Spending Review 2020 Trends in Public Expenditure 2009- 2019
Indonesia Public Expenditure Review Spending for Better Results 2020
Housing
Context Assessing the Quality of Spending
Recommendations to Improve the Quality of Spending
10.1 10.2 10.3
CHAPTER
10
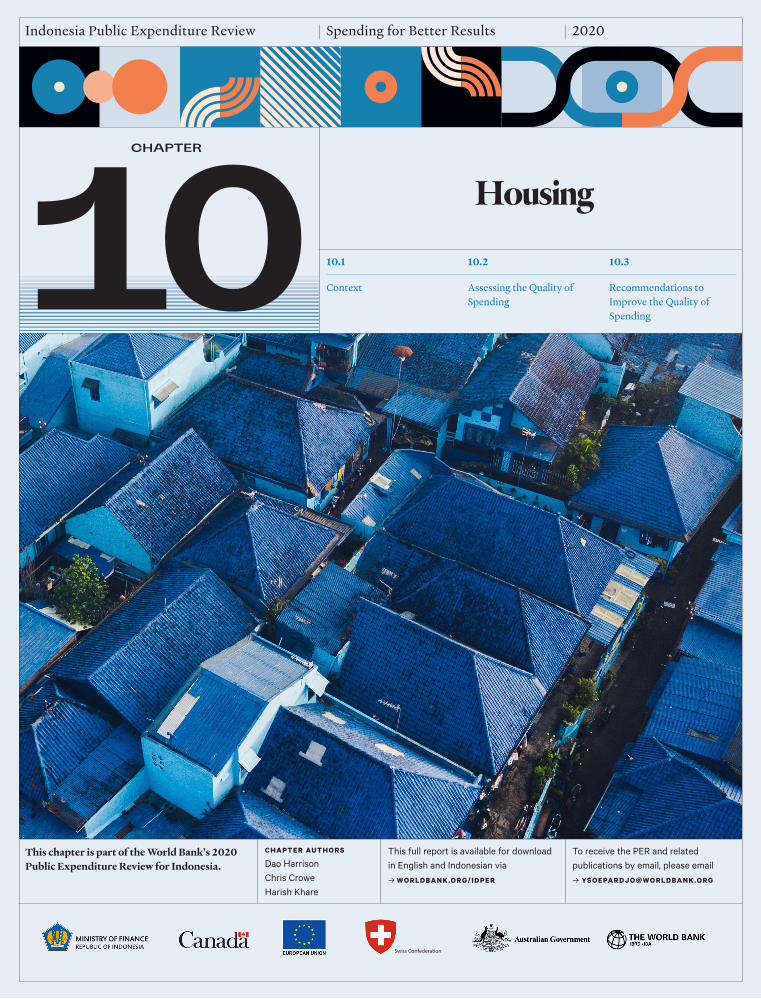
This chapter is part of the World Bank's 2020 Public Expenditure Review for Indonesia.
This full report is available for download in English and Indonesian via→ WORLDBANK.ORG/IDPER
To receive the PER and related publications by email, please email→ YSOEPARDJO @WORLDBANK.O R G
CHAPTER AUTHOR S
Dao HarrisonChris CroweHarish Khare
Swiss Confederation
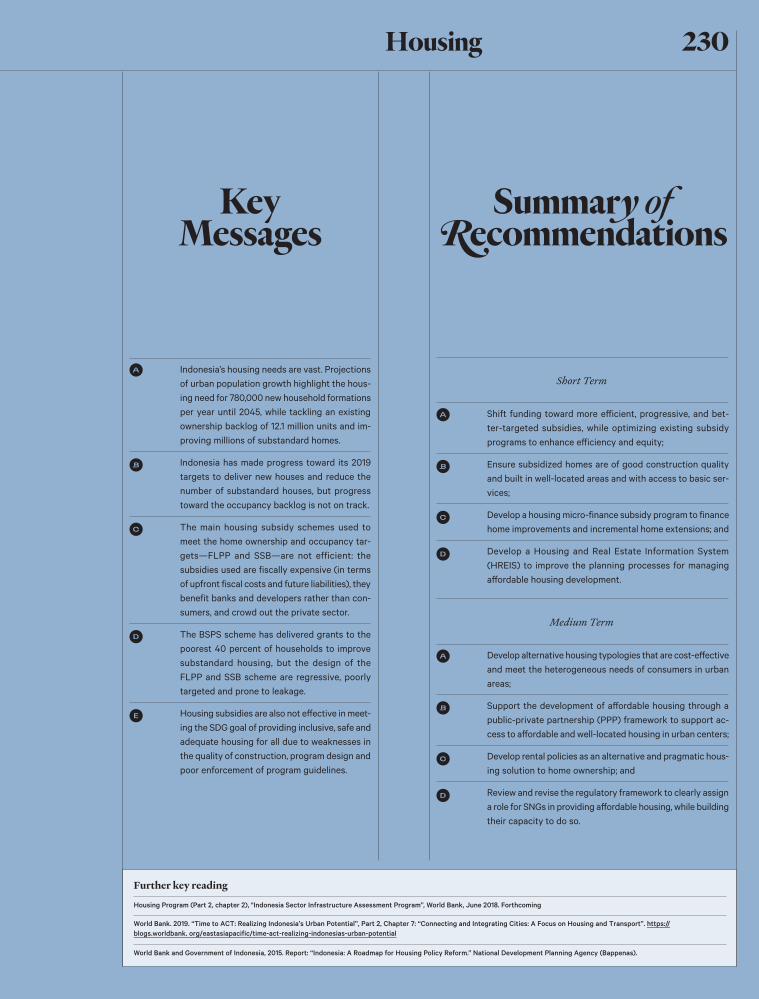
10A Indonesia’s housing needs are vast. Projections
of urban population growth highlight the hous-ing need for 780,000 new household formations per year until 2045, while tackling an existing ownership backlog of 12.1 million units and im-proving millions of substandard homes.
B Indonesia has made progress toward its 2019 targets to deliver new houses and reduce the number of substandard houses, but progress toward the occupancy backlog is not on track.
C The main housing subsidy schemes used to meet the home ownership and occupancy tar-gets—FLPP and SSB—are not efficient: the subsidies used are fiscally expensive (in terms of upfront fiscal costs and future liabilities), they benefit banks and developers rather than con-sumers, and crowd out the private sector.
D The BSPS scheme has delivered grants to the poorest 40 percent of households to improve substandard housing, but the design of the FLPP and SSB scheme are regressive, poorly targeted and prone to leakage.
E Housing subsidies are also not effective in meet-ing the SDG goal of providing inclusive, safe and adequate housing for all due to weaknesses in the quality of construction, program design and poor enforcement of program guidelines.
Further key reading
Housing Program (Part 2, chapter 2), "Indonesia Sector Infrastructure Assessment Program”, World Bank, June 2018. Forthcoming
World Bank. 2019. “Time to ACT: Realizing Indonesia’s Urban Potential”, Part 2, Chapter 7: “Connecting and Integrating Cities: A Focus on Housing and Transport”. https://blogs.worldbank. org/eastasiapacific/time-act-realizing-indonesias-urban-potential
World Bank and Government of Indonesia, 2015. Report: “Indonesia: A Roadmap for Housing Policy Reform.” National Development Planning Agency (Bappenas).
A Shift funding toward more efficient, progressive, and bet-ter-targeted subsidies, while optimizing existing subsidy programs to enhance efficiency and equity;
B Ensure subsidized homes are of good construction quality and built in well-located areas and with access to basic ser-vices;
C Develop a housing micro-finance subsidy program to finance home improvements and incremental home extensions; and
D Develop a Housing and Real Estate Information System (HREIS) to improve the planning processes for managing affordable housing development.
A Develop alternative housing typologies that are cost-effective and meet the heterogeneous needs of consumers in urban areas;
B Support the development of affordable housing through a public-private partnership (PPP) framework to support ac-cess to affordable and well-located housing in urban centers;
C Develop rental policies as an alternative and pragmatic hous-ing solution to home ownership; and
D Review and revise the regulatory framework to clearly assign a role for SNGs in providing affordable housing, while building their capacity to do so.
Short Term
Medium Term
Key Messages
Summary of Recommendations
230Housing
A ccess to housing for all” is a key priority for the GoI. Through laws
and programs, the GoI has ratified access to housing for all as a national mandate. The right to adequate housing is enshrined in the 1945 Constitution and Law No. 1/2011 on Housing and Settlements, which proclaims: “every Indonesian citizen should live in a decent and affordable settlement within a healthy, safe, harmonious, organized, inte-grated and sustainable environment.” The GoI has also endorsed Sustainable Develop-ment Goal (SDG) #11 to “make cities and human settlements inclusive, safe, resilient and sustainable”.
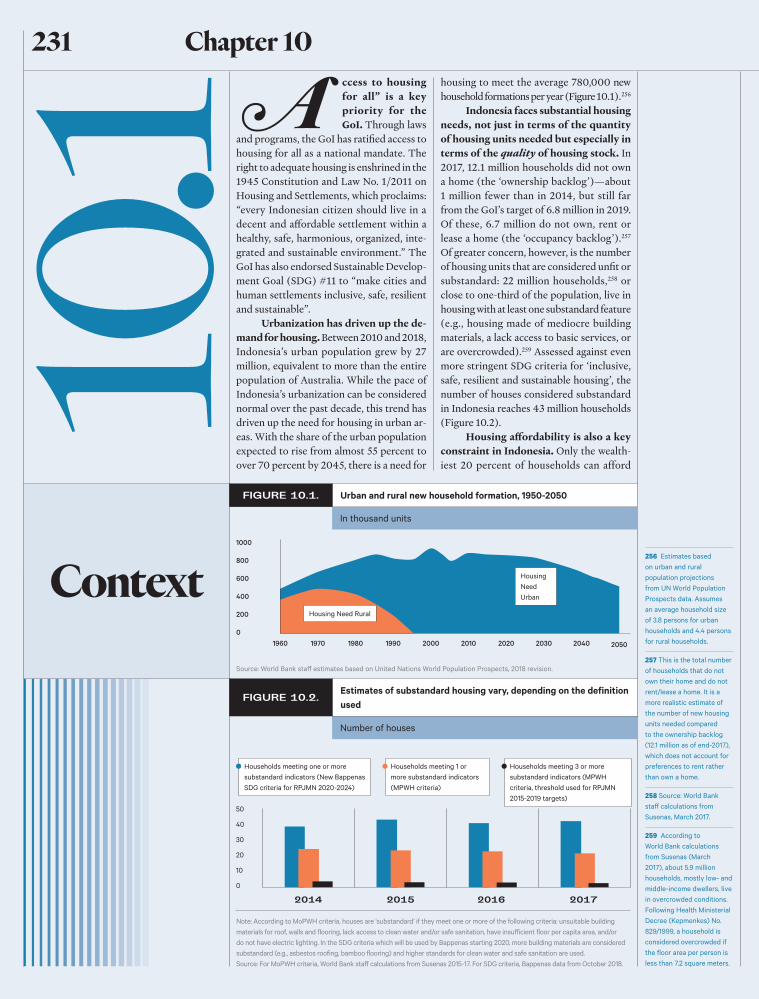
Urbanization has driven up the de-mand for housing. Between 2010 and 2018, Indonesia’s urban population grew by 27 million, equivalent to more than the entire population of Australia. While the pace of Indonesia’s urbanization can be considered normal over the past decade, this trend has driven up the need for housing in urban ar-eas. With the share of the urban population expected to rise from almost 55 percent to over 70 percent by 2045, there is a need for
housing to meet the average 780,000 new household formations per year (Figure 10.1).256
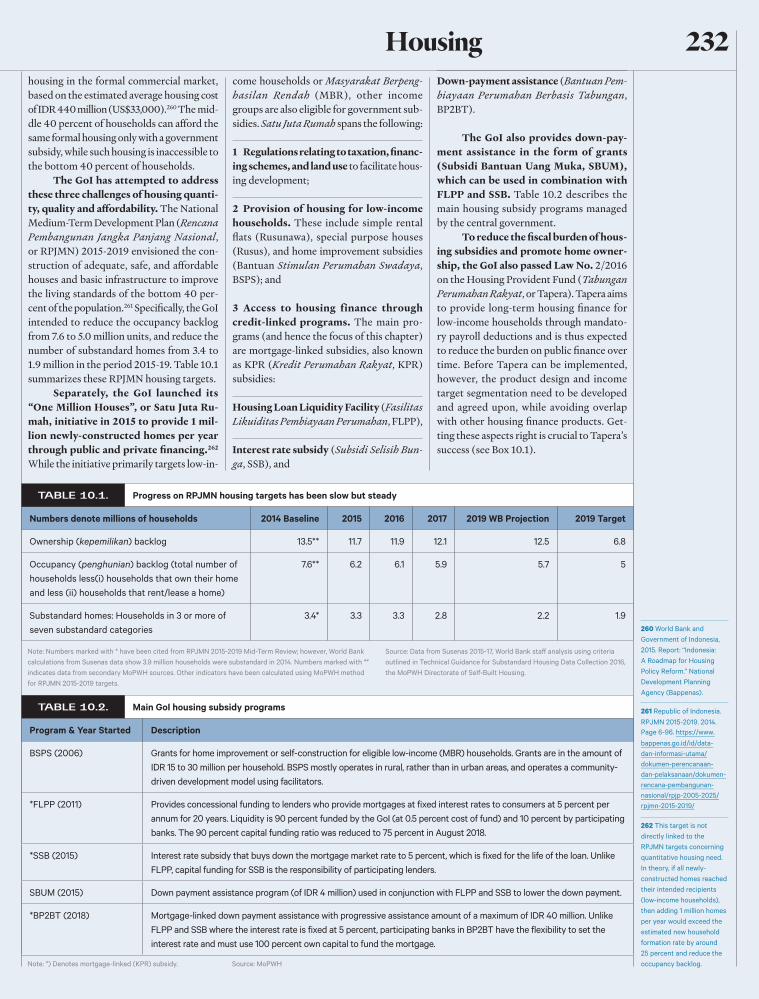
Indonesia faces substantial housing needs, not just in terms of the quantity of housing units needed but especially in terms of the quality of housing stock. In 2017, 12.1 million households did not own a home (the ‘ownership backlog’)—about 1 million fewer than in 2014, but still far from the GoI’s target of 6.8 million in 2019. Of these, 6.7 million do not own, rent or lease a home (the ‘occupancy backlog’).257 Of greater concern, however, is the number of housing units that are considered unfit or substandard: 22 million households,258 or close to one-third of the population, live in housing with at least one substandard feature (e.g., housing made of mediocre building materials, a lack access to basic services, or are overcrowded).259 Assessed against even more stringent SDG criteria for ‘inclusive, safe, resilient and sustainable housing’, the number of houses considered substandard in Indonesia reaches 43 million households (Figure 10.2).
Housing affordability is also a key constraint in Indonesia. Only the wealth-iest 20 percent of households can afford
10.1
Context
In thousand units
Number of houses
Urban and rural new household formation, 1950-2050
Estimates of substandard housing vary, depending on the definition used
FIGURE 10.1.
FIGURE 10.2.
1000
800
600
400
200
01960 1970 1980 1990 2000 2010 2020 2030 2040 2050
Housing Need Rural
Housing Need Urban
Source: World Bank staff estimates based on United Nations World Population Prospects, 2018 revision.
Note: According to MoPWH criteria, houses are ‘substandard’ if they meet one or more of the following criteria: unsuitable building materials for roof, walls and flooring, lack access to clean water and/or safe sanitation, have insufficient floor per capita area, and/or do not have electric lighting. In the SDG criteria which will be used by Bappenas starting 2020, more building materials are considered substandard (e.g., asbestos roofing, bamboo flooring) and higher standards for clean water and safe sanitation are used. Source: For MoPWH criteria, World Bank staff calculations from Susenas 2015-17. For SDG criteria, Bappenas data from October 2018.
Households meeting one or more substandard indicators (New Bappenas SDG criteria for RPJMN 2020-2024)
Households meeting 1 or more substandard indicators (MPWH criteria)
Households meeting 3 or more substandard indicators (MPWH criteria, threshold used for RPJMN 2015-2019 targets)
256 Estimates based on urban and rural population projections from UN World Population Prospects data. Assumes an average household size of 3.8 persons for urban households and 4.4 persons for rural households.
257 This is the total number of households that do not own their home and do not rent/lease a home. It is a more realistic estimate of the number of new housing units needed compared to the ownership backlog (12.1 million as of end-2017), which does not account for preferences to rent rather than own a home.
258 Source: World Bank staff calculations from Susenas, March 2017.
259 According to World Bank calculations from Susenas (March 2017), about 5.9 million households, mostly low- and middle-income dwellers, live in overcrowded conditions. Following Health Ministerial Decree (Kepmenkes) No. 829/1999, a household is considered overcrowded if the floor area per person is less than 7.2 square meters.
231 Chapter 10
housing in the formal commercial market, based on the estimated average housing cost of IDR 440 million (US$33,000).260 The mid-dle 40 percent of households can afford the same formal housing only with a government subsidy, while such housing is inaccessible to the bottom 40 percent of households.
The GoI has attempted to address these three challenges of housing quanti-ty, quality and affordability. The National Medium-Term Development Plan (Rencana Pembangunan Jangka Panjang Nasional, or RPJMN) 2015-2019 envisioned the con-struction of adequate, safe, and affordable houses and basic infrastructure to improve the living standards of the bottom 40 per-cent of the population.261 Specifically, the GoI intended to reduce the occupancy backlog from 7.6 to 5.0 million units, and reduce the number of substandard homes from 3.4 to 1.9 million in the period 2015-19. Table 10.1 summarizes these RPJMN housing targets.
Separately, the GoI launched its “One Million Houses”, or Satu Juta Ru-mah, initiative in 2015 to provide 1 mil-lion newly-constructed homes per year through public and private financing.262 While the initiative primarily targets low-in-
come households or Masyarakat Berpeng-hasilan Rendah (MBR), other income groups are also eligible for government sub-sidies. Satu Juta Rumah spans the following:
1 Regulations relating to taxation, financ-ing schemes, and land use to facilitate hous-ing development;
2 Provision of housing for low-income households. These include simple rental flats (Rusunawa), special purpose houses (Rusus), and home improvement subsidies (Bantuan Stimulan Perumahan Swadaya, BSPS); and
3 Access to housing finance through credit-linked programs. The main pro-grams (and hence the focus of this chapter) are mortgage-linked subsidies, also known as KPR (Kredit Perumahan Rakyat, KPR) subsidies:
Housing Loan Liquidity Facility (Fasilitas Likuiditas Pembiayaan Perumahan, FLPP),
Interest rate subsidy (Subsidi Selisih Bun-ga, SSB), and
Down-payment assistance (Bantuan Pem-biayaan Perumahan Berbasis Tabungan, BP2BT).
The GoI also provides down-pay-ment assistance in the form of grants (Subsidi Bantuan Uang Muka, SBUM), which can be used in combination with FLPP and SSB. Table 10.2 describes the main housing subsidy programs managed by the central government.
To reduce the fiscal burden of hous-ing subsidies and promote home owner-ship, the GoI also passed Law No. 2/2016 on the Housing Provident Fund (Tabungan Perumahan Rakyat, or Tapera). Tapera aims to provide long-term housing finance for low-income households through mandato-ry payroll deductions and is thus expected to reduce the burden on public finance over time. Before Tapera can be implemented, however, the product design and income target segmentation need to be developed and agreed upon, while avoiding overlap with other housing finance products. Get-ting these aspects right is crucial to Tapera’s success (see Box 10.1).
260 World Bank and Government of Indonesia, 2015. Report: “Indonesia: A Roadmap for Housing Policy Reform.” National Development Planning Agency (Bappenas).
261 Republic of Indonesia. RPJMN 2015-2019. 2014. Page 6-96. https://www. bappenas.go.id/id/data-dan-informasi-utama/dokumen-perencanaan-dan-pelaksanaan/dokumen-rencana-pembangunan-nasional/rpjp-2005-2025/rpjmn-2015-2019/
262 This target is not directly linked to the RPJMN targets concerning quantitative housing need. In theory, if all newly-constructed homes reached their intended recipients (low-income households), then adding 1 million homes per year would exceed the estimated new household formation rate by around 25 percent and reduce the occupancy backlog.
Progress on RPJMN housing targets has been slow but steady
Main GoI housing subsidy programs
TABLE 10.1.
TABLE 10.2.
Numbers denote millions of households 2014 Baseline 2015 2016 2017 2019 WB Projection 2019 Target
Ownership (kepemilikan) backlog 13.5** 11.7 11.9 12.1 12.5 6.8
Occupancy (penghunian) backlog (total number of households less(i) households that own their home and less (ii) households that rent/lease a home)
7.6** 6.2 6.1 5.9 5.7 5
Substandard homes: Households in 3 or more of seven substandard categories
3.4* 3.3 3.3 2.8 2.2 1.9
Program & Year Started Description
BSPS (2006) Grants for home improvement or self-construction for eligible low-income (MBR) households. Grants are in the amount of IDR 15 to 30 million per household. BSPS mostly operates in rural, rather than in urban areas, and operates a community-driven development model using facilitators.
*FLPP (2011) Provides concessional funding to lenders who provide mortgages at fixed interest rates to consumers at 5 percent per annum for 20 years. Liquidity is 90 percent funded by the GoI (at 0.5 percent cost of fund) and 10 percent by participating banks. The 90 percent capital funding ratio was reduced to 75 percent in August 2018.
*SSB (2015) Interest rate subsidy that buys down the mortgage market rate to 5 percent, which is fixed for the life of the loan. Unlike FLPP, capital funding for SSB is the responsibility of participating lenders.
SBUM (2015) Down payment assistance program (of IDR 4 million) used in conjunction with FLPP and SSB to lower the down payment.
*BP2BT (2018) Mortgage-linked down payment assistance with progressive assistance amount of a maximum of IDR 40 million. Unlike FLPP and SSB where the interest rate is fixed at 5 percent, participating banks in BP2BT have the flexibility to set the interest rate and must use 100 percent own capital to fund the mortgage.
Note: Numbers marked with * have been cited from RPJMN 2015-2019 Mid-Term Review; however, World Bank calculations from Susenas data show 3.9 million households were substandard in 2014. Numbers marked with ** indicates data from secondary MoPWH sources. Other indicators have been calculated using MoPWH method for RPJMN 2015-2019 targets.
Source: Data from Susenas 2015-17, World Bank staff analysis using criteria outlined in Technical Guidance for Substandard Housing Data Collection 2016, the MoPWH Directorate of Self-Built Housing.
Note: *) Denotes mortgage-linked (KPR) subsidy. Source: MoPWH
232Housing
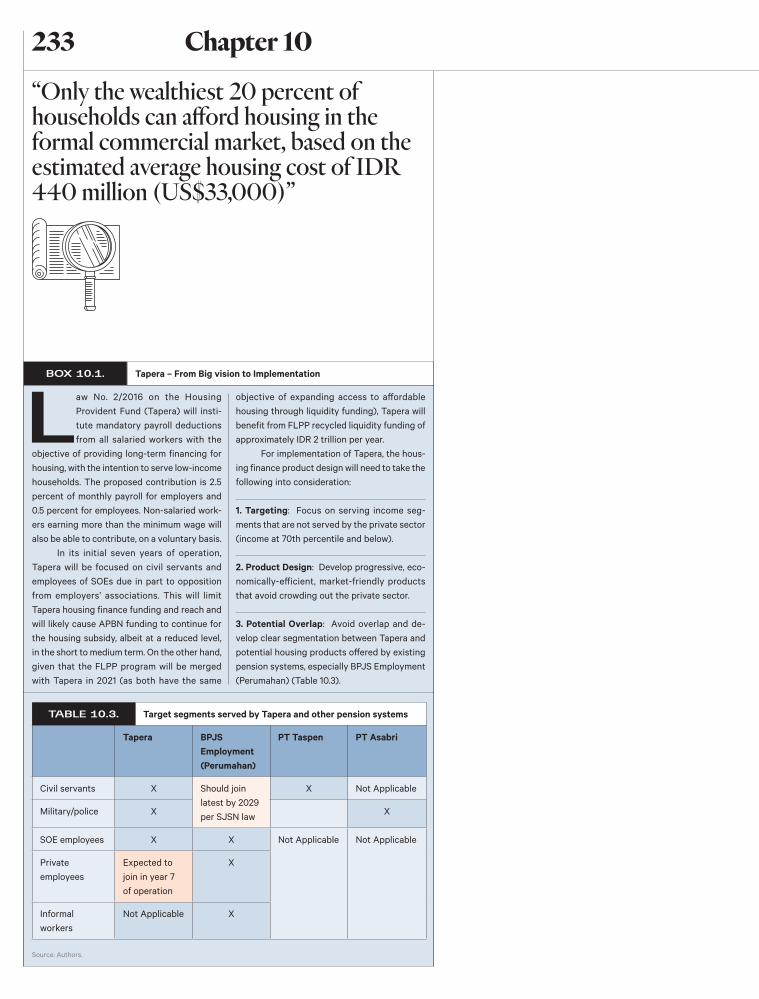
Law No. 2/2016 on the Housing Provident Fund (Tapera) will insti-tute mandatory payroll deductions from all salaried workers with the
objective of providing long-term financing for housing, with the intention to serve low-income households. The proposed contribution is 2.5 percent of monthly payroll for employers and 0.5 percent for employees. Non-salaried work-ers earning more than the minimum wage will also be able to contribute, on a voluntary basis.
In its initial seven years of operation, Tapera will be focused on civil servants and employees of SOEs due in part to opposition from employers’ associations. This will limit Tapera housing finance funding and reach and will likely cause APBN funding to continue for the housing subsidy, albeit at a reduced level, in the short to medium term. On the other hand, given that the FLPP program will be merged with Tapera in 2021 (as both have the same
objective of expanding access to affordable housing through liquidity funding), Tapera will benefit from FLPP recycled liquidity funding of approximately IDR 2 trillion per year.
For implementation of Tapera, the hous-ing finance product design will need to take the following into consideration:
1. Targeting: Focus on serving income seg-ments that are not served by the private sector (income at 70th percentile and below).
2. Product Design: Develop progressive, eco-nomically-efficient, market-friendly products that avoid crowding out the private sector.
3. Potential Overlap: Avoid overlap and de-velop clear segmentation between Tapera and potential housing products offered by existing pension systems, especially BPJS Employment (Perumahan) (Table 10.3).
Tapera – From Big vision to Implementation
Target segments served by Tapera and other pension systems
BOX 10.1.
TABLE 10.3.
Tapera BPJS Employment (Perumahan)
PT Taspen PT Asabri
Civil servants X Should join latest by 2029 per SJSN law
X Not Applicable
Military/police X X
SOE employees X X Not Applicable Not Applicable
Private employees
Expected to join in year 7 of operation
X
Informal workers
Not Applicable X
Source: Authors.
“Only the wealthiest 20 percent of households can afford housing in the formal commercial market, based on the estimated average housing cost of IDR 440 million (US$33,000)”
233 Chapter 10
IDR trillion
Percent of General Government expenditures or GDP IDR billion
Number of units
2001
2002
2003
2004
2005
2006
2007
2008
2009
2010
2011
2012
2013
2014
2015
2016
2017
2018
Housing as % of Total GoI Expenditures Total housing expenditure (Secondary axis; IDR billion)
FLPP FLPP
SSB SSB
SBUM
Housing as % of GDP
Spending on housing subsidies has increased since 2015…
…in line with expansion in the annual average volume of mortgage subsidies, which more than doubled in recent years
FIGURE 10.3.
FIGURE 10.4. FIGURE 10.5.
Note: Total housing expenditure is defined as the net present value of Central Government expenditures on the main subsidy programs (FLPP and SSB), as well spending on housing and public facilities (including BSPS). At the subnational level, only spending on housing construction is included. Due to limitations in data availability, subnational data for 2015-16 use budgeted expenditures, whereas 2017-18 subnational data are estimates. Source: World Bank staff calculations using data from the MoF and the MoPWH.
Source: MoPWH, World Bank staff calculations. Source: MoPWH, World Bank staff calculations.
Average annual volume
of ~230,000
Average annual volume
of ~90,000
10.2Assessing the Quality of Spending
A Overall Trends: Is Spending Adequate?
B How Efficient Is Public Spending in the Sector?
C How Effective Is Public Spending in the Sector?
T otal public spending on housing has increased in absolute terms over the past decade. Overall housing
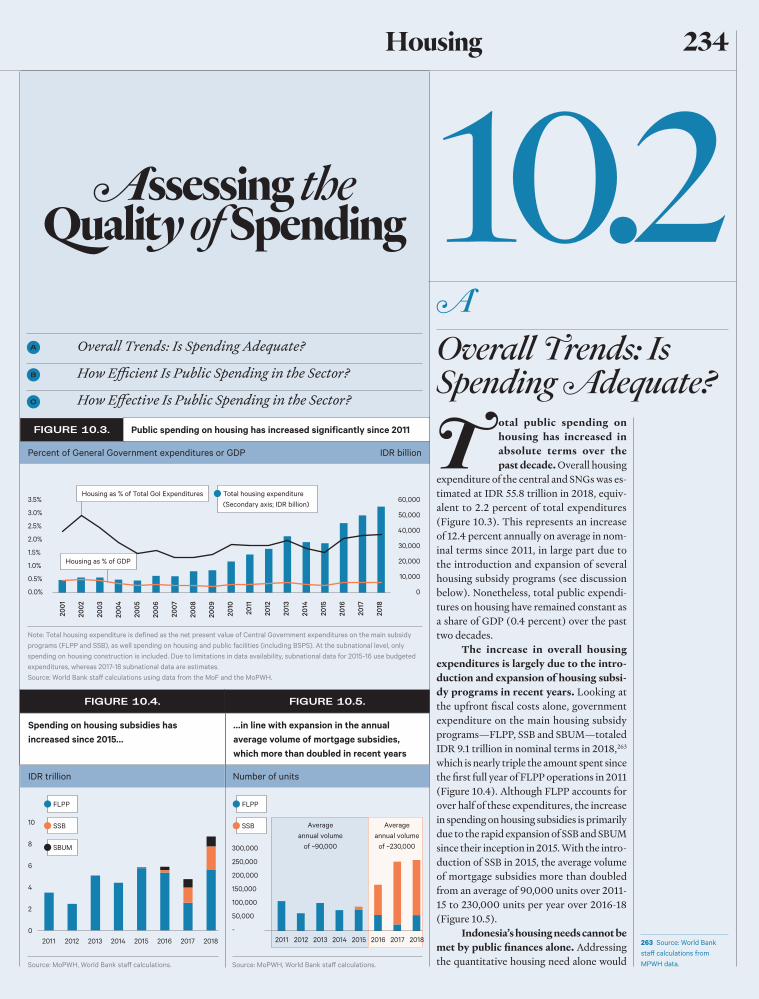
expenditure of the central and SNGs was es-timated at IDR 55.8 trillion in 2018, equiv-alent to 2.2 percent of total expenditures (Figure 10.3). This represents an increase of 12.4 percent annually on average in nom-inal terms since 2011, in large part due to the introduction and expansion of several housing subsidy programs (see discussion below). Nonetheless, total public expendi-tures on housing have remained constant as a share of GDP (0.4 percent) over the past two decades.
The increase in overall housing expenditures is largely due to the intro-duction and expansion of housing subsi-dy programs in recent years. Looking at the upfront fiscal costs alone, government expenditure on the main housing subsidy programs—FLPP, SSB and SBUM—totaled IDR 9.1 trillion in nominal terms in 2018,263 which is nearly triple the amount spent since the first full year of FLPP operations in 2011 (Figure 10.4). Although FLPP accounts for over half of these expenditures, the increase in spending on housing subsidies is primarily due to the rapid expansion of SSB and SBUM since their inception in 2015. With the intro-duction of SSB in 2015, the average volume of mortgage subsidies more than doubled from an average of 90,000 units over 2011-15 to 230,000 units per year over 2016-18 (Figure 10.5).
Indonesia’s housing needs cannot be met by public finances alone. Addressing the quantitative housing need alone would
A Overall Trends: Is Spending Adequate?
263 Source: World Bank staff calculations from MPWH data.
Public spending on housing has increased significantly since 2011
234Housing
Number of units Number of units
require an estimated IDR 1,005 trillion (US$71 billion),264 or nearly half of total pub-lic spending. If the GoI maintains its current level of spending on housing and does not involve the private sector, it would take 26 years to close the gap,265 notwithstanding the additional investments needed to upgrade substandard homes. Rather than increase the amount of public finances spent on housing, efforts should be made to increase the efficien-cy and effectiveness of public spending to bet-ter leverage private sector investment. As the next few sections show, creating more space for private sector players would help the GoI to achieve its goal of providing housing for all.
Target BSPS Target
Achievement
BSPS MPWH Achievement
BSPS DSPS DAK Achievement
FLPP and SSB programs exceeded the target volume in 2017-18…
…but not BSPS, which only met half of the targeted volume
FIGURE 10.6. FIGURE 10.7.
B How Efficient Is Public Spending in the Sector?
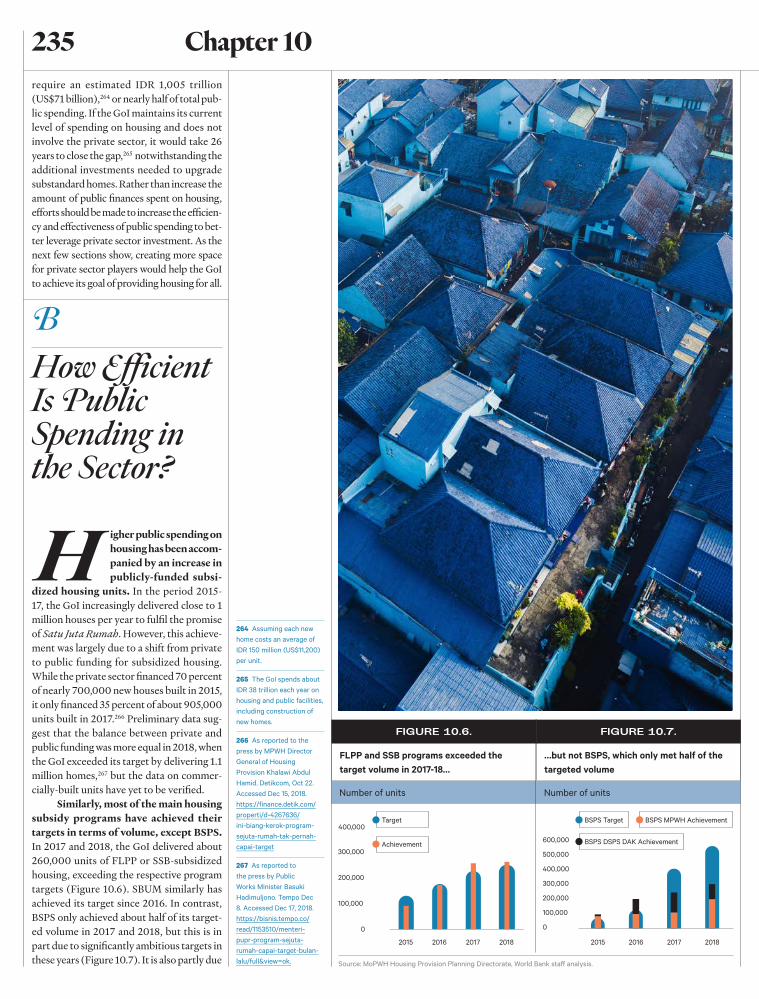
H igher public spending on housing has been accom-panied by an increase in publicly-funded subsi-
dized housing units. In the period 2015-17, the GoI increasingly delivered close to 1 million houses per year to fulfil the promise of Satu Juta Rumah. However, this achieve-ment was largely due to a shift from private to public funding for subsidized housing. While the private sector financed 70 percent of nearly 700,000 new houses built in 2015, it only financed 35 percent of about 905,000 units built in 2017.266 Preliminary data sug-gest that the balance between private and public funding was more equal in 2018, when the GoI exceeded its target by delivering 1.1 million homes,267 but the data on commer-cially-built units have yet to be verified.
Similarly, most of the main housing subsidy programs have achieved their targets in terms of volume, except BSPS. In 2017 and 2018, the GoI delivered about 260,000 units of FLPP or SSB-subsidized housing, exceeding the respective program targets (Figure 10.6). SBUM similarly has achieved its target since 2016. In contrast, BSPS only achieved about half of its target-ed volume in 2017 and 2018, but this is in part due to significantly ambitious targets in these years (Figure 10.7). It is also partly due
264 Assuming each new home costs an average of IDR 150 million (US$11,200) per unit.
265 The GoI spends about IDR 38 trillion each year on housing and public facilities, including construction of new homes.
266 As reported to the press by MPWH Director General of Housing Provision Khalawi Abdul Hamid. Detikcom, Oct 22. Accessed Dec 15, 2018. https://finance.detik.com/properti/d-4267636/ini-biang-kerok-program-sejuta-rumah-tak-pernah-capai-target
267 As reported to the press by Public Works Minister Basuki Hadimuljono. Tempo Dec 8. Accessed Dec 17, 2018. https://bisnis.tempo.co/read/1153510/menteri-pupr-program-sejuta-rumah-capai-target-bulan-lalu/full&view=ok. Source: MoPWH Housing Provision Planning Directorate, World Bank staff analysis.
400,000
235 Chapter 10
Year 1 upfront fiscal costs per unit (IDR million)
Net present cost of subsidy per unit (IDR million)
FLPP
SSB
SBUM
SBUM
Year 1 cost of subsidy per unit
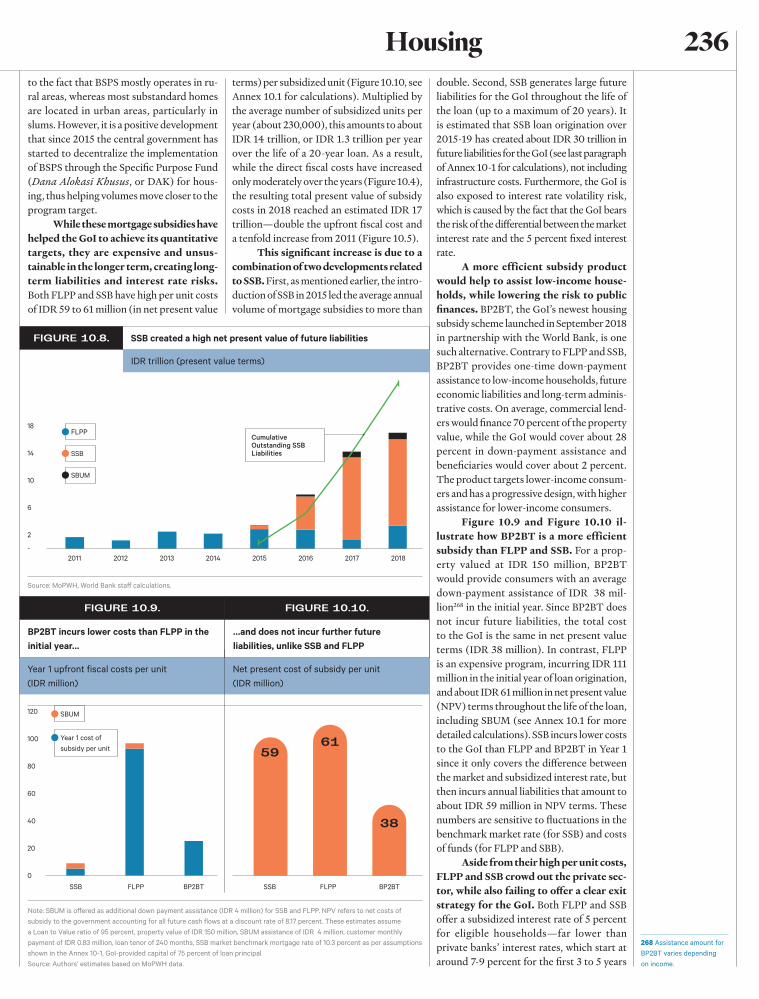
SSB created a high net present value of future liabilities
BP2BT incurs lower costs than FLPP in the initial year…
…and does not incur further future liabilities, unlike SSB and FLPP
FIGURE 10.8.
FIGURE 10.9. FIGURE 10.10.
IDR trillion (present value terms)
double. Second, SSB generates large future liabilities for the GoI throughout the life of the loan (up to a maximum of 20 years). It is estimated that SSB loan origination over 2015-19 has created about IDR 30 trillion in future liabilities for the GoI (see last paragraph of Annex 10-1 for calculations), not including infrastructure costs. Furthermore, the GoI is also exposed to interest rate volatility risk, which is caused by the fact that the GoI bears the risk of the differential between the market interest rate and the 5 percent fixed interest rate.
A more efficient subsidy product would help to assist low-income house-holds, while lowering the risk to public finances. BP2BT, the GoI’s newest housing subsidy scheme launched in September 2018 in partnership with the World Bank, is one such alternative. Contrary to FLPP and SSB, BP2BT provides one-time down-payment assistance to low-income households, future economic liabilities and long-term adminis-trative costs. On average, commercial lend-ers would finance 70 percent of the property value, while the GoI would cover about 28 percent in down-payment assistance and beneficiaries would cover about 2 percent. The product targets lower-income consum-ers and has a progressive design, with higher assistance for lower-income consumers.
Figure 10.9 and Figure 10.10 il-lustrate how BP2BT is a more efficient subsidy than FLPP and SSB. For a prop-erty valued at IDR 150 million, BP2BT would provide consumers with an average down-payment assistance of IDR 38 mil-lion268 in the initial year. Since BP2BT does not incur future liabilities, the total cost to the GoI is the same in net present value terms (IDR 38 million). In contrast, FLPP is an expensive program, incurring IDR 111 million in the initial year of loan origination, and about IDR 61 million in net present value (NPV) terms throughout the life of the loan, including SBUM (see Annex 10.1 for more detailed calculations). SSB incurs lower costs to the GoI than FLPP and BP2BT in Year 1 since it only covers the difference between the market and subsidized interest rate, but then incurs annual liabilities that amount to about IDR 59 million in NPV terms. These numbers are sensitive to fluctuations in the benchmark market rate (for SSB) and costs of funds (for FLPP and SBB).
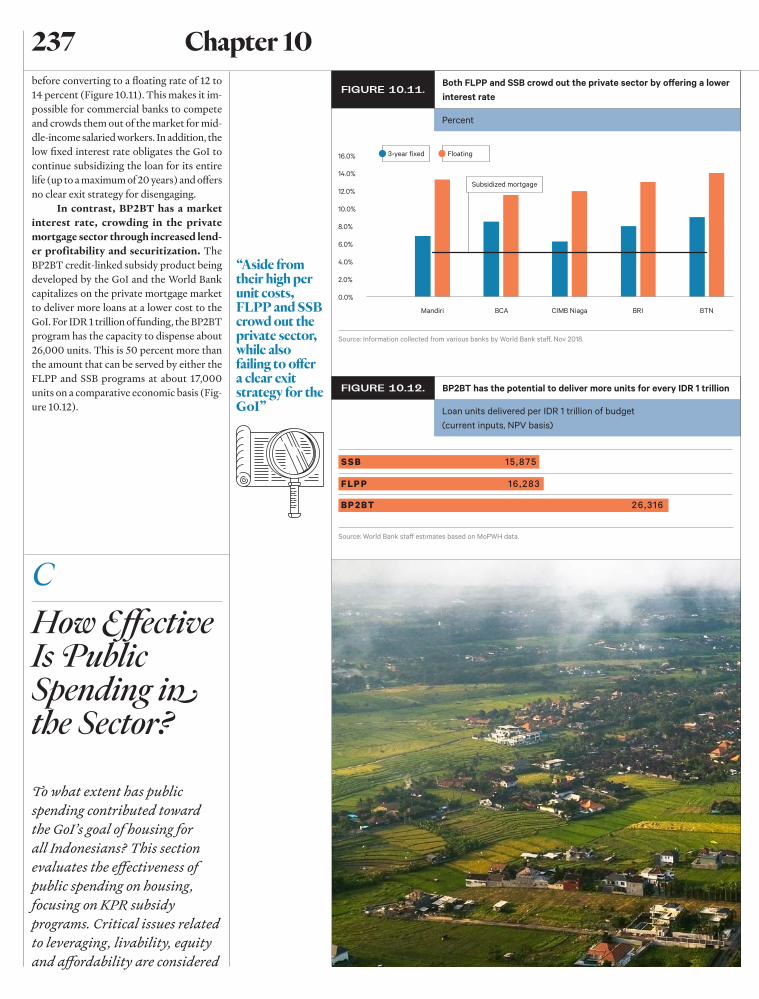
Aside from their high per unit costs, FLPP and SSB crowd out the private sec-tor, while also failing to offer a clear exit strategy for the GoI. Both FLPP and SSB offer a subsidized interest rate of 5 percent for eligible households—far lower than private banks’ interest rates, which start at around 7-9 percent for the first 3 to 5 years
Source: MoPWH, World Bank staff calculations.
268 Assistance amount for BP2BT varies depending on income.
5961
38
Note: SBUM is offered as additional down payment assistance (IDR 4 million) for SSB and FLPP. NPV refers to net costs of subsidy to the government accounting for all future cash flows at a discount rate of 8.17 percent. These estimates assume a Loan to Value ratio of 95 percent, property value of IDR 150 million, SBUM assistance of IDR 4 million, customer monthly payment of IDR 0.83 million, loan tenor of 240 months, SSB market benchmark mortgage rate of 10.3 percent as per assumptions shown in the Annex 10-1, GoI-provided capital of 75 percent of loan principalSource: Authors’ estimates based on MoPWH data.
to the fact that BSPS mostly operates in ru-ral areas, whereas most substandard homes are located in urban areas, particularly in slums. However, it is a positive development that since 2015 the central government has started to decentralize the implementation of BSPS through the Specific Purpose Fund (Dana Alokasi Khusus, or DAK) for hous-ing, thus helping volumes move closer to the program target.
While these mortgage subsidies have helped the GoI to achieve its quantitative targets, they are expensive and unsus-tainable in the longer term, creating long-term liabilities and interest rate risks. Both FLPP and SSB have high per unit costs of IDR 59 to 61 million (in net present value
terms) per subsidized unit (Figure 10.10, see Annex 10.1 for calculations). Multiplied by the average number of subsidized units per year (about 230,000), this amounts to about IDR 14 trillion, or IDR 1.3 trillion per year over the life of a 20-year loan. As a result, while the direct fiscal costs have increased only moderately over the years (Figure 10.4), the resulting total present value of subsidy costs in 2018 reached an estimated IDR 17 trillion—double the upfront fiscal cost and a tenfold increase from 2011 (Figure 10.5).
This significant increase is due to a combination of two developments related to SSB. First, as mentioned earlier, the intro-duction of SSB in 2015 led the average annual volume of mortgage subsidies to more than
Cumulative Outstanding SSB Liabilities
236Housing
Percent
Loan units delivered per IDR 1 trillion of budget (current inputs, NPV basis)
before converting to a floating rate of 12 to 14 percent (Figure 10.11). This makes it im-possible for commercial banks to compete and crowds them out of the market for mid-dle-income salaried workers. In addition, the low fixed interest rate obligates the GoI to continue subsidizing the loan for its entire life (up to a maximum of 20 years) and offers no clear exit strategy for disengaging.
In contrast, BP2BT has a market interest rate, crowding in the private mortgage sector through increased lend-er profitability and securitization. The BP2BT credit-linked subsidy product being developed by the GoI and the World Bank capitalizes on the private mortgage market to deliver more loans at a lower cost to the GoI. For IDR 1 trillion of funding, the BP2BT program has the capacity to dispense about 26,000 units. This is 50 percent more than the amount that can be served by either the FLPP and SSB programs at about 17,000 units on a comparative economic basis (Fig-ure 10.12).
Both FLPP and SSB crowd out the private sector by offering a lower interest rate
BP2BT has the potential to deliver more units for every IDR 1 trillion
FIGURE 10.11.
FIGURE 10.12.
3-year fixed Floating
Subsidized mortgage
Source: Information collected from various banks by World Bank staff, Nov 2018.
Source: World Bank staff estimates based on MoPWH data.
C How Effective Is Public Spending in the Sector?
To what extent has public spending contributed toward the GoI’s goal of housing for all Indonesians? This section evaluates the effectiveness of public spending on housing, focusing on KPR subsidy programs. Critical issues related to leveraging, livability, equity and affordability are considered
“Aside from their high per unit costs, FLPP and SSB crowd out the private sector, while also failing to offer a clear exit strategy for the GoI”
237 Chapter 10
Percent of all households in Indonesia Households (million)
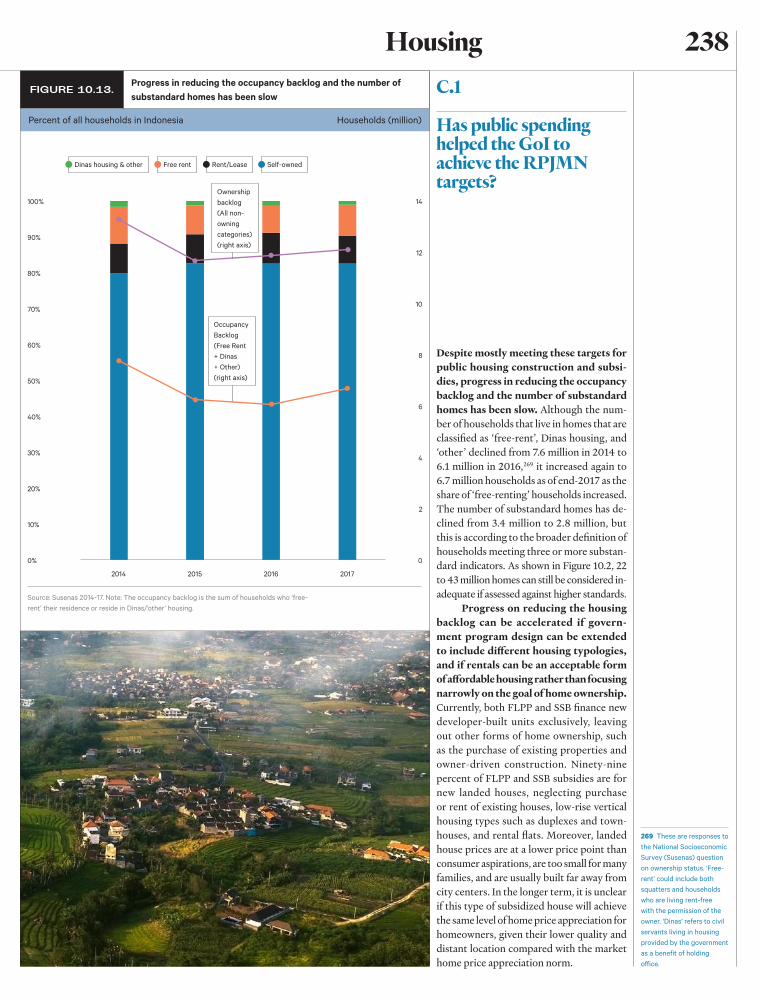
Progress in reducing the occupancy backlog and the number of substandard homes has been slow
FIGURE 10.13.
Dinas housing & other Free rent Rent/Lease Self-owned
Occupancy Backlog (Free Rent + Dinas + Other) (right axis)
Ownership backlog (All non-owning categories) (right axis)
Source: Susenas 2014-17. Note: The occupancy backlog is the sum of households who ‘free-rent’ their residence or reside in Dinas/’other’ housing.
Has public spending helped the GoI to achieve the RPJMN targets?
C.1
Despite mostly meeting these targets for public housing construction and subsi-dies, progress in reducing the occupancy backlog and the number of substandard homes has been slow. Although the num-ber of households that live in homes that are classified as ‘free-rent’, Dinas housing, and ‘other’ declined from 7.6 million in 2014 to 6.1 million in 2016,269 it increased again to 6.7 million households as of end-2017 as the share of ‘free-renting’ households increased. The number of substandard homes has de-clined from 3.4 million to 2.8 million, but this is according to the broader definition of households meeting three or more substan-dard indicators. As shown in Figure 10.2, 22 to 43 million homes can still be considered in-adequate if assessed against higher standards.
Progress on reducing the housing backlog can be accelerated if govern-ment program design can be extended to include different housing typologies, and if rentals can be an acceptable form of affordable housing rather than focusing narrowly on the goal of home ownership. Currently, both FLPP and SSB finance new developer-built units exclusively, leaving out other forms of home ownership, such as the purchase of existing properties and owner-driven construction. Ninety-nine percent of FLPP and SSB subsidies are for new landed houses, neglecting purchase or rent of existing houses, low-rise vertical housing types such as duplexes and town-houses, and rental flats. Moreover, landed house prices are at a lower price point than consumer aspirations, are too small for many families, and are usually built far away from city centers. In the longer term, it is unclear if this type of subsidized house will achieve the same level of home price appreciation for homeowners, given their lower quality and distant location compared with the market home price appreciation norm.
269 These are responses to the National Socioeconomic Survey (Susenas) question on ownership status. ‘Free-rent’ could include both squatters and households who are living rent-free with the permission of the owner. ‘Dinas’ refers to civil servants living in housing provided by the government as a benefit of holding office.
238Housing
Has public spending helped the GoI to achieve the RPJMN targets?
C.2
270 Ministry of Public Works and Housing FLPP data for 2016 and 2017. World Bank analysis.
271 Chetty et al., 2015.
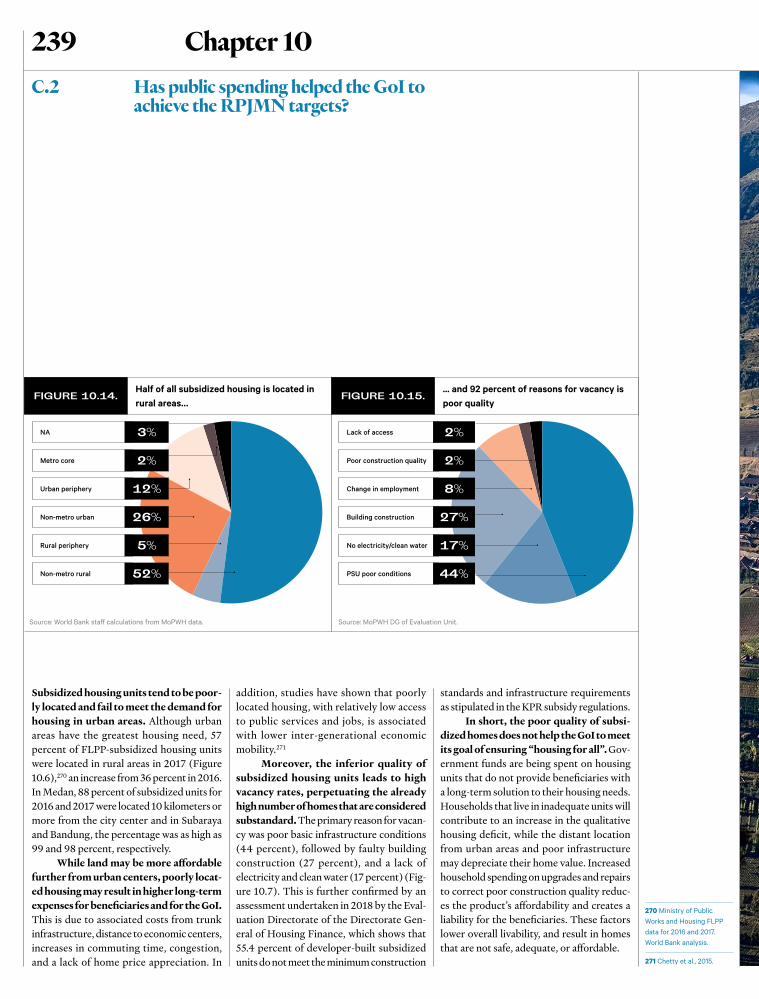
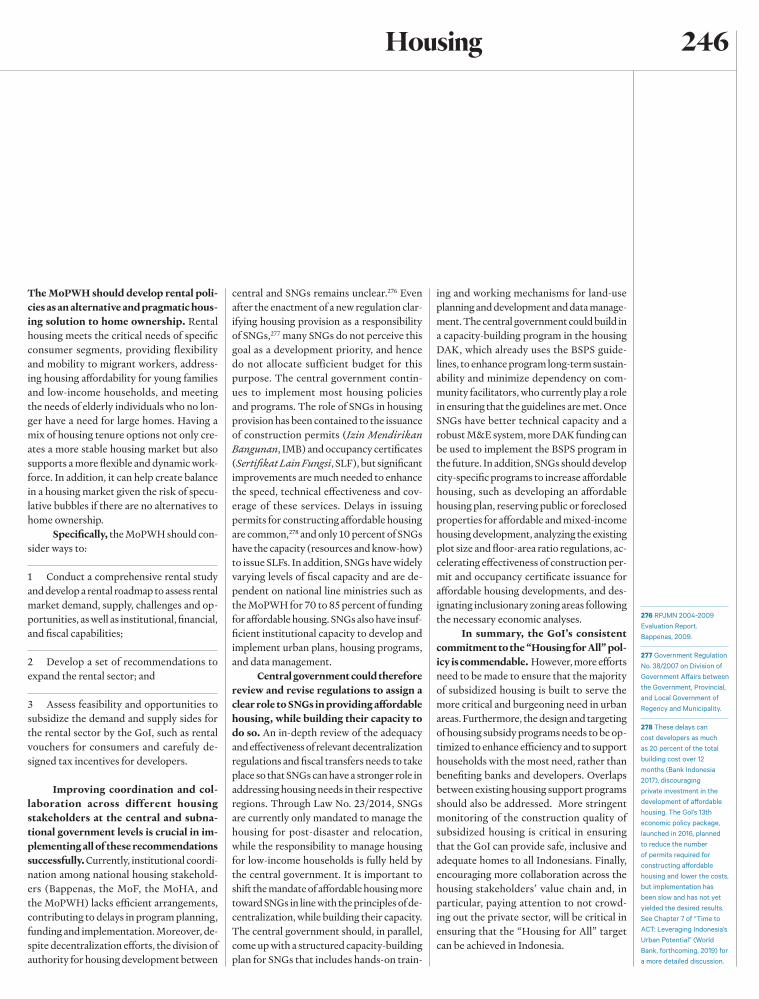
Subsidized housing units tend to be poor-ly located and fail to meet the demand for housing in urban areas. Although urban areas have the greatest housing need, 57 percent of FLPP-subsidized housing units were located in rural areas in 2017 (Figure 10.6),270 an increase from 36 percent in 2016. In Medan, 88 percent of subsidized units for 2016 and 2017 were located 10 kilometers or more from the city center and in Subaraya and Bandung, the percentage was as high as 99 and 98 percent, respectively.
While land may be more affordable further from urban centers, poorly locat-ed housing may result in higher long-term expenses for beneficiaries and for the GoI. This is due to associated costs from trunk infrastructure, distance to economic centers, increases in commuting time, congestion, and a lack of home price appreciation. In
addition, studies have shown that poorly located housing, with relatively low access to public services and jobs, is associated with lower inter-generational economic mobility.271
Moreover, the inferior quality of subsidized housing units leads to high vacancy rates, perpetuating the already high number of homes that are considered substandard. The primary reason for vacan-cy was poor basic infrastructure conditions (44 percent), followed by faulty building construction (27 percent), and a lack of electricity and clean water (17 percent) (Fig-ure 10.7). This is further confirmed by an assessment undertaken in 2018 by the Eval-uation Directorate of the Directorate Gen-eral of Housing Finance, which shows that 55.4 percent of developer-built subsidized units do not meet the minimum construction
standards and infrastructure requirements as stipulated in the KPR subsidy regulations.
In short, the poor quality of subsi-dized homes does not help the GoI to meet its goal of ensuring “housing for all”. Gov-ernment funds are being spent on housing units that do not provide beneficiaries with a long-term solution to their housing needs. Households that live in inadequate units will contribute to an increase in the qualitative housing deficit, while the distant location from urban areas and poor infrastructure may depreciate their home value. Increased household spending on upgrades and repairs to correct poor construction quality reduc-es the product’s affordability and creates a liability for the beneficiaries. These factors lower overall livability, and result in homes that are not safe, adequate, or affordable.
Half of all subsidized housing is located in rural areas…
... and 92 percent of reasons for vacancy is poor quality
FIGURE 10.14. FIGURE 10.15.
NA Lack of access
Metro core Poor construction quality
Urban periphery Change in employment
Non-metro urban Building construction
Rural periphery No electricity/clean water
Non-metro rural PSU poor conditions
3% 2%
2% 2%
12% 8%
26% 27%
5% 17%
52% 44%
Source: World Bank staff calculations from MoPWH data. Source: MoPWH DG of Evaluation Unit.
239 Chapter 10
To what extent are subsidy schemes effectively leveraging private sector finance to deliver affordable and livable housing?
C.3
The poor quality of housing is, in part, exacerbated by the fact that subsidized housing developers are generally frag-mented, localized and small in scale. In 2016, about 80 percent of developers par-ticipating in FLPP built 30 percent of the FLPP units, at an average of about six units per developer. These small developers do not have the economies of scale necessary to produce good quality housing, as they lack access to skilled construction workers and project managers, good quality con-struction materials, and technology and finance. In addition, they may not be as concerned with reputational risk as larg-er-scale developers.
In addition, lenders and develop-ers that participate in FLPP and SSB face limited risks, contributing to moral haz-ard. Lenders participating in FLPP receive a minimum net interest margin (NIM) of
about 1.5 percent and an internal rate of return of 8.2 percent.272 Furthermore, they are generally protected against borrower default through buy-back guarantees (during the first one to three years of the loan), and with a mortgage guarantee (af-ter the buy-back guarantee period). Like-wise, developers receive a 20 to 30 percent margin on subsidized housing projects. In the case of beneficiary default during the buy-back guarantee period, units can be refurbished and resold, sometimes at a higher price. Lenders and developers therefore do not have much ‘skin in the game’, which contributes to issues of poor housing construction quality, non-compli-ance of residency requirements, and tar-geting. In short, FLPP and SSB appear to benefit lenders and developers rather than consumers.
“The poor quality of subsidized homes does not help the GoI to meet its goal of ensuring “housing for all””
272 World Bank calculations
240Housing
To what extent does public spending promote equality in access to housing subsidies and grants?
C.4
BSPS home improvement grants are relatively effective in targeting low-income (MBR) Indonesian households, as per its stated intention. Sixty-five percent of BSPS beneficia-ries are from the poorest 4 deciles of household consumption, i.e., the poorest 40 percent of households.273
Contrary to their objective of promoting equal access to housing, FLPP and SSB are regressive schemes that benefit higher-income earners more than the targeted low-income group (MBR). This is due to two reasons:
1
There is significant vertical inequality across the subsidy programs.Beneficiaries of the BSPS program at the bottom 2 deciles receive a subsidy of IDR 15-30 million, while beneficiaries of the FLPP and SSB in income deciles of 3-9 re-ceive a subsidy of IDR 40-100 million. The majority of FLPP and SSB beneficiaries re-ceived subsidies at an NPV of up to IDR 61 million, which is two to four times that of BSPS beneficiaries (Figure 10.16, right pan-el). Moreover, the GoI is currently preparing the launch of FLPP ASN—an extended FLPP program designed for civil servants (the ASN segment)—who are in income deciles 7-9. The subsidy would range from IDR 80-160 million on a NPV basis, thus further exacer-bating vertical inequality.
2
More subsidies go to those who purchase more highly-valued properties, thus benefiting higher-income earners. The per unit subsidy cost for a landed house peaks at around IDR 60 million, while multi-story units with higher property value peak around IDR 135 million. In other words, higher-income earners who buy more expen-sive properties receive larger subsidies from FLPP and SSB.
In summary, using the “Basic Income” eligibility criterion masks the actual household income of beneficiaries, allowing for the highest-income earners to benefit from gov-ernment subsidies that are intended for the MBR. The GoI needs to clearly define the MBR segment and provide housing subsidies only to that segment.
273 Source: MPWH Laporan Pemantauan dan Evaluasi Rumah Swadaya, 2018.
241 Chapter 10
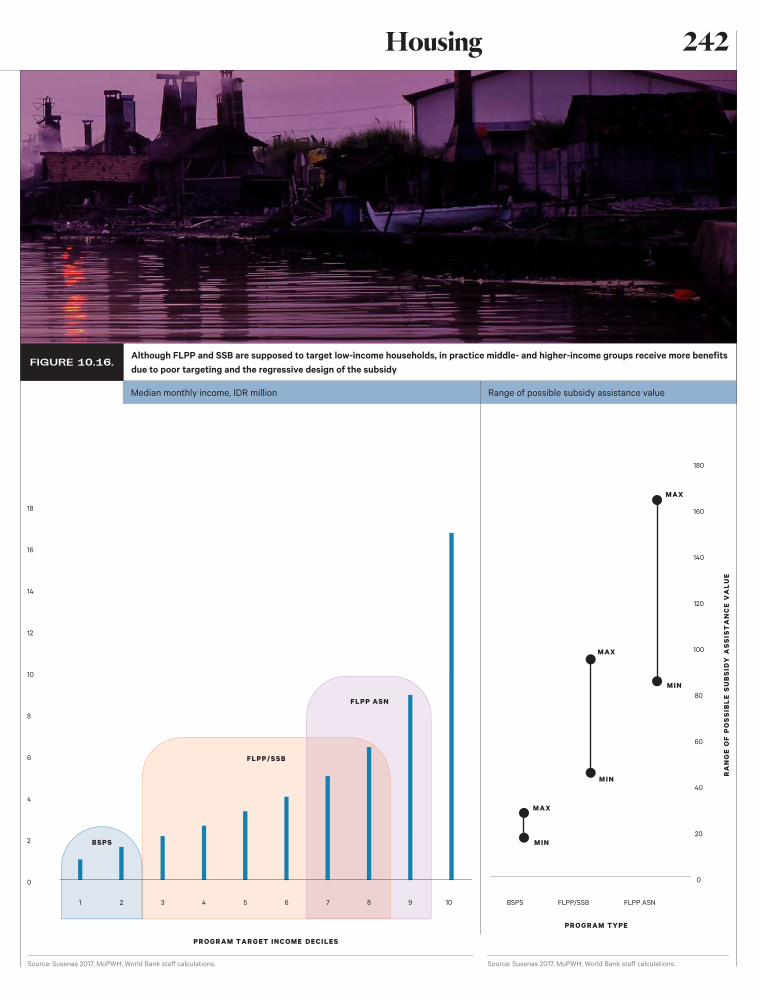
Median monthly income, IDR million Range of possible subsidy assistance value
Although FLPP and SSB are supposed to target low-income households, in practice middle- and higher-income groups receive more benefits due to poor targeting and the regressive design of the subsidy
FIGURE 10.16.
Source: Susenas 2017, MoPWH, World Bank staff calculations. Source: Susenas 2017, MoPWH, World Bank staff calculations.
242Housing
A s a principle, gov-ernment subsidies should be used to intervene where
the market is unable to reach, ideally focusing on lower-income households and where risk is higher than what can be borne by the private sector. Current trends work in the opposite direction, pro-viding larger and deeper subsidies for high-er-income segments, and crowding out the private sector. The upcoming RPJMN 2020-2024 is an opportunity to strengthen the sus-tainability of public spending on housing, better leverage private sector resources to meet housing gaps, and ultimately fulfill SDG goals, while supporting housing provisioning for all Indonesians.
This section provides short- and me-dium-term recommendations to help the GoI to meet its goal of providing housing for all Indonesians efficiently and effec-tively. Ideally, housing policy should pro-mote efficiency, equity, transparency, and help to leverage private/household resources to promote innovation and competition.
10.3
Recommendations to Improve the
Quality of Spending
A Short Term
B Medium Term
A Short Term
F irst, the GoI should shift public funding toward more efficient, progres-sive, and better-target-
ed subsidies. As illustrated earlier, shifting public funding toward more progressive subsidy schemes such as BP2BT would help to improve the efficiency and effectiveness of spending.
Existing subsidy programs can be further optimized to ensure per-unit cost efficiency and equity. The GoI has already committed to phase out of SSB in 2020, while reducing its FLPP liquidity contribu-tion from 90 to 75 percent of the loan has begun in 2019. To further optimize FLPP, one or a combination of the following mea-sures could be considered:
1 Further reduce the GoI’s liquidity con-tribution (from the current 75 percent of the loan);
2 Increase the interest rate at loan origina-tion or on a step-up basis in line with benefi-ciaries’ capacity-to-pay; and
3 Leverage SMF capacity to tap capital market funding for blended liquidity sup-port.
One major constraint to implement-ing these recommendations is the political nature of affordable housing provision in Indonesia, as in many other countries. The provision of affordable housing can become highly politicized, leading targeting and budgeting decisions to move with election cycles, and negatively impacting the execut-ing agencies’ ability to implement housing programs. Associating housing programs with election cycles also hinders their abil-ity to achieve long-term efficiency through monitoring and evaluation (M&E), and improvement. Politics can also influence the measurement of a program’s success, as performance indicators place more weight on a numeric achievement in lieu of SDG measures such as construction quality, safe-ty, adequacy, or livability. However, several countries have managed to establish long-term national affordable housing policies and strategies and implement them in a consis-tent manner. Singapore’s public housing pro-
243 Chapter 10
274 Habitat for Humanity, 2018.
gram, for instance, has been lauded as one of the world’s best practices and the long-term planning nature of the program is among the key drivers of success.
Second, the GoI should also ensure that subsidized homes are of good con-struction quality and are built in well-lo-cated areas. To do so, the MoPWH should consider:
1 developing spatial suitability tools and guidelines for subsidized housing, including location screening with hazard mapping, to ensure well-located housing development and to protect beneficiaries from investing in poorly located projects that can strain their social and economic livelihoods;
2 developing a robust M&E system using geo-tagging technologies to track quality and take actions to address non-compliance of quality standards; and
3 promoting the development of a na-tionwide developer certification and scoring system in partnership with real estate associa-tions and the MoPWH’s Directorate General of Construction Development (Bina Konstruksi) to disengage poorly performing developers, while incentivizing quality developers.
Currently, the lack of a strong M&E system limits the implementation and long-term sustainability of housing pro-grams. Audits are conducted by BPKP and BPK, the internal GoI and external auditors, respectively, but do not focus on the quali-ty, effectiveness, and efficiency of spending. This limits accountability beyond volume of developers and mortgage providers. Com-pliance enforcement is not systematized, in-creasing the likelihood of poor construction
and infrastructure from developers and lend-ers, as well as the voiding of residency com-pliance requirements of consumers. Finally, a strong consumer complaints system is also lacking, limiting consumers’ ability to voice issues related to their subsidized homes.
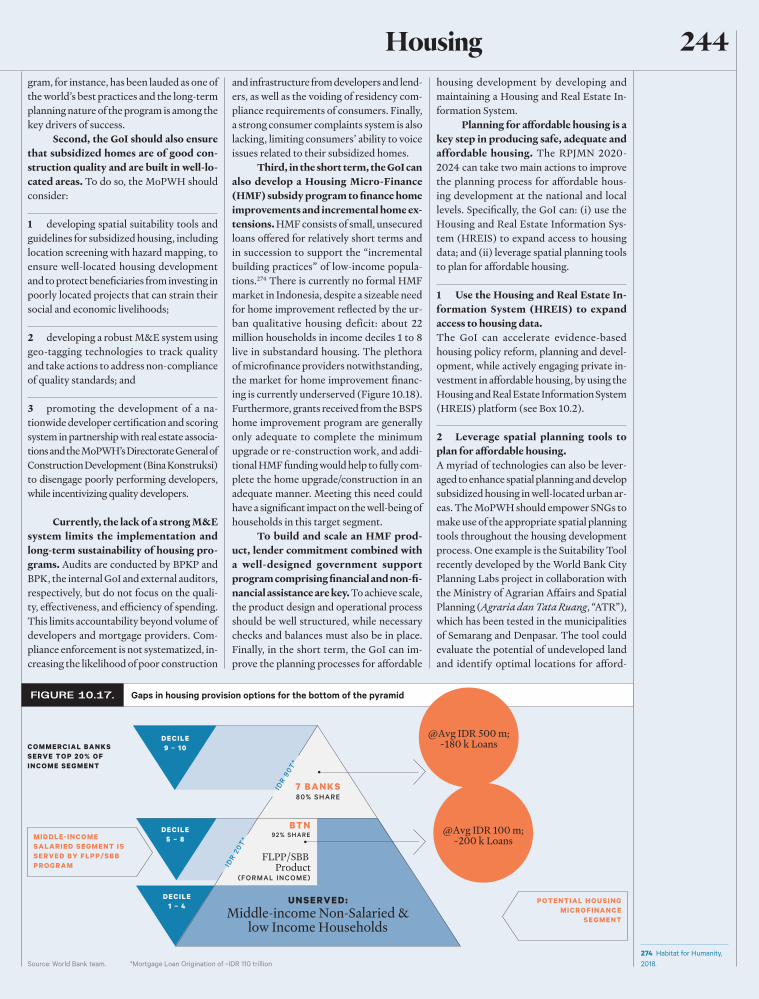
Third, in the short term, the GoI can also develop a Housing Micro-Finance (HMF) subsidy program to finance home improvements and incremental home ex-tensions. HMF consists of small, unsecured loans offered for relatively short terms and in succession to support the “incremental building practices” of low-income popula-tions.274 There is currently no formal HMF market in Indonesia, despite a sizeable need for home improvement reflected by the ur-ban qualitative housing deficit: about 22 million households in income deciles 1 to 8 live in substandard housing. The plethora of microfinance providers notwithstanding, the market for home improvement financ-ing is currently underserved (Figure 10.18). Furthermore, grants received from the BSPS home improvement program are generally only adequate to complete the minimum upgrade or re-construction work, and addi-tional HMF funding would help to fully com-plete the home upgrade/construction in an adequate manner. Meeting this need could have a significant impact on the well-being of households in this target segment.
To build and scale an HMF prod-uct, lender commitment combined with a well-designed government support program comprising financial and non-fi-nancial assistance are key. To achieve scale, the product design and operational process should be well structured, while necessary checks and balances must also be in place. Finally, in the short term, the GoI can im-prove the planning processes for affordable
housing development by developing and maintaining a Housing and Real Estate In-formation System.
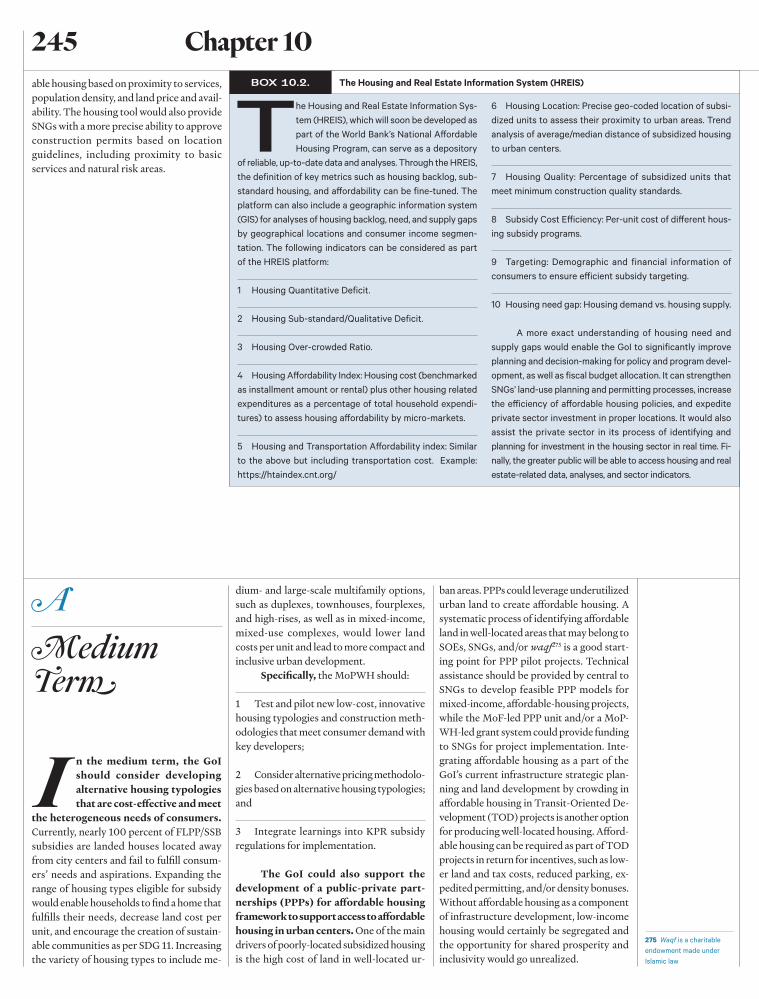
Planning for affordable housing is a key step in producing safe, adequate and affordable housing. The RPJMN 2020-2024 can take two main actions to improve the planning process for affordable hous-ing development at the national and local levels. Specifically, the GoI can: (i) use the Housing and Real Estate Information Sys-tem (HREIS) to expand access to housing data; and (ii) leverage spatial planning tools to plan for affordable housing.
1 Use the Housing and Real Estate In-formation System (HREIS) to expand access to housing data. The GoI can accelerate evidence-based housing policy reform, planning and devel-opment, while actively engaging private in-vestment in affordable housing, by using the Housing and Real Estate Information System (HREIS) platform (see Box 10.2).
2 Leverage spatial planning tools to plan for affordable housing.A myriad of technologies can also be lever-aged to enhance spatial planning and develop subsidized housing in well-located urban ar-eas. The MoPWH should empower SNGs to make use of the appropriate spatial planning tools throughout the housing development process. One example is the Suitability Tool recently developed by the World Bank City Planning Labs project in collaboration with the Ministry of Agrarian Affairs and Spatial Planning (Agraria dan Tata Ruang, “ATR”), which has been tested in the municipalities of Semarang and Denpasar. The tool could evaluate the potential of undeveloped land and identify optimal locations for afford-
Gaps in housing provision options for the bottom of the pyramidFIGURE 10.17.
Source: World Bank team. *Mortgage Loan Origination of ~IDR 110 trillion
244Housing
I n the medium term, the GoI should consider developing alternative housing typologies that are cost-effective and meet
the heterogeneous needs of consumers. Currently, nearly 100 percent of FLPP/SSB subsidies are landed houses located away from city centers and fail to fulfill consum-ers’ needs and aspirations. Expanding the range of housing types eligible for subsidy would enable households to find a home that fulfills their needs, decrease land cost per unit, and encourage the creation of sustain-able communities as per SDG 11. Increasing the variety of housing types to include me-
dium- and large-scale multifamily options, such as duplexes, townhouses, fourplexes, and high-rises, as well as in mixed-income, mixed-use complexes, would lower land costs per unit and lead to more compact and inclusive urban development.
Specifically, the MoPWH should:
1 Test and pilot new low-cost, innovative housing typologies and construction meth-odologies that meet consumer demand with key developers;
2 Consider alternative pricing methodolo-gies based on alternative housing typologies; and
3 Integrate learnings into KPR subsidy regulations for implementation.
The GoI could also support the development of a public-private part-nerships (PPPs) for affordable housing framework to support access to affordable housing in urban centers. One of the main drivers of poorly-located subsidized housing is the high cost of land in well-located ur-
ban areas. PPPs could leverage underutilized urban land to create affordable housing. A systematic process of identifying affordable land in well-located areas that may belong to SOEs, SNGs, and/or waqf275 is a good start-ing point for PPP pilot projects. Technical assistance should be provided by central to SNGs to develop feasible PPP models for mixed-income, affordable-housing projects, while the MoF-led PPP unit and/or a MoP-WH-led grant system could provide funding to SNGs for project implementation. Inte-grating affordable housing as a part of the GoI’s current infrastructure strategic plan-ning and land development by crowding in affordable housing in Transit-Oriented De-velopment (TOD) projects is another option for producing well-located housing. Afford-able housing can be required as part of TOD projects in return for incentives, such as low-er land and tax costs, reduced parking, ex-pedited permitting, and/or density bonuses. Without affordable housing as a component of infrastructure development, low-income housing would certainly be segregated and the opportunity for shared prosperity and inclusivity would go unrealized.
able housing based on proximity to services, population density, and land price and avail-ability. The housing tool would also provide SNGs with a more precise ability to approve construction permits based on location guidelines, including proximity to basic services and natural risk areas.
The Housing and Real Estate Information Sys-tem (HREIS), which will soon be developed as part of the World Bank’s National Affordable Housing Program, can serve as a depository
of reliable, up-to-date data and analyses. Through the HREIS, the definition of key metrics such as housing backlog, sub-standard housing, and affordability can be fine-tuned. The platform can also include a geographic information system (GIS) for analyses of housing backlog, need, and supply gaps by geographical locations and consumer income segmen-tation. The following indicators can be considered as part of the HREIS platform:
1 Housing Quantitative Deficit.
2 Housing Sub-standard/Qualitative Deficit.
3 Housing Over-crowded Ratio.
4 Housing Affordability Index: Housing cost (benchmarked as installment amount or rental) plus other housing related expenditures as a percentage of total household expendi-tures) to assess housing affordability by micro-markets.
5 Housing and Transportation Affordability index: Similar to the above but including transportation cost. Example: https://htaindex.cnt.org/
6 Housing Location: Precise geo-coded location of subsi-dized units to assess their proximity to urban areas. Trend analysis of average/median distance of subsidized housing to urban centers.
7 Housing Quality: Percentage of subsidized units that meet minimum construction quality standards.
8 Subsidy Cost Efficiency: Per-unit cost of different hous-ing subsidy programs.
9 Targeting: Demographic and financial information of consumers to ensure efficient subsidy targeting.
10 Housing need gap: Housing demand vs. housing supply.
A more exact understanding of housing need and supply gaps would enable the GoI to significantly improve planning and decision-making for policy and program devel-opment, as well as fiscal budget allocation. It can strengthen SNGs’ land-use planning and permitting processes, increase the efficiency of affordable housing policies, and expedite private sector investment in proper locations. It would also assist the private sector in its process of identifying and planning for investment in the housing sector in real time. Fi-nally, the greater public will be able to access housing and real estate-related data, analyses, and sector indicators.
The Housing and Real Estate Information System (HREIS)BOX 10.2.
A Medium Term
275 Waqf is a charitable endowment made under Islamic law
245 Chapter 10
The MoPWH should develop rental poli-cies as an alternative and pragmatic hous-ing solution to home ownership. Rental housing meets the critical needs of specific consumer segments, providing flexibility and mobility to migrant workers, address-ing housing affordability for young families and low-income households, and meeting the needs of elderly individuals who no lon-ger have a need for large homes. Having a mix of housing tenure options not only cre-ates a more stable housing market but also supports a more flexible and dynamic work-force. In addition, it can help create balance in a housing market given the risk of specu-lative bubbles if there are no alternatives to home ownership.
Specifically, the MoPWH should con-sider ways to:
1 Conduct a comprehensive rental study and develop a rental roadmap to assess rental market demand, supply, challenges and op-portunities, as well as institutional, financial, and fiscal capabilities;
2 Develop a set of recommendations to expand the rental sector; and
3 Assess feasibility and opportunities to subsidize the demand and supply sides for the rental sector by the GoI, such as rental vouchers for consumers and carefuly de-signed tax incentives for developers.
Improving coordination and col-laboration across different housing stakeholders at the central and subna-tional government levels is crucial in im-plementing all of these recommendations successfully. Currently, institutional coordi-nation among national housing stakehold-ers (Bappenas, the MoF, the MoHA, and the MoPWH) lacks efficient arrangements, contributing to delays in program planning, funding and implementation. Moreover, de-spite decentralization efforts, the division of authority for housing development between
central and SNGs remains unclear.276 Even after the enactment of a new regulation clar-ifying housing provision as a responsibility of SNGs,277 many SNGs do not perceive this goal as a development priority, and hence do not allocate sufficient budget for this purpose. The central government contin-ues to implement most housing policies and programs. The role of SNGs in housing provision has been contained to the issuance of construction permits (Izin Mendirikan Bangunan, IMB) and occupancy certificates (Sertifikat Lain Fungsi, SLF), but significant improvements are much needed to enhance the speed, technical effectiveness and cov-erage of these services. Delays in issuing permits for constructing affordable housing are common,278 and only 10 percent of SNGs have the capacity (resources and know-how) to issue SLFs. In addition, SNGs have widely varying levels of fiscal capacity and are de-pendent on national line ministries such as the MoPWH for 70 to 85 percent of funding for affordable housing. SNGs also have insuf-ficient institutional capacity to develop and implement urban plans, housing programs, and data management.
Central government could therefore review and revise regulations to assign a clear role to SNGs in providing affordable housing, while building their capacity to do so. An in-depth review of the adequacy and effectiveness of relevant decentralization regulations and fiscal transfers needs to take place so that SNGs can have a stronger role in addressing housing needs in their respective regions. Through Law No. 23/2014, SNGs are currently only mandated to manage the housing for post-disaster and relocation, while the responsibility to manage housing for low-income households is fully held by the central government. It is important to shift the mandate of affordable housing more toward SNGs in line with the principles of de-centralization, while building their capacity. The central government should, in parallel, come up with a structured capacity-building plan for SNGs that includes hands-on train-
ing and working mechanisms for land-use planning and development and data manage-ment. The central government could build in a capacity-building program in the housing DAK, which already uses the BSPS guide-lines, to enhance program long-term sustain-ability and minimize dependency on com-munity facilitators, who currently play a role in ensuring that the guidelines are met. Once SNGs have better technical capacity and a robust M&E system, more DAK funding can be used to implement the BSPS program in the future. In addition, SNGs should develop city-specific programs to increase affordable housing, such as developing an affordable housing plan, reserving public or foreclosed properties for affordable and mixed-income housing development, analyzing the existing plot size and floor-area ratio regulations, ac-celerating effectiveness of construction per-mit and occupancy certificate issuance for affordable housing developments, and des-ignating inclusionary zoning areas following the necessary economic analyses.
In summary, the GoI’s consistent commitment to the “Housing for All” pol-icy is commendable. However, more efforts need to be made to ensure that the majority of subsidized housing is built to serve the more critical and burgeoning need in urban areas. Furthermore, the design and targeting of housing subsidy programs needs to be op-timized to enhance efficiency and to support households with the most need, rather than benefiting banks and developers. Overlaps between existing housing support programs should also be addressed. More stringent monitoring of the construction quality of subsidized housing is critical in ensuring that the GoI can provide safe, inclusive and adequate homes to all Indonesians. Finally, encouraging more collaboration across the housing stakeholders’ value chain and, in particular, paying attention to not crowd-ing out the private sector, will be critical in ensuring that the “Housing for All” target can be achieved in Indonesia.
276 RPJMN 2004-2009 Evaluation Report. Bappenas, 2009.
277 Government Regulation No. 38/2007 on Division of Government Affairs between the Government, Provincial, and Local Government of Regency and Municipality.
278 These delays can cost developers as much as 20 percent of the total building cost over 12 months (Bank Indonesia 2017), discouraging private investment in the development of affordable housing. The GoI’s 13th economic policy package, launched in 2016, planned to reduce the number of permits required for constructing affordable housing and lower the costs, but implementation has been slow and has not yet yielded the desired results. See Chapter 7 of “Time to ACT: Leveraging Indonesia’s Urban Potential” (World Bank, forthcoming, 2019) for a more detailed discussion.
246Housing
Percent
Annex 10–1Summary of main mortgage subsidy mechanisms, FLPP & SSB
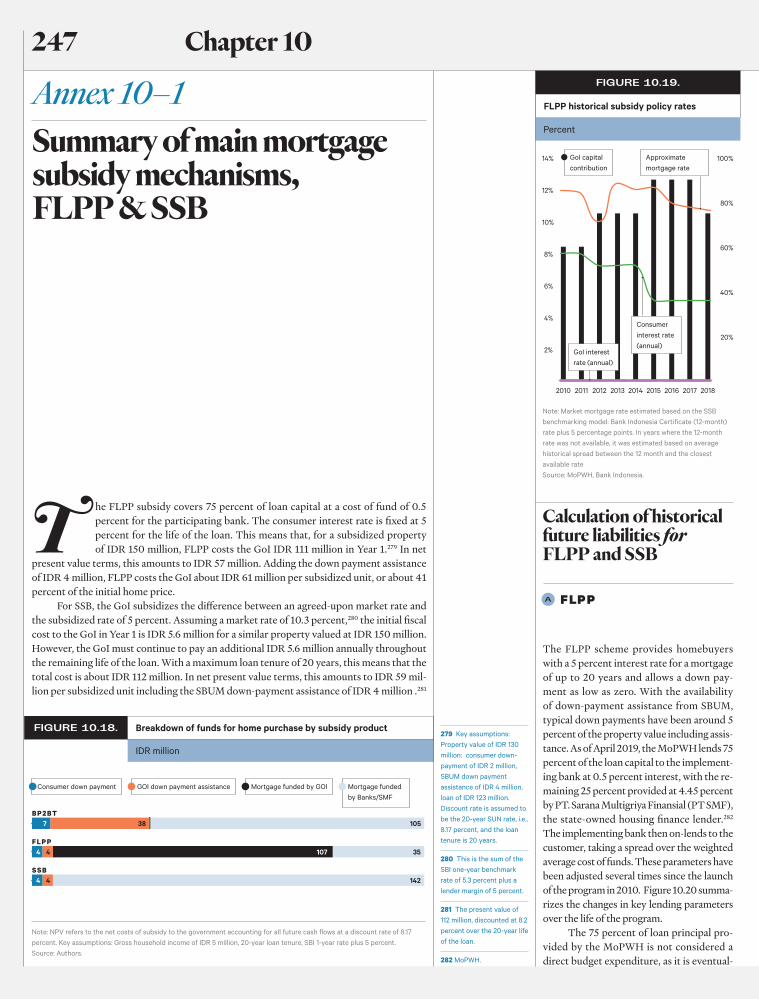
T he FLPP subsidy covers 75 percent of loan capital at a cost of fund of 0.5 percent for the participating bank. The consumer interest rate is fixed at 5 percent for the life of the loan. This means that, for a subsidized property of IDR 150 million, FLPP costs the GoI IDR 111 million in Year 1.279 In net
present value terms, this amounts to IDR 57 million. Adding the down payment assistance of IDR 4 million, FLPP costs the GoI about IDR 61 million per subsidized unit, or about 41 percent of the initial home price.
For SSB, the GoI subsidizes the difference between an agreed-upon market rate and the subsidized rate of 5 percent. Assuming a market rate of 10.3 percent,280 the initial fiscal cost to the GoI in Year 1 is IDR 5.6 million for a similar property valued at IDR 150 million. However, the GoI must continue to pay an additional IDR 5.6 million annually throughout the remaining life of the loan. With a maximum loan tenure of 20 years, this means that the total cost is about IDR 112 million. In net present value terms, this amounts to IDR 59 mil-lion per subsidized unit including the SBUM down-payment assistance of IDR 4 million .281
IDR million
Breakdown of funds for home purchase by subsidy productFIGURE 10.18.
Consumer down payment
GoI capital contribution
GOI down payment assistance Mortgage funded by GOI
Note: NPV refers to the net costs of subsidy to the government accounting for all future cash flows at a discount rate of 8.17 percent. Key assumptions: Gross household income of IDR 5 million, 20-year loan tenure, SBI 1-year rate plus 5 percent. Source: Authors.
Mortgage funded by Banks/SMF
279 Key assumptions: Property value of IDR 130 million: consumer down-payment of IDR 2 million, SBUM down payment assistance of IDR 4 million, loan of IDR 123 million. Discount rate is assumed to be the 20-year SUN rate, i.e., 8.17 percent, and the loan tenure is 20 years.
280 This is the sum of the SBI one-year benchmark rate of 5.3 percent plus a lender margin of 5 percent.
281 The present value of 112 million, discounted at 8.2 percent over the 20-year life of the loan.
282 MoPWH.
The FLPP scheme provides homebuyers with a 5 percent interest rate for a mortgage of up to 20 years and allows a down pay-ment as low as zero. With the availability of down-payment assistance from SBUM, typical down payments have been around 5 percent of the property value including assis-tance. As of April 2019, the MoPWH lends 75 percent of the loan capital to the implement-ing bank at 0.5 percent interest, with the re-maining 25 percent provided at 4.45 percent by PT. Sarana Multigriya Finansial (PT SMF), the state-owned housing finance lender.282 The implementing bank then on-lends to the customer, taking a spread over the weighted average cost of funds. These parameters have been adjusted several times since the launch of the program in 2010. Figure 10.20 summa-rizes the changes in key lending parameters over the life of the program.
The 75 percent of loan principal pro-vided by the MoPWH is not considered a direct budget expenditure, as it is eventual-
FLPP
Calculation of historical future liabilities for FLPP and SSB
A
FLPP historical subsidy policy rates
FIGURE 10.19.
Approximate mortgage rate
Consumer interest rate (annual)
GoI interest rate (annual)
Note: Market mortgage rate estimated based on the SSB benchmarking model: Bank Indonesia Certificate (12-month) rate plus 5 percentage points. In years where the 12-month rate was not available, it was estimated based on average historical spread between the 12 month and the closest available rateSource: MoPWH, Bank Indonesia.
7 38 105
4 4
4
107 35
1424
247 Chapter 10
Present value of subsidy cost, IDR trillion
Present value cost per unit, IDR million
FIGURE 10.23.
IDR million
IDR million
Breakdown of funds for home purchase by subsidy product
Historical SSB market benchmark used for payment calculation (monthly)
Net present cost of interest gap payments for SSB loans issued in 2015-18
FIGURE 10.20.
FIGURE 10.22.
SSBB
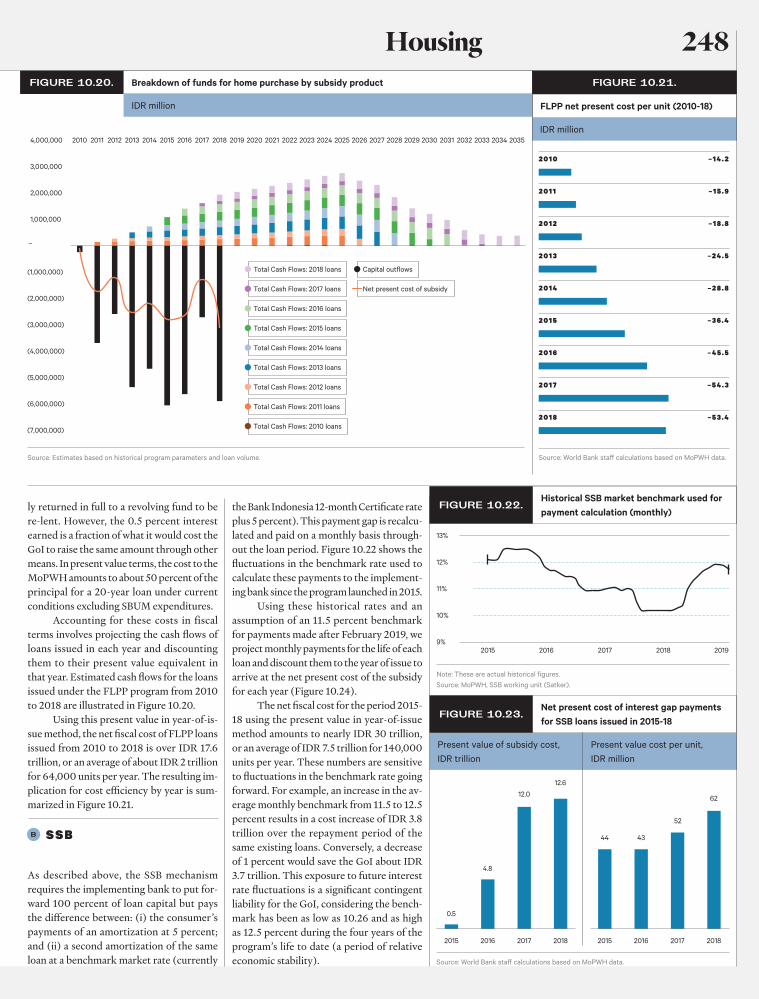
As described above, the SSB mechanism requires the implementing bank to put for-ward 100 percent of loan capital but pays the difference between: (i) the consumer’s payments of an amortization at 5 percent; and (ii) a second amortization of the same loan at a benchmark market rate (currently
ly returned in full to a revolving fund to be re-lent. However, the 0.5 percent interest earned is a fraction of what it would cost the GoI to raise the same amount through other means. In present value terms, the cost to the MoPWH amounts to about 50 percent of the principal for a 20-year loan under current conditions excluding SBUM expenditures.
Accounting for these costs in fiscal terms involves projecting the cash flows of loans issued in each year and discounting them to their present value equivalent in that year. Estimated cash flows for the loans issued under the FLPP program from 2010 to 2018 are illustrated in Figure 10.20.
Using this present value in year-of-is-sue method, the net fiscal cost of FLPP loans issued from 2010 to 2018 is over IDR 17.6 trillion, or an average of about IDR 2 trillion for 64,000 units per year. The resulting im-plication for cost efficiency by year is sum-marized in Figure 10.21.
the Bank Indonesia 12-month Certificate rate plus 5 percent). This payment gap is recalcu-lated and paid on a monthly basis through-out the loan period. Figure 10.22 shows the fluctuations in the benchmark rate used to calculate these payments to the implement-ing bank since the program launched in 2015.
Using these historical rates and an assumption of an 11.5 percent benchmark for payments made after February 2019, we project monthly payments for the life of each loan and discount them to the year of issue to arrive at the net present cost of the subsidy for each year (Figure 10.24).
The net fiscal cost for the period 2015-18 using the present value in year-of-issue method amounts to nearly IDR 30 trillion, or an average of IDR 7.5 trillion for 140,000 units per year. These numbers are sensitive to fluctuations in the benchmark rate going forward. For example, an increase in the av-erage monthly benchmark from 11.5 to 12.5 percent results in a cost increase of IDR 3.8 trillion over the repayment period of the same existing loans. Conversely, a decrease of 1 percent would save the GoI about IDR 3.7 trillion. This exposure to future interest rate fluctuations is a significant contingent liability for the GoI, considering the bench-mark has been as low as 10.26 and as high as 12.5 percent during the four years of the program’s life to date (a period of relative economic stability).
FLPP net present cost per unit (2010-18)
FIGURE 10.21.
Total Cash Flows: 2018 loans
Total Cash Flows: 2017 loans
Total Cash Flows: 2016 loans
Total Cash Flows: 2015 loans
Total Cash Flows: 2014 loans
Total Cash Flows: 2013 loans
Total Cash Flows: 2012 loans
Total Cash Flows: 2011 loans
Total Cash Flows: 2010 loans
Capital outflows
Net present cost of subsidy
Source: Estimates based on historical program parameters and loan volume.
2010 –14 .2
–15.9
–18.8
–24 .5
–28.8
–36.4
–45.5
–54 .3
–53.4
2011
2012
2013
2014
2015
2016
2017
2018
Source: World Bank staff calculations based on MoPWH data.
13%
12%
11%
10%
9%2015
2015 2015
12.6
62
52
4344
12.0
4.8
0.5
2016
2016 2016
2017
2017 2017
2018
2018 2018
2019
Note: These are actual historical figures. Source: MoPWH, SSB working unit (Satker).
Source: World Bank staff calculations based on MoPWH data.
248Housing