

National Health Expenditure Trends, 1975 to 2017 · 6 National Health Expenditure Trends, 1975 to...
45
National Health Expenditure Trends, 1975 to 2017
Transcript of National Health Expenditure Trends, 1975 to 2017 · 6 National Health Expenditure Trends, 1975 to...
Production of this document is made possible by financial contributions from Health Canada and provincial and territorial governments. The views expressed herein do not necessarily represent the views of Health Canada or any provincial or territorial government.
Unless otherwise indicated, this product uses data provided by Canada’s provinces and territories.
All rights reserved.
The contents of this publication may be reproduced unaltered, in whole or in part and by any means, solely for non-commercial purposes, provided that the Canadian Institute for Health Information is properly and fully acknowledged as the copyright owner. Any reproduction or use of this publication or its contents for any commercial purpose requires the prior written authorization of the Canadian Institute for Health Information. Reproduction or use that suggests endorsement by, or affiliation with, the Canadian Institute for Health Information is prohibited.
For permission or information, please contact CIHI:
Canadian Institute for Health Information495 Richmond Road, Suite 600Ottawa, Ontario K2A 4H6
Phone: 613-241-7860Fax: [email protected]
ISBN 978-1-77109-649-2 (PDF)
© 2017 Canadian Institute for Health Information
How to cite this document:Canadian Institute for Health Information. National Health Expenditure Trends, 1975 to 2017. Ottawa, ON: CIHI; 2017.
Cette publication est aussi disponible en français sous le titre Tendances des dépenses nationales de santé, 1975 à 2017.ISBN 978-1-77109-650-8 (PDF)
Table of contentsKey findings . . . . . . . . . . . . . . . . . . . . . . . . . . . . . . . . . . . . . . . . . . . . . . . . . . . . . . . . . . . . . . . 4
About this report . . . . . . . . . . . . . . . . . . . . . . . . . . . . . . . . . . . . . . . . . . . . . . . . . . . . . . . . . . . 5
Overview of health spending in Canada . . . . . . . . . . . . . . . . . . . . . . . . . . . . . . . . . . . . . . . . . . 6
International comparisons . . . . . . . . . . . . . . . . . . . . . . . . . . . . . . . . . . . . . . . . . . . . . . . . . . . 10
Total health expenditure by source of finance . . . . . . . . . . . . . . . . . . . . . . . . . . . . . . . . . . . . 11
Health expenditure by use of funds . . . . . . . . . . . . . . . . . . . . . . . . . . . . . . . . . . . . . . . . . . . . 14
Health expenditure in the provinces and territories . . . . . . . . . . . . . . . . . . . . . . . . . . . . . . . . 20
Analysis . . . . . . . . . . . . . . . . . . . . . . . . . . . . . . . . . . . . . . . . . . . . . . . . . . . . . . . . . . . . . . . . . 24
Appendix A: Health expenditure data in brief . . . . . . . . . . . . . . . . . . . . . . . . . . . . . . . . . . . . . 33
Appendix B: Text alternative for figures . . . . . . . . . . . . . . . . . . . . . . . . . . . . . . . . . . . . . . . . . 35
References . . . . . . . . . . . . . . . . . . . . . . . . . . . . . . . . . . . . . . . . . . . . . . . . . . . . . . . . . . . . . . 44
4
National Health Expenditure Trends, 1975 to 2017
Key findingsNational Health Expenditure Trends, 1975 to 2017 — the Canadian Institute for Health Information’s 21st annual health expenditure trends publication — provides detailed, updated information on health expenditure in Canada.
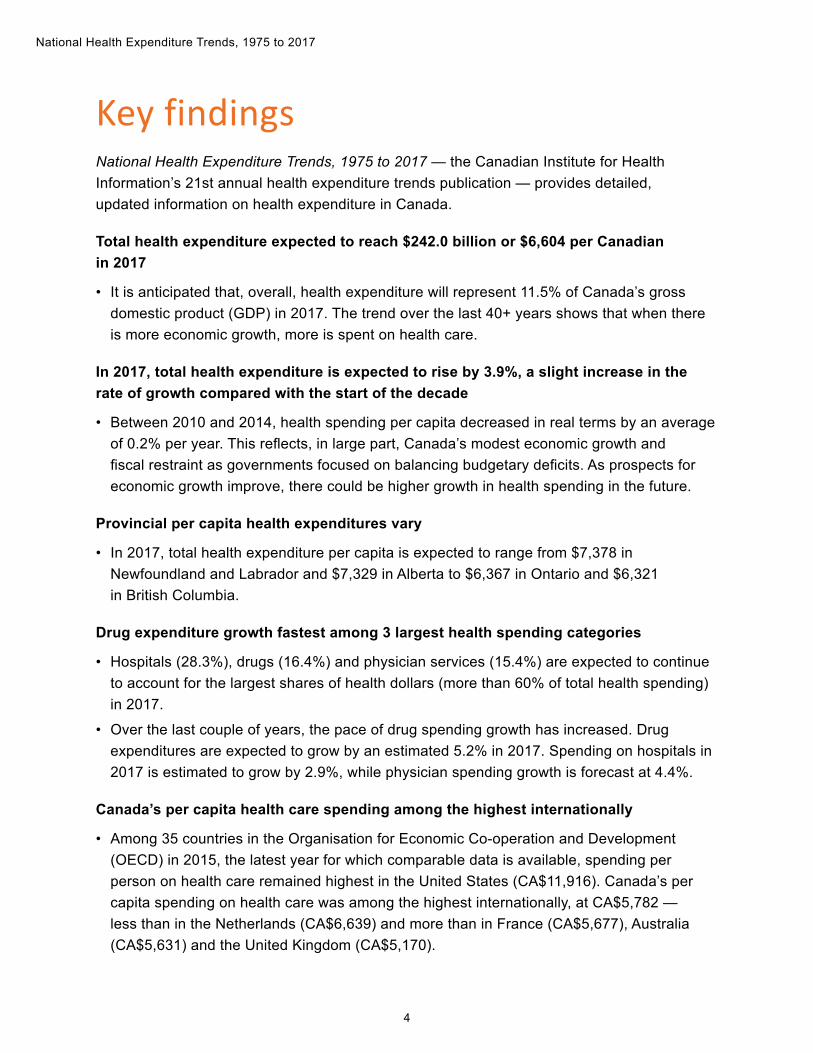
Total health expenditure expected to reach $242.0 billion or $6,604 per Canadian in 2017
• It is anticipated that, overall, health expenditure will represent 11.5% of Canada’s gross domestic product (GDP) in 2017. The trend over the last 40+ years shows that when there is more economic growth, more is spent on health care.
In 2017, total health expenditure is expected to rise by 3.9%, a slight increase in the rate of growth compared with the start of the decade
• Between 2010 and 2014, health spending per capita decreased in real terms by an average of 0.2% per year. This reflects, in large part, Canada’s modest economic growth and fiscal restraint as governments focused on balancing budgetary deficits. As prospects for economic growth improve, there could be higher growth in health spending in the future.
Provincial per capita health expenditures vary
• In 2017, total health expenditure per capita is expected to range from $7,378 in Newfoundland and Labrador and $7,329 in Alberta to $6,367 in Ontario and $6,321 in British Columbia.
Drug expenditure growth fastest among 3 largest health spending categories
• Hospitals (28.3%), drugs (16.4%) and physician services (15.4%) are expected to continue to account for the largest shares of health dollars (more than 60% of total health spending) in 2017.
• Over the last couple of years, the pace of drug spending growth has increased. Drug expenditures are expected to grow by an estimated 5.2% in 2017. Spending on hospitals in 2017 is estimated to grow by 2.9%, while physician spending growth is forecast at 4.4%.
Canada’s per capita health care spending among the highest internationally
• Among 35 countries in the Organisation for Economic Co-operation and Development (OECD) in 2015, the latest year for which comparable data is available, spending per person on health care remained highest in the United States (CA$11,916). Canada’s per capita spending on health care was among the highest internationally, at CA$5,782 — less than in the Netherlands (CA$6,639) and more than in France (CA$5,677), Australia (CA$5,631) and the United Kingdom (CA$5,170).
5
National Health Expenditure Trends, 1975 to 2017
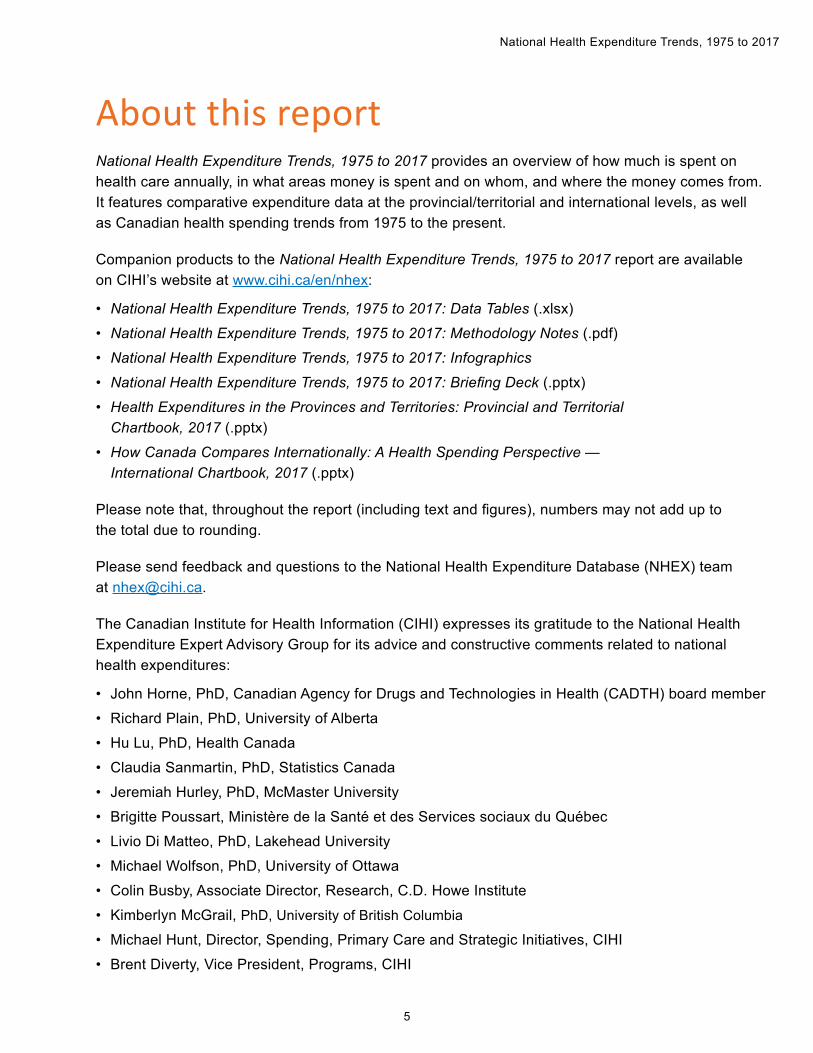
About this reportNational Health Expenditure Trends, 1975 to 2017 provides an overview of how much is spent on health care annually, in what areas money is spent and on whom, and where the money comes from. It features comparative expenditure data at the provincial/territorial and international levels, as well as Canadian health spending trends from 1975 to the present.
Companion products to the National Health Expenditure Trends, 1975 to 2017 report are available on CIHI’s website at www.cihi.ca/en/nhex:
• National Health Expenditure Trends, 1975 to 2017: Data Tables (.xlsx)
• National Health Expenditure Trends, 1975 to 2017: Methodology Notes (.pdf)
• National Health Expenditure Trends, 1975 to 2017: Infographics
• National Health Expenditure Trends, 1975 to 2017: Briefing Deck (.pptx)
• Health Expenditures in the Provinces and Territories: Provincial and Territorial Chartbook, 2017 (.pptx)
• How Canada Compares Internationally: A Health Spending Perspective — International Chartbook, 2017 (.pptx)
Please note that, throughout the report (including text and figures), numbers may not add up to the total due to rounding.
Please send feedback and questions to the National Health Expenditure Database (NHEX) team at [email protected].
The Canadian Institute for Health Information (CIHI) expresses its gratitude to the National Health Expenditure Expert Advisory Group for its advice and constructive comments related to national health expenditures:
• John Horne, PhD, Canadian Agency for Drugs and Technologies in Health (CADTH) board member
• Richard Plain, PhD, University of Alberta
• Hu Lu, PhD, Health Canada
• Claudia Sanmartin, PhD, Statistics Canada
• Jeremiah Hurley, PhD, McMaster University
• Brigitte Poussart, Ministère de la Santé et des Services sociaux du Québec
• Livio Di Matteo, PhD, Lakehead University
• Michael Wolfson, PhD, University of Ottawa
• Colin Busby, Associate Director, Research, C.D. Howe Institute
• Kimberlyn McGrail, PhD, University of British Columbia
• Michael Hunt, Director, Spending, Primary Care and Strategic Initiatives, CIHI
• Brent Diverty, Vice President, Programs, CIHI
6
National Health Expenditure Trends, 1975 to 2017
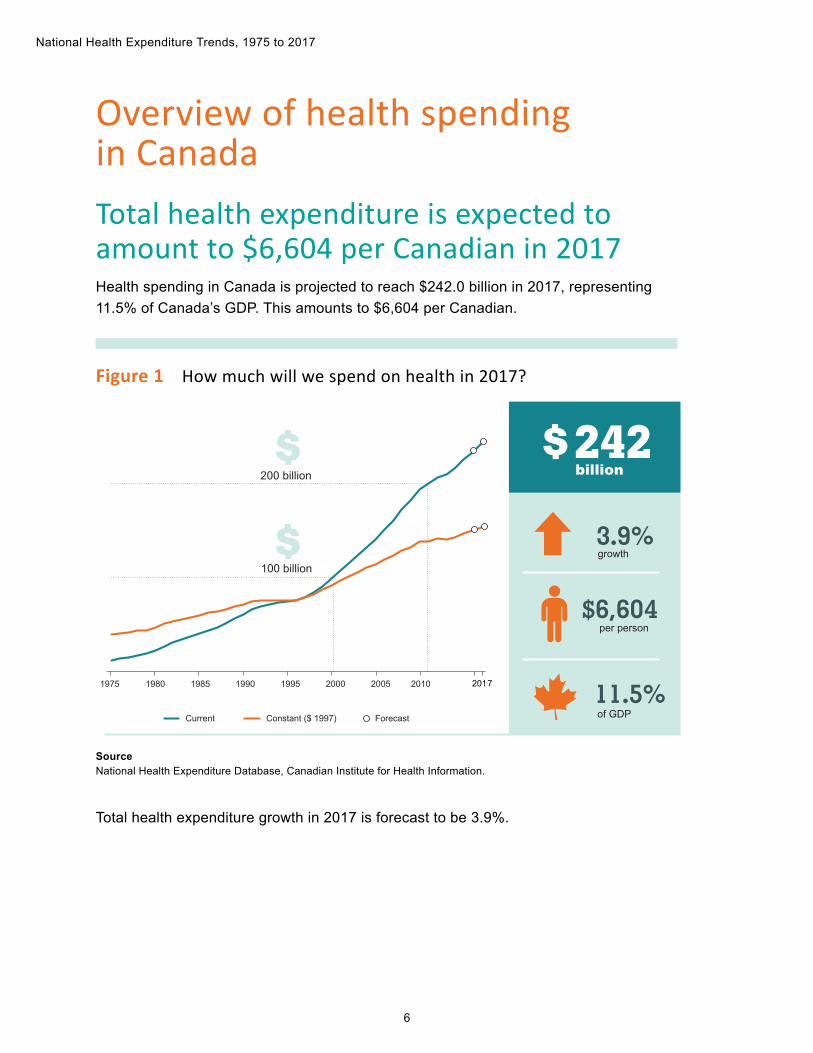
Overview of health spending in CanadaTotal health expenditure is expected to amount to $6,604 per Canadian in 2017Health spending in Canada is projected to reach $242.0 billion in 2017, representing 11.5% of Canada’s GDP. This amounts to $6,604 per Canadian.
Figure 1 How much will we spend on health in 2017?
$6,604per person
11.5%of GDP
growth3.9%
242billion
100 billion
200 billion
Current Constant ($ 1997) Forecast
20171975 1980 1985 1990 1995 2000 2005 2010
SourceNational Health Expenditure Database, Canadian Institute for Health Information.
Total health expenditure growth in 2017 is forecast to be 3.9%.
7
National Health Expenditure Trends, 1975 to 2017
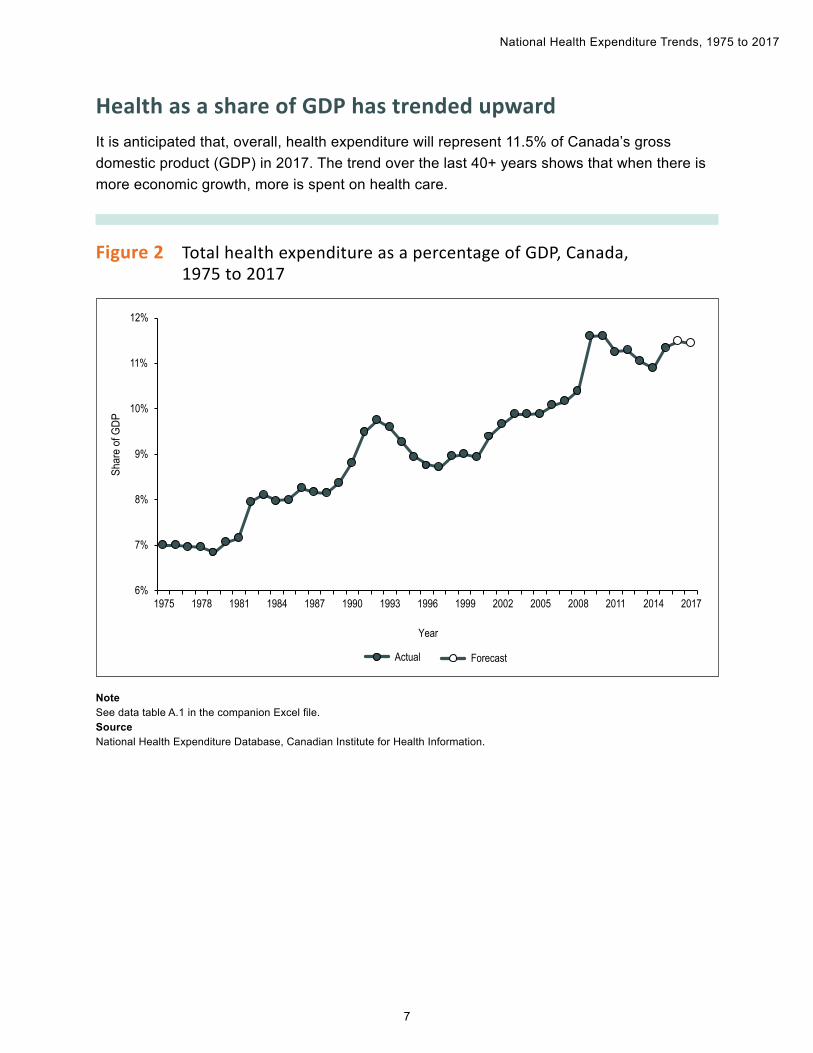
Health as a share of GDP has trended upwardIt is anticipated that, overall, health expenditure will represent 11.5% of Canada’s gross domestic product (GDP) in 2017. The trend over the last 40+ years shows that when there is more economic growth, more is spent on health care.
Figure 2 Total health expenditure as a percentage of GDP, Canada, 1975 to 2017
6%
7%
8%
9%
10%
11%
12%
1975 1978 1981 1984 1987 1990 1993 1996 1999 2002 2005 2008 2011 2014 2017
Shar
e of
GDP
Year
Actual Forecast
NoteSee data table A.1 in the companion Excel file.SourceNational Health Expenditure Database, Canadian Institute for Health Information.
8
National Health Expenditure Trends, 1975 to 2017
• 1975 to early 1990s: Health expenditure grew during this period. Total health expenditure as a proportion of GDP was 7.0% in 1975. With GDP falling during the 1982 recession, the ratio of total health expenditure to GDP increased sharply, from 6.8% in 1979 to 8.1% in 1983. The ratio continued to increase significantly, reaching 9.8% for the first time in 1992 (Figure 2).
• Mid-1990s: As governments focused on fiscal restraint, total health expenditures grew more slowly than GDP between 1993 and 1997. Consequently, the health-to-GDP ratio fell each year in that period, reaching 8.7% in 1997.
• Late 1990s to 2010: Major investments were made in health care. Health expenditure grew faster than or close to GDP from 1998 to 2010, with the result that the health-to-GDP ratio trended upward. It peaked at 11.6% in 2010.
• 2011 to 2017: Since the 2009 recession, governments have focused on restraining program spending to manage budgetary deficits. Health spending growth has been slower than or close to the growth in the overall economy. The health-to-GDP ratio is estimated to be 11.5% in 2017.
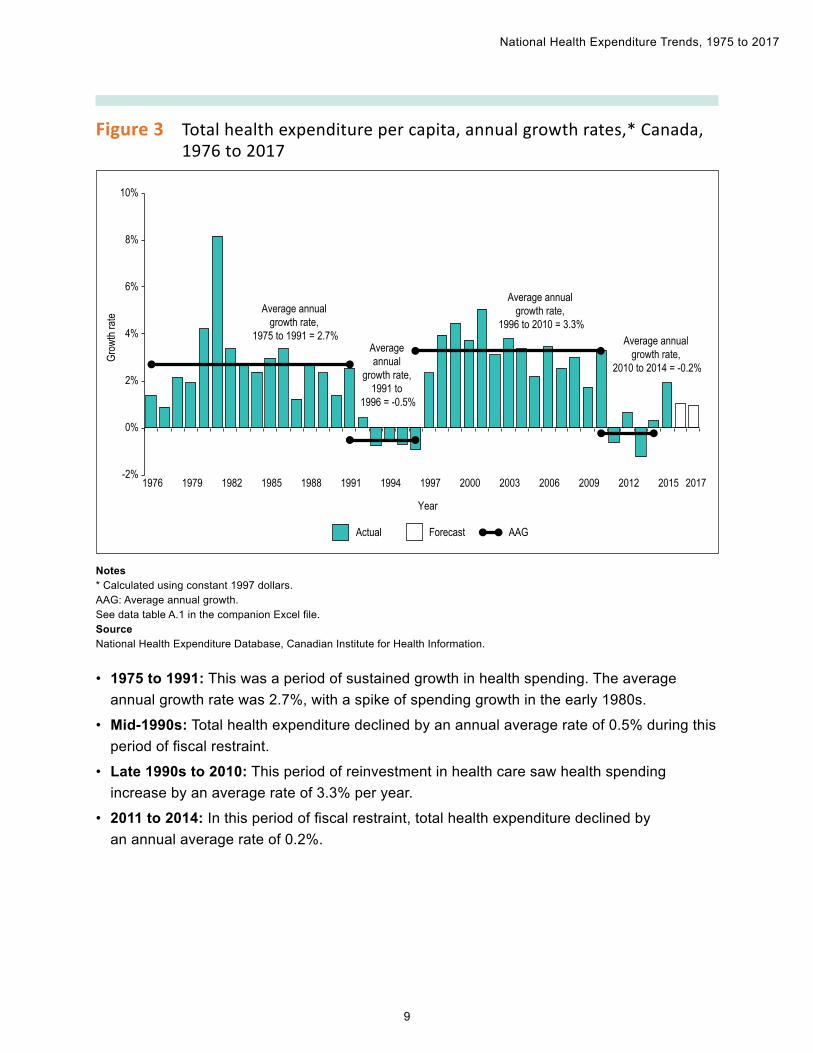
Total health expenditure in 2017 is expected to rise by 3.9%, a slight increase in the rate of growth compared with the start of the decadeBetween 2010 and 2014, health spending per capita decreased in real terms by an average of 0.2% per year (Figure 3), similar to the rate experienced during the mid-1990s. This was mainly due to Canada’s modest economic growth and fiscal restraint as governments focused on balancing budgetary deficits.
9
National Health Expenditure Trends, 1975 to 2017
Figure 3 Total health expenditure per capita, annual growth rates,* Canada, 1976 to 2017
-2%
0%
2%
4%
6%
8%
10%
1976 1979 1982 1985 1988 1991 1994 1997 2000 2003 2006 2009 2012 2015
Grow
th ra
te
Average annual growth rate,
2010 to 2014 = -0.2%
Average annual
growth rate, 1991 to
1996 = -0.5%
Average annual growth rate,
1996 to 2010 = 3.3%Average annual
growth rate, 1975 to 1991 = 2.7%
Year
2017
Actual Forecast AAG
Notes* Calculated using constant 1997 dollars.AAG: Average annual growth.See data table A.1 in the companion Excel file.SourceNational Health Expenditure Database, Canadian Institute for Health Information.
• 1975 to 1991: This was a period of sustained growth in health spending. The average annual growth rate was 2.7%, with a spike of spending growth in the early 1980s.
• Mid-1990s: Total health expenditure declined by an annual average rate of 0.5% during this period of fiscal restraint.
• Late 1990s to 2010: This period of reinvestment in health care saw health spending increase by an average rate of 3.3% per year.
• 2011 to 2014: In this period of fiscal restraint, total health expenditure declined by an annual average rate of 0.2%.
10
National Health Expenditure Trends, 1975 to 2017
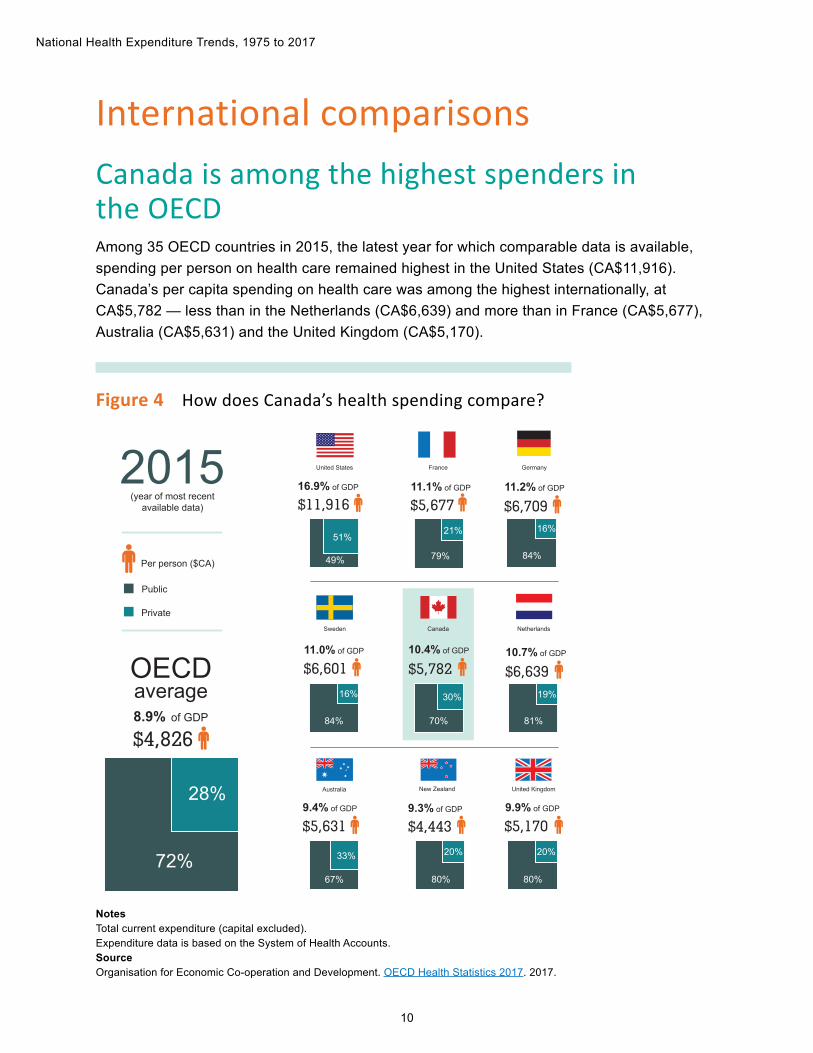
International comparisonsCanada is among the highest spenders in the OECDAmong 35 OECD countries in 2015, the latest year for which comparable data is available, spending per person on health care remained highest in the United States (CA$11,916). Canada’s per capita spending on health care was among the highest internationally, at CA$5,782 — less than in the Netherlands (CA$6,639) and more than in France (CA$5,677), Australia (CA$5,631) and the United Kingdom (CA$5,170).
Figure 4 How does Canada’s health spending compare?
Per person ($CA)
Public
Private
2015(year of most recent
available data)
$4,8268.9% of GDP
OECDaverage
28%
72%
$5,6319.4% of GDP
Australia
$5,1709.9% of GDP
United Kingdom
$5,78210.4% of GDP
Canada
$6,60111.0% of GDP
Sweden
$5,67711.1% of GDP
France
$6,70911.2% of GDP
Germany
$6,63910.7% of GDP
Netherlands
$4,4439.3% of GDP
New Zealand
$11,916
United States
16.9% of GDP
49%
51%
79%
21%
67%
33%
70%
30%
81%
19%
80%
20%
80%
20%
84%
16%
84%
16%
NotesTotal current expenditure (capital excluded). Expenditure data is based on the System of Health Accounts.SourceOrganisation for Economic Co-operation and Development. OECD Health Statistics 2017. 2017.
11
National Health Expenditure Trends, 1975 to 2017
Although Canada is above the OECD average in terms of per-person spending on health care, the public-sector share of total health expenditure is below the OECD average.
Total health expenditure by source of financeAbout 70% of total health expenditure in 2017 will come from public-sector fundingBoth the public and private sectors finance Canada’s health systems. Public-sector funding includes payments by governments at the federal, provincial/territorial and municipal levels and by workers’ compensation boards and other social security schemes. Private-sector funding consists primarily of health expenditures by households and private insurance firms.
Provincial and territorial government spending on health is expected to account for 65% of total health expenditure in 2017. i Another 5% will come from other parts of the public sector: federal direct government, municipal government and social security funds. Since 1997, the public-sector share of total health expenditure has remained relatively stable at around 70%.
i. National health expenditures are reported based on the principle of responsibility for payment rather than on the original source of the funds. It is for this reason, for example, that federal health transfers to the provinces/territories are contained within the provincial government sector, since it is the responsibility of provincial/territorial governments to expend federal transfers on health services.
12
National Health Expenditure Trends, 1975 to 2017
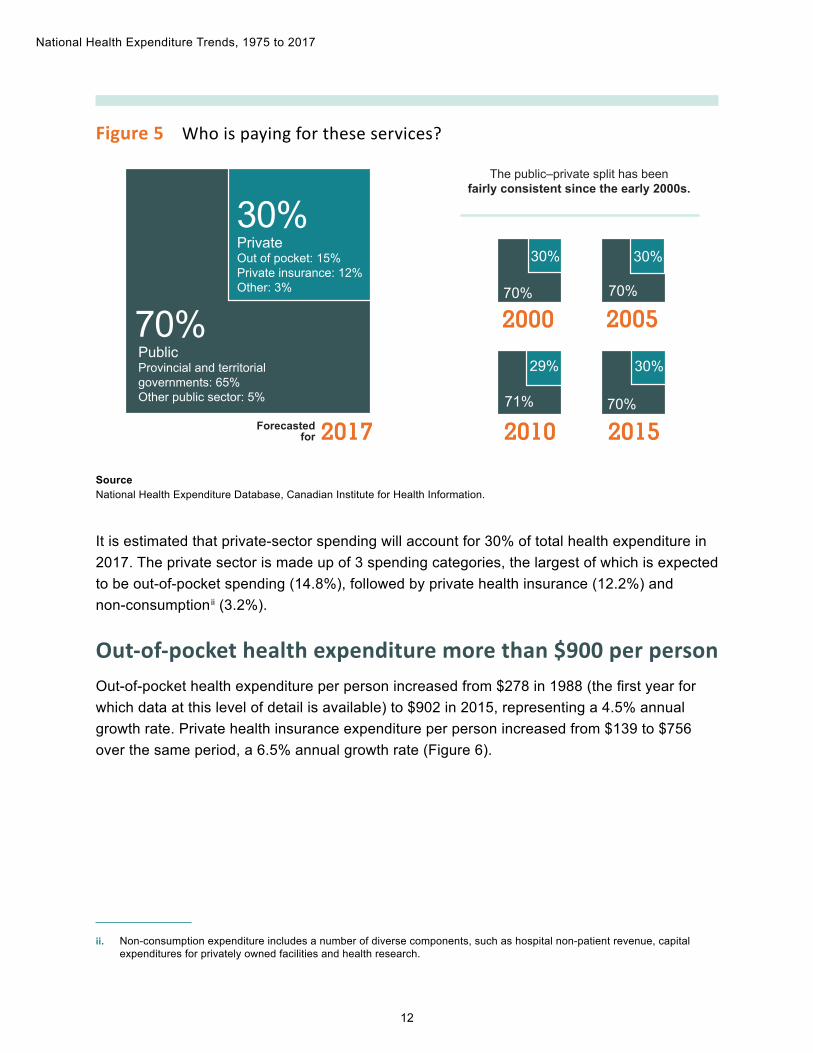
Figure 5 Who is paying for these services?
The public–private split has been fairly consistent since the early 2000s.
30%PrivateOut of pocket: 15%Private insurance: 12%Other: 3%
70%PublicProvincial and territorial governments: 65%Other public sector: 5%
200070%
29%
71%
30%
70%
2005
2010 20152017Forecastedfor
30%
70%
30%
SourceNational Health Expenditure Database, Canadian Institute for Health Information.
It is estimated that private-sector spending will account for 30% of total health expenditure in 2017. The private sector is made up of 3 spending categories, the largest of which is expected to be out-of-pocket spending (14.8%), followed by private health insurance (12.2%) and non-consumption ii (3.2%).
ii. Non-consumption expenditure includes a number of diverse components, such as hospital non-patient revenue, capital expenditures for privately owned facilities and health research.
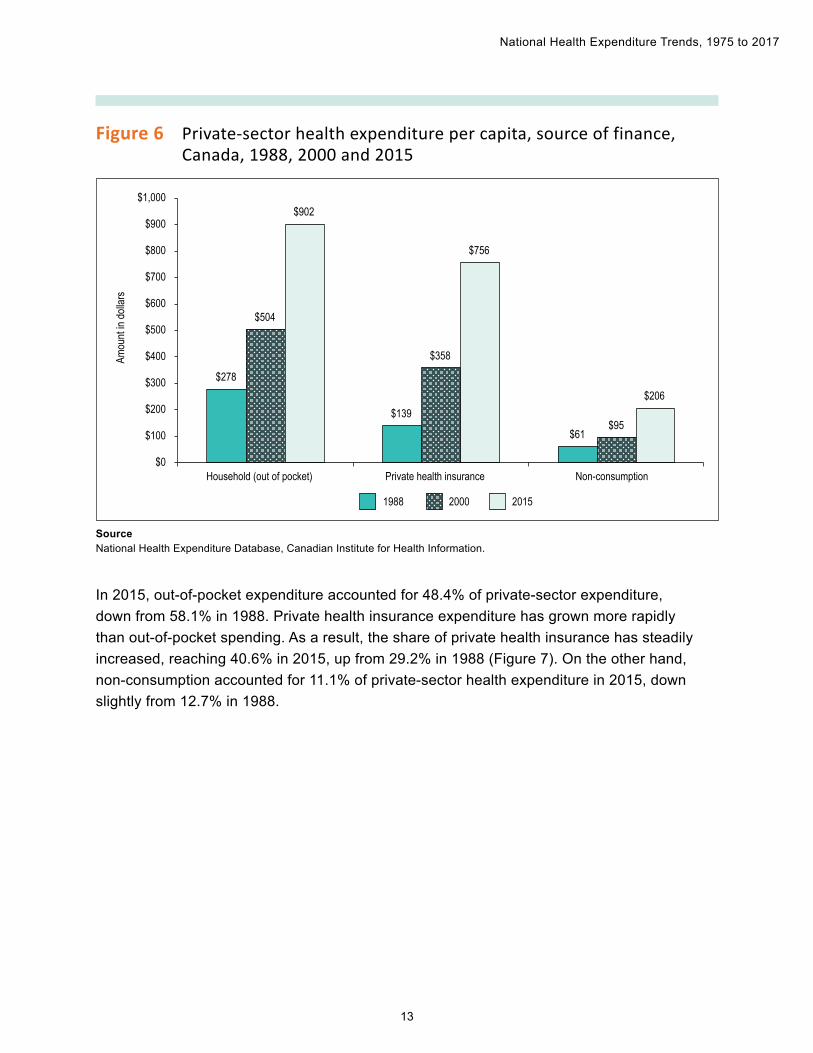
Out-of-pocket health expenditure more than $900 per personOut-of-pocket health expenditure per person increased from $278 in 1988 (the first year for which data at this level of detail is available) to $902 in 2015, representing a 4.5% annual growth rate. Private health insurance expenditure per person increased from $139 to $756 over the same period, a 6.5% annual growth rate (Figure 6).
13
National Health Expenditure Trends, 1975 to 2017
Figure 6 Private-sector health expenditure per capita, source of finance, Canada, 1988, 2000 and 2015
$278
$139
$61
$504
$358
$95
$902
$756
$206
$0
$100
$200
$300
$400
$500
$600
$700
$800
$900
$1,000
Household (out of pocket) Private health insurance Non-consumption
Amou
nt in
dolla
rs
1988 20152000
SourceNational Health Expenditure Database, Canadian Institute for Health Information.
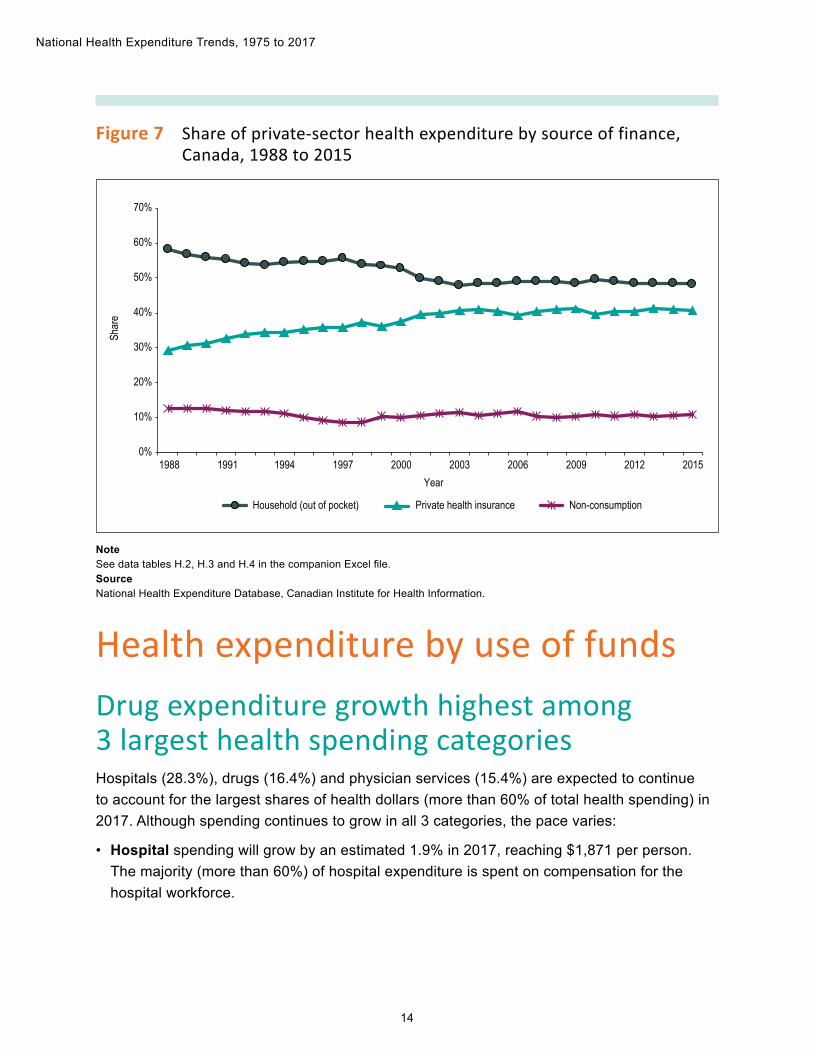
In 2015, out-of-pocket expenditure accounted for 48.4% of private-sector expenditure, down from 58.1% in 1988. Private health insurance expenditure has grown more rapidly than out-of-pocket spending. As a result, the share of private health insurance has steadily increased, reaching 40.6% in 2015, up from 29.2% in 1988 (Figure 7). On the other hand, non-consumption accounted for 11.1% of private-sector health expenditure in 2015, down slightly from 12.7% in 1988.
14
National Health Expenditure Trends, 1975 to 2017
Figure 7 Share of private-sector health expenditure by source of finance, Canada, 1988 to 2015
0%
10%
20%
30%
40%
50%
60%
70%
1988 1991 1994 1997 2000 2003 2006 2009 2012 2015
Shar
e
Year
Household (out of pocket) Private health insurance Non-consumption
NoteSee data tables H.2, H.3 and H.4 in the companion Excel file.SourceNational Health Expenditure Database, Canadian Institute for Health Information.
Health expenditure by use of fundsDrug expenditure growth highest among 3 largest health spending categoriesHospitals (28.3%), drugs (16.4%) and physician services (15.4%) are expected to continue to account for the largest shares of health dollars (more than 60% of total health spending) in 2017. Although spending continues to grow in all 3 categories, the pace varies:
• Hospital spending will grow by an estimated 1.9% in 2017, reaching $1,871 per person. The majority (more than 60%) of hospital expenditure is spent on compensation for the hospital workforce.
15
National Health Expenditure Trends, 1975 to 2017
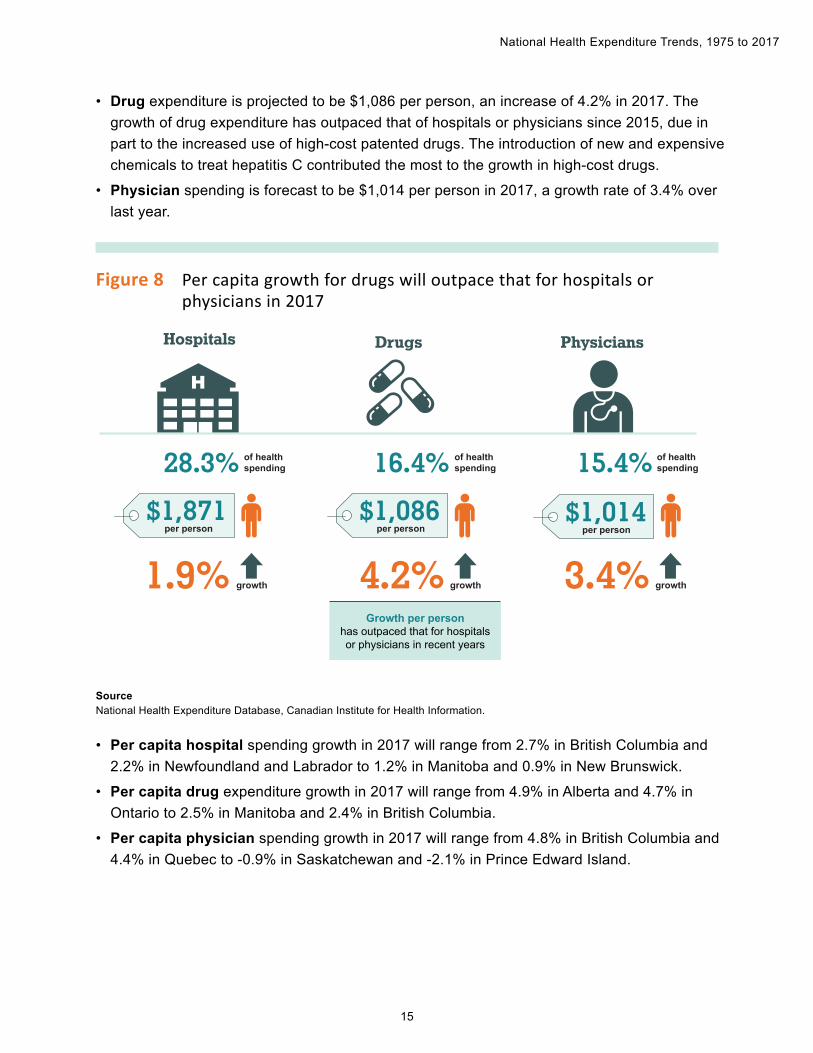
• Drug expenditure is projected to be $1,086 per person, an increase of 4.2% in 2017. The growth of drug expenditure has outpaced that of hospitals or physicians since 2015, due in part to the increased use of high-cost patented drugs. The introduction of new and expensive chemicals to treat hepatitis C contributed the most to the growth in high-cost drugs.
• Physician spending is forecast to be $1,014 per person in 2017, a growth rate of 3.4% over last year.
Figure 8 Per capita growth for drugs will outpace that for hospitals or physicians in 2017
$1,871per person
$1,086per person
1.9% growth4.2% 3.4%
28.3% of health spending
of health spending
of health spending
Drugs
16.4%
Physicians
$1,014per person
15.4%
Hospitals
growthgrowth
Growth per personhas outpaced that for hospitals or physicians in recent years
SourceNational Health Expenditure Database, Canadian Institute for Health Information.
• Per capita hospital spending growth in 2017 will range from 2.7% in British Columbia and 2.2% in Newfoundland and Labrador to 1.2% in Manitoba and 0.9% in New Brunswick.
• Per capita drug expenditure growth in 2017 will range from 4.9% in Alberta and 4.7% in Ontario to 2.5% in Manitoba and 2.4% in British Columbia.
• Per capita physician spending growth in 2017 will range from 4.8% in British Columbia and 4.4% in Quebec to -0.9% in Saskatchewan and -2.1% in Prince Edward Island.
16
National Health Expenditure Trends, 1975 to 2017
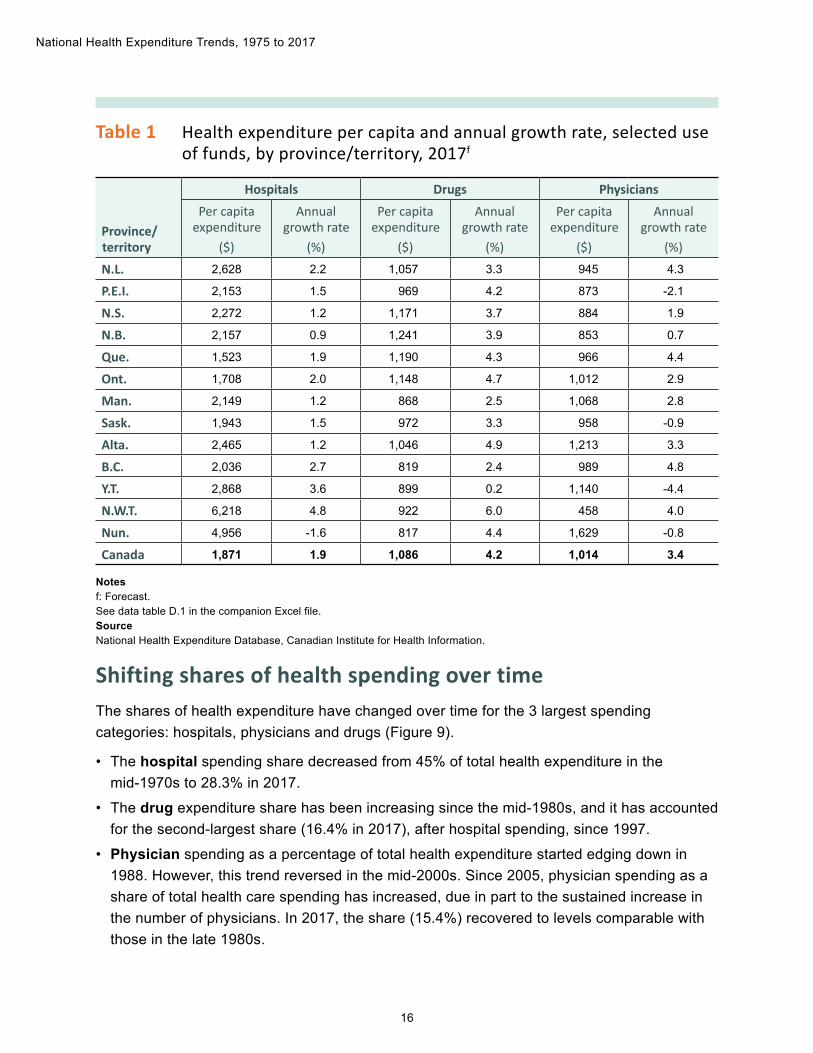
Table 1 Health expenditure per capita and annual growth rate, selected use of funds, by province/territory, 2017f
Province/territory
Hospitals Drugs PhysiciansPer capita
expenditure($)
Annual growth rate
(%)
Per capita expenditure
($)
Annual growth rate
(%)
Per capita expenditure
($)
Annual growth rate
(%)N.L. 2,628 2.2 1,057 3.3 945 4.3
P.E.I. 2,153 1.5 969 4.2 873 -2.1
N.S. 2,272 1.2 1,171 3.7 884 1.9
N.B. 2,157 0.9 1,241 3.9 853 0.7
Que. 1,523 1.9 1,190 4.3 966 4.4
Ont. 1,708 2.0 1,148 4.7 1,012 2.9
Man. 2,149 1.2 868 2.5 1,068 2.8
Sask. 1,943 1.5 972 3.3 958 -0.9
Alta. 2,465 1.2 1,046 4.9 1,213 3.3
B.C. 2,036 2.7 819 2.4 989 4.8
Y.T. 2,868 3.6 899 0.2 1,140 -4.4
N.W.T. 6,218 4.8 922 6.0 458 4.0
Nun. 4,956 -1.6 817 4.4 1,629 -0.8
Canada 1,871 1.9 1,086 4.2 1,014 3.4
Notesf: Forecast.See data table D.1 in the companion Excel file.SourceNational Health Expenditure Database, Canadian Institute for Health Information.
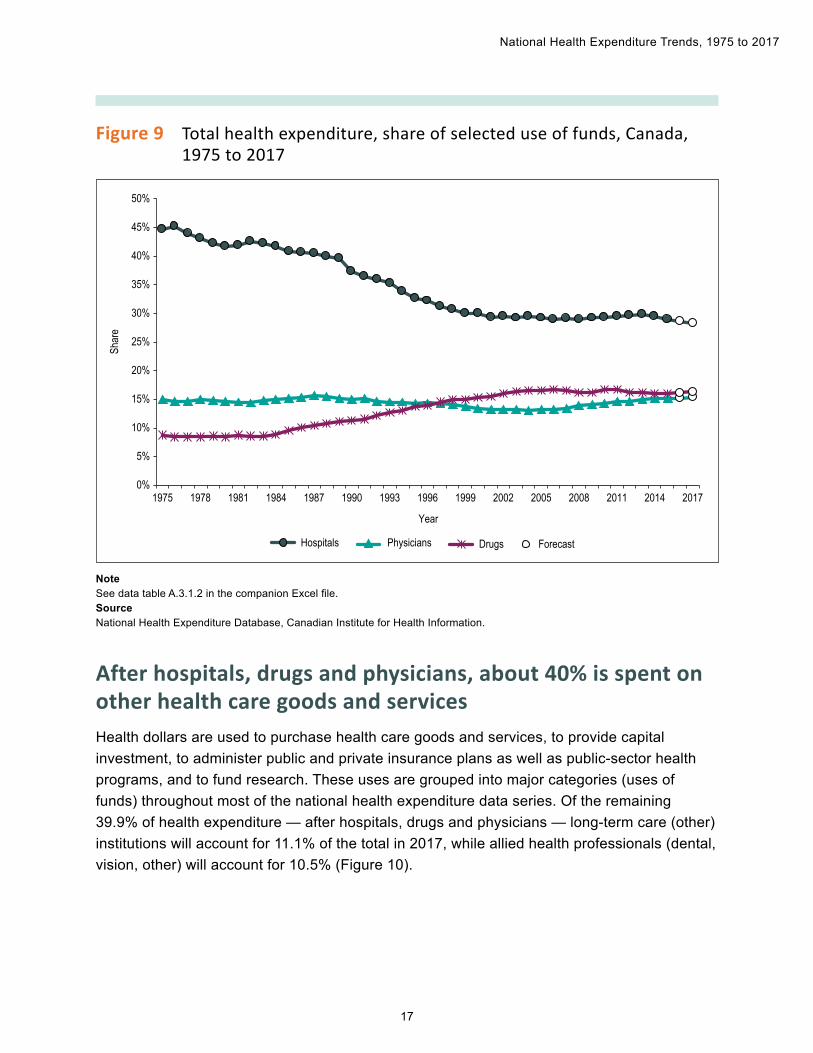
Shifting shares of health spending over timeThe shares of health expenditure have changed over time for the 3 largest spending categories: hospitals, physicians and drugs (Figure 9).
• The hospital spending share decreased from 45% of total health expenditure in the mid-1970s to 28.3% in 2017.
• The drug expenditure share has been increasing since the mid-1980s, and it has accounted for the second-largest share (16.4% in 2017), after hospital spending, since 1997.
• Physician spending as a percentage of total health expenditure started edging down in 1988. However, this trend reversed in the mid-2000s. Since 2005, physician spending as a share of total health care spending has increased, due in part to the sustained increase in the number of physicians. In 2017, the share (15.4%) recovered to levels comparable with those in the late 1980s.
17
National Health Expenditure Trends, 1975 to 2017
Figure 9 Total health expenditure, share of selected use of funds, Canada, 1975 to 2017
0%
5%
10%
15%
20%
25%
30%
35%
40%
45%
50%
1975 1978 1981 1984 1987 1990 1993 1996 1999 2002 2005 2008 2011 2014 2017
Year
Shar
e
Hospitals Physicians Drugs Forecast
NoteSee data table A.3.1.2 in the companion Excel file.SourceNational Health Expenditure Database, Canadian Institute for Health Information.
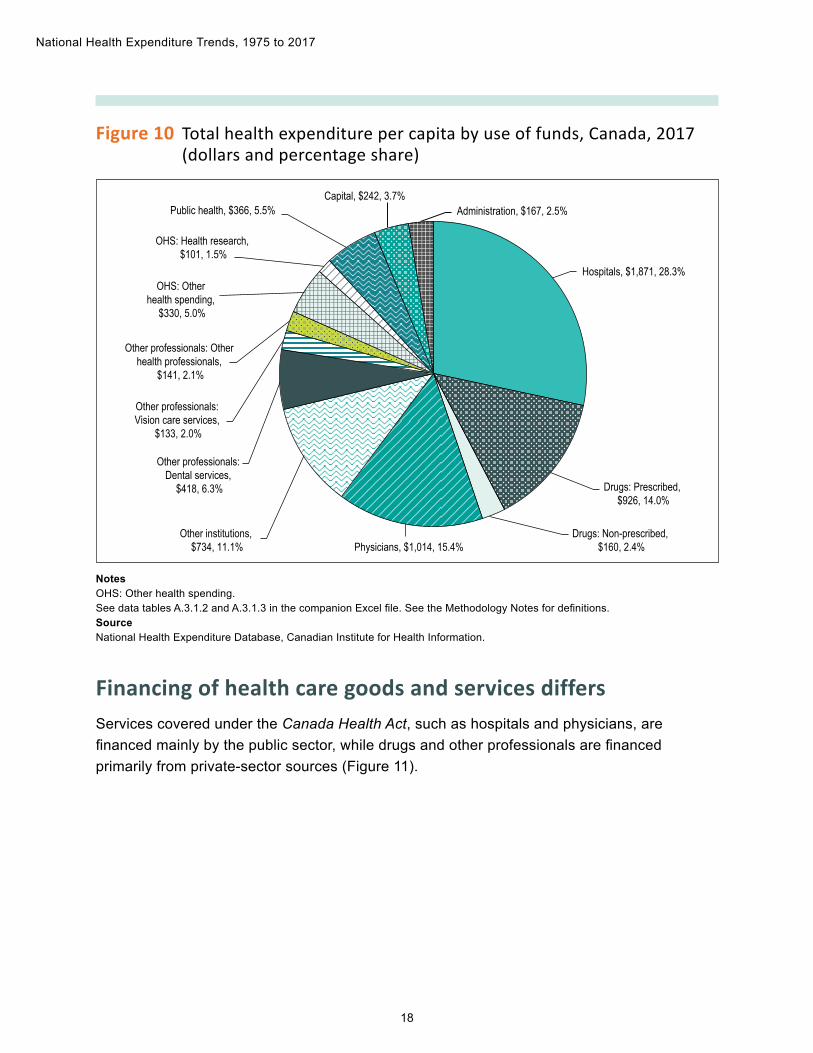
After hospitals, drugs and physicians, about 40% is spent on other health care goods and servicesHealth dollars are used to purchase health care goods and services, to provide capital investment, to administer public and private insurance plans as well as public-sector health programs, and to fund research. These uses are grouped into major categories (uses of funds) throughout most of the national health expenditure data series. Of the remaining 39.9% of health expenditure — after hospitals, drugs and physicians — long-term care (other) institutions will account for 11.1% of the total in 2017, while allied health professionals (dental, vision, other) will account for 10.5% (Figure 10).
18
National Health Expenditure Trends, 1975 to 2017
Figure 10 Total health expenditure per capita by use of funds, Canada, 2017 (dollars and percentage share)
Hospitals, $1,871, 28.3%
Physicians, $1,014, 15.4%
Public health, $366, 5.5%Capital, $242, 3.7%
Administration, $167, 2.5%
Drugs: Prescribed, $926, 14.0%
Drugs: Non-prescribed, $160, 2.4%
Other institutions, $734, 11.1%
Other professionals: Dental services,
$418, 6.3%
Other professionals: Vision care services,
$133, 2.0%
Other professionals: Other health professionals,
$141, 2.1%
OHS: Other health spending,
$330, 5.0%
OHS: Health research, $101, 1.5%
NotesOHS: Other health spending.See data tables A.3.1.2 and A.3.1.3 in the companion Excel file. See the Methodology Notes for definitions.SourceNational Health Expenditure Database, Canadian Institute for Health Information.
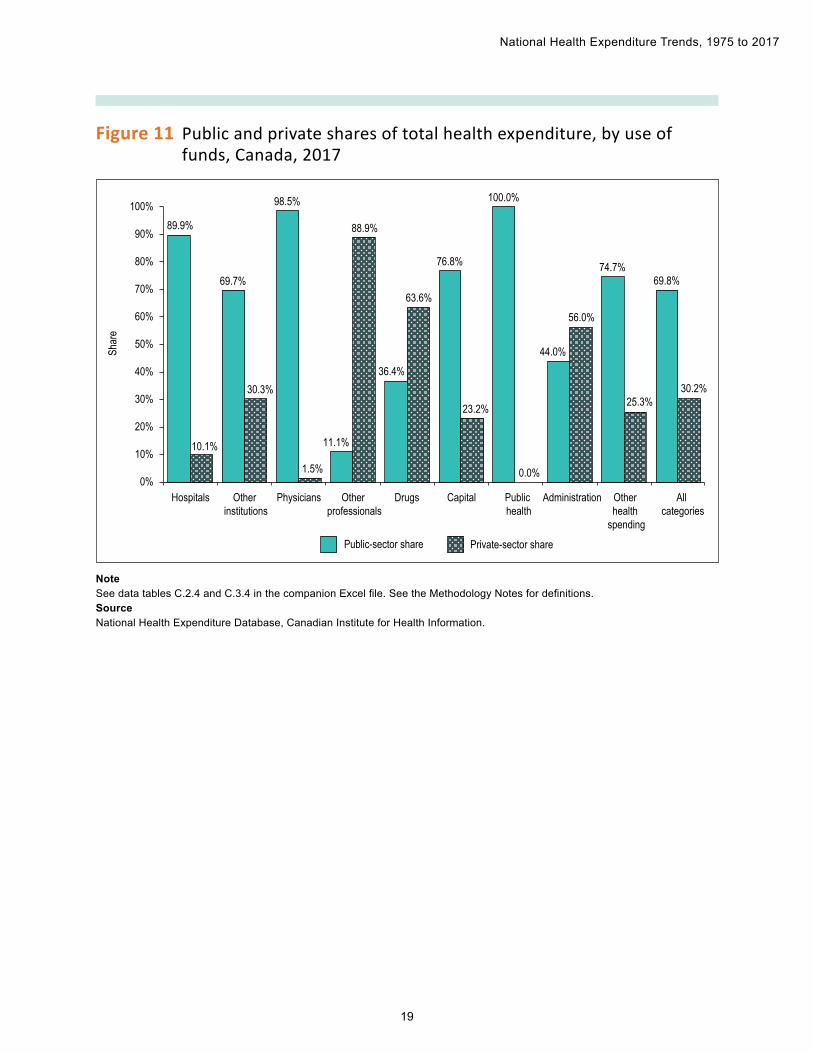
Financing of health care goods and services differsServices covered under the Canada Health Act, such as hospitals and physicians, are financed mainly by the public sector, while drugs and other professionals are financed primarily from private-sector sources (Figure 11).
19
National Health Expenditure Trends, 1975 to 2017
Figure 11 Public and private shares of total health expenditure, by use of funds, Canada, 2017
89.9%
69.7%
98.5%
11.1%
36.4%
76.8%
100.0%
44.0%
74.7%69.8%
10.1%
30.3%
1.5%
88.9%
63.6%
23.2%
0.0%
56.0%
25.3%30.2%
0%
10%
20%
30%
40%
50%
60%
70%
80%
90%
100%
Hospitals Other institutions
Physicians Other professionals
Drugs Capital Public health
Administration Other health
spending
All categories
Shar
e
Public-sector share Private-sector share
NoteSee data tables C.2.4 and C.3.4 in the companion Excel file. See the Methodology Notes for definitions.SourceNational Health Expenditure Database, Canadian Institute for Health Information.
20
National Health Expenditure Trends, 1975 to 2017
Health expenditure in the provinces and territoriesProvincial/territorial health expenditures varyHealth expenditure per capita varies among provinces/territories in part because of different age distributions. iii Population density and geography also affect health expenditure, particularly in the case of the territories. Other factors that affect health expenditure include population health needs, the manner in which health care is delivered (including the balance between institutional and ambulatory care) and differences in the remuneration of health care workers across the country. The manner in which health care is financed is also an important consideration, including the degree of public coverage and private insurance for services not included in the Canada Health Act.
iii. Provincial/territorial comparisons in this discussion are based on figures that are not adjusted for variations in age and sex.
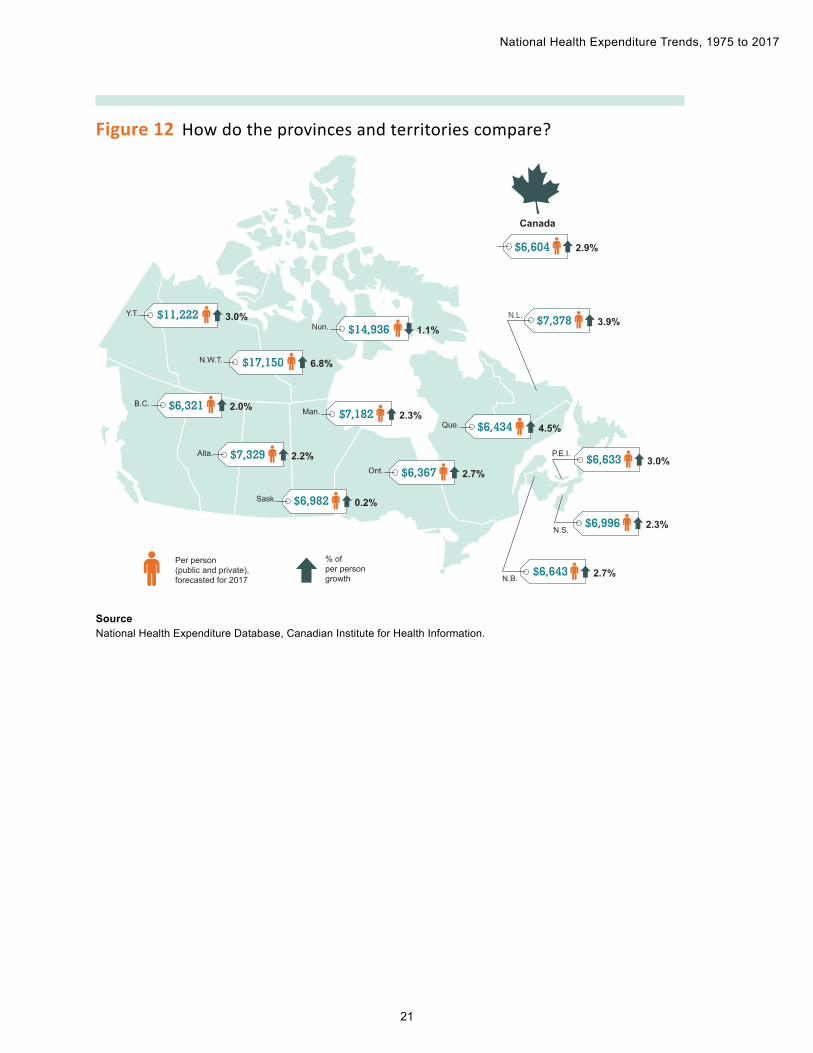
Health expenditure per capita is highest in the territories because of, among other things, their large geographical areas and low populations. In the provinces in 2017, total health expenditure per capita is forecast to range from $7,378 in Newfoundland and Labrador and $7,329 in Alberta to $6,367 in Ontario and $6,321 in British Columbia. iv
iv. The provincial/territorial NHEX chartbook presents trends for each jurisdiction.
21
National Health Expenditure Trends, 1975 to 2017
Figure 12 How do the provinces and territories compare?
N.L.
N.S.
P.E.I.
N.B.
Canada
Per person (public and private), forecasted for 2017
2.9%
3.9%
3.0%
2.3%
2.7%
6.8%N.W.T. $17,150
% of per persongrowth
0.2%Sask. $6,982
B.C. 2.0%$6,321
Y.T. 3.0%$11,222Nun. 1.1%$14,936
$6,604
$7,378
$6,633
$6,996
$6,643
Que. 4.5%$6,434
Ont. 2.7%$6,367
Man. 2.3%$7,182
Alta. 2.2%$7,329
SourceNational Health Expenditure Database, Canadian Institute for Health Information.
22
National Health Expenditure Trends, 1975 to 2017
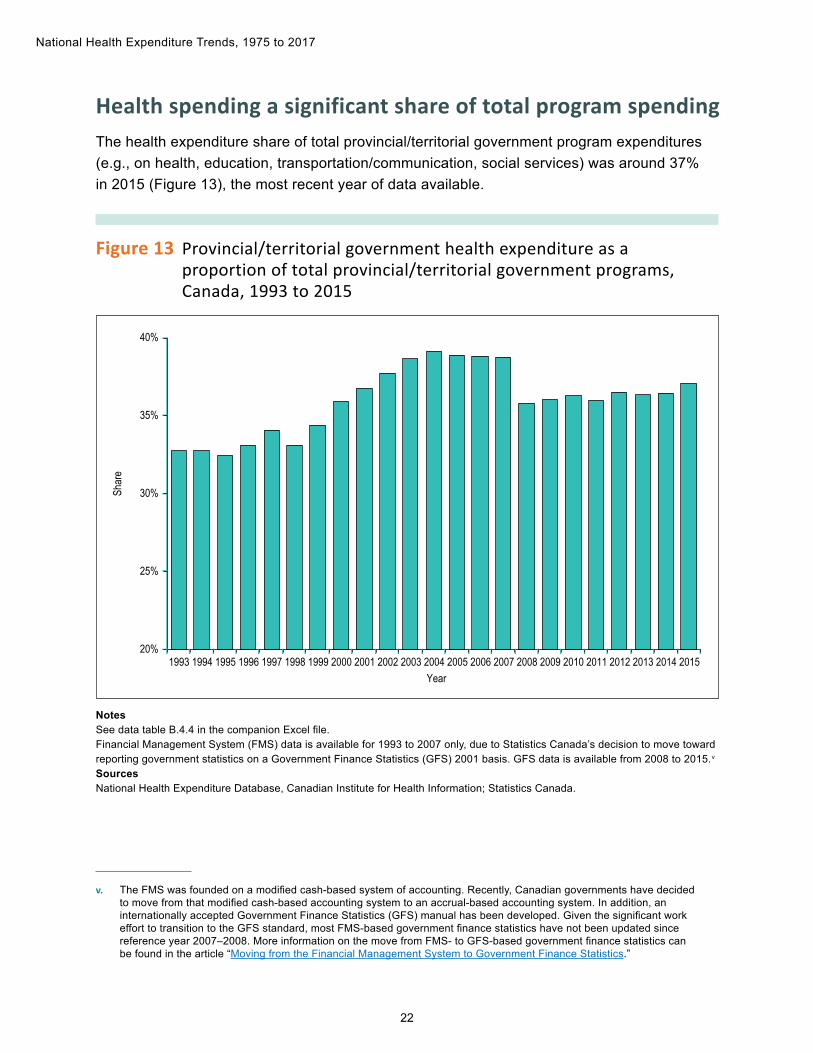
Health spending a significant share of total program spendingThe health expenditure share of total provincial/territorial government program expenditures (e.g., on health, education, transportation/communication, social services) was around 37% in 2015 (Figure 13), the most recent year of data available.
Figure 13 Provincial/territorial government health expenditure as a proportion of total provincial/territorial government programs, Canada, 1993 to 2015
20%
25%
30%
35%
40%
1993 1994 1995 1996 1997 1998 1999 2000 2001 2002 2003 2004 2005 2006 2007 2008 2009 2010 2011 2012 2013 2014 2015
Shar
e
Year
NotesSee data table B.4.4 in the companion Excel file.Financial Management System (FMS) data is available for 1993 to 2007 only, due to Statistics Canada’s decision to move toward reporting government statistics on a Government Finance Statistics (GFS) 2001 basis. GFS data is available from 2008 to 2015. v
SourcesNational Health Expenditure Database, Canadian Institute for Health Information; Statistics Canada.
v. The FMS was founded on a modified cash-based system of accounting. Recently, Canadian governments have decided to move from that modified cash-based accounting system to an accrual-based accounting system. In addition, an internationally accepted Government Finance Statistics (GFS) manual has been developed. Given the significant work effort to transition to the GFS standard, most FMS-based government finance statistics have not been updated since reference year 2007–2008. More information on the move from FMS- to GFS-based government finance statistics can be found in the article “Moving from the Financial Management System to Government Finance Statistics.”
23
National Health Expenditure Trends, 1975 to 2017
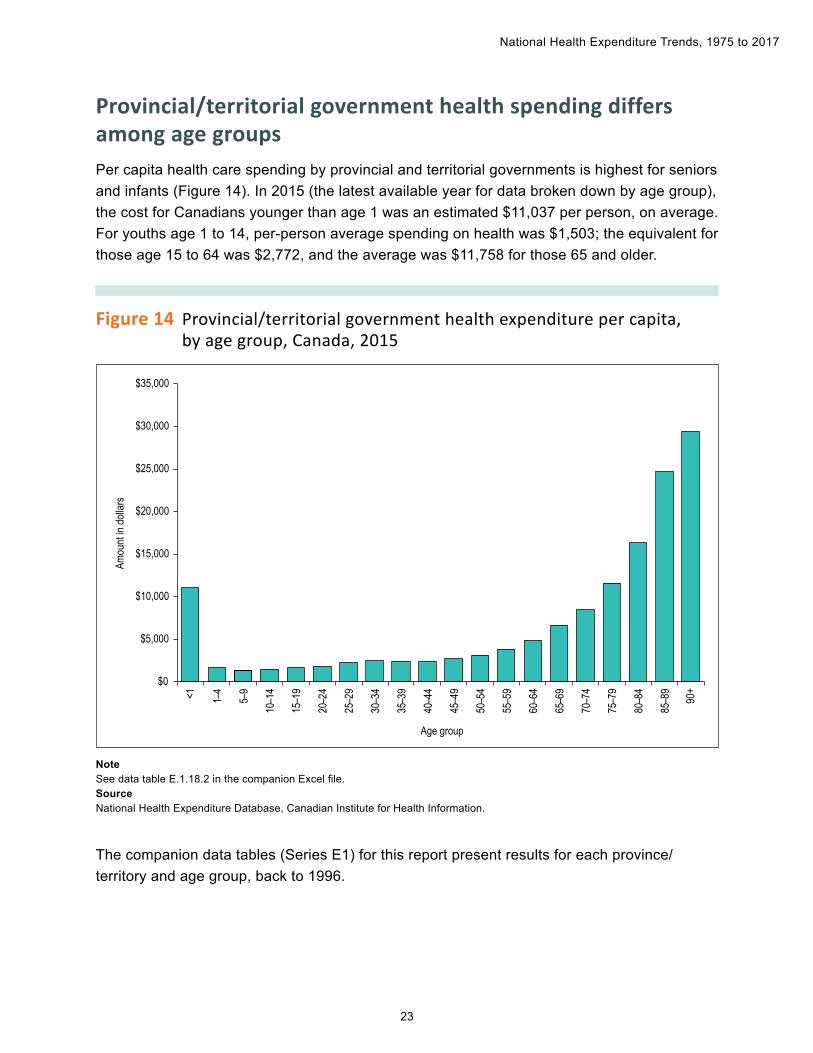
Provincial/territorial government health spending differs among age groupsPer capita health care spending by provincial and territorial governments is highest for seniors and infants (Figure 14). In 2015 (the latest available year for data broken down by age group), the cost for Canadians younger than age 1 was an estimated $11,037 per person, on average. For youths age 1 to 14, per-person average spending on health was $1,503; the equivalent for those age 15 to 64 was $2,772, and the average was $11,758 for those 65 and older.
Figure 14 Provincial/territorial government health expenditure per capita, by age group, Canada, 2015
$0
$5,000
$10,000
$15,000
$20,000
$25,000
$30,000
$35,000
<1 1–4
5–9
10–1
4
15–1
9
20–2
4
25–2
9
30–3
4
35–3
9
40–4
4
45–4
9
50–5
4
55–5
9
60–6
4
65–6
9
70–7
4
75–7
9
80–8
4
85–8
9
90+
Amou
nt in
dolla
rs
Age group
NoteSee data table E.1.18.2 in the companion Excel file.Source National Health Expenditure Database, Canadian Institute for Health Information.
The companion data tables (Series E1) for this report present results for each province/territory and age group, back to 1996.
24
National Health Expenditure Trends, 1975 to 2017
AnalysisMore economic growth, more health care spendingThere has been a positive relationship between economic growth and health care spending growth in Canada since the mid-1970s. In general, with more economic growth and thus income, more has been spent on health care. The exception is the fiscal restraint period from 1993 to 1996, when governments attempted to reduce or eliminate budget deficits.
When viewing Canada’s health care spending trends in the larger global context, Canada’s experience parallels that of other countries in the OECD. The most obvious similarity is the positive correlation between growth in health care spending and growth in the economy between 2000 and 2010.1
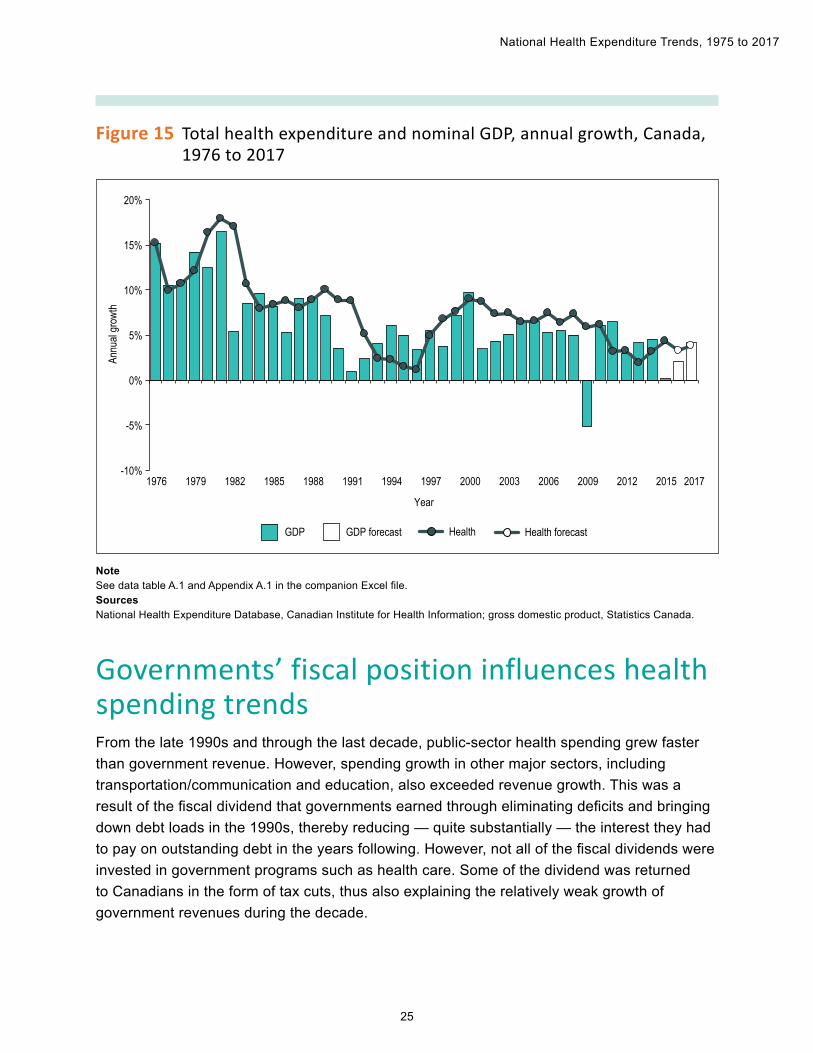
Current trends show modest health care spending in line with economic growth (Figure 15).
25
National Health Expenditure Trends, 1975 to 2017
Figure 15 Total health expenditure and nominal GDP, annual growth, Canada, 1976 to 2017
-10%
-5%
0%
5%
10%
15%
20%
1976 1979 1982 1985 1988 1991 1994 1997 2000 2003 2006 2009 2012 2015 2017
Annu
al gr
owth
Year
GDP GDP forecast Health Health forecast
NoteSee data table A.1 and Appendix A.1 in the companion Excel file.SourcesNational Health Expenditure Database, Canadian Institute for Health Information; gross domestic product, Statistics Canada.
Governments’ fiscal position influences health spending trendsFrom the late 1990s and through the last decade, public-sector health spending grew faster than government revenue. However, spending growth in other major sectors, including transportation/communication and education, also exceeded revenue growth. This was a result of the fiscal dividend that governments earned through eliminating deficits and bringing down debt loads in the 1990s, thereby reducing — quite substantially — the interest they had to pay on outstanding debt in the years following. However, not all of the fiscal dividends were invested in government programs such as health care. Some of the dividend was returned to Canadians in the form of tax cuts, thus also explaining the relatively weak growth of government revenues during the decade.
26
National Health Expenditure Trends, 1975 to 2017
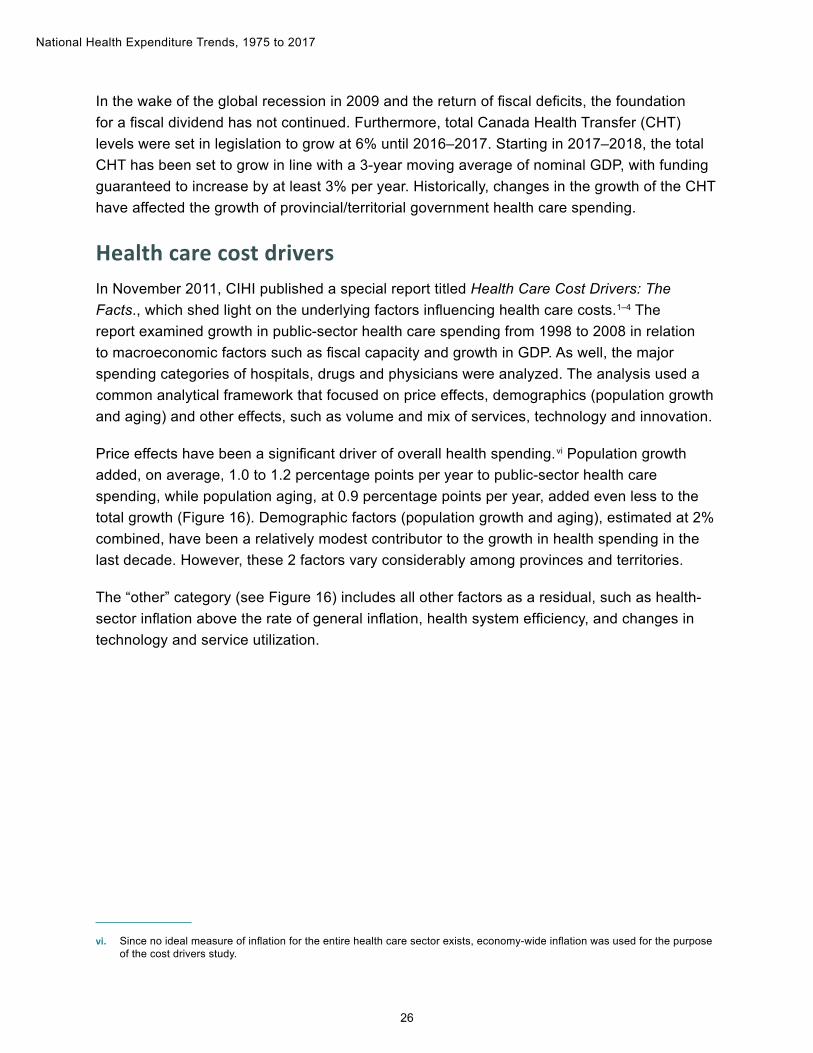
In the wake of the global recession in 2009 and the return of fiscal deficits, the foundation for a fiscal dividend has not continued. Furthermore, total Canada Health Transfer (CHT) levels were set in legislation to grow at 6% until 2016–2017. Starting in 2017–2018, the total CHT has been set to grow in line with a 3-year moving average of nominal GDP, with funding guaranteed to increase by at least 3% per year. Historically, changes in the growth of the CHT have affected the growth of provincial/territorial government health care spending.
Health care cost driversIn November 2011, CIHI published a special report titled Health Care Cost Drivers: The Facts., which shed light on the underlying factors influencing health care costs.1–4 The report examined growth in public-sector health care spending from 1998 to 2008 in relation to macroeconomic factors such as fiscal capacity and growth in GDP. As well, the major spending categories of hospitals, drugs and physicians were analyzed. The analysis used a common analytical framework that focused on price effects, demographics (population growth and aging) and other effects, such as volume and mix of services, technology and innovation.
Price effects have been a significant driver of overall health spending. vi Population growth added, on average, 1.0 to 1.2 percentage points per year to public-sector health care spending, while population aging, at 0.9 percentage points per year, added even less to the total growth (Figure 16). Demographic factors (population growth and aging), estimated at 2% combined, have been a relatively modest contributor to the growth in health spending in the last decade. However, these 2 factors vary considerably among provinces and territories.
vi. Since no ideal measure of inflation for the entire health care sector exists, economy-wide inflation was used for the purpose of the cost drivers study.
The “other” category (see Figure 16) includes all other factors as a residual, such as health-sector inflation above the rate of general inflation, health system efficiency, and changes in technology and service utilization.
27
National Health Expenditure Trends, 1975 to 2017
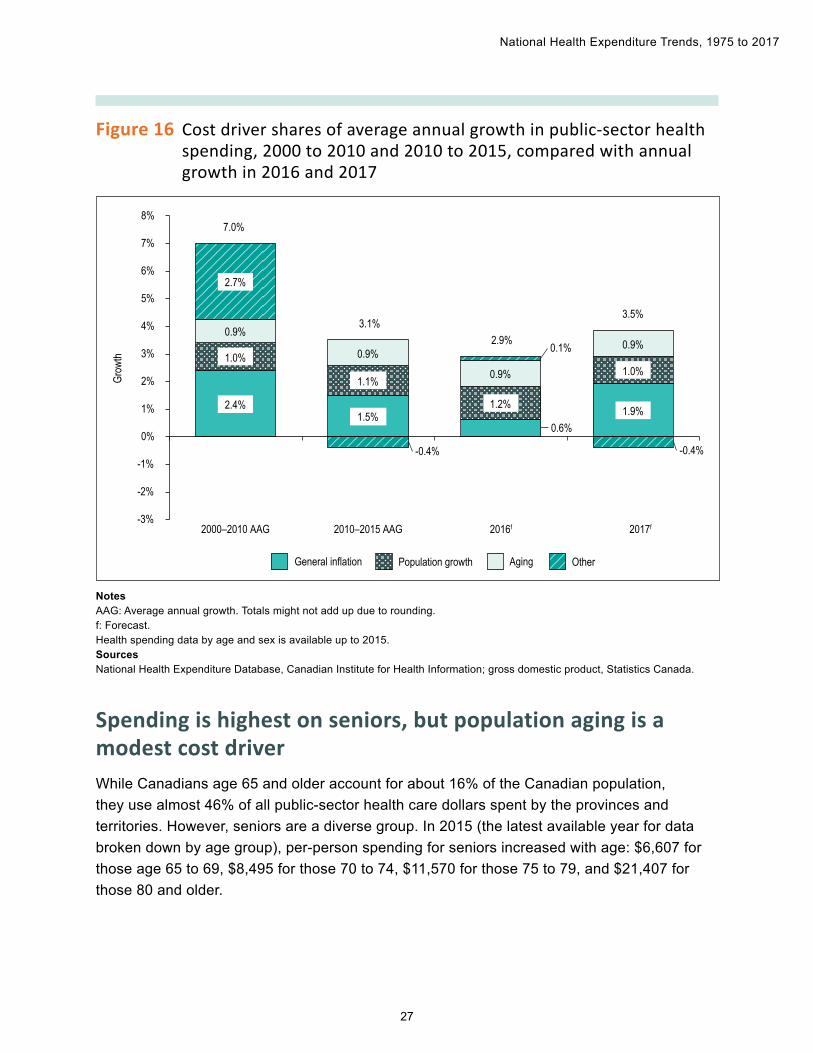
Figure 16 Cost driver shares of average annual growth in public-sector health spending, 2000 to 2010 and 2010 to 2015, compared with annual growth in 2016 and 2017
2.4%1.5%
0.6%1.9%
1.0%
1.1%
1.2%
1.0%
0.9%
0.9%
0.9%
0.9%
2.7%
-0.4%
0.1%
-3%
-2%
-1%
0%
1%
2%
3%
4%
5%
6%
7%
8%7.0%
3.1%3.5%
2.9%
-0.4%
General inflation AgingPopulation growth Other
2016f 2017f2000–2010 AAG 2010–2015 AAG
Grow
th
NotesAAG: Average annual growth. Totals might not add up due to rounding.f: Forecast.Health spending data by age and sex is available up to 2015. SourcesNational Health Expenditure Database, Canadian Institute for Health Information; gross domestic product, Statistics Canada.
Spending is highest on seniors, but population aging is a modest cost driverWhile Canadians age 65 and older account for about 16% of the Canadian population, they use almost 46% of all public-sector health care dollars spent by the provinces and territories. However, seniors are a diverse group. In 2015 (the latest available year for data broken down by age group), per-person spending for seniors increased with age: $6,607 for those age 65 to 69, $8,495 for those 70 to 74, $11,570 for those 75 to 79, and $21,407 for those 80 and older.
28
National Health Expenditure Trends, 1975 to 2017
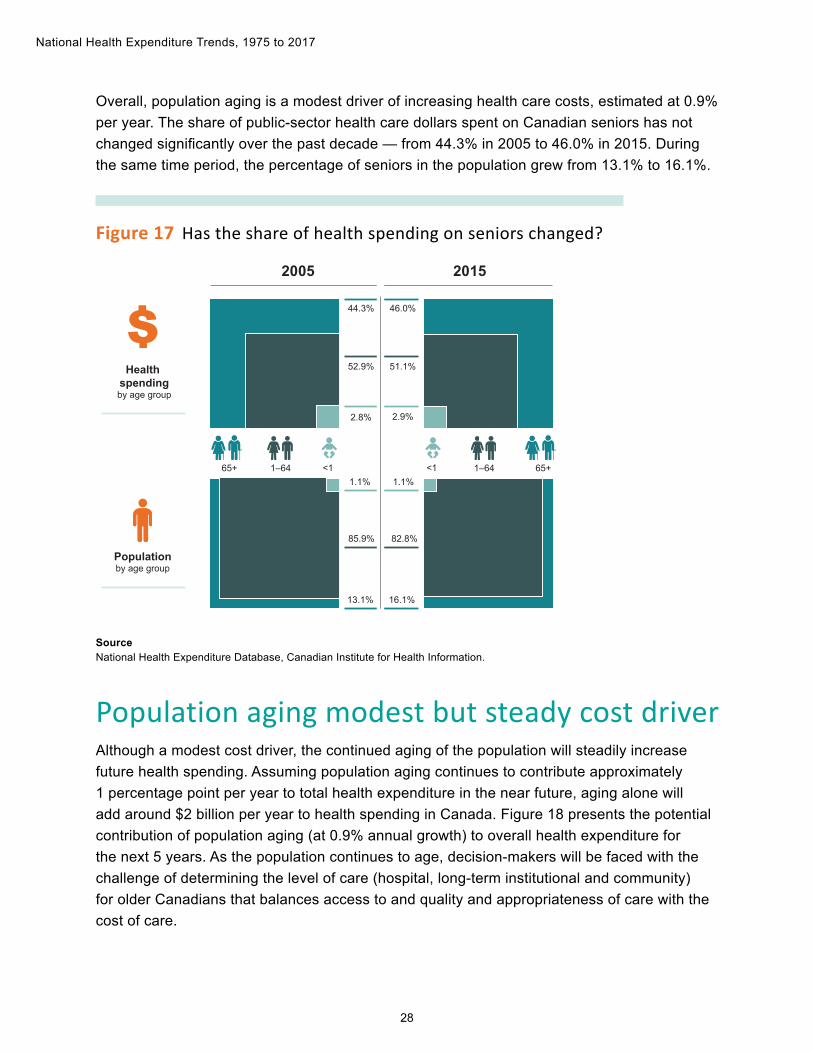
Overall, population aging is a modest driver of increasing health care costs, estimated at 0.9% per year. The share of public-sector health care dollars spent on Canadian seniors has not changed significantly over the past decade — from 44.3% in 2005 to 46.0% in 2015. During the same time period, the percentage of seniors in the population grew from 13.1% to 16.1%.
Figure 17 Has the share of health spending on seniors changed?
1–641–64
Populationby age group
65+65+
Health spendingby age group
1.1%
85.9%
13.1%
2.8% 2.9%
52.9%
44.3%
1.1%
82.8%
16.1%
51.1%
46.0%
<1<1
20152005
SourceNational Health Expenditure Database, Canadian Institute for Health Information.
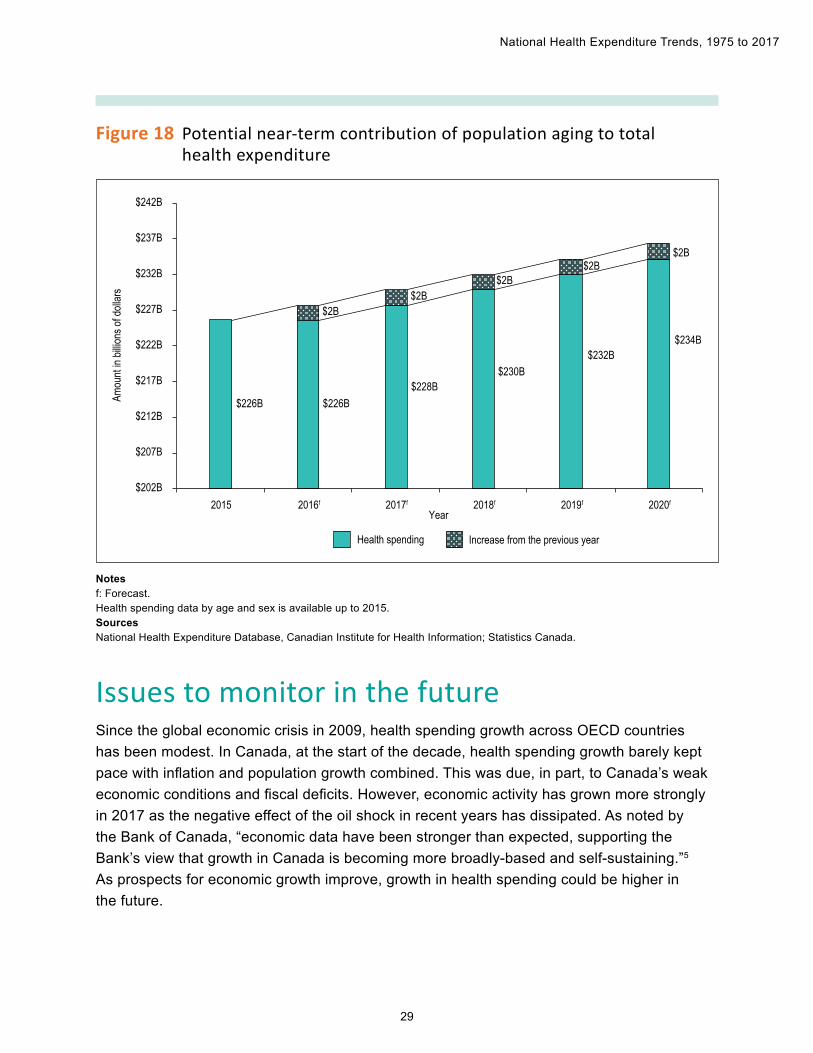
Population aging modest but steady cost driverAlthough a modest cost driver, the continued aging of the population will steadily increase future health spending. Assuming population aging continues to contribute approximately 1 percentage point per year to total health expenditure in the near future, aging alone will add around $2 billion per year to health spending in Canada. Figure 18 presents the potential contribution of population aging (at 0.9% annual growth) to overall health expenditure for the next 5 years. As the population continues to age, decision-makers will be faced with the challenge of determining the level of care (hospital, long-term institutional and community) for older Canadians that balances access to and quality and appropriateness of care with the cost of care.
29
National Health Expenditure Trends, 1975 to 2017
Figure 18 Potential near-term contribution of population aging to total health expenditure
$202B
$207B
$212B
$217B
$222B
$227B
$232B
$237B
$242B
2015 2016f 2017f 2018f 2019f 2020f
Amou
nt in
billio
ns of
dolla
rs
Year
$226B $226B$228B
$230B$232B
$234B
$2B$2B
$2B$2B
$2B
Health spending Increase from the previous year
Notesf: Forecast.Health spending data by age and sex is available up to 2015.SourcesNational Health Expenditure Database, Canadian Institute for Health Information; Statistics Canada.
Issues to monitor in the futureSince the global economic crisis in 2009, health spending growth across OECD countries has been modest. In Canada, at the start of the decade, health spending growth barely kept pace with inflation and population growth combined. This was due, in part, to Canada’s weak economic conditions and fiscal deficits. However, economic activity has grown more strongly in 2017 as the negative effect of the oil shock in recent years has dissipated. As noted by the Bank of Canada, “economic data have been stronger than expected, supporting the Bank’s view that growth in Canada is becoming more broadly-based and self-sustaining.”5 As prospects for economic growth improve, growth in health spending could be higher in the future.
30
National Health Expenditure Trends, 1975 to 2017
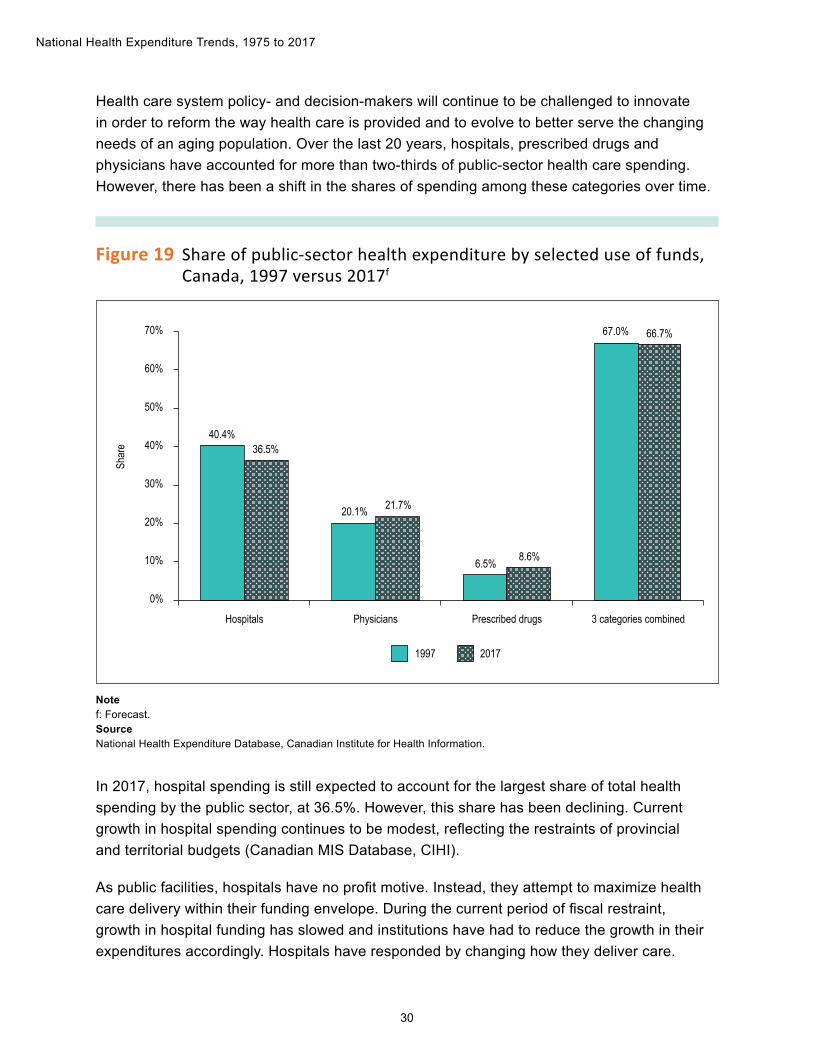
Health care system policy- and decision-makers will continue to be challenged to innovate in order to reform the way health care is provided and to evolve to better serve the changing needs of an aging population. Over the last 20 years, hospitals, prescribed drugs and physicians have accounted for more than two-thirds of public-sector health care spending. However, there has been a shift in the shares of spending among these categories over time.
Figure 19 Share of public-sector health expenditure by selected use of funds, Canada, 1997 versus 2017f
Notef: Forecast.SourceNational Health Expenditure Database, Canadian Institute for Health Information.
40.4%
20.1%
6.5%
67.0%
36.5%
21.7%
8.6%
66.7%
0%
10%
20%
30%
40%
50%
60%
70%
Hospitals Physicians Prescribed drugs 3 categories combined
Shar
e
1997 2017
In 2017, hospital spending is still expected to account for the largest share of total health spending by the public sector, at 36.5%. However, this share has been declining. Current growth in hospital spending continues to be modest, reflecting the restraints of provincial and territorial budgets (Canadian MIS Database, CIHI).
As public facilities, hospitals have no profit motive. Instead, they attempt to maximize health care delivery within their funding envelope. During the current period of fiscal restraint, growth in hospital funding has slowed and institutions have had to reduce the growth in their expenditures accordingly. Hospitals have responded by changing how they deliver care.
31
National Health Expenditure Trends, 1975 to 2017
Less-complex cases that were once treated as inpatients are increasingly treated on an outpatient basis, leading to an increase in the complexity of both inpatients and outpatients. Over time, this has led to a large overall rise in ambulatory and community visits, while inpatient activity has seen only modest growth.
As reported by the OECD, the number of hospital beds per 1,000 population in Canada decreased from 3.0 in 2006 to 2.6 in 2016 for publicly owned hospitals in Canada.6 As noted by the OECD, “the number of hospital beds per capita has decreased over the past decade in most OECD countries. This reduction is part of a voluntary effort in most countries, partly driven by progress in medical technology, which has enabled a move to day surgery for a number of procedures and a reduced need for hospitalisation.”7
Physician spending as a share of total health expenditure began increasing in 2005, due in part to more rapid growth in the supply of physicians and the rise in physician fees. Higher demand for physician services from an aging population may be contributing to these increases.
For the 10th year in a row, as described in CIHI’s report Physicians in Canada, 2016, the number of physicians increased at a faster rate than the number of people in the population, resulting in more physicians per person than ever before — 230 doctors per 100,000 population.8 Based on the number of MD degrees awarded by Canadian universities, the number of physicians is likely to continue to grow.9 The proportion of recent physician graduates (10 years or less since graduation) rose from 16.2% in 2012 to 20.0% in 2016.
The current trend of shifting services from hospital to the community increases the demand for physician services. As a result, more physician services and an increase in utilization will continue to contribute to a rise in physician expenditure in the future.
Drug spending in Canada represents a significant component of overall health care costs. Growth in drug spending began to moderate in 2010 due, in large part, to the expiration of patents on many widely used blockbuster medications like statins (commonly used to lower cholesterol). In addition, public drug programs implemented policies that limited the prices they were willing to pay for generic drugs. However, a key finding in CIHI’s report Prescribed Drug Spending in Canada, 2016 is that although the savings achieved by patent expirations and generic pricing policies persist, they are no longer leading to significant reductions in year-over-year growth.
32
National Health Expenditure Trends, 1975 to 2017
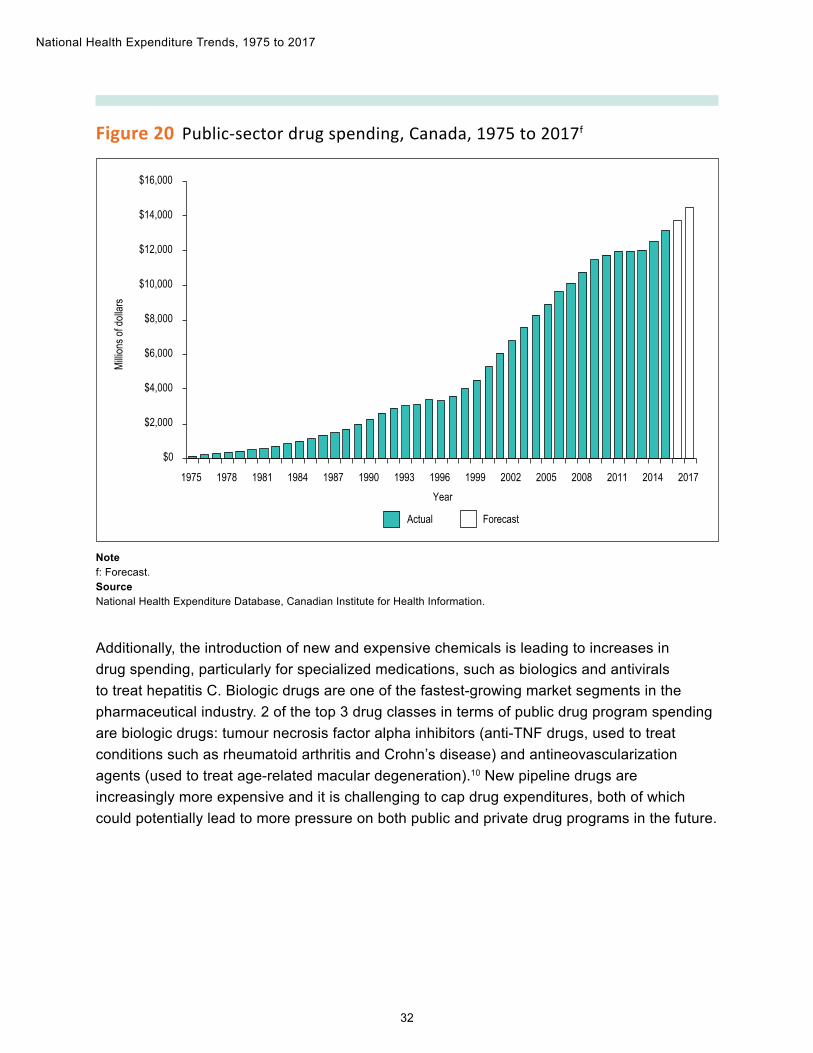
Figure 20 Public-sector drug spending, Canada, 1975 to 2017f
Notef: Forecast.SourceNational Health Expenditure Database, Canadian Institute for Health Information.
$0
$2,000
$4,000
$6,000
$8,000
$10,000
$12,000
$14,000
$16,000
1975 1978 1981 1984 1987 1990 1993 1996 1999 2002 2005 2008 2011 2014 2017Year
Millio
ns of
dolla
rs
Actual Forecast
Additionally, the introduction of new and expensive chemicals is leading to increases in drug spending, particularly for specialized medications, such as biologics and antivirals to treat hepatitis C. Biologic drugs are one of the fastest-growing market segments in the pharmaceutical industry. 2 of the top 3 drug classes in terms of public drug program spending are biologic drugs: tumour necrosis factor alpha inhibitors (anti-TNF drugs, used to treat conditions such as rheumatoid arthritis and Crohn’s disease) and antineovascularization agents (used to treat age-related macular degeneration).10 New pipeline drugs are increasingly more expensive and it is challenging to cap drug expenditures, both of which could potentially lead to more pressure on both public and private drug programs in the future.
33
National Health Expenditure Trends, 1975 to 2017
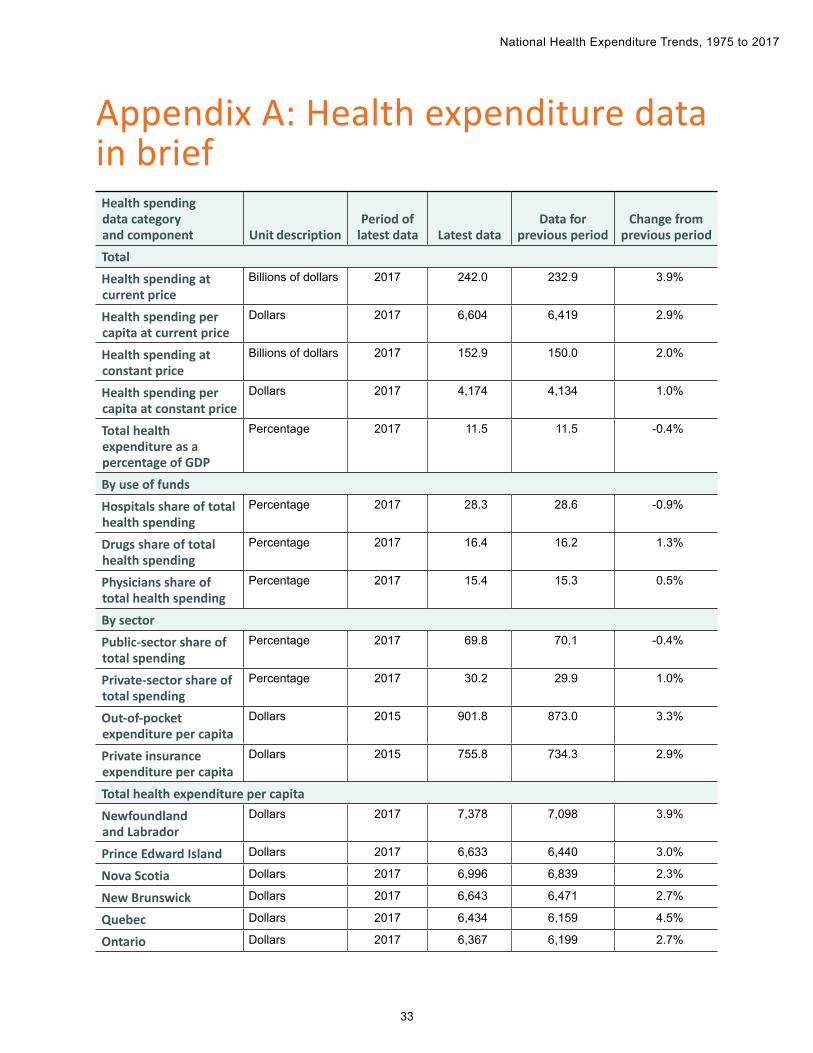
Appendix A: Health expenditure data in briefHealth spending data category and component Unit description
Period of latest data Latest data
Data for previous period
Change from previous period
TotalHealth spending at current price
Billions of dollars 2017 242.0 232.9 3.9%
Health spending per capita at current price
Dollars 2017 6,604 6,419 2.9%
Health spending at constant price
Billions of dollars 2017 152.9 150.0 2.0%
Health spending per capita at constant price
Dollars 2017 4,174 4,134 1.0%
Total health expenditure as a percentage of GDP
Percentage 2017 11.5 11.5 -0.4%
By use of fundsHospitals share of total health spending
Percentage 2017 28.3 28.6 -0.9%
Drugs share of total health spending
Percentage 2017 16.4 16.2 1.3%
Physicians share of total health spending
Percentage 2017 15.4 15.3 0.5%
By sectorPublic-sector share of total spending
Percentage 2017 69.8 70.1 -0.4%
Private-sector share of total spending
Percentage 2017 30.2 29.9 1.0%
Out-of-pocket expenditure per capita
Dollars 2015 901.8 873.0 3.3%
Private insurance expenditure per capita
Dollars 2015 755.8 734.3 2.9%
Total health expenditure per capitaNewfoundland and Labrador
Dollars 2017 7,378 7,098 3.9%
Prince Edward Island Dollars 2017 6,633 6,440 3.0%
Nova Scotia Dollars 2017 6,996 6,839 2.3%
New Brunswick Dollars 2017 6,643 6,471 2.7%
Quebec Dollars 2017 6,434 6,159 4.5%
Ontario Dollars 2017 6,367 6,199 2.7%
34
National Health Expenditure Trends, 1975 to 2017
Health spending data category and component Unit description
Period of latest data Latest data
Data for previous period
Change from previous period
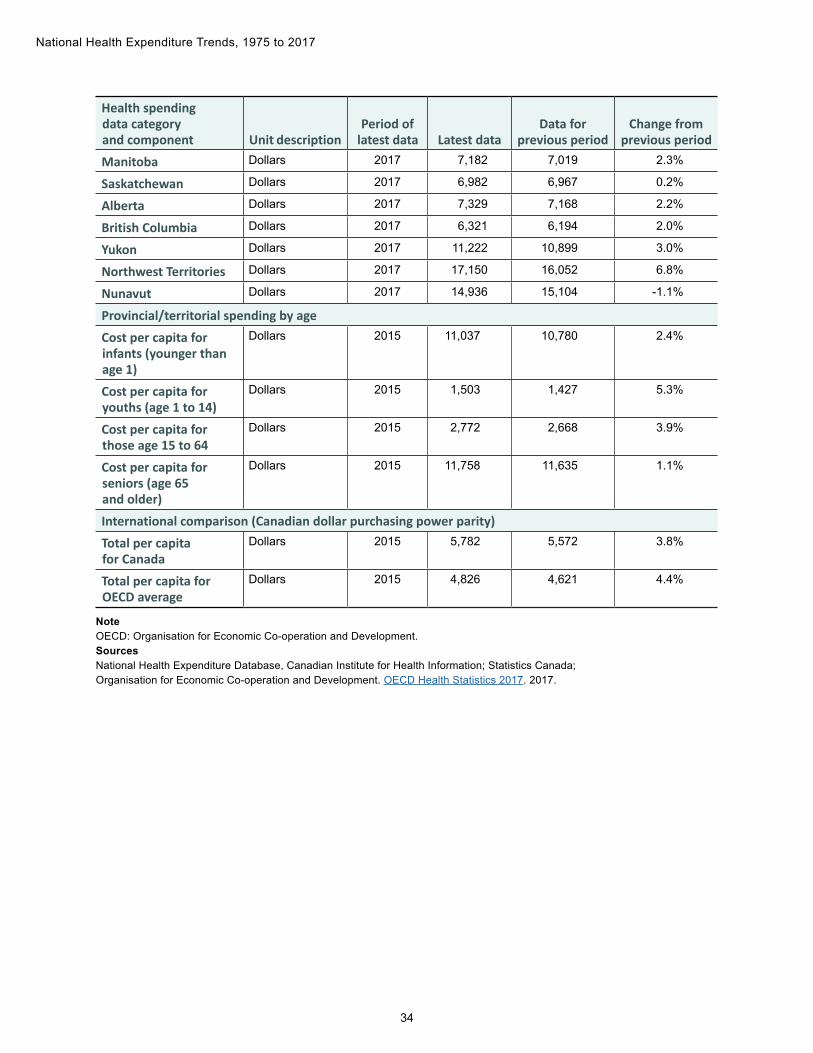
Manitoba Dollars 2017 7,182 7,019 2.3%
Saskatchewan Dollars 2017 6,982 6,967 0.2%
Alberta Dollars 2017 7,329 7,168 2.2%
British Columbia Dollars 2017 6,321 6,194 2.0%
Yukon Dollars 2017 11,222 10,899 3.0%
Northwest Territories Dollars 2017 17,150 16,052 6.8%
Nunavut Dollars 2017 14,936 15,104 -1.1%
Provincial/territorial spending by ageCost per capita for infants (younger than age 1)
Dollars 2015 11,037 10,780 2.4%
Cost per capita for youths (age 1 to 14)
Dollars 2015 1,503 1,427 5.3%
Cost per capita for those age 15 to 64
Dollars 2015 2,772 2,668 3.9%
Cost per capita for seniors (age 65 and older)
Dollars 2015 11,758 11,635 1.1%
International comparison (Canadian dollar purchasing power parity)Total per capita for Canada
Dollars 2015 5,782 5,572 3.8%
Total per capita for OECD average
Dollars 2015 4,826 4,621 4.4%
NoteOECD: Organisation for Economic Co-operation and Development.SourcesNational Health Expenditure Database, Canadian Institute for Health Information; Statistics Canada; Organisation for Economic Co-operation and Development. OECD Health Statistics 2017. 2017.
35
National Health Expenditure Trends, 1975 to 2017
Appendix B: Text alternative for figuresText alternative for Figure 1: How much will we spend on health in 2017?
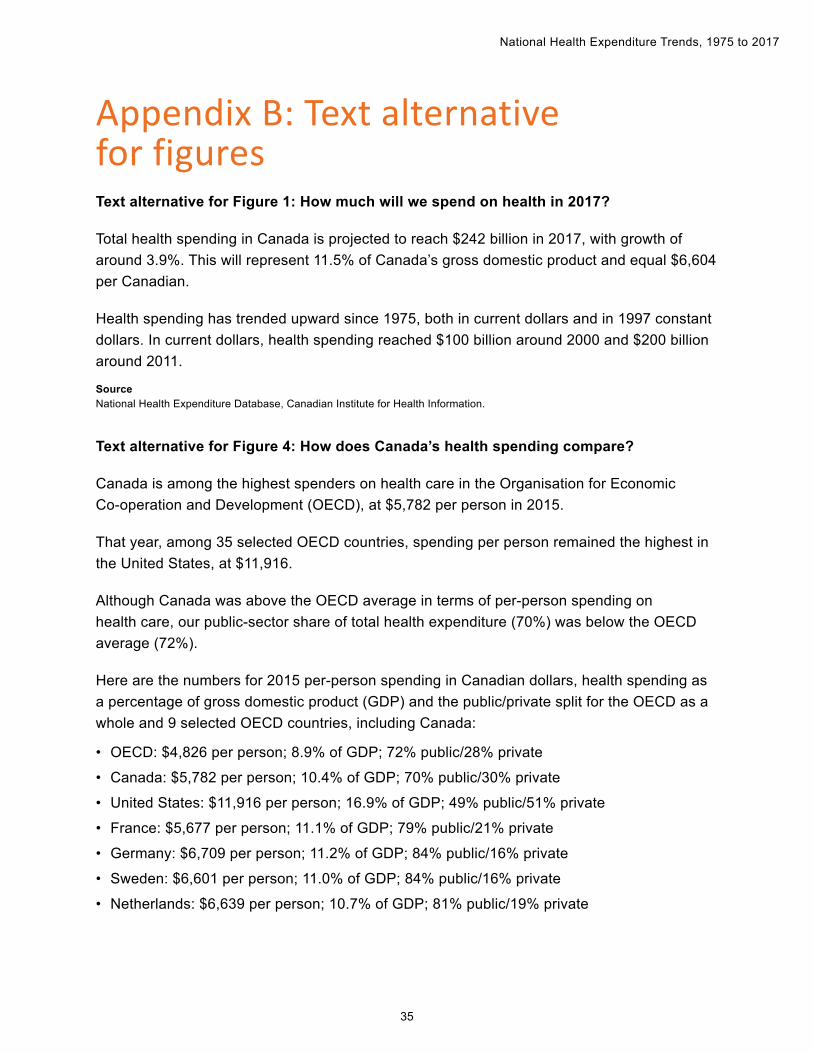
Total health spending in Canada is projected to reach $242 billion in 2017, with growth of around 3.9%. This will represent 11.5% of Canada’s gross domestic product and equal $6,604 per Canadian.
Health spending has trended upward since 1975, both in current dollars and in 1997 constant dollars. In current dollars, health spending reached $100 billion around 2000 and $200 billion around 2011.
SourceNational Health Expenditure Database, Canadian Institute for Health Information.
Text alternative for Figure 4: How does Canada’s health spending compare?
Canada is among the highest spenders on health care in the Organisation for Economic Co-operation and Development (OECD), at $5,782 per person in 2015.
That year, among 35 selected OECD countries, spending per person remained the highest in the United States, at $11,916.
Although Canada was above the OECD average in terms of per-person spending on health care, our public-sector share of total health expenditure (70%) was below the OECD average (72%).
Here are the numbers for 2015 per-person spending in Canadian dollars, health spending as a percentage of gross domestic product (GDP) and the public/private split for the OECD as a whole and 9 selected OECD countries, including Canada:
• OECD: $4,826 per person; 8.9% of GDP; 72% public/28% private
• Canada: $5,782 per person; 10.4% of GDP; 70% public/30% private
• United States: $11,916 per person; 16.9% of GDP; 49% public/51% private
• France: $5,677 per person; 11.1% of GDP; 79% public/21% private
• Germany: $6,709 per person; 11.2% of GDP; 84% public/16% private
• Sweden: $6,601 per person; 11.0% of GDP; 84% public/16% private
• Netherlands: $6,639 per person; 10.7% of GDP; 81% public/19% private
36
National Health Expenditure Trends, 1975 to 2017
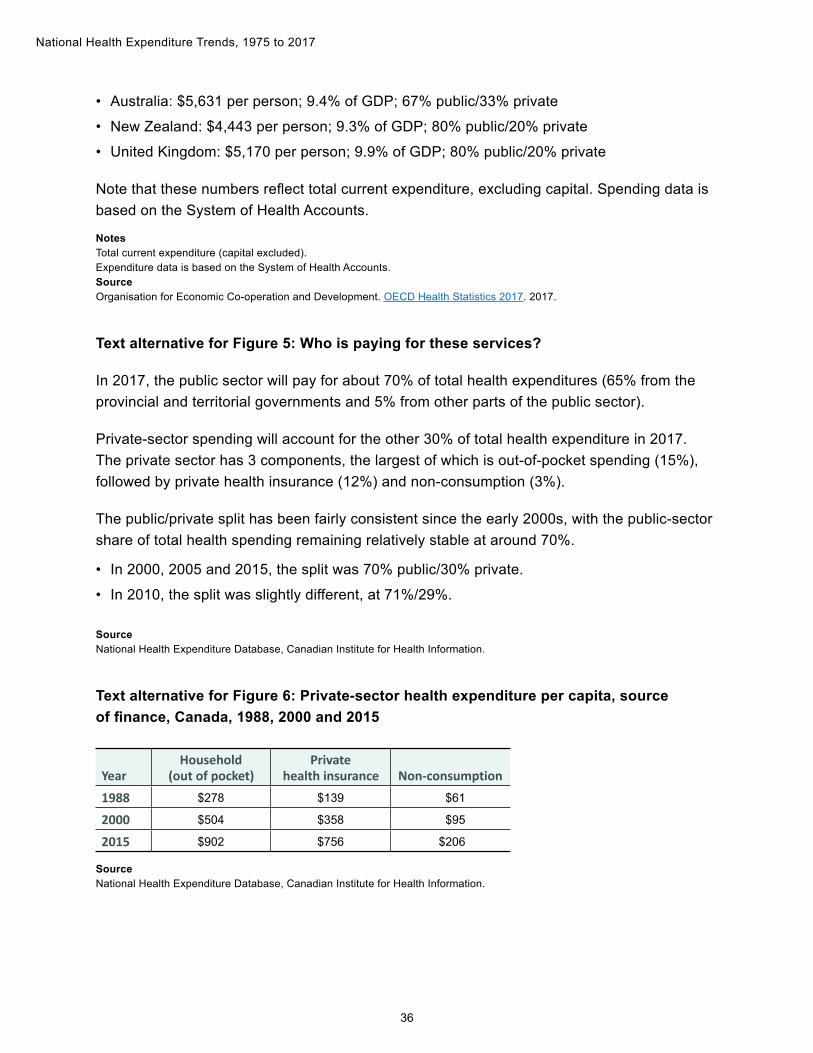
• Australia: $5,631 per person; 9.4% of GDP; 67% public/33% private
• New Zealand: $4,443 per person; 9.3% of GDP; 80% public/20% private
• United Kingdom: $5,170 per person; 9.9% of GDP; 80% public/20% private
Note that these numbers reflect total current expenditure, excluding capital. Spending data is based on the System of Health Accounts.
NotesTotal current expenditure (capital excluded). Expenditure data is based on the System of Health Accounts.SourceOrganisation for Economic Co-operation and Development. OECD Health Statistics 2017. 2017.
Text alternative for Figure 5: Who is paying for these services?
In 2017, the public sector will pay for about 70% of total health expenditures (65% from the provincial and territorial governments and 5% from other parts of the public sector).
Private-sector spending will account for the other 30% of total health expenditure in 2017. The private sector has 3 components, the largest of which is out-of-pocket spending (15%), followed by private health insurance (12%) and non-consumption (3%).
The public/private split has been fairly consistent since the early 2000s, with the public-sector share of total health spending remaining relatively stable at around 70%.
• In 2000, 2005 and 2015, the split was 70% public/30% private.
• In 2010, the split was slightly different, at 71%/29%.
SourceNational Health Expenditure Database, Canadian Institute for Health Information.
Text alternative for Figure 6: Private-sector health expenditure per capita, source of finance, Canada, 1988, 2000 and 2015
YearHousehold
(out of pocket)Private
health insurance Non-consumption1988 $278 $139 $61
2000 $504 $358 $95
2015 $902 $756 $206
SourceNational Health Expenditure Database, Canadian Institute for Health Information.
37
National Health Expenditure Trends, 1975 to 2017
Text alternative for Figure 8: Per capita growth for drugs will outpace that for hospitals or physicians in 2017
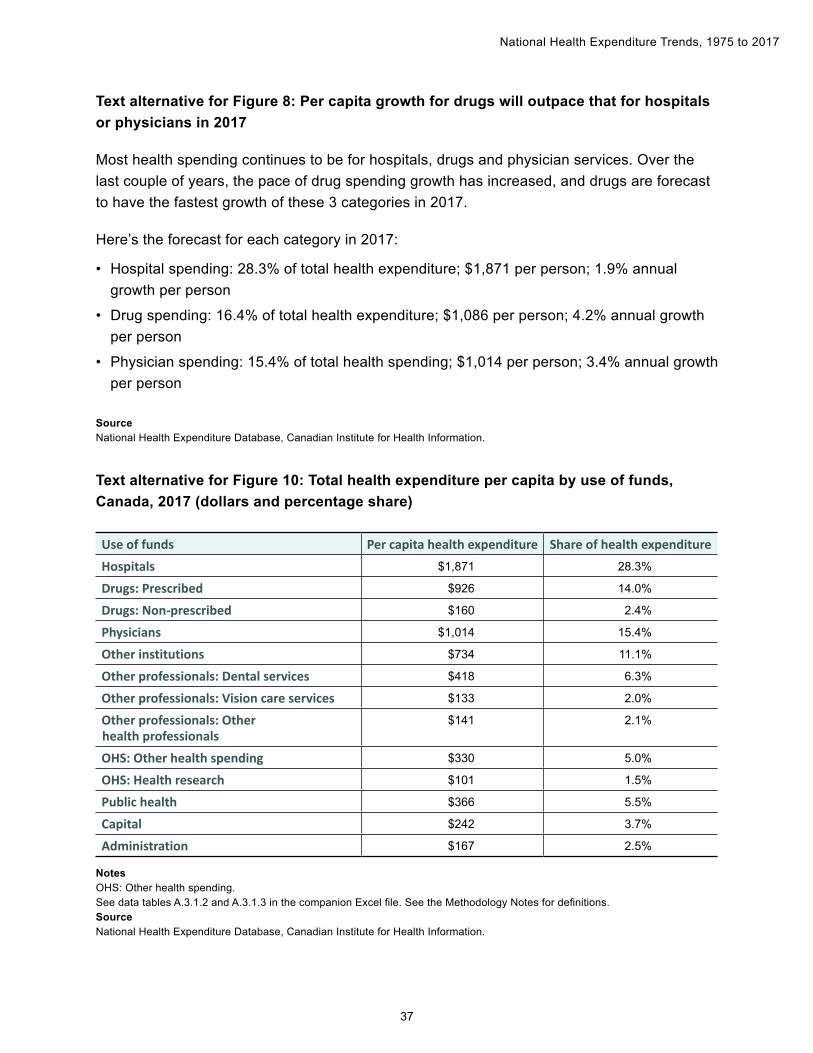
Most health spending continues to be for hospitals, drugs and physician services. Over the last couple of years, the pace of drug spending growth has increased, and drugs are forecast to have the fastest growth of these 3 categories in 2017.
Here’s the forecast for each category in 2017:
• Hospital spending: 28.3% of total health expenditure; $1,871 per person; 1.9% annual growth per person
• Drug spending: 16.4% of total health expenditure; $1,086 per person; 4.2% annual growth per person
• Physician spending: 15.4% of total health spending; $1,014 per person; 3.4% annual growth per person
SourceNational Health Expenditure Database, Canadian Institute for Health Information.
Text alternative for Figure 10: Total health expenditure per capita by use of funds, Canada, 2017 (dollars and percentage share)
Use of funds Per capita health expenditure Share of health expenditureHospitals $1,871 28.3%
Drugs: Prescribed $926 14.0%
Drugs: Non-prescribed $160 2.4%
Physicians $1,014 15.4%
Other institutions $734 11.1%
Other professionals: Dental services $418 6.3%
Other professionals: Vision care services $133 2.0%
Other professionals: Other health professionals
$141 2.1%
OHS: Other health spending $330 5.0%
OHS: Health research $101 1.5%
Public health $366 5.5%
Capital $242 3.7%
Administration $167 2.5%
NotesOHS: Other health spending.See data tables A.3.1.2 and A.3.1.3 in the companion Excel file. See the Methodology Notes for definitions.SourceNational Health Expenditure Database, Canadian Institute for Health Information.
38
National Health Expenditure Trends, 1975 to 2017
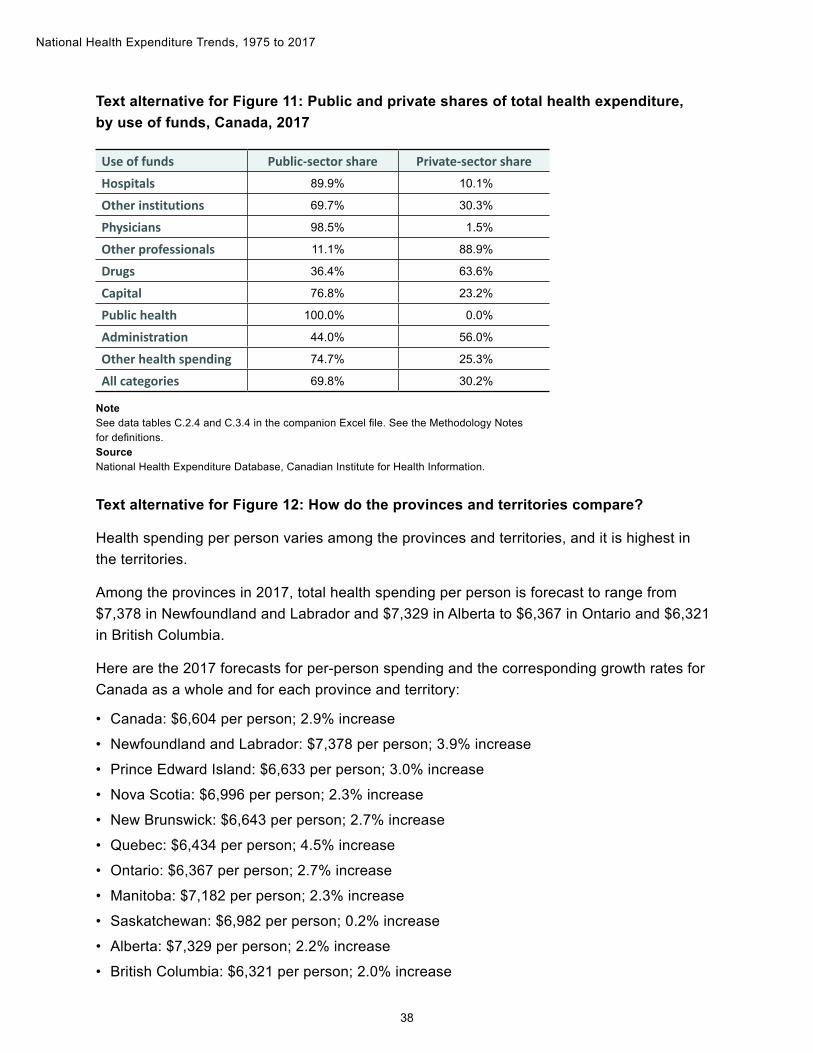
Text alternative for Figure 11: Public and private shares of total health expenditure, by use of funds, Canada, 2017
Use of funds Public-sector share Private-sector shareHospitals 89.9% 10.1%
Other institutions 69.7% 30.3%
Physicians 98.5% 1.5%
Other professionals 11.1% 88.9%
Drugs 36.4% 63.6%
Capital 76.8% 23.2%
Public health 100.0% 0.0%
Administration 44.0% 56.0%
Other health spending 74.7% 25.3%
All categories 69.8% 30.2%
NoteSee data tables C.2.4 and C.3.4 in the companion Excel file. See the Methodology Notes for definitions.SourceNational Health Expenditure Database, Canadian Institute for Health Information.
Text alternative for Figure 12: How do the provinces and territories compare?
Health spending per person varies among the provinces and territories, and it is highest in the territories.
Among the provinces in 2017, total health spending per person is forecast to range from $7,378 in Newfoundland and Labrador and $7,329 in Alberta to $6,367 in Ontario and $6,321 in British Columbia.
Here are the 2017 forecasts for per-person spending and the corresponding growth rates for Canada as a whole and for each province and territory:
• Canada: $6,604 per person; 2.9% increase
• Newfoundland and Labrador: $7,378 per person; 3.9% increase
• Prince Edward Island: $6,633 per person; 3.0% increase
• Nova Scotia: $6,996 per person; 2.3% increase
• New Brunswick: $6,643 per person; 2.7% increase
• Quebec: $6,434 per person; 4.5% increase
• Ontario: $6,367 per person; 2.7% increase
• Manitoba: $7,182 per person; 2.3% increase
• Saskatchewan: $6,982 per person; 0.2% increase
• Alberta: $7,329 per person; 2.2% increase
• British Columbia: $6,321 per person; 2.0% increase
39
National Health Expenditure Trends, 1975 to 2017
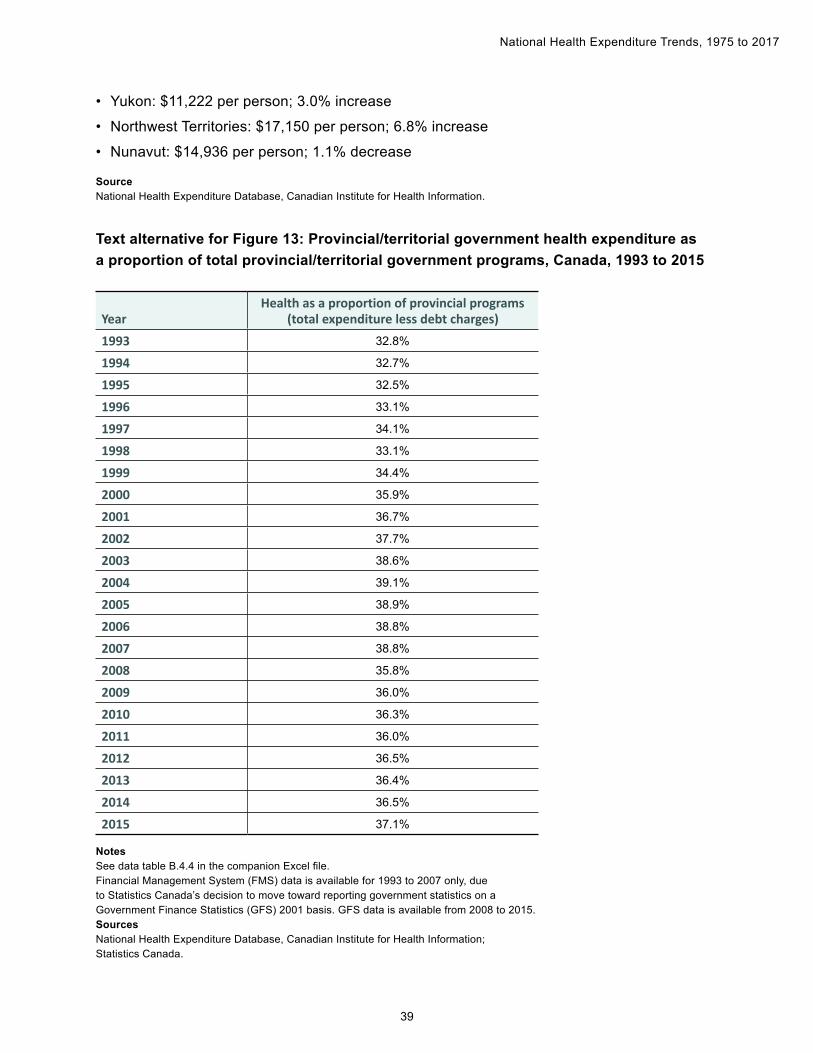
• Yukon: $11,222 per person; 3.0% increase
• Northwest Territories: $17,150 per person; 6.8% increase
• Nunavut: $14,936 per person; 1.1% decrease
SourceNational Health Expenditure Database, Canadian Institute for Health Information.
Text alternative for Figure 13: Provincial/territorial government health expenditure as a proportion of total provincial/territorial government programs, Canada, 1993 to 2015
YearHealth as a proportion of provincial programs
(total expenditure less debt charges)1993 32.8%
1994 32.7%
1995 32.5%
1996 33.1%
1997 34.1%
1998 33.1%
1999 34.4%
2000 35.9%
2001 36.7%
2002 37.7%
2003 38.6%
2004 39.1%
2005 38.9%
2006 38.8%
2007 38.8%
2008 35.8%
2009 36.0%
2010 36.3%
2011 36.0%
2012 36.5%
2013 36.4%
2014 36.5%
2015 37.1%
NotesSee data table B.4.4 in the companion Excel file.Financial Management System (FMS) data is available for 1993 to 2007 only, due to Statistics Canada’s decision to move toward reporting government statistics on a Government Finance Statistics (GFS) 2001 basis. GFS data is available from 2008 to 2015.SourcesNational Health Expenditure Database, Canadian Institute for Health Information; Statistics Canada.
40
National Health Expenditure Trends, 1975 to 2017
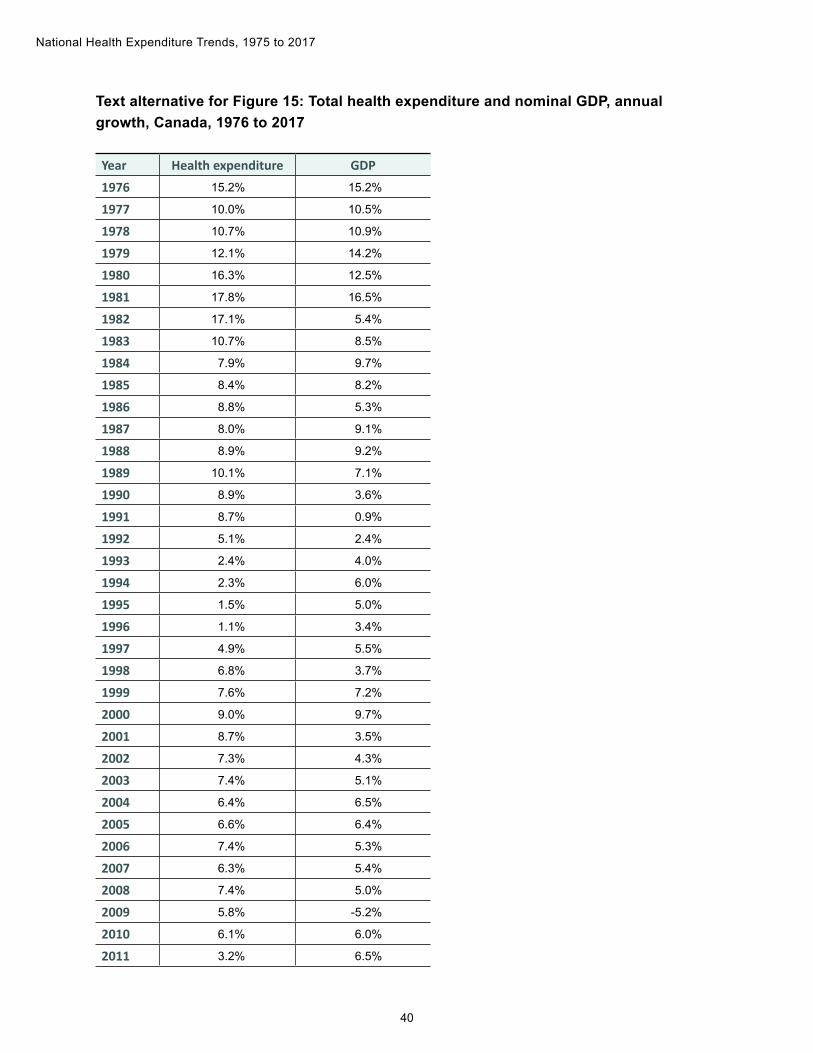
Text alternative for Figure 15: Total health expenditure and nominal GDP, annual growth, Canada, 1976 to 2017
Year Health expenditure GDP1976 15.2% 15.2%
1977 10.0% 10.5%
1978 10.7% 10.9%
1979 12.1% 14.2%
1980 16.3% 12.5%
1981 17.8% 16.5%
1982 17.1% 5.4%
1983 10.7% 8.5%
1984 7.9% 9.7%
1985 8.4% 8.2%
1986 8.8% 5.3%
1987 8.0% 9.1%
1988 8.9% 9.2%
1989 10.1% 7.1%
1990 8.9% 3.6%
1991 8.7% 0.9%
1992 5.1% 2.4%
1993 2.4% 4.0%
1994 2.3% 6.0%
1995 1.5% 5.0%
1996 1.1% 3.4%
1997 4.9% 5.5%
1998 6.8% 3.7%
1999 7.6% 7.2%
2000 9.0% 9.7%
2001 8.7% 3.5%
2002 7.3% 4.3%
2003 7.4% 5.1%
2004 6.4% 6.5%
2005 6.6% 6.4%
2006 7.4% 5.3%
2007 6.3% 5.4%
2008 7.4% 5.0%
2009 5.8% -5.2%
2010 6.1% 6.0%
2011 3.2% 6.5%
41
National Health Expenditure Trends, 1975 to 2017
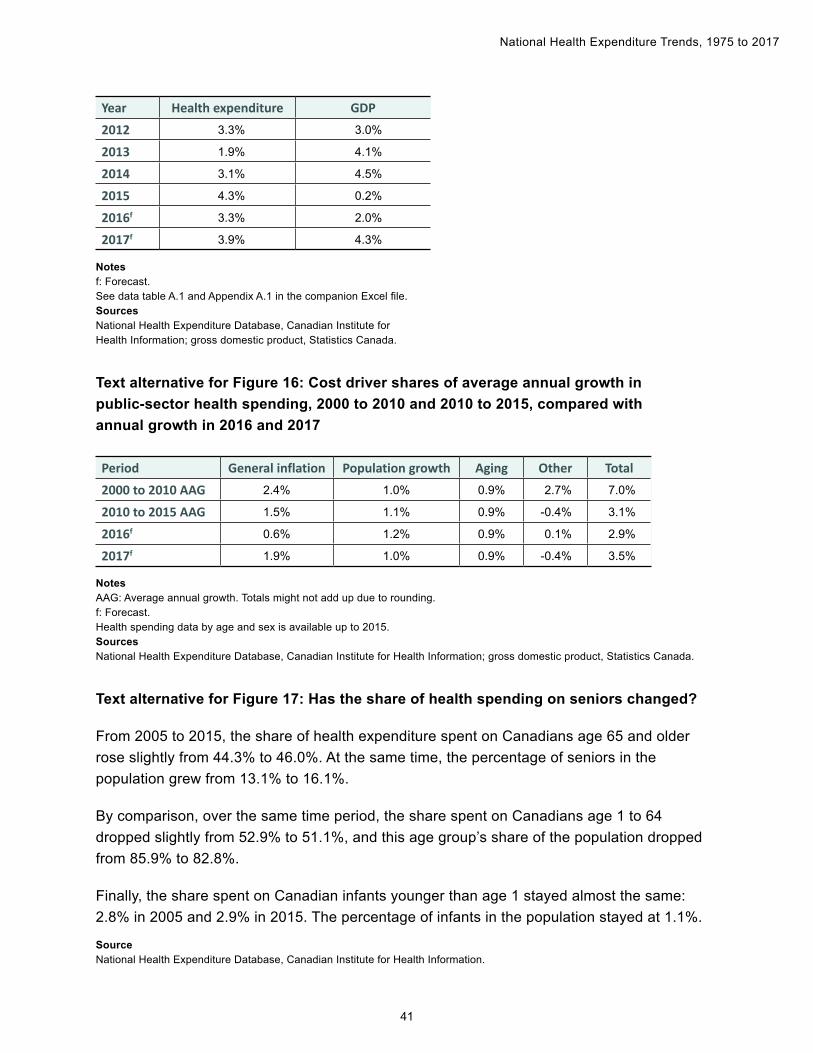
Year Health expenditure GDP2012 3.3% 3.0%
2013 1.9% 4.1%
2014 3.1% 4.5%
2015 4.3% 0.2%
2016f 3.3% 2.0%
2017f 3.9% 4.3%
Notesf: Forecast.See data table A.1 and Appendix A.1 in the companion Excel file.SourcesNational Health Expenditure Database, Canadian Institute for Health Information; gross domestic product, Statistics Canada.
Text alternative for Figure 16: Cost driver shares of average annual growth in public-sector health spending, 2000 to 2010 and 2010 to 2015, compared with annual growth in 2016 and 2017
Period General inflation Population growth Aging Other Total2000 to 2010 AAG 2.4% 1.0% 0.9% 2.7% 7.0%
2010 to 2015 AAG 1.5% 1.1% 0.9% -0.4% 3.1%
2016f 0.6% 1.2% 0.9% 0.1% 2.9%
2017f 1.9% 1.0% 0.9% -0.4% 3.5%
NotesAAG: Average annual growth. Totals might not add up due to rounding.f: Forecast.Health spending data by age and sex is available up to 2015.SourcesNational Health Expenditure Database, Canadian Institute for Health Information; gross domestic product, Statistics Canada.
Text alternative for Figure 17: Has the share of health spending on seniors changed?
From 2005 to 2015, the share of health expenditure spent on Canadians age 65 and older rose slightly from 44.3% to 46.0%. At the same time, the percentage of seniors in the population grew from 13.1% to 16.1%.
By comparison, over the same time period, the share spent on Canadians age 1 to 64 dropped slightly from 52.9% to 51.1%, and this age group’s share of the population dropped from 85.9% to 82.8%.
Finally, the share spent on Canadian infants younger than age 1 stayed almost the same: 2.8% in 2005 and 2.9% in 2015. The percentage of infants in the population stayed at 1.1%.
SourceNational Health Expenditure Database, Canadian Institute for Health Information.
42
National Health Expenditure Trends, 1975 to 2017
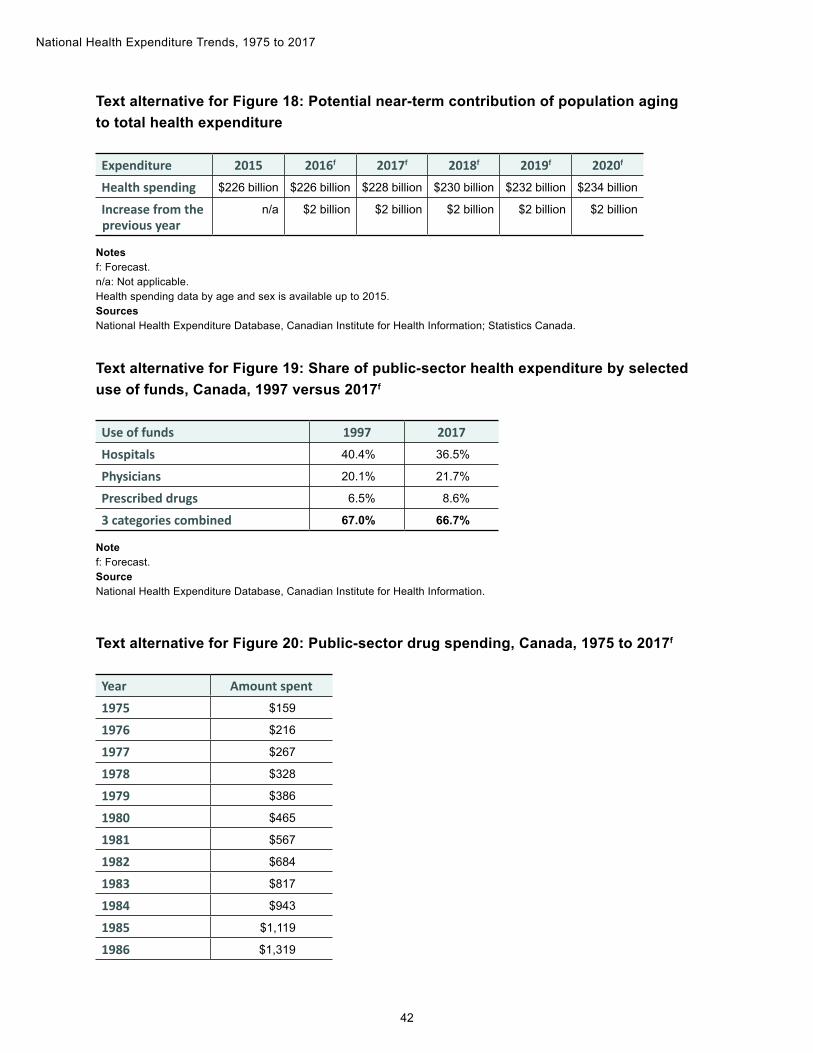
Text alternative for Figure 18: Potential near-term contribution of population aging to total health expenditure
Expenditure 2015 2016f 2017f 2018f 2019f 2020f
Health spending $226 billion $226 billion $228 billion $230 billion $232 billion $234 billion
Increase from the previous year
n/a $2 billion $2 billion $2 billion $2 billion $2 billion
Notesf: Forecast.n/a: Not applicable. Health spending data by age and sex is available up to 2015.SourcesNational Health Expenditure Database, Canadian Institute for Health Information; Statistics Canada.
Text alternative for Figure 19: Share of public-sector health expenditure by selected use of funds, Canada, 1997 versus 2017f
Use of funds 1997 2017Hospitals 40.4% 36.5%
Physicians 20.1% 21.7%
Prescribed drugs 6.5% 8.6%
3 categories combined 67.0% 66.7%
Notef: Forecast.SourceNational Health Expenditure Database, Canadian Institute for Health Information.
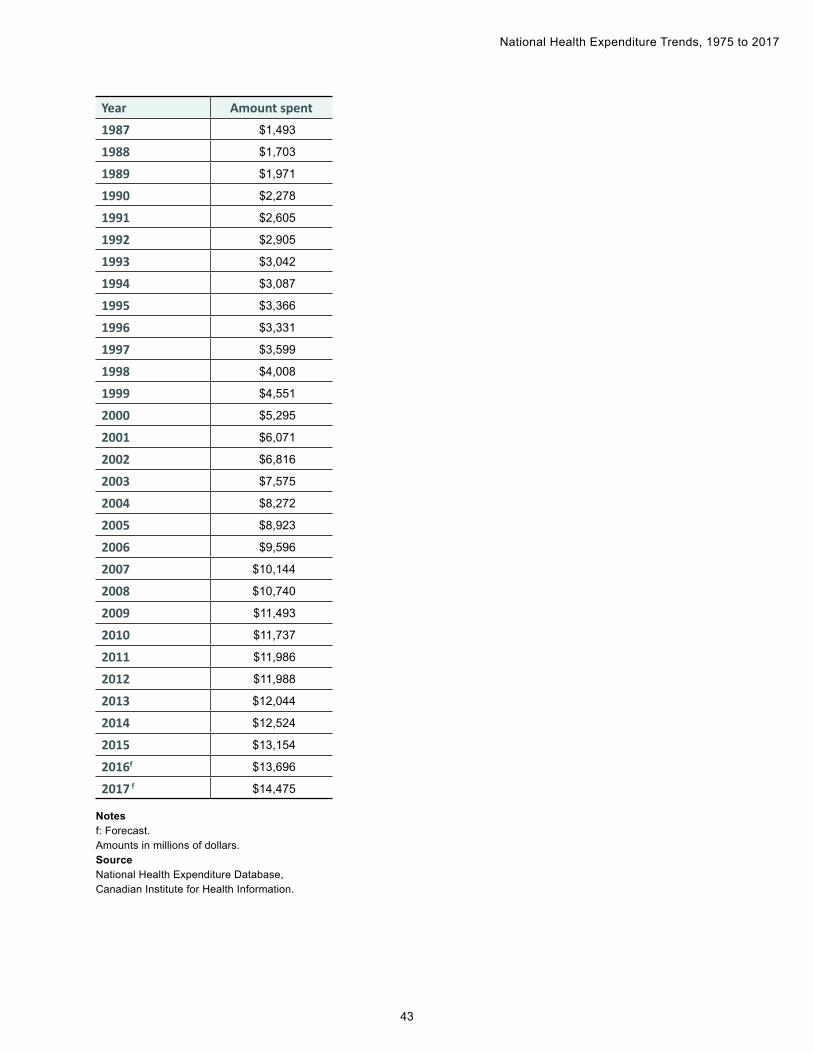
Text alternative for Figure 20: Public-sector drug spending, Canada, 1975 to 2017f
Year Amount spent 1975 $159
1976 $216
1977 $267
1978 $328
1979 $386
1980 $465
1981 $567
1982 $684
1983 $817
1984 $943
1985 $1,119
1986 $1,319
43
National Health Expenditure Trends, 1975 to 2017
Year Amount spent 1987 $1,493
1988 $1,703
1989 $1,971
1990 $2,278
1991 $2,605
1992 $2,905
1993 $3,042
1994 $3,087
1995 $3,366
1996 $3,331
1997 $3,599
1998 $4,008
1999 $4,551
2000 $5,295
2001 $6,071
2002 $6,816
2003 $7,575
2004 $8,272
2005 $8,923
2006 $9,596
2007 $10,144
2008 $10,740
2009 $11,493
2010 $11,737
2011 $11,986
2012 $11,988
2013 $12,044
2014 $12,524
2015 $13,154
2016f $13,696
2017 f $14,475
Notesf: Forecast.Amounts in millions of dollars. SourceNational Health Expenditure Database, Canadian Institute for Health Information.
44
National Health Expenditure Trends, 1975 to 2017
References1. Canadian Institute for Health Information. Health Care Cost Drivers: The Facts.. 2011.
2. Canadian Institute for Health Information. Hospital Cost Drivers Technical Report: What Factors Have Determined Hospital Expenditure Trends in Canada?. 2012.
3. Canadian Institute for Health Information. Drivers of Prescription Drug Spending in Canada. 2012.
4. Canadian Institute for Health Information. Health Care Cost Drivers: Physician Expenditure — Technical Report. 2012.
5. Bank of Canada. Bank of Canada increases overnight rate target to 1 per cent [media release]. September 6, 2017.
6. Organisation for Economic Co-operation and Development. OECD Health Statistics 2017. 2017.
7. Organisation for Economic Co-operation and Development. Health at a Glance 2017. 2017.
8. Canadian Institute for Health Information. Physicians in Canada, 2016. 2017.
9. Office of Research and Information Services, Association of Faculties of Medicine of Canada. Canadian Medical Education Statistics (CMES). 2016.
10. Canadian Institute for Health Information. Prescribed Drug Spending in Canada, 2016: A Focus on Public Drug Programs. 2016.
[email protected] Ottawa495 Richmond Road
Suite 600
Ottawa, Ont.
K2A 4H6
613-241-7860
CIHI Toronto 4110 Yonge Street
Suite 300
Toronto, Ont.
M2P 2B7
416-481-2002
CIHI Victoria 880 Douglas Street
Suite 600
Victoria, B.C.
V8W 2B7
250-220-4100
CIHI Montréal 1010 Sherbrooke Street West
Suite 602
Montréal, Que.
H3A 2R7
514-842-2226
cihi.ca16179-0917