Spending Review 2020 Trends in Public Expenditure 2009- 2019
176
Spending Review 2020 Trends in Public Expenditure 2009- 2019 DEPARTMENT OF P UBLIC E XPENDITURE & REFORM OCTOBER 2020 This paper has been prepared by IGEES staff in the Department of Public Expenditure and Reform. The views presented in this paper do not represent the official views of the Department or Minister for Public Expenditure and Reform.
Transcript of Spending Review 2020 Trends in Public Expenditure 2009- 2019

Spending Review 2020
Trends in Public Expenditure 2009-2019
DEPARTMENT OF PUBLIC EXPENDITURE & REFORM
OCTOBER 2020
This paper has been prepared by IGEES staff
in the Department of Public Expenditure
and Reform. The views presented in this
paper do not represent the official views of
the Department or Minister for Public
Expenditure and Reform.

Contents
Overview of Public Expenditure................................................................................................. 1
Agriculture, Food & the Marine ................................................................................................. 6
Business Enterprise & Innovation ............................................................................................ 12
Children & Youth Affairs .......................................................................................................... 18
Communications, Climate Action & Environment ................................................................... 29
Culture, Heritage & the Gaeltacht ........................................................................................... 39
Defence .................................................................................................................................... 46
Education & Skills ..................................................................................................................... 54
Employment Affairs & Social Protection ................................................................................. 69
Finance ..................................................................................................................................... 77
Foreign Affairs & Trade ............................................................................................................ 86
Health ....................................................................................................................................... 92
Housing, Planning & Local Government ................................................................................ 106
Justice & Equality ................................................................................................................... 118
Public Expenditure & Reform ................................................................................................ 131
Rural & Community Development ......................................................................................... 151
Taoiseach ............................................................................................................................... 158
Transport, Tourism & Sport ................................................................................................... 164

1
Overview of Public Expenditure
Gross voted public expenditure amounted to €67.2 billion in 2019. This set a new record and
facilitated the delivery of a myriad of public service across key sectors such as social
protection, health, education and justice. In the absence of Covid19, Exchequer spending was
due to reach €71 billion in 2020. However, the impact of the pandemic has necessitated the
allocation of significant additional resources to protect people, business and the economy.
While this report predominantly shows trends in expenditure up to and including 2019, the
sections that follow will also highlight where these COVID pressures have emerged and where
they are likely to continue to feature at least into next year.
Following the global financial crisis period, expenditure has been growing by 4 per cent on
average each year. In 2009 total gross voted expenditure reached a peak of €63.1 billion. Over
the period of 2009–2014, there was significant expenditure consolidation. The
implementation of the 5 year consolidation led to a 14 per cent reduction in spending and
expenditure decreasing to €54.1 billion in 2014.
With the improvement in public finances after the consolidation period, there has been
modest growth in expenditure from the end of 2014 and increasing by 20%, between 2014–
2019. In 2019, expenditure was at a peak of €67.2 billion.
Figure 1: Gross Voted Government Expenditure 2009-2019
Figure 1 illustrates voted expenditure over the past decade. It shows the development of
current and capital expenditure, with pay and pension related expenditure and non-pay
related expenditure subdivided.
0
10
20
30
40
50
60
70
2009 2010 2011 2012 2013 2014 2015 2016 2017 2018 2019
€ B
illio
n
Current - Pay & Pension Current - Non-Pay Capital

2
A third of total expenditure in 2019 related to current expenditure on pay and pensions. Non-
pay related expenditure has remained consistent over the past decade at 57% in 2009 and
56% in 2019. Over the period of 2009-2019 capital expenditure has experienced the greatest
fluctuation, accounting for 12% of gross expenditure in 2009, decreasing to a 7% share in 2014
and currently accounting for 11% of total expenditure for 2019.
Figure 2: Allocation of Gross Government Expenditure by Policy Area 2009 and 2019 (€bn)
Figure 2 illustrates expenditure in the various policy areas in 2009 and 2019. It is important
to note that Figure 2 attempts to control for the changes in Health expenditure. This is due
to a number of significant changes in health expenditure, thus making it difficult to compare
expenditure on a like-for-like basis. These changes include the transfer of Children and
Families expenditure to the Children and Youth Affairs Vote, the transfer of the Domiciliary
Care Allowance to the Social Protection Vote and the disestablishment of the HSE Vote.
In 2009, four policy areas: social protection, health, education and justice accounted for 78%
of total government expenditure approximately. While expenditure in these areas fluctuated
over the period, the percentage share of those four policy areas had the same share of
expenditure in 2019.
0 5 10 15 20 25
Justice
Education & Skills
Employment Affairs & Social Protection
Health
Other
2009 2019

3
Figure 3: Gross Capital Expenditure 2008 – 2019, €bn
There was significant investment in capital expenditure in the years leading to the economic
crisis. Capital expenditure reached a peak of approximately €9 billion in 2008. Public
investment was significantly constrained due to consolidation efforts to maintain the
provision of public services. Figure 3 shows that capital expenditure reached a low of just
under €3.4 billion in 2013.
From 2014 onwards, investment in capital expenditure began to grow. The National
Development Plan, published in 2018, sets out investment of €116 billion over the ten-year
period 2018 to 2027. The capital expenditure allocation for 2020 is €8.2 billion.
Throughout this report a range of expenditure drivers have been identified within each of the
Vote Chapters. Below is a brief summary of the key drivers of public expenditure.
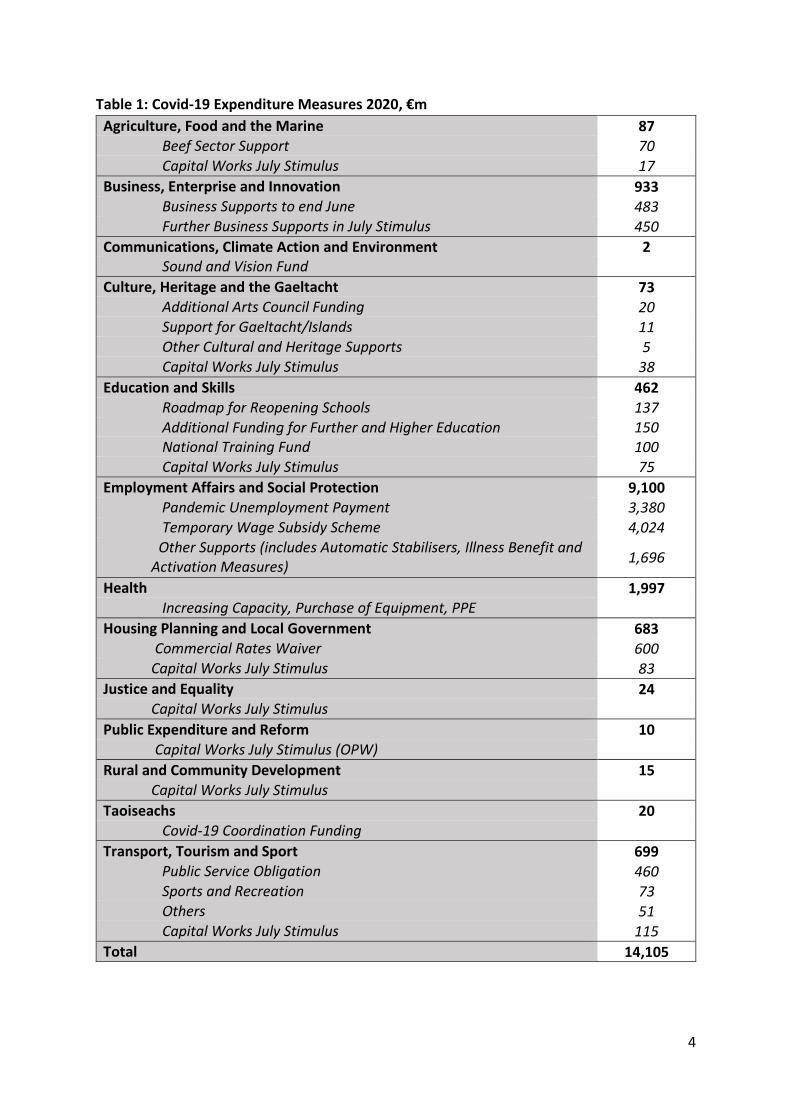
Covid-19
COVID 19 has had a significant effect on public expenditure with areas such as health, social protection and business experiencing the most demand. In response to the crisis, almost €14 billion has been allocated across a range of areas. See table 1 below for details.
0
1
2
3
4
5
6
7
8
9
10
2008 2009 2010 2011 2012 2013 2014 2015 2016 2017 2018 2019
€ B
illo
ns
4
Table 1: Covid-19 Expenditure Measures 2020, €m
Agriculture, Food and the Marine 87 Beef Sector Support 70 Capital Works July Stimulus 17
Business, Enterprise and Innovation 933 Business Supports to end June 483 Further Business Supports in July Stimulus 450
Communications, Climate Action and Environment 2 Sound and Vision Fund
Culture, Heritage and the Gaeltacht 73 Additional Arts Council Funding 20 Support for Gaeltacht/Islands 11 Other Cultural and Heritage Supports 5 Capital Works July Stimulus 38
Education and Skills 462 Roadmap for Reopening Schools 137 Additional Funding for Further and Higher Education 150 National Training Fund 100 Capital Works July Stimulus 75
Employment Affairs and Social Protection 9,100 Pandemic Unemployment Payment 3,380 Temporary Wage Subsidy Scheme 4,024 Other Supports (includes Automatic Stabilisers, Illness Benefit and Activation Measures)
1,696
Health 1,997 Increasing Capacity, Purchase of Equipment, PPE
Housing Planning and Local Government 683 Commercial Rates Waiver 600 Capital Works July Stimulus 83
Justice and Equality 24 Capital Works July Stimulus
Public Expenditure and Reform 10 Capital Works July Stimulus (OPW)
Rural and Community Development 15 Capital Works July Stimulus
Taoiseachs 20 Covid-19 Coordination Funding
Transport, Tourism and Sport 699 Public Service Obligation 460 Sports and Recreation 73 Others 51 Capital Works July Stimulus 115
Total 14,105

5
While it remains unclear what the scale of the impact of this public health emergency will be on the economy and the public finances, policy response to the COVID-19 crisis will require an international response driven at EU level. However were solutions cannot be found, Ireland will be faced with tough public expenditure choices including raising taxes to continue to fund a higher level of expenditure, funding a higher level of expenditure through fiscal deficits or reducing public expenditure in line with the reduction in tax revenues.
Demographics
A significant driver of expenditure is the demographic profile of the country. The headline
demographic estimates have increased from the previous projections from 2016. The latest
projection estimates the cost of demographics for 2020 at €511m, this is higher than the 2016
projection estimate of €435m1. Between 2020 and 2030, core demographic spending
pressures are estimated to require an additional €4.3bn. This results in an annual average
increase in spending of €392m.
The overall population expanded by 0.323 million or 7% in the period 2009 to 2018. The latest
comparison figures show that Ireland has the second youngest population in 2019 with an old
age dependency ratio of 22.2. It is estimated that by 2040 the old age dependency ratio in
Ireland will be around 36.6.
Looking at the Education sector, in 2018, primary level student numbers peaked at almost
569,000 students. This “bubble” is expected to continue into post-primary level, and reach a
peak by 2025. The number of students at primary level is expected to decrease over the
coming years. This will present challenges particularly in relation to how best to manage and
allocate resources in light of projected reductions in demand for education services,
retirements, recruitment and redeployment of teachers.
Looking ahead, the annual average demographic cost is estimated to be €497m from 2023 to
20262, reducing to around €321m from 2027 to 2030. This reduction will be driven by pension
reforms as the retirement age is due to increase to 68 in 2028. In the long term the main
demographic pressure come from an ageing population in the form of increased requirements
in the areas of health, social care and pensions.
1 J. Connors, R. Duffy and F. Newman. 2016. Budgetary Impact of Changing Demographics 2017 – 2027. IGEES Staff Paper 2016. Department of Public Expenditure & Reform http://igees.gov.ie/wp-content/uploads/2015/02/Demographic-Paper-Final-101016.pdf. This analysis is expected to be updated in 2019. J. Connors, C. Moran, and K. Ivory. 2019. Budgetary Impact of Changing Demographics 2020 – 2030. Spending Review 2019 Paper. Department of Public Expenditure & Reform http://www.budget.gov.ie/Budgets/2020/Documents/Budget/Budgetary%20Impact%20of%20Changing%20Demographics%20from%202020%20-%202030.pdf 2 J. Connors, C. Moran, and K. Ivory. 2019. Budgetary Impact of Changing Demographics 2020 – 2030. Spending Review 2019 Paper. Department of Public Expenditure & Reform http://www.budget.gov.ie/Budgets/2020/Documents/Budget/Budgetary%20Impact%20of%20Changing%20Demographics%20from%202020%20-%202030.pdf

6
Economic Dynamics
In the past 10 years, expenditure has evolved in response to the cyclical conditions. Due to the economic downturn in 2008, the number of people on the Live Register rose sharply peaking at approximately 450,000 in 2011. As a result, there was a shift in the distribution of expenditure towards jobseekers benefit and assistance, and employment supports. Ireland has reacted speedily to the COVID-19 crisis putting in place a number of temporary supports in response to the health and economic impact of the crisis. This has resulted in an additional 1.3 million people (at its peak in May) being supported by DEASP. The total numbers supported by unemployment payments and other temporary COVID-19 income support schemes was 962,662 as at 4 August.
Government Policy Initiatives
Outside of Covid-19 and demographic pressures, there are a range of areas where
Government policy has driven the demand for additional resources. Throughout this report,
sectoral plans and programmes that impact on ongoing and future spending trends are
highlighted within each Chapter.
This paper provides an overview of the developments in public expenditure over the last
decade. It looks at the evolution of spending on a sector by sector basis, examining the key
expenditure drivers and looking at what has been delivered. It also provides a context for the
papers published as part of the Spending Review 2020. Each chapter is structured as follows:
o The first section gives a broad overview of the long term trends in the spending area;
o The second section details the underlying drivers of expenditure within the Votes; and
o The third section highlights the range of funding and policy challenges facing Vote
Groups. The impacts, known and potential, of the COVID19 pandemic, are also
explored.
Agriculture, Food & the Marine Niall McCabe
Summary
o Current gross voted expenditure on the Agriculture, Food and Marine Vote is the
highest it has been in a decade.

7
o The Vote’s 2019 level of capital gross expenditure is just over half of the level it
was during 20103. Since 2011 Capital has stayed around 15% of gross Agriculture
Vote expenditure.
o In recent years, not reaching Forestry/afforestation targets has contributed to
lower capital expenditure than allocated.
o Official Controls carried out by DAFM as an independent verifier of the safety of
food is a critical aspect of ensuring consumer confidence in Irish food, not only in
Ireland but across the globe to the 180 countries to whom we export. Significant
sums are being spent on food safety measures on an ongoing basis. The challenge
will be to prove that these expenditures are achieving value-for-money (in an era
when technological advances offer the opportunity to replace manual inspection
practises). In this regard, DAFM is currently implementing a Food Safety and Food
Authenticity Strategy which will ensure that the opportunity presented by
technological advances is taken to gain benefits for the citizen and consumer as
well as enable efficient and effective safeguarding of the food chain.
o Increased expenditure on Agri-environmental scheme has been one of the main
contributors to growing current voted expenditure in recent years. It is to be
expected that Agri-Environmental Schemes will represent a growing proportion of
future expenditure in line with Common Agricultural Policy ambitions post 2020.
Figure 1 below displays the total Agriculture Vote gross expenditure over the past decade
(2010-2019) split between Current & Capital gross expenditure.
Figure 1: Agriculture, Food and the Marine Gross Expenditure, 2010-2019 (€m)
3 2008-2010 was an exceptional period for Capital Expenditure.

8
Figure 2 below breaking out gross current expenditure by functional area highlights
farm/sectoral supports make up approximately half of overall Vote current expenditure.
o The main components underlying the increase in current expenditure within the
Agriculture Vote in recent years have been linked to farm/sectoral policy
commitments arising from the Common Agricultural Policy (CAP) namely Areas of
Natural Constraint and Agri-enviromental schemes as well as solely nationally funded
beef schemes.
o In light of COVID impacts, a growing proportion of DAFM’s annual budget may in
future be disbursed toward further enhancing already high food safety standards (to
ensure beef factory worker and consumer safety).
o It is to be expected that consumer demands will continue to increase. DAFM’s Food
Safety & Food Authenticity strategy will provide the framework for responding to the
enhancement of food standards.
o It is the role of each Food Business Operator under Health and Safety legislation to
protect their factory workers. If costs for Food Business Operators increase, there is
a possibility that those costs will be passed back to the primary producer, thus
impacting their income and viability. It is conceivable that DAFM may have a support
role in safety oversight (while not assuming the role and responsibility of the Health
& Safety Authority) and this may have some cost implications for DAFM in the future.
Figure 2: DAFM Gross Current Expenditure by Function (€m)
488206 186 165 182 194 171 219 274 260
1,243
1,216 1,132 1,041 1,010 1,071 1,0861,168
1,272 1,359
0
200
400
600
800
1,000
1,200
1,400
1,600
1,800
2010 2011 2012 2013 2014 2015 2016 2017 2018 2019
Capital Current

9
o Figure 3 below shows that the lower level of gross capital expenditure compared to
2010 is due to lower capital expenditure in respect of farm / sectoral supports.
o Given the importance of capital investment as a driver of productivity
improvements (with positive income impact), an increased weighting of
capital (as a proportion of overall Vote spend) in future years is conceivable.
o In recent years, not reaching Forestry/afforestation targets has contributed
to lower farm/sector capital expenditure than allocated.
Figure 3: DAFM Gross Capital Expenditure by Function (€m)
0
200
400
600
800
1,000
1,200
1,400
2010 2011 2012 2013 2014 2015 2016 2017 2018 2019
D - SEAFOOD SECTOR
C - POLICY AND STRATEGY
B - FARM / SECTOR SUPPORTS & CONTROLS
A - FOOD SAFETY, ANIMAL & PLANT HEALTH & ANIMAL WELFARE
0
100
200
300
400
500
600
2010 2011 2012 2013 2014 2015 2016 2017 2018 2019
D - SEAFOOD SECTOR
C - POLICY AND STRATEGY
B - FARM / SECTOR SUPPORTS & CONTROLS
A - FOOD SAFETY, ANIMAL & PLANT HEALTH & ANIMAL WELFARE

10
o Through the EU’s Common Agricultural Policy (CAP), a significant proportion of
Agricultural Policy and Expenditure is directed via the European Union.
o The portion of this that is co-funded from the Vote, the Rural Development
Programme (RDP), is distributed across the period of the CAP 2014-2020 Programme
(and sometimes into following years). Lower annual average expenditure in earlier
years of the 2014-2020 RDP means higher expenditure in later years.
o Given the strong integration of national and European agricultural expenditure, the
shape of a new 2021-2027 CAP and the transition period from the old to the new CAP
will have a significant impact on future DAFM Vote expenditure.
o It is envisaged that the new CAP will have a stronger environmental emphasis which
can be expected to increase focus on farm/sectoral supports such as agri-
environmental schemes.
o There is an ongoing focus on facilitating generational renewal throughout the sector,
creating demand both for Knowledge Transfer training regionally as well as significant
investment in modern, low-energy / green-energy consumption equipment.
o Global demand for meat, including beef, is expected to increase in the next decade
(OECD-FAO Agricultural Outlook 2020-2029). While the shut-down of food services
had a disproportionate effect on the demand for higher cuts across Europe, this may
not be a permanent feature (obviously this is COVID dependant).
Agriculture, Food and the Marine
1. COVID19
The longer-term impacts of Covid have yet to unfold and will require dynamic policy
responses.
2. Brexit
Market and product diversification efforts are underway to mitigate the worst effects of
Brexit over time.
3. Rural Development Programme (RDP) post 2020 & Agri-food Strategy to 2030
Preparatory work is still ongoing for both.
4. Challenges to Agri-Food industry sustainability

11
The longer-term strategy for sustaining the beef sector will require further examination.

12
Business Enterprise & Innovation Sue Blood, Andrew Grey
Summary
o When excluding retired expenditure, the overall expenditure trend within the
Business, Enterprise and Innovation Vote (Vote 32) has steadily risen in the years since
2014. Prior to 2014, Vote expenditure was on a generally downward trend.
o Key factors which influenced the reduction of expenditure from 2010 to 2014 were
the measures taken in response to the economic downturn and the removal of FÁS
from the Departments remit.
o Total expenditure for Vote 32 in 2019 represented 1.3% of total Voted expenditure in
2019.
The Department of Business Enterprise and Innovation has undergone significant change in
the last decade and that has been reflected in the long term spending trend of the
Department. One of the most significant changes in terms of its expenditure profile was the
removal of the FÁS function in 2010. In addition, this also occurred during the economic
downturn. Figure 1 outlines the extent of the impact which both of these events had on the
expenditure of the Department with current expenditure being reduced by significantly. This
downward trend in expenditure ended following 2014 and has gradually increased in line with
overall Government spending.
Figure 2: Enterprise & Innovation – Including FÁS
403 358 351 338 322 286 286 304 310 324
486487 500
454 443 528 557 547 527577
0
100
200
300
400
500
600
700
800
900
1000
2010 2011 2012 2013 2014 2015 2016 2017 2018 2019
Current Capital

13
Figure 2: Enterprise & Innovation – Including FÁS
For comparative purposes, Figure 2 below shows a like-for-like view on the levels of
expenditure in relation to the current functions of the Department. When excluding FÁS, the
expenditure trend is much more stable, with spending increases and reductions being much
more gradual. One observation to note is that the Department reduced current expenditure
significantly (2019 = 19% lower than 2010) during the period while capital expenditure has
returned to pre-crisis levels.
Figure 3 and Figure 4 outline expenditure over the period in terms of current and capital
expenditure respectively. Figure 3 again illustrates the level of current expenditure which was
reduced as a result of the removal of FÁS under the heading of retired expenditure. The Jobs
& Enterprise Development Programme has the largest current expenditure of the 3
Department functions, averaging 66% of current expenditure over the period excluding
retired expenditure. This is primarily driven by agencies such as IDA Ireland and Enterprise
Ireland.
Figure 3: Business Enterprise & Innovation Current Expenditure by Programme, €000s
665
358 351 338 322 286 286 304 310 324
486
487 500454 443 528 557 547 527
577
0
200
400
600
800
1,000
1,200
1,400
2010 2011 2012 2013 2014 2015 2016 2017 2018 2019
Current Capital
0
100,000
200,000
300,000
400,000
500,000
600,000
700,000
2010 2011 2012 2013 2014 2015 2016 2017 2018 2019
€ ,0
00
Jobs Ent Innovation Reg Retired

14
In terms of capital spend, expenditure has been relatively stable during the period 20010-
2019 in comparison to current expenditure as illustrated in figure 4 below. Total capital spend
reached its lowest level of the period in 2014 with spend of €443m but this was quickly
reversed to an upward trend which reached a new peak in 2019 with a capital spend of
€577m. The Innovation programme has consistently been the largest capital expenditure
programme within the Departments remit and accounted for 64.8% of capital expenditure in
2019.
Figure 4: Business Enterprise & Innovation Capital Expenditure by Programme, €000s
DBEI’s main expenditure drivers are influenced by Government Policy and the need for
interventions and support for the sector. The key strategy which drove policy in the sector
during this period was the Action Plan for Jobs which was published in 2012. Over 3,200
measures were implemented under the Action Plan for Jobs and sought to support job
creation in the economy to tackle unemployment.
Economic and other external factors play a significant role in driving expenditure in the
Department. During the financial crisis, significant expenditure was allocated to reducing
unemployment by maintaining supports for SMEs and by continuing to attract FDI. In recent
times, the preparations for Brexit have been a significant external factor driving expenditure.
0
100,000
200,000
300,000
400,000
500,000
600,000
700,000
2010 2011 2012 2013 2014 2015 2016 2017 2018 2019
€ ,0
00
Jobs Enterprise Innovation Retired Expenditure

15
Figure 5: Business Enterprise & Innovation Total Expenditure by Programme, €m
The current performance indicators utilised by DBEI give a broad overview of the outcomes
of various measures. A key indicator on the Jobs and Enterprise Development programme is
the number of jobs created by IDA companies in a given year. This helps to demonstrate the
impacts of IDA Ireland and the value created by attracting foreign direct investment.
However, it should be acknowledged that as a small, open economy, global economic
conditions will likely have a significant bearing on this indicator.
Ireland’s global competitiveness ranking is also utilised as a context and impact indicator. This
is an important indicator when considering the economy’s capacity to sustain job creation via
both FDI and indigenous industry, given the demands it may place on infrastructure and
housing etc. Competitiveness will likely remain a key issue into the future as economies such
as Ireland’s continue to transition to carbon neutrality.
DBEI Performance Indicators
2010 2011 2012 2013 2014 2015 2016 2017 2018 2019
No. of new IDA investment
projects won
126 148 144 164 197 213 242 237 265 250
No. gross new jobs created by
IDA client companies in
year
9,075 13,000 12,722 13,367 15,012 18,983 18,627 19,851 22,785 24,542
0
100
200
300
400
500
600
700
800
900
1000
2010 2011 2012 2013 2014 2015 2016 2017 2018 2019
€ m
Jobs, Enterprise Innovation Regulation

16
No. gross permanent fulltime job gains in EI
client companies in
year
8,193 9,076 7,645 12,532 14,873 15,905 14,814 19,332 18,846 13,298
Total direct expenditure in Irish Economy
by IDA/EI client
companies
36bn 38.2bn 40.1bn 43.4bn 45.3bn 42.2bn 45bn 46.4bn 49.3 TBC
No. High Potential Start-Ups supported
80 93 97 104 102 105 105 90 82 91
No. of workplace inspections
and investigations undertaken by
the HSA
16,714 15,000 13,000 12,244 10,719 10,880 10,477 9,934 9,828 10,291
No. of calls made by Consumers to the CCPC call centre
60,000 62,000 60,000 56,200 49,432 43,000 44,102 42,112 43,000 41,589
Days lost through strike
action
6,602 3,483 8,486 14,965 19,238 32,964 71,647 50,191 4,050 36,152
Source: Revised Estimates/Agency Annual Reports 2010-2019
1. Covid-19 The onset of the Covid-19 pandemic has had significant consequences for enterprises across the vast majority of sectors. The temporary closure of many businesses has increased the risk of liquidity issues arising, particularly for smaller enterprises. In addition, it is expected that domestic demand is likely to be dampened in comparison to previous estimates. As the economy continues to reopen and adapt to the conditions required to safeguard public health, there will continue to be uncertainty which has the potential to dampen investment. There have already been a number of interventions by Government designed to support enterprises impacted by the economic conditions created by the pandemic. These range from supports such as the Temporary Wage Subsidy Scheme, direct grants such as the Restart Grant to assist with reopening costs and various loan schemes to address liquidity issues. There will likely be a case for further intervention in order to support employment as the economy recovers from the effects of the pandemic. This will have policy and expenditure implications for the Department in the future. 2. Brexit

17
Brexit continues to pose significant policy challenges for DBEI in terms of its potential to cause disruption across a variety of sectors. The outcome of negotiations regarding the trading relationship between the European Union and the United Kingdom will have wide ranging impacts for Irish business. The impacts will be felt most notably in many exporting sectors, including agri-food, indigenous manufacturing and tourism, as well as in importing sectors, especially those characterised by just-in-time supply chains, such as parts of the retail sector. The uncertainty surrounding a departure date and the form of Brexit poses significant policy challenges to DBEI and creates challenges to businesses in terms of preparation. A number of measures have already been implemented, including the Brexit Loan Scheme, the Future Growth Loan Scheme as well as support in terms of the delivery of customs training in the form of the Clear Customs Programme. Both IDA Ireland and Enterprise Ireland have received additional funding in order to allow them to increase their global footprint.

18
Children & Youth Affairs Larry Dunne and Patrick Kiernan
Summary
o Since 2014, gross voted expenditure by the Department of Children and Youth Affairs
has increased by 61% to €1.61 billion.
o In terms of 2020 REV composition, 51% of gross expenditure allocated for 2020
relates to the work and services of TUSLA while 40% is accounted for by childcare
related supports.
o At end Quarter 1 2020 there were 4979 (fte) staff employed within the Department
and its Agencies, with some 88% employed in Tusla providing child protection and
welfare services.
o The primary drivers of expenditure are related to demographics, economic dynamics,
service demand and policy direction/implementation.
o In terms of demographics, the number of children is projected to increase over the
next couple of years but demographic pressure in this cohort is expected to ease over
the medium term.
o Birth rates in Ireland peaked at 16.8 births per thousand in 2008. In 2019, it fell to
12.6 births per thousand, a decrease of 25 per cent.
o Policy direction and implementation is a key factor in determining expenditure in the
area of childcare, the implementation of the National Childcare Scheme, the extension
of ECCE and commitments to provide supports in this area are important factors.
Over the period 2014 to 2020, gross expenditure on the Children and Youth Affairs (CYA) Vote
increased from just under €1 billion to €1.61 billion, an increase of over €610 million or 61%.
As the Children and Youth Affairs Vote, established in 2011, centralised policy areas and
programmes from a range of areas including health, education and justice, comparing
expenditure before 2011 is challenging.

19
Figure 1: Gross Voted Expenditure, 2011 – 2020, €000s
Source: DPER. 2011 and 2019 are provisional outturn. 2020 is allocation. * Note: 2011-2013 figures adjusted for HSE Children and Family Services expenditure subsequently transferred to CYA on Tusla’s establishment.
The Department’s responsibilities include a range of policy and service activity, direct and
indirect, for children and young people and has a diverse range of cross-cutting impacts on
other policy areas. CYA expenditure is focussed on early learning and care (ELC) and school
age childcare, youth justice, child welfare and protection, children and young people's
participation, research on children and young people, youth work and cross-cutting children’s
initiatives. This cross-cutting feature is reflected in the Department’s National Policy
Framework, ‘Better Outcomes, Brighter Futures’, launched in 2014. Building on this work,
First 5: A Whole-of-Government Strategy for Babies, Young Children and their Families was
published in November 2018.
The following sets out an overview of expenditure by programme between 2011 and 2020
(Table 1) and by type in 2020 (Figure 2). Looking at CYA expenditure by sub-programme area
from 2011 to 2020, as in Table 8.1, 51% of the 2020 gross expenditure is associated with
TUSLA. The (i) childcare schemes and programmes along with delivery supports and other
initiatives and the (ii) ECCE (including AIM) account for 19% and 21% of the allocation
respectively, while the remainder relates to youth services and organisations (4%) and other
expenditure streams. Note the 2011-2013 figures are amended to include HSE expenditure
on Child and Family Services, which transferred to the CYA Vote with the establishment of
TUSLA4 in 2014.
Table 1: Gross Expenditure 2011-2020 by Sub-Programme Area, €000s
2011 2012 2013 2014 2015 2016 2017 2018 2019 2020
TUSLA - Child & Family Agency
623,645* 628,560* 623,988* 619,318 662,690 678,996 712,693 752,916 809,216 817,372
4 Campbell, T and Mullins, D. (2016) ‘Health Spending: Moving Back to Peak Funding’. http://igees.gov.ie/wp-content/uploads/2014/11/Health-Expenditure_Moving-Back-to-Peak-Funding.pdf
976 989 971 999 1,029 1,088
1,250 1,387
1,518 1,613
0
200
400
600
800
1000
1200
1400
1600
1800
2011* 2012* 2013* 2014 2015 2016 2017 2018 2019 2020

20
Early Childhood Care and Education Scheme
163,033 175,768 174,112 173,797 177,082 223,751 297,136 326,709 332,540 338,576
General Childcare Programmes & Childcare Initiatives
85,778 85,682 76,139 79,001 84,179 81,217 119,097 175,480 234,841 299,366
Youth Services and Organisations
60,941 57,030 53,895 50,523 51,485 53,607 62,747 59,881 62,515 64,789
Youth Justice – Oberstown Children Detention Campus
15,853 17,254 19,293 54,701 29,343 22,869 23,743 27,658 23,917 29,388
Other 26,913 25,072 23,733 21,805 24,594 27,988 34,568 44,512 55,105 63,574
Total 976,163* 989,366* 971,160* 999,145 1,029,373 1,088,428 1,249,984 1,386,854 1,518,134 1,613,065
Source: DPER. 2011 and 2019 are provisional outturn. 2020 is allocation. Note: 2011-2013 TUSLA figures include expenditure under CYA Vote on Family Support Agency, National Educational Welfare Board, School Completion Programme and Child and Family Support Programme and expenditure on Child and Family Services by the HSE. Note: The Early Years Subheads under Programme B were reorganised in REV 2019 reducing the validity of year-on-year comparisons.
Figure 2: Gross Allocated Expenditure 2020 by Type
The following sets out a brief overview of the main programme areas under the CYA Vote.
Tusla – Child and Family Agency
Tusla’s funding, delivered under Programme A, Children and Family Support, aims to support
and improve the existing service delivery for the welfare of children, young people and
families, including oversight of Tusla. Tusla provides for child protection and welfare services,
Gross expenditure is around
three-quarters non-pay and
one-quarter pay, as in Figure
8.2.
As such, the vast majority of
the Vote is current
expenditure with capital
expenditure accounting for
2% of the 2020 allocation.
These proportions are broadly
similar to 2019.
2%
21%
1%
76%
2020 (€M) GROSS VOTE ALLOCATION
Capital Pay Pension Non Pay

21
educational welfare services, psychological services, alternative care, community-based
welfare of children and families, pre-school inspection services and domestic, sexual and
gender-based violence services.
Early Years Care and Education
Funding of the Childcare schemes, related supports and initiatives are delivered through
Programme B - Sectoral Programmes for Children and Young People. The aim is to support
the provision of both universal and targeted services for the care, development and well-
being of children and young people.
Early Childhood Care and Education Scheme (ECCE)
ECCE provides children with their first formal experience of early learning prior to primary
school. It is a universal and demand-led scheme, available to all legally resident children
within the qualifying age range. The scheme entitlement is currently three hours per day, five
days per week, over 38 weeks per year, for 2 programme years or 76 weeks in total (up from
38 weeks when introduced and 61 weeks on average when enhanced in 2016).
National Childcare Scheme (NCS)
The National Childcare Scheme was launched in September 2019. The Scheme provides both
universal and income-linked subsidies. The universal entitlement provides up to €1,040 per
annum for childcare subsidisation for the under 3s. The NCS replaced the existing targeted
childcare programmes with a single scheme.
Youth Organisations and Services
Youth Organisations and Services provides the funding to support the delivery of a range of
youth work programmes and services for young people.
These resources fund youth services throughout the country, including services for those at
risk of disadvantage and help address some of the remaining challenges faced by LGBTI+
young people. The principal youth services and programmes in receipt of funding are:
Youth Service Grant Scheme
Youth Information Centres
Targeted Youth Funding Scheme
Local Youth Club Grant Scheme
Gaisce
Léargas
National Youth Health Programme
National Youth Arts
Other Expenditure
Other expenditure primarily relates to smaller areas within Programmes (A) Children and
Family Support and (B) Sectoral Programmes for Children and Young People. These includes

22
Youth Justice (Oberstown Children Detention Campus); Prevention and Early Intervention
Programmes; Intervention Programmes for Children and Young People; Programme for Peace
& Reconciliation; and Administration expenditure. In addition, Programme (C) Policy and
Legislation, is targeted at key areas of policy, legislation and inter-sectoral collaboration. This
expenditure has expanded in recent years relating to Growing Up in Ireland- The National
Longitudinal Study on Children, the Children and Young People`s Policy Framework and Other
Programmes and the Commission of Investigation into Mother and Baby Homes and certain
related matters. The funding delivered under Programme C also supports the Adoption
Authority of Ireland and the Office of the Ombudsman for Children.
Section 2: Expenditure Drivers
The key drivers of expenditure are demographics, economic dynamics, service demand and
policy choices. As with any policy area the factors that drive expenditure are varied and
complex. However, it is possible to usefully identify a number of high level and interrelated
drivers.
Demographic Change
A significant driver is demographic trends in the cohort of children in the State. Over the
period 2002 to 2016, the cohort aged between 0-14 expanded significantly by 22%, from
827,428 to just under 1.01 million. This significant expansion has led to expenditure pressures
in a number of areas including education, children services, childcare and child related
payments (including Child Benefit which is provided from Department of Employment Affairs
& Social Protection Vote).
Figure 3: Population Years 0-14, 2002-2016
In 2016, the number of families in Ireland was 1,218,370, an increase of 3.3% on 2011 and
51% since 1996. Child population growth has a strong upwards pressure on childcare
expenditure, with increased uptake on demand-led supports and programmes. In tandem,
there is an increasing demographic demand in child and family and other Tusla services, with
an upward trend in child welfare/abuse referrals since 2006, reaching over 50,000 annually
in recent years.
0.83 0.86 0.98 1.01
0
0.2
0.4
0.6
0.8
1
1.2
2002 2006 2011 2016
Mill
ion
s
Source: CSO

23
However, the Central Statistics Offices in its Population and Labour Force Projections 2017 –
20515 have stated “Under the most positive scenario M1F1 the population aged 0 - 14 is
projected to decline from 2016 levels to 960,600 persons by 2031”.
Economic Dynamics
This general driver impacts on service demand. Trends in household income, employment,
cost of living, quality of life, poverty and wealth are all important factors for child
development. Demand to access childcare and for support to do so, is a function of a number
of factors including employment rates, the cost of childcare and income levels etc. Notably,
parents’ eligibility subsidies under National Childcare Scheme (NCS) determined by their
income. Trends in the cost of the NCS, are driven by wider economic and social factors, which
can impact both the level of demand and the level of subsidies paid per household. Significant
increases in the number of Live Register participants, due to the impact of the C-19 pandemic
will be a major cost driver in 2020 and into 2021. Conversely, the impact of the pandemic on
childcare provider’s ability to provide services may reduce expenditure.
Service Demand
The level of demand for service provision is a driver of expenditure and is itself impacted by
other stated factors such as demographics. As with other policy areas, expenditure pressures
are interlinked with demand for services.
TUSLA
An example of service demand is set out in Table 2 which shows the total number, and rate,
of referrals to Tusla’s Child Protection and Welfare Social Work Services between 2014 and
2019. The total number of referrals increased by 30% to 56,561 between 2014 and 2019 while
the rate of referrals (per 1000 population 0-17 years) increased from 37 to 47.5.
Table 2: Referrals** to Child Protection and Welfare Social Work Services and Rate per
1,000 Population 0-17 Years, 2014–2019
Referrals 2014 2015 2016 2017 2018 2019
Total Referrals 43,630 43,596 47,399 53,755 55,136 56,561
Rate/1,000 pop 0-17*
37 37 40 45 46 47.5
*As more than one referral can be received per child, the number of children is likely to be lower than level of the referrals. **As data from Areas is collated referral figures are subject to revision. In addition the counting of referrals is under review as of Oct 2019 with a view to improve and standardise the approach across all areas. Source: Tusla Q1 2020 Service Performance Report
5 https://www.cso.ie/en/releasesandpublications/ep/p-plfp/populationandlabourforceprojections2017-2051/populationprojectionsresults/

24
A further indication of service demand is the total number of children in care as measured by
Tusla. There were 5,985 children in care at the end of 2019, about five for every 1,000 children
under 18 years. This figure includes Separated Children Seeking Asylum. The majority of
children in care (91%) are in foster care, with more than a quarter (26%) in care with relatives.
The data, in Table 3, indicates the total number of children in care was 3% lower at end 2019
than at end 2011.
Table 3: Total Number of Children in Care, 2011-2019
2011 2012 2013 2014 2015 2016 2017 2018 2019
No. of Children in Care+
6,160 6,332 6,469 6,454 6,384 6,267 6,196 6,041 5,985
+ Data on children in care pre 2014 includes children in respite care, data on children post 2016 includes
Separated Children Seeking Asylum Source: data.tusla.ie
Early Years: Care & Education
Figure 4: Projected Thematic Breakdown of Expenditure on ELC & SAC Programmes and
Initiatives in 2020
€638m was allocated to Early Years programmes and initiatives in 2020, representing an
increase of €377m in funding since 2015. The majority of this funding is allocated to ELC
beneficiary schemes and front line services (85%), including the Early Childhood Care and
Education scheme (€297m), the National Childcare Scheme (€207m), and also front-line Early
Years Specialists.
The remainder provides for overall administration costs and development costs associated
with the National Childcare Scheme (7%), quality and Capital measures (5%), and various
other initiatives (3%).
85%
5%7% 3%
Beneficiary/Front Line
Quality and Capital
Admin & NCS Development
Other Initiatives

25
This 144% funding increase over the past five years supported initiatives to further the
provision of affordable, accessible and quality childcare. It has also enabled a significant
increase in the number of children availing of the two largest beneficiary schemes - ECCE and
CCS. From November 2020 the CCS has been provided for from the funding allocation of the
National Childcare Scheme.
Figure 5: Unique ECCE Registrations 2014-2019, Annual vs Base (2014/2015)
Figure 5 above demonstrates that unique ECCE registrations grew by c. 50,000 (61%) between
the programme years 2014/2015 and 2019/2020 (current programme year). This
corresponded to an increase of €135m (83%) to this programme’s allocation, which also
provided for a 7% increase to the ECCE capitation rates in 2018 and the introduction of various
accessibility/eligibility measures.
Registrations peaked in programme year 2016/17 following changes to eligibility criteria,
which allowed children to begin pre-school from the age of three years. This accessibility
measure was further extended in 2018, with availability of the ECCE programme extended to
children over 2 years and 8 months, for a full two programme years (76 weeks).
ECCE registrations subsequently fell by c. 12,500 (11%), from the end of the 2016/17
programme year to the 2018/19 programme year. This reduction is primarily attributable to:
(i) the reintroduction of a single entry point reducing enrolments (although the number of
weeks children availed of increased) and (ii) a number of ECCE eligible children enrolling on
other DCYA schemes.
It should also be noted that registration data for the 2019/2020 programme year has been
taken from 12th March 2020, prior to the closure of ELC and SAC service providers in response
to the developing COVID-19 pandemic. ECCE registrations would ordinarily have increased
from this point to the end of the academic year, and therefore uptake figures for the
2018/2019 and 2019/2020 programme years are currently not directly comparable.
66,761 73,964
120,736 117,152108,198 105,950
+11%
+81%
+75%
+61% 59%
0%
10%
20%
30%
40%
50%
60%
70%
80%
90%
0
20,000
40,000
60,000
80,000
100,000
120,000
140,000
2014/15 2015/16 2016/17 2017/18 2018/2019 2019/20 (Mar. 12)
Un
iqu
e R
egis
trat
ion
s
% C
han
ge v
s B
ase
Unique ECCE Registrations

26
Figure 6: Unique CCS/P/RT Registrations 2014-2019, Annual vs Base (2014/2015)
Under the Community Childcare Subvention (CCS) Programme, disadvantaged parents and
parents in training, education or low-paid employment can avail of childcare at reduced rates.
The scheme comprises a number of elements, including CCS, CCSP (Plus), and CCSU
(Universal). Targeted programmes, including the CCS, were replaced by the new National
Childcare Scheme in Q4 2019. As a result of Budget 2020, children that were on these schemes
prior to the introduction of NCS will now be able to stay on those schemes beyond August
2020 or swap to the NCS, depending on whichever will benefit them most. These registrations
are known as ‘Savers.’ Data within Figure 6 for the 2019/2020 programme year therefore
pertains to both NCS and ‘Savers’ registrations, taken in March 2020 immediately prior to the
closure of ELC and SAC services due to COVID-19.
Overall CCS registrations increased by c. 23,000 (90%) in the period from the end of the
2016/17 academic year to the 2018/19 academic year, following a comparatively stable trend
over 2014 to 2016. This increase was driven by significant changes introduced in September
of 2017. Specifically, a new universal subsidy (CCSU) was introduced for children under 3 in
early learning and care settings, while subsidies under the targeted elements of CCS were
increased significantly. These changes were accompanied by a public information campaign,
which generated further public awareness and demand for those schemes.
Registrations increased by a further c. 5,800 between programme year 2018/19 and the
March data point for programme year 2019/2020. As noted previously, registrations would
ordinarily have increased further from March 2020 until the end of the 2019/20 programme
year.
23,716 25,010 25,406
34,683
48,44354,315
+5% +7%
+46%
+78%
129%
0%
20%
40%
60%
80%
100%
120%
140%
0
10,000
20,000
30,000
40,000
50,000
60,000
2014/15 2015/16 2016/17 2017/18 2018/2019 2019/20(Mar. 12)
Un
iqu
e R
egis
trat
ion
s
% C
han
ge v
s B
ase
Unique CCS/P/RT Registrations % Change vs 2014/15 Base

27
BREXIT
At present, no significant financial implications for Vote 40 are foreseen as a consequence of
Brexit.
COVID 19
The DCYA Estimate for 2020 will be adjusted to reflect expected Covid-related spending and
the reallocation of resources on the Vote to meet these costs.
The Gross allocation has increased by €3m to take account of DCYA-related spending under
the Stability Fund, funded by Dormant Accounts. The nett allocation remains the same.
Within the Vote, 8m will be re-allocated from the existing Early Years provision to Tusla is
respect of additional Covid-related costs. This includes additional staffing costs, supports
through provision of additional grant funding required by Voluntary Agencies, estimated
expenditure on PPE and additional cleaning costs, additional expenditure regarding Private
Residential Provision and ICT development of a number of Covid-related apps.
€109.5m will be re-allocated within the Vote to meet certain approved Covid-related Early
Years costs: the Temporary Wage Subsidy Childcare Scheme, the Reopening Grant and the
Reopening Capital Grant.
These additional costs will be met by an under spend in Early Years schemes, which were
suspended in March 2020.
The Vote’s split of current and capital will also be affected, with €38m now allocated to capital
compared to €31m previously, arising from the Reopening Capital Grant.
Other Future Policy Challenges
In terms of future policy challenges, there are a number of areas relevant to the Children and
Youth Affairs Vote including demographics and policy direction/implementation.
Demographic
Demographic pressure will likely moderate over the medium/long term. However, it is
unclear how the relative level of service demand as a proportion of the population will trend
in the future.
Policy decisions taken within the childcare space have had significant expenditure
implications. The resources provided to the Department of Children and Youth Affairs
facilitate continued improvements in the affordability, accessibility and quality of childcare
and reflect Government commitments in this area.
First 5
First 5: A Whole-of-Government Strategy for Babies, Young Children and their Families was
published in November 2018. First 5 is a ten-year plan across all aspects of children’s lives to

28
help ensure positive early experiences. First 5 provides a framework to improve the lives of
babies, young children and their families consisting of four goals: Strong and supportive
families and communities; Optimum physical and mental health; Positive, play-based early
learning; and An effective early childhood system.
Legislation
Legislative reform and other changes in the regulatory environment can also impact on
funding requirements. For example, the implementation of the requirements of the Children
First Act, 2017 and the enactment of the provisions of the Adoption (Information and Tracing)
Bill will necessitate a robust response from Tusla and the Adoption Authority of Ireland within
the overall framework in which they operate in the provision of services to children, young
people and their families.

29
Communications, Climate Action & Environment Aíne Mannion, Ronan Nestor and Josh Lernihan
Summary
o Exchequer expenditure has increased from €500m in 2010 to €587m in 2019 -
although annual expenditure over the period cannot be compared on a like-for-like
basis due to a number of changes to Departmental functions.
o The Department accounts for approximately 1% of overall gross Government
expenditure in 2019.
o Expenditure relates to a number of sectoral areas (which have been varied over the
years via Transfers of Departmental Functions).
o Capital programmes under the Energy subhead continue to be the primary drivers of
increased expenditure in this period.
o Forecasted increases in capital expenditure for Energy Efficiency programmes and the
National Broadband Plan under the National Development Plan will continue to drive
increases in the Department’s expenditure into the future.
o However, restrictions introduced in response to the COVID-19 pandemic have resulted
in significant underspending on these projects in 2020 to date. The pandemic has also
resulted in the reallocation of funding within Vote 29 to the Trading Online Voucher
scheme.
2019 Gross Exchequer expenditure of the Department at €587m is less than 1% of overall
Government expenditure.
It should be noted that the Environment and Waste Management programme area, with a
2019 gross spend of €61.6m, was added to the functions of the Department in 2016, and that
as such, the total expenditure from 2010 to 2019 depicted in Figure 1 below does not show a
like-for-like trend over the period.

30
Figure 1: Communications, Climate Action and Environment – Gross Expenditure (€m),
2010 – 2019
Current Expenditure
Current expenditure on the Vote is skewed by the ‘pass-through’ nature of TV Licence Fee
revenue, which represented 59% of the total gross current expenditure in 2019. These
revenues enter the Vote through Appropriations-in-Aid and are simultaneously allocated out
to RTÉ, the Broadcasting Fund and An Post (as collection agent) under the Broadcasting
Programme. TV Licence Fee revenues typically represent approximately 86% of the
Broadcasting Current Expenditure, with the remainder comprised primarily of grant funding
to TG4 (approximately 13.5%) and a small proportion on Departmental administration
(approximately 0.5%).
Outside of the TV Licence Fee receipts and Administration expenditure, the largest portions
of current expenditure continue to be represented by grant funding to TG4 and by funding to
the exchequer-funded Non-Commercial State Bodies: Sustainable Energy Authority of Ireland
(SEAI), Inland Fisheries Ireland (IFI), and the Environmental Protection Agency (EPA).
0
100
200
300
400
500
600
700
2010 2011 2012 2013 2014 2015 2016 2017 2018 2019
€m
Capital Current

31
Figure 2: Communications, Climate Action and Environment – Gross Current Expenditure
by Function (€m), 2010 – 20196
Capital Expenditure
Over the period 2010 to 2019, Energy expenditure has consistently accounted for the majority
of the total Capital expenditure on Vote 29, ranging from 80% in 2011 to 55% in 2017. This
spending is primarily directed toward the Better Energy Programme, the energy efficiency
upgrade scheme operated by the SEAI.
6 Retired expenditure represented for 2010 relates to Administration expenditure for all Department programmes. In 2011, the Administration Programme was split, with the relevant Administration expenditure allocated under each programme subhead.
226
7 13 11 11 8 9 11 11
254243
242 241 238 238 238 245 250 258
2119
21 22 20 20 2022
283110
918 16 15 20 9
910
102726 28 27 27 27
2727
3031
2528
3235
0
50
100
150
200
250
300
350
400
2010 2011 2012 2013 2014 2015 2016 2017 2018 2019
€m
A - COMMUNICATIONS B - BROADCASTING
C - ENERGY D - NATURAL RESOURCES
E - INLAND FISHERIES F - ENVIRONMENT & WASTE MANAGEMENT
- RETIRED EXPENDITURE

32
Figure 3: Communications, Climate Action and Environment – Gross Capital Expenditure
by Function (€m), 2010 – 2019
Figure 4: Sustainable Energy Programmes - Gross Expenditure 2019
56
14 10 935
17 11 22 17 14
2
4 1 1
2
1 39
3 2
96
98
7053
66
56 66
89125
154
9
7
7
7
9
10 11
16
11
11
18
23
32
26
0
50
100
150
200
250
2010 2011 2012 2013 2014 2015 2016 2017 2018 2019
€m
A - COMMUNICATIONS B - BROADCASTING
C - ENERGY D - NATURAL RESOURCES
E - INLAND FISHERIES F - ENVIRONMENT & WASTE MANAGEMENT
- RETIRED EXPENDITURE
1. Better Energy Warmer Homes 2. Better Energy Homes
3. Electric Vehicles - Purchase Grants 4. Better Energy Communities
5. Exemplar Projects Technical Assistance 6. Better Energy Warmth & Wellbeing
7. Deep Retrofit Pilot 8. Solar PV Capital
9. Industrial Engagement (EXCEED) 10. SME Energy Efficiency
11. Electric Vehicles - Home Charger Programme 12. Public Sector Energy Efficiency Support
13. Retrofit Programme 14. Support Scheme for Renewable Heat
15. Other (€4.3m)

33
Non-Commercial State Bodies Expenditure
Under the Capital Plan 2016-21 and subsequently the National Development Plan (NDP) 2018-
27, a significant ramping up of capital expenditure on energy efficiency schemes has been
planned. As a result, from 2016 to 2019, Exchequer funding to the SEAI has increased by
approximately 124%.
Figure 5: Gross DCCAE Funding of Non-Commercial State Bodies under the aegis - SEAI, IFI,
EPA, & DHDA, 2016-19
*Figure for EPA expenditure only represents portion of funding received from DCCAE (Vote 29). This figure does
not include portion of Exchequer funding EPA receives from either DHPLG (Vote 34) or the Environment Fund.
Government commitments to the National Broadband Plan and climate change measures
continue to account for a significant amount of expenditure.
Sustainable Energy Programmes
As detailed above, Energy expenditure is consistently the largest area of Capital expenditure
for Vote 29, and an average 70-80% of that annual expenditure has gone toward the
Sustainable Energy Programmes subhead over this period.
0.0
20.0
40.0
60.0
80.0
100.0
120.0
140.0
160.0
180.0
200.0
SEAI IFI EPA* DHDA
€m
2016 2017 2018 2019
34
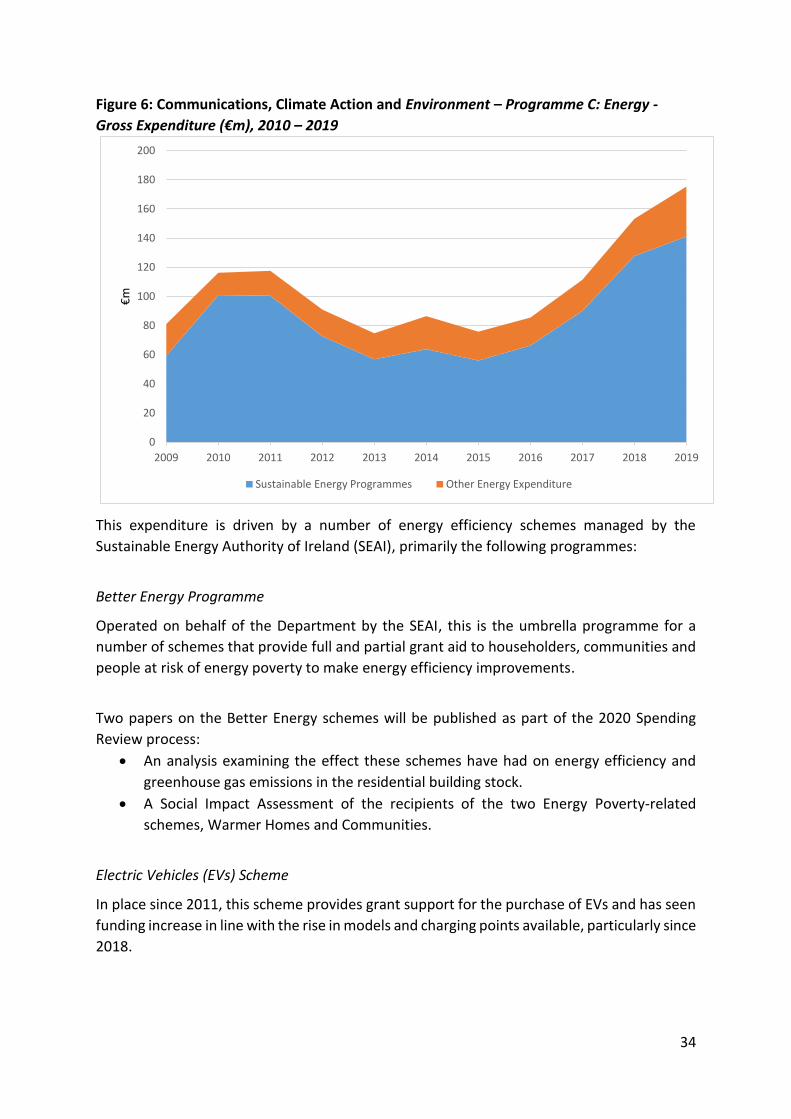
Figure 6: Communications, Climate Action and Environment – Programme C: Energy -
Gross Expenditure (€m), 2010 – 2019
This expenditure is driven by a number of energy efficiency schemes managed by the
Sustainable Energy Authority of Ireland (SEAI), primarily the following programmes:
Better Energy Programme
Operated on behalf of the Department by the SEAI, this is the umbrella programme for a
number of schemes that provide full and partial grant aid to householders, communities and
people at risk of energy poverty to make energy efficiency improvements.
Two papers on the Better Energy schemes will be published as part of the 2020 Spending
Review process:
An analysis examining the effect these schemes have had on energy efficiency and
greenhouse gas emissions in the residential building stock.
A Social Impact Assessment of the recipients of the two Energy Poverty-related
schemes, Warmer Homes and Communities.
Electric Vehicles (EVs) Scheme
In place since 2011, this scheme provides grant support for the purchase of EVs and has seen
funding increase in line with the rise in models and charging points available, particularly since
2018.
0
20
40
60
80
100
120
140
160
180
200
2009 2010 2011 2012 2013 2014 2015 2016 2017 2018 2019
€m
Sustainable Energy Programmes Other Energy Expenditure

35
Figure 7: Gross Expenditure on Electric Vehicles, 2011-2019
An analysis of incentives for the EV Scheme was published as part of the 2019 Spending
Review process. It found that Ireland’s current range of financial incentives are among the
most generous in the world and concluded that it would be extremely costly to maintain the
current range of financial incentives over the medium term.
Funding for the scheme doubled between 2018 and 2019, and in 2020 was increased further
to €36.6m. While the number of EV registrations up to end-March 2020 were 15.6% ahead of
the same period for 2019, in April and May 2020 they were down 46% for the same period as
a result of COVID-19.7 It is expected that the outlay on this scheme will be curtailed by COVID-
19 and the resulting economic impact.
Under the National Development Plan (NDP) (2018-27), a significant ‘ramping up’ of
expenditure is envisioned for Energy capital expenditure, amounting to approximately
€5.5bn.
Broadband
Under the Capital Plan (2016-21) and NDP (2018-2027), a steady increase in funding for the
National Broadband Plan (NBP) from 2016 onwards was anticipated to provide early funding
for the preliminary stages of development, before the full scale roll-out once tendering for
the project was complete. However, delays to the tendering process prevented the
deployment from commencing, resulting in a consistent underspend of allocations.
7 CSO Statbank, Vehicle Licensing Statistics Monthly Series, TEM12: New Vehicles Licensed for the First Time by Type of Vehicle Registration, Type of Fuel and Month
0
5
10
15
20
25
2011 2012 2013 2014 2015 2016 2017 2018 2019
€m

36
Figure 8: Capital Provision for NBP - Capital Plan (2016-21) & NDP (2018-27)
2016 2017 2018 2019 2020 2021 2022 2023
Subsidy (€m)
10 10 30 75 75 75 90 90
Figure 9: National Broadband Plan Expenditure 2013-2019
Year Expenditure (€) REV Allocation (€)
2013 394,507 500,000
2014 681,327 1,388,000
2015 2,978,464 4,100,000
2016 2,345,659 10,000,000
2017 €10,050,428 15,000,000
2018 8,330,653 15,000,000
2019 €6,131,959 60,000,000
Prior to the signing of the tender contracts in November 2019, expenditure on the NBP has
been directed toward technical support, network design, and consultation/advice on
corporate, economic, legal and environmental matters. As the contract for the NBP was
signed, it was anticipated that expenditure would increase significantly to match the allocated
amounts. However, a further underspend is now expected for 2020 primarily due to the
following factors:
A change in the treatment of VAT on subsidy payments, as determined by the Revenue
Commissioners, resulting in VAT no longer being included in the spend forecast.
Project costs incurred by National Broadband Ireland (NBI), the consortium appointed
to implement the National Broadband Plan, have been less than forecasted to date.
COVID-19 has impacted operations and the level of progress expected, which will
result in costs not incurred this year falling into subsequent years.
COVID-19
Already in 2020, the COVID-19 pandemic has had a significant impact on the drivers of expenditure on Vote 29. Social distancing measures and restrictions on economic activity during the lockdown have curtailed activity. As a result capital spending on a number of large projects, such as the NBP and the SEAI Energy Efficiency grants, has fallen behind the expected levels of expenditure. It has also led to a sudden, unexpected demand on the Trading Online Voucher. It is expected that COVID-19 will continue to impact on DCCAE policy goals and expenditure, in the following ways:
Trading Online Voucher (TOV) Scheme

37
The TOV scheme assists small businesses to trade online by providing grants, skills training and mentoring. It is funded by DCCAE and delivered in partnership with Enterprise Ireland and the Local Enterprise Offices. With the temporary closure of many non-essential services due to the lockdown, the ability to trade online became vitally important for small businesses. As a result, applications to the TOV rose dramatically, with 1,635 grant applications being approved by end-May 2020 (compared to 1,218 in total for 2019) and a further 4,774 applications having been received. Due to this rise in demand, DCCAE moved to reallocate funding from within their Vote to the scheme, both in April and in June. Furthermore, the Department of Business, Enterprise and Innovation began joint-funding the scheme, and the rules were also amended on a temporary basis, reducing the amount of co-funding required from businesses and allowing second applications from previously successful applicants.
Utility Companies
The COVID-19 enforced restrictions has had an indirect impact on EirGrid and ESB, as electricity demand has fallen sharply. In response to the lockdown, the Commission for the Regulation of Utilities (CRU) introduced a temporary moratorium on domestic electricity and gas disconnections and increased emergency credit levels for all gas prepayment customers. Furthermore, for non-domestic customers, a Supply Suspension Scheme was also introduced to give small and medium businesses a temporary exemption from energy or network charges. While these measures, and the possibility of consumers struggling to pay electricity bills in an economic downturn, are expected to impact the income of both EirGrid and ESB in 2020 and beyond, both bodies have signalled their ability to adapt to this unexpected shortfall.
Broadcasting
In response to the impact of this fall in advertising revenue on independent commercial radio stations, €2.5m unallocated from the Sound and Vision Scheme was available for such stations, while the broadcasting levy, with an estimated total of €1m, was also suspended. As with most media outlets, RTÉ’s commercial income has been significantly impacted by the reduction in advertising revenue resulting from the adverse economic conditions. However, licence fee receipts have also been adversely affected, further compounding the reduction in revenue. An interdepartmental working group was established in 2018 to examine the Future Funding of Public Service Broadcasting. This group recommended amending the funding model of Public Service Broadcasting by introducing a Broadcasting Charge. However, this group recognised that such a charge would be a medium-term solution, and that a shorter-term response to the funding shortfall, at RTÉ in particular, would be to target savings and increased compliance by tendering the collection of TV licence fees. Following this review, a Commission on the Future of the Irish Media was established by Government in December 2019 to make recommendations on RTÉ’s role, financing and structure within a
38
sustainable funding framework that delivers value for money to the public. Furthermore, RTÉ published a strategy in November 2019 to address the long term decline in advertising revenues by reorienting both its content and cost base, However, the immediate impact of COVID-19 is expected to pose a further challenge to these aims by exacerbating the issue of funding for Public Service Broadcasting in the short term.
Climate Change
The Programme for Government commits Ireland to an ambitious target of reducing greenhouse gas emissions by an average of 7% a year to 2030. Achieving this target will require every sector to contribute to meeting this target, through the implementation of the actions outlined in the Programme for Government and Climate Action Plan. It will also require the development of new policies, underpinned by robust evidence and the continued development of research and modelling architecture by the Department.
Energy
The goal of Irish energy policy is to facilitate a transition to a low carbon energy system, which provides secure supplies of competitive energy to citizens. This will be achieved by ensuring the renewable energy represents a 34% share of all energy consumption by 2030, with 70% of electricity provided from renewable sources. Renewable energy use in 2020 is likely to reach 12.8%, demonstrating the scale of the challenge facing energy policy over the decade. A failure to achieve this target, or periodic milestones on the path towards it, will give rise to additional compliance costs in line with the rules governing the EU Energy Union.

39
Culture, Heritage & the Gaeltacht Paul Kilkenny and Tina Hayes
Summary
o Vote 33 is comprised of four programme areas: Culture; Heritage; Irish Language, Gaeltacht and Islands and North-South Co-operation.
o Total voted expenditure by the Department of Culture, Heritage and the Gaeltacht amounted to €3,077m from 2010 to 2019. In 2019, total voted expenditure amounted to €335m, an 11% increase on the 2018 allocation.
o The Culture programme has been the largest component of spending for the Department in recent years, reaching a ten year high point of €183.5m in 2019.
o The Culture, Heritage and the Gaeltacht group has represented 0.54% of total voted expenditure over the last 10 years.
Figure 1: Vote 33 Long Term Trends 2010-2019, €m 8
8 Note: The configuration of the Department has changed a number of times during the period 2009 to 2018 and the expenditure shown
above includes all programme expenditure across every iteration e.g. expenditure on sport, tourism, regional and rural affairs, etc. which
are no longer associated with the Department.
339
214 224 215 203 216247 236 248 265
111
54 42 41 5461
121
63 5470
0
50
100
150
200
250
300
350
400
450
500
2010 2011 2012 2013 2014 2015 2016 2017 2018 2019
Current Capital

40
o The structure of the Department has changed in line with Government priorities. For
example, over the past decade the arts function has been within the following
Departments: Department of Arts, Sports and Tourism (2002-2010), Department of
Tourism, Culture and Sport (2010-2011), Department of Arts, Heritage and the
Gaeltacht (2011-2016), Department of Arts, Heritage, Regional, Rural and Gaeltacht
Affairs (2016-2017) and Department of Culture, Heritage and the Gaeltacht (2017
onwards).
Figure 2: Vote 33 Agency Expenditure 2011-2019, €m
o There are 13 agencies under the aegis of the Department: the Arts Council; Chester
Beatty Library; Crawford Gallery; An Foras Teanga; Heritage Council; Screen Ireland;
Irish Museum of Modern Art; National Concert Hall; National Gallery of Ireland;
National Museum of Ireland; National Library of Ireland; Údarás na Gaeltachta; and
Waterways Ireland.
o Total agency expenditure on the Vote from 2011-2019 was €1,657m. In 2019 total
Agency Expenditure amounted to€208m.
573
225173
148121 115
82 65 49 4824 23 12
-
100
200
300
400
500
600
700

41
Figure 3: Vote 33 Total Agency Expenditure 2011-2019, €000s
o The Arts Council incurred the largest agency spend on the Vote totalling €573m from
2011-2019, representing 35% of the overall agency voted expenditure of €1.66bn for
the Department over this period.
o Agency expenditure has increased year on year from 2014. Agency expenditure was
€169m in 2014, increasing by 23% to €208m in 2019.
0
50,000
100,000
150,000
200,000
250,000
2011 2012 2013 2014 2015 2016 2017 2018 2019
Waterways Ireland National Museum of Ireland National Gallery of Ireland
National Library of Ireland Irish Museum of Modern Art Údarás na Gaeltachta
An Foras Teanga National Concert Hall Arts Council
Chester Beatty Library Screen Ireland Heritage Council
Crawford Gallery

42
Figure 4: Vote 33 Current Expenditure by Function 2012-2019, €m9
Figure 5: Vote 33 Capital Expenditure by Function 2012-2019, €m
9 Note: Due to a reconfiguration of programme spending in 2011, expenditure trends are shown from 2012 onward only.
38 36 35 35 36 36 36 36
35 33 32 32 35 36 38 41
38 38 34 32 34 35 37 39
113107
101 116132 130
137148
0
50
100
150
200
250
300
2012 2013 2014 2015 2016 2017 2018 2019
D - NORTH - SOUTH CO-OPERATION C - IRISH LANGUAGE, GAELTACHT AND ISLANDS
B - HERITAGE A - CULTURE
21 1828
3641
29 2635
8 10
14
11
14
1612
16
9 8
8
10
19
12
10
13
5 4
4
4
6
6
5
5
0
10
20
30
40
50
60
70
80
90
2012 2013 2014 2015 2016 2017 2018 2019
A - CULTURE B - HERITAGE
C - IRISH LANGUAGE, GAELTACHT AND ISLANDS D - NORTH - SOUTH CO-OPERATION
43
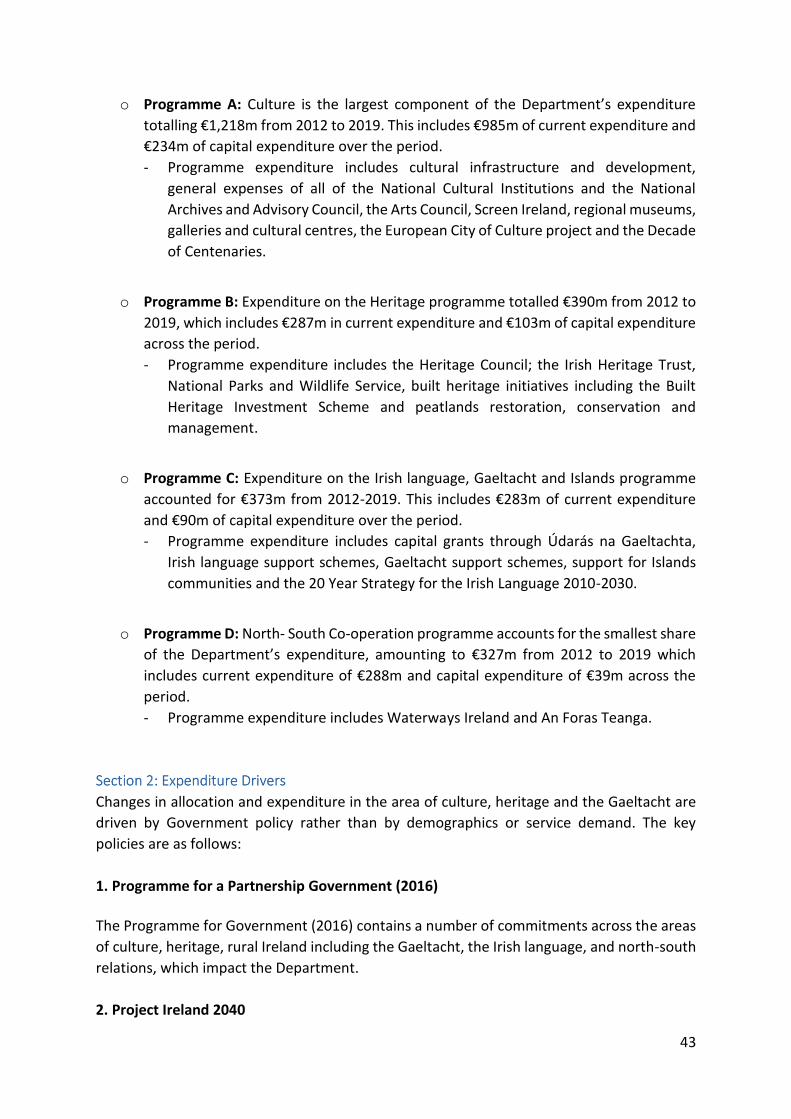
o Programme A: Culture is the largest component of the Department’s expenditure
totalling €1,218m from 2012 to 2019. This includes €985m of current expenditure and
€234m of capital expenditure over the period.
- Programme expenditure includes cultural infrastructure and development,
general expenses of all of the National Cultural Institutions and the National
Archives and Advisory Council, the Arts Council, Screen Ireland, regional museums,
galleries and cultural centres, the European City of Culture project and the Decade
of Centenaries.
o Programme B: Expenditure on the Heritage programme totalled €390m from 2012 to
2019, which includes €287m in current expenditure and €103m of capital expenditure
across the period.
- Programme expenditure includes the Heritage Council; the Irish Heritage Trust,
National Parks and Wildlife Service, built heritage initiatives including the Built
Heritage Investment Scheme and peatlands restoration, conservation and
management.
o Programme C: Expenditure on the Irish language, Gaeltacht and Islands programme
accounted for €373m from 2012-2019. This includes €283m of current expenditure
and €90m of capital expenditure over the period.
- Programme expenditure includes capital grants through Údarás na Gaeltachta,
Irish language support schemes, Gaeltacht support schemes, support for Islands
communities and the 20 Year Strategy for the Irish Language 2010-2030.
o Programme D: North- South Co-operation programme accounts for the smallest share
of the Department’s expenditure, amounting to €327m from 2012 to 2019 which
includes current expenditure of €288m and capital expenditure of €39m across the
period.
- Programme expenditure includes Waterways Ireland and An Foras Teanga.
Changes in allocation and expenditure in the area of culture, heritage and the Gaeltacht are
driven by Government policy rather than by demographics or service demand. The key
policies are as follows:
1. Programme for a Partnership Government (2016)
The Programme for Government (2016) contains a number of commitments across the areas
of culture, heritage, rural Ireland including the Gaeltacht, the Irish language, and north-south
relations, which impact the Department.
2. Project Ireland 2040

44
Culture, heritage and sport is one of the ten Strategic Investment Priorities in the National
Development Plan, 2018-2027 and total funding in the area is in excess of €1bn over the
lifetime of the Plan. Areas of investment will include the National Cultural Institutions
(€460m), national heritage, regional arts and culture facilities, digitisation of national
collections, Galway European City of Culture, the restoration of Ulster Canal and investment
in waterways and related infrastructure, and investment in media production and the audio
visual industry.
3. Creative Ireland (2017-2022)
Launched in 2017, Creative Ireland is the main implementation vehicle for the priorities
identified in Culture 2025 - Éire Ildánach, Ireland's first Framework National Cultural Policy,
currently in draft format. It is a five year initiative to put creativity at the centre of public
policy and support and enable participation in creative activities.
4. 20 Year Strategy for the Irish Language 2010-2030
Policy in this area is to increase, on an incremental basis, the use and knowledge of Irish as a
community language. It commits to the development of a bilingual society, while recognising
the policy focus of maintaining the linguistic identity of the Gaeltacht community.
5. Realising our Rural Potential: Action Plan for Rural Development
Despite the transfer of the Regional Development and Rural Affairs programme to the
Department of Rural and Community Development in 2017, the Action Plan for Rural
Development, still impacts on the Department with regards to Údarás na Gaeltachta. The plan
contains over 270 actions and aims to ensure that people who live in rural areas have
increased opportunities for employment locally and access to public services and social
networks that support a high quality of life.
6. National Biodiversity Action Plan,
Ireland's vision for biodiversity is that biodiversity and ecosystems are conserved and
restored, delivering benefits essential for all sectors of society and that Ireland contributes to
efforts to halt the loss of biodiversity and the degradation of ecosystems in the EU and
globally. The Plan captures the objectives, targets and actions for biodiversity that will be
undertaken by a wide range of government bodie, civil society and the private sector to
achieve Ireland’s vision for biodiversity.
The Department is developing an adaptation plan for built and archaeological heritage under
the framework of a Departmental advisory group. This plan will build on a background study
commissioned by the Department to assess climate change impacts and has been
commissioned to meet the instruction given by government under the national adaptation
framework. The sectoral climate change adaptation plan, currently under public consultation,

45
identifies goals objectives and actions that will be resourced by the Department through its
implementation phase. Departmental spend on mitigating climate change impact on heritage
will continue.
Summary
While future policy concerns will differ across the distinct functions of the Department, some
challenges continues to exist around measuring and analysing outcomes and benefits
delivered by the programmes in question, as a consequence of the qualitative nature of much
of the work of the Department. As a result, prioritisation both between the programmes and
against other areas of Government expenditure will remain an ongoing challenge.
COVID
Additional funding of €25m is being allocated to the Department in 2020 to address immediate
priorities to assist with the unique challenges faced by artists, arts organisations and culture
workers. €20 million will be allocated to the Arts Council to facilitate new bursaries and
commissions, supports for freelance artists and collaborative projects. €5 million will be
available for other measures including securing the future of key cultural and museum spaces
and facilities throughout the country and the production of high-quality digital art and on-line
performances.
In addition, the Department has reallocated some of its existing allocation for 2020 to address
pressures arising from the sudden closure of a number of its institutions and agencies, with a
view to providing stabilisation supports for the sectors under its remit. These include a €1m
Covid-19 Artists Fund and
€4.7m for Summer Colleges Stabilisation Initiative (SCSI) for Irish Colleges in the Gaeltacht.
Delivery on Project Ireland 2040
The scale of the funding being made available under Project Ireland 2040 is significant for the
Department and delivery of major capital projects and maximising and measuring returns on
investment will be challenging and will require careful planning on the Department’s part.
Funding is in excess of €1 billion for the 10 year capital investment programme investing in our
Culture, Language and Heritage,
In response to this significant increase in funding the Department has established a Project
Ireland 2040 Unit. This unit has responsibility for ensuring a coordinated, programme-approach
to the management of the investment. The Unit also has responsibility for monitoring and
reporting on activity under the programme and supporting compliance with the Public Spending
Code including providing technical assessments and guidance on appraisal and evaluation.

46
Defence Josh Lernihan, Aíne Mannion and Ronan Nestor
Summary
o Defence expenditure is provided for by the Exchequer through two Votes: Vote 35
(Army Pensions) and Vote 36 (Defence) which, together, form the Defence Vote
Group.
o Outcomes for the Defence Vote Group are focused on the high-level goal of the
Defence Organisation: ‘To provide for the military defence of the State, contribute
to national and international peace and security and fulfil all other roles assigned by
Government’.
o Vote 35 funds military pensions and gratuities for retired members of the Defence
Forces and (where applicable) their dependants. Vote 36 funds the capital and
current costs of the Defence Organisation (i.e. the Department of Defence and the
Defence Forces).
o Gross expenditure on the Vote Group reduced from €0.962 billion in 2010 to €0.891
billion in 2013, before increasing to €1.007 billion by 2019.
o Defence Pay and Pensions expenditure accounted for the largest element of annual
spend within the Vote Group, ranging from 74% to 80% within the 2010 to 2019
timeframe.
The Defence Vote Group comprises two Votes: Vote 35 (Army Pensions) and Vote 36
(Defence). Gross expenditure on the Defence Vote Group has increased by 4.7% over the
decade from 2010, and in 2019 amounted to some €1.007 billion.
Between 2010 and 2013, spending on the Vote group fell by some 7.4%, from €0.962 billion
to €0.891 billion, before rising again to €1.007 billion by 2019. Group current expenditure has
risen by 7% from 2015 to 2019, while capital expenditure increased by 55% over the same

47
period, with the majority of the rise between 2018 and 2019 with a year-on-year increase of
€43m noted between 2018 and 2019.
Figure 1: Defence Vote Group Gross Expenditure
Note – from 2015 onwards, military equipment was reclassified as capital expenditure rather than current expenditure
(D/PER Circular 07/14).
Vote 35
Over 99% of expenditure on Vote 35 relates to retirement pensions, gratuities and disability
pensions and as such is non-discretionary. Spending on the Vote has been steadily increasing
over the decade, with a notable increase in 2012. Between the January 2010 introduction of
pay reductions on foot of the Financial Emergency Measures in the Public Interest (FEMPI)
legislation and the expiry of the end-February 2012 FEMPI grace period, some 1,500 military
personnel retired from the Defence Forces10. Some 75% of these leavers retired with
immediate retirement benefits payable immediately on retirement (pension and gratuity). In
2012, most of the unusually high number of c. 600 personnel who exited with immediate
retirement benefits retired in the first two months of that year, with many of them qualifying
for maximum benefits. These factors combined with the knock-on cost of the other ‘pre-
FEMPI’ retirements from 2010-2011 were the primary contributors to the spike in
expenditure in that year. Expenditure in 2019 of €251m represented an increase of 15% over
the decade, and is €7.4m (3%) more than the previous highpoint in 2012. Trends in
expenditure on Vote 35 are shown in Figure 2.
10 DPER and Department of Defence, Defence Forces Pensions Expenditure (2018).
2010 2011 2012 2013 2014 2015 2016 2017 2018 2019
Capital 15 13 8 9 9 89 101 95 95 138
Current 947 914 893 882 889 809 805 825 849 869
0
200
400
600
800
1,000
1,200
€M
Current Capital

48
Figure 2: Vote 35 (Army Pensions) Gross Expenditure, €m
Vote 36
On Vote 36, pay and allowances represent the largest element of annual expenditure,
accounting for €496m (66%) of the 2019 outturn. As with the group trend in current spending
over the period, pay costs fell from 2010 to 2016 during the post-2008 financial crisis, and
have risen steadily from 2016 to 2019. Composition of expenditure is shown in Figure 3.
Figure 3: Vote 36 (Defence) Gross Expenditure, €m11
Note – from 2015 onwards, military equipment was reclassified as capital expenditure rather than current expenditure
(D/PER Circular 07/14).
11 Please note that rounding can affect totals.
2010 2011 2012 2013 2014 2015 2016 2017 2018 2019
Vote 35 (Gross) €'M 218.1 223.3 243.8 223.7 225.7 227.4 234.7 240.0 242.3 251.0
200.0
210.0
220.0
230.0
240.0
250.0
260.0
€M
2010 2011 2012 2013 2014 2015 2016 2017 2018 2019
Capital 15 13 8 9 9 89 101 95 95 138
Non-Pay 208 186 170 166 199 123 116 116 135 123
Pay 521 505 479 492 465 459 454 469 472 496
0
100
200
300
400
500
600
700
800
€M
Pay Non-Pay Capital

49
Current Expenditure
Defence Forces pay and pension costs account for the largest element of annual current
expenditure on the Defence Vote Group over the last ten years, accounting for €747m (74%)
of overall gross expenditure in 2019 (Figure 3).
Figure 4: Defence Vote Group Gross Expenditure by Category 2010-2019, €m
Note – from 2015 onwards, military equipment was reclassified as capital expenditure rather than current expenditure
(D/PER Circular 07/14).
Vote 36 – Pay and Allowances
The pay and allowance costs of serving personnel (i.e. military personnel, civil servants and
civilian employees) make up the majority of expenditure on Vote 36. As with other Votes with
a high proportion of staff costs, wider pay policy is the determinant of pay rates and these are
reflective of increases in the Vote. For instance, in 2019, commitments arising from the Public
Service Stability Agreement 2018-2020 (amounting to c. €6m) and increases in allowances for
the Permanent Defence Force (PDF) arising from the Public Service Pay Commission report
(amounting to c. €2m) required a corresponding increase in expenditure.12
Military numbers have reduced over the last two decades. The military personnel target, or
Establishment, was set at 10,500 in 2000, and reduced to 9,500 in 2012. The White Paper on
Defence (2015), confirmed the Government’s commitment to retain a PDF strength of at least
12 The full-year cost of these increases is c. €10m, comprising: €4.6m for 10% increase in MSA; €4.8m for restoration of allowances cut by HRA; and €0.6m service commitment scheme for pilots.
2010 2011 2012 2013 2014 2015 2016 2017 2018 2019
Pensions 218 223 244 224 226 227 235 240 242 251
Capital 15 13 8 9 9 89 101 95 95 138
Non Pay 208 186 170 166 199 123 116 116 135 123
Pay 521 505 479 492 465 459 454 469 472 496
0
200
400
600
800
1000
1200
€M
Pay Non Pay Capital Pensions

50
9,500 personnel. Personnel numbers at end-May stand at 8,451. There have been a number
of initiatives undertaken to increase recruitment and retention, including increases to pay and
allowances and amendments to legislative provisions to allow for the re-entry into service of
former members of the Permanent Defence Force.
In addition to pay pressures, tasking’s of the Defence Force are often subject to circumstances
outside of the direct control of the Vote, resulting in pressure on allowances. Expenditure on
allowances is largely activity related, and is directly linked to the number of operational
activities undertaken and the rates applicable rather than the number of personnel in the
PDF. This has been the case in relation to recent Aid to the Civil Authority (ATCA) taskings
undertaken in response to the COVID-19 pandemic. Other ATCA roles undertaken over the
past decade include support at National Commemoration Ceremonies, State Visits,
Emergency Flood Relief efforts and Missing Person Searches. The exception to the above is
expenditure on Overseas Allowances, for which costs are determined by, amongst others, the
actual number of personnel serving on overseas peace support missions, the nature of the
mission and the duration of the deployment.13
Domestic security remains primarily the role of the Department of Justice and Equality and
An Garda Siochána, supported as required by the Defence Forces as part of its Aid to the Civil
Power function. Taskings under this function include Central Bank security escorts, high-risk
prisoner escorts, explosive ordnance disposal, search and rescue, fisheries protection, and
Naval diving operations, among other supports.
Vote 35 – Military Pensioners
Military pensions and post-service entitlements of retired members of the Defence Forces are
administered through Vote 3514. In line with public service trends, military pension gross
expenditure has risen from c. €218m in 2010 to c. €251m in 2019, an increase of 15%. Upward
pressure on Vote 35 is largely driven by the turnover of Defence Forces personnel year-on-
year and increased life expectancy more generally. In addition to demographic pressure there
is the distinct nature of military pension expenditure. Like all pension payments, expenditure
on Vote 35 is demand-driven and non-discretionary. However, military pensions differ in
several key respects when compared to other areas of the public service, including an
atypically high incidence of voluntary early retirement – before reaching the mandatory
retirement age – with entitlement to immediate payment of benefits (pension and gratuity).
There has been an acknowledged under-provision for military pensions through Vote 35 in
recent years, resulting in an annual requirement for a Supplementary Estimate largely being
met through identified savings on Vote 36 (Defence) but without impacting on Defence Forces
13 The Defence Vote Section in DPER is currently undertaking a Spending Review on the cost of participation on overseas missions which will provide more detail on these allowances. 14 While the pay of Civil Service staff of the Department of Defence and civilian employee is funded from Vote 36, their superannuation benefits are funded separately from Vote 12 (Superannuation and Retired Allowances). This expenditure does not fall under the Defence Vote Group.

51
operational capabilities. However, it is to be noted that there is no direct financial co-relation
between the two Votes, either in terms of their respective funding requirements / projections
or allocations from year to year. Vote 35 and 36 have very different needs in that regard.
The Army Pensions funding issue has been the subject of some comment by the Comptroller
and Auditor General, and was addressed in the 2018 Spending Review of Defence Forces
Pensions Expenditure (published with Budget 2019). This review recommended that Vote 35
should be allocated resources in line with the cost analysis in the review from 2019 onwards,
to ensure that the full cost can be met. As announced in Budget 2020, some €259 million was
provided to the Army Pensions Vote for 2020, an increase of €10m over the 2019 allocation
of €249m. However, the actual level of funding required by Vote 35 from year to year is
influenced by the demand-led drivers as set out in the Spending Review. The number of
military pensioners at year-end 2019 was 12,688, and a further increase in this number is
projected for 2020.
Figure 5: Military Pensioners, 2010-2019
Capital Expenditure
Capital expenditure on Vote 36 has increased over the period, allowing the Defence
Organisation to undertake a programme of sustained equipment replacement and renewal
and infrastructure development, as set out in the Defence White Paper. Major Defence
capital projects are multi annual in nature and expenditure can span a number of years.
Defence capital expenditure broadly encompasses spending on Defence Forces Capability
Development, Defence Forces Built Infrastructure, Defence Forces Transport and Defence
Forces Communication and Information Technology platforms.
The National Development Plan provided for a €541m Expenditure Ceiling for the Defence
Vote Group for 2018-22, broken down as follows:
11,322
11,563
11,974 11,994 12,03212,128
12,23412,370
12,483
12,688
10,500
11,000
11,500
12,000
12,500
13,000
2010 2011 2012 2013 2014 2015 2016 2017 2018 2019
No
. of
mili
tary
pen
sio
ner
s

52
2018 2019 2020 2021 2022
€77m €106m €113m €120m €125m
Outturn on Defence capital expenditure was some €138m in 2019. The 2015 White Paper on
Defence sets out capital priorities for D/Defence over the short to medium term, and these
may be considered the main drivers on capital expenditure on the Vote. In addition, a five
year Equipment Development Plan for the Defence Forces, announced in June 2020, provides
a comprehensive list of planned equipment projects due to be progressed over the next five
years.15
Priority ongoing Defence capital expenditure programmes / projects include:
Maritime Patrol Aircraft programme;
Air Corp Fixed Wing Utility Aircraft Project;
Armoured Personnel Carrier Mid-Life Upgrade and Maintenance Programme;
Defence Forces 4x4 Vehicle Replacement Programme; and
Naval Service Vessel Mid-Life Refit.
It is worth noting also that a five-year Infrastructure Plan was also published in January 2020.
This Defence Forces Infrastructural programme will implement the policy approach contained
in the White Paper on Defence to enhance Defence physical infrastructure and
accommodation as an important component of defence capability.
15 The Equipment Development Plan is available at https://www.gov.ie/en/publication/9bd58-equipment-development-plan/

53
1. COVID-19
The collective response to COVID-19 involved Defence Forces personnel, members of the
Reserve, Civil Defence volunteers, Civil Servants and Civilian Employees within the
Department. A Defence Forces taskforce was set up to deal with elements of the Defence
response to the health crisis from a number of State bodies and agencies – most visibly in
contact tracing, testing, patient and equipment transport, and logistics on behalf of the HSE
and the National Ambulance Service. The Civil Defence have also been tasked with
ambulance, support, and transport tasks.
The full impact of COVID 19 on Defence financial resources is not yet fully known, with the
final cost likely to be influenced both by the length of the crisis and the type of roles to
which the Defence Force are tasked by other bodies. As the crisis evolves, the level of
involvement of personnel in operations will influence on expenditure levels.
2. Vote 35 – Military Pensioners
The trajectories of (i) Exchequer spending on military pensions and (ii) the proportion of
this area to overall Irish defence expenditure have both steadily grown over the last two
decades. Among other reasons, including demographic factors, military pensioner numbers
have consistently increased over the last decade, and are projected to continue to do so in
the short to medium term. As noted above, military pension’s expenditure is demand
driven and by its nature has a higher incidence of voluntary early retirement leading to
associated immediate entitlement to benefits. This can present difficulties in making
accurate projections of retirees in any given year.
3. Vote 36 – EU & Brexit
Among other developments at EU Level, the EU Commission has proposed a new regulation
establishing the European Defence Fund (EDF) under the 2021-2027 Multiannual Financial
Framework (MFF). In addition, there is also a proposal for a new European Peace Facility
outside of the Union's multi-annual budget, which would run concurrently to the MFF. If
these Funds are established with the budgets as proposed, this could have significant cost
implications for the Irish Exchequer, which may impact on the Defence Vote.
With regard to Brexit, the precise security implications remain hard to predict at this point,
albeit that the overall setting in which security resides may be adversely impacted.

54
Education & Skills Jonathan Morris and Alan Dunne
Summary
o From 2009 to 2019, Education and Skills expenditure experienced both a decline
and rise. From 2009 to 2013 expenditure decreased from €9.7 billion to €8.8 billion
before steadily increasing to €10.9 billion in 2019.
o As a portion of total government expenditure, Education and Skills is the third
largest and has remained relatively stable as a percentage of total government
expenditure at around 16.0% to 16.6%.
o The scale and composition of expenditure on Education and Skills has changed over
time due to a variety of factors including demographics, increase in special needs
education, the economic downturn following the 2008 Financial Crisis, need for
capital investment and the transfer of functions in the further education sector.
o The largest element of Department of Education and Skills expenditure is pay and
pensions, which is estimated to account for 72% of overall DES expenditure in 2019.
o First, Second & Early Years Education saw the largest increase over the ten year
period of 19% (€1.3 billion increase) while Higher Education saw a decrease in
expenditure over the same period of €15 million (1%).
o In 2019, Special Education Needs’ gross current allocation (€1.87 billion) was just
below that of Higher Education (€1.89 billion).
o There are a number of challenges facing the Education sector over the short and
long term. The most fundamental of these being managing the demographic shift
from primary to post primary level, as well as the future demographic changes,
delivering reforms in the special needs education and school transport, expected
growth in superannuation costs, higher participation rates and funding pressures in
the Higher Education Sector. Also, in the Tertiary Education sector there is a need
to ensure that both the higher education and further education and training sectors
are optimally configured to meet the skills needs of the labour market. From 2020,
a number of these functions will be a matter for the newly established Department
of Further and Higher Education, Research, Innovation and Science.

55
Overall, average annual growth for the period 2010 to 2019 was 1%. However, as Figure 1
shows, expenditure in Education and Skills fell by an average of 3.4% per annum from 2010
to 2013, with an average annual growth of 3.6% from 2014 to 2019. Non-National Training
Fund (NTF) Exchequer expenditure on Education and Skills in 2019 at €10.4 billion was the
largest ever allocation to the sector, an 11% increase from 2010.
Expenditure from the National Training Fund (NTF) also decreased during the period 2010 to
2013 where it fell at an average of 3.5% per annum, with an average annual growth of 6.7%
during the years 2014 – 2019. NTF expenditure was €508 million in 2019, this represents an
increase from 2018 to 2019 of 22%, the largest yearly increase observed over the period, in
part due to decisions to increase the NTF from 0.7% to 0.9%. A further increase in 2020 brings
the rate to 1.0%.
Overall, expenditure for the sector as a whole (Exchequer and NTF) was at its highest level to
date in 2019 at €10.9 billion, some 11.7% higher than in 2010.
Figure 1: DES Expenditure 2010 – 2019, €bn
Source: Department of Public Expenditure & Reform
€-
€2
€4
€6
€8
€10
€12
Bill
ion
s
Education & Skills National Training Fund
€9.7
€10.9
€8.8
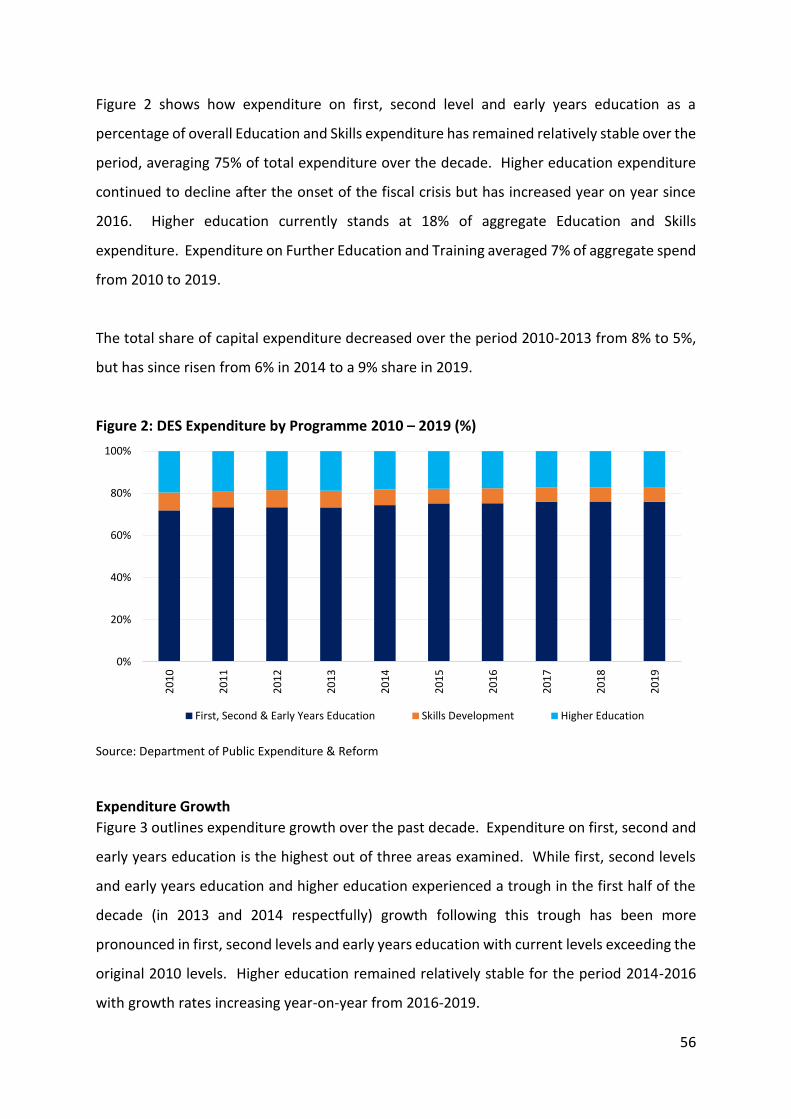
56
Figure 2 shows how expenditure on first, second level and early years education as a
percentage of overall Education and Skills expenditure has remained relatively stable over the
period, averaging 75% of total expenditure over the decade. Higher education expenditure
continued to decline after the onset of the fiscal crisis but has increased year on year since
2016. Higher education currently stands at 18% of aggregate Education and Skills
expenditure. Expenditure on Further Education and Training averaged 7% of aggregate spend
from 2010 to 2019.
The total share of capital expenditure decreased over the period 2010-2013 from 8% to 5%,
but has since risen from 6% in 2014 to a 9% share in 2019.
Figure 2: DES Expenditure by Programme 2010 – 2019 (%)
Source: Department of Public Expenditure & Reform
Expenditure Growth
Figure 3 outlines expenditure growth over the past decade. Expenditure on first, second and
early years education is the highest out of three areas examined. While first, second levels
and early years education and higher education experienced a trough in the first half of the
decade (in 2013 and 2014 respectfully) growth following this trough has been more
pronounced in first, second levels and early years education with current levels exceeding the
original 2010 levels. Higher education remained relatively stable for the period 2014-2016
with growth rates increasing year-on-year from 2016-2019.
0%
20%
40%
60%
80%
100%
20
10
20
11
20
12
20
13
20
14
20
15
20
16
20
17
20
18
20
19
First, Second & Early Years Education Skills Development Higher Education

57
Figure 3: Expenditure Growth 2010 – 2019
Source: Department of Public Expenditure & Reform
Figure 4: DES expenditure as a proportion of total Government expenditure 2019 – 2019
Source: Department of Public Expenditure & Reform
Education represents the third largest element of government expenditure (after Social
Protection & Health). Figure 4 (above) illustrates the ten year trend of Education and Skills
expenditure as a percentage of overall government expenditure. Expenditure in Education
and Skills remain relatively stable over the period from 16.1% in 2010, to 16.2% in 2020.
-€0.2
€0.3
€0.8
€1.3
€1.8
€2.3
€-
€1
€2
€3
€4
€5
€6
€7
€8
€9
Skill
s D
evel
op
men
t an
d H
igh
er E
dcu
atio
nB
illio
ns
Firs
t, S
eco
nd
an
d E
arly
Yea
r's
Edu
cati
on
Bill
ion
s
First, Second & Early Years Education Skills Development Higher Education
15.6%
15.7%
15.8%
15.9%
16.0%
16.1%
16.2%
16.3%
16.4%
16.5%
16.6%
16.7%
16.6% (2015)
16.0% (2012)
16.2% (2020)

58
Expenditure as a proportion of total government expenditure was at its highest during the
period in 2015 at 16.6%.
Figure 5: Gross voted expenditure growth: Three-year intervals 2011 – 2019
Source: Department of Public Expenditure & Reform
Expenditure on education has followed the trend in overall government expenditure as
illustrated in Figure 5 (above). After the onset of the downturn gross education expenditure
fell in line with total government expenditure from 2011 to 2013. From 2013 to 2019
percentage growth of expenditure in education was broadly in line with percentage growth
in government expenditure.
Figure 6 outlines the four components of DES expenditure in 2010, 2015 and end 2019. As
with all other labour intensive frontline public services, such as Health, Defence, Garda, etc.
pay is the single largest element of expenditure in the education sector. The education paybill
at its pre-crisis peak in 2010 stood at €6.5 billion, reducing to €5.3 billion in 2015 before
reaching just over €6.4 billion in 2019, with reduction and restoration pay deals being the
main cause for the fluctuations in paybill over those 10 years. In overall terms, the share of
four expenditure components as a percent of aggregate education expenditure are outlined
in Table 1 below. It is worth noting that between 2015 and 2019 current education
expenditure increased by €1.47 billion, 82% (€1.19 billion) of which was in the first, second
levels and early years area. 39% of this expenditure (€470 million) was special education
-5%
4%
13%
-5%
3%
15%
-20% -15% -10% -5% 0% 5% 10% 15% 20%
2011-2013
2014-2016
2017-2019
Government Eduation & Skills

59
expenditure. Special Education is now 19% of total education current expenditure at €1.9
billion, 90% of which is pay related.
Figure 6: Composition of DES Expenditure, 2010, 2015 and 2019
Source: Department of Public Expenditure & Reform
Table 1: Change in Composition of DES Expenditure (Percentage Share) 2010, 2015 and
2019
2010 2015 2019
Non-pay 23% 22% 20%
Pay 60% 58% 59%
Pensions 10% 13% 13%
Capital 7% 6% 9%
Source: Department of Public Expenditure & Reform
Capital Investment
Figure 7 outlines gross capital expenditure. Examining the years 2010-2019, the annual
expenditure on first, second level and early years has increased to €796 million while third
level has increased to €131 million. Following the outcome of the review of the Capital Plan
in mid-2017, an additional €663 million was provided for the Education Sector for 2018-2021.
This is in addition to nearly €3 billion already provided for the sector for those years under
€-
€1.00
€2.00
€3.00
€4.00
€5.00
€6.00
€7.00
Non-pay Pay Pensions Capital
Bill
ion
s
2010 2015 2019

60
the Capital Plan (2016-21). In total, an overall allocation for the Education Sector of approx.
€12 billion out to 2027 was set out as part of the National Development Plan 2018-2027.
Figure 7: Composition of DES Capital Expenditure 2011 – 2019, €bn
Source: Department of Public Expenditure & Reform
€- €0.1 €0.2 €0.3 €0.4 €0.5 €0.6 €0.7 €0.8 €0.9 €1.0
2010
2011
2012
2013
2014
2015
2016
2017
2018
2019
Billions
First and Second Level Third Level

61
Staffing and enrolment changes
As outlined in Section 1 pay makes up the largest share of Education and Skills Expenditure.
These pay costs are driven by rates (determined largely by public sector pay agreements)
and numbers. Numbers have been increasing over the past 10 years in the education sector,
particularly at primary and post-primary level. This has been in part due to the movement of
a demographic bubble through the school system, resulting in increased enrolments, but
was also amplified by policy changes.16
Figure 8 outlines staffing trends at first, second and third level. Staffing in the primary
education sector has been on an upward trend from 2010 to 2019, growing by 23% over the
period. Similarly, second level increased by 19% over the period. Exchequer funded third
level staffing had no increase over the period.
Figure 8: Staffing trend for 1st, 2nd and 3rd Level, 2010 – 2019
Source: Department of Public Expenditure & Reform
Table 2 outlines the increase in students across all three levels of the education sector. Both
the primary and post primary sectors saw considerable increases in student numbers with an
increase of close to 62,000 (12%) in the primary sector from 2010 to 2019 and an increase of
over 41,500 (12%) in the post-primary sector for the same period. In percentage terms, the
16 For example Budgets 2016 and 2018 reduced the general average teacher to pupil ratio at primary level.
16,000
21,000
26,000
31,000
36,000
41,000
46,000
51,000
56,000
20
10
20
11
20
12
20
13
20
14
20
15
20
16
20
17
20
18
20
19
FTE
First Level Second Level Third Level
23% Increase Over
19% Increase Over
0% Increase Over Period

62
third level sector saw the largest percentage increase of 20% in student numbers (38,300
students).
Table 2: Enrolments of Full-Time Students (Number) by Year and Level of Education
Source: Department of Education & Skills
Table 3: Change in Expenditure Compared with Enrolments 2010-2015 2015-2019 2010-2019
1st, 2nd and Early Years Education
Funding (% Change) -2% 21% 19%
Enrolments (% Change) 7% 5% 12%
Higher Education
Funding (% Change) -15% 17% -1%
Enrolments (% Change) 11% 8% 20%
Source: Department of Public Expenditure & Reform and the Department of Education and Skills
2010 2015 2019
First Level
Enrolments 505,998 544,696 567,772
% Growth
8% 4%
Second Level
Enrolments 350,687 372,296 392,267
% Growth
6% 5%
Third Level
Enrolments 189,779 210,624 228,119
% Growth
11% 8%
Total 1,046,464 1,127,616 1,188,158
% Growth
8% 5%

63
Table 3 outlines the difference in the percentage changes in expenditure and enrolments for
the three periods; 2010 to 2015, 2015 to 2019 and 2010 to 2019. The analysis shows the
extent to which first, second and early years’ education has been prioritised over higher
education. Overall, higher education saw the largest percentage increase in enrolments from
2010 to 2019 while also seeing the largest decrease in funding over the same period.
Special Education
Special education needs expenditure represents nearly 19% of the Department of Education
and Skills gross current allocation in 2019 (€1.87 billion). Expenditure on this area increased
by 49% (€616m) from 2011 to 2019. An estimated 90% (€1.68 billion) of total expenditure in
this area is allocated to pay. This is divided between teacher pay of €1.08 billion (58% of total)
and special needs assistants’ pay of €0.56 billion (30% of total). There have been various
drivers of the increase in expenditure on special education including, the underlying change
in the school age population, the increasing proportion of children who are qualifying for SNA
and special educational needs supports, and in particular, the increasing number of pupils
presenting with an autism diagnosis.

64
COVID-19
Primary and Post Primary Education
The safe re-opening of schools is a key priority in the Government’s Response to COVID-19,
one to which Government have allocated €375 million for the school year 2020/21. In July
2020 The Government approved the publication of a Roadmap to enable the safe return of
schools in September 2020. Measures outlined included enhanced cleaning and hygiene
measures, changes to physical arrangements of classrooms to enable social distancing and
recruitment of additional staff to support safe and sustained re-opening of schools. DES
estimate the total cost of these measures as €375 million for the school year 2020/21, this
includes a €75 million Capital package agreed as part of the July Stimulus.
There remains considerable uncertainty around these cost estimates and, in this regard, the
Department of Education and Skills have put in place monitoring and control mechanisms.
Given the size of the sector, with 1 million pupils, 100,000 staff and over 50,000 classrooms,
small alterations in measures can have a considerable impact on costs. In addition to the
costs outlined, certain areas of planned spending may not materialise due to the impact of
COVID 19, including the cancelation of state examinations.
Summer programmes were provided to special education pupils and those at greatest risk
of educational disadvantage. The cost for these programmes is currently estimated at up to
€15 million.

65
Higher and Further Education
As part of the Government response to COVID-19, including the July Stimulus, an additional
aggregate investment of €250 million has been allocated to the Further and Higher Education
sectors in 2020.
This includes €100 million in NTF funding as agreed in the July Stimulus. Of this, just over €52
million will provide for c. 28,000 new FET places for people who have lost their jobs to COVID-
19, additional upskilling opportunities, as well as incentives for employers to hire new
apprentices. The remaining c.€47 million will be allocated to the HE sector to provide over
7,000 additional Higher Education places for students at both under graduate and post
graduate levels.
There is also an additional €150 million of Exchequer funding in 2020 to assist in the re-
opening of the further education and training and higher education sectors and will provide
for: Higher Education supports to the front line response in the Health sector; additional
online provision & software; increased Health & Safety Costs; additional research funding;
greater supports for the mental health and wellbeing of students and additional measures to
improve student access.
COVID-19 also poses risks to revenue streams in the University Sector including the fee
income from international students, rental income from student accommodation and income
from research. In order to ensure the Government balance sheet treatment of the sector is
unaffected, the new Department of Further and Higher Education, Research, Innovation and
Science is separately examining options for putting alternative, non-Exchequer, funding
mechanisms in place to respond to these projected income losses.
The negative impacts of COVID-19 on the wider economy and the labour market will also
increase Student Support (SUSI) costs. Decreased incomes due to loss of employment or
reduced hours will increase the demand and eligibility for grants.
66
In relation to Brexit, with a Common Travel Area in place, the Irish and UK Governments
have both committed to allowing students across the Common Travel Area to continue to
be eligible to study in both jurisdictions.
Further Education and Training
Further education and training opportunities will continue to be available to students and
trainees from Ireland going to the UK, and vice versa, under the Common Travel Area. In
addition to COVID-19 impact on the economy, there is also the additional economic impact
associated with Brexit which could lead to increased demand in the FET sector.
Future Policy Challenges
There are a number of challenges facing the Education sector over the short and long term.
The most fundamental challenges being managing the demographic shift from primary to
post primary level, as well as the future demographic changes, expected growth in
superannuation costs, higher participation rates and future funding pressures in the Higher
Education Sector. Also, in the Tertiary Education sector there is a need to ensure that both
the higher education and further education and training sectors are optimally configured to
meet the skills needs of the labour market.
Primary and Post Primary Education
Demographic pressures at primary school level peaked at 567,800 in 2018/19, with the
primary school population expected to decline year-on-year from 2019 to
2034.[1] Furthermore, recent enrolment outturns for 2019/20 show only a small fall in
primary enrolment numbers as post-primary enrolments continue to climb. It is likely the
small decline in primary enrolments indicate the peak has been reached and that numbers
will now decline.
This is not an isolated challenge for the primary education sector; a demographic “bubble” is
working its way through the education system. While the decrease in demand for primary
[1] https://www.education.ie/en/Publications/Statistics/Statistical-Reports/Projections-full-time-enrolment-Primary-and-Second-Level-2017-2035.pdf

67
teachers can be offset to some extent by the non-replacement of retiring teachers, the supply
of teachers must be managed at post-primary level to ensure the needs of the sector are
being met, particularly with regard to priority areas such as languages and STEM
subjects. However, while post primary enrolments peak in 2025, this is expected to be
followed by a year-on-year decline for the following decade (up to 2035), resulting in
oversupply of teachers at second level. Beyond demographics, operational mechanisms play
a role in determining the number of teaching posts each year—understanding them in greater
detail will inform better projections of teaching post numbers.17 Thus the supply of teachers
at both primary and secondary level needs to be carefully managed over the coming years,
while having regard to challenges faced in meeting regional variations. Similarly, regional
variations will also need to be managed appropriately to ensure cost-effective and sustainable
planning of capital investment in the sector.
Higher Education
Demographic changes, higher participation rates and future funding structures continue to
pose a considerable challenge in the Higher Education Sector. Full-time student enrolments
have increased from 173,64918 in 2015 to 184,98119 in 2019 with a projected further increase
of 29% (238,23220) by 2029. Of these enrolments, Non-EU fee-paying student numbers are
currently projected to rise from 20,280 in 2019 to 26,939 in 202921, however COVID-19 may
impact on these projections. In addition to the COVID-19 / July stimulus measures highlighted
above, recent funding measures have included a rise in the National Training Fund levy from
0.7% in 2018 to a rate of 1.0% in 2020 - providing an additional recurrent c.€200 million for
the HE and FET sectors by 2021.
From January 2020, a new Human Capital Initiative, was established within the National
Training Fund to invest c. €60 million per annum from the accumulated surplus in the NTF
over a 5-year period. This investment will total c. €300 million over the period 2020-2024 and
17 Department of Public Expenditure and Reform and Department of Education Spending Review 2020 Teacher Allocation Model 18 https://statbank.cso.ie/px/pxeirestat/Statire/SelectVarVal/Define.asp?maintable=EDA99&PLanguage=0 19 https://hea.ie/statistics/data-for-download-and-visualisations/data-for-download/ *TCD data projected. 20 Using S3 baseline scenario from the Department of Education and Skills projections of full time demand for third level education. 21https://www.education.ie/en/Publications/Statistics/projections/projections-of-demand-for-full-time-third-level-education-2018-2040.pdf

68
will be a key investment in HE and FET. The HCI will be used to support additional HE and FET
expenditure to develop programmes and skills, at regional and national level, close to the
labour market to help buffer the economy from potential economic risks.
A key policy challenge in the coming months will be to establish clarity on a sustainable future
funding model for the Higher Education sector, including any implication for the treatment of
higher education institutions in relation to their general government balance sheet. This will
be informed and supported by analysis being funded by the EU Commission Structural Reform
Report Services, and which is due to report in Q4 2020. The new Department of Further and
Higher Education, Research, Innovation and Science, together with D/PER, will be the lead
Departments in this regard.
Demographic changes, resulting in a larger number of first, second and third levels retirees
on the superannuation education payrolls. The actuarial review undertaken as part of the
2018 Spending Review, Public Service Occupational Pensions in Ireland - Cash Flow Analysis,
projects continued growth in net benefit expenditure in the education sector over time, in
line with trends across the public sector. This is a challenge across a number of Government
Sectors.

69
Employment Affairs & Social Protection Jenny Connors and Orlagh Lavelle
Summary
The Department of Employment Affairs and Social Protection accounts for the largest
share of voted Government expenditure at 31% in 2019. Total Social Protection
expenditure is funded through both the Vote and the Social Insurance Fund (SIF)22.
Ireland’s social safety net supported over 1.35 million people at the end of 2019, this
equates to approximately 27% of the population.
o From 2014 to 2019, the overall numbers supported by DEASP reduced primarily due
to positive labour market conditions over this period which resulted in fewer
working age people on income supports.
o Over the same period the number of pension recipients has continued to grow
annually, rising from 561,296 recipients in 2014 to 648,580 in 2019. See Figure 1
below.
Figure 1: Social Welfare Recipient Numbers, 2014-2019
22 The Social Insurance Fund (SIF) is made up of Pay Related Social Insurance (PRSI) contributions from employers, employees and the self-employed. The SIF provides insurance related payments to people in retirement and to meet certain contingencies, including periods of unemployment, illness and maternity leave.
561,296 577,237 593,642 598,097 629,322 648,580
630,026 601,766 586,828 598,821 589,984 528,611
316,286 284,381 255,885 231,820 189,322 173,674
-
200,000
400,000
600,000
800,000
1,000,000
1,200,000
1,400,000
1,600,000
2014 2015 2016 2017 2018 2019
Total Older Persons Total Working Age (Excluding Jobseekers) Persons on Jobseekers
1.35 million
1.5 million

70
Ireland’s social transfer system has continued to be effective in reducing the ‘at risk of
poverty rate’. However, in more recent years the impact of transfers has diminished due
to a more positive pre- transfer position.
o In 2010, Ireland’s social transfers system reduced the “at risk of poverty rate” from
50.1% to 15.2%, a 34.9 percentage point difference.
o In 2018, Ireland’s social transfers system reduced the “at risk of poverty rate” from
41% to 14.9%, a decrease of 26.1 percentage points.
o As illustrated in Figure 2 below, in more recent years the impact of transfers has
diminished, this is primarily due to the considerable employment growth Ireland
has experienced over this period which resulted in a reduction in the poverty rate
before social transfers.
Figure 2: At Risk of Poverty Rate Before and After Social Transfers, 2010 -2018
Source: Eurostat
Over the period 2010 to 2012, changes in DEASP expenditure reflected the prevailing
labour market conditions and the high number of people on Live Register related
schemes.
In the period 2014 to 2019, increases in expenditure continued but these were not driven
by high levels of working age income and employment support recipients as the number
on the Live Register reduced significantly.
15.2 14.9
50.10
41
0
10
20
30
40
50
60
70
2010 2011 2012 2013 2014 2015 2016 2017 2018
At
Ris
k o
f P
ove
rty
Rat
e %
After Social Transfers Before Social Transfers

71
The expenditure increases over this period were instead driven by a considerable rise in
recipients on Pensions, Illness, Disability and Carer schemes. Other expenditure drivers
over the period included increases in social welfare payment rates and the introduction
of other new measures.
Figure 3: Social Protection Expenditure and Annual Average Live Register Number, 2010-
2019
Source: DPER Statbank
From 2014 to 2019, DEASP expenditure increased by €1 billion or 5% from €19.8 billion to
€20.8 billion. The increase in underlying structural expenditure is much greater, this is
expenditure after adjusting for scheme transfers to other Votes and excluding cyclical Live
Register costs. This spend grew by €2.4bn or 14.5% over the period 2014 to 2019. See Table
1 below.
Table 2: DEASP Expenditure and Underlying Expenditure 2014 – 2019, €bn
2014 2015 2016 2017 2018 2019 Change
€bn €bn €bn €bn €bn €bn €bn %
Total DEASP spend 19.8 19.9 19.8 20 20.3 20.8 +1 +5%
Live Reg. spend + scheme transfers
3.3 3.1 2.9 2.5 2.2 1.9 -1.4 -42%
Underlying spend 16.5 16.8 16.9 17.5 18.1 18.9 +2.4 14.5%
€2
0,8
07
€2
0,9
17
€2
0,7
35
€2
0,2
48
€1
9,7
85
€1
9,9
06
€1
9,8
02
€1
9,9
75
€2
0,3
11
€2
0,7
56
444,905
191,529
-
50,000
100,000
150,000
200,000
250,000
300,000
350,000
400,000
450,000
500,000
€19,200
€19,400
€19,600
€19,800
€20,000
€20,200
€20,400
€20,600
€20,800
€21,000
€21,200
2010 2011 2012 2013 2014 2015 2016 2017 2018 2019
No
. on
LR
Exp
end
itu
re €m
DEASP Expenditure Annual Average No. on LR

72
A range of factors have played a role in driving changes in the composition of expenditure
over the past decade.
Figure 4: DEASP Expenditure by Programme Area 2010 – 2019, €m
o Firstly, demographic pressures have increased pension recipients, by 145,564 (or 29%)
over the last 10 years. This compares to an overall population rise of an estimated
366,700 or 8% over the same period. The number of children (0-19 years) increased by
approximately 82,000 or 7%. Some of costs resulting from demographic pressures have
been offset by the significant decreases in expenditure on working age income supports
as a result of improvements to the labour market from 2012 onwards.
Over a ten year period, pensions’ expenditure has increased by €2.3bn or 39%,
from €5.9bn in 2010 to €8.2bn in 2019. The main driver of this increase is the rising
cost of the contributory state pension (SPC) reflecting the increase in recipient
numbers.
o The Illness, Disability & Carer (IDC) programme has experienced significant increase in
spend over the last decade, increasing by €947m or almost 27%, from €3.6bn in 2010 to
€4.5bn in 2019. This is due to numbers on Illness, Disability and Carer schemes increasing
5.8
98
6,5
96
8,2
14
7,4
05
4,9
40
3,2
60
3,5
65
3,4
46
4,5
06
0
5,000
10,000
15,000
20,000
2010 2011 2012 2013 2014 2015 2016 2017 2018 2019
€m
Pensions Income Supports Illness, Disability, Carer's
Children Supplementary Payments Admin
Employment Supports
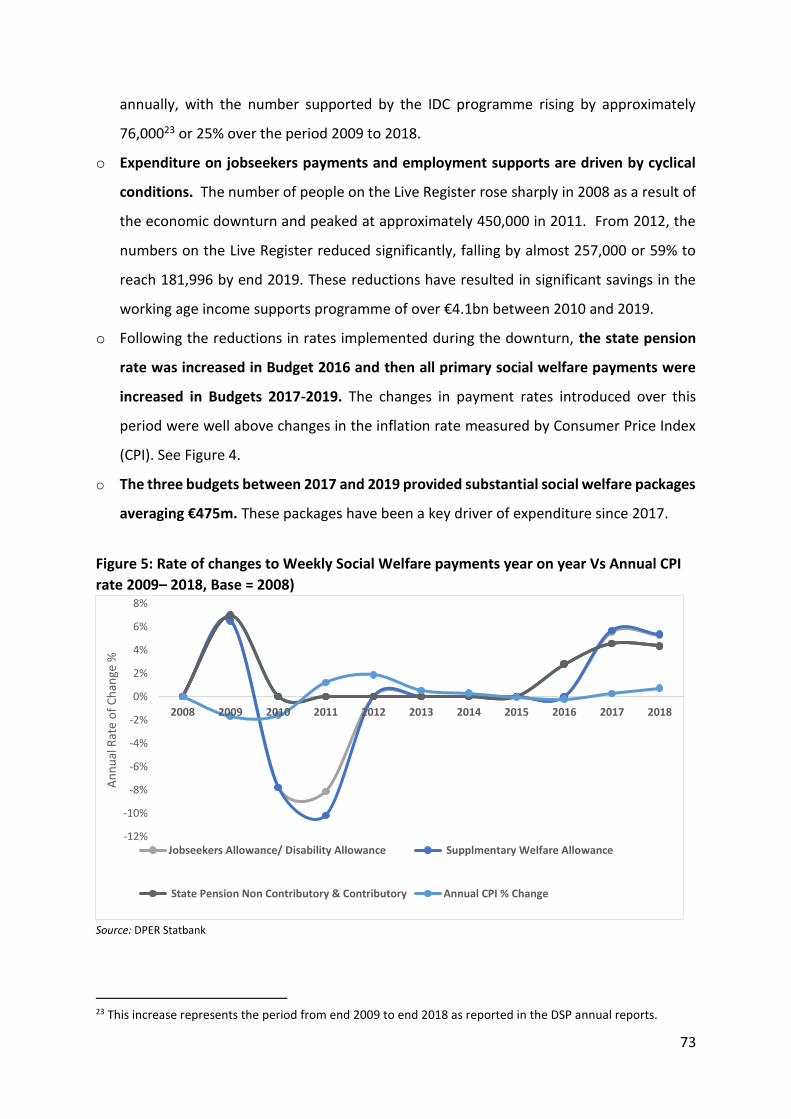
73
annually, with the number supported by the IDC programme rising by approximately
76,00023 or 25% over the period 2009 to 2018.
o Expenditure on jobseekers payments and employment supports are driven by cyclical
conditions. The number of people on the Live Register rose sharply in 2008 as a result of
the economic downturn and peaked at approximately 450,000 in 2011. From 2012, the
numbers on the Live Register reduced significantly, falling by almost 257,000 or 59% to
reach 181,996 by end 2019. These reductions have resulted in significant savings in the
working age income supports programme of over €4.1bn between 2010 and 2019.
o Following the reductions in rates implemented during the downturn, the state pension
rate was increased in Budget 2016 and then all primary social welfare payments were
increased in Budgets 2017-2019. The changes in payment rates introduced over this
period were well above changes in the inflation rate measured by Consumer Price Index
(CPI). See Figure 4.
o The three budgets between 2017 and 2019 provided substantial social welfare packages
averaging €475m. These packages have been a key driver of expenditure since 2017.
Figure 5: Rate of changes to Weekly Social Welfare payments year on year Vs Annual CPI
rate 2009– 2018, Base = 2008)
Source: DPER Statbank
23 This increase represents the period from end 2009 to end 2018 as reported in the DSP annual reports.
-12%
-10%
-8%
-6%
-4%
-2%
0%
2%
4%
6%
8%
2008 2009 2010 2011 2012 2013 2014 2015 2016 2017 2018
An
nu
al R
ate
of
Ch
ange
%
Jobseekers Allowance/ Disability Allowance Supplmentary Welfare Allowance
State Pension Non Contributory & Contributory Annual CPI % Change

74
Temporary Supports in Response to COVID-19 Pandemic
Ireland has reacted speedily to the COVID-19 crisis putting in place a number of
temporary supports in response to the health and economic impact of the crisis. The
response to the COVID crisis resulted in an additional 1.3 million people (at its peak in
May) being supported by DEASP. These temporary supports and measures put in place in
response to the COVID-19 crisis included:
1. The Enhanced Illness Benefit payment which was introduced to provide income support
for employees and the self-employed who are affected through illness or self-isolation.
2. The Pandemic Unemployment Payment (PUP) was introduced on 13 March at a rate of
€203 per week and subsequently increased on 24 March to €350 per week for employees
whose employment were forced to close in response to the public health crisis.
3. The temporary increase to the Qualified Adult rate on certain schemes to €147 per week
to bring the standard payment for these schemes to €350 for a two adult household.
4. The extension of the Fuel Allowance Season by four weeks from Friday 10 April to Friday
8 May to support current recipients in relation to additional heating costs.
5. The Temporary Wage Subsidy Scheme (TWSS1) was introduced on 26 March 2020 to
provide income support to eligible employees where the employer’s business activities
were negatively impacted by the COVID-19. The aim of the TWSS was to maximise staff
retention and firm viability by maintaining the link between the employer and employee.
As of July 2019, there are a total of 2.3 million people being supported by a DEASP income
support/subsidy. This equates to 47% of the population. The total numbers supported by
unemployment payments and other temporary COVID-19 income support schemes was
962,662 as at 4 August.

75
Figure 6: Weekly Trend Recipient Numbers on Temporary COVID 19 Schemes
Total expenditure to date (as of 27 July) on the PUP and the TWSS temporary COVID-19
schemes is in the region of €5billion.
Figure 7: Weekly Trend of Expenditure on Temporary COVID 19 Schemes, €m
274,600
244,56253,500
962,662
390,000
0
100,000
200,000
300,000
400,000
500,000
600,000
700,000
800,000
900,000
1,000,000
1,100,000
1,200,000
1,300,000
1,400,0001
7-M
ar
24
-Mar
31
-Mar
07
-Ap
r
14
-Ap
r
21
-Ap
r
28
-Ap
r
05
-May
12
-May
19
-May
26
-May
02
-Ju
n
09
-Ju
n
16
-Ju
n
23
-Ju
n
30
-Ju
n
07
-Ju
l
14
-Ju
l
21
-Ju
l
28
-Ju
l
No
. o
f P
ers
on
s
PUP No. LR
€89 €103
€-
€20
€40
€60
€80
€100
€120
€140
€160
€180
€200
€220
€240
€260
€280
€300
Exp
en
dit
ure
€m

76
Other Future Policy Challenges
Demographic pressures will continue to drive up recipient numbers and costs, particularly in
relation to pensions. Analysis24 published in 2019 estimated the average annual cost of
demographic change on the Social Protection budget at €179m between 2020 and 203025.
Demographics will also contribute to upward pressures on disability and carer related
supports. Other structural issues will also pose a challenge into the future. Disability income
support expenditure has increased significantly over the past 20 years but this growth has
escalated over the period since 2012 with annual average growth of 5% in the number of
recipients.
In the short to medium term, the primary challenges will be to support businesses, jobs and
help people to get back to employment. A core aspect to this will be in ensuring expenditure
is directed towards the most appropriate supports that help to effectively achieve the social
and economic objectives of Ireland’s recovery.
Activation is a key policy tool to support and promote the move back to sustainable
employment. In the medium to longer term, a timely recovery will be required to ensure the
sustainability of expenditure and for positive employment outcomes.
24 Connors, Moran and Ivory; Budgetary Impact of Changing Demographics 2020 – 2030; IGEES, 2019. The future estimates in this paper have factored in increases of the pension age to 67 in 2021 and to 68 in 2028.

77
Finance Victoria Cahill
Summary
Total voted expenditure for this Departmental Group 2010-2019 is €4,519m.
Department of Finance
The Department of Finance manages government finances and plays a central role in the
achievement of the government’s economic and social goals having regard to the
Programme for a Partnership Government.
C&AG
The objectives of the Office of the Comptroller and Auditor are to carry out high quality
audits efficiently, in a timely manner, and in accordance with International Standards on
Auditing; to produce reports that facilitate scrutiny of audited bodies by the Oireachtas and
which contribute to better public administration; and to authorise the timely release of funds
from the Exchequer on foot of requisitions by or on behalf of the Minister for Finance.
Revenue
The Office of the Revenue Commissioners, as the Irish tax and customs administration, plays
a vital role in our economy by collecting the vast majority of the taxes and duties due to the
State. These receipts underpin Government’s capacity to fund vital services and facilities for
society.
Tax Appeals Commission
The Tax Appeals Commission (TAC) was established on 21 March 2016 and replaced the
former Office of the Appeal Commissioners.
The principal purposes of the establishment of the new structure for tax appeals were to:
ensure an enhanced and cost-effective appeal mechanism for tax cases
provide transparency and increased certainty for taxpayers
ensure that the Appeal Commissioners be seen as fully independent, and
ensure that there be no actual or perceived bias in the operation of the appeals
system.

78
Figure 1: Total Voted Finance Group Expenditure, 2010-2019
Department of Finance
Figure 2: Expenditure on the Department of Finance 2010-2019, €000s
Total Voted Expenditure on the Department of Finance equalled €359.3m within the period
2010-2019. The expenditure cliff in 2011 represents the establishment of the Department of
Public Expenditure and Reform, and the separation of functions. Funding remained relatively
stable between 2012 and 2015. Since 2015 it has increased slightly year-on-year. The non-pay
increase in 2019 reflects a Supplementary Estimate provided on Vote 7 in relation to the
settlement of a case pertaining to Air Travel Tax.
0
100,000
200,000
300,000
400,000
500,000
2010 2011 2012 2013 2014 2015 2016 2017 2018 2019
Finance Vote Group 2010-2019Total Voted Expenditure €4,519m (GROSS)
Finance Comptroller and Auditor General Revenue Tax Appeals Commission
0
10,000
20,000
30,000
40,000
50,000
60,000
70,000
80,000
2010 2011 2012 2013 2014 2015 2016 2017 2018 2019
Pay Non-Pay Capital Total Expenditure

79
Comptroller and Auditor General
Figure 3: Expenditure by the Comptroller and Auditor General 2010-2019, €000s
Total Voted Expenditure of the Comptroller and Auditor General equalled €117.9m within the
period 2010-2019. From 2010 to 2019, gross annual expenditure has increased from €10.8m
to €13.8m, an increase of €3m or 27%.
Revenue Commissioners
Figure 4 – Expenditure by the Revenue Commissioners 2010-2019, €000s
Total Voted Expenditure of the Revenue Commissioners equalled €4,037m within the period
2010-2019. From 2010 to 2019, gross annual expenditure has increased from €401,769m to
€449,520m an increase of €47,751m or 11.9%.
0
2,000
4,000
6,000
8,000
10,000
12,000
14,000
16,000
2010 2011 2012 2013 2014 2015 2016 2017 2018 2019
Pay Non Pay Total Expenditure
0
50,000
100,000
150,000
200,000
250,000
300,000
350,000
400,000
450,000
500,000
2010 2011 2012 2013 2014 2015 2016 2017 2018 2019
Pay Non-pay Capital Total Expenditure

80
Tax Appeals Commission
Figure 5: Expenditure of the Revenue Commissioners 2010-2019, €000s
Total Voted Expenditure of the Tax Appeals Commission equalled €5.21m within the period
2016-2019. From 2016 to 2019, gross annual expenditure increased from €0.89m to €1.773m
an increase of €0.83m or 99.2%.
The drivers of expenditure for the Department of Finance are:
The pay bill: while remaining relatively stable from 2011-2018, has increased in 2019
to provide for recruitment and for the Lansdowne Road and Public Service Stability
Agreement. It accounts for almost 46% of the original 2019 gross estimate.
Fuel Grant: €10.5m was provided for in 2019 for the Fuel Grant under the Disabled
Drivers and Passengers (tax Concessions) Scheme. The grant has been paid since 1
January 2016 in respect of fuel used in the previous 12 months. This accounts for
approximately 25% of the original 2019 gross estimate.
Consultancy related to policy advice and legal advice account for approximately
another 11% of the original 2019 gross estimate. The outturn in any year in this
category of expenditure depends on the amount of the potential legal cases
concerning the Department take place.
As indicated in figure 6, the majority of expenditure by the Office of the Comptroller and
Auditor General in 2019 was accounted for by salaries (80%) and contracted out audit
services (8%).
0
200
400
600
800
1,000
1,200
1,400
1,600
1,800
2,000
2016 2017 2018 2019
Pay Non-Pay Total Expenditure

81
Figure 6: Detailed expenditure 2010 – 2019, €000s
2010 2019 Variance
(i) Salaries, wages and allowances 8,869 10,871 23%
(ii)Travel and Subsistence 454 611 35%
(iii) Training and development and incidental expenses 228 491 115%
(iv) Postal and telecommunication services 166 50 -70%
(v) Office equipment and external IT services 361 438 21%
(vi) Office premises expenses 257 178 -31%
(vii) Consultancy services and value for money and policy reviews 67 30 -55%
(viii) Legal fees 14 42 200%
(ix) Contract audit services 427 1,088 155%
Total 10,843 13,799
The most significant increases in expenditure in the period 2010 – 2019 relate to:
Salaries, wages and allowances – due to the steady increase in staff numbers from
150 to 185 (as more resources were put in to financial audits in order to clear arrears
of audits; additional effort on certain audits such as third level education audits, more
focus on propriety in financial audits and increasingly demanding auditing standards
and increase in reporting resources since 2018) and average increase in wages of 4%.
Travel and subsistence – due to overall increase in rates (approx. 20%), business travel
needs and international cooperation with other auditing bodies.
Training and development – there has been a steady increase in this expenditure due
to year-on-year increases in staff number, staff turnover and the Office’s focus on
continuous professional development.
Office equipment and information technology – remote working (either from home
or from client sites) is a critical element of the Office’s work, which is supported by
this expenditure.
Outsourcing audit costs – the use of contract audit services has been key to advancing
the timeliness of financial audit certification. The cost of contracting out audits
increased over the last decade due to the high market demand for the services.
The Office may charge fees for audits, inspections or examinations in accordance with section
12 of the Comptroller and Auditor General (Amendment) Act 1993 subject to the consent of
the Minister for Public Expenditure and Reform. These fees are classified as appropriation-in-
aid.
The recovery policy in relation to charging audit fees is as follows
o fees are charged for all State-sponsored bodies and most departmental fund accounts
o fees are not charged for the audit of appropriation accounts, Finance Account,
inspections or value for money examinations
o fees aim to recover the outlay in carrying out audits for which fees are chargeable.

82
Since 2001, the Office policy has been to adjust fees to as close as possible to full cost recovery
levels over a rolling three-year period. The year-on-year timing of receipts related to arrears
or their reduction may have impact on the level of receipts in the year.
The main driver of Revenue’s expenditure is the steady increase in their customer base (the
number of active taxpayers – businesses, employers/employees, traders, property owners,
etc). Economic growth leads to more business and job creation, creating extra demand on
Revenue customer services and extra requirements for Revenue’s compliance work.
Number of Taxpayers 2010 2011 2012 2013 2014 2015 2016 2017 2018 2019
PAYE Employments 2.53m 2.60m 2.31m 2.30m 2.41m 2.51m 2.62m 2.75m 2.96m 3.18m
Self-assessment
Income Tax 0.6m 0.6m 0.6m 0.6m 0.6m 0.7m 0.7m 0.7m 0.7m 0.8m
Companies 0.16m 0.16m 0.16m 0.16m 0.17m 0.18m 0.18m 0.19m 0.20m 0.20m
Continued investment in information and communications technology, as well as providing a
better service for the taxpaying public, has been a major driver of productivity growth in
Revenue to ensure that higher volumes of taxpayers’ needs are addressed in an effective and
efficient manner as possible.
In addition to the growth in customer numbers, in any given year, Revenue must implement
urgent and new projects that ensure the State’s complex tax systems can support budgetary
and legislative changes as introduced by the Government or the EU. These project continually
are delivered on time and to a high standard.
The TAC pay bill accounts for the majority of the vote - 79% in 2019, 81% in 2018, 67% in 2017
and 74% in 2016.
On establishment the TAC inherited 282 cases from the Office of the Appeal Commissioners.
During 2016 an additional 2,700 additional legacy appeals were transferred from Revenue. As
a result, a backlog of appeals developed, standing at approximately 3,370 at year end 2019.
In 2019 the TAC received 1,495 new appeals and closed 1,584 appeals.
In 2018, the Minister for Finance sanctioned an independent review of the workload and
operations of the Tax Appeals Commission. The review made a number of recommendations
on governance, resources and process improvements within the Commission, resulting in a
near-doubling of the TAC budget from 2018 to 2019.
Subsequently, additional recruitment took place throughout 2019. Total FTE staff number was
27 at end 2019. In 2020 the total number of staff will reach 32.5 FTE, including 5.5 Appeal
Commissioners and a Chairperson, as per the recommendations of the review.

83
The vote estimate for Office Equipment & External IT Services also increased substantially
between 2018 and 2019, to facilitate the procurement of a new Case Management System.
The Commission hired 2 internal ICT professionals to manage internal ICT and to develop the
new Case Management System.
Department of Finance
Covid-19: The economic landscape has fundamentally changed due to the impact of the
Covid-19 pandemic. Economic activity has temporarily come to an effective stand-still in an
effort to supress the transmission of the Covid-19 virus. Non-food retail, entertainment and
hospitality are among those sectors most impacted. With other sectors also affected to
varying degrees, economic activity has fallen sharply in Ireland.
The Covid-19 crisis has continued to have a significant impact on the labour market. While
the standard measure of Monthly Unemployment was 5.6% in May 2020, a new Covid-19
adjusted measure of unemployment could indicate a rate as high as 26.1% if all claimants of
the Pandemic Unemployment Payment were classified as unemployed. While this figure is
expected to fall with future easing of restrictions and a limited return to work for most
sectors, it remains a significant challenge going forward.
Brexit: Negotiations between the EU and UK on a future partnership agreement are ongoing
and the Government remains hopeful agreement can be reached. However, limited progress
to date has resulted in heightened uncertainty, making the assumption of an agreed exit when
the transition period ends on 31 December 2020 now less certain. In light of this, the
Government has decided to intensify readiness work over the coming months on the basis of
two scenarios: (i) a limited trade agreement (including a fisheries agreement), or, (ii) no
agreement, meaning the UK and EU would trade on WTO terms from 1 January 2021. In
parallel, work is continuing on the implementation of the Withdrawal Agreement, which
includes the Protocol on Ireland/Northern Ireland.
It has always been clear that Brexit will have a negative impact on the economy and on
domestic living standards, irrespective of the form that it takes. Regardless of the outcome,
there will be change for Government, business and citizens. A Free Trade Agreement in goods
only will not address a range of areas important to Ireland such as transport, energy and police
and judicial cooperation. Recognising this and planning accordingly is the most appropriate
strategy and the Department of Finance is preparing for both scenarios.
Comptroller and Auditor General
As the OCAG prepares its strategic plan for 2021-2025, progress on the following challenges
is the key focus:
84
Timeliness of certification of audits – Following the significant reduction of arrears of
financial audits, OCAG is focusing on improving the timeliness of certification of financial
audits within the 12-month period. While many bodies have been able to adhere to normal
financial reporting deadlines during the 2020 public health emergency, some are having
difficulty in that regard and in engaging with audit.
Adoption of an accruals based accounting framework for appropriation accounts - the
Department of Public Expenditure and Reform is leading this project, which will have a
significant impact on the production and audit of appropriation accounts. OCAG is
represented as an observer on the project’s Standing Advisory Group.
Increasing the number of special reports/examinations – This remains a challenge for OCAG
given the competing demands for resources, but both OCAG, and our stakeholders, recognise
the importance of us achieving this. During the public health emergency, some of our
reporting work was deferred or stopped to free up staff for temporary release for crisis-
related work. In the event, a significant transfer out of staff was not required. We are now
reviewing our forward work programme to reflect the new risks and challenges public bodies
face, and to prioritise appropriately other planned work. Availability of sufficient resources is
a key factor in delivering this objective.
Greater sharing of audit insights – OCAG has an opportunity to increase the impact of its
work, through broader engagement with clients and a more general sharing of audit findings.
One such event in April was deferred and OCAG is exploring option to deliver these types of
large scale events remotely.
Revenue
Covid-19: Revenue has worked with the Department of Finance, other government
departments and stakeholders to introduce a series of measures and supports to help
businesses deal with the impacts of the COVID-19 pandemic.
Many of these supports are simplifications of existing administrative practices or reprioritising
of certain activities by Revenue. Many of the measures will have only a temporary cash flow
impact and are expected to be Exchequer neutral in terms of cost overall but still require IT
developments or administrative changes by Revenue.
The Temporary Wage Subsidy Scheme (TWSS) and the ‘warehousing’ of certain COVID-19
related tax debts are two of the most significant measures introduced to support businesses.
TWSS was implemented from March and is supporting over half a million employees with
over 50,000 employers by early June. The cumulative value of the payments made under the
Scheme is €1,370 million to the same period. Government has announced the extension of
the Scheme until end August.

85
To the end of March, tax warehousing measures provided vital liquidity support for
businesses benefiting some 14,000 VAT registered businesses and over 30,000 employers.
The value of the measures was approximately €800 million for January/February VAT and
February Payroll taxes.
Brexit: Revenue will continue to work to support trade and businesses to maintain high levels
of voluntary compliance through the transition phase and post Brexit. Revenue’s approach is
grounded in facilitating legitimate trade to move goods as speedily and efficiently as possible
through the efficient implementation of tax and customs procedures.
As well as hiring additional trade facilitation staff, throughout 2019 Revenue engaged in a
series of outreach events to assist businesses in assessing the impact Brexit will have on their
operations, Revenue also made direct contact with businesses. This engagement
encompassed all businesses (over 100,000) that traded with the United Kingdom (UK) in 2018
and/or 2019, identified through Revenue’s analysis of the VAT Information Exchange System
(VIES) returns. This engagement continues in 2020.
TAC
Covid-19: Whilst remote working and the processing of appeals presents a significant
challenge to the Commission, since the restrictions were introduced the processing of current
and new appeals is continuing. However, the cancellation of hearings until the restrictions are
lifted presents a more difficult challenge due to their nature. The Commission is actively
pursuing the possibility of conducting entire hearings using video conferencing only. This
presents legal and operational difficulties that the Commission is working to overcome. The
Covid 19 restrictions has also led to the delay in the transfer of the Commission’s ICT platform
to the BTS ICT platform and a delay in the development of the new Case Management System.
Addressing backlogs – the TAC is taking action to address the backlog of appeals to date and
will have the challenge of integrating additional Commissioners and staff to the existing
cohort to achieve this goal.
Legislation – legislation to establish the role of Chairperson in the TAC was enacted in
December 2019 Finance (Tax Appeals and Prospectus Regulation) Act 2019, and the
appointment of the new Chairperson is awaiting ministerial sign off. The TAC has put in place
structures to incorporate the new Chairperson role within its governance structure.
Progression of ICT projects – while ICT projects are not policy challenges per se, an effective
Case Management System (CMS) and appropriate ICT equipment is essential to the delivery
of TAC services. The TAC plan to develop a new CMS with improved functionality to interface
with appellants, agents and with Revenue’s systems and to deliver improved reporting
capability. There is a need to ensure that the final product is properly designed, tested, user
friendly, value for money and supports the Civil Service-wide commitment to providing world-
class service to citizens.

86
Foreign Affairs & Trade Victoria Cahill
Summary
The Foreign Affairs Group of Votes consists of:
o Vote 27 – International Co-operation o Vote 28 – Foreign Affairs and Trade
Total voted expenditure for this Departmental Vote Group 2010 – 2019 is €7,207m.
The funding provided to International Co-Operation represents international development
cooperation funding, including bilateral country programmes, long term multilateral
engagement and shorter term humanitarian responses. In 2019, Ireland published a new
policy for international development, “A Better World” with its call to reach those Furthest
Behind First.
The funding provided to the Department of Foreign Affairs and Trade supports the
Department’s efforts to serve the Irish people, promote their values and advance Ireland’s
prosperity abroad, and provides the Government with the capabilities, analysis and
influence to ensure that Ireland derives the maximum benefit from all areas of its external
engagement.
The current main expenditure drivers are the COVID19 crisis response which includes the
repatriation of Irish citizens who have been stranded abroad and support to the Irish
diaspora communities, the ongoing increased demand for passports and citizenship,
ongoing related Brexit implementation negotiations, opening new missions and
implementation of the government’s strategy “Global Ireland – Ireland’s Global Footprint
to 2025”, Ireland’s increasing contributions to international organisations, ICT global
network support costs, currency exchange exposures and general cost increases worldwide
which are expanded on below.
There are five expenditure programmes under Vote 28 corresponding with the
Department’s five high level goals: - Our People, Our Place in Europe, Our Values, Our
Prosperity and Our Influence.
The future policy challenges facing this Departmental Vote group are:
Covid19 response (including repatriation of Irish citizens from abroad, supporting
Irish communities overseas, analysing international trends to inform Government
policy, maintaining Ireland’s mission network and supporting other government
Departments and the HSE with the international procurement of critical medical
supplies and PPE)
Brexit implementation;
Passport Reform and increasing demand (despite the initial reduction during the
early days of the COVID19 crisis) for passports;

87
Ireland’s commitment to International Development;
Delivering on “Global Ireland – Ireland’s Global Footprint to 2025”, and
Ireland’s UN SECCO seat 2021-2022.
Figure 1 – Total Voted Foreign Affairs Group Expenditure, 2010-2019
International Co-operation
Figure 2 – Expenditure on International Co-operation 2010-2019, €000s
0
100,000
200,000
300,000
400,000
500,000
600,000
700,000
800,000
900,000
2010 2011 2012 2013 2014 2015 2016 2017 2018 2019
Foreign Affairs Vote Group 2010-2019 Total Voted Expenditure €7,207m
International Co-operation Foreign Affairs and Trade
Foreign Affairs Group Total Expenditure
0
100,000
200,000
300,000
400,000
500,000
600,000
2010 2011 2012 2013 2014 2015 2016 2017 2018 2019
Admin Pay and Non-Pay
BILATERAL COOPERATION ANDHUMANITARIAN ASSISTANCE
PAYMENTS TO INT. FUNDS FORTHE BENEFIT OF DEVELOPINGCOUNTRIES
CONTRIBUTIONS TO UN ANDOTHER DEVELOPMENT AGENCIES
Capital
Total Expenditure

88
Total Voted Expenditure on International Co-operation equalled €5,023m within the period
2010-2019. From 2010 to 2019, gross annual expenditure has increased from €524m to
€543m and increase of €19m or 3.6%.
Department of Foreign Affairs and Trade
Figure 3 – Expenditure on the Department of Foreign Affairs and Trade 2010-2019, €000s
Total Voted Expenditure on the Department of Foreign Affairs and Trade equalled €2,184m
within the period 2010-2019. From 2010 to 2019, gross annual expenditure has increased
from €224m to €266m, an increase of €42m or 18.8%.
Ireland’s Consular Response to COVID19: During the first half of 2020 the Department
was at the forefront of efforts to repatriate Irish citizens who had become stranded
abroad due to the COVID19 crisis. This involved significant engagement with airlines,
foreign governments, local authorities, health services, police forces and Irish citizens
stranded overseas. While every effort was made to facilitate returning citizens on
commercial flights and charter flights arranged by other countries, the Department
also arranged a number of charter flights to repatriate Irish citizens. The Department
also activated a dedicated helpline to provide direct support and advice to Irish
citizens and is coordinating assistance and support for Irish communities who are
resident abroad during this COVID19 crisis.
Increased demand for passports: Despite an initial decrease in passport demand
during the early stages of the COVID19 crisis there continues to be a sustained
increase in demand for passports. This will probably maintain operating costs at 2019
levels with expected growth in applications anticipated in future years. The Passport
Service, over the last two years, has introduced online passport applications for both
first time applicants based in EU countries and renewals worldwide. Further
0
50,000
100,000
150,000
200,000
250,000
300,000
2010 2011 2012 2013 2014 2015 2016 2017 2018 2019
Current Capital Total

89
developments are planned to expand online applications to all applicants over the
coming 12 months. In addition, there is also a significant increase in applications for
Irish citizenship under the Foreign Births Registration procedures.
Brexit: A key focus for this Department continues to be the safeguarding of Ireland’s
interests in the broader context of Brexit implementation and additional resources
have been put in place at HQ and in key EU Missions to address the challenges.
Ireland’s increasing contributions to international organisations: The Department
pays Ireland’s contributions to a number of international organisations including the
UN, OECD, OSCE and the Council of Europe. These assessed contributions for Ireland
are based on formulae related to Ireland’s Gross National Income (GNI). As Ireland’s
GNI has increased this has resulted in a corresponding increase in Ireland’s assessed
contributions to these international organisations. In addition, changes to the UN
Peacekeeping Budget will result in higher contributions by Ireland in 2019.
‘Global Ireland – Ireland’s Global Footprint to 2025’ Implementation: As part of the
2020 Budget, €12.5 million was allocated to the Department of Foreign Affairs and
Trade to continue to implement on the commitments under Global Ireland. In 2020,
funding has been allocated to enable preparations for Ireland’s involvement in Expo
2020 in Dubai (which due to COVID19 has now been rescheduled to 2021), planning
for the construction of an Ireland House in Tokyo, the opening of new Embassies and
Consulates and the strengthening of resources at Headquarters.
New Missions: The 2020 Budget provided resources to enable the commitments
under Global Ireland to complete the first phase of openings of new Irish Embassies
and Consulates. Embassies are now open in Wellington, Monrovia, Bogotá, Santiago
and Amman, and Consulates General are open in Vancouver, Mumbai, Cardiff,
Frankfurt and Los Angeles. Planning is underway to open embassies in Rabat, Kyiv and
Manilla before the end of the year.
ICT global network support costs, including those associated with the COVID19
response, the supply of ICT services worldwide and an upgrade in technology facilities
under the Department’s ICT Strategy 2018-2020 are driving expenditure in this area.
General cost increases worldwide, currency exchange exposure, ICT Global Network
and the Global State Property Portfolio are also driving expenditure within this
Department.
COVID-19: During the first half of 2020 the Department repatriated Irish citizens who had
become stranded abroad due to the COVID19 crisis. While every effort was made to facilitate
returning citizens on commercial flights and charter flights arranged by other countries, the
Department also arranged a number of charter flights to repatriate Irish citizens. The
Department also activated a dedicated 24/7 helpline to provide direct support and advice to
Irish citizens. The citizens have undertaken to repay the Department for the majority of the
costs incurred.

90
To meet the urgent needs of Irish communities abroad, a Covid-19 Response Fund was
established with funding of €2.5m ring-fenced from the existing Emigrant Support
Programme budget which to date has supported over 60 projects worldwide. It is anticipated
that further demand will arise in this area.
The Department is now looking beyond the immediate COVID-19 crisis response to a
transitional phase, and towards the recovery phase. During this next period, the Department
will support the ongoing public health requirements, international procurement and
economic support measures, and manage an increasingly complex context for provision of
consular and Irish abroad outreach services, while assisting with the strategic response to
Ireland’s broader economic and social recovery.
Brexit: the Department will lead on the negotiations for a future EU-UK relationship, the
implementation of the Protocol on Ireland and Northern Ireland and Brexit Preparedness, all
of which will be crucial to Ireland’s recovery in the period ahead.
Passport Service Reform Programme and increasing demand for passports: The Passport
Reform Programme was launched in 2016 and has an ambitious plan to transform the
Passport Service by delivering 32 projects at a total cost of €21.3m over a five-year period.
The Programme has delivered major upgrades to Passport Service technology platforms and
business processes as well as significant customer service improvements. The introduction of
Online Adult Renewals in March 2017, Online Child Renewals in November 2018 and for the
majority of First Time Applicants in October 2019 have been the most significant public
innovations for the Passport Service the current processing system in the early 2000s. The
result has been a significantly enhanced customer service due to ease of use and improved
delivery times, with nearly one million citizens using the online channel since its launch.
Tangible benefits from the focus on increasing the protection of the integrity of the Irish
passport have been realised through the enhanced Facial Recognition System, the new
Emergency Travel Certificate with enhanced security features, and new business processes
which help mitigate against the threat of fraud. Before its conclusion, the Reform Programme
will also deliver a new back-end Passport Issuance and Processing System (PIPS) and a second
automated passport mailing machine, while also expanding the online channel to allow all
Irish citizens to apply 24/7 from anywhere in the world. Development of the new system will
continue during 2020. While there was a decrease in applications during the early stages of
the COVID19 crisis it is expected that application volumes will increase slightly for 2020.
Ireland’s commitment to International Development: Ireland’s new policy for international
development “A Better World” focusses on a number of commitments addressing
international climate action; humanitarian need; gender equality; and governance through its
development cooperation programme. This new policy reconfirms Ireland's commitment to
progressing towards the United Nations target of providing 0.7% of Gross National Income
(GNI) in Official Development Assistance (ODA), where economic circumstances permit.
91
In addition, because of a proposed increase in the volume and changes in the management
of the EU’s international development support under the next Multiannual Financial
Framework, it is likely that the proportion of Ireland’s Official Development Assistance (ODA)
going through the EU institutions (presently 26%) will increase. Ireland’s new Policy for
International Development, “A Better World”, and “Global Ireland, Ireland’s Global Footprint
to 2025” commit to the deepening of our relations within the EU on development issues and
the strengthening of our presence in multilateral institutions.
Delivering on “Global Ireland – Ireland’s Global Footprint to 2025”: In June 2018 the
Government launched Global Ireland, Ireland’s Global Footprint to 2025, an ambitious plan
which aims to double the scope and impact of Ireland’s international presence by 2025. The
Department has opened 10 new mission to date with 3 more planned for later this year.
Ireland’s UN SECCO Seat: On 2 July 2018 the Taoiseach and Tánaiste launched Ireland’s
election campaign for a non-permanent seat on the UN Security Council for the 2021-2022
term.
Ireland has sought election to the Security Council at roughly 20-year intervals. The campaign
is being used as an opportunity to showcase Ireland’s foreign policy credentials and
international standing at the UN, to highlight our contribution to the UN throughout six
decades of membership in the fields of sustainable development, peacekeeping,
disarmament and human rights and to build relationships with new partners for investment,
trade and tourism. Ireland won a seat on the Security Council in the elections held in June and
will formally take this seat on the council on 1 January 2021 for a two year term.

92
Health Deirdre Collins and Cian McCarthy
Summary
2010 to 2019, total voted expenditure on healthcare rose from €14.52bn to €18.38bn.
Health expenditure has fluctuated over the last decade. Expenditure increased
considerably from 2010; initially falling to 2013 due to the economic downturn and then
continuously rising, reaching a peak in 2019 of €18.38bn. Healthcare has consistently
accounted for approximately a quarter of total Voted Government expenditure over the
period.
Total health expenditure increased by 27% from 2015 to 2019, representing significant
growth over such a short period of time. Growth over this period was significantly driven
by increased expenditure in the acute hospital setting through increased staff numbers and
wider growth in pharmaceutical expenditure.
In terms of outcomes, from 2010 to 2018 life expectancy in Ireland rose from 80.7 to 82.6,
an increase of one year and eleven months. Ireland has a relatively young population, life
expectancy has risen and remains higher than the EU average. However, while 84% have
described their experience in an acute hospital setting as ‘good’ or ‘very good’, Ireland’s
bed occupancy rate is above 90% and has been consistently above that of the EU average
over the decade. Obesity and caesarean section rates continues to rise, the population is
growing more elderly with the demographic impact of population aging is expected to have
a significant impact on health expenditure in the years ahead.
The estimates expenditure pressures arising from demographic costs are informed by the
‘Budgetary Impact of Changing Demographics 2017-2021’ paper, published by the Irish
Government Economic and Evaluation Service (IGEES) in 2016. Health was prescribed
€130m in demographics for 2019 and €137m in 2020 under this analysis.
There is an increasing need to ensure that all health resources are deployed as effectively
as possible. To this end, Spending Review 2020 will take an in-depth look at the following
health related topics:
An analysis of State Expenditure on Pharmaceuticals with a focus on High-tech
drugs.
A focused policy assessment (FPA) on the National Drugs Strategy.

93
Public health spending has traditionally been the second largest area of Government
expenditure after Social Protection, and the amount spent on in health has consistently
risen since 2013. Figure 1 below illustrates this trend.
Figure 1: Total Public Expenditure on Health 2010 to 2019, €000s
Source: Department of Health; Department of Public Expenditure and Reform
2019 Number figure based on estimate of off-vote income by author
It is difficult to compare health expenditure across this period on a like-for-like basis due to a
number of significant changes that have taken place. These include the transfer of Children
and Families expenditure to the Children and Youth Affairs Vote in 2014 and the
disestablishment of the HSE Vote in 2015. Figure 1 attempts to control for these changes. In
2010, the total Healthcare expenditure was just over €14.5bn; by 2019 that figure had risen
to €18.34bn.
0
2,000,000
4,000,000
6,000,000
8,000,000
10,000,000
12,000,000
14,000,000
16,000,000
18,000,000
20,000,000
2010 2011 2012 2013 2014 2015 2016 2017 2018 2019
Current Total Capital

94
Spending contracted during the recession– largely the result of central pay agreements and
the recruitment moratorium – but has continuously grown since 2013. From 2010 to 2013
Health expenditure fell by 7%, as a result of a general decrease in Government spending
during the economic crisis. In the period from 2013 to 2019 health spending increased by an
average of €809m annually.
Healthcare has made up a significant proportion of Government expenditure over the past
decade. Since the establishment of the HSE in 2005, Health has on average accounted for
25% of Voted expenditure annually. While Government spending on health care would have
had to increase over the past ten years simply to keep pace with a growing population, the
rate of expenditure growth since 2008 has been far greater than demographic pressures.
Figure 2: Government Expenditure on Health per capita, 2000 to 2018
Source: OECD
€1,104
€2,005
€2,660
€1,247
€2,621
€3,211
€1,000
€1,500
€2,000
€2,500
€3,000
€3,500
2000 2001 2002 2003 2004 2005 2006 2007 2008 2009 2010 2011 2012 2013 2014 2015 2016 2017 2018
OECD Average Ireland
Expenditure Management
Management of the Health Budget is a key priority for the Government.
Reporting of expenditure takes place on a monthly basis and is communicated to
Government.
In addition to these normal monitoring structures, a Health Budget Oversight Group has
been put in place which includes senior officials from the Department of Health,
the HSE and Department of Public Expenditure and Reform. This meets on a monthly basis
and provides an up-to-date expenditure position.
Although reduced from previous years, supplementary funding of approximately €338m
was provided for day-to-day spending in the Health service in 2019.

95
As with total expenditure, per-capita spending declined for a period after 2009 but has been
growing again since 2013, as can be seen in Figure 3. In 2009, Government spending on health
was €2,621 per person but by 2018 this had risen by over 2% to €3,211, based on the latest
available OECD Data. This compares to an OECD average per capita spend of €2,005 in 2009
and €2,660 in 2018.
This sections details the underlying drivers of public expenditure on health.
Pay Bill
The most significant driver of the increase in Health expenditure over the past decade is the
HSE pay bill. Pay account for almost 50% of voted health expenditure, and indeed some
elements of the non-pay budget, such as grants, also go towards pay. Table 1 below shows
that from 2010 to 2019, the health pay bill increased by €1.1bn, or 17%. This increase is a
result of a combination of pay restoration and agreements, and of a considerable expansion
of the HSE workforce between 2014 and 2019, with approximately 22,000 additional WTEs
hired by the HSE over the this period.
Table 3: HSE Pay Bill and HSE Staffing Levels from 2010-2019
2010 2011 2012
201
3
201
4 2015 2016 2017
2018 2019 Pay Bill
(€m) 6,466 6,385 6,251 6,166 6,085 6,220 6,442 6,772 7,183 7,594
Annual
Change
(€m) -463 -81 -134 -85 -81 135 222 330 411 411
Annual
Change (%) -7% -1% -2% -1% -1% 2% 3.5%
5% 6% 5.7%
WTE 107,972 104,392 101,506 99,959 97,791 103,884 107,085 110,795 117,857 119,817
Annual
Change - 1,781 -3,580 -2,887
-
1,547
-
2,168 6,093 3,201 3,710 7,062 1,960
Annual
Change (%) -2% -3% -3% -2% -2% 6% 3% 3% 6% 1.7%
Source: HSE Employment Reports
Pharmaceutical spend
The largest element of growth in total non-pay related health expenditure is pharmaceuticals.
Pharmaceutical expenditure has fluctuated over the period 2012 to 2019. Expenditure on
some community schemes26 decreased from 2012 to 2014 as a consequence of the
introduction of a number of measures tightening eligibility and reducing supplier fees
(FEMPI). However from 2014 to 2019 pharmaceutical expenditure was on an upward
26 General Medical Services (GMS), Drug Payment Schemes (DPS), Long Term Illness (LTI)

96
trajectory, this is similar to the trend in overall health expenditure as significant growth
occurred from 2014 onwards.
Figure 3: Pharmaceutical Spend Across Hospitals and Community Schemes 2012-2019
Source: PCRS Administrative Data, HSE Acute Hospital Drugs Cost Estimate
The impact of new and more advanced treatment options in the form of high-tech drugs is
both significant in enhancing the wellbeing of individuals with illnesses and remains a
significant challenge in terms of overall budget impact, due to their high costs.
Hospital Expenditure
Acute hospital gross expenditure remained relatively flat from 2013 to 2014, and then
expenditure rose consistently. The majority of the increase in hospital spend from 2013 to
2019 is explained by the considerable growth in pay expenditure over the period. Hospital
expenditure increased by 39% over the period 2013 to 2019 and in 2019 67% of expenditure
was on pay related spend.
Growth in non–pay expenditure in hospitals followed a similar trajectory to spend on hospital
drugs. Mainstream hospital drugs account for 70% of total drugs spend. Hospital drug spend
increased by €197m (63%) over the period 2013 to 2019 which explains the majority of the
increase in non-pay spend in hospitals over the period. Growth in hospital drug spend began
to stabilise after as a result of a pharmaceutical sector agreement in 2016. This agreement
reduced the price the State pays for medicines in Ireland. The impact of this agreement is
evident from 2016 to 2017 when spend on hospital drugs increased by just 3%, however,
further increases have been evident in subsequent years.
€1,591 €1,498 €1,450 €1,441 €1,517 €1,514 €1,601 €1,662
€301 €314 €336 €378
€413 €424 €460
€511
€0
€500
€1,000
€1,500
€2,000
€2,500
2012 2013 2014 2015 2016 2017 2018 2019
mill
ion
s
PCRS (less Homecare/Hospital) Hospital
€1,892€1,812 €1,786 €1,819
€1,930 €1,938
€2,061€2,173

97
Caesarean Sections
Figure 4: Caesarean Sections per 1,000 live births, 2017
Caesarean sections can
result in increased financial
costs and lengthier stays in
hospital. Ireland’s rate of
caesarean section has
increased steadily since
2010 when there were 260.4
sections for every 1,000 live
births (26%). In 2017, Ireland
had the 7th highest rate of
caesarean section per 1,000
live births in the OECD, with
314 sections taking place for
every 1,000 live births (31%).
This is above the OECD
average of 262.1 caesarean
sections per 1,000 live births
and well above the 10-15%
the WHO recommended
national C-section rate.
Source: OECD
Obesity
Obesity significantly increases the risk of chronic disease placing additional pressure on a
country’s healthcare system. It is associated with many forms of cancers, stroke, type-2
diabetes and heart disease. The treatment of obesity and its related ailments also comes with
direct and more significantly indirect costs in the form of public health care spend. It is an
increasing health and budgetary concern in Ireland and indeed around the world.
Ireland has seen a marked increase in obesity rates over the last two decades. Measured using
BMI, Eurostat 2014 statistics show Ireland as the 10th most obese country in Europe with
18.2% of the population obese. 15.6% of the EU population in 2014 was obese, that’s one in
every 6 adults over 18 years of age. The WHO forecast that by 2030, 47% on the adult
population over 20 years of age in Ireland will be obese27. It appears that this is and will
27 Based on 2008 estimates.
0 100 200 300 400 500 600
ISR
NOR
ISL
NLD
FIN
SWE
LTU
EST
FRA
DNK
BEL
SVN
LVA
CZE
ESP
OECD
NZL
GBR
CAN
AUT
LUX
SVK
DEU
IRL
CHE
ITA
HUN
POL
KOR
TUR
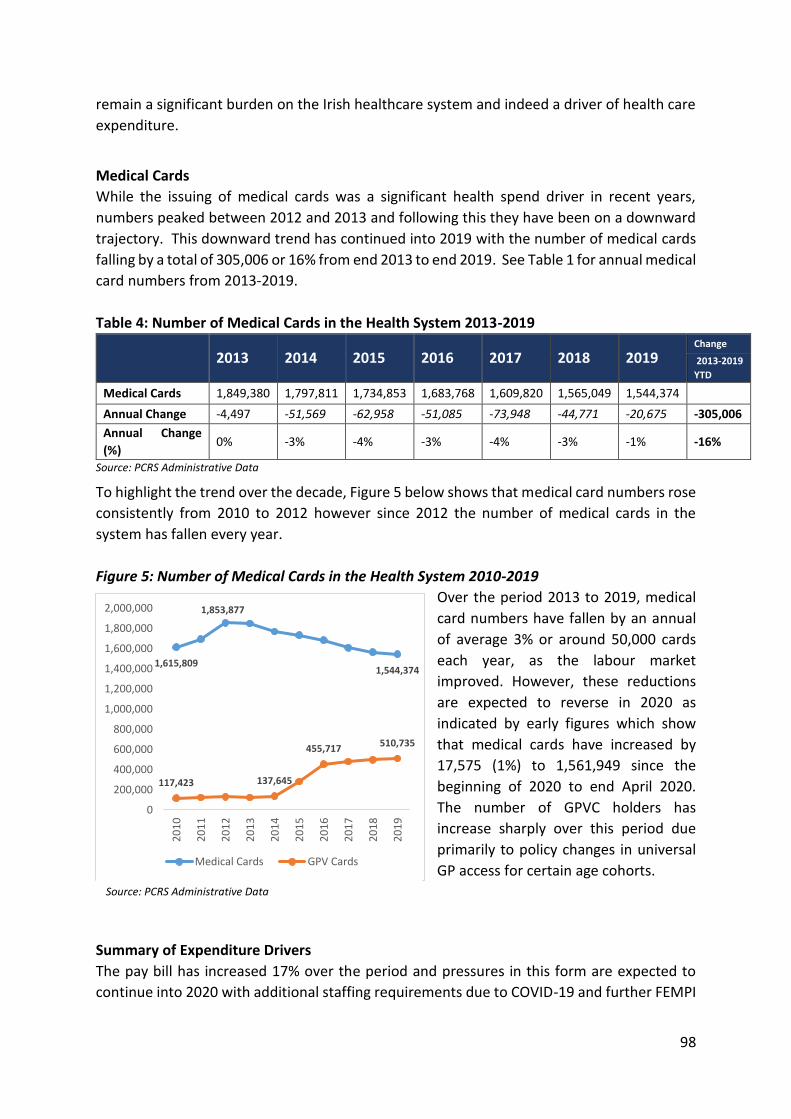
98
remain a significant burden on the Irish healthcare system and indeed a driver of health care
expenditure.
Medical Cards
While the issuing of medical cards was a significant health spend driver in recent years,
numbers peaked between 2012 and 2013 and following this they have been on a downward
trajectory. This downward trend has continued into 2019 with the number of medical cards
falling by a total of 305,006 or 16% from end 2013 to end 2019. See Table 1 for annual medical
card numbers from 2013-2019.
Table 4: Number of Medical Cards in the Health System 2013-2019
2013 2014 2015 2016 2017 2018 2019 Change
2013-2019
YTD
Medical Cards 1,849,380 1,797,811 1,734,853 1,683,768 1,609,820 1,565,049 1,544,374
Annual Change -4,497 -51,569 -62,958 -51,085 -73,948 -44,771 -20,675 -305,006
Annual Change
(%) 0% -3% -4% -3% -4% -3% -1% -16%
Source: PCRS Administrative Data
To highlight the trend over the decade, Figure 5 below shows that medical card numbers rose
consistently from 2010 to 2012 however since 2012 the number of medical cards in the
system has fallen every year.
Figure 5: Number of Medical Cards in the Health System 2010-2019
Over the period 2013 to 2019, medical
card numbers have fallen by an annual
of average 3% or around 50,000 cards
each year, as the labour market
improved. However, these reductions
are expected to reverse in 2020 as
indicated by early figures which show
that medical cards have increased by
17,575 (1%) to 1,561,949 since the
beginning of 2020 to end April 2020.
The number of GPVC holders has
increase sharply over this period due
primarily to policy changes in universal
GP access for certain age cohorts.
Summary of Expenditure Drivers
The pay bill has increased 17% over the period and pressures in this form are expected to
continue into 2020 with additional staffing requirements due to COVID-19 and further FEMPI
1,615,809
1,853,877
1,544,374
117,423 137,645
455,717510,735
0
200,000
400,000
600,000
800,000
1,000,000
1,200,000
1,400,000
1,600,000
1,800,000
2,000,000
20
10
20
11
20
12
20
13
20
14
20
15
20
16
20
17
20
18
20
19
Medical Cards GPV Cards
Source: PCRS Administrative Data

99
restoration measures expected in October 2020. Hospital expenditure has also increased over
the period and has been signalled as a significant expenditure driver again for 2020. This is
discussed in further detail in Section 4. While C-section rates have continued to increase and
this is ultimately a clinical decision as well as an expenditure pressure, the percentage of
women in child bearing age continues to fall as does the number of children borne by each.
Although obesity has been noted as a significant expenditure risk going forward, the most
recent Programme for Government does outline preventative measures such as tackling
obesity and promoting exercise for increased health benefits. Such measures may save money
in the long-term if implemented in a manner that brings about behavioural changes.
The State’s total pharmaceutical spend is a significant driver with a 31% increase (almost
€0.6bn) increase over the 2014-2020 period. The cost of new drugs, expanding eligibility and
demographics are the main drivers and will provide a challenge into the future. Savings
associated with the significant decline in the numbers of medical cards allocated in recent
years have dissipated and early indications in 2020 are that card numbers are increasing.
The increased investment in health over the past decade has been associated with improving
health outcomes in the population. The clearest and most objective measure of this success
is perhaps the growth in life expectancy that has been witnessed since 2010, as shown in
Figure 11.
Life Expectancy
Figure 6: Life Expectancy at Birth (years); 2010-2018
Source: worldbank.org
Ireland’s life expectancy at birth has increased 2.3% over the decade. In 2010, Irish life
expectancy at birth was 80.7 years; 2.4 months more than the EU15 average of 80.5 years.
80.780.9
81.7
82.6
80.5
81.3
81.8 81.9
79.5
80
80.5
81
81.5
82
82.5
83
2010 2011 2012 2013 2014 2015 2016 2017 2018
Age
(ye
ars)
Ireland EU 15 Average (excl. Ireland)

100
During the economic downturn there was some divergence but in 2016 Ireland’s life
expectancy at birth converged with the EU15 average, at 81.8 and 81.7 years respectively.
The following two years saw Ireland’s life expectancy at birth rise further and surpass the
EU15 average, to reach 82.6 years in 2018, compared with 81.9 years average of the
remaining EU15.
The growth in life expectancy in those years coincides with expenditure growth of €14.2bn to
€16.2bn (14%) across the same period; an average annual increase of €251m. This growth in
life expectancy suggests that investment into healthcare in recent decades has translated into
tangible benefits for the population. However given the amount invested in health care each
year and Ireland’s relatively young population, it may be the case that our performance in
terms of health metrics is not as strong as it may appear on the surface.
Elderly population
Figure 7: Percentage of Population classified as elderly (>65 years), 2010-2019
Source: Eurostat
The growth in the proportion of elderly within the population is something which healthcare
and other areas of public expenditure, such as social welfare, are focused on in planning for
the future. However, latest comparison figures (2019) show that Ireland’s population remains
the youngest in the EU with the proportion of elderly in the population just 14.1%, 5.7
percentage points less than the EU average in 2019 of 19.8. Ireland has also witnessed a
growth in healthy life years over the period. In 2009 an individual in Ireland was expected to
have 61.8 healthy life years and by 2019 this had increased two years to 63.8.
Census 2016 found the average age in Ireland to be increasing with the projected old age
dependency ratio set to rise from 20% in 2016 to 28% by 2031. The number of persons over
65 as a percentage of the working age population is in line with the European Commission’s
11.2%
14.1%
17.4%
19.8%
0.0%
5.0%
10.0%
15.0%
20.0%
25.0%
2010 2011 2012 2013 2014 2015 2016 2017 2018 2019
Ireland EU 15 Average (excl. Ireland)

101
2015 Ageing Report which forecasts that by 2060 public expenditure in long-term care will
increase by a proportionately greater extent than total expenditure on healthcare.
In the general population overall, there is on average a 50:50 split in males and female.
However as you move through the age groups, the female to male ratio increases. 66% of the
population in Ireland over 85 is female and 3% of the elderly population in Ireland are co-
funded by the State to reside in long term residential care through the Nursing Home Support
Scheme (NHSS).
While the elderly population is increasing in numerical terms, it remains relatively small (but
growing) proportion of the overall population. The largest proportion of the Irish population
remains aged under 4028.
From 2013 to 2019, Exchequer expenditure on the Scheme grew by almost €100 million or
11% at a time when the proportion of the elderly population increased by less than 2%. At
end 2019, there were 23,629 people supported in the Scheme. The elderly population were
also supported with 18.3 million public-funded home-support hours delivered in 2019.
While no significant correlations exist, the Economic and Social Research Institutes (ESRI) in
the Projections of Demand for Healthcare in Ireland 2015-2030, has found that the demand
for places in nursing homes and other settings for long as well as intermediate term periods
is forecast to increase by between 40% to 54% from 2015-2030. Over the same period,
demand for home help hours is estimated to increase in the range of 38% to 54%.
It is within this context of a small but growing elderly population that has a comparatively
high life expectancy at 65 (the cohort that this policy is most applicable to) and the forecasted
increase in demand for nursing home places that Ireland may see a significant increase in
healthcare spend into the future. Demand for residential nursing home places has increased
over the decade.
Bed occupancy rate (%) acute care hospitals
There were 1.7 million in-patient and day cases provided in the acute hospital setting in 2019
with 84% of individuals stating that their patient experience in the acute health care services
was ‘good’ or ‘very good’ in 2019.
In the twenty years from 1980 to 2000 the bed occupancy rate rose just 3 percentage points
from 82% occupancy to 85%. The following decade saw a much steeper rise of 6 percentage
28 While the age profile of a population and demographic trends may influence a country’s interaction with the health care system, it should be noted here that there remains no consensus on the extent to which population ageing necessarily results in proportionally higher healthcare expenditure. Smith et al (2000) found that the impact of an ageing population on healthcare expenditure to be minor with healthcare spend more strongly associated with proximity to death than the age of the population, in explaining US health spending over the period 1940-1990 (Smith, 2000). In line with this, an Irish analysis found no significant correlation in changes in the size of the elderly population and the demand for Nursing Home Support Scheme (NHSS) funding in Ireland (Campbell and Connors, 2015).

102
points to 91.4%. The same increase in the 20 year period from 1980 to 2000 was seen in just
4 years from 2010 to 2014. Ireland’s bed occupancy rate has been above that of the EU
average consistently since 1987. The graph below shows the divergence from 2010 to 2014.
Bed occupancy rate was 16% higher during the period than the EU average.
Figure 8: Bed occupancy rate 2010-2014
Source: WHO
Bed occupancy is likely to increasingly become an issue as we focus on infectious disease
management going forward. This is highlighted on an annual basis during flu season when
additional beds (trollies) are placed in hallways to attempt to accommodate demand. Under
the National Development Plan, Ireland 2040, there is a commitment to provide an additional
2,600 beds across three ‘elective-only’ hospitals in Dublin, Cork and Galway. This capital
investment will assist in the bed occupancy rate.
Cancer
Across the EU, cancer is linked to over a quarter of all deaths29 and is one of the main causes
for hospitalisation, with breast cancer the highest prevalence and incidence in cancer types.
Many EU countries, including Ireland, have a variety of early detection measures in the form
of cancer screening programmes. Such screening programmes aim to detect cancer while it is
treatable and before it becomes life threatening. There are four areas of population based
health screening in Ireland, three of which are cancer related.
In 2015 the eligible uptake rate for the breast cancer screening programme in Ireland
‘BreastCheck’ was 74.7%, with similar rates across other services. This had risen to 75.15 by
29 In the age group under 65 it accounts for 37% of all deaths.
77.2% 76.8% 76.7% 76.7% 76.9%
91.4% 91.9% 92.6% 93.8% 93.3%
0.0%
10.0%
20.0%
30.0%
40.0%
50.0%
60.0%
70.0%
80.0%
90.0%
100.0%
2010 2011 2012 2013 2014
EU Ireland

103
2016. In the 2017/18 cycle, all counties surpassed the 70% uptake rate of those in the eligible
population30. Breastcheck31 undertook 170,957 screenings in 2019.
23% of all cancer survivors are breast cancer survivors in Ireland. Despite this and while five-
year survival rates in Ireland for all cancers have improved, they are still below that of the
OECD average in terms of breast cancer five year net survival; 82% compared with 85%. The
OECD32 found a positive relationship between per capita health spend and life expectancy
including that of 5-year net survival from breast cancer. Despite significant investment in
health, breast cancer mortality rates in Ireland are among the highest in the EU and are
above the OECD35 average.
Pain
While pain is subjective it can be a good measure of the health of the population.
Psychological effects as well as mental health issues can be associated with pain, in particular
chronic pain. The graph below compares Ireland in terms of severe/ very severe pain with
those of EU15.
Figure 9: Severe or very severe bodily pain by country EU 15 2014
Source: Eurostat
30 Although it should be noted that some few areas, mainly those showing deprivation, did fall below the standard. 3131 Breast screening in Ireland operates on a bi-annual cycle across all counties. It is free to access for those within the eligible population of 50 to 69 years. 32 https://www.oecd.org/health/health-systems/Health-at-a-Glance-2019-Chartset.pdf
0.0 2.0 4.0 6.0 8.0 10.0 12.0 14.0 16.0
Ireland
Denmark
France
Spain
Luxembourg
UK
Sweden
Finland
Austria
Germany
Italy
Greece
EU 15 (ex. Ireland) average
Belgium
Netherlands
Portugal
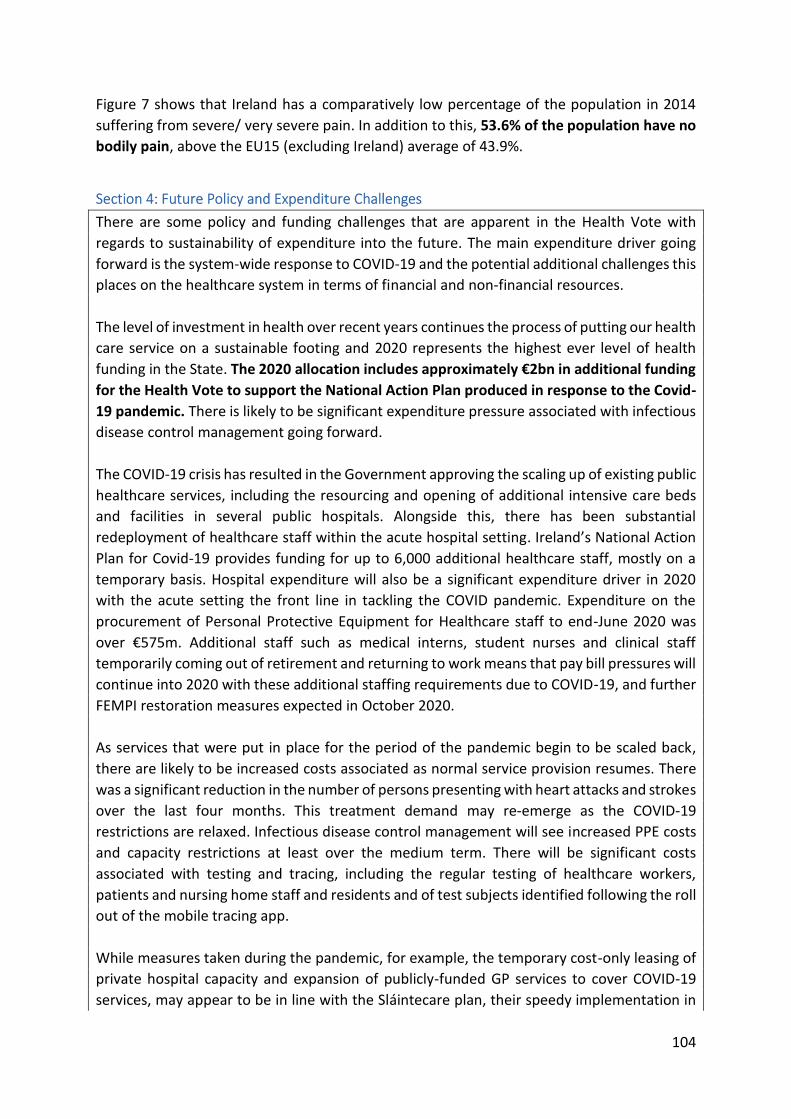
104
Figure 7 shows that Ireland has a comparatively low percentage of the population in 2014
suffering from severe/ very severe pain. In addition to this, 53.6% of the population have no
bodily pain, above the EU15 (excluding Ireland) average of 43.9%.
There are some policy and funding challenges that are apparent in the Health Vote with
regards to sustainability of expenditure into the future. The main expenditure driver going
forward is the system-wide response to COVID-19 and the potential additional challenges this
places on the healthcare system in terms of financial and non-financial resources.
The level of investment in health over recent years continues the process of putting our health
care service on a sustainable footing and 2020 represents the highest ever level of health
funding in the State. The 2020 allocation includes approximately €2bn in additional funding
for the Health Vote to support the National Action Plan produced in response to the Covid-
19 pandemic. There is likely to be significant expenditure pressure associated with infectious
disease control management going forward.
The COVID-19 crisis has resulted in the Government approving the scaling up of existing public
healthcare services, including the resourcing and opening of additional intensive care beds
and facilities in several public hospitals. Alongside this, there has been substantial
redeployment of healthcare staff within the acute hospital setting. Ireland’s National Action
Plan for Covid-19 provides funding for up to 6,000 additional healthcare staff, mostly on a
temporary basis. Hospital expenditure will also be a significant expenditure driver in 2020
with the acute setting the front line in tackling the COVID pandemic. Expenditure on the
procurement of Personal Protective Equipment for Healthcare staff to end-June 2020 was
over €575m. Additional staff such as medical interns, student nurses and clinical staff
temporarily coming out of retirement and returning to work means that pay bill pressures will
continue into 2020 with these additional staffing requirements due to COVID-19, and further
FEMPI restoration measures expected in October 2020.
As services that were put in place for the period of the pandemic begin to be scaled back,
there are likely to be increased costs associated as normal service provision resumes. There
was a significant reduction in the number of persons presenting with heart attacks and strokes
over the last four months. This treatment demand may re-emerge as the COVID-19
restrictions are relaxed. Infectious disease control management will see increased PPE costs
and capacity restrictions at least over the medium term. There will be significant costs
associated with testing and tracing, including the regular testing of healthcare workers,
patients and nursing home staff and residents and of test subjects identified following the roll
out of the mobile tracing app.
While measures taken during the pandemic, for example, the temporary cost-only leasing of
private hospital capacity and expansion of publicly-funded GP services to cover COVID-19
services, may appear to be in line with the Sláintecare plan, their speedy implementation in

105
response to a health care crisis does not constitute a clear roadmap to achieving universal
healthcare by sustainable means. However the pandemic does present an opportunity to
embed a culture of data driven policymaking in various health sectors, and to maintain and
nurture the expertise and experience in evidence synthesis and modelling gained over the
course of the crisis. The use of technology, in particular telemedicine and in pharmacy
engagements such as in relation to prescribing practices has increased substantially over the
period. The use of such technology for remote healthcare consultations could be a cost-
effective method to significantly impact how services are delivered if this is retained and
expanded following the pandemic. The rapid increase in the use of remote consultations via
telephone or videoconference may accelerate the long-term adoption of this technology
within the health system. Many of these products are being licensed free of charge to
healthcare providers during the pandemic. This may create a familiarity and acceptance of
this technology that will see it being retained and expanded after COVID-19.
The cataclysm of COVID has occurred at a time of a wide-reaching programme of
transformational change under Sláintecare. Sláintecare is a programme which sets out to
achieve a universal single-tier health and social care system; one in which everyone has equal
access to services based on need, and not ability to pay. Over the next year the focus of this
programme is on community healthcare, increasing capacity and deciding on patient access
and entitlements to universal care free at the point of delivery. Achieving these goals in a
sustainable manner will be a challenge and indeed wider societal changes in health-related
behaviours and preferences have the potential to produce more profound changes in the long
run than any specific health policy decisions.

106
Housing, Planning & Local Government Garrett O’Rorke
Summary
o The Department of Housing, Local Government and Heritage (DHLG&H)1 vote
disburses central government allocations for housing programmes, water services,
planning and local government and Met Éireann. Since 2018, the vote also
includes funding for Irish Water‘s domestic water services and capital projects.
o DHLG&H gross exchequer expenditure has increased from €2.1bn in 2010 to a
peak of just over €4.2bn in 2020. Following the economic crisis, it dropped below
€1bn in 2014 but has since returned to pre-crash levels. This does not reflect
transfer of functions over the period.
o Housing stock in the State has risen from approximately 1.16 million units in 1991
to just over 2 million units in 2016.
o The State currently has a shortage of housing to meet overall demand. Current
estimates of overall housing need is 25,000 units per annum in the short term. The
National Development Plan notes that from 2020 to 2027, in the region of 30,000
to 35,000 units will be required per annum to address pent up demand. The
Central Bank also estimate the level of demand at 34,000 units2. CSO data for new
completions in 2019 show that 21,241 additional housing units were built in that
year.
o Under the Rebuilding Ireland Action Plan, the Government has committed to
investing €6bn to advance a range of policy interventions to ensure a sustainable
and sufficient supply of housing. 50,000 additional units of social housing stock
have been targeted in the action plan by 2021, with a further 87,000 social
housing solutions provided over the lifetime of the plan.
o Under the National Development Plan, from 2021, local authorities and approved
housing bodies will be providing 12,000 social housing homes to those on social
housing waiting lists annually. This level of provision will be maintained over the
remainder of the period of the National Development Plan (2022 to 2027 at a cost
of €7.5bn resulting in an additional 72,000 households having their housing needs
met in a social housing home over the next decade).
o The Land Development Agency (LDA) was established to ensure the optimal use of
State land, with the key strategic objective to coordinate appropriately those lands
for regeneration and development by opening up key sites not being optimally
used, especially for home delivery, while focusing on the overall public interest in
determining land use. The LDA aims to deliver 150,000 homes over the next 20
years. Budget 2020 provided €17.5m towards the cost of activities of the LDA in
2020, ahead of its expected capitalisation through ISIF following the enactment of
the relevant primary legislation.
o To address the issue of affordability, under the Serviced Sites Fund (SSF), €310m
has been provided from 2019 to 2021 to enable affordable housing delivery, on
local authority lands, through the funding of infrastructure. Under the SSF,

107
Department of Housing, Planning and Local Government
It is very important to note that the composition of the DHLG&H Vote has changed over recent
years and therefore a year on year, like for like comparison is difficult from a Vote funding
perspective. For example, Community functions transferred to the new Department of
Community and Rural Development in 2017 and Environment programmes transferred to the
Department of Communications, Climate Action and Environment in 2015.
As provided for in the Water Services Act 2017, on foot of the Report of the Joint Oireachtas
Committee on Future Funding of Domestic Water Services, technical adjustments to the Vote
for funding Irish Water were made in the Further Revised Estimates 2017. Since 2018 all State
funding to Irish Water is being channelled through the DHLG&H Vote with the subvention
accounting for approximately one third of the total Vote in 2019.
As illustrated in Figure 1, DHLG&H expenditure declined between 2010 and 2014 but began
to rise again in 2015 and increased significantly following the launch of Rebuilding Ireland in
2016.
The Housing Programme (both current and capital) has increased by more than two and half
times from 2016 to 2019 (€943m to €2.4bn) to provide for increased delivery of housing
programmes to meet Rebuilding Ireland targets. Over the period 2015 to 2017 a greater share
of the housing budget (43%) was spent on current expenditure supports for social housing
provision with both current and capital investment peaking in 2020 (now 47.5% and 52.5%
respectively). This will see the housing needs of over 27,500 households being met in 2020.
The revised funding model for Irish Water, introduced in mid-2017, has also had an impact on
the overall size of the Vote. The Water Programme reduced during the period 2014 to 2016
reflecting the funding mechanism in place during that period but increased from 2017 to 2020
indicating the new funding model for Irish Water which is now channelled through the Vote.
approval has been given for €127m worth of infrastructure projects, facilitating
delivery of approximately 3,200 homes from 2021 onwards across 14 local
authorities.
o Since 2017, all State funding to Irish Water is being channelled through the
DHLG&H’s vote in the form of a payment for domestic water services as
determined through the regulatory process and a capital contribution. Exchequer
funding for Irish Water will total over €1.2bn in 2020 (some €596m current and
€635m capital, including the stimulus package of €43m). The Irish Water Strategic
Funding Plan 2019-2024 was approved in November 2018. It sets out Irish Water’s
multi-annual strategic funding requirement of €11bn to 2024, over €8bn of which
is to be funded through the Exchequer.

108
Figure 1: Department of Housing, Local Government and Heritage Expenditure (Gross) 2009 -
2020
Source: DPER Databank *Includes LPT self-funding
Figure 2: Current Expenditure by Programme (Gross) 2010 – 2020
Source: DPER Databank
*Includes LPT self-funding
0.606 0.741
2.0361.395
0.473
2.312
0
1
2
3
4
5
2010 2011 2012 2013 2014 2015 2016 2017 2018 2019 2020
Bill
ion
Year
Current Capital

109
Figure 3: Capital Expenditure by Programme (Gross) 2010 – 2020
Source: DPER Databank *Includes LPT self-funding
Housing
The Housing Programme (both current and capital) has increased by more than two and half
times (€943m to €2.4bn) from 2016 to 2019 to provide for increased delivery of housing
programmes under Rebuilding Ireland targets. Expenditure increased significantly in 2017 and
2018, increasing by 49% and 46% respectively, in 2019 it increased a further 18%. The 2020
REV allocation increases the housing programme budget by a further 7% in 2020 to €2.5bn.
€173 €337 €745 €836
€233
€377
€418 €496
€2,500
€58
€153
€277
€382
€89
€109
€139
€165
€0
€500
€1,000
€1,500
€2,000
€2,500
€3,000
2016 2017 2018 2019 2020
Mill
ion
Housing Expenditure
Build Acquisition Lease RAS HAP Homelessness Other

110
Developments in the overall housing market are strongly interlinked with the operation of
social housing and housing support programmes. In particular, developments in disposable
income, property purchase and rent prices affect overall social and affordable housing
demand. Property prices nationally have increased by 82.9% from their trough in early 2013.
Dublin residential property prices have risen 91.4% from their February 2012 low, whilst
residential property prices in the rest of Ireland are 81.7% higher than at the trough, which
was in May 2013. Figure 4 below provides an overview of property price developments in
recent years.
Figure 4: Residential Property Price Index; Jan 2010 – July 2020
Source: CSO
Similarly the cost of renting a property has risen significantly over the last six years as
demonstrated in Figure 5.
Figure 5: Residential Tenancies Board Rent Index, 2010 Q1 – 2020 Q2
Source: RTB
0
20
40
60
80
100
120
140
160
2010 2011 2012 2013 2014 2015 2016 2017 2018 2019 2020
Ind
ex (
10
0:2
00
5)
Residential Property Price Index, Jan 2010 - July 2020
National
Dublin
Nationalexcluding Dublin
0
20
40
60
80
100
120
140
160
2010 2011 2012 2013 2014 2015 2016 2017 2018 2019 2020
Ind
ex
(10
0:2
00
7Q
4)
RTB Rent Index, 2010Q1-2020Q2
National
Dublin
Outside GDA

111
The Homeless budget has increased substantially from €45m in 2014 to €166m in 2020.
This represents a cumulative annual growth rate of 30% in the last seven years. The
significant budget increases reflect the increase in homelessness since 2014.
In August 2014, there were 385 families in emergency accommodation while in August
2020, there were 1,120 families, an increase of 190%. The August 2020 figure is the lowest
since June 2016 (1,078). Between January and August 2020 there was a sharp drop of 30%
or 491 less of families in emergency accommodation. Recent figures show a gradual
reduction, particularly in relation to family homelessness. While some of this reduction can
be attributed to an increase in the number of exits to tenancies, emergency legislation
introduced due to COVID 19, resulting in a moratorium on evictions from the private rented
sector also had a significant impact over the last six months.
Figure 6: Homeless Families, dependants and singles in emergency accommodation Q2 2014 to Q2 2020
Source: DHLG&H
Figure 7: Social housing rental solutions
Category Target
2016
Output
2016
Target
2017
Output
2017
Target
2018
Output
2018
Target
2019
Output
2019
Cumulative
2016 to end
2019
Target
2020
Target
2021
Overall
Target 16-
21
RAS 1,000 1,256 1,000 890 600 755 600 1,043 3,944 600 0 3,800
HAP 12,000 12,075 15,000 17,916 17,000 17,926 16,760 17,025 64,942 15,750 10,000 86,510
Subtotal 13,000 13,331 16,000 18,806 17,600 18,681 17,360 18,068 68,886 16,350 10,000 90,310
Source: DHLG&H
The latest estimate of social housing demand puts the total net household need at 68,693 as
of June 2019. ‘Net Household Need’ is defined as the total number of households qualifying
for social housing support whose social housing need is not being met. Net household need
increased between 2013 and 2016 by 1.9% or 1,728 households with a slight decline of almost
5,000 between 2016 and 2017. As of June 2019 the number of households on the waiting list
0
500
1000
1500
2000
2500
3000
3500
4000
4500
5000
Q2
20
14
Q3
20
14
Q4
20
14
Q1
20
15
Q2
20
15
Q3
20
15
Q4
20
15
Q1
20
16
Q2
20
16
Q3
20
16
Q4
20
16
Q1
20
17
Q2
20
17
Q3
20
17
Q4
20
17
Q1
20
18
Q2
20
18
Q3
20
18
Q4
20
18
Q1
20
19
Q2
20
19
Q3
20
19
Q4
20
19
Q1
20
20
Q2
20
20
Families, dependants and singles in emergency accommodation
Families Dependants Singles

112
decreased by 3,165 (-4.4%) compared to the previous assessment, with 19 of the 31 local
authorities reporting a decrease. With regard to ‘Net Need’ in Figure 8, it is important to note
that it excludes those already receiving social housing support, for example, the Housing
Assistance Payment. Recipients on HAP can elect to be included on a transfer list for a
permanent social house. The numbers on the HAP transfer list are unknown, but at the end
of 2019 there were over 52,000 active HAP tenancies. Data is not comparable pre-2013 as the
collection methodology changed.
Figure 8: Net Household Need 1993-2019
Source: Housing Agency
Water
The investment being delivered by Irish Water will contribute to maintaining public water and
waste water infrastructure to continue current levels of service, achieve environmental
compliance and support expansion, deliver improvements in drinking water quality and
capacity, manage waste water to protect and enhance our environment and to support
growth and economic development for Ireland.
The Irish Water Strategic Funding Plan 2019-2024, which will facilitate the investment
outlined above, was approved in November 2018. It sets out Irish Water’s multi-annual
strategic funding requirement of €11bn to 2024, comprised of a €6.1bn investment in
infrastructure and assets, and €4.9bn in operating costs. Over €8bn of the total €11bn
investment will be funded by the State. Irish Water is refreshing the Strategic Funding Plan
(SFP) following the Commission for Regulation of Utilities (CRU) Third Revenue Control (RC3)
determination for the period 2020-2024 for Irish Water.
Table 5: Irish Water Infrastructure Outputs 2018-2024
0
20000
40000
60000
80000
100000
120000
1993 1996 1999 2002 2005 2008 2011 2013 2016 2017 2018 2019
Net Household Need, 1993 - 2019

113
Outputs 2018-2024
Commissioning new/upgraded wastewater treatment plants (Number)
134
Commissioning new/upgraded water treatment plants (Number)
42
Provision of wastewater treatment at agglomerations previously discharging raw sewage (Number)
44
Delivery of new rehabilitated water mains (km) 600
Millions of litres of water saved per day 245 Source: Irish Water
Planning
The National Development Plan (NDP) sets out the significant level of investment, almost
€116bn, which will underpin the National Planning Framework and drive its implementation
from 2018 to 2027. As part of the NDP, the Government has committed €2bn to the Urban
Regeneration and Development Fund (URDF) to be administered by DHLG&H. The URDF looks
to support more compact and sustainable development, with a particular focus on the five
cities and other large urban centres. Budget 2020 provides funding of €96.5m (with an
additional €33.5m carried over) for the URDF. The NDP has also promised €1bn for the Rural
Regeneration and Development Fund, to promote rural renewal and sustainable growth for
these communities. The NDP intends on building an average of 25,000 to 30,000 homes per
year in order to meet future needs, with 112,000 social houses by 2027.
The Land Development Agency (LDA), a body under DHLG&H, was established on an interim
basis in September 2018 and is working to ensure the optimum management of State land
with an immediate focus on providing new homes, including social and affordable housing.
Budget 2020 provided €17.5m towards the cost of activities of the LDA in 2020, ahead of its
expected capitalisation through ISIF following the enactment of the relevant legislation.
Housing
As the RBI delivery streams (Table 2) are not directly linked to Housing Programme Subheads
in the Revised Estimates (Table 3), it is difficult to track spend against outputs (delivery). This
point has also been made by the Parliamentary Budget Office (PBO) in its February 2019 paper
on the Revised Estimates33.
The 2020 RBI output target for social housing delivery, as per Table 2, is 11,167. This figure
comprises build (7,736), acquisition (800) and lease (2,631). This overall output target is not
reflected in the REV Key High Level Metrics template (Table 3). For example, in Table 3 the
33 https://data.oireachtas.ie/ie/oireachtas/parliamentaryBudgetOffice/2019/2019-02-26_revised-estimates-for-public-services-2020_en.pdf
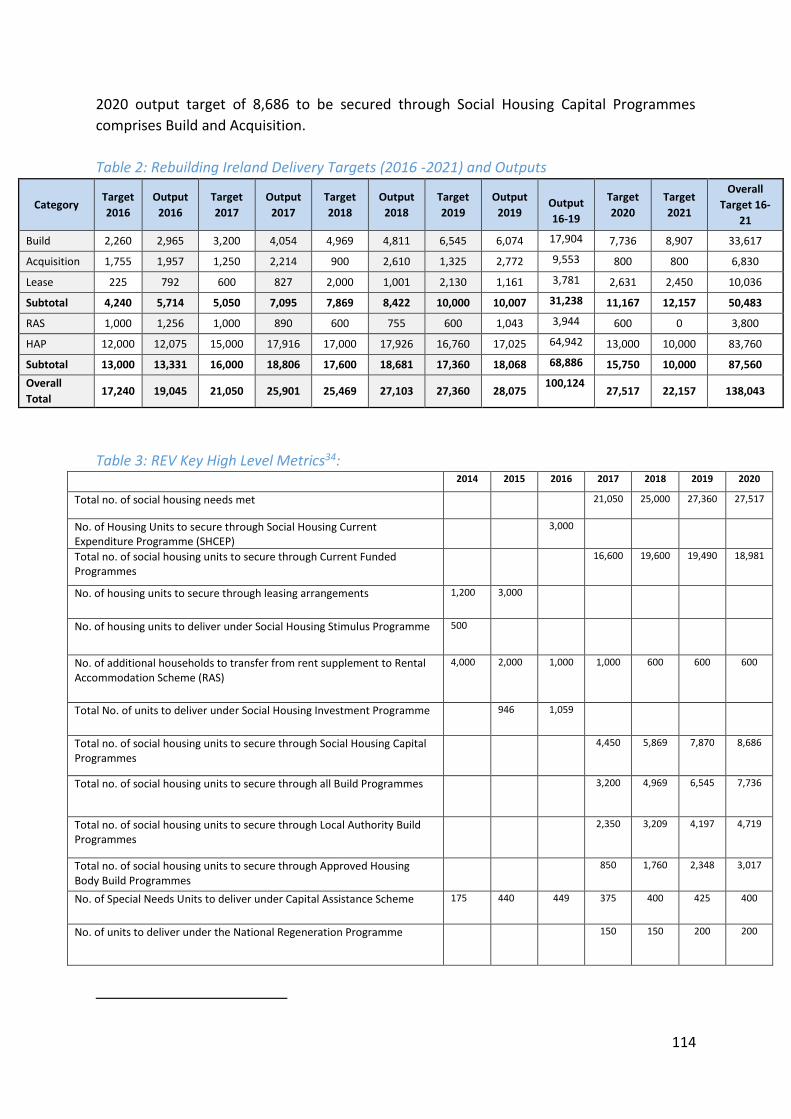
114
2020 output target of 8,686 to be secured through Social Housing Capital Programmes
comprises Build and Acquisition.
Table 2: Rebuilding Ireland Delivery Targets (2016 -2021) and Outputs
Category Target
2016
Output
2016
Target
2017
Output
2017
Target
2018
Output
2018
Target
2019
Output
2019
Output
16-19
Target
2020
Target
2021
Overall
Target 16-
21
Build 2,260 2,965 3,200 4,054 4,969 4,811 6,545 6,074 17,904 7,736 8,907 33,617
Acquisition 1,755 1,957 1,250 2,214 900 2,610 1,325 2,772 9,553 800 800 6,830
Lease 225 792 600 827 2,000 1,001 2,130 1,161 3,781 2,631 2,450 10,036
Subtotal 4,240 5,714 5,050 7,095 7,869 8,422 10,000 10,007 31,238 11,167 12,157 50,483
RAS 1,000 1,256 1,000 890 600 755 600 1,043 3,944 600 0 3,800
HAP 12,000 12,075 15,000 17,916 17,000 17,926 16,760 17,025 64,942 13,000 10,000 83,760
Subtotal 13,000 13,331 16,000 18,806 17,600 18,681 17,360 18,068 68,886 15,750 10,000 87,560
Overall
Total 17,240 19,045 21,050 25,901 25,469 27,103 27,360 28,075
100,124 27,517 22,157 138,043
Table 3: REV Key High Level Metrics34:
2014 2015 2016 2017 2018 2019 2020
Total no. of social housing needs met
21,050 25,000 27,360
27,517
No. of Housing Units to secure through Social Housing Current Expenditure Programme (SHCEP)
3,000
Total no. of social housing units to secure through Current Funded Programmes
16,600 19,600 19,490 18,981
No. of housing units to secure through leasing arrangements 1,200 3,000
No. of housing units to deliver under Social Housing Stimulus Programme 500
No. of additional households to transfer from rent supplement to Rental Accommodation Scheme (RAS)
4,000 2,000 1,000 1,000 600 600 600
Total No. of units to deliver under Social Housing Investment Programme 946 1,059
Total no. of social housing units to secure through Social Housing Capital Programmes
4,450 5,869 7,870
8,686
Total no. of social housing units to secure through all Build Programmes 3,200 4,969 6,545 7,736
Total no. of social housing units to secure through Local Authority Build Programmes
2,350 3,209 4,197
4,719
Total no. of social housing units to secure through Approved Housing Body Build Programmes
850 1,760 2,348 3,017
No. of Special Needs Units to deliver under Capital Assistance Scheme 175 440 449 375 400 425 400
No. of units to deliver under the National Regeneration Programme
150 150 200
200

115
No. of Traveller Specific Units to deliver 40 55 75
90 110 120 130
No. of units to upgrade under retrofitting programme 14,166 11,000 12,500
12,500 9,000 3,000 1,000
No. of additional households to be supported by Housing Assistance Payments (HAP)
8,400 10,000 15,000 17,000 16,760 15,750
No. of Vacant social housing units to be refurbished and brought back to productive use
1,000 1,500 766 560 303 180
No. of properties repaired and brought into leasing under the Repair & Leasing Scheme
150 800 950 150
No. of grants to assist older people and people with disabilities to remain in their home for longer
8,200 8,500
9,000 11,000 11,000 12,000
No. of adults exiting from homelessness
3,079 4,729 5,135
3 Figures for 2013 to 2017 represent outputs and those for 2018 and 2019 represent targets. As the key metrics and how the number of housing units are tracked in the period 2013 to 2016 has changed this makes analysis of social housing provision in the context of the REV more challenging.
Water
The Key High Level Metrics assigned to the Water Programme relate to Private and Public
Group Water Schemes paid, the total number of Private Well Grants Paid and improvements
of water services in rural areas. These metrics, 7% of the allocation to Programme B, are not
reflective of the level of funding assigned to the Water Programme which comprises 31% of
the overall vote programme composition. Table 5 looks at various KPIs in relation to outputs
and targets over the period 2018 to 2020.
Metrics that could be assigned to the Irish Water Programme are, inter alia, the number of
current boil water notices lifted; the number of leakages reduced in the water network and
reductions in wastewater discharge without treatment.
Table 4: Irish Water Exchequer Funding Requirement 2019 - 2024
2019 2020 2021 2022 2023 2024 2019-2024
€m €m €m €m €m €m €m
Subvention - Current 562 606 626 630 637 636 3,697
Subvention - Non Current/ Capital Contribution
646 656 633 720 898 1014 4,567
Total Exchequer Funding Requirement
1,208 1,262 1,259 1,350 1,535 1,650 8,264
Source: Irish Water Strategic Funding Plan 2019-2024. Irish Water is preparing an updated Strategic Funding
Plan 2020-2024 following the CRU revenue control determination.
Table 5: Irish Water KPIs 2018 - 2020 2018 Output Outturn
2019 Output Target
2020 Output Target

116
(2018 Output Target)
No. of Operational Supports to Private Group Water Schemes
563 (500)
500 575
No. of Operational Supports to Private Group Water Schemes
195 (150)
145 175
Total No. of Private Wells (new and upgraded)
1,569 (3,650)
3,900 2,000
Total No. of Septic Tanks (upgraded) 83 (70)
125 250
Total No. of Waste Water Treatment Plants (new and upgraded)
11 12 5*
Total No. of Drinking Water Treatment Plants (new and upgraded)
10 8 3**
Kilometres of Waste Water Network sewer (new and rehabilitated)
74 57 19***
Kilometres of Water Network (new and rehabilitated)
416 292 189****
*Only upgrades planned for 2020 (no new plant). Capacity PE (population equivalent) for these 5 upgrades is
317,556 vs Capacity PE for 2019 of 379,540. In 2020 a number of projects are being progressed through design
and construction with project completions planned to increase for subsequent years.
**The 3 relates to 1 new & 2 upgraded plants the equivalent of 36.5 ml/day in total which compares to 85
ml/day in 2019. As above, a number of projects are being progressed through design and construction with
project completions planned to increase for subsequent years.
***The targets for 2020 are reflective of targeting rehabilitation of high priority larger diameter critical sewers,
which have a higher unit cost than the smaller sewer diameters delivered in previous years.
****Irish Water funding is being prioritised for leakage reduction programmes e.g. Find and Fix, in order to
achieve leakage savings which will also impact on reducing new and rehabilitated water network in 2020.
Planning
When comparing 2019 with the previous year, Programme D ‘Planning’ allocation has grown
by a greater proportion than any other Programme in the Vote (132%). Of this increase, 70%
(€53 million) is attributable to one subhead ‘D9 – Urban Renewal/Regeneration’. While there
are existing metrics in place in relation to the Planning Programme these cover issuing of
statutory guidance, foreshore consents and work conducted by An Bord Pleanála. Additional
metrics to cover the Urban Renewal/Regeneration Programme should also now be included.
There a number of future policy challenges for DHLG&H, particularly in the context of COVID-
19.
Housing expenditure has grown significantly over the past number of years, and at €2.6bn in
2020, has more than doubled since 2016. The existing housing delivery plan, Rebuilding
Ireland, comes to an end in 2021. The DHLG&H will need to provide for a new plan to cover

117
the next five years. This will require an evidence based approach to identify an appropriate
unit cost per delivery mechanism and appropriate delivery blend which abides by the
budgetary constraints and accords with the level of housing need.
In addition to developing the next phase of Rebuilding Ireland the DHLG&H will need to
incorporate their affordable housing strategy into the next phase of their delivery. The
affordable housing scheme will see homes being sold at discounted affordable prices to
households due to the introduction of an equity stake held by the State.
Homelessness expenditure has grown by 186% since 2016. Covid-19 has had a significant
impact on homelessness expenditure. The homeless spend has increased because of the need
to ensure compliance with social distancing requirements and the need to have necessary
isolation accommodation in place if required. The impact of Covid-19 on the homeless budget
will need to be kept under review.
Local Government funding also poses a significant challenge following the COVID-19 crisis.
Rates waivers were imposed to affected businesses who were forced to close, leading to
central government having to compensate for the lost income. The longer-term
consequences of the crisis (e.g. business closures) could also have a significant impact on rates
income in the future.
It will also be important to ensure that sufficient funding is available to meet the ambitious
programmes being delivered by Irish Water, such as the Eastern and Midlands Water Supply
Project (Shannon/Parteen Basin) and the Ringsend Wastewater Treatment Plant (WTP)
project. The Irish Water Strategic Funding Plan outlines exchequer funding of €8.3bn for the
period 2019 to 2024.

118
Justice & Equality Stephen Blake
Summary
o From 2010 to 2019, expenditure on the Justice Group of votes increased from €2.47 billion to €2.83 billion.
o As a proportion of Government expenditure, the Justice sector accounts for
almost 4.2% in 2019.
o Pay is the key driver of expenditure in the Justice sector. When combined with pensions, it accounts for approximately 70% of vote expenditure.
o International protection applications, one of the main drivers of expenditure on
direct provision accommodation, continued to rise in 2019 with a 30.2% increase in applications.
o Reform continued to gather pace in the Justice Sector last year, with the
completion of the restructuring of the Department of Justice and Equality, and the launch of the comprehensive Garda Reform implementation plan A Policing Service for the Future. There is also a new impetus for reform in the Courts Service following the publication of the Organisation Capability Review in April 2019.
o A large volume of performance indicators are utilised across the Justice sector and
the wider criminal justice system. It is timely in the context of the wider reform agenda to review the coverage, quality and use of performance indicators, commencing with a focus on policing in 2020.
o Spending Review 2019 reviewed the following areas of expenditure in the Justice
sector: - Direct Provision: Overview of Current Accommodation Expenditure
(D/Justice & Equality) - Towards a Framework for Multi-Annual Budgeting: Considerations for An
Garda Síochána (DPER).
Between 2010 and 2019 Justice Group expenditure increased by €0.37 billion, from €2.47
billion to €2.83 billion, representing an increase of 14.9%. This shows significant changes in
the level of expenditure during this period. The Group of Votes has also changed in
composition with the introduction of new votes such as the Irish Human Rights and Equality
Commission (2015) and the Policing Authority (2016). Further changes occurred in 2018 when
the functions of the Valuation Office and the Property Registration Authority transferred to

119
the Department of Housing, Planning and Local Government. Figure 2 shows the breakdown
between current and capital expenditure for each Vote over the last decade.
Figure 1: Breakdown of Justice Group Gross Expenditure by Vote 2010-2019, €000s
Source: DPER INFOR system and Databank Note: Expenditure related to IHREC was managed within the Human Rights Commission and Equality Authority subheads in the Justice vote for the period 2011 to 2014.
Figure 2: Breakdown of Justice Group Current and Capital Expenditure 2010-2019, €000s
Source: DPER INFOR system and Databank
In the 10 years between 2010 and 2019 inclusive, Justice Group expenditure increased
annually by an average of 1.4% per annum, reaching its highest level of €2.83 billion in 2019.
Justice Group expenditure declined to a low of €2.27 billion in 2014, falling by €0.19 billion or
8% compared with the corresponding figures in 2010. It increased by €0.56 billion or 25% to
the €2.83 billion reached in 2019.
0
500,000
1,000,000
1,500,000
2,000,000
2,500,000
3,000,000
2010 2011 2012 2013 2014 2015 2016 2017 2018 2019
€,0
00
Val Office Garda Prisons Courts PRA Justice IHREC PA
-
500,000
1,000,000
1,500,000
2,000,000
2,500,000
3,000,000
2010 2011 2012 2013 2014 2015 2016 2017 2018 2019
€ 0
00
Justice Group Current and Capital 2010-2019

120
Figure 1 also shows that over the decade, the three biggest contributors to expenditure on
the Justice Group were the Garda Vote, the Prisons Vote and the Justice Vote. Figure 3 shows
the proportional breakdown of expenditure for 2019 compared to 2010. There was some
variation over that period – for example, Garda spending as a share of total justice sector
spending was approximately 62% in 2010 but increased to 63% in 2019. Justice vote spending
accounted for a marginally larger share of spending in 2019 (19%), compared to 2010 (17%).
Conversely, the relative share of Prisons Vote spending has decreased slightly from 14% to
13%.
Figure 3(a) - Justice Group Gross Expenditure, 2019
Figure 3(b) - Justice Group Gross Expenditure, 2010
Source: DPER INFOR system and Databank Source: DPER INFOR system and Databank
63%13%
5%
19%
0%0%
2019 Justice Group Vote Expenditure by Vote
Garda Prisons
Courts Justice
IHREC Policing Authority
62%14%
6%
17%
1%
2010 Justice Group Vote Expenditure by Vote
Garda Prisons Courts Justice PRA

121
Pay and Numbers
Staff is the most important influence on expenditure for the Justice Group of votes. Changes
in the number of Gardaí, prison officers as well as the quantum of staff across the Justice and
Courts votes have a large impact on the sustainability of expenditure. Table 1 shows that,
taken together, pay and pensions accounted for 70% of total gross public expenditure on the
Justice Group of votes in 2019. This is 2.3% less than the equivalent share in 2010.
Table 1: Justice Group Gross Expenditure by composition: 2010 - 2019 2010 2014 2019
Pay and Pensions 72.3% 73.6% 70.0%
Non Pay 23.5% 23.0% 24.3%
Capital 4.2% 3.4% 5.7%
Totals 100% 100% 100% Source: DPER INFOR system and Databank
The number of Garda members remains the most significant staffing cohort across the Justice
sector. The sectoral policy drivers for staffing numbers across the Justice sector include,
among others:
Previous Government policy to increase numbers e.g. in policing to 21,000 (reservists,
Garda members, Garda staff)
Pressures on large operational areas e.g. the Irish Naturalisation and Immigration
Service
Regulatory demands – e.g. Data Protection Commission
Government decisions on new bodies.
Non Pay
On the non-pay side, the key drivers of expenditure continue to encompass:
Criminal and civil legal aid
Accommodation for international protection applicants
Service contracts such as GoSafe (speed cameras)
Non pay spending to support frontline staff in the Criminal Justice system (e.g. prison
officers and Gardaí) – transport and T&S, equipment etc.
Grant programmes.
Figure 4a compares occupancy and capacity in accommodation centres for international
protection applicants. It shows that numbers of international protection applicants in direct

122
provision centres has increased to at least full occupancy in terms of capacity, an increase on
the 2017 figure of 92.6%. This is in turn a reflection of the recent increase in applications since
2016 and an increase in applications of 30.2% from 2018 to 2019 (see Figure 4b). The number
of applications in 2019 stood at 4,781 and it was the first time since 2006 that numbers
exceeded 4,000 applying for asylum in the State – a very substantial increase. It should be
noted that the volume of new applications can escalate/reduce rapidly from year to year, with
the number of year-to-date applications to end May 2020 of 775 representing a 58.1%
decrease on the corresponding number of applications in May 2019 of 1,852. The recent
decrease is mainly attributable to travel restrictions arising from the COVID-19 crisis.
Figure 4a: Reception and Integration Agency Occupancy and Capacity, 2004 to 2019
Source: Reception and Integration Agency (year-end figures)
Figure 4b: Applications for Refugee Status, 2004 to 2019
Prisoner population is an example of a driver which influences both pay and non-pay and
merits a brief discussion. The average daily number of prisoners in custody in 2019 was 3,971
0
1000
2000
3000
4000
5000
6000
7000
8000
9000
2004 2005 2006 2007 2008 2009 2010 2011 2012 2013 2014 2015 2016 2017 2018 2019
RIA Capacity RIA Occupancy
0
1,000
2,000
3,000
4,000
5,000
6,000
2004 2005 2006 2007 2008 2009 2010 2011 2012 2013 2014 2015 2016 2017 2018 2019
Asylum Applications by Year

123
compared to 3,893 in 2018, an increase of 2%, as shown in figure 5. The Annual Report of the
Prison Service for 2019 notes that the numbers in custody from 1 January 2019 to end
December increased by 2.1% - a significant increase over a short term. This likely reflects
increased Garda activity (e.g. more detections) among other pressures. Continuation of this
trend will place pressures on the prisons system (both pay and non-pay) to manage this
additional demand given that the annual cost of an available staffed prison space was €75,000
in 2019.
Figure 5: Average Prisoner Population, 2009 to 2019
Source: Annual Report Prison Service
Capital Figure 6 below shows the main core components of the capital budget for the Justice Vote Group and the proportion of capital spend that each component comprises from 2014 to 2019 inclusive. The core components are as follows:
Buildings (accommodation for Prisons, Gardaí and courts)
Office equipment
ICT – case management, processing systems, new Garda systems
Transport – Garda vehicles
Capital Building Programme (An Garda Síochána)
3,200
3,400
3,600
3,800
4,000
4,200
4,400
4,600
2009 2010 2011 2012 2013 2014 2015 2016 2017 2018 2019

124
Figure 6: Justice Vote Group Selected Capital Expenditure Drivers 2014-2019
Source: DPER INFOR system
Outcomes
The Justice Vote Group covers a significant number of functions, programmes, subheads and
agencies. Accordingly, it is not possible to fully analyse the entire range of outputs and
outcomes of spending on the justice system within the scope of this chapter. Consistent with
the approach taken to the Justice chapter of the trends papers in recent years35, this section
focuses specifically on policing given the scale of reform efforts underway in the sector and
the size of Vote 20. The first section reviews the current set of indicators presented in the
Garda vote as part of the 2020 Revised Estimates. The second section considers crime trends
as published by the CSO.
Table 2 below shows the performance indicators (outputs) presented in the 2020 Revised
Estimates Volume.
Table 2: List of Garda Indicators presented in the Revised Estimates 2020 (outputs)
Indicator 2020 Target
Community Policing Implementing our new Community Policing framework in 6 Divisions 6
Protecting People
Establishing and commencing operation of satellite cybercrime hubs 3
Intelligence entries created by Roads Policing personnel +5%
Connecting Ireland to Schengen Information System 1
National Rollout of Divisional Protective Services Units 19
In-person contact within 7 days to victims of Domestic Abuse 60%
Victim Assessments completed within 3 days 85%
35 In 2018 and 2019 analysis covered satisfaction with An Garda Síochána, awareness of Local Patrols, occupancy and capacity in RIA as well as outputs for regulatory bodies such as the Data Protection Commission and the Garda Síochána Ombudsman Commission.
43%
24%
9%
9%
15%
Justice Vote Group Capital Expenditure Drivers 2014-2019
Office Equipment and External IT (AGS) Buildings and Equipment (Pris)
Transport (AGS) Office Equipment and External IT (Courts)
Capital Building Programme (AGS)

125
Enhancing governance of missing person investigations: Reducing the number of incidents with overdue reviews to 60 per month nationally
60
Mandatory Intoxication Test Breath Tests conducted 348,864
Average number of contacts per victim of crime 2.7
Our People – Our Greatest Resource
% of AGS members engaging in PALF (Performance and Accountability Learning Framework) process
60%
Transforming Our Service
Implementing Phase 1 and Phase 2 of the Garda Síochána Operating Model on a phased basis in a number of Divisions
5
Deploying Enterprise Content Management in Divisions/HQ/Specialist Sections 14
Allocation of policing enabled mobile devices 4,000
As well as these high level metrics, there are also context and impact indicators in the Revised Estimates in terms of reported crime incidents for certain offence categories as published by the CSO. In addition to these indicators, the annual Public Service Performance Report published by the Department of Public Expenditure and Reform includes additional output indicators for the Garda vote such as, among others:
Number of Gardaí reassigned to policing duties;
Average overtime hours per Garda Member per year36
Lifesaver offences where a fixed charge penalty notice was issued;
Other results from the Garda Public Attitudes Survey. The 2019 spending review published by the Department of Public Expenditure and Reform, “Towards a Framework for Multi-Annual Budgeting: Considerations for An Garda Síochána” identified 4 enablers for the advancement of multi-annual budgeting in An Garda Síochána, one of which was expenditure tools. Performance budgeting and the use of performance indicators were particular prerequisites under the expenditure tools heading that were noted as requiring further development. A spending review examining the use of performance indicators is a logical next step in progressing multi-annual budgeting and financial capability reforms in An Garda Síochána. Accordingly, in 2020 the Department of Public Expenditure and Reform proposes to publish a spending review which will examine best practice for designing performance indicators in policing, having regard to international best practice in this area. The spending review will further inform the engagement between the Department of Public Expenditure and Reform, the Department of Justice and Equality and An Garda Síochána when selecting appropriate performance indicators and metrics for use in the 2021 Revised Estimates Volume and next year’s Public Service Performance Report. Recorded Crime Recorded crime is a measure of incidents reported to the Gardaí where it is determined that a criminal offence has taken place, as defined by the law. It is influenced by many factors,
36 New metric in 2019 Public Service Performance Report

126
including policing activity. Other factors include economic growth, demographics, social conditions (e.g. deprivation and poor childhood outcomes), among many others. Table 3 shows the trend in recorded crime for the period 2015 to 2019, as categorised by offence group. This table should be read in conjunction with the caveats regarding crime statistics as set out by the CSO in the Review on the Quality of Crime Statistics 2018. In September 2017, the CSO took the decision to further defer the publication of Recorded Crime statistics. This arose because work on issues raised by the CSO in May 2017 had not been fully completed and An Garda Síochána had also decided to extend the period of their review of homicide incidents. Accordingly, crime statistics are categorised as Under Reservation. This mean that the quality of these statistics do not meet the standards required of official statistics published by CSO.
The Under Reservation categorisation will remain in place until the CSO is satisfied that the level of accuracy and completeness of the underlying data is of sufficient quality. The CSO is engaging with An Garda Síochána to set out the criteria for the lifting of the reservation. These criteria cover quality concerns across a broader range of issues such as data governance, training, crime data recording procedures and the auditing and monitoring of data quality.
Table 3: Recorded crime incidents classified by offence group & annualised to end Q4,
2015 to 2019
2015 2016 2017 2018 2019 Homicide Offences 83 91 83 80 50
Sexual Offences 2,288 2,525 2,884 3,182 3,307
Attempts/threats to murder, assaults, harassment & related offences 16,896 16,691 18,925 20,165
21,752
Dangerous or negligent acts1 7,117 7,689 8,374 8,559 8,705
Kidnapping and related offences 153 124 129 127 123
Robbery, extortion and hijacking offences 2,575 2,102 2,186 2,435 2,339
Burglary and related offences 26,306 18,551 19,182 16,966 16,772
Theft and related offences 75,729 64,510 69,283 66,920 68,414
Fraud, deception and related offences 5,782 4,937 5,436 6,295 7,944
Controlled drug offences 15,049 16,029 16,792 18,309 21,475
Weapons and explosives offences 2,374 2,137 2,377 2,438 2,686
Damage to property and to the environment 25,943 22,192 23,209 21,531
21,914
Public order and other social code offences 33,268 29,224 31,199 31,982 32,408
Offences against government, justice procedures and organisation of crime 11,440 12,308 13,740 16,165
16,474
Source: CSO (Recorded Crime Q4 2019) Note: Figures may be revised by the CSO after publication and the annualised figure for a given quarter is the total number of crimes recorded in the 12 months prior to the end of that quarter
The overall number of recorded offences declined between the end of 2015 and the end of 2016. However, the equivalent number rose between 2016 and 2017 with increases in nearly all categories. The overall number of recorded crimes was broadly the same for 2018. On the

127
issue of changes in the incidence of crime by offence category, the following broad trends can be observed over the period 2016 to 2019:
The number of homicide offences has declined
Sexual offences have risen significantly
Burglaries rose in 2017 before falling again in 2018 and 2019 to below 2016 levels
Controlled drugs offences have increased This commentary does not take into account the issue of underreporting of crime.
1. A Policing Service for the Future The report of the Commission on the Future of Policing in Ireland (CoFPI) was published in September 2018. It aimed to provide a fresh start for policing through a comprehensive examination of all aspects of policing in Ireland. “A Policing Service for the Future”, the four year plan to implement the CoFPI recommendations, commenced in 2019 and is underpinned by a robust reporting framework to oversee the delivery of the plan, which is led by the Department of the Taoiseach. The Department of Public Expenditure and Reform is one of the key stakeholders in driving this reform. In addition to the recommendations to improve the effectiveness of policing, the CoFPI report clearly identifies the levers available to deliver better Value for Money including reforms to learning and development, multi-annual budgeting, redesign of business processes, a capability review of the finance function, streamlining of allowances and divestment of non-core functions, among others. This reinforces the message that the challenges to improve policing are not solely about increased investment. Another central theme of the CoFPI report is the need for better data so that policing becomes information-led. Currently there is a challenge in obtaining good published data and related analysis on either the costs of police activity or the results in terms of crimes detected, resolved or the important crime prevention work carried out by An Garda Síochána. A better understanding of demand is also a crucial input into improved workforce planning. As has been highlighted by the Policing Authority on many occasions, the enablers of policing reform require significant improvement i.e. ICT, HR, Finance etc. Work is ongoing on a number of fronts to address these issues including a Finance Function capability review which is nearing completion. Covid-19 presents particular challenges for frontline organisations, and necessitated a refocus and reprioritisation of resources within An Garda Síochána (AGS) in the short term to meet the pandemic effectively. DPER, D/Taoiseach, D/Justice and Equality and An Garda Síochána have recently reviewed the APSFF reform plan in the context of Covid-19 to ensure the delivery of key reform actions in 2020. 2. International Protection/Direct Provision

128
The pressures on the direct provision system have increased significantly driven by rising numbers of international protection applicants in 2019 and higher costs of securing accommodation for applicants including the costs of emergency accommodation. The underlying financial pressures in the International Protection Seeker Accommodation area (Direct Provision) are exacerbated by the Covid emergency. The necessity to provide self‐isolation facilities and reduce the numbers in proximity to each other is leading to increased accommodation requirements and consequential additional costs. The Programme for Government (PfG) proposes that a new Government is committed to ending the system of Direct Provision and replacing it with a new international protection policy centred on a not for profit approach. Their intention is to publish a White Paper by the end of 2020, informed by the recommendations of an expert group, which will set out how this new system will be structured and the steps necessary to achieving it.
In the interim period, an advisory group has been set up to improve the situation of those within the direct provision with a number of proposals put forward. These recommended measures include: - Extending the right to work; - Exploration of alternative Housing models and funding provisions; - Clear guidance with regard to ensuring all applicants can open bank accounts; - Reducing the amount of time taken to process positive decisions; - Ensuring binding standards for centres are applied and enforced by January 2021; - Compulsory training and regular networking for centre managers; - Moving away from the use of emergency accommodation; - Ensuring vulnerability assessments take place; - Working with the Department of Transport towards access to driving licenses. Access to Labour Market The Department of Justice and Equality carried out a review of labour market access for persons seeking international protection in May 2020. The review considers the present arrangements, including legislative timeline, for providing access to the labour market where an applicant for international protection has not received a first instance decision within 9 months of the initial application for protection. The report makes a number of recommendations with two of the main recommendations as follows;
Labour market access should be provided within 6 months rather than the current period of 9 months in line with the recommendation of the inter-Departmental Group Report on Direct Provision. The move to 6 months would also be in line with the position in many other EU+ countries, but not in the United Kingdom, where access to work is provided to protection applicants on a restricted basis after 12 months.

129
The duration of a labour market access authorisation should be increased from 6 to 12 months. This will make it more attractive for employers to hire applicants for international protection as the increased duration of the authorisation provides greater certainty in terms of a person’s availability for work.
3. Courts and Prisons Reform
Courts Further to the completion of the DPER Organisational Capability Review in 2018, challenges were identified to be addressed in the areas of leadership, ICT, strategy and better service delivery for the user in the Courts Service. One of the key issues highlighted was the need to improve the eCourt environment for management of cases in the courts. The ambitious nature of the reform programme means that significant planning, appraisal and evidence gathering work is needed to ensure that any overall implementation plan is realistic, properly costed and includes an analysis of the monetary and non-monetary benefits. The potential for this plan to generate efficiencies and productivity needs to be clearly analysed in advance of implementing change programme activities. As a result of the COVID-19 emergency, the Courts Service has projected a shortfall on court fees receipts by year end, associated with licensing and specifically Special Exemption Orders (SEO's). This forecast was based on the closure of pubs since mid-March, with no SEO applications being lodged since then. There will also be a shortfall in Court receipts due to the reduction in the Courts civil matters for the months of April, May and June. While the COVID-19 emergency has presented many challenges, it has driven the desire to do things differently. e.g. remote courts, delivering judgments electronically in the High Court, lodging of consent terms by e-mail and the increase in Video-link hearings with the IPS for prisoners in custody. It is planned that the new Target operating model, will build on these revised arrangements and ensure that further enhancement in IT capacity sustains these new ways of working. Prisons In the Irish Prisons Service, rising levels of committals will pose a challenge in the coming years. It will be necessary to manage the rise in demand through a combination of increased efficiencies and strategic reforms. The Irish Prison Service Strategic Plan 2019 - 2022 is a plan for service improvement, development and a road-map, which builds on recent achievements, and sets out how the Prison Service intends to operate as a highly functioning public service organisation. This strategy has been built around five pillars, including Staff Support, Prisoner Support, Safe and Secure Custody, the Prison Estate and Governance. These following intended outcomes include:
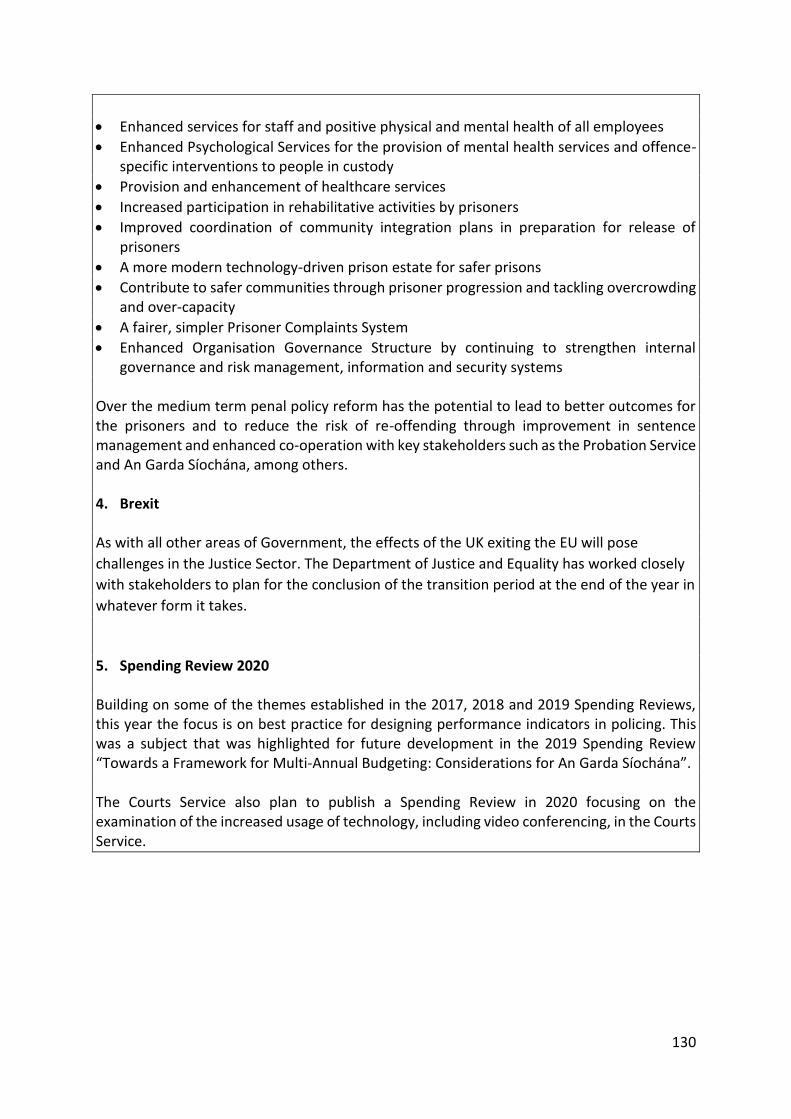
130
Enhanced services for staff and positive physical and mental health of all employees
Enhanced Psychological Services for the provision of mental health services and offence-specific interventions to people in custody
Provision and enhancement of healthcare services
Increased participation in rehabilitative activities by prisoners
Improved coordination of community integration plans in preparation for release of prisoners
A more modern technology-driven prison estate for safer prisons
Contribute to safer communities through prisoner progression and tackling overcrowding and over-capacity
A fairer, simpler Prisoner Complaints System
Enhanced Organisation Governance Structure by continuing to strengthen internal governance and risk management, information and security systems
Over the medium term penal policy reform has the potential to lead to better outcomes for the prisoners and to reduce the risk of re-offending through improvement in sentence management and enhanced co-operation with key stakeholders such as the Probation Service and An Garda Síochána, among others. 4. Brexit As with all other areas of Government, the effects of the UK exiting the EU will pose
challenges in the Justice Sector. The Department of Justice and Equality has worked closely
with stakeholders to plan for the conclusion of the transition period at the end of the year in
whatever form it takes.
5. Spending Review 2020 Building on some of the themes established in the 2017, 2018 and 2019 Spending Reviews, this year the focus is on best practice for designing performance indicators in policing. This was a subject that was highlighted for future development in the 2019 Spending Review “Towards a Framework for Multi-Annual Budgeting: Considerations for An Garda Síochána”. The Courts Service also plan to publish a Spending Review in 2020 focusing on the examination of the increased usage of technology, including video conferencing, in the Courts Service.

131
Public Expenditure & Reform
Cillian McBride, Kathryn Waller, Paul Keenan and Kevin O’Brien
Summary
The Public Expenditure and Reform Group consists of 9 Votes in total:
1. Public Expenditure and Reform
2. Superannuation and Retired Allowances
3. Office of Public Works
4. State Laboratory
5. Secret Service
6. Public Appointments Service
7. National Shared Service Office
8. Office of the Ombudsman
9. Office of Government Procurement
Figure 1: Department of Public Expenditure and Reform Gross Voted Expenditure 2008-
2019, €m
The Department of Public Expenditure and Reform's expenditure has grown from €30.1m in
its first year to €56.9m in 2019 and continues to have a wide range of objectives across two
strategic programmes – (A) Public Expenditure and Sectoral Policy and (B) Public Service
Management and Reform.
0
10
20
30
40
50
60
2011 2012 2013 2014 2015 2016 2017 2018 2019
Expenditure

132
As set out in the Department’s Statement of Strategy 2016-19, these objectives support the
two strategic goals of the Department:
1. to manage public expenditure at sustainable levels in a planned, rational and balanced
manner in support of Ireland’s economic development and social progress; and
2. to have public management and governance structures that are effective and
responsive to the citizen, transparent and accountable, and which thereby improve
the effectiveness of public expenditure.
In the period from the Department's establishment in 2011, expenditure has been driven, in
the main, by the Department's cross Government reforms such as the development of the
productivity enhancing Build to Share Applications by the Office of the Government Chief
Information Officer and the development of the single Civil Service Learning and Development
System and OneLearning centre.
Over the course of the last decade, the Office of Government Procurement and the National
Shared Services Office commenced their operations within the Department before becoming
Offices of Government in their own right as their centralised operations developed.
In 2020, a separate vote for the Office of the Government Chief Information Officer was
established which has an Estimate of €21.7 million (net) in 2020. The creation of this Vote,
for which the Secretary General is the Accounting Officer, will serve to drive the digital
transformation agenda across Government while providing and developing pan-public service
ICT infrastructure, service delivery models and cross government applications.

133
Gross Expenditure Trends
Figure 1: Vote 12 - Superannuation and Retired Allowances Total Gross Expenditure Trend
2010 – 2020, €000s
Total Gross Voted expenditure for Superannuation and Retired Allowances amounted to €5,640m from 2010 to 2020. Gross expenditure has increased steadily (for the most part) year on year to the 2020 allocation of €640.1m in line with the increase in pensioner numbers (overleaf). The Superannuation and Retired Allowances vote represents less than 1% of total Voted expenditure cumulatively since 2010.
0
100,000
200,000
300,000
400,000
500,000
600,000
700,000
2010 2011 2012 2013 2014 2015 2016 2017 2018 2019 2020
Gro
ss T
ota
l Exp
en
dit
ure
(€
'00
0)
Year

134
Pension Numbers Trend
Figure 2: Number of Pensioners Paid form Vote 12 from 2010 - 2020
Pensioner numbers have increased steadily from approximately 18,000 in 2010 to the forecast of approximately 28,200 by the end of 2020. This represents an increase of 56% overall.
The key drivers of total gross expenditure in any one year are subhead A1 (pension payroll for established scheme) and subhead A4 (lump sums paid under established scheme). Expenditure here is led by the number of established pensioners who join (and leave) the scheme each year. For 2020, the basis of the estimate for subhead A.4 was 1,785 retirements under the established scheme offset by deaths of 420.
Other drivers of expenditure are:
the number of pay periods in the year - 26 in most years (some years have 27).
changes to the pension rate of pay (for example changes to the Public Service Pension Reduction (PSPR) under FEMPI legislation) and pension increases.
the number of established civil servants who will choose to retire having reached minimum voluntary retirement age (age 60 generally, or age 50 in the case of Prison Officers).
the number of deaths (including the number of existing retirees whose deaths may result in a spouses’ pension becoming payable)
the average lump sum/pension payable to each new cohort of retirees (determined by the grading, years of reckonable service and date of entry to the public service of such retirees)
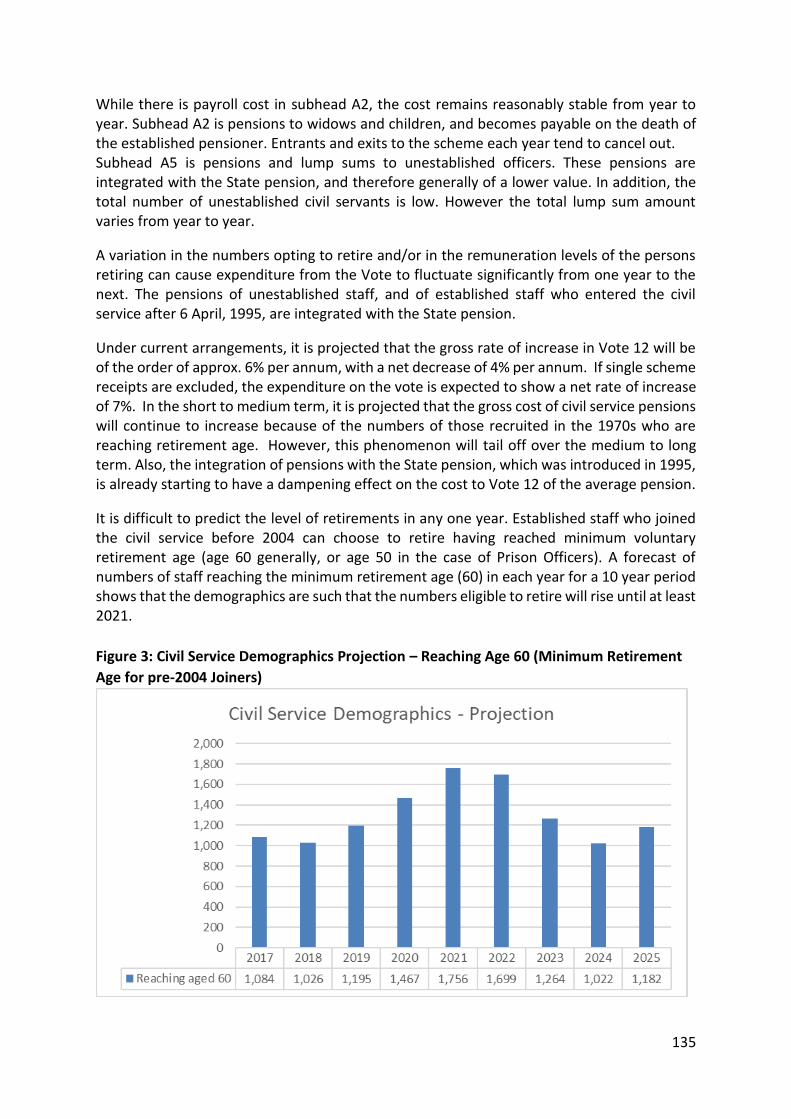
135
While there is payroll cost in subhead A2, the cost remains reasonably stable from year to year. Subhead A2 is pensions to widows and children, and becomes payable on the death of the established pensioner. Entrants and exits to the scheme each year tend to cancel out. Subhead A5 is pensions and lump sums to unestablished officers. These pensions are integrated with the State pension, and therefore generally of a lower value. In addition, the total number of unestablished civil servants is low. However the total lump sum amount varies from year to year.
A variation in the numbers opting to retire and/or in the remuneration levels of the persons retiring can cause expenditure from the Vote to fluctuate significantly from one year to the next. The pensions of unestablished staff, and of established staff who entered the civil service after 6 April, 1995, are integrated with the State pension.
Under current arrangements, it is projected that the gross rate of increase in Vote 12 will be of the order of approx. 6% per annum, with a net decrease of 4% per annum. If single scheme receipts are excluded, the expenditure on the vote is expected to show a net rate of increase of 7%. In the short to medium term, it is projected that the gross cost of civil service pensions will continue to increase because of the numbers of those recruited in the 1970s who are reaching retirement age. However, this phenomenon will tail off over the medium to long term. Also, the integration of pensions with the State pension, which was introduced in 1995, is already starting to have a dampening effect on the cost to Vote 12 of the average pension.
It is difficult to predict the level of retirements in any one year. Established staff who joined the civil service before 2004 can choose to retire having reached minimum voluntary retirement age (age 60 generally, or age 50 in the case of Prison Officers). A forecast of numbers of staff reaching the minimum retirement age (60) in each year for a 10 year period shows that the demographics are such that the numbers eligible to retire will rise until at least 2021.
Figure 3: Civil Service Demographics Projection – Reaching Age 60 (Minimum Retirement
Age for pre-2004 Joiners)

136
The Vote for Superannuation and Retired Allowances covers pensions, superannuation, occupational injuries, and additional and other allowances and gratuities under the Superannuation Acts 1834 to 2004 and sundry other statutes; extra-statutory pensions, etc.
2015 2016 2017 2018 2019
2020 (Estimated)
Number of pension cases processed in year
2,438 2,508 2,656 2,783 2,777 2,205
Pensions in payment 21,794 22,856 23,915 25,190 26,364 28,200
Pension Funding
Civil service pensions are funded on a pay as you go basis which means that the costs are met out of the current tax receipts. The possibility of creating a fund for this purpose arises from time to time. Part of the rationale for the National Pension Reserve Fund was to have a fund available to meet the future cost of public service pensions. Considerations to be borne in mind include that a diversion of Appropriations in Aid in order to create a fund to meet the future cost of civil service pensions would mean that those Appropriations in Aid would no longer be available to defray current costs. Moreover, consideration would need to be given as to whether an Employer contribution would also be directed to such a fund. While there is a risk distribution argument in favour of creating a fund to meet or partially meet the cost of public service pensions in the future, a proposal to create a fund to cover the entire cost of public service pensions would require careful consideration. Single Scheme receipts and expenditure The unit has prepared a vote management report in which it has outlined a number of options for the accounting of receipts and expenditure relating to the Single Scheme. At present, all receipts for the Single Scheme are lodged to Vote 12 as an Appropriation in Aid.

137
Summary
o Total voted expenditure by the Office of Public Works (OPW) amounted to
€4,108m from 2010 to 2019. In 2019 total gross voted expenditure was €455m.
o Flood Risk Management totalled €778m from 2010-2019.
o Estate Management totalled €3,314m from 2010-2019.
o OPW expenditure represents 0.71 % of total voted expenditure from 2010-2019
Figure 1: OPW (Vote 13) Long Term Trends 2010-2019, €m
o Total voted expenditure on the Office of Public Works equalled €4,108m from 2010 to
2019.
o Vote 13 is comprised of two programme areas; Flood Risk Management and Estate
Management.
280 289 275 284 269 277 256 271 276 289
173113 118 116
112 113 135 124
174 167
0
50
100
150
200
250
300
350
400
450
500
2010 2011 2012 2013 2014 2015 2016 2017 2018 2019
Current Capital

138
Figure 2: Vote 13 Capital Expenditure by Function 2010-2019, €m
o Programme A: The Flood Risk Management programme comprises a significant
component of voted expenditure of €778m from 2010-2019. This includes current
expenditure of €285m and capital expenditure €493m incurred across the period.
Programme expenditure includes spending on flood risk management principally
through a planned programme of flood relief schemes, drainage maintenance,
purchase of plant and machinery and hydrometric and hydrological operations and
investments.
o Programme B: Estate Management comprises the largest share of voted expenditure
with Th€2,461m current expenditure and capital expenditure of €853m from 2010-
2019. A total programme spend of €3,314m from 2010-2019.
o Programme expenditure includes rents, new works, alterations and additions,
property maintenance and supplies, unitary payments (National Convention Centre),
heritage services, service charges and utilities and purchase of sites and buildings.
1. Flooding
In 2011, the Government identified 300 areas at potentially significant risk from flooding.
Together these areas account for 80% of Ireland's potential flood risk from rivers and seas,
the primary source of flooding in Ireland. As part of the Catchment Flood Risk Assessment
and Management (CFRAM) programme agreed in 2018, the OPW has delivered 29 Flood Risk
Management Plans and flood maps for the flood risk in each of the areas that will support
40 3653 46 44 49 52 45
66 62
134
7765 70 68 65
8379
108104
0
20
40
60
80
100
120
140
160
180
200
2010 2011 2012 2013 2014 2015 2016 2017 2018 2019
A - FLOOD RISK MANAGEMENT B - ESTATE MANAGEMENT

139
planning and emergency response management. There are 150 flood relief capital projects,
including CFRAM plans and schemes at different stages of advancement.
The Government has committed €940m to flood defences in the period from 2018 to 2027 as
part of the National Development Plan. There are currently 92 schemes being progressed at
the moment, including 60 projects from the first phase of the Flood Risk Management Plans.
The number being progressed includes 31 small projects under €1m in individual cost terms.
As well as the National Flood Plan, the Programme for Government made commitments
regarding national flood forecasting, flood response, and other non-structural responses such
as individual property protection and voluntary property relocation.
Figure 3: Vote 13 Total Flood Risk Management Programme Expenditure 2010-2019, €m
Figure 4: Vote 13 Total Flood Risk Management Expenditure 2010-2019, €m
0
20,000
40,000
60,000
80,000
100,000
120,000
2010 2011 2012 2013 2014 2015 2016 2017 2018 2019
A.1 - ADMINISTRATION - PAY
A.2 - ADMINISTRATION - NON PAY
A.3 - PURCHASE OF PLANT AND MACHINERY
A.4 - HYDROMETRIC AND HYDROLOGICAL INVESTIGATION AND MONITORING
A.5 - FLOOD RISK MANAGEMENT
A.6 - DRAINAGE MAINTENANCE
483
159
8024 22 10
0
100
200
300
400
500
600
A.5 - FLOOD RISKMANAGEMENT
A.6 - DRAINAGEMAINTENANCE
A.1 -ADMINISTRATION
- PAY
A.3 - PURCHASEOF PLANT AND
MACHINERY
A.2 -ADMINISTRATION
- NON PAY
A.4 -HYDROMETRIC
ANDHYDROLOGICALINVESTIGATION
ANDMONITORING

140
o Flood risk management is the largest component of expenditure incurring, €483m
across the period of 2010 to 2019.
o Drainage maintenance is the second largest driver of expenditure with €159m
incurred across the period 2010 to 2019.
2. Estate Management
Expenditure on office accommodation (both owned and leased) has been driven by growing
demands for public sector accommodation following such matters as the move from the
Employment Control Framework to Delegated Sanction Arrangement in 2015, as well as
energy efficiency commitments. There are also ongoing supply-side pressures due to the lack
of available office accommodation in urban centres, particularly the Central Business District
in Dublin which has impacted on costs. At present there are several potential outcomes that
could affect the size of the office accommodation portfolio arising out of the Covid19
pandemic and possible changes to the “where” and the “how” the civil service will work into
the future.
The OPW is also responsible for the conservation, maintenance and upkeep of some 800
national monuments and other heritage properties in State care. Guided visitor services are
provided at up to 70 OPW managed heritage sites on either a fulltime (26) or seasonal (44)
basis. The management role also includes curation and presentation of 30 major historical
properties, gardens and arboreta and significant collections of art, historical objects, plants
and trees. The Tourism Capital Development Investment Programme 2016 - 2021, jointly
managed by the OPW, Fáilte Ireland, and the Department of Culture Heritage and the
Gaeltacht (DCHG), aims to develop visitor-facing infrastructure at heritage sites in State care
and to improve certain facilities where they already exist. Investment by Fáilte Ireland is
restricted to a maximum of 75% per project, with the balance paid currently by the OPW37.
Figure 5: Vote 13 Current Expenditure by Function 2010-2019, €m
37. Capital investment in the Heritage estate is primarily a matter for DCHG in the first instance with funding routed through the DCHG to the OPW to carry out specific agreed projects.
30 26 25 25 25 26 28 30 33 37
247 259 245 254 243 250 229 240 243 252
0
50
100
150
200
250
300
350
2010 2011 2012 2013 2014 2015 2016 2017 2018 2019
A - FLOOD RISK MANAGEMENT B - ESTATE MANAGEMENT

141
Figure 6: Vote 13 Estate Management Expenditure 2010-2019, €000s
Figure 7: Vote 13 Estate Management Expenditure 2010-2019, €m
o Rents is the largest expenditure on the programme, accounting for €997m from 2010
to 2019.
o New works, alterations and additions is the second largest expenditure on the
programme, accounting for €586m from 2010 to 2019.
0
200,000
400,000
2010 2011 2012 2013 2014 2015 2016 2017 2018 2019
B.1 - ADMINISTRATION - PAY B.2 - ADMINISTRATION - NON PAY
B.3 - PRESIDENT'S HOUSEHOLD STAFF B.4 - GRANTS FOR REFURBISHMENT WORKS AND SERVICES
B.5 - PURCHASE OF SITES AND BUILDINGS B.6 - NEW WORKS, ALTERATIONS AND ADDITIONS
B.7 - PROPERTY MAINTENANCE AND SUPPLIES B.8 - RENTS
B.9 - SERVICE CHARGES AND UTILITIES B.10 - UNITARY PAYMENTS
B.11 - HERITAGE SERVICES
997
586519
390 375267
65 61 24 8 60
200
400
600
800
1000
1200

142
COVID19
The COVID-19 pandemic and measures adopted by governments worldwide to address it have
had an immediate and significant effect on the world economy.
Concerns about infection are likely to remain in the short to medium term, and offices will
have to be adapted to facilitate staff, there may also be an impact on capital investment, and
the future requirements for office accommodation.
Delivery on the Flood Response Programme
The scale of the Flood Risk Management programme is unprecedented in the history of the
State and its implementation within the 10 year timescale of the NDP presents considerable
challenges. In addition to the 46 flood relief schemes already completed, there are 61 major
schemes at various stages of delivery throughout the country, 9of which are at construction.
In 2018, 29 Flood Risk Management Plans (FRMPs) were published, which arose from the
National Catchment-based Flood Risk Assessment and Management (CFRAM) studies, which
identified 118 new projects for implementation. As part of the first phase, 60 projects are
currently being advanced in association with the Local Authorities.
State Rents
State Rents is the largest item of expenditure by the OPW, representing €91m in 2019 or 20%
of total voted expenditure of €455 .
Capital Projects
The OPW is charged with delivery of many building projects, including some of significant
scale and value, on behalf of, and with capital funding from, other Departments and Agencies,
in addition to those delivered under OPW’s own voted allocations.
The OPW in conjunction with DPER are undertaking an analysis on state property expenditure
(leasing/buying/building) as part of the 2020 Spending Review. The findings and
recommendations arising from this report should inform and develop policy in this
expenditure area going forward. This is particularly important in the context of COVID-19
Heritage
The scale and consistency of the increase in visitor numbers to OPW-managed sites over the
reference period is considerable. Admissions to the more prominent guided sites in particular
have increased sharply in recent years and total recorded admissions to managed sites have
effectively more than doubled in the last 5 years.

143
Summary
The Corporate Bodies Unit manages five Votes within the PER Group:
1. State Laboratory
2. Secret Service
3. Public Appointments Service
4. National Shared Services Office (NSSO)
5. Office of the Ombudsman
o Gross Voted Expenditure for the Corporate Bodies Votes was €84,584m in 2019,
an increase of 245% from 2010 levels which is largely due to the establishment
and gradual expansion of the NSSO during this time, and NSSO expenditure
accounted for over 56% of the total 2019 expenditure for these five Votes.
o Most of the Votes listed above provide shared services to clients in the civil and
public service, or services to the public.
o Greater levels of public sector recruitment since the end of the moratorium in
public sector recruitment has led to increased demand for services from the Public
Appointments Service.
o Higher numbers of civil and public servants also results in higher levels of
transactions to be processed by the NSSO, and in addition the NSSO has grown
exponentially over the period 2010-2019.
o The services provided by the Office of the Ombudsman have expanded to cover
new areas over the years, e.g. to include those living in Direct Provision and
private nursing homes.
o Legislative developments have also led to more public bodies coming within the
scope of Freedom of Information, and changes to the FOI fees structure have led
to an exponential increase in FOI requests. This has an impact on the number of
appeals being submitted to the Office of the Information Commissioner (which is
funded under the Office of the Ombudsman Vote).

144
Figure 1: State Laboratory Gross Voted Expenditure 2008-2019, €000s
o Gross Voted Expenditure of €10,830 in 2019, which is an increase of 17.79% from the
2010 allocation – and this Vote does not have a capital budget.
o The Laboratory provide services to clients in the public sector, and main clients include
the Department of Agriculture, Food and the Marine, the Office of the Revenue
Commissioners, the Coroner’s Service and the Health Products Registry Authority.
o The State Laboratory achieved high levels of customer satisfaction with the quality
and timeliness of the service provided
o The 2019 output target for analyses testing is 102% higher than 2012 levels, while the
number of samples tested is 5% higher.
o Statements issued to assist the Courts, including Coroners, rose by over 20% between
2012 and 2019.
Figure 1: Secret Service Gross Voted Expenditure 2008-2019, €000s
o Expenditure in 2019 of €1,100m was 89.66% higher than 2010 levels.
9,1948,366 8,305 8,489 8,312 8,626 8,882 9,318 9,742
10,830
0
2,000
4,000
6,000
8,000
10,000
12,000
2010 2011 2012 2013 2014 2015 2016 2017 2018 2019
580 568515
587 593635
683741
883
1,100
0
200
400
600
800
1,000
1,200
2010 2011 2012 2013 2014 2015 2016 2017 2018 2019

145
Figure 1: Public Appointments Service Gross Voted Expenditure 2010-2019, €000s
o The PAS Gross Voted Expenditure of €14,764m in 2019 was 88% higher than 2010
levels.
o In 2019 PAS initiated 377 Recruitment Campaigns, held 14,401 interviews and made
9433 assignments to fill vacancies.
o The level of 2019 assignments to fill vacancies was 292% higher than the
corresponding levels in 2012, and 440% higher than 2011 levels.
o The increased activity and level of expenditure is reflective of an increased demand
for recruitment services from public sector clients, which increased rapidly following
the moratorium in public sector recruitment in 2015.
o PAS did not have a capital allocation for most of the period 2010-2019, but secured a
capital allocation of €0.635m in 2017, which rose to €1.7m in 2019 – an increase of
168%.
o While this capital increase comes from a very low base, it does reflect recent
investment in PAS’ offices in Chapter House, and plans to upgrade its IT recruitment
platform, both projects being multiannual in nature.
o COVID-19 has impacted PAS activities in 2020, and will likely continue to do so for the
foreseeable. Face to face interviews have been replaced by video interviews. Online
testing was developed to replace computer based testing that would traditionally
have taken place as PAS’ offices.
o Additional recruitment campaigns were initiated on behalf of the HSE, and PAS took
responsibility for the temporary reassignment process.
o An Innovation Steering Committee was established to provide structured governance
and guidance for the innovations that have been implemented in recent months to
maintain services during COVID-19, which may have implications on service delivery
into the future.
7,8497,301
6,699 6,2837,169
8,8029,537
11,75712,558
14,764
0
2,000
4,000
6,000
8,000
10,000
12,000
14,000
16,000
2010 2011 2012 2013 2014 2015 2016 2017 2018 2019

146
Figure 1: National Shared Services Office Gross Voted Expenditure 2013-2019, €000s
o The National Shared Service Office (NSSO) became an independent established office
in 2018, but a Vote has existed since 2013.
o Gross Voted Expenditure of €47,479m in 2019 was 203% higher than 2013 levels,
which reflects the expansion of NSSO’s business as the HR Shared Service and the
Payroll Shared Service became operational
o The Financial Management Shared Services Project is also in process and when
operational will reflect the next phase of growth in the NSSO business model.
o NSSO expenditure has typically been significantly behind profile on an annual basis
each year since the Vote was established in 2013, which have ranged from 8-43% from
year to dear during this period.
o This trend of underspending has been reflective of the phased expansion of shared
services for the majority of this timeframe, when project delivery has often taken
longer than originally envisaged.
o An underspend of 15% in 2019 reflected the delayed rollout of the FMSS Project, and
this trend is expected to continue in 2020.
o The NSSO have reported approximately €0.5m in COVID related expenditure in 2020,
€0.4m of which related to IT costs and €0.1m of which related to facilities costs.
15,664
23,24526,183
36,405
40,081
46,802 47,479
0
5,000
10,000
15,000
20,000
25,000
30,000
35,000
40,000
45,000
50,000
2013 2014 2015 2016 2017 2018 2019

147
Figure 1: Office of the Ombudsman Gross Voted Expenditure 2010-2019, €000s
o The Office of the Ombudsman Vote incorporates the Office of the Ombudsman but
also incorporates the Office of the Information Commissioner, the Standards in Public
Office Commission, the Commission for Public Service Appointments and the
Commissioner for Environmental Information
o Gross Voted Expenditure of €10,411m in 2019 was 50% higher than 2010 levels.
o This is entirely current expenditure – the Vote does not have a capital allocation.
o There has been a steady increase for services from the public in recent years due to a
range of factors, but mainly due to the expansion of the remit of the Ombudsman to
cover additional areas such as private nursing homes and direct provision.
o Changes to FOI legislation has also significantly increased the level of FOI applications,
and subsequently the number of appeals being submitted to the Office of the
Information Commissioner.
o The Commission for Public Service Appointments (CPSA) was a separate Vote until the
end of 2012, after which it became part of the Office of the Ombudsman corporate
structure. Prior to this change the CPSA Vote had allocation of 0.8m, which was
approximately 8% of the total Ombudsman Vote at that time.
6,924 6,7936,256
6,925 6,718
7,9468,408
8,920
9,72910,411
0
2,000
4,000
6,000
8,000
10,000
12,000
2010 2011 2012 2013 2014 2015 2016 2017 2018 2019

148
Figure 1: Office of Government Procurement Gross Voted Expenditure 20014-2018, €m
The Government has committed to lead the Procurement Reform Programme (“PRP”)
bringing procurement policy and operations together and focusing on building procurement
capacity and capability across the public service. The Office of Government Procurement
(OGP) has centralised policy, strategy and operations in one body leading to a coherent and
consistent approach to public procurement.
The aim of the Procurement Reform Programme is to develop procurement capacity and
capability across the public service. Some of the core outputs and services to be provided by
OGP in 2020 are:
o To deliver improved procurement capability in the public service which will yield
financial, performance and risk management benefits to the State
o To further develop, implement and action medium term strategy for construction
procurement
o To further develop the overarching policy framework for public procurement in
Ireland including promoting social and environmental considerations
o To support Future Jobs Ireland and the Climate Action Plan through focused
procurement policy initiatives
o To continue to enhance the supports to promote SME access to public procurement
o To publish and deliver Schedule of Contracts and Frameworks giving advance notice
to Public Service Bodies (PSB’s) and the supply markets of planned tenders
o To create awareness and encourage uptake of procurement frameworks and
contracts
o To publish a 2018 Public Service Spend and Tendering Analysis report
o To operate a customer service helpdesk to support supplier and buyer procurement
needs nationally
o To support the development of a new national eTenders system.
0.40 1.19 0.72 0.38 0.87 0.55
5.98
13.13 13.70 13.21 14.67 15.62
-
2.00
4.00
6.00
8.00
10.00
12.00
14.00
16.00
18.00
2014 2015 2016 2017 2018 2019
Capital Current

149
o To deliver Commercial Skills training, including procurement elements, across the
public sector through the OGP’s Commercial Skills Academy.
COVID-19 may have a continued impact for the administrative costs for all Votes into
the future, however the majority of costs in 2020 appear to have involved IT
expenditure to enable working from home.
COVID-19 has had a significant impact on recruitment campaigns run by PAS, such as
the need for remote assessment, but also in terms of HSE recruitment and the transfer
scheme that was organised for public servants.
PAS will be impacted by any increased demand for posts associated by either Brexit or
COVID, an campaigns for additional veterinary inspectors, agricultural officers, clerical
port inspectors etc. took place in 2019, with more campaigns possible based upon the
requirements of their clients.
The State Laboratory will also likely to be impacted by Brexit, as a significant increase
in tariff classification advice will be required by Revenue in the event of a no-deal
Brexit, which would place a significant challenge to the Laboratory due to the complex
nature of the work, and the large volume of advice expected.
The State Laboratory have also advised that additional veterinary residue testing
currently conducted in the UK for the D/Agriculture will have to be conducted by the
State Laboratory following Brexit, which will represent additional work for the
laboratory, which will require investment in equipment and personnel.
OGP has published Covid-19 information notes to support contracting authorities in
managing procurements where urgency is required.
Updates published on construction procurement and contractual matters associated
with the Covid-19 response measures during the period of shutdown.
Guidance issued on pre-start preparation and re-starting public works contracts with
further guidance to issue on tendering and award.
OGP developed a website (gov.ie/covidsupplies) to capture the many offers of support
being made by business to assist Ireland’s response to COVID-19.
Government Departments and key Agencies – including the Brexit Unit in DPER -have
been preparing for Brexit for four years now – and will continue to do so, through
extensive contingency planning and stakeholder engagement.
For its part, OGP has been addressing the implications of Brexit through its governance
structures and via proactive stakeholder engagement including through forums such
as the SME Advisory Group.
OGP has updated its Information Note on Brexit and Public Procurement twice in 2019
(June & October) to take account of developments.
The OGP has assessed the Framework Agreements (FWA) it has put in place to identify
the risks associated with a no-deal Brexit.
OGP has been discussing the legal implications of Brexit with the CSSO.

150
The Chief Procurement Officer wrote to Government Departments in September 2019
reminding them to identify and manage any potential risks and to put in place the
necessary detailed contingency plans.
OGP has requested Industry Bodies on SME Advisory Group to bring Government’s
support initiatives to the attention of their members.
The OGP continues to monitor the situation and will issue new guidance as
appropriate.

151
Rural & Community Development Paul Kilkenny and Tina Hayes
Summary
o The Department of Rural and Community Development was established with effect
from 26 July 2017.
o Current and capital combined voted expenditure for the Department of Rural and
Community Development increased from €136m in 2017 to €291m in 2019, an
increase of 114%.
o The Rural and Community Development group represented 0.43% of total voted
expenditure in 2019.
Figure 1: Vote 42 Short Term Trends: Total Expenditure – Current and Capital 2017-2019,
€m 38
o Total voted expenditure on Rural and Community Development amounted to €664m
for the three years from 2017 to 2019.
o A large proportion of current expenditure on rural and community development is in
the form of grants, in many cases to local authorities and also through schemes
administered by Pobal on behalf of the Department on community development
schemes such as SICAP, the Community Services Programme, SSNOs and the Seniors
Alert Scheme.
38 The Community Services Programme transferred from Vote 37 (D/Employment Affairs and Social Protection) to Vote 42 (D/Rural and Community Development) with effect from 01/01/2018. The programme amount of €46.19m, with respect to 2018, is reflected in figure 1.
78
142 153
58
95
138
0
50
100
150
200
250
300
350
2017 2018 2019
Current Capital

152
Figure 2: Vote 42 Current Expenditure by Function 2017-2019, €m
Figure 3: Vote 42 Capital Expenditure by Function 2017-2019, €m
Programme A: Capital spending focused primarily on the Rural Development and Regional
Affairs programme. €242m million was invested in the period 2017-2019 in a range of capital
schemes including LEADER, the Rural Regeneration and Development Fund, Outdoor
Recreation Infrastructure Fund, Town and Village Renewal, Broadband and the CLÁR
programme. An additional €38 million was invested in current programmes which included
supporting the work of the Western Development Commission, the walks programme and
other rural supports.
Programme B: Current spending has been directed more to community development, with
€323 million invested 2017-2019 supporting the Social Inclusion and Community Activation
9 14 15
65
124134
4 4 4
0
20
40
60
80
100
120
140
160
2017 2018 2019
A - RURAL DEVELOPMENT & REGIONAL AFFAIRS B - COMMUNITY DEVELOPMENT
C - CHARITIES REGULATORY AUTHORITY
46
74
123
1221
15
0
20
40
60
80
100
120
140
2017 2018 2019
A - RURAL DEVELOPMENT & REGIONAL AFFAIRS B - COMMUNITY DEVELOPMENT
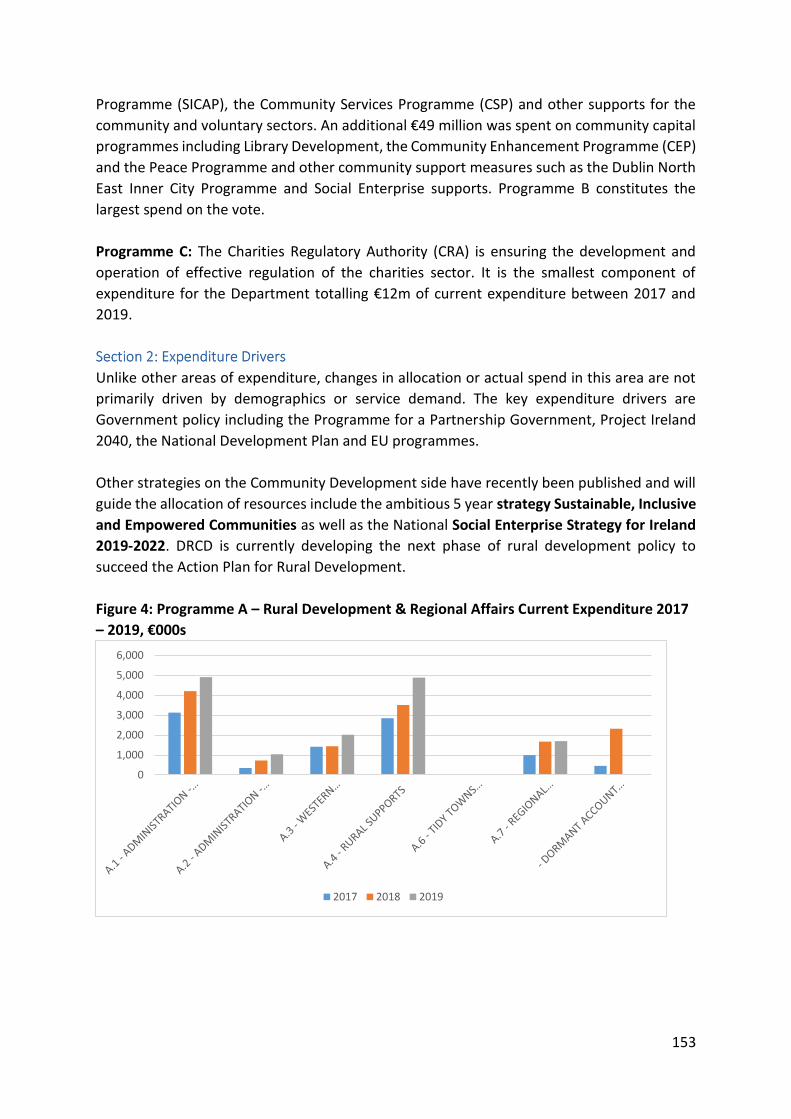
153
Programme (SICAP), the Community Services Programme (CSP) and other supports for the
community and voluntary sectors. An additional €49 million was spent on community capital
programmes including Library Development, the Community Enhancement Programme (CEP)
and the Peace Programme and other community support measures such as the Dublin North
East Inner City Programme and Social Enterprise supports. Programme B constitutes the
largest spend on the vote.
Programme C: The Charities Regulatory Authority (CRA) is ensuring the development and
operation of effective regulation of the charities sector. It is the smallest component of
expenditure for the Department totalling €12m of current expenditure between 2017 and
2019.
Unlike other areas of expenditure, changes in allocation or actual spend in this area are not
primarily driven by demographics or service demand. The key expenditure drivers are
Government policy including the Programme for a Partnership Government, Project Ireland
2040, the National Development Plan and EU programmes.
Other strategies on the Community Development side have recently been published and will
guide the allocation of resources include the ambitious 5 year strategy Sustainable, Inclusive
and Empowered Communities as well as the National Social Enterprise Strategy for Ireland
2019-2022. DRCD is currently developing the next phase of rural development policy to
succeed the Action Plan for Rural Development.
Figure 4: Programme A – Rural Development & Regional Affairs Current Expenditure 2017
– 2019, €000s
0
1,000
2,000
3,000
4,000
5,000
6,000
2017 2018 2019

154
Figure 5: Programme B – Community Development Current Expenditure 2017-2019, €000s
o SICAP is the largest component of current expenditure, with a total outturn of €129m
between 2017-2019.
o The Community Services Programme is the second largest current expenditure on the
Vote in 2018 with total programme expenditure of €87m.39
39 Responsibility for CSP moved to Department in 2018, annual spend on a par with SICAP
0
5,000
10,000
15,000
20,000
25,000
30,000
35,000
40,000
45,000
50,000
2017 2018 2019

155
Figure 6: Programme A – Rural Development & Regional Affairs Capital Expenditure 2017 –
2019, €000s
Figure 7: Programme B – Community Development Capital Expenditure 2017 – 2019,
€000s
0
5,000
10,000
15,000
20,000
25,000
30,000
35,000
40,000
45,000
50,000
2017 2018 2019
0
2,000
4,000
6,000
8,000
10,000
12,000
2017 2018 2019

156
o LEADER (A.5) accounts for the largest component of capital expenditure on the Vote.
Total expenditure amounted to €84m from 2017-2019.
o Rural Supports accounts for the second largest component of capital expenditure,
totalling €48m from 2017-2019.
COVID Pressures
DRCD is playing a crucial role in providing supports to communities in response to the COVID
19 pandemic through the Community Call and other supports. The COVID-19 Community Call
Forum established by each local authority works with State agencies and community and
voluntary groups to provide supports or services to any vulnerable person who needs them.
The primary aim of the recently announced €35m Stability Fund, resourced from the
Dormant Accounts Fund, is to assist community and voluntary, charity and social
enterprises who are experiencing financial difficulties due to a reduction in their
fundraising income and/or traded income as a direct result of the COVID-19 pandemic.
€5m in additional matching funding for 2020 has been provided for ‘Innovate Together’.
This time limited philanthropic fund is a collaboration between Government,
philanthropists and social innovators. It will focus on supporting innovative responses to
the Covid-19 crisis.
€3.5m has been repurposed, or reallocated from existing resources, by the Department
to support increased demand for a number of community support schemes.
National Development Plan
One of the National Strategic Outcomes of the National Development Plan is to bring about
strengthened rural economies and communities. As part of this, €1bn is committed to the
Rural Regeneration and Development Fund between 2018 and 2027 to promote rural renewal
in order to enable towns, villages and outlying rural areas to grow sustainably and support
delivery of the strategic objectives of the National Planning Framework. Proposals supported
under the Fund must demonstrate additionality, value for money, and a sustainable impact
on social or economic development of rural communities through measurable outputs. This
is complemented by an Urban Regeneration and Development Fund, under the responsibility
of the Department of Housing, Planning, and Local Government.
In the period 2018 - 2022, €315m is committed to the Rural Regeneration and Development
Fund, €225m for LEADER, and €166m for other capital schemes, including the town and village
renewal scheme, rural recreation schemes, Local Improvement Schemes, library
development, and PEACE.
EU programmes

157
Expenditure on programmes part-funded by the EU (LEADER & Programme for Peace and
Reconciliation) are dependent both on Ireland's allocation and on the interest of individuals
and organisations to apply, as well as the ability of organisations to apply for funding.
Rural Development Policy
Since 2017, the Action Plan for Rural Development has been delivering a wide range of
measures across Departments and agencies to support job creation, invest in town and village
renewal and improve the delivery of services in rural areas, taking account of the ever-
changing nature of our society.
It is estimated that 50% of the population live in settlements of fewer than 10,000 people and
that rural-based enterprises support hundreds of thousands of jobs and contribute
significantly to our national economy. Rural communities are also important guardians of our
heritage, culture and natural environment. It is important that we ensure that people living
in rural areas have reasonable access to services if they are to continue to live and work in
rural Ireland.
DRCD is currently developing the next phase of rural policy to succeed the Action Plan for
Rural Development. The new policy will reflect a whole-of-Government commitment to a
range of matters impacting on rural Ireland.
Community Development Policy
Sustainable, Inclusive and Empowered Communities is Government’s five-year strategy to
support the community and voluntary sector in Ireland 2019-2024. This Strategy recognises
the importance of the community and voluntary sector to a healthy, just and prosperous
society, and it sets out how Government will support the sector in the years to come. It builds
upon the Government’s 2016 Framework Policy for Local and Community Development,
serving as an implementation plan for that policy, and it meets the Programme for a
Partnership Government commitment to develop a strategy to support the community and
voluntary sector. It has been co-produced by national and local government in collaboration
with the community and voluntary sector, and it is underpinned by shared principles and
values that guided its development. It includes an ambitious range of actions that will ensure
communities are served by robust and sustainable community and voluntary organisations.

158
Taoiseach Niall Branigan
Summary
The Taoiseach Group of Votes consists of the following votes;
o Vote 1 – President’s Establishment
o Vote 2 – Department of The Taoiseach
o Vote 3 – Office of the Attorney General
o Vote 4 – Central Statistics Office
o Vote 5 – Office of the Director of Public Prosecutions
o Vote 6 – Office of the Chief State Solicitor
Total voted expenditure for this Departmental Group 2010-2019 is €1,654m (Gross). This
review focusses on the expenditure of the Department of the Taoiseach and the Central
Statistics Office (CSO).
The primary function of the Department of the Taoiseach is to support the Taoiseach and
Government in delivering on its programme of delivering a sustainable economy and a
successful society. Over 50% of the non-pay portion of the Vote funds independent entities
which have been established outside of any individual Department or Agency. The
Department of the Taoiseach have a wide range of responsibilities under its programme for
Government.
The CSO is an independent office under the aegis of the Department of the Taoiseach. The
CSO is Ireland’s national statistical institute and is responsible for the production and
oversight of the production of all official statistics for Ireland. The functions of the CSO, as
set out in the Statistics Act, include “the collection, compilation, extraction and
dissemination for statistical purposes of information relating to economic, social and
general activities and conditions in the State”. The European Statistical System (ESS) has a
significant impact on the CSO’s work programme, which comprises approximately 60% of
the statistics produced annually, and which are legally required under European legislation.
The volume and nature of data now accessible and the technological and analytical capacity
available positions the CSO to act as impartial compilers of information contextualising
what is happening in our societies and economies, identifying drivers of change, pinpointing
challenges and informing policy makers, the business community and society as a whole.
Confidence in the quality and independence of official statistics is crucial as this information
serves as an objective input to policy development, oversight and governance at national
and international levels.
In 2019, salaries, wages and allowances accounted for 74% of the Gross Total Expenditure
on Vote 4 – CSO.

159
Figure 1: Total Voted Taoiseach Group Expenditure, 2010 – 2019
Figure 2: Expenditure on the Department of the Taoiseach 2010 – 2019, €m
0
10,000
20,000
30,000
40,000
50,000
60,000
70,000
80,000
90,000
2010 2011 2012 2013 2014 2015 2016 2017 2018 2019
Taoiseach Vote Group 2010 - 2019Total Voted Expenditure €1,654m (Gross)
V1 - PRESIDENT'S ESTABLISHMENT (GROSS) V2 - DEPARTMENT OF THE TAOISEACH (GROSS)
V3 - OFFICE OF THE ATTORNEY GENERAL (GROSS) V4 - CENTRAL STATISTICS OFFICE (GROSS)
V5 - DIRECTOR OF PUBLIC PROSECUTIONS (GROSS) V6 - CHIEF STATE SOLICITOR'S OFFICE (GROSS)
0
5,000
10,000
15,000
20,000
25,000
30,000
2010 2011 2012 2013 2014 2015 2016 2017 2018 2019
V2 - Department of The Taoiseach 2010 - 2019Total Voted Expenditure €232m (Gross)
Admin Pay Admin Non-Pay
NESC Tribunals of Inquiry
Commissions of Investigation Citizens Assembly
Other Entities Dept of The Taoiseach Voted Expenditure (Gross)

160
Total Voted Expenditure on the Department of the Taoiseach equalled €232m within the
period 2010 -2019. With the exception of 2017, Pay accounts for over half of the Total Voted
Expenditure within the period reflected in the above graph.
Figure 3: Expenditure on the Department of the Taoiseach 2010 – 2019, €m
The graph above illustrates the Gross Total Expenditure for Vote 2 – Department of The
Taoiseach from 2010 – 2019.
0
5,000
10,000
15,000
20,000
25,000
30,000
2010 2011 2012 2013 2014 2015 2016 2017 2018 2019
V2 - Department of The Taoiseach 2010 - 2019 Total Expenditure €232m (Gross)

161
Figure 4: Expenditure on the Central Statistics Office 2010 – 2019, €m
Total Voted Expenditure on the Central Statistics Office equalled €521m within the period
2010-2019. Figure 4 above shows the cyclical nature of the CSO allocation, peaking each
Census year (2011 and 2016) within the 10 year period.
Expenditure requirements remain broadly constant year on year. However, the Department
of the Taoiseach must remain responsive to the changing social, political and economic
landscape.
A unique feature of the Department of the Taoiseach Voted Expenditure is the fact that over
50% of the non-pay portion of the Vote is monies utilised to run independent entities, which,
of necessity, have been established outside of any individual Department or agency. These
are entities established by the Government and the Houses of the Oireachtas, such as the
National Economic and Social Development Office, Tribunals of Inquiry, Commissions of
Investigation or Citizen Assembly-type entities which are each independent and generally
Judge-led.
Following a Government Decision in May 2020, an additional €20m, which accounts for 57%
of the non-pay portion of the Vote for 2020, was allocated to Department of the Taoiseach to
co-ordinate and manage the whole-of-government Covid-19 communications campaign in
2020.
0
10,000
20,000
30,000
40,000
50,000
60,000
70,000
80,000
90,000
2010 2011 2012 2013 2014 2015 2016 2017 2018 2019
V4 Central Statistics Office 2010 - 2019Total Voted Expenditure €521m
Pay Other Non Pay
Collection of Statistics Office Equipment and External IT
CSO Voted Expenditure (Gross)
76,55774,700

162
The focus of the Government’s public awareness programme to date has been to build mass
awareness and understanding of Government information related to Covid-19 as quickly and
efficiently as possible. This is in alignment with both World Health Organisation and European
Centre for Disease Control advice, which recommends the provision of easily accessible
information such as signs and symptoms of COVID-19, contact details of local health services,
the population groups at risk, self-isolation, social distancing measures and travel advice.
The CSO demand for products and services are constantly increasing both nationally and
internationally. The volume and nature of data now accessible and the technological and
analytical capacity available positions the CSO to act as impartial compilers of information
contextualising what is happening in our societies and economies, identifying drivers of
change, pinpointing challenges and informing policy makers, the business community and
society as a whole.
The European Statistical System (ESS) has a significant impact on the CSO’s work programme,
which comprises approximately 60% of the statistics we produce annually, and which are
legally required under European legislation.
The CSO is increasingly providing and facilitating data analysis (Covid-19 response) and new
survey work or the incorporation of existing studies into its programme of official statistics,
(Growing Up in Ireland survey from 2023 and a Sexual Violence Survey for Ireland).
COVID-19 has impacted on CSO’s statistical work programme in 2020 with pilots for the
International Assessment of Adult Competencies (PIAAC - undertaken on behalf of the
Department of Education and Skills) and the Sexual Violence Survey (SVS) both being
postponed until 2021 along with the Household Budget Survey (HBS). Face to face
interviewing had to be ceased with new technological solutions and mixed mode collection
options being implemented. The impact on the progression of a traditional Census in 2021 is
under continuous review. These various issues will all have implications for expenditure into
2021 and beyond.
The need for CSO’s statistical and analytical expertise was made clear during the course of
COVID-19 when the CSO provided data analysis to inform central government’s response to
the pandemic. In response to the pandemic the CSO developed:
A C19 Data Research Hub to enable specialised experts (epidemiology and related subject
matter experts) to collaborate with CSO teams in analysing sensitive health data sources in a
safe environment to inform the Government response to the C19 pandemic
An information dashboard for the Department of the Taoiseach which tracks in real time the
critical data which will provide evidence of a need to respond to certain trends rapidly as well
as potential emerging issues which will need to be dealt with through recovery.

163
A National Covid-19 Data Hub on the GeoHive platform to allow for geospatial visualization,
in collaboration with Ordnance Survey Ireland (OSI), the Department of Housing, Planning &
Local Government (DHPLG) and the All Island Research Observatory (AIRO) in Maynooth
University, along with Esri Ireland as technical partners.
A Covid-19 Information Hub on the CSO website. This is a cross office development that
reports on the changing state of aspects of Ireland's economy and society since the COVID-19
outbreak and includes the outputs from the new surveys developed by CSO to capture the
economic, business and social impact of the pandemic in a more real time way to help inform
society and decision makers.
This work moved the CSO closer to producing real time data and it is likely that post Covid the
demand for more real time or flash estimates will continue.
The CSO is also focusing on developing administrative data sources and on modernising how
we collect, process and publish data. The CSO will continue to use technology to reduce
respondent burden and to make its outputs accessible and user-friendly and advance the
Office’s position as a leading national statistical institute.
Following a Government Decision in May, an additional €20m was allocated to Department
of the Taoiseach to co-ordinate and manage the whole-of-government Covid-19
communications campaign for 2020. The focus of the Government’s public awareness
programme to date has been to invest in media to build mass awareness and understanding
of Government information related to the COVID-19 emergency response as quickly and
efficiently as possible.
Given the importance of the information, both national and local media have been deployed
to get the balance right between main national news sources, which help to communicate
information which is important to all of Ireland, and local news sources, which resonate
particularly strongly with local communities.
The campaign activity and corresponding media spend is being planned on a weekly basis
based on two phases: May to the end of August and September to the end of the year with a
mix of media presence and mediums as appropriate based on the public health requirements.
The Department of the Taoiseach’s Vote encompasses a wide range of responsibilities under
its programme including responsibility for the system of Cabinet Committees covering a range
of priority areas. The Programme for Government includes a Shared Island Unit, Commission
on Future Media, and coordinating social dialogue while the Department plays an important
role in other challenges including Brexit, economic recovery and climate action.
164
Transport, Tourism & Sport Joseph O’Connell and Philip Maher
Summary
o Total gross expenditure by the Department of Transport, Tourism and Sport
reduced by €823 million from €3,175 million in 2009 to €2,352 million in 2019 (26%).
o However, total gross expenditure allocations have increased since 2013 by €652m
from €1,700m to €2,352m in 2019 (38%).
o A significant increase in Capital of €10bn has been provided to DTTAS under the new
National Development Plan (NDP) 2018-2027.
o The Department operates across five programme areas - Aviation, Land Transport,
Maritime, Tourism and Sport, with 60% of expenditure allocated to Land Transport
(covering Roads and Public Transport).
o The primary drivers of expenditure are economic growth, leading to pressures on
the existing roads and public transport system, policy commitments in relation to
roads, regional airports and sport and the transition to more sustainable transport
systems.
The Department of Transport, Tourism and Sport was established in 2011. In the 2002 to
2011 period, the Department operated as the Department of Transport and prior to that,
was known as the Department of Public Enterprise. The Department of Transport, Tourism
and Sport operates across 5 main programme areas.
- Aviation: to maximise air transport connectivity with a safe, competitive, cost
effective and sustainable aviation sector.
- Land Transport : to best serve the needs of society and the economy through
safe, sustainable and competitive transport networks and services
- Maritime: to facilitate safe and sustainable maritime transport and the delivery
of emergency management services.
- Sport: to contribute to a healthier and more active society by promoting sports
participation and by supporting high performance and the provision of sport
facilities.
- Tourism: to support the tourism industry to grow in a sustainable way.
Over the period 2009 to 2019, gross expenditure (current and capital) decreased from €3,175
million in 2009 to €2,352 million in 2019, a decrease of €823 million or 26%. Figure 1 sets out
the breakdown between current and capital expenditure for that period. Figures 2 and 3 set
out the breakdown by programme area between current and capital respectively. NOTE: The

165
Department of Transport only became responsible for Tourism and Sport in 2011. It should
also be noted that Land Transport is responsible for almost 95% of Capital Expenditure and
58% of Total Expenditure in 2019.
Figure 1: Total Gross Expenditure 2009-2019, €m
Figure 2: Current Expenditure by Programme Area 2009-2019, €m
24772061
14961225
944 1113 1051 1175 11391312
1586
698
678
850
825
756685 677
661 680741
766
0
500
1000
1500
2000
2500
3000
3500
2009 2010 2011 2012 2013 2014 2015 2016 2017 2018 2019
Mill
ion
s
Capital Current
0
100
200
300
400
500
600
700
800
900
2009 2010 2011 2012 2013 2014 2015 2016 2017 2018 2019
Mill
ion
s
Aviation Land Transport Maritime Sports Tourism Retired Expenditure

166
Figure 3: Capital Expenditure by Programme Area 2009-2019, €m
Table 1: Gross Expenditure 2009-2019 by Programme Areas
Programmes 2009 2010 2011 2012 2013 2014 2015 2016 2017 2018 2019
Total
€m
Aviation Current 22 23 55 24 23 23 23 22 23 24 26 288
Capital 5 1 5 4 4 3 2 4 2 4 11 45
Total 27 24 60 28 27 26 25 26 25 28 37 333
Land Current 589 566 574 571 489 422 418 393 407 448 444 5,321
Transport Capital 2,451 2,040 1,413 1,158 873 1050 974 1,073 1,068 1,242 1,467 14,809
Total 3,040 2,606 1,987 1,729 1,362 1,472 1,392 1,466 1,475 1,690 1,911 20,130
Maritime Current 39 45 39 60 77 82 85 84 83 88 95 777
Capital 8 20 16 11 20 12 5 7 4 2 8 113
Total 47 65 55 71 97 94 90 91 87 90 103 890
Sports Current - - 48 48 47 47 48 55 57 62 66 477
Capital - - 34 31 27 26 54 74 51 50 61 408
Total - - 82 79 74 73 102 129 108 112 126 885
Tourism Current - - 126 122 119 112 104 107 110 119 136 1,055
Capital - - 16 21 20 22 16 16 13 15 39 178
Total - - 142 143 139 134 120 123 123 134 175 1,233
Total €m Total
Current 650 634 842 825 755 686 678 661 680 741 766 7,918
Total
Capital 2,464 2,061 1,484 1,225 944 1,113 1,051 1,174 1,138 1,313 1,586 15,553
Retired Exp. 60 44 21
Overall
Total 3,174 2,739 2,347 2,050 1,699 1,799 1,729 1,835 1,818 2,054 2,352 23,596
0
500
1000
1500
2000
2500
3000
2009 2010 2011 2012 2013 2014 2015 2016 2017 2018 2019
Mill
ion
s
Aviation Land Transport Maritime Sports Tourism Retired Expenditure

167
The main drivers of expenditure are the growth in the economy, policy direction (including
PfG) and implementation and climate change adaptations and pay.
Economy and employment growth has created an increased demand on roads and public
transport services. Demand is forecast to be at peak 2007 levels by 2020, with associated
expenditure pressure for improved capacity.
There are a number of policy commitments driving expenditure, including increased
expenditure on roads and public transport, together with regional airports and the Sports
Capital Programme.
The transition to sustainable transport systems will impact on expenditure. This will include
the potential for developing technology and alternative fuel sources including hybrid and full
electric bus systems.
Roads
The road network in Ireland covers approximately 98,500km and accounts for 44% of gross
expenditure. National Roads cover 5% of the road network and carry 45% of traffic.
• Motorways 1,224km
• National Primary Roads 1,515km
• National Secondary Roads 2,676km
• Regional & Local Roads 93,000km
Regional and Local Roads cover 95% of the road network and carry 55% of traffic.
National Roads development and maintenance expenditure and PPPs are managed by grants
to Transport Infrastructure Ireland (TII). This sub-programme areas has seen a reduction of
€1,063 million (73%) over the 2009-2019 period, as illustrated in Figure 4.
Figure 4: Expenditure on National Primary and Secondary Roads 2009-2019, €bn
1.46
1.21
0.800.72
0.390.46 0.43 0.41 0.44 0.47
0.39
2009 2010 2011 2012 2013 2014 2015 2016 2017 2018 2019

168
Regional and Local Roads (Local Government Funded)
Regional and Local Roads accounts for 94% of the roads network and the primary
responsibility for improvement and maintenance of regional and local roads rests with local
authorities. Funding from the Department of Transport Tourism and Sport is intended to
supplement contributions by local authorities from their own resources. Expenditure in this
sub-programme area has increased by €32 million (7%) over the 2009-2019 period, as set out
in Figure 5.
Up to 2018, funding for these roads came from the Local Government Fund, managed by the
Department of Housing, Planning, Community and Local Government. From 2018 this funding
is provided by the Department of Transport, Tourism and Sport.
Figure 5: Regional and Local Road Grants 2009-2019, €m
Public and Sustainable Transport
Public and Sustainable Transport, as represented in Figure 6, is a sub-programme of the Land
Transport programme, representing around 25% of gross expenditure. It provides funding for
the development of public transport infrastructure and the improvement of railway safety.
The National Transport Authority (NTA) has responsibility for public transport infrastructure
in the Greater Dublin Area. The Authority also administers the Regional Cities and Accessibility
Grants Programmes on behalf of the Department, Accessibility; Regional Cities (Public
Transport) Programme; Technical Assistance; heavy rail network maintenance and renewal;
Luas/Metro; buses nationally; integration measures including Leap Card, RTPI and National
Journey Planner in the Greater Dublin Area and regional cities. This subhead has reduced by
€193 million (29%) in 2019 compared to the 2009 allocation.
451411
452
377400
331 319
374
321
417
483
2009 2010 2011 2012 2013 2014 2015 2016 2017 2018 2019

169
Figure 6: Public & Sustainable Transport Investment, Programme 2009-2019, €m
Public Service Provision Payments.
Public Service Provision payments, a sub-programme of the Land Transport programme
accounts for around 16% Gross Expenditure. Public Service Provision payments provides
funding to two areas (1) Public Service Obligation (PSO) (2) Rural Transport, with over 95% of
the funding to the Public Service Obligation (PSO). This funding is managed by National
Transport Authority (NTA) who in turn provides funding to Dublin Bus, Bus Éireann, Iarnród
Éireann and M&A Coaches Ltd. These four companies are tasked with providing socially
necessary but financially unviable public transport services. As illustrated by Figure 7 below,
this expenditure has reduced by €25million (8%) in the period 2009-2019.
Figure 7: Public Service Provision Payment 2009-2019, €m
Sports and Recreation Services programme
The two main sub-programmes in the Sports and Recreation Services Programme are:
1) Grants for sporting bodies which, since 2011, has an average spend of around 32% of
the main programme. This provides grants for sports facilities to sports clubs and
organisations and to voluntary and community organisations. Figure 8 shows an
674614
377
254 265
395339 355 368
401
481
2009 2010 2011 2012 2013 2014 2015 2016 2017 2018 2019
328
289278
290
237224 221
250
279 286303
2009 2010 2011 2012 2013 2014 2015 2016 2017 2018 2019

170
increase in grants for sporting bodies in 2016-2018 reflecting the allocation of the
Páirc Úi Chaoimh grant award of €30 million at €10 million per year 2016-2018.
2) Sports Ireland average spend, since 2011, is around 68% of the main programme,
providing grants to National Governing Bodies of Sport; Local Sports Partnerships;
International Carding Scheme; and support for other sporting bodies and institutions
(Institute of Sport, Olympic Council of Ireland, etc.) It also provides support for specific
Sport Ireland programmes such as High Performance Strategy; Anti-Doping
Programme; Buntús Programme; Women in Sport Initiative; Go for Life; Irish Trails
Strategy; Code of Ethics; and Research. It includes a subsidy to a subsidiary of Sport
Ireland – National Sports Campus Development Authority NSCDA (Operations)
Limited. The subsidiary is responsible for the day-to-day management and operation
of the National Sports Campus sporting facilities. It also provides building
management services for the office accommodation provided to NGBs on Campus.
There was a decrease in the allocation from 2016 to 2017 (see Figure 8), as the
National Indoor Arena (NIA) Phase I was completed in 2016. However, the NIA Phase
II commenced in late 2017 and this has resulted in an increase in 2018.
There is also a sub-programme for swimming pools, with funding for grant aiding the
provision of new and the refurbishment of local authority swimming pools.
Figure 8: Sports and Recreation Services Programme 2011-2019, €000s
Tourism Services Programme
The two main sub-programmes under the Tourism Service programme:
Fáilte Ireland
Fáilte Ireland, the National Tourism Development Authority, supports the tourism industry to
sustain Ireland as a high-quality and competitive tourism destination. They provide a range of
practical business supports to help tourism businesses better manage, market and sell their
products and services and to develop experiences in line with Fáilte Ireland’s new experience
brands (Wild Atlantic Way, Ireland’s Ancient East and Dublin). They also work with other state
agencies and representative bodies, at local and national levels, to implement and champion
23,40319,812
13,570
20,94428,058
39,625
30,275
41,510 42,58046,837 44,495
53,25849,444
68,687
78,416
60,341 58,32663,001
2011 2012 2013 2014 2015 2016 2017 2018 2019
GRANTS FOR SPORTING BODIES SPORT IRELAND
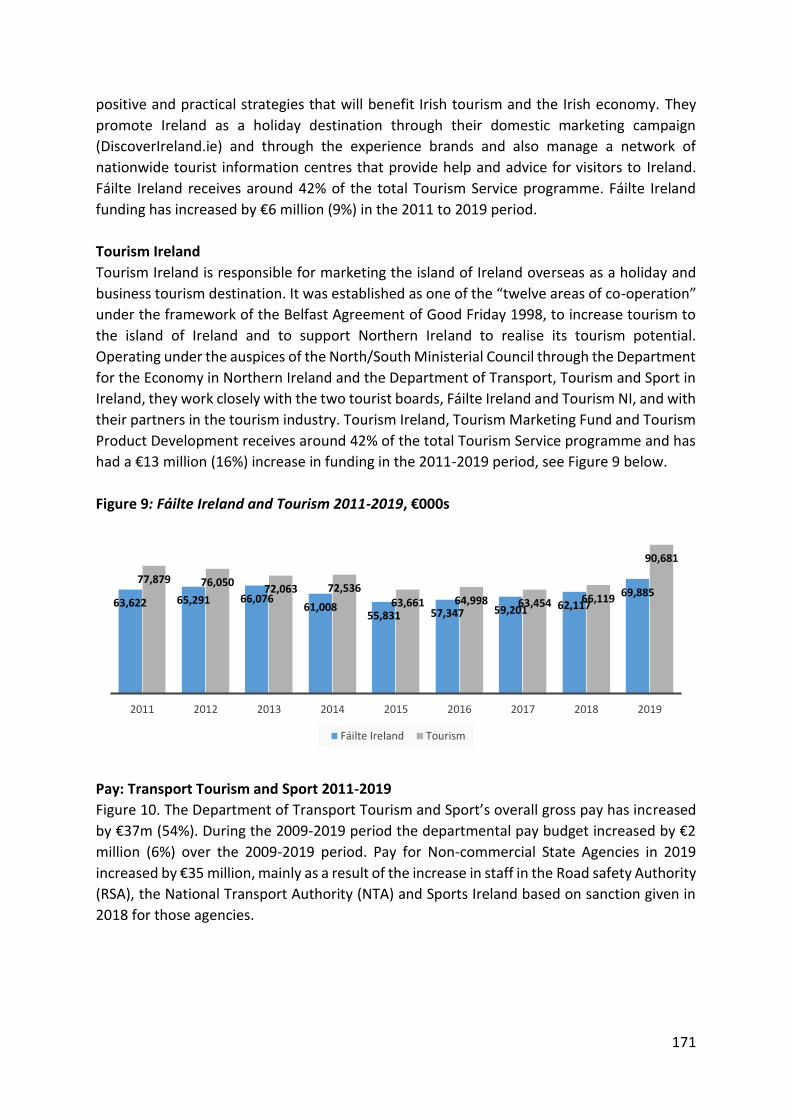
171
positive and practical strategies that will benefit Irish tourism and the Irish economy. They
promote Ireland as a holiday destination through their domestic marketing campaign
(DiscoverIreland.ie) and through the experience brands and also manage a network of
nationwide tourist information centres that provide help and advice for visitors to Ireland.
Fáilte Ireland receives around 42% of the total Tourism Service programme. Fáilte Ireland
funding has increased by €6 million (9%) in the 2011 to 2019 period.
Tourism Ireland
Tourism Ireland is responsible for marketing the island of Ireland overseas as a holiday and
business tourism destination. It was established as one of the “twelve areas of co-operation”
under the framework of the Belfast Agreement of Good Friday 1998, to increase tourism to
the island of Ireland and to support Northern Ireland to realise its tourism potential.
Operating under the auspices of the North/South Ministerial Council through the Department
for the Economy in Northern Ireland and the Department of Transport, Tourism and Sport in
Ireland, they work closely with the two tourist boards, Fáilte Ireland and Tourism NI, and with
their partners in the tourism industry. Tourism Ireland, Tourism Marketing Fund and Tourism
Product Development receives around 42% of the total Tourism Service programme and has
had a €13 million (16%) increase in funding in the 2011-2019 period, see Figure 9 below.
Figure 9: Fáilte Ireland and Tourism 2011-2019, €000s
Pay: Transport Tourism and Sport 2011-2019
Figure 10. The Department of Transport Tourism and Sport’s overall gross pay has increased
by €37m (54%). During the 2009-2019 period the departmental pay budget increased by €2
million (6%) over the 2009-2019 period. Pay for Non-commercial State Agencies in 2019
increased by €35 million, mainly as a result of the increase in staff in the Road safety Authority
(RSA), the National Transport Authority (NTA) and Sports Ireland based on sanction given in
2018 for those agencies.
63,622 65,291 66,07661,008
55,831 57,347 59,201 62,11769,885
77,879 76,05072,063 72,536
63,661 64,998 63,454 66,119
90,681
2011 2012 2013 2014 2015 2016 2017 2018 2019
Fáilte Ireland Tourism

172
Figure 10: Gross Departmental and Agency Pay 2009-2019, €m
Staff
Figure 11 below details staff numbers for both the Department and Agencies between 2009
and 2019. The overall Full Time Equivalent staffing numbers increased from 1,103 in 2009 to
2,011 by 2019, an increase of 908 or 82%. Departmental staff increased from 534 in 2009 to
582 in 2019, an increase of 48 or 9%, while the Agencies staff increased from 569 in 2009 to
1,429 in 2019, an increase of 860 or 151%.
Figure 11: DTTaS and Agencies Staff Analysis Numbers 2009-2019
34 30 31 29 28 27 27 27 28 32 3634 32
53 5852
44 4254 55 58
696862
83 8780
70 6981 83
90
105
2009 2010 2011 2012 2013 2014 2015 2016 2017 2018 2019
Dept Staff Agencies Total pay
534 493 497 466 455 426 428 459 486 530 582569 562
1,055 1,106 1,096 1,0221,204 1,223 1,215 1,293
1,429
1103 1055
1,552 1572 1,5511,448
1,632 1,682 1,7011,823
2,011
2009 2010 2011 2012 2013 2014 2015 2016 2017 2018 2019
Dept NCSA Total

173
2009 2010 2011 2012 2013 2014 2015 2016 2017 2018 2019
State Airport
Passenger
Numbers
26m
22.6m
22.7m
22.8m
23.8m
25.5m
28.8m
31.8m
33.6m
35.7m
35.5m
Number of
overseas
visitors
6.9m 6m 6.5m 6.5m 7m 7.6m 8.6m 9.5m 9.9m 10.6m 10.8m
Maritime
Investigation
of Vessels
780 1,130 1,130 1,500 1,130 1,011 1,204 1,293 1,500
Irish Coast
Guard
Helicopter
Tasked
512 470 553 532 808 914 1,013 898 1,073 1,246 770
Taxi
Complaints 476 433 346 377 742 952 928 998 1,146 1,310 1,383
Road traffic
accident
deaths
238 212 186 161 190 193 165 187 158 141 142
Road traffic
accident
injuries
9,742 8,270 7,235 7,942 6,880 8,079 7,840 7,710
Number of
privately
owned cars
1.9m 1.8m 1.8m 1.8m 1.9m 1.9m 1.9m 2m 2m
No of
medals won
at elite level
11
31
59
53
70
52
79
54
72
1. COVID-19 Passenger numbers and associated revenue on public transport has collapsed since March 2020 due to people working from home or being temporarily laid off. This has resulted in the Public Service Obligation (PSO) funding being increased by 161% (460m max) €285m to €745m approx. in 2020 to compensate for passenger revenues earned by transport operators. Financial supports have also been given to ensure the viability of 5 essential shipping routes (€15m once off), to provide for repatriation and compensation of overseas travellers under an EU directive (€15m), and Sporting NGB’s (€70m). 2. 2021 Outlook The ongoing public health advice will affect the ability of these sectors to return to normality. If social distancing continues into 2021, there is likely to be a demand for significant support for the Public Service Obligation (PSO) with some smaller level of funding also likely to be needed for overseas travellers and sporting NGB’s.
174
3. Brexit Brexit presents challenges right across the Transport and Tourism sectors in the areas of aviation, road haulage, adequacy of infrastructure at ports and airports, supporting tourism sector, protecting the efficiency of the North-South rail and bus connections; certification and standards issues in the maritime sector, also the impacts on road haulage and other sectors. The tourism sector will need to be supported to enable it to mitigate immediate negative economic impacts and to accelerate market diversification though both overseas marketing initiatives and development of domestic tourism “product”, particularly in those regional and rural areas most likely to suffer the negative impacts most keenly. 4. Public Transport Post 2020 Pre Covid-19, Ireland was heading for an economy with almost full employment and expected increasing demand for Public Transport. Additional funding will be required for public transport to enhance services by bus, rail and tram. It will include elements of the DART Expansion Programme and constituent projects which will make it more efficient to operate trains that access or move within the Greater Dublin Area. It will be needed to progress the BusConnects programme and the MetroLink project. Also additional capacity on the Luas Green Line with the purchase of tram extensions is on-going. 5. Emissions-related Climate challenge The enhancing of the capacity and quality of Public Transport because of the demand must be met, as far as possible and practical by greener public transport. The Dept. of Transport, Tourism and Sport have additional measures under Carbon Reduction Programme such as, the transition of a regional city bus fleet or potentially a bus fleet based at a specific bus depot to a Compressed Natural Gas (CNG)/Biogas fuelled fleet, through a collaboration with the NTA. The Green Public Transport Fund will be used to fund the differential costs between the conventionally and alternatively fuelled vehicles and also to support the supporting charging/refuelling infrastructure. In relation to the national bus fleet, Dept. of Transport are no longer purchasing diesel-only buses for the urban public bus fleet since July 2019 which will result in air quality benefits especially where older buses are being replaced 6. Evidence Base In order to assess whether value for money is being attained, visibility needs to be achieved in conveying the essential improvements being funded. For example, upgrading roads are reducing travel time and improving safety. Increasing public transport and frequency will reduce the time spent in queues and commuting. The National Transport Authority (NTA) have the metrics needed to check the performance level being delivered and determine whether the public transport system is achieving its goals.