Indicators and Methods for Cross-Sectional Surveys of ... · developed by CDC. Two of the four...
155
Transcript of Indicators and Methods for Cross-Sectional Surveys of ... · developed by CDC. Two of the four...


Forward
Vitamin and mineral deficiencies remain a significant public health problem in many parts of the world,
particularly in developing countries where deficiencies to vitamin A, iron, iodine and other micronutrients
leads to adverse health consequences. These include diminished learning and development capacity of
young children and reduced work capacity of adults, both of which contribute to poor socioeconomic
condition of populations. The implementation of effective intervention programs to eliminate or reduce
the prevalence of vitamin and mineral deficiencies in populations requires a wide array of activities
directed towards ensuring high coverage of interventions. One component of national micronutrient
programs includes the periodic assessment of the status of vitamin and mineral deficiencies, as well as the
adequacy of the coverage of interventions in a population using cross-sectional surveys.
Periodic cross-sectional surveys are helpful in answering questions such as: What is the current
magnitude and distribution of selected vitamin and mineral deficiencies? Has the prevalence of disease
changed over time in comparison with previous surveys? What is the coverage of interventions, such as
the proportion of target populations who have received nutrient supplements or are consuming fortified
foods? Has coverage changed over time? Are there groups in the population where the prevalence of
vitamin and mineral nutrient deficiencies remains high or where the coverage of interventions is
inadequate? Results from surveys also provide information on whether intervention strategies are helping
to achieve program objectives. For example, if there are interventions directed to the population to
promote behavioral change to overcome vitamin and mineral deficiencies, then the level of knowledge,
attitudes, and practices (KAP) of the population can be assessed using periodic surveys. The results of a
cross-sectional survey provide a snapshot of the vitamin and mineral status of a population at a specific
time period.
We hope you find this manual useful in the planning and implementation of cross-sectional surveys and
trust that the information generated from such surveys will help to support programs to prevent and
control vitamin and mineral deficiencies.

Acknowledgements
These guidelines have been developed by the Micronutrient Initiative and the Centers for Disease Control
and Prevention in response to increasing interest by countries to undertake population-based assessment
of vitamin and mineral deficiencies and the coverage of intervention programs. We would like to thank
the many individuals who made comments on various versions of this manuscript with expertise in
different aspects of nutrient status assessment and survey methods: Shawn Baker, Erick Boy, Jenny
Cervinskas, Christine Clewes, Denise Coitinho, Bruno de Benoist, Wilma Freire, Deborah Galuska,
Heather Gardner, Larry Grummer-Strawn, Elaine Gunter, Maria Elena Jefferds, Jim Lepkowski, Julia
Moorman, and Tom Schaetzel. Individuals from the Program for Technology in Health (PATH) provided
comments in the latter stages of manuals development, particularly in the area of rapid diagnostic tools
and the appropriate use of tools in the field assessment of micronutrient status.
Parts of this manual are based on the Urinary Iodine Assessment: A Manual on Survey and
Laboratory Methods (Sullivan et al., 2000), the End-Decade Multiple Indicator Survey Manual:
Monitoring Progress Toward the Goals of the 1990 World Summit for Children (UNICEF, 2000), the
Multiple Indicator Cluster Survey Manual 2005 (UNICEF, 2006), and from documents and presentations
developed by CDC. Two of the four authors, Jonathan Gorstein and Kevin Sullivan, performed this
work, in part, as consultants to the Micronutrient Initiative. Jonathan Gorstein (University of Washington), Kevin Sullivan (Emory University and the Centers
For Disease Control and Prevention), Ibrahim Parvanta (Centers for Disease Control and
Prevention), and France Begin (Micronutrient Initiative) Jonathan Gorstein Department of Health Services University of Washington School of Public Health 1959 NE Pacific Street, H-688 Box No. 357660 Seattle, WA 98195 USA
Kevin M. Sullivan Department of Epidemiology Rollins School of Public Health Emory University 1518 Clifton Road, NE Atlanta, GA 30322 USA
Ibrahim Parvanta Centers for Disease Control and Prevention International Micronutrient Malnutrition Prevention and Control Program (IMMPaCt) 4770 Buford Hwy., NE, MS K25 Atlanta, GA 30333 USA
France Begin Micronutrient Initiative P.O. Box 56127 250 Albert Street Ottawa, Ontario Canada

Indicators and Methods for Cross-Sectional Surveys of Vitamin and Mineral Status of Populations 1
Suggested citation: Gorstein J, Sullivan KM, Parvanta I, Begin F. Indicators and Methods for Cross-Sectional Surveys of Vitamin and Mineral Status of Populations. The Micronutrient Initiative (Ottawa) and the Centers for Disease Control and Prevention (Atlanta), May 2007.

Indicators and Methods for Cross-Sectional Surveys of Vitamin and Mineral Status of Populations 2
Disclaimer
The mention of product names and websites in this document do not constitute an official endorsement
for the products by any of the agencies or individuals involved in the development of this manual. They
are mentioned to provide users of this manual with information on the types of products frequently used
in micronutrient surveys and where to obtain further information. None of the authors, reviewers, or
agencies has a monetary link to the private companies mentioned.

Indicators and Methods for Cross-Sectional Surveys of Vitamin and Mineral Status of Populations 3
Abbreviations AGP Alpha 1-acid glycoprotein APP Acute Phase Proteins ARI Acute Respiratory Infection CDC Centers for Disease Control and Prevention, Atlanta, USA CRP C-Reactive Protein d Level of absolute precision DBS Dried blood spot DEFF Design Effect DHS Demographic and Health Survey EDTA Ethylenediaminetetraacetic acid EPI Expanded Programme on Immunization Hb Hemoglobin HH Household HKI Helen Keller International HPLC High-Pressure Liquid Chromatography ICCIDD International Council for the Control of Iodine Deficiency Disorders ID Iron Deficiency IDA Iron Deficiency Anemia IDD Iodine Deficiency Disorders ILSI International Life Science Institute IMMPaCt International Micronutrient Malnutrition Prevention and Control Program, CDC INACG International Nutritional Anemia Consultative Group IVACG International Vitamin A Consultative Group KAP Knowledge, Attitudes, and Practices MAPit Micronutrient Action Plan instructional tool MICS Multiple Indicator Cluster Survey MI Micronutrient Initiative MM Micronutrient Malnutrition PATH Program for Technology in Health PDAs Personal Digital Assistants ppm Parts Per Million PPS Probability Proportionate to Size PSU Primary Sampling Unit RBP Retinol Binding Protein SF Serum Ferritin TfR Transferrin Receptor TSH Thyroid Stimulating Hormone (or thyrotropin) UI Urinary iodine UNICEF United Nations Children’s Fund USI Universal Salt Iodization VAD Vitamin A Deficiency WHO World Health Organization WRA Women of Reproductive Age WSC World Summit for Children Z Z-score

Indicators and Methods for Cross-Sectional Surveys of Vitamin and Mineral Status of Populations 4

Indicators and Methods for Cross-Sectional Surveys of Vitamin and Mineral Status of Populations 5
Table of Contents
Forward .......................................................................................................................................... ii
Acknowledgements........................................................................................................................ iii
Disclaimer....................................................................................................................................... 2
Abbreviations.................................................................................................................................. 3
Table of Contents ........................................................................................................................... 5
Chapter 1 Overview ................................................................................................................. 11
1.1 Introduction ............................................................................................................................. 11
1.2 Public Health Significance of Vitamin and Mineral Deficiencies............................... 11
1.3 Assessing Multiple Vitamin and Mineral Deficiencies ................................................. 12
1.4 Planning the Survey .............................................................................................................. 12
Chapter 2 Overall Survey Objectives.................................................................................. 15
2.1 Which Nutrients to Include?................................................................................................ 15
2.2 Which Indicators to Measure?............................................................................................ 15 2.2.1 General Issues Related to Indicator Selection......................................................................16
2.3 Which Target Groups to Assess?...................................................................................... 20 2.3.1 Preschool children ......................................................................................................................21 2.3.2 School age children ....................................................................................................................21 2.3.3 Women of reproductive age .....................................................................................................22 2.3.4 Men..................................................................................................................................................22
2.4 Summary on target groups and survey sites ................................................................. 23
2.5 Where to measure participants - household or a central site?.................................. 23
2.6 Benefits of survey to participants ..................................................................................... 24
Chapter 3 Survey Design and Sampling Strategies ....................................................... 25
3.1 Introduction ............................................................................................................................. 25
3.2 National vs. Sub-National Estimates................................................................................. 26

Indicators and Methods for Cross-Sectional Surveys of Vitamin and Mineral Status of Populations 6
3.3 Household vs. clinic vs. school-based surveys ............................................................ 26
3.4 Independent Survey vs. Incorporating Micronutrient Indicators into another Survey ................................................................................................................................................... 27
3.5 Sample Size Calculations .................................................................................................... 28 3.5.1 Sample size for proportion in single cross-sectional survey ..........................................29 3.5.2 Sample size calculation for comparing two surveys .........................................................31 3.5.3 Subgroup Comparisons and their affect on sample size..................................................33 3.5.4 Accounting for Response Rates .............................................................................................35 3.5.5 Number of Households ..............................................................................................................36
3.6 Number of clusters and samples per cluster ................................................................. 37 3.6.1 Number of Households/Individuals per Cluster and the Number of Clusters .............37
3.7 How to select clusters .......................................................................................................... 39 3.7.1 PPS selection of clusters ...........................................................................................................39 3.7.2 Random and systematic selection of clusters.....................................................................42
3.8 Summary .................................................................................................................................. 43
Chapter 4 Household and Subject Selection.................................................................... 45
4.1 Segmenting clusters ............................................................................................................. 46 4.1.1 How to Map a Cluster/Segment When Accurate Maps Are Not Available .....................49 4.1.2 More Detailed Map of Area Selected and Selecting Households – Random or Systematic Selection of a Fixed Number of Households Method .....................................................51
4.2 Selecting Households using Random or Systematic Selection of a Fixed Number of Households.......................................................................................................................................... 53
4.2.1 Random or systematic selection of a fixed number of households ...............................53
4.3 Random selection of first household ............................................................................... 55 4.3.1 Selecting the First Household...................................................................................................55 4.3.2 Selecting Subsequent Households .........................................................................................55
4.4 Some general notes on the household selection process.......................................... 56
4.5 Selection of eligible individuals within households ..................................................... 57
Chapter 5 Survey Planning, Organization, Training, and Field Work ........................ 59
5.1 Supervision.............................................................................................................................. 59
5.2 Coordination and Communications .................................................................................. 59

Indicators and Methods for Cross-Sectional Surveys of Vitamin and Mineral Status of Populations 7
5.3 Protocol .................................................................................................................................... 60
5.4 Recruitment of Survey Teams ............................................................................................ 60
5.5 Pilot Testing............................................................................................................................. 62
5.6 Training team members........................................................................................................ 62
5.7 Development of Survey Instruments and Forms........................................................... 62
5.8 Other survey forms and documents ................................................................................. 63
5.9 Equipment and Supplies ...................................................................................................... 63
5.10 Logistics ............................................................................................................................... 65
5.11 Transportation and Lodging ........................................................................................... 65
5.12 Disposal of Contaminated Materials ............................................................................. 65
5.13 Budget................................................................................................................................... 66
Chapter 6 Data Entry, Cleaning, and Analysis ................................................................. 67
6.1 Data Entry................................................................................................................................. 67
6.2 Data Cleaning .......................................................................................................................... 68
6.3 Data Analysis .......................................................................................................................... 69 6.3.1 PPS Surveys ..................................................................................................................................69 6.3.2 Stratified PPS Surveys ................................................................................................................72 6.3.3 Non-PPS Surveys .........................................................................................................................74
6.4 Summary .................................................................................................................................. 75
Chapter 7 Development of Preliminary Report, Final Report, and Program
Management .............................................................................................................................. 77
7.1 Preliminary Report ................................................................................................................. 77
7.2 Final Report ............................................................................................................................. 78
7.3 Additional Reports ................................................................................................................. 80
7.4 Dissemination ......................................................................................................................... 80
Appendices.................................................................................................................................... 81
Appendix 1 Background on Micronutrient Deficiencies ............................................... 83

Indicators and Methods for Cross-Sectional Surveys of Vitamin and Mineral Status of Populations 8
A1.1 Iron Deficiency (ID), Anemia, and Iron Deficiency Anemia (IDA) .......................... 83 A1.1.1 Global prevalence of ID, Anemia, and IDA .............................................................................83 A1.1.2 Consequences of ID, Anemia, and IDA ...................................................................................84 A1.1.3 Interventions for IDA....................................................................................................................84
A1.2 Vitamin A Deficiency (VAD) .................................................................................................. 84 A1.2.1 Global prevalence of VAD ..........................................................................................................85 A1.2.2 Consequences of VAD ................................................................................................................85 A1.2.3 Interventions for VAD ..................................................................................................................85
A1.3 Iodine Deficiency................................................................................................................ 86 A1.3.1 Global prevalence of Iodine Deficiency Disorders (IDD)....................................................86 A1.3.2 Consequences of Iodine Deficiency ........................................................................................86 A1.3.3 Interventions for IDD....................................................................................................................86
Appendix 2 Micronutrient Indicators .................................................................................. 89
A2.1 Vitamin A Deficiency (VAD) .................................................................................................. 89 A2.1.1 Serum retinol .................................................................................................................................89 A2.1.2 Retinol binding protein (RBP) ...................................................................................................90 A2.1.3 VAD clinical and morphologic indicators ..............................................................................91 A2.1.4 VAD control program indicators (supplementation, fortification, and dietary diversification) ................................................................................................................................................91
A2.2 Iron Deficiency Anemia (IDA) ............................................................................................... 93 A2.2.1 Hemoglobin as the primary indicator of anemia......................................................................95 A2.2.2 Indicators for assessing iron status ...........................................................................................98
A2.3 Iodine Deficiency.............................................................................................................. 101 A2.3.1 Urinary iodine as the primary indicator of iodine nutrition .............................................102 A2.3.2 Salt iodine level...........................................................................................................................103 A2.3.3 Other Iodine Program-Related Information .........................................................................104
A2.4 Acute Phase Reactant..................................................................................................... 105
Appendix 3 Modified UNICEF Multiple Indicator Cluster Survey (MICS)
Questionnaires ....................................................................................................................... 107
Appendix 4 Basic Issues in Sampling.............................................................................. 119
A4.1 General sampling issues and terminology ............................................................... 119
A4.2 Example of Simple and Systematic Sampling.......................................................... 120

Indicators and Methods for Cross-Sectional Surveys of Vitamin and Mineral Status of Populations 9
A4.3 Sampling from Large Populations............................................................................... 123
Appendix 5 Sample Size Tables......................................................................................... 125
Appendix 6 Random Number Table .................................................................................. 127
Appendix 7 Guidelines for Interviewers .......................................................................... 129
A7.1 Human Rights and Consent Issues............................................................................. 129
A7.2 Conducting interviews.................................................................................................... 129 A7.2.1 Make a Good First Impression ................................................................................................130 A7.2.2 Always have a Positive Approach..........................................................................................130 A7.2.3 Stress Confidentiality of Responses when Necessary.....................................................130 A7.2.4 Answer Any Questions from the Respondent Frankly .....................................................130 A7.2.5 Interview the Respondent Alone ............................................................................................131
A7.3 Tips for Successful Interview ....................................................................................... 131
Appendix 8 Example Tables................................................................................................ 135

Indicators and Methods for Cross-Sectional Surveys of Vitamin and Mineral Status of Populations 10

Indicators and Methods for Cross-Sectional Surveys of Vitamin and Mineral Status of Populations 11
Chapter 1 Overview
1.1 Introduction
This manual is intended for program managers who are responsible for the design and implementation of
surveys to assess vitamin and mineral deficiencies (see Box 1.1) as well as others involved in the
planning, implementation, analysis, and reporting of survey results. Such surveys are usually carried out
periodically to provide information that should lead to advocacy and appropriate intervention strategies.
When carried out sequentially, surveys can be used to track progress of prevention and control efforts
over time.
Box 1.1 The main objective of this manual is to describe procedures and tools necessary to undertake a
cross-sectional survey that will:
• Provide estimates of the prevalence of iron deficiency anemia, iodine deficiency, and vitamin A
deficiency.
• Provide information on the coverage of prevention and control programs such as vitamin A capsule
distribution, salt iodization, and flour fortification.
1.2 Public Health Significance of Vitamin and Mineral Deficiencies
Many vitamins and minerals are needed in small amounts to perform important physiological functions. 1
Iron, vitamin A, and iodine are three major micronutrients targeted for intervention in many countries to
reduce the prevalence of these deficiencies, and therefore, improve the health and socioeconomic status of
populations. A description of the magnitude and consequences of these deficiencies is provided in
Appendix 1. There are a number of other important vitamins and minerals of public health importance
not covered in this manual, including folate and zinc.
Unlike some infectious diseases that may be eradicated, such as smallpox or polio, vitamin and
mineral deficiencies can only be eliminated and controlled through ongoing programs to ensure adequate
nutrient intake among populations. While insufficient dietary intake is the primary cause of nutrient

Indicators and Methods for Cross-Sectional Surveys of Vitamin and Mineral Status of Populations 12
deficiencies, other conditions, such as infectious and parasitic diseases, chronic illness, certain genetic
conditions, and other dietary components that may enhance or interfere with nutrient absorption, also
affect vitamin and mineral status.
1.3 Assessing Multiple Vitamin and Mineral Deficiencies
In order to develop appropriate intervention strategies and plan effective control programs, it is useful to
have information regarding the magnitude, distribution, and etiology of several different vitamin and
mineral deficiencies. In developing countries, populations are often affected by multiple nutrient
deficiencies, frequently as a result of poverty and diets with little diversity. This manual is intended to
provide a framework for the design and implementation of national surveys that allow countries to
simultaneously assess iron, vitamin A, and iodine deficiencies.
1.4 Planning the Survey
Designing an integrated micronutrient survey requires many decisions, and these will be dependent on the
survey objectives, resources available, and the time period in which the survey is to be completed (Box
1.2). In all cases, it is essential that the data collected can provide information to guide intervention
strategies and programs.
It may be instructive to consider the steps in Box 1.2 in reverse order, where it is ultimately the use of
data for planning and improving interventions that should be the driving force behind the design of the
survey. Only relevant data should be collected that may affect program management, with emphasis
placed on collecting data with good quality and rigor. The level to which survey results can help
advocate for intervention programs, guide on-going prevention and control programs, and lead to
effective strategies will justify the expense of the survey in the first place. In planning a survey, it is
important to review the overall survey steps listed in Box 1.2 several times before a final plan is agreed
upon.
We recommend that a national survey planning committee be created and include relevant
government agencies and other organizations. A collaborative effort on the support, design, and
implementation of the survey assists in assuring the results of the survey are accepted and endorsed by the
various organizations.
Indicators and Methods for Cross-Sectional Surveys of Vitamin and Mineral Status of Populations 13
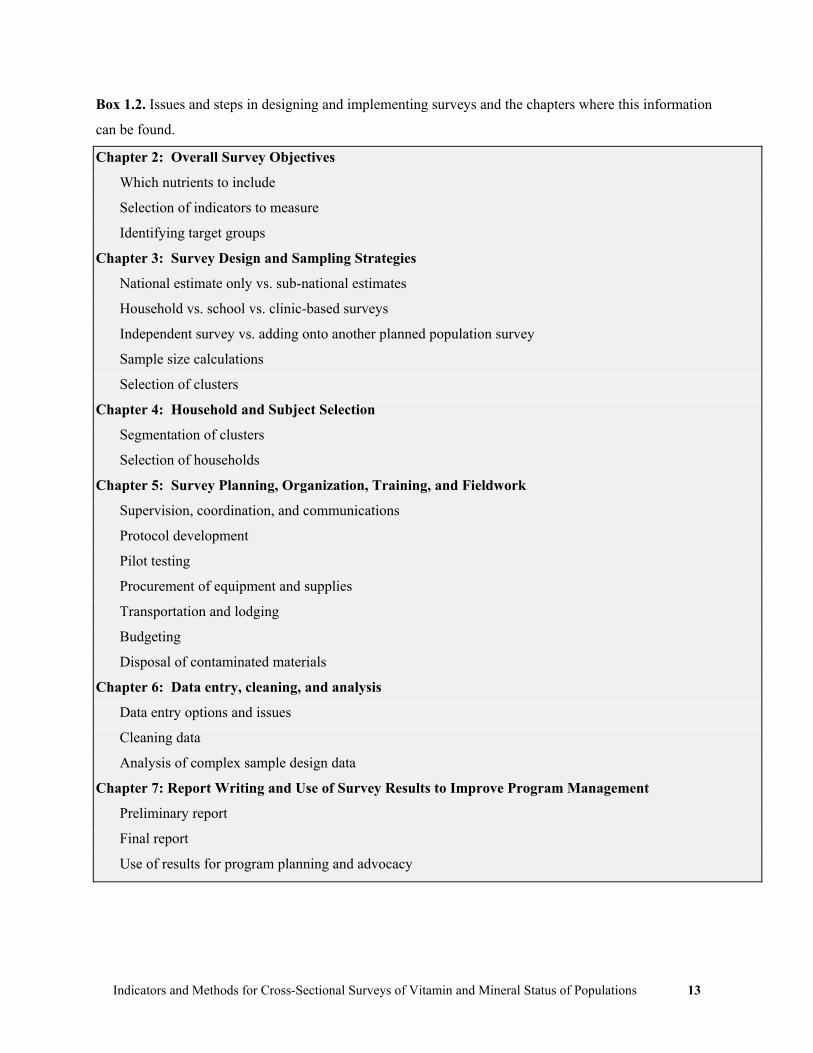
Box 1.2. Issues and steps in designing and implementing surveys and the chapters where this information
can be found.
Chapter 2: Overall Survey Objectives
Which nutrients to include
Selection of indicators to measure
Identifying target groups
Chapter 3: Survey Design and Sampling Strategies
National estimate only vs. sub-national estimates
Household vs. school vs. clinic-based surveys
Independent survey vs. adding onto another planned population survey
Sample size calculations
Selection of clusters
Chapter 4: Household and Subject Selection
Segmentation of clusters
Selection of households
Chapter 5: Survey Planning, Organization, Training, and Fieldwork
Supervision, coordination, and communications
Protocol development
Pilot testing
Procurement of equipment and supplies
Transportation and lodging
Budgeting
Disposal of contaminated materials
Chapter 6: Data entry, cleaning, and analysis
Data entry options and issues
Cleaning data
Analysis of complex sample design data
Chapter 7: Report Writing and Use of Survey Results to Improve Program Management
Preliminary report
Final report
Use of results for program planning and advocacy

Indicators and Methods for Cross-Sectional Surveys of Vitamin and Mineral Status of Populations 14

Indicators and Methods for Cross-Sectional Surveys of Vitamin and Mineral Status of Populations 15
Chapter 2 Overall Survey Objectives
This chapter discusses the development of survey objectives, such as which nutrients to include, which
indicators to use, and which target groups to assess. These overall objectives should be decided upon
based on the utility of the information and cost of obtaining the information. The overall objectives
influence subsequent aspects of the survey, such as the sample size, laboratory assays, questionnaire
design, field logistics, etc.
2.1 Which Nutrients to Include?
In many developing countries, the majority of the population is affected, to some extent, with iron,
vitamin A, and iodine deficiencies. Thus, a survey might include indicators to estimate the prevalence of
all three deficiencies, the prevalence of conditions that contribute to the deficiencies, coverage of
interventions and the populations’ related knowledge, attitudes, and practices (KAP). Issues that might
affect the decision on which three nutrients to assess are presented in Box 2.1.
Box 2.1 Issues concerning which vitamins and minerals to include in a survey can be influenced by the
following:
What is already known about different vitamin and mineral deficiencies in the country?
Has there been a recent survey of any of the nutrients?
Is an intervention program in place or being planned?
Will it be feasible to test the same target groups in the survey for more than one micronutrient?
2.2 Which Indicators to Measure?
The survey will most likely include the collection of data relevant to the prevention program and impact
indicators, i.e., assessment of intervention coverage, and measurement of nutrient status. This would
allow relevant authorities in the public and private sectors to determine which interventions appear to be
appropriate and whether implementation strategies and components currently in place are adequate. In

Indicators and Methods for Cross-Sectional Surveys of Vitamin and Mineral Status of Populations 16
addition, it is generally useful to collect data on other relevant health parameters, demographic and
socioeconomic characteristics of the survey population, and knowledge, attitudes, and practices related to
intervention programs. Through analyses of these variables it may be possible to better understand the
major factors associated with the nutrient deficiencies, characteristics of groups targeted for intervention,
and in turn, identify opportunities for improved program planning. An important aspect of the survey
management is to focus on collection of only essential data related to the overall survey objectives.
This manual emphasizes the use of indicators recommended by WHO and other internationally
recognized organizations (see Table 2.1) for use in population surveys for classifying the public health
significance of vitamin and mineral deficiencies and monitoring progress toward their elimination. Other
indicators may be useful for special research studies, but are often less suitable in large cross-sectional
surveys. Appendix 2 presents detailed information on different indicators along with the survey
requirements for their measurement. Appendix 2 also includes a section on assessing infection or
inflammation status which can affect the results of a number of laboratory tests of vitamin and mineral
status. Different indicators have logistical requirements in terms of equipment, technology, human
resource capacity, and laboratory expertise.
2.2.1 General Issues Related to Indicator Selection
This section presents some general issues related to the selection of indicators for a micronutrient survey.
A general overview of some of the information that might be collected in a cross-sectional survey is
provided in Box 2.2. The issues include collection, processing, storage, transport and testing of blood and
urine specimens (see Table 2.1), assessment of coverage of supplements and food fortification programs,
and decisions on selecting target groups. These indicators are described in more detail in Appendix 2.
Box 2.2 The basic components of a vitamin and mineral status survey may include: • Information on demographic characteristics of the survey population • Information relating to intervention programs (fortification, supplementation, communication and
promotion) • Testing of samples of fortified foods and/or related labelling information • Collection and testing of blood and urine specimens to assess vitamin and mineral status • Collection of other specimens and/or questionnaire data on illness and infection that could affect
laboratory test results • Collection of limited dietary data (usually a simple food frequency questionnaire)

Indicators and Methods for Cross-Sectional Surveys of Vitamin and Mineral Status of Populations 17
Table 2.1 Overview of selected indicators to assess iron, iodine and vitamin A status and intervention
programs.
Indicators for Assessing Interventions Nutrient Indicators for Assessing Status
Supplementation Fortification Dietary Improvement
Iron Hemoglobin Serum ferritin Transferrin
receptor
% coverage and compliance with iron supplements/ multiple vitamins in target groups
% households using iron-fortified products (e.g., iron-fortified flour); % households using in-home fortification (e.g., Sprinkles)
% target population regularly consuming iron-fortified foods, iron-rich foods, foods which promote iron absorption, and/or foods that inhibit iron absorption
Iodine Urinary iodine % coverage and compliance with multiple vitamins containing iodine in target groups
% households using iodine-fortified products (e.g., iodized salt)
% target population regularly using iodine-fortified foods
Vitamin A Serum retinol
% coverage of vitamin A supplements/multiple vitamins in target groups
% households using vitamin A fortified foods (e.g. fortified oil, sugar, dairy) % households using in-home fortification (e.g., Sprinkles)
% target population regularly eating vitamin A rich foods
2.2.1.i Blood Specimen Collection
Blood and/or resulting serum samples are often collected to assess the iron and/or vitamin A status of
populations. Specimens can be collected using either capillary or venous blood depending on the volume
of blood needed for laboratory testing (see Table 2.2). For a number of laboratory tests, small volumes of
whole capillary blood obtained from a finger puncture can be tested immediately (e.g., Hb using
HemoCueTM) or spotted onto filter paper. It is also possible to collect capillary blood samples in
microtainers for further processing and testing. For laboratory assays which require a large volume of
serum (> 400μl), collection of blood via venipuncture would be necessary.
Indicators and Methods for Cross-Sectional Surveys of Vitamin and Mineral Status of Populations 18
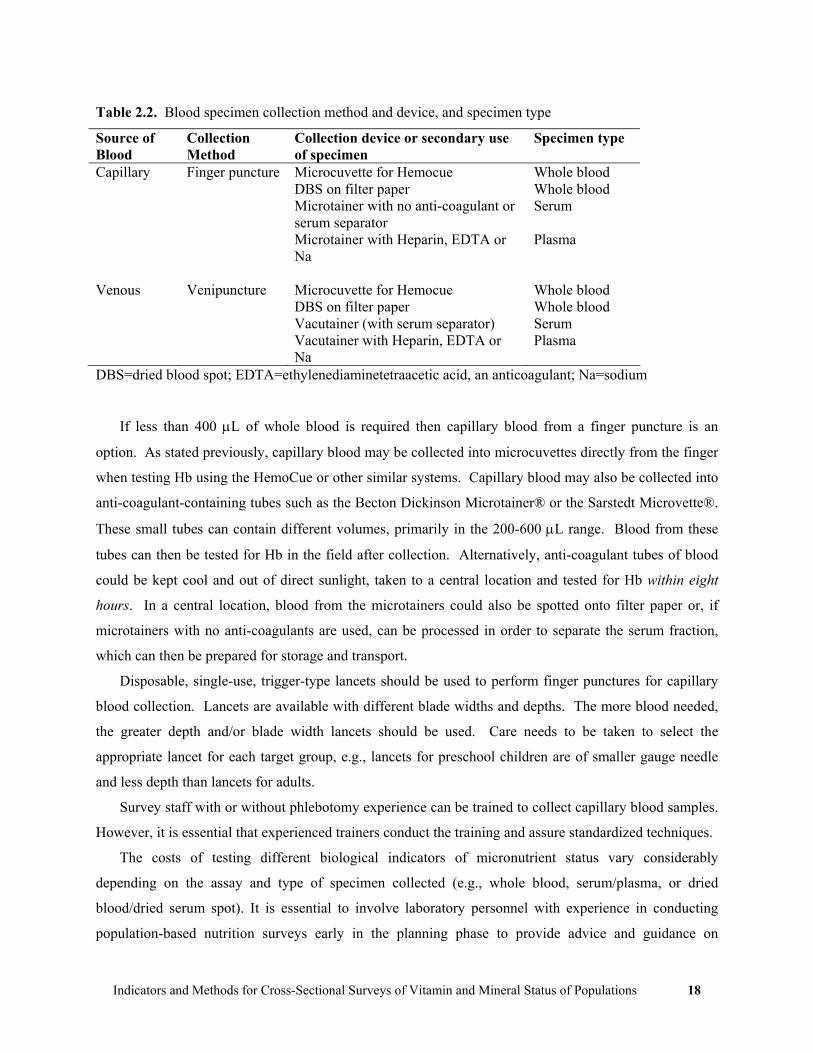
Table 2.2. Blood specimen collection method and device, and specimen type
Source of Blood
Collection Method
Collection device or secondary use of specimen
Specimen type
Capillary Finger puncture Microcuvette for Hemocue Whole blood DBS on filter paper Whole blood Microtainer with no anti-coagulant or
serum separator Serum
Microtainer with Heparin, EDTA or Na
Plasma
Venous Venipuncture Microcuvette for Hemocue Whole blood DBS on filter paper Whole blood Vacutainer (with serum separator) Serum Vacutainer with Heparin, EDTA or
Na Plasma
DBS=dried blood spot; EDTA=ethylenediaminetetraacetic acid, an anticoagulant; Na=sodium
If less than 400 μL of whole blood is required then capillary blood from a finger puncture is an
option. As stated previously, capillary blood may be collected into microcuvettes directly from the finger
when testing Hb using the HemoCue or other similar systems. Capillary blood may also be collected into
anti-coagulant-containing tubes such as the Becton Dickinson Microtainer® or the Sarstedt Microvette®.
These small tubes can contain different volumes, primarily in the 200-600 μL range. Blood from these
tubes can then be tested for Hb in the field after collection. Alternatively, anti-coagulant tubes of blood
could be kept cool and out of direct sunlight, taken to a central location and tested for Hb within eight
hours. In a central location, blood from the microtainers could also be spotted onto filter paper or, if
microtainers with no anti-coagulants are used, can be processed in order to separate the serum fraction,
which can then be prepared for storage and transport.
Disposable, single-use, trigger-type lancets should be used to perform finger punctures for capillary
blood collection. Lancets are available with different blade widths and depths. The more blood needed,
the greater depth and/or blade width lancets should be used. Care needs to be taken to select the
appropriate lancet for each target group, e.g., lancets for preschool children are of smaller gauge needle
and less depth than lancets for adults.
Survey staff with or without phlebotomy experience can be trained to collect capillary blood samples.
However, it is essential that experienced trainers conduct the training and assure standardized techniques.
The costs of testing different biological indicators of micronutrient status vary considerably
depending on the assay and type of specimen collected (e.g., whole blood, serum/plasma, or dried
blood/dried serum spot). It is essential to involve laboratory personnel with experience in conducting
population-based nutrition surveys early in the planning phase to provide advice and guidance on

Indicators and Methods for Cross-Sectional Surveys of Vitamin and Mineral Status of Populations 19
biochemical methods. Issues concerning supplies, procedures for collection, processing,
transport/shipping, storage, and analysis of laboratory specimens must be considered. The following
issues should be considered:
• What type(s) of specimen(s) should be collected?
• What volume is required?
• What supplies are needed to collect the biological specimens?
• What kind of training is required for laboratory field staff?
• At what temperature must the specimens be stored?
• How will waste products, such as lancets, needles, syringes, be safely disposed?
It is important to identify, as soon as possible, a laboratory that would perform the tests and verify
that the laboratory has adequate equipment, experience, and quality assurance mechanisms in place.
Some of the issues to be agreed upon with the testing laboratory include the number and volume of
samples that could be tested in a timely manner, how the samples are to be processed, stored, and
transported to the laboratory, and assay costs. Another issue is how the results of the laboratory tests will
be provided; generally an electronic file with the laboratory results is preferred. Each test result should
include the survey participant’s ID number as assigned in the survey. In addition, information concerning
the laboratory methods used and any quality assurance from the testing should be requested in advance. It
is preferable that a single laboratory performs analysis of all samples for a specific assay to avoid inter-
laboratory variation.
2.2.1.ii Assessing coverage of supplementation interventions
There are a number of issues in attempting to obtain information to estimate accurate supplement
coverage. For vitamin and mineral deficiencies, for many countries, most commonly this would include
iron and vitamin A supplementation. For vitamin A supplementation, in some areas, the provision of a
supplement to an individual is not documented in medical records or on a personal health record, while in
other areas vitamin A supplementation is recorded on an immunization record or other medical record.
Usually questions concerning vitamin A supplement use in children are limited to the previous 6 months.
In areas where vitamin A supplements are not documented in an immunization or medical record, during
the interview, respondents are asked whether they or their child have received supplements, which may be
enhanced by showing an example of the capsule or by associating the supplement with the place or event
of delivery. The history based on recall may not be accurate for a number of reasons which could

Indicators and Methods for Cross-Sectional Surveys of Vitamin and Mineral Status of Populations 20
potentially over- or under-estimate coverage depending on the situation. We recommend that questions
concerning supplement coverage need to be tailored to each country’s situation to maximize validity.
2.2.1.iii Assessing adequacy and coverage of fortification interventions In assessing the use of fortified foods in the household, the inspection of food packaging can be useful to
determine if the product is labeled as fortified. In some instances, the packaging may not be available.
For some fortified products, there may be a simple test that can be performed in the field, such as the
rapid test kit to semi-quantitatively estimate the iodine content in salt. Some iodine rapid test kits are of
low sensitivity and specificity compared to more definitive laboratory tests. Another issue is whether a
sample of the food should be collected and sent to a laboratory for testing, an issue that needs to be
addressed early in the planning stage of a survey to determine the test(s) to be performed as well as issues
related to collection, labeling, storing, and shipping of food specimens, and identification of appropriate
laboratories. Should it be determined that salt will be collected from households (or other sources) and
sent to a central laboratory for quantifying the level of iodine in salt, we recommend the salt titration
method or use of the WYD Iodine Checker (National Salt Research Center, Tianjin, China).
2.3 Which Target Groups to Assess?
An important consideration in the selection of indicators for a micronutrient survey is to determine which
groups to assess which is usually based on vulnerability, representativeness, and accessibility2, or, to
assess the coverage or effectiveness of an intervention targeted to a specific group, such as vitamin A
supplementation in young children or iron supplementation in a specific group of women. The group
selected should be vulnerable to the deficiency, have measurable negative health consequences as a result
of the deficiency, and be responsive to interventions. Representativeness is the extent to which the
selected group represents the status of the general population and/or other potential target groups.
Accessibility has to do with logistics and the ability to gather data in a systematic way that reduces costs
in performing the survey. Finally, it may be important to take into account whether a group is useful for
assessing multiple micronutrient problems since this could greatly increase the efficiency of a survey.
The following presents the groups usually assessed for micronutrient status and coverage in cross-
sectional surveys, although other groups can be assessed depending on the situation:
• Iron deficiency anemia: women of childbearing age and/or preschool children
• Vitamin A deficiency: preschool children

Indicators and Methods for Cross-Sectional Surveys of Vitamin and Mineral Status of Populations 21
• Iodine deficiency: school-age children and/or women of childbearing age
2.3.1 Preschool children
Preschool children, usually defined as less than five years of age, are particularly vulnerable to the
consequences of micronutrient malnutrition and are an important target group to assess for some
micronutrient deficiencies. Iron and vitamin A deficiencies are often prevalent among preschool children
in developing countries. Although preschool children are also vulnerable to iodine deficiency, this age
group is generally not recommended as a target group for assessing iodine deficiency primarily because it
is difficult to collect urine samples in this age group Preschool children may be accessed either through
household-based surveys, or where clinic registration and attendance is high, through clinic-based
surveys.
2.3.2 School age children
Historically, school age children between 6 and 12 years of age have been targeted for surveys of iodine
deficiency primarily because of the relative ease with which they could be assembled to assess goiter.
However, because the developing fetus is the most vulnerable to the negative consequences of iodine
deficiency, it may be important to assess iodine status of women of reproductive age. We would like to
note that at the present time there are no cut off values for urinary iodine in nonpregnant women by
WHO, although some experts have provided such values.
Although school age children can be efficiently assessed for iodine deficiency in schools, school-
based surveys should only be implemented in areas where the proportion of children attending school is
high (around 75% or higher). In populations with low school attendance, a household-based survey
would be preferable. There are other reasons to assess school age children, such as for micronutrient
supplement coverage or impact if they are targeted to this group, or for assessing the causes of anemia, in
addition iron deficiency, in this group, such as hookworm. The assessment of VAD in school age children
is infrequent.

Indicators and Methods for Cross-Sectional Surveys of Vitamin and Mineral Status of Populations 22
2.3.3 Women of reproductive age
Women of reproductive age (WRA), usually defined as women 15 through 49 years of age, are also
vulnerable to vitamin and mineral deficiencies and may provide insight into the magnitude of
micronutrient deficiencies among newborns. In countries where vitamin A deficiency is endemic,
pregnant women often experience ocular symptoms of VAD, such as night blindness, which continue into
the early period of lactation. In some countries of South-East Asia, the prevalence of night blindness has
been reported to be greater than 10% in pregnant women.3 For nursing infants, breast milk from deficient
mothers is likely to contain insufficient levels of vitamin A to build or maintain vitamin A stores.
In pregnant women, iron deficiency leads to anemia which is associated with an increased risk of
maternal mortality and morbidity, fetal morbidity and mortality, and intrauterine growth retardation. The
consequences of iodine deficiency in pregnant women are particularly severe since thyroid hormones are
essential for the mental and physical development of the fetus. Brain damage in the fetus and infancy
attributable to severe and prolonged iodine deficiency is likely to be irreversible.9 However, in many
populations, finding an adequate number of pregnant women in household-based surveys is too time-
consuming because a large number of households would need to be visited to identify a sufficient sample
of pregnant woman. Therefore, for household-based micronutrient surveys in populations with low
fertility rates, in general it is not recommended to have pregnant women as one of the main target groups.
It may be possible to assess pregnant women in a clinic-based survey; however, similar to the issue in
school-based surveys, it would be important to assure a large proportion of the pregnant women seeking
prenatal care from clinics.
2.3.4 Men While men can suffer the consequences of vitamin and mineral deficiencies, they tend to be less affected
compared to preschool children and women. In some settings, men might be assessed to determine their
level of knowledge, attitudes, and practices towards vitamin and mineral deficiencies as well as their role,
in some populations, in determining which foods to purchase. Men may also be assessed for
haemoglobin in some settings to estimate the role of iron deficiency as a cause of anemia in women and
children. The rationale behind this is that when the prevalence of anemia is high in women and children
but low in men, then iron deficiency is likely to be a major contributor to the high prevalence of anemia in
the women and children. If the prevalence of anemia is high in all three groups, then causes of anemia
other than iron deficiency are likely to be prevalent, such as malaria or other parasitic infections.
Indicators and Methods for Cross-Sectional Surveys of Vitamin and Mineral Status of Populations 23
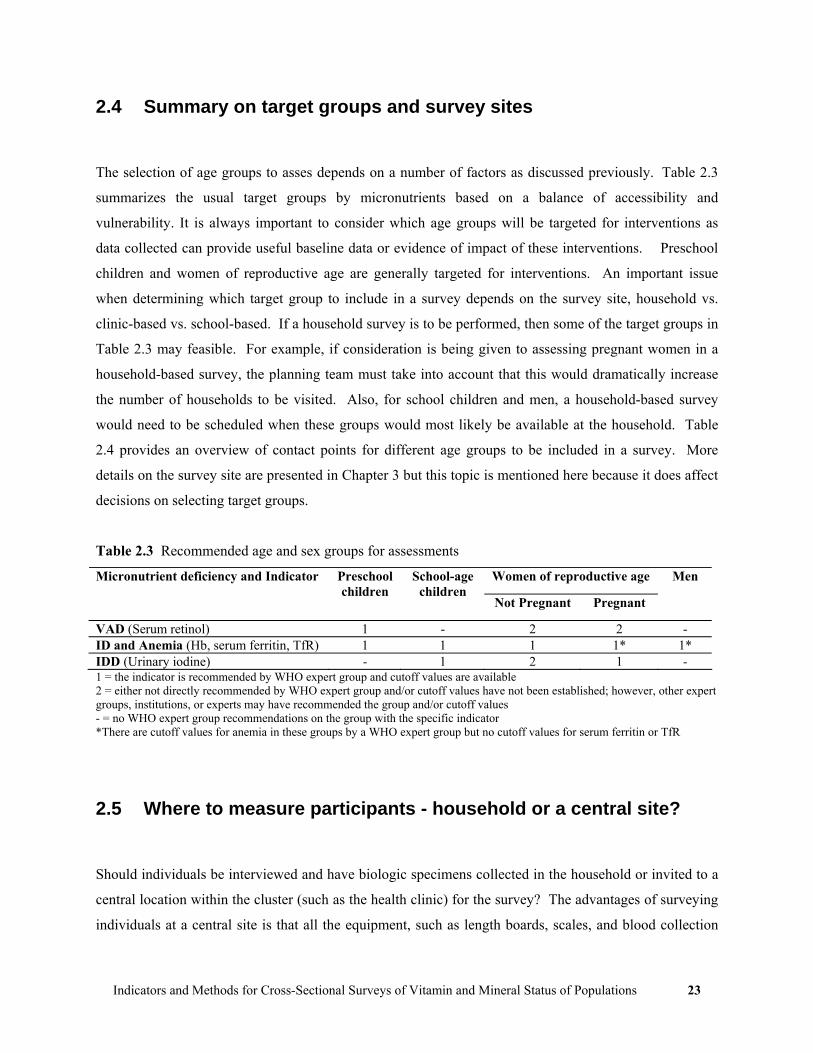
2.4 Summary on target groups and survey sites
The selection of age groups to asses depends on a number of factors as discussed previously. Table 2.3
summarizes the usual target groups by micronutrients based on a balance of accessibility and
vulnerability. It is always important to consider which age groups will be targeted for interventions as
data collected can provide useful baseline data or evidence of impact of these interventions. Preschool
children and women of reproductive age are generally targeted for interventions. An important issue
when determining which target group to include in a survey depends on the survey site, household vs.
clinic-based vs. school-based. If a household survey is to be performed, then some of the target groups in
Table 2.3 may feasible. For example, if consideration is being given to assessing pregnant women in a
household-based survey, the planning team must take into account that this would dramatically increase
the number of households to be visited. Also, for school children and men, a household-based survey
would need to be scheduled when these groups would most likely be available at the household. Table
2.4 provides an overview of contact points for different age groups to be included in a survey. More
details on the survey site are presented in Chapter 3 but this topic is mentioned here because it does affect
decisions on selecting target groups.
Table 2.3 Recommended age and sex groups for assessments
Women of reproductive age Micronutrient deficiency and Indicator Preschool children
School-age children
Not Pregnant Pregnant
Men
VAD (Serum retinol) 1 - 2 2 - ID and Anemia (Hb, serum ferritin, TfR) 1 1 1 1* 1* IDD (Urinary iodine) - 1 2 1 - 1 = the indicator is recommended by WHO expert group and cutoff values are available 2 = either not directly recommended by WHO expert group and/or cutoff values have not been established; however, other expert groups, institutions, or experts may have recommended the group and/or cutoff values - = no WHO expert group recommendations on the group with the specific indicator *There are cutoff values for anemia in these groups by a WHO expert group but no cutoff values for serum ferritin or TfR
2.5 Where to measure participants - household or a central site?
Should individuals be interviewed and have biologic specimens collected in the household or invited to a
central location within the cluster (such as the health clinic) for the survey? The advantages of surveying
individuals at a central site is that all the equipment, such as length boards, scales, and blood collection

Indicators and Methods for Cross-Sectional Surveys of Vitamin and Mineral Status of Populations 24
aspects, could be set up once in the cluster. This makes data collection much faster. However, in some
situations there may not be a convenient central site or it may be inconvenient for the participants to get to
a central site. It may be difficult for ill individuals or those with certain types of disabilities or chronic
diseases to travel to a central site.
Table 2.4 Target groups to assess and possible survey sites
Group(s) to Assess Possible survey sites Preschool children and/or women of reproductive age
• Assess preschool children and women in a household-based survey • Assess preschool children and women at a public health clinics if
clinic enrollment/registration is high School-age children only • Household-based if school enrollment low, e.g., <75%, or school not
in session • School-based if enrollment high, e.g., >75% for both males and
females and school is in session during survey Preschool children and women of reproductive age and school-age children
• Assess preschool children and women in a household-based survey or, if appropriate, a clinic-based survey, and assess school children in schools if school enrollment high and school in session during the survey
• Assess all three groups in a household-based survey
2.6 Benefits of survey to participants
In general, it is discouraged to provide survey participants with monetary compensation for participation
in surveys or to provide medications or treatments. In some surveys the teams may provide a small gift to
the household (such as iodized salt) or candy or toy for a child. Should any medical conditions be
identified during the survey, such as severe anemia, the participant should be informed of this finding,
provided written information on the condition, and referred to a local health facility. If laboratory tests
are to be performed, such as serum retinol or urinary iodine, the participant should be told that these tests
will not be analyzed until a later date and, in many countries, it would not be possible to inform the
participant of the results of the laboratory tests.

Indicators and Methods for Cross-Sectional Surveys of Vitamin and Mineral Status of Populations 25
Chapter 3 Survey Design and Sampling Strategies
3.1 Introduction
Some of the details of designing a cross-sectional survey and sampling strategies are discussed in this
Chapter. The survey design is based on the overall survey objectives which define:
• Indicators to be assessed
• Target groups to be surveyed
• Where subjects are recruited, the survey site (e.g., in households, health clinics, or schools)
Cross-sectional surveys are useful in providing an overall estimate of prevalence and coverage in a
geographic area. They are not useful in identifying “pockets” of disease or low coverage. There are other
methods more suitable to identifying “pockets”, such as lot quality assurance methods (see Monitoring
Universal Salt Iodization Programmes4 for examples relating to iodized salt). Issues in the design of the
survey discussed in this Chapter are:
• National vs. sub-national estimates
• Whether the survey is household, clinic, or school-based
• Implementing an independent vitamin and mineral deficiency survey or incorporating a
micronutrient component into another planned survey
• Sample size
• Number of clusters to select
• How to select clusters
Some of the basic issues and terminology used in sampling are presented in Appendix 4 and it is
recommended that those unfamiliar with basic sampling theory review this appendix prior to reading the
next sections in this chapter.

Indicators and Methods for Cross-Sectional Surveys of Vitamin and Mineral Status of Populations 26
3.2 National vs. Sub-National Estimates
If a national estimate is needed, an important decision is whether the survey will be conducted to provide
a single estimate for the entire country or if there is also a need to provide separate estimates for sub-
national areas, referred to as “strata.” For each stratum for which an estimate is desired, such as a
province or region, a separate survey sample would need to be drawn and therefore expense and time
requirements are directly proportional to the number of strata in the survey. (Note that there could be a
trade off such as accepting a lower level of precision for each stratum.) Deciding on the number of strata
to sample should be based on at least the following two factors:
1. Interventions are stratum-specific, i.e., they are implemented in certain areas of a country or
based on specific population subgroups.
2. Interventions or actions may be directed to stratum-specific administrative levels where important
differences in the etiology and magnitude of problems need to be identified.
If the country is divided into sub-national areas and a separate cluster survey performed in each area,
this is referred to as a stratified cluster survey.5 Estimates from each of the sub-national areas can be
combined to produce an overall national estimate (see section on weighting in Chapter 6). There is a
possibility of over-interpretation of survey results when a single cluster survey is performed at the
national level and then sub-national estimates are derived based on relatively few clusters (see Section
3.6). For example, if a single 30-cluster survey is performed at the national level, and four clusters were
located in one province, the estimate for that province would most likely be very imprecise, which could
be seen by including confidence limits around the estimates.
In some surveys the goal may not be to derive a national estimate but to perform a survey in one
specific area of the country, i.e., a target area. A decision would need to be made whether a single survey
is needed for the target area vs. the need to stratify within that target area.
3.3 Household vs. clinic vs. school-based surveys
Most of this chapter will present information on how to perform household-based surveys, which are the
most common type of national cross-sectional survey. In some countries there may be an opportunity to
perform a national survey in a clinic population (assuming high clinic coverage/registration) or school
population (assuming high school attendance). At the first stage of selection, in household-based surveys,

Indicators and Methods for Cross-Sectional Surveys of Vitamin and Mineral Status of Populations 27
the cluster is the enumeration unit or community selected to be surveyed; in clinic-based surveys, the
clusters are clinics selected for the survey; and in school-based surveys, the selected schools are the
clusters. The methods used for selecting clusters at the first stage are similar for household-, clinic-, and
school-based surveys. The selection of individuals (the second stage of selection) differs between
household-based surveys and clinic- and school-based surveys. In household-based surveys, households
are selected and then eligible individuals within the households are assessed. In clinic- and school-based
surveys, clinics are schools are selected and then individuals selected from clinic or school records using
simple random sampling or systematic sampling.
Whether the survey is household-, clinic-, or school-based (or a combination of these) depends on the
target groups discussed in Chapter 2 (see Table 2.4). Most of this chapter will focus on selecting
communities or enumeration units at the first stage of sampling, and then households at the second stage.
The basic principles of this methodology would apply equally well to clinic-based surveys (i.e., selecting
clinics at the first stage of sampling, and then from clinic records, selecting individuals) and school-based
surveys (i.e., selecting schools at the first stage of sampling, and then from an enrollment listing, selecting
students).
3.4 Independent Survey vs. Incorporating Micronutrient Indicators into another Survey
Information on vitamin and mineral deficiencies may be collected through an independent survey or as a
component of another population-based survey. Other surveys in which micronutrient information could
be added include the UNICEF Multiple Indicator Cluster Survey (MICS), the Demographic and Health
Surveys (DHS), and the Centers for Disease Control and Prevention (CDC) Reproductive Health Surveys.
The three rounds of MICS (1995, 2000, and 2005) have included modules on coverage of micronutrient-
related interventions, such as vitamin A supplement usage and iodized salt. DHS has modules that
include collecting hemoglobin and micronutrient intervention coverage, such as iodized salt, and some
Reproductive Health Surveys have included hemoglobin measurements. It would be important to
determine whether one of these surveys is being planned and whether a micronutrient module could be
added to that survey.
Incorporating a micronutrient component to another planned survey may have the following
advantages:
• Reduced cost
• A sampling frame will be developed by the lead agency

Indicators and Methods for Cross-Sectional Surveys of Vitamin and Mineral Status of Populations 28
• Skilled survey staff
• Logistics support
At the same time, there are a number of potential disadvantages:
• May require additional time in the field compared to an independent micronutrient survey if the
planned survey is of a larger sample size and will take longer to complete data collection
• Refusal rate to the original survey protocol may be higher when biologic specimens are collected
as an added component of the micronutrient survey
• Specialized training and capacity of field workers required when bio-markers are collected
To determine whether to incorporate (or “piggyback”) a micronutrient component onto another
survey, two important questions should be considered:
1. Will a nationally representative sample be selected?
2. Will the survey be of adequate sample size? (Sample size is discussed in the next section)
The MICS, DHS, and CDC Reproductive Health surveys generally meet the above criteria. If the
sample size of the planned survey is larger than needed for the micronutrient component, a sub-sample of
clusters, households, or subjects could be selected for the micronutrient component. If the ‘piggy-back’
approach is not an option, it may still be possible to use the sampling frame from one of the above
surveys for an independent vitamin and mineral deficiency survey. The advantage to this approach is that
the first-stage sampling may have been performed and the maps and information to identify households
and subjects may already be developed and available. Finally, if it is not possible to incorporate a
micronutrient component to another survey, then an independent micronutrient survey will need to be
designed and implemented.
3.5 Sample Size Calculations
Sample size calculations can be a source of confusion because different individuals may arrive at different
recommended sample sizes, primarily because sample size calculations are based on a number of
decisions and estimates. There may also be slight differences between hand calculated sample size
estimates and computer-based calculations due to rounding and slight variations in sample size formulae,
but these differences should be minor. We present three approaches to sample size calculations: 1)
Estimating a proportion for a single cross-sectional survey; 2) comparing differences between two cross-
Indicators and Methods for Cross-Sectional Surveys of Vitamin and Mineral Status of Populations 29
sectional surveys; and 3) subgroup comparisons within a survey and their effect on sample size. The
second situation is used when the impact of intervention between two cross-sectional surveys is desired,
usually a baseline survey and a follow-up survey. For all approaches we assume 95% confidence
intervals are desired and that the primary measure of interest is a proportion.
In most surveys, information on many indicators is collected, each of which might result in a different
sample size estimate. It is recommended that the final sample size for a survey be based on the most
important indicators. Computer-based programs to perform sample size calculations can be found at
www.OpenEpi.com. Keep in mind that not all information needs to be collected on every survey subject
or household. For example, more expensive tests might be performed on a sub-sample, such as every
other survey participant so long as minimum sample size requirements are satisfied.
3.5.1 Sample size for proportion in single cross-sectional survey
To estimate a sample size for a proportion in a single cross-sectional survey, three numbers are needed:
1. Estimate of the expected proportion (p)
2. Desired level of absolute precision (d)
3. Estimated design effect (DEFF)
The sample size formula is:
2
2 ))(1(96.1d
DEFFppn −=
If the expected proportion p for an indicator is not known, usually the value of 0.5 (or 50%) is used
because it produces the largest sample size (for given values of d and DEFF). If the proportion is
expected to be between two values, select the value closest to 0.5. For example, if the proportion is
thought to be between 0.15 and 0.30, use 0.30 for the sample size calculation.
The level of absolute precision d specifies the width of the confidence interval, e.g., +0.03 (i.e., +3%),
+0.05 (i.e., +5%) or +0.10 (i.e., +10%). For example, if the proportion estimated were 40%, would a
precision of +10% (i.e., 95% confidence limits of 30% and 50%) be acceptable? If not, would a narrower
confidence interval (35%, 45%), i.e., precision of +5%, be acceptable? The selection of a value for d (the
desired absolute precision) may depend on the expected proportion and the purpose of the survey.
Indicators and Methods for Cross-Sectional Surveys of Vitamin and Mineral Status of Populations 30
Common values for d are usually around +5% for estimated proportions in the range of 20%-80%, and
around +3% for less common or very common events (<20% or >80%).
The sample size required for a cluster survey is almost always larger than that required for surveys
using simple random sampling because of the design effect (DEFF). If the prevalence or coverage of a
particular indicator is similar in each cluster, the DEFF will be around one, which means the variability is
the same as would have been with simple random sampling methods. The greater the clusters differ from
one another, the larger the DEFF. As the DEFF increases the sample size must be increased to maintain a
desired level of precision. See Appendix 5 for sample size calculations for a number of different p, d, and
DEFF estimates.
After a survey has been completed and the data analyzed, any calculated proportion is an estimate of
the proportion in the whole population. Generally a confidence interval is calculated to present a range of
values within which the true proportion is likely to be captured. For example, if the proportion is 40%
and the lower and upper 95% confidence limits are 30% and 50%, respectively, the interpretation would
be that the true proportion in the population most likely lies somewhere between 30% and 50%. This
means that it would be very unlikely for the true population proportion to be below 30% and very
unlikely for it to be greater than 50%.
Experience from surveys of anemia, vitamin A deficiency, and iodine deficiency with around 30
individuals sampled in each of 30 clusters have DEFFs in the range of 1.5 to 3. If more than 30
individuals are sampled per cluster, the DEFF is usually larger; if fewer than 30 individuals are sampled
per cluster, the DEFF is usually smaller. Sample sizes for different key indicators, based on estimated
prevalence levels, design effects, confidence levels, and precision are presented in Table 3.1. Please note
that these are only examples and the actual sample size required for an individual country survey will
vary.
As an example, the sample size calculation to assess vitamin A capsule coverage, assuming p = 0.5, d
= .05, and DEFF = 2:
32.76805.
)2(5.5.96.12
2
=××
=n

Indicators and Methods for Cross-Sectional Surveys of Vitamin and Mineral Status of Populations 31
Table 3.1 Examples of sample size calculations for key micronutrient indicators
Micronutrient/Indicators/Group Expected Prevalence/
Coverage (p) (%)
Absolute Precision (d)
(%)
Design Effect DEFF
Sample Sizea
Indicators based on individuals VAD and capsule coverage Low Serum retinol in preschool children 10-15 ± 3.0 2.0 1088 Vitamin A capsule coverage 80-90 ± 3.0 2.0 1365 IDA and supplementation coverage Anemia 40-60 ± 5.0 2.0 769 Iron deficiency anemia 15-30 ± 5.0 2.0 769 Iron tablet coverage in appropriate group(s) 20-40 ± 5.0 3.0 1106 IDD Low urinary iodine 10-30 ± 5.0 2.0 646 Indicators based on households Households using vitamin A fortified product 25-75 ± 5.0 2.0 769 Households using iron fortified product(s) 20-40 ± 5.0 3.0 1106 Households using iodized salt 50-75 ± 5.0 3.0 1152
a Sample sizes are calculated for each strata based on 95% confidence intervals (α = 0.05), expected prevalence/coverage levels closest to 50%, desired absolute precision, and estimated design effect
Sample sizes are always rounded up, so the sample size from the example would be 769. In some
settings, a different precision value and/or different expected DEFF value may be appropriate. For
example, if the prevalence of anemia is thought to be 60%, this would indicate that anemia is a severe
problem in the population; it could be decided that a precision of +10% would be adequate because any
anemia prevalence estimate in a population >40% is considered to indicate a severe anemia problem, so a
very precise estimate may not be necessary. On the other hand, if the proportion is very low or very
high, for example, if the proportion of households using iodized salt is thought to be 92%, it some
situations it may be desired to have greater precision than +5%, perhaps +2.5%. In general, when
performing sample size calculations or using sample size tables, careful consideration should be given to
the values used in the calculation.
3.5.2 Sample size calculation for comparing two surveys
In some situations two sequential cross-sectional surveys are planned to assess the estimated impact of
interventions; frequently the first cross-sectional survey is to establish a pre-intervention baseline
estimate, and then after a period of time (perhaps 1-5 years), a second cross-sectional survey (“follow-up”
survey) is performed. The sample size estimates for this study design requires a number of assumptions

Indicators and Methods for Cross-Sectional Surveys of Vitamin and Mineral Status of Populations 32
and preferences for certain values. In the calculations below it is assumed that the sample size in each of
the two surveys will be the same.
Estimates and preferences are needed for:
p1 The estimated proportion with deficiency or intervention at baseline survey
p2 The estimated proportion with deficiency or intervention at follow-up survey
DEFF The estimated design effect (while the formula assumes the DEFF will be the same for both
surveys, realistically the DEFF may differ between surveys, therefore it is recommended to
provide the larger estimated DEFF)
α Level of significance (“alpha”), usually 0.05 or 5% (corresponds with 95% confidence interval)
1- β Power, usually 0.8 (80%) or 0.9 (90%)
The formula is:
[ ]2
21
22211β1α/2
)p(p
qpqpZ-qp2ZDEFFn
−
+×= −
where
2pp
p 21 += and p1q −= when sample sizes are to be equal
q1 = 1 – p1
q2 = 1 – p2
Zα/2 is the Z-value for the level of significance
Z1-β is the Z-value for the Power
In general we would recommend an α of .05 and β of .20. The Z-value for these and some other
common Z-values for the level of significance and Power are provided in Tables 3.2 and 3.3, respectively.
Table 3.2. Two-sided Z-values ( α/2Z ) for various significance levels
Significance level (α) 2-sided Z-value 0.01 2.576 0.05 1.960 0.10 1.645
Bold indicates usual value used

Indicators and Methods for Cross-Sectional Surveys of Vitamin and Mineral Status of Populations 33
Table 3.3 One-sided Z-values (Z1-β) for various Power (1- β) levels
β value Power (1- β) 1-sided Z-value 0.01 .99 -2.326 0.05 .95 -1.645 0.10 .90 -1.282 0.20 .80 -0.842
Bold indicates usual value used
Example: A country is going to begin fortifying flour with iron. They estimate the baseline prevalence
of anemia to be 50% in women of reproductive age, and expect that iron fortification of flour will lower
the anemia prevalence in this group to 40%.
Example of sample size calculation:
p1 = 0.50, q1 = 0.50
p2 = 0.40, q2 = 0.60
α = 0.05, therefore α/2Z = 1.96
β = .20, therefore β1Z − = -.842
DEFF = 2
Need to calculate p . For equal sample sizes:
452
4050p ...=
+= , .55 .451q =−=
[ ]776
0187632
)40(.50
60405050(-.842)-)2(.45)(.559612n 2
2
≈×=−
+×=
.
..
))(.(.))(.(..
In this example, the sample size would be 776 individuals in each cross-sectional survey, i.e., 776 for
the baseline survey and 776 in the follow-up survey.
3.5.3 Subgroup Comparisons and their affect on sample size
The sample sizes in Section 3.5.1 assume that a single overall (nutrient) deficiency prevalence or program
coverage estimate is desired from a survey, such as the prevalence of VAD in preschool children or
prevalence of IDA in women of reproductive age, or percent of households using iodized salt. If an
objective of the survey is to compare subgroups within the survey, such as comparing males to females,
then the sample size would likely be larger depending upon the level of precision desired for the
comparison(s). Another example might be to compare the prevalence of deficiency in households not

Indicators and Methods for Cross-Sectional Surveys of Vitamin and Mineral Status of Populations 34
using a fortified food compared to households using a fortified food. If these types of comparison are
important, then the sample size will need to be increased to assure adequate precision for each subgroup.
If it is expected that the two subgroups are equally distributed in the population (such as females and
males, where in most populations around 50% of the population is female and 50% male), then the
sample size presented in the previous section (3.5.2) could be used, only substituting the estimated
prevalence for each of the two subgroups. If the two subgroups differ in size, another sample size
formula should be used which is described next.
For example, suppose the prevalence of anemia in households using iron-fortified flour is to be
compared to the prevalence of anemia not using iron-fortified flour, and it is estimated that 80% of the
households use iron fortified flour. The sample size formula is:
[ ]2
21
22211β1α/2
1)pr(p
qpqrpZqp1)(rZDEFFn
−
+−+×= −
12 n rn =
where
1rrpp
p 21++
= and p1q −= when sample sizes are to be unequal
Different from the formula in section 3.5.2 is an additional term r, which for our example would be
the proportion of households not using iron-fortified flour divided by the proportion of households using
iron-fortified flour. In the above example, r = .2 / .8 = .25. Two sample sizes are calculated:
• n1 = the number of households using the fortified product
• n2 = the number of households not using the fortified product
For example, assume the following:
p1 = 0.40, the prevalence of anemia in households using iron-fortified flour
p2 = 0.50, the prevalence of anemia in households not using iron-fortified flour
r = 0.2 / 0.8 = 0.25
α = 0.05, therefore α/2Z = 1.96
β = 0.20, therefore β1Z − = -0.842
DEFF = 2

Indicators and Methods for Cross-Sectional Surveys of Vitamin and Mineral Status of Populations 35
421.25
5254p .).(..=
+×+
= and 58421q .. =−=
[ ] ( ) 92310025
4688081612)50.25(.40
55604025(-.842)-8)1)(.42)(.5(.259612n
2
2
2
1 ,.
...
))(.(.))(.(...=
+×=
−
++×=
481 .25(1923)n2 ==
Therefore, the survey would need to include 2,404 individuals, of which 1,923 would be expected to
be from households that use iron-fortified flour and 481 would be expected not to use iron-fortified flour.
3.5.4 Accounting for Response Rates
Another important issue to consider when calculating a sample size for a survey is to take into account the
potential response or compliance of the population to be surveyed. Nonresponse can occur at many
levels, such as:
• None of the household members may be available during the survey (the household is away
on a temporary basis)
• The entire household may refuse to participate
• Some individuals within a household may refuse to participate or may not be available during
the survey
• Some individuals may partially participate, such as agreeing to answer questions but refusing
blood collection
• The volume of blood collected may be insufficient for laboratory analysis
All of these potential reasons for nonparticipation or nonresponse should be taken into account and the
final sample size is determined by dividing the calculated sample size, as shown in sections 3.5.2 and
3.5.3, by the expected response. For example, if the calculated sample size is 768 and a 90% (i.e., 0.9)
response is expected, then the final sample size would be 768 / 0.9 = 853.3 or 854 (always round up).
Thus, if 854 individuals are invited to participate in the survey and 90% agree to do so, then it would be
expected that the sample size of 768 individuals would be met.

Indicators and Methods for Cross-Sectional Surveys of Vitamin and Mineral Status of Populations 36
3.5.5 Number of Households
We describe two methods in household-based cluster surveys for determining the number of households
to select in each cluster. One method is to select a pre-determined number of households in each cluster
(the “fixed number of households” method). Another method, called the “quota” method, is described in
Chapter 4 and has survey teams visit households until the desired number of eligible individuals has been
identified.
Some indicators, such as the prevalence of anemia, relate to individuals, while other indicators relate
to households, such as the proportion of households using iodized salt. If a fixed number of households
are to be surveyed in each cluster, the following information, usually available from the ministry
responsible for the census, is needed to determine the number of households:
• Largest sample size requirement based on the primary indicators to be measured
• Average number of persons per household
• Proportion of target population out of total population
The number of households to select in each cluster would be determined using the following formula:
ppHHnnHH*
=
where
nHH = total number of households to sample in a survey
n = total sample size for number of individuals
HH = average household size
pp = proportion of the population in target group
As an example where the indicator of interest is the prevalence of anemia among women of reproductive age:
- the calculated sample size is 768 women
- the average number of individuals per household 3.9
- women of reproductive age represent 0.31 (31%) of the population
Thus, nHH = 768 / (3.9 x 0.31) = 636 households (rounded up to a whole number) would need to be
assessed in the survey area. Note that in this example HH x pp is the average number of women of

Indicators and Methods for Cross-Sectional Surveys of Vitamin and Mineral Status of Populations 37
reproductive age that would be found in each household; 3.9 x 0.31 = 1.209, i.e., on average, there will be
1.209 women of reproductive age in each household.
3.6 Number of clusters and samples per cluster
Two issues to consider when applying sample size calculations to cluster surveys are how many clusters
are needed, and once this is determined, how many samples (individuals or households) are to be
surveyed per cluster.
3.6.1 Number of Households/Individuals per Cluster and the Number of Clusters The number of clusters to assess depends on many factors, such as the size of the geographic area (which
affects costs in terms of teams traveling from one cluster to another), the amount of time a survey team
spends in a cluster, the primary purpose of the survey, whether there is a single national cluster survey or
a stratified cluster survey, and many other factors. Here are some general guidelines for micronutrient
surveys:
• Within each cluster, generally there should be between 10 and 40 individuals in the most
important target groups. Having fewer than 10 individuals may lead to unstable variance
estimates (at least in surveys with 30 clusters) and going beyond 40 results in little
improvement in precision (described in the next section). If the collection and/or analysis of
information are of significant cost, such as collecting blood specimens for laboratory
analysis, then the fewest samples per cluster with adequate precision should be collected. If
the cost of collecting information is low, such as asking about vitamin A supplementation,
then including more than 40 may be reasonable, however it will have little effect on
improving precision. The underlying issue is to balance the costs of data and specimen
collection/processing with programmatic needs for a specified precision around the estimates.
While it would seem that collecting more samples per cluster would increase precision in
cluster surveys, the improvement in precision is minimal beyond 40 samples per cluster. The
reason for this is that as more samples are collected per cluster, the DEFF also increases.
• There should be at least 25 clusters in each stratum and going beyond 40 clusters does not
improve precision appreciably. In larger countries the cost of teams moving from one cluster

Indicators and Methods for Cross-Sectional Surveys of Vitamin and Mineral Status of Populations 38
to another can be substantial, and therefore to keep survey costs down, usually the motivation
is to have fewer clusters. In very small countries where travel between clusters is not a
significant constraint, having a larger number of clusters would be reasonable and even
improve precision. For example, for a total sample size of 900, a survey of 60 clusters with
15 individuals per cluster would be, on average, more precise than a survey of 30 clusters
with 30 individuals. The reason for the improved precision is that the smaller the number of
observations per cluster, the smaller, on average, the design effect.
• Another approach is to determine the number of clusters based on the number of households
that can be surveyed in one or two days by a survey team, as long as there are at least 25-30
clusters in each stratum.
Collecting data from around 30 clusters with around 15-30 observations per cluster provides
reasonably precise estimates (i.e., 95% confidence limits of no greater than +5% assuming a design effect
of around 2.0) of nutritional status indicators in the target population.5 Thirty cluster surveys have been
used extensively for many health outcomes, such as immunizations, diarrheal disease surveys, and
anthropometry surveys. For a fixed number of samples/individuals selected per cluster (e.g., 10
individuals per cluster or 30 individuals per cluster), collecting information on more than 30 clusters only
slightly improves the precision of the estimate, however in some settings, mentioned previously, having
more than 30 clusters is reasonable.
The UNICEF Multiple Indicator Cluster Survey (MICS) and Demographic and Health Surveys
(DHS) select more than 30 clusters, sometimes up to 300 or more, and also have much larger sample sizes
than described in this manual for micronutrient surveys. The primary reasons include:
• Stratification – frequently one goal of MICS and DHS surveys is to present prevalence or
coverage estimates by strata, such as by province, and different demographic groups (e.g., age,
sex, and socioeconomic status). Thus the sample size increases by the number of strata and for
subgroup analyses.
• Size of target group – some of the target groups in MICS and DHS represent small proportions of
the entire population of a country and therefore a large number of households need to be visited
to recruit the desired number of participants. For example, a relatively large number of
households would need to be visited to identify sufficient numbers of:
women who have given birth in the previous year
one-year old children (12 months up to 24 months of age)
pregnant women
children 0 to 6 months of age to assess breastfeeding status

Indicators and Methods for Cross-Sectional Surveys of Vitamin and Mineral Status of Populations 39
Design effects – the design effects for some indicators can be much larger than two, such as
factors relating to access to potable water and adequate sanitation.
Therefore, for surveys such as MICS and DHS, having larger sample sizes and a larger number of clusters
are reasonable given the above issues. Our recommendations for the type of surveys described in this
manual are as follows:
• For a non-stratified national survey, fewer than 30 clusters would not be sufficient.
• For stratified surveys, at least 25 clusters should be selected in each stratum, although if less
precision is required for stratum-specific estimates, the number of clusters per stratum could
be reduced.
3.7 How to select clusters
In household-based surveys, communities, wards, villages, census tracts, or other defined enumeration
units (EU) are designated as the primary sampling units (PSU). In determining how to select clusters, one
issue is whether there are reasonably accurate estimates of the population size for the PSUs. In
household-based surveys, this would be the population size or the number of households within each
enumeration unit (EU); in clinic-based surveys, this would be the number of clinic enrollees; in school-
based surveys, this would be the number of students enrolled in each school. If relatively accurate data on
population size are available, then the preferred method for selecting clusters is the probability
proportionate to size (PPS) method because this is under many settings a self-weighted design and is
described in more detail in the next section. If accurate population data are not available, then either a
random or systematic selection of clusters could be used. Each of these methods is described in the
sections that follow.
3.7.1 PPS selection of clusters
As mentioned, clusters should ideally be selected using a technique called "probability proportionate to
size" or PPS sampling. Using the PPS method, the likelihood of a PSU being selected is proportional to
its population size, i.e., larger PSUs are more likely to be selected than smaller ones. The first step is to
obtain the "best available" census data for all the PSUs in the geographic area to be surveyed (e.g., a
country). This information is usually available from the government agency that performs the census for
the country, such as a national bureau of statistics.

Indicators and Methods for Cross-Sectional Surveys of Vitamin and Mineral Status of Populations 40
Countries with very organized census information will frequently have PSUs or enumeration units
that are relatively small geographic areas with a population size between 100-1,000 or 20-200 households.
It may be necessary to designate a minimum PSU population size to assure that enough potential respondents
are available to meet the sample size per cluster; consequently, there may be situations where two or more
contiguous enumeration units will need to be combined to form a single PSU.
If the enumeration unit information is either not readily accessible or is very inaccurate, the most recent
estimates of population size should be obtained by village, towns, and cities that would serve as the PSUs. It
is essential to include all areas, including those which may be remote and/or rural.
With the PSU information, make a list with four columns (see Table 3.4). The first column lists the
name of each PSU; the second column contains the population of each PSU; the third column contains the
cumulative population that is obtained by adding the population of each PSU to the cumulative population
of PSUs preceding it on the list. As a general rule, it is best for the list to be in geographic order by
districts or provinces. A sampling interval (k) is obtained by dividing the total population size by the
number of clusters to be surveyed. A random number between 1 and the sampling interval (k) is chosen
(see Appendix 6 for a table of random numbers) as the starting point and the sampling interval is added
cumulatively until thirty clusters are chosen; the selected clusters are shown in the 4th column of Table
3.4.
3.7.1.i. Example of Selecting PSUs for a Cluster Survey
In the fictitious area of El Saba, there are fifty PSUs (Table 3.4). In practice there are usually many more
than fifty PSUs in a survey area. With a large number of PSUs, the selection process is usually performed
using a computer. For SAS users, there is PROC SURVEYSELECT which has an option to select data
using PPS. With SPSS, the optional Complex Samples module has a “Select Sample…” option. Use of
spreadsheets is another method for performing the selection.

Indicators and Methods for Cross-Sectional Surveys of Vitamin and Mineral Status of Populations 41
Table 3.4. Selecting communities for a cluster survey in El Saba using the PPS method
PSU Pop. Cum. Cluster PSU Pop. Cum. Cluster Utural 600 600 BanVinai 400 10,880 13 Mina 700 1,300 1 Puratna 220 11,100 Bolama 350 1,650 2 Kegalni 140 11,240 Taluma 680 2,380 3 Hamali-Ura 80 11,320 War-Yali 430 2,810 Kameni 410 11,730 14 Galey 220 3,030 Kiroya 280 12,010 Tarum 40 3,070 Yanwela 330 12,340 Hamtato 150 3,220 4 Bagvi 440 12,780 15 Nayjaff 90 3,320 Atota 320 13,100 Nuviya 300 3,610 Kogouva 120 13,220 16 Cattical 430 4,040 5 Ahekpa 60 13,280 Paralai 150 4,190 Yondot 320 13,600 Egala-Kuru 380 4,570 Nozop 1,780 15,380 17,18 Uwanarpol 310 4,880 6 Mapazko 390 15,770 19 Hilandia 2,000 6,880 7,8 Lotohah 1,500 17,270 20 Assosa 750 7,630 9 Voattigan 960 18,230 21,22 Dimma 250 7,880 Plitok 420 18,650 Aisha 420 8,300 10 Dopoltan 270 18,900 Nam Yao 180 8,480 Cococopa 3,500 22,400 23,24,25,26,27 Mai Jarim 300 8,780 Famegzi 400 22,820 Pua 100 8,880 Jigpelay 210 22,840 Gambela 710 9,590 11 Mewoah 50 22,890 Fugnido 190 9,880 12 Odigla 350 23,240 28 Degeh Bur 150 10,030 Sanbati 1,440 24,680 29 Mezan 450 10,480 Andidwa 260 24,940 30
Follow the four steps below to select clusters to be included in the survey:
Step 1: Calculate the sampling interval by dividing the total population by the number of clusters to be
surveyed. In this example, 24,940 / 30 = 831.
Step 2: Choose a random starting point between 1 and the sampling interval (k, in this example, 831) by
using the random number table in Appendix 6. For this example, the number 710 is randomly selected.
Step 3: The first cluster will be where the 710th individual is found based on the cumulative population
column, in this example, Mina since it includes the population from 601 to 1,300.
Step 4: Continue to assign clusters by adding 831 cumulatively. For example, the second cluster will be
in the PSU where the value 1,541 is located (710 + 831 = 1541), which is Bolama. The third cluster is
where the value 2,372 is located (1541 + 831 = 2372), and so on. In PSUs with large populations, more
than one cluster could be selected. Note that if two clusters were selected in one PSU, when the survey is
performed, the survey team would divide the area into two sections of approximately equal population
size and treat each area as independent clusters. Similarly, if three or more clusters were in a PSU, the
PSU would be divided into three or more sections of approximately equal population size, as is the case
with Cococopa in Table 3.4 (described in more detail later).

Indicators and Methods for Cross-Sectional Surveys of Vitamin and Mineral Status of Populations 42
3.7.2 Random and systematic selection of clusters
When a list of PSUs is available but the population size for each PSU is not known or very inaccurate,
simple random sampling or systematic selection can be used. Systematic sampling tends to be easier to
implement by hand and is described next, although simple random sampling (see Appendix 4) could also
be performed. With the availability of computer programs that can sample records from a file, the
preference would be to use simple random sampling. The steps for systematic sampling, should it be
more convenient to implement, are as follows:
Step 1: Obtain the list of the PSUs and number them from 1 to N (the total number of PSUs)
Step 2: The number of PSUs to sample (n) should have already been determined.
Step 3: Calculate the "sampling interval" (k) by N/n (always round down to the nearest whole integer).
Step 4: Using the random number table (Appendix 6), select a number between 1 and k. Whichever
number is randomly selected, go to the PSU list and include that PSU in the survey.
Step 5: Select every kth PSU after the first selected PSU.
For illustrative purposes, Table 3.5 lists fifty PSUs and below demonstrates how to select 8 PSUs.
Step 1: There are fifty PSUs, therefore N=50.
Step 2: The number of PSUs to sample is eight, therefore n=8.
Step 3: The sampling interval is 50/8 = 6.25; round down to the nearest whole integer which is 6;
therefore, k=6.
Step 4: Using a random number table, select a number from 1 to (and including) 6. In this example, let's
say the number selected was 3. Therefore, the first PSU to be selected is the third PSU on the list, which
in this example is Bolama.
Step 5: Select every 6th PSU thereafter. In this example, the selected PSUs would be the 3rd, 9th, 15th,
21st, 27th, 33rd, 39th, and 45th PSUs on the list.
In some circumstances you might actually end up selecting more than the number of clusters needed.
In the above example, had the random number chosen in Step 4 been 1 or 2, nine PSUs would have been
selected rather than eight. To remove one cluster so that only eight are selected, again go to the random
number table, and pick a number and the cluster that corresponds to the random number is removed from
the survey. To properly analyze the data collected using systematic sampling, an estimate of the
population size in each cluster should be collected when the survey team arrives on site. (Note that
usually more clusters are selected; the 8 selected in this example was for illustrative purposes only).

Indicators and Methods for Cross-Sectional Surveys of Vitamin and Mineral Status of Populations 43
Table 3.5 Selection of PSUs using the systematic selection method PSU Selected? PSU Selected?
1 Utural 2 Mina 3 Bolama Y 4 Taluma 5 War-Yali 6 Galey 7 Tarum 8 Hamtato 9 Nayjaff Y 10 Nuviya 11 Cattical 12 Paralai 13 Egala-Kuru 14 Uwanarpol 15 Hilandia Y 16 Assosa 17 Dimma 18 Aisha 19 Nam Yao 20 Mai Jarim 21 Pua Y 22 Gambela 23 Fugnido 24 Degeh Bur 25 Mezan
26 BanVinai 27 Puratna Y 28 Kegalni 29 Hamali-Ura 30 Kameni 31 Kiroya 32 Yanwela 33 Bagvi Y 34 Atota 35 Kogouva 36 Ahekpa 37 Yondot 38 Nozop 39 Mapazko Y 40 Lotohah 41 Voattigan 42 Plitok 43 Dopoltan 44 Cococopa 45 Famegzi Y 46 Jigpelay 47 Mewoah 48 Odigla 49 Sanbati 50 Andidwa
3.8 Summary
This chapter described issues related to survey design and sampling strategies. The relative merits of
conducting an independent micronutrient survey or incorporating a micronutrient component into another
planned survey were presented. In many countries a non-stratified national survey is adequate to
determine an overall estimate of nutrient status (i.e., nutrient deficiency). A 30 cluster survey with 10 to
30 individuals per population group of interest or households per cluster will usually be adequate in most
cases. In some settings there may need to be a stratified survey if stratum-specific estimates are needed,
and in some settings more than 30 clusters may be selected. When accurate population sizes are known,
the probability proportionate to size (PPS) method is recommended for selecting clusters.

Indicators and Methods for Cross-Sectional Surveys of Vitamin and Mineral Status of Populations 44

Indicators and Methods for Cross-Sectional Surveys of Vitamin and Mineral Status of Populations 45
Chapter 4 Household and Subject Selection
In most cross-sectional nutrition surveys, subjects are identified from selected households within each
cluster and then eligible individuals assessed within the sampled households. Usually a local definition of
“household” and “dwelling” are used because these may vary from country to country. In this document
the following definitions are used:
• A household is a group of persons who eat from the same kitchen
• A dwelling is a building or residential unit and may include one or more households.
Definitions of household and dwelling must be made clear and specific to assure that survey teams
operate consistently in the field when identifying and selecting households.
In some countries, a list or map of dwellings or households within a PSU may be available through a
local government administrative office or the census bureau. This allows for the selection of households
from the list or map.
Two methods are described for selecting households in a cluster, “fixed” versus “quota.” For the fixed
method, the number of households to select in each cluster is determined in advance, most commonly the
same number of households being assessed in every cluster, e.g., 10 households, or 15 households. The
team knows, prior to arriving at the cluster, the number of households to approach and invite to
participate in the survey. The “quota” method of household selection is where the survey team visits
households until they identify a predetermined number of households or individuals eligible and/or
willing to participate in the survey. Some surveys use the quota method based on the number of eligible
individuals in each cluster, such as EPI surveys where the survey team visits households until they
identify 7 children from 12 months to 24 months of age; the team does not know in advance how many
households will need to be visited in order to identify and assess 7 eligible and participating children.
Most micronutrient surveys use the “fixed” method because they tend to have several targets of interest:
the household; pre-school children; women of reproductive age, etc., compared to the EPI survey in
which the primary interest is in preschool children. For nutrition surveys the fixed number of households
approach is recommended.

Indicators and Methods for Cross-Sectional Surveys of Vitamin and Mineral Status of Populations 46
Another issue is how to select households within a cluster. One approach is to carefully map all
households within the cluster and then either randomly or systematically select households to survey.
Another approach is to randomly select one household within the cluster and then select subsequent
households using the “next nearest household” approach as frequently used in EPI surveys, or select
households in a specified direction. With the random or systematic selection households, having a
relatively accurate map or listing of households is important, whereas for the “next nearest household” or
selection of households in a specified direction, accurate mapping is less important. In both situations, if
the cluster is very large in terms of the number of households within the cluster, it may be necessary to
first segment the cluster, which is described in the next section.
4.1 Segmenting clusters
Clusters may vary widely in the number of households and/or population size. Large clusters may need to
be divided into smaller geographic areas within which households can more easily be identified and
selected. The terms “segments” (in some documents referred to as “quadrants”) and “subsegments” will
be used to describe this process. If a cluster is very large and it is not possible to identify households, the
following steps are recommended:
1. Divide the cluster into approximately equal size segments (in terms of the number of households or
population size)
2. Randomly select one segment
3. If the segment is still too large, then subsegment the area and randomly select one subsegment.
4. For the random or systematic selection of households, there will be a need to map or listing the
households within the selected segment/subsegment
5. Select households
If up-to-date maps of large clusters are available, the survey segments should be identified prior to the
survey team’s arrival to the cluster. If maps are not available, a survey “census” team could visit each
cluster and select the segments and households prior to the arrival of the survey team; alternatively, the
survey team itself may do this task upon arriving at the cluster, in which case the added time for this
activity should be included in the survey schedule.

Indicators and Methods for Cross-Sectional Surveys of Vitamin and Mineral Status of Populations 47
Figure 4.1 illustrates examples of the use of random or systematic selection of a fixed number of
households with different cluster characteristics and steps to take to select households in a cluster. In this
example it is assumed that the average household size is 7.4 individuals, the number of households to be
assessed was 30, and the goal was to identify a cluster/segment between 30-60 households, i.e., a segment
from 1 to 2 times the number of households to be sampled. In some settings, the survey management
team may choose to have segments that are 2-4 times larger than the number to be assessed. There are a
number of advantages and disadvantages to be weighed in determining the segment size. For example, if
households are to be selected randomly or systematically from the area to be surveyed, if the area is large,
this could increase the amount of time it takes teams to get from one household to the next and may make
supervision more difficult when there are two or more groups of surveyors in a cluster.
Large clusters, such as cities, may already have political subdivisions with an estimated number of
households or population size (for an example, see Figure 4.2). If political subdivisions already exist, one
can use these subdivisions to define segments.
Figure 4.1. Example of cluster size (in terms of households or population size) and approaches to determining area (i.e., segment) to survey.*
Large cluster >450 households or >3500 population
Intermediate size cluster 60-450 households or 450-3500 population
Small cluster <60 households or <450 population
↓ ↓ ↓ 1. Divide cluster into segments
consisting of approximately 60-450 households (or 450-3500 population) per segment
2. Randomly select one segment
↓
↓
↓ ↓ ↓ 1. Divide selected segment into
subsegments consisting of approximately 45 households (range of 30-60 households) or a population of 300 (range of 225-450 population) per subsegment
2. Randomly select one subsegment
1. Divide cluster into segments consisting of approximately 45 households (range of 30-60 households) or a population of 300 (range of 225-450 population) per segment
2. Randomly select one segment
↓
↓ ↓ ↓ Select 30 households within selected subsegment
Select 30 households within selected segment
Select 30 households within cluster
*As an example, assume 30 households are to be selected in each cluster and there are approximately 7.4 individuals per household

Indicators and Methods for Cross-Sectional Surveys of Vitamin and Mineral Status of Populations 48
Figure 4.2. Mazari-Sharif by District and Gozar, Afghanistan
If there are no defined subdivisions for a large cluster, the following steps could be used to subdivide
the area using the example of 30 households per cluster:
• From a map, divide the cluster into segments using easily recognizable boundaries, such as rivers and roads.
• Sequentially number the segments and then randomly select one segment.
• Divide the selected segment into subsegments with approximately 30-60 households each.
• Sequentially number the subsegments and then randomly select one subsegment.
• Select 30 households within the selected subsegment.
Assuming, for example, 30 households are to be selected in a cluster and the number of households in
the cluster is known (and is between 60 and 450), to determine the number of segments, divide the total
number of households in the cluster by 45:
Example 1: a cluster has 115 households:
115 ÷ 45 ≈ 3
Thus, the cluster should be divided into 3 approximately equal size segments.

Indicators and Methods for Cross-Sectional Surveys of Vitamin and Mineral Status of Populations 49
Example 2: a cluster has 320 households:
320 ÷ 45 ≈ 7
Thus, the cluster should be divided into 7 approximately equal size segments.
If the number of households in the cluster is not known but a population size estimate is available,
then this information can be used to determine the number of segments. The standard segment size is
determined by multiplying a “standard number” (i.e., 45) of households per segment by the average
number of subjects per household. Thus, if we assume an average of 7.4 persons per household:
45 x 7.4 = 333 (this can be rounded down to 330 individuals).
Example 1: a cluster has a population size of approximately 850:
850 ÷ 330 ≈ 3
Thus, the cluster should be divided into 3 approximately equal size segments.
Example 2: a cluster has a population size of approximately 3,850:
3850 ÷ 330 ≈ 12
Thus, the cluster should be divided into 12 approximately equal size segments.
In the above example, if the total estimated population of the cluster is less than 450, segmentation is
not necessary. It should be possible to count the total number of households in a cluster of this size, and
then select the needed number of households to be surveyed (in the above example, 30).
4.1.1 How to Map a Cluster/Segment When Accurate Maps Are Not Available
In the guidance below, it is assumed that 30 households are to be surveyed in each cluster using the
random or systematic selection of a fixed number of households method.
Step 1: Prepare a sketch map; identify and draw the outer boundaries of the cluster. With the help
of a local guide, draw a map marking the boundaries of the cluster, identifying the major roads, lanes,
streets and showing physical boundaries such as streams, and rivers.
Step 2: Draw internal markers, which will help identify locations and aid in establishing a path of
travel. These would include internal streets, paths, streams, and so forth.

Indicators and Methods for Cross-Sectional Surveys of Vitamin and Mineral Status of Populations 50
Step 3: Mark the location of each dwelling unit
on the map. For help in later locating the
households, it is also useful to mark other prominent
buildings—schools, churches, mosques, etc.
Step 4: Count the number of dwellings in the
cluster and divide by 45. This will give you the
approximate number of segments in which the cluster should be divided. Note that this exercise should
be a “quick count” operation to locate dwellings. It does not require knocking on doors to inquire about
households or the names of occupants. An exception is multi-dwelling buildings that appear to include
several households—for example, in the case of large compounds or apartment buildings, where you
should ask about the number of households and record it on your map.
Step 5: Based on the sketch map, divide the cluster into the number of segments (calculated in Step
4) with approximately the same number of dwellings. This means that the size of the segments in terms
of geographic area may vary considerably—densely populated areas will have geographically smaller
segments and less populated segments will be larger.
Segments should be designated with easily identifiable boundaries and landmarks to facilitate field
work. An example of a sketch map is shown in Figure 4.3; each segment includes approximately 45
dwellings. It is acceptable to have a slightly unequal number of households per segment in order to create
segments with clearly identifiable boundaries.
Figure 4.3Sample Cluster and segments
For purposes of mapping and/or segmenting a
cluster, absolute precision in the count of
households is not necessary. A good approximate
count of dwellings is sufficient.

Indicators and Methods for Cross-Sectional Surveys of Vitamin and Mineral Status of Populations 51
Step 6: Select one segment. Using a random number table (see Appendix 6), choose a random number
between 1 and the number of segments in the cluster. Note that the random method of “picking numbers
from a hat” could also be used, where the segment numbers are written on separate pieces of paper and
folded in half to hide the number, placed in a hat or bowl, and one selected. If possible, the person who
selects the segment should not be the same one who identified the segments, in order to prevent any
inadvertent bias.
Segmenting urban areas may be easier than segmenting rural areas. Cities and towns are usually
organized into blocks or other similar units. When using census enumeration areas in cities and larger
towns, maps are usually available showing streets and blocks. If unavailable, such maps can be easily
drawn. A quick drive through the area will let you know whether there are an approximately equal
number of dwellings per block. If so, the cluster could be segmented by blocks, or parts of blocks.
Example: Let us suppose that an urban cluster includes 18 very similar blocks and they are to be
divided into seven segments. Divide 18 by 7 to obtain 2.6 blocks per segment. Divide the cluster
into seven segments with two and a half blocks each (the last segment will include three blocks).
If the number of dwellings per block varies considerably, approximate the total number of dwellings in
the cluster and dividing them into segments with a similar number of dwellings. When sketch-mapping
rural areas you usually do not have to worry about separating dwellings from households, however in
urban areas you may need to determine the number of households in multi-story buildings (e.g. apartment
buildings).
4.1.2 More Detailed Map of Area Selected and Selecting Households – Random or Systematic Selection of a Fixed Number of Households Method
Once the precise area where the survey is to be performed is determined, the sketch-map of the area
may need to be double-checked and improved upon. This may mean visiting the segment and double-
checking the accuracy of the location of the households and placing additional landmarks on the map (See
Figure 4.4). If possible, an official of the area could assist with determining which dwellings are
occupied and which dwellings have multiple households. In areas where groups of households live in
compounds or large buildings, you may need to visit the site and determine the number of households. If
it is found that there are many more than 60 households in the segment/cluster, then it may be necessary

Indicators and Methods for Cross-Sectional Surveys of Vitamin and Mineral Status of Populations 52
to divide the area into approximately equal size subsegments based on number of households, and
randomly select one segment to survey.
Figure 4.4. Close up of Segment 4 as shown in Figure 4.3.
4.1.2.i Questions and Answers concerning Segmentation with Random or Systematic Selection of a Fixed Number of Households
• What is the ideal cluster/segment size for a survey?
Different investigators may have different preferences. One possible rule is that when
randomly or systematically selected households, usually there should be 1 to 3 times the
number of households to be assessed in the cluster/segment. A value of 1 means every
household in the segment is assessed, and a value of 3 means every third household is
assessed. For selecting the next nearest household or households in a specified direction,
this is less of an important issue.
• What if there is fewer than the number of households to be assessed within a selected village?
One approach is to survey all the households in the cluster and select remaining
households from the nearest village. This is considered a reasonable approach in that
households in a neighboring village are likely to be similar to those in the selected
village. For example, if 30 households are to be assessed in each cluster and the team
visits a cluster and finds it only contains 20 households, they would need to go to the next
village and select 10 households most likely using a segmentation approach.

Indicators and Methods for Cross-Sectional Surveys of Vitamin and Mineral Status of Populations 53
If the village has just slightly below the number of households to be assessed in each
cluster (say 1 or 2 households less than required), usually the team would just assess the
households in the cluster and not attempt to go to the next nearest village. The survey
protocol should have specific instructions on how to deal with various scenarios.
4.2 Selecting Households using Random or Systematic Selection of a Fixed Number of Households
On the map, sequentially number the households from 1 to the number of households in the segment. If a
dwelling has multiple households, assign each household its own number. Figure 4.4 shows segment 4
from Figure 4.3; the households in this segment would need to be numbered from 1 to 49.
4.2.1 Random or systematic selection of a fixed number of households
Simple random or systematic sampling of a fixed number of households, from a statistical viewpoint, is
the preferred method for selecting households in a selected cluster or segment. Both methods generally
require an accurate map of the cluster or segment with households sequentially numbered as described
previously. Using the example of assessing 30 households in each clusters, if there are >30 households,
then randomly select households to be surveyed using a random number table or by picking numbers
from a hat. Examples of random and systematic sampling are provided next.
4.2.1.i Example of random sampling approach: a. Assume a segment includes 60 households and 30 are to be selected.
b. Number the households from 1 to 60.
c. Use a random number table (Appendix 6) to select 30 unique numbers between 1 and 60
to identify the 30 households based on the random numbers selected.
4.2.1.ii Example of systematic sampling approach: If systematic selection of a fixed number of households is to be used, if the teams are to assess 30
households and if there are exactly 60 households in the cluster, then they would randomly select the

Indicators and Methods for Cross-Sectional Surveys of Vitamin and Mineral Status of Populations 54
number 1 or 2. If the number 1 is selected, all odd numbered households are assessed. If the number 2 is
selected, all even numbered households are assessed.
a. Calculate a sampling interval (number of households in segment ÷ 30 households to be
surveyed): 60 ÷ 30 = 2 (every second household would be surveyed)
b. Number the households from 1 to 60.
c. Select a random number between 1 and sampling interval (in this example, 2).
d. To identify the first household, select household number 1 or 2 on the map depending on
the random number selected.
e. Select every 2nd (sampling interval) household; in this example, this would either be the
even numbered or odd numbered households.
It is unlikely that there will be exactly 1, 2, or 3 times the number of households in the
cluster/segment. For example, say 30 households are to be assessed and there are 36 households in the
cluster/segment. First, the sampling fraction is the number of HH is the cluster divided by the number of
HH to be sampled, in this example, 36/30 = 1.2. This means every 1.2 households are to be selected. To
do the selection, first pick a random starting value, either 1 or 2, then assess every 1.2 households by
rounding. For example, say “1” is the randomly selected, so household 1 is assessed; add 1.2 which is 2.2
(1 + 1.2 = 2.2), round down to 2 and assess household number 2; add 1.2 (2.2 + 1.2 = 3.4), round down
and assess household number 3; add 1.2 (3.4 + 1.2 = 4.6) which would be rounded up to 5, so assess
household 5, and so on. For this cluster, the selected households would be:
1, 2, 3, 5, 6, 7, 8, 9, 11, 12, 13, 14, 15, 17, 18, 19, 20, 21, 23, 24, 25, 26, 27, 29, 30, 31, 32, 33, 35, 36
Alternatively, another option is to systematically select, in this example, the six households to not
assess. The sampling interval would be 36/6 = 6, randomly select a number between 1 and 6, remove that
one from the selection, and then remove every 6th household. For example, say the random number was
4, so household 4 would not be selected; 4 + 6 = 10, so exclude household number 10; 10 + 6 = 16,
exclude household number 16, and so on.
4.2.1.iii General Issues on Random or Systematic Selection of a Fixed Number of Households
The survey team should survey only selected households. If during the survey one of the dwellings to
be surveyed is found to have more than one household, determine how many households occupy the
dwelling and randomly select one to survey. If acceptable to the head of household, the team supervisor
can mark entrances to identify dwellings to be surveyed as well as those already surveyed.

Indicators and Methods for Cross-Sectional Surveys of Vitamin and Mineral Status of Populations 55
4.3 Random selection of first household
Another approach is to randomly select the first household and then select subsequent households in a
specified manner. This approach can be used with the fixed number of households or quota sampling
approaches. The selection of the first household can be done using different methods depending upon the
size of the segment and whether a listing or map of households is available. These steps are described in
more detail below.
4.3.1 Selecting the First Household
If the survey is to be performed in a large area, such as a city, it may be necessary to first divide the area
into segments or subsegments described previously. For the cluster/segment to be surveyed, a map must
be available and the steps for selecting households are:
Step 1: Number all of the households.
Step 2: Randomly select a number from 1 to the highest numbered household. The number can be
selected using a random number table or other predetermined method.
Step 3: Go to the selected household.
4.3.2 Selecting Subsequent Households
We recommend that, based on the map used to select the first household, subsequent households be
selected based on the map using prespecified rules. For example, on the map, draw a line the houses to
the left of first household (facing the household to the street); continue to select households to the left. If
an intersection is reached, turn left, and continue the household selection process.
We do not recommend using the “next nearest household” approach as presented for EPI surveys
because this may bias the results.

Indicators and Methods for Cross-Sectional Surveys of Vitamin and Mineral Status of Populations 56
4.4 Some general notes on the household selection process
Some important issue on assessing clusters and households include:
• A survey team must survey only the clusters as determined by the survey coordinator. Survey
teams should never substitute another site as a cluster unless instructed to do so by the national
survey coordinator.
• All those involved in planning and implementing the survey should understand that the primary
purpose of the survey is NOT to estimate the prevalence of micronutrient deficiencies in selected
clusters, but to derive a national estimate, or in the case of a stratified survey, stratum-specific
estimates. In some clusters, those surveyed may primarily consist of lower income households,
while in others they may consist of higher income households. When data from all clusters are
combined, the results will provide a reasonably valid national estimate.
• At the cluster level, e.g., a village, it is important that the village leaders understand that a specific
method will be applied in their village to select households, and the same method will be used in
all other villages selected for the survey. The selection of an area or households to be surveyed
should never be influenced by local officials or based on convenience to field workers. However,
local officials can be helpful in providing legitimacy to the survey team and improve the
likelihood that people would participate in the survey.
• When discussing the survey with local officials, try to confirm the population size of the cluster,
the number of households, the availability of maps, and other information that might be useful to
most readily identify and randomly select households. Local officials can also be helpful in
providing information on the boundaries of the cluster or segments so that sketch maps can be
easily developed if needed.
• Team members should understand that the purpose of a national micronutrient survey is to assess
a cross-section of the population to develop a valid estimate of the prevalence of nutrient
deficiencies and coverage of interventions across the country. Confusion can arise when survey
team members or local officials incorrectly believe the goal is to seek and identify individuals
with deficiencies.
It is expected that in some clusters fewer than the predetermined number of households will actually
be assessed. However, all selected households must be accounted for, and for those not participating, the
reason for nonparticipation recorded. Such circumstances are to be accounted for by increasing the
calculated survey sample size by an expected rate of non-complying households or individuals (as

Indicators and Methods for Cross-Sectional Surveys of Vitamin and Mineral Status of Populations 57
described in Section 3.5.4). Under no circumstances would it be appropriate for survey teams to
substitute households in the field. In addition:
The survey team, not local officials, must select households to be surveyed; and
Every attempt should be made to locate eligible individuals in selected households.
When sampling using the fixed number of households approach, the team visits the predetermined
number of households in each segment. The team will attempt to gain permission to survey every
selected household and eligible individuals in these households. It is expected that in some households:
There may be no one at home while the survey team is in the cluster, even after revisiting the dwelling
There may be no eligible individuals within the household
Not all individuals eligible in a household will be available for the survey, even after revisiting
Some households may refuse to participate
In some households the head of household may provide permission for the survey team to survey household members; however, some individual members may refuse to participate
Performing the survey during hours when people are most likely to be at home or, by working with
local leaders, request that people remain near their homes until the survey is completed can enhance
participation of survey subjects. For households where either no one is home or some eligible individuals
are not available when the survey team first visits the dwelling, a standard approach to revisiting such
households should be applied by all survey teams.
4.5 Selection of eligible individuals within households
As a general rule, we recommend that everyone within a household meeting the eligibility criteria should
be surveyed. For example, if one eligibility criterion is women 15-49 years of age, and there are three
women meeting this criterion in the household, we would recommend that all three be requested to
participate. An alternative approach would be to randomly select one of the three women, however this
approach would require a sampling weight in the analysis of the data.

Indicators and Methods for Cross-Sectional Surveys of Vitamin and Mineral Status of Populations 58

Indicators and Methods for Cross-Sectional Surveys of Vitamin and Mineral Status of Populations 59
Chapter 5 Survey Planning, Organization, Training, and
Field Work
Important components necessary to conduct a successful survey are supervision, planning, organization,
and coordination, all of which require good communications. Supervision is important to assure quality
data collection and adherence to the survey protocol. Coordination is important to ensure that all teams
follow similar procedures. Other essential requirements are having detailed protocols for the field
activities and sufficient supplies and equipment.
5.1 Supervision
One individual should be assigned as the survey manager to oversee all aspects of survey planning and
implementation. Additionally, each team should have a designated team supervisor. This supervisor is
responsible to assure:
• Proper protocol is followed in contacting local civil and health authorities in each cluster
• Standard procedures are followed to ensure quality data collection in all components of the survey
• Consent is obtained from participants and that potential survey subjects are aware of their right to
refuse participation in the survey and to withdraw from the survey at any time.
• The survey manager is informed regularly regarding the progress of data collection in the field, as
well as any problems so that solutions can be implemented in a similar manner by different teams.
5.2 Coordination and Communications
Adequate coordination and communications between the field teams and the survey manager are
essential. In many countries the communication infrastructure outside of urban areas can be poor. It is
recommended to provide each survey team with a field radio, mobile phone, or satellite phone to allow
the survey manager to keep track of progress and solve problems in the field. Appropriate individuals
should be notified of shipments of biologic specimens from the field to assure proper handling and

Indicators and Methods for Cross-Sectional Surveys of Vitamin and Mineral Status of Populations 60
storage. In some circumstances it may be useful to provide teams with global positioning systems (GPS)
to assist teams in finding selected clusters. Some satellite phones and other equipment can be used to
record the altitude which can be used at the analysis phase of the survey to correct hemoglobin values.
5.3 Protocol
Each team must fully understand the survey procedures based on training and need to have a
comprehensive protocol describing each step of field work and contingencies for dealing with problems,
such as equipment failure or supply problems. The protocol should include clear instructions on handling
and shipping completed survey forms and specimens. Some considerations in designing the survey are
described below.
5.4 Recruitment of Survey Teams
The composition of the survey team is important in ensuring that the work is performed systematically
and with good quality. Personnel recruited or assigned responsibility for the survey should be able to
focus exclusively on the activity. Each survey team should have one individual designated as the “team
supervisor.” The team supervisor’s role is to assure that clusters selected are actually surveyed, to
visually verify that all forms are completed correctly, and the collection of specimens and other
information is performed correctly. The number and types of other team members will depend upon the
survey protocol. For the collection of biological specimens, a laboratory technician will need to be
identified. It is important to develop a clear list of responsibilities of each team member and to
communicate these within the first few days of training. It is helpful to have checklists in the field as
reminders of roles and specific duties.
The number of teams to perform the survey will depend on a number of factors, including the number
of clusters selected and the span of time to complete the survey. At one extreme a single team could
assess every cluster, which would most likely increase the level of consistency in the way data are
collected, however it may take a long time to complete the survey. At the other extreme there could be a
different team for each cluster which would likely result in the survey being completed in a short period
of time but potentially less consistency in data collection. To assure consistency in data collection, the
fewest number of teams should be trained to collect data in a reasonable amount of time. Box 5.1 poses
some questions concerning the number of survey teams and number of clusters.
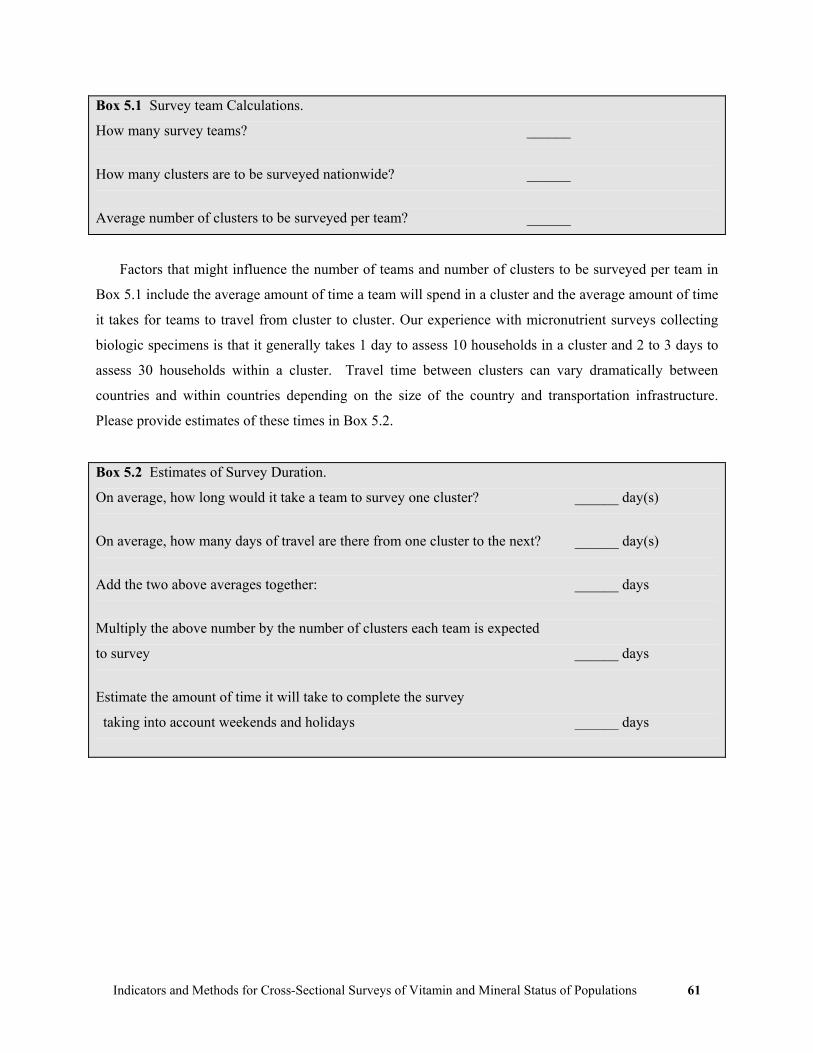
Indicators and Methods for Cross-Sectional Surveys of Vitamin and Mineral Status of Populations 61
Box 5.1 Survey team Calculations.
How many survey teams? ______
How many clusters are to be surveyed nationwide? ______
Average number of clusters to be surveyed per team? ______
Factors that might influence the number of teams and number of clusters to be surveyed per team in
Box 5.1 include the average amount of time a team will spend in a cluster and the average amount of time
it takes for teams to travel from cluster to cluster. Our experience with micronutrient surveys collecting
biologic specimens is that it generally takes 1 day to assess 10 households in a cluster and 2 to 3 days to
assess 30 households within a cluster. Travel time between clusters can vary dramatically between
countries and within countries depending on the size of the country and transportation infrastructure.
Please provide estimates of these times in Box 5.2.
Box 5.2 Estimates of Survey Duration.
On average, how long would it take a team to survey one cluster? ______ day(s)
On average, how many days of travel are there from one cluster to the next? ______ day(s)
Add the two above averages together: ______ days
Multiply the above number by the number of clusters each team is expected
to survey ______ days
Estimate the amount of time it will take to complete the survey
taking into account weekends and holidays ______ days

Indicators and Methods for Cross-Sectional Surveys of Vitamin and Mineral Status of Populations 62
5.5 Pilot Testing
Pilot testing should be performed on all aspects of the survey. The questionnaire should be translated into
the local language and tested. Pilot testing is useful to estimate the amount of time it will take to
complete the survey in each cluster and to identify any potential problems with the survey instruments
and protocol. The pilot testing should be undertaken in conditions similar to the field to simulate the
actual data collection. Questionnaire validation and other (pilot) community-level training activities
should take place in places different from those selected for the survey. Following the pilot test, all
survey teams should convene and discuss the experience and modifications made, if necessary, to the
protocol.
5.6 Training team members
Training of the team is an extremely important aspect. Training generally entails having documents that
provide details on data collection, processing, storage, and shipping. A training schedule should be
designed and those who are going to perform the training need to be identified early on for assisting in
producing the training materials. It is recommended that an extra team be trained in case someone is
unable to perform the field collection. Generally the training would include having in-class presentations
over the various aspects of data collection followed by a test field collection experience. After the field
experience, the team reassembles and discusses the field aspects. Appendix 7 provides guidelines for
interviewing participants.
5.7 Development of Survey Instruments and Forms
The survey instruments should be as concise as possible while addressing the primary objectives of the
survey. The major agencies responsible for the survey should be involved in the development of survey
objectives and in proposing indicators and questions for the survey. The questionnaire will depend upon
the indicators selected, but may include one or more of the following: demographic information;
socioeconomic information; knowledge, attitudes and practices (KAP); and information related to the
collection of specimens. At times it may be necessary to conduct qualitative interviews regarding
selected topics prior to the cross-sectional survey to develop appropriate closed-ended questions.
Indicators and Methods for Cross-Sectional Surveys of Vitamin and Mineral Status of Populations 63
While it may be tempting to collect information on many different characteristics, it is important to
remain focused on questions that will provide the most relevant information based on survey objectives
for assessing the current state and for future planning. For each question, thought should be given as to
how the results of the question would be used, whether analysis of the question can potentially impact
overall program management, be used to improve the health of the population, and precisely how the
information would be presented in a table. We strongly recommend that countries use a questionnaire
similar in design and wording as the UNICEF MICS and DHS. The UNICEF MICS questionnaires are
available in English, Spanish, French, and Russian (www.childinfo.org). Standard methods for analyzing
the data and tables are provided in the MICS documentation. Using the same or similar wording in the
questions and similar tables for presenting results will allow for comparison within and between
countries. Appendix 3 presents a sample questionnaire modified from the UNICEF MICS as an example
of the type of questions that may be included as part of a micronutrient survey.
5.8 Other survey forms and documents
A number of additional materials will need to be developed to support the implementation of the
survey and to monitor the progress of the fieldwork. Forms to accompany biologic and other specimens
collected in the field and shipped to the laboratory would need to be developed. A comprehensive manual
for field staff that provides guidelines for the survey would need to include detailed information on
conducting interviews and measurement technique, information on each question, including the range and
definition of responses. It is best if the manual is used in all stages of training, pilot field work, and in the
field for the duration of the survey. This will help ensure a high degree of standardization and
consistency, especially when several survey teams are involved with the survey.
5.9 Equipment and Supplies
Equipment and supplies are often not considered early enough in planning for a survey and can end up
being a bottleneck that delays fieldwork. It is very important to develop a complete listing of all supplies
needed with the number of items required (add approximately 10% to the number of items to order to
assure adequate supplies). It is recommended that supplies be ordered at least six months prior to the
training and field implementation. Table 5.1 provides an initial listing of supplies, although this would
need to be modified depending upon which indicators are to be assessed and whether blood is

Indicators and Methods for Cross-Sectional Surveys of Vitamin and Mineral Status of Populations 64
Table 5.1 Partial field Equipment and supply needs Item to be collected/tested Equipment/Supplies needed General Supplies Questionnaires
Consent forms (if required) Clip boards Pens or pencils Survey manual Local calendar Map of survey areas
General biologic specimen materials
Disposable surgical gloves (different sizes, depending on make-up of team members) Biomedical waste disposal bags and hard-shell containers
Serum Collection (Venipunture) Vacutainers (anticoagulant depends on specimens to be analyzed) Tube labels Tube racks Permanent ink pens Sterile disposable needles Butterfly needles (for small children) EPI cold boxes with frozen packs Bandaids Dry gauze pads Alcohol swabs (or cotton balls and alcohol) Tourniquets
Serum Collection (Capillary blood collected by finger stick)
Microtainers (anticoagulant depends on specimens to be analyzed) Tube labels Tube racks Permanent ink pens Sterile disposable lancets Bandaids Dry gauze pads Alcohol swabs (or cotton balls and alcohol) Container for disposal of biological samples and accessories
Dried Blood Spots from a finger stick
Sterile disposable lancets Filter papers Alcohol swabs (or cotton balls and alcohol) Band-aids Dry gauze pads Ziploc bags Silica gel sachets EPI cold boxes with frozen packs
Hemoglobin HemocueTM or other equipement to measure hemoglobin (in addition to supplies for blood collection)
Urinary iodine Disposable cups for collecting specimens Screw-capped tubes for urine storage and transportation Disposable pipette for transferring urine from cup to tube Tube labels Tube racks Cardboard with styrofoam-insert boxes Mailing/shipping labels Permanent ink pens for labels Sealable plastic bags
Iodized Salt Rapid test of iodine in salt Salt samples for titration (optional)
Rapid test kits (available from UNICEF); one vial can test approximately 50 salt samples Tube, bags, or packages for salt samples to be sent to a central laboratory for salt iodine titration analysis
Other Survey Equipment Scales (for measuring weight) Height/length boards Other equipment as needed

Indicators and Methods for Cross-Sectional Surveys of Vitamin and Mineral Status of Populations 65
collected from finger stick or by venipuncture. If laboratory tests are to be performed within the country,
it is important that all necessary equipment and reagents for the laboratory be obtained.
Prior to going to the field each team should complete an inventory to ensure they have adequate
supplies. All electronic and mechanical equipment should be properly tested to assure they are accurate
and in working condition. Appropriate testing of some equipment will need to be performed on a routine
basis in the field. Backup devices should either be with each team or available at a central site.
5.10 Logistics
A very time-consuming aspect of cross-sectional surveys is the logistics. This would include the ordering
of all equipment, organizing pilot studies, organizing the training, and the actual field collection issues of
vehicles, drivers, other forms of transportation, and accommodations. Having a person familiar with the
administrative aspects of these types of arrangements is important to the overall success of a survey. This
person is generally in addition to the survey manager/director.
5.11 Transportation and Lodging
The number and types of vehicles needed to perform the survey need to be determined early on and will
depend upon the terrain, number of personnel on the survey team, the equipment, and security needs. In
some settings four wheel drive vehicles will be necessary while in others a mini van will suffice. Lodging
for survey teams is usually arranged prior to the field implementation.
5.12 Disposal of Contaminated Materials
All biomedical waste should be handled, packaged, labeled or color-coded, transported, and
decontaminated in accordance with the requirements within the country. Usually, approved methods of
decontamination of biomedical wastes are autoclaving and incineration. In some countries, blood and
urine may usually be discarded either by carefully decanting into the sanitary sewer with 10% household
bleach, by autoclaving, or incineration.

Indicators and Methods for Cross-Sectional Surveys of Vitamin and Mineral Status of Populations 66
5.13 Budget
The cost of the survey will depend to a great extent on the sample size and expense of laboratory tests.
As a general rule, doing interviews and performing hemoglobin and urinary iodine tests in a 30 cluster
survey with around 20-30 households per cluster will cost around $120,000 USD to $150,000 USD, or in
the range of $120 USD to $160 USD per household. If expensive serologic tests are performed the costs
can increase dramatically. There is a need to balance the number of households and individuals to survey
with an acceptable level of precision against the cost of performing the survey. This usually means there
needs to be some tradeoffs, such as either reducing the overall sample size, eliminating some tests, or
performing expensive tests on a sub-sample.

Indicators and Methods for Cross-Sectional Surveys of Vitamin and Mineral Status of Populations 67
Chapter 6 Data Entry, Cleaning, and Analysis
The careful entry of survey data, cleaning of the data, and proper analysis are important. Similar to
efforts to assure quality in the collection of data and in the handling and processing of specimens in the
laboratory, adequate planning and procedures apply to the way data are entered into the computer and
analyzed. This chapter discusses issues on data entry, cleaning, and analysis of data.
6.1 Data Entry
The data entry system must be decided upon prior to the start of the survey. Some important issues are
which software program to use for data entry and the identification of an individual to develop the data
entry system. Common programs used for data entry are Epi Info6 (www.cdc.gov/epiinfo), Epi Data
(www.epidata.dk), and CSPro (www.census.gov/ipc/www/cspro/). Other programs can be used for data
entry, but as a general rule, the data entry system needs to be developed within a relatively short time
period. It is best to use a program that could easily be modified by others should the primary developer
be unavailable.
Three possible ways to have data entry performed are:
• As the data are collected: Enter the data onto computer while the participant is present, this allows
for the immediate double-checking of suspect data and the ability to re-measure a participant. This
method also identifies errors in completing the forms and would require each team to have a portable
computer, electricity, requires training of the survey personnel for this purpose, and may increase the
cost of the survey. Personal digital assistants (PDAs) are becoming more widely used for collecting
data in surveys.
• Enter data at the end of the day by the survey team. While not as flexible as option 1, this approach
could also allow for correction of erroneous data by allowing the team to return to a cluster.
• Enter data at central location. This method has the advantage of having a few experienced data
entry personnel performing data entry, usually with fewer errors. This approach makes it difficult to
correct errors due to incorrect information written on the forms. Rapid data entry allows survey
managers and team supervisors to identify erroneous data collection procedures early in the survey
which allows corrective action and we therefore recommend that no more than one week should pass
between data collection and data entry.

Indicators and Methods for Cross-Sectional Surveys of Vitamin and Mineral Status of Populations 68
A data dictionary should be developed that defines each variable in the database with its acceptable
values (an example shown in Table 6.1). Ideally, data entry should perform error checking as data are
entered.
When data are collected on paper forms, it is strongly recommended that the data be entered two
times to identify data entry errors, a process referred to as “double data entry.” While double data entry
requires time and resources, the benefit of having as accurate a data set for analyses as possible is well
worth the effort.
In many studies the questionnaires are first entered into the computer and later the results of
laboratory analyses added to the files. The same rigor in which the questionnaires were entered should be
applied to the data entry of laboratory results.
Table 6.1 Example data dictionary Variable Variable
Name Variable Type Variable
Width Values/Notes
Participant ID no. ID Numeric 3 001-900 Cluster number CLUSTER Numeric 2 1-30 Age in months AGE Numeric 2.1 6.0-59.9 months Date of birth DOB dd/mm/yyyy Sex SEX Numeric 1 1=Male, 2=Female Date of Survey SURVEY dd/mm/yyyy 15/06/2004-20/08/2004 Hemoglobin HB Numeric 2.1 4.0-18.0 Urinary iodine UI Numeric 4.1 0.0-1000.0 Iodine levels in salt based on rapid test kit
IODINE Numeric 2 0,7,15,30
*Note: these may not be correct minimum and maximum values for use in populations living at high altitudes
6.2 Data Cleaning
After correcting any data entry errors by comparing double-entered data, further data cleaning is
performed to identify potentially erroneously recorded data which usually cannot be verified and
corrected. This usually means performing a frequency of every variable to assure that the values are
within an acceptable range, which should be defined in the data dictionary (Table 6.1). For example,
individual ID numbers are usually unique and should occur only once in a data file - if there are duplicate
ID numbers, it could be that: one questionnaire was entered two times; two different individuals were
assigned the same ID number; or one of the two was entered incorrectly.

Indicators and Methods for Cross-Sectional Surveys of Vitamin and Mineral Status of Populations 69
Logical errors should be investigated. Examples include:
• Assuring that the date of birth cannot be after the date the individual was surveyed
• A calculated age (calculated from the date of survey and date of birth) is similar to the stated age (the
age as stated verbally)
Any errors found should be corrected or deleted from the database and the cleaning process repeated
until the data are considered “clean.” The number of missing responses for each variable should be
investigated. If there are a large number of missing values, make sure that these are not a result of data
entry.
6.3 Data Analysis
The analysis of data should take into account the complex design of multi-stage cluster surveys.
Commonly used computer programs that allow such analyses include Epi Info7 (www.cdc.gov/epiinfo),
SAS version 8.0 or later (www.sas.com), SPSS with the optional SPSS Complex Samples module
(www.spss.com), Stata (www.stata.com), and Sudaan (www.sudaan.com). All calculations should be
considered as estimates of the “true” values for the target population. Ninety-five percent confidence
intervals around prevalence and coverage estimates provide a range of values in which the "true"
proportion is likely to be “captured."
In the interpretation of data, it is important to remember that sampling errors, measurement errors,
and the skill of the survey team members influence survey results. In general, if a stratified survey is
performed, prevalence estimates are provided for each stratum as well as a national estimate. Information
collected at the cluster level is usually not presented in a survey report but they may be useful to identify
geographic areas where the prevalence of micronutrient deficiencies are much higher than expected or the
coverage of interventions much lower than expected. Therefore, further investigation into clusters where
problems appear to be present may be warranted. There are differences in how data are analyzed
depending upon whether or not the PPS methodology and/or stratification were used and described in the
next two sections.
6.3.1 PPS Surveys
With a single PPS survey where sample weighting is frequently not necessary, it is relatively
straightforward to calculate a proportion. Consider iodized salt use in a single PPS survey - all that is

Indicators and Methods for Cross-Sectional Surveys of Vitamin and Mineral Status of Populations 70
needed is to count the number of salt samples found to be adequate divided by the number of salt samples
tested, which could easily be calculated by hand. For example, if 300 households had salt available for
testing and 157 had adequately iodized salt, then the proportion of households with adequately iodized
salt would be 157/300 = 52%. If a single school-based PPS survey was performed and 451 children out
of 600 had a UI < 100 µg/L, then the proportion would be 451/600 = 75%.
While the calculation of the proportion for PPS surveys is straightforward, the calculation of 95%
confidence intervals is more complex. The 95% confidence interval is an important part of presenting the
results because it provides a range that, with 95% confidence, captures the "true" proportion. Also, the
width of the confidence intervals provides a measure of the precision of the survey; the narrower the
confidence limits, the greater the precision. In comparing one area to another or the results of two
surveys performed at different times in the same area, the confidence intervals can assist in determining
whether the difference between two prevalence estimates is significant (note that a statistical test taking
into account the survey design could also be applied).
Given equal sample sizes, confidence intervals for PPS surveys are usually wider than those using
simple random sampling. This is because in PPS the first stage of selection is the cluster, and the second
stage of selection is individuals and/or households. It is beyond the scope of this manual to explain this
concept further. There are a number of introductory survey statistics textbooks that provided these
details.
Epi Info Version 6 (DOS) has a module for analyzing complex survey data called Csample. This
program can calculate correct confidence intervals for cluster survey data. Additional information on use
of Csample can be found in the Epi Info documentation. The Windows version of Epi Info (starting with
version 3.0) has commands in the Analyze Data module that can take into account complex sample
designs. The commands are Complex Sample Frequencies, Complex Sample Tables, and
Complex Sample Means. An example using real data from a district in a country using the DOS
version of Epi Info is described next.
6.3.1.i Example of analyzing PPS survey data using Csample
In this example, thirty schools were selected by PPS, and within each school, an average of 12 students
had urine samples collected. A variable called UILT100 was created that dichotomizes UI into groups,
where an UI <100 µg/L was coded as a “1” and >100 µg/L coded as a “2”. After reading the Epi Info
data file (a ".REC" file), the second Csample screen is shown in Figure 6.1. The Main variable
(UILT100) is that which identifies whether or not the UI was less than 100 µg/L. The other important
variable is the PSU (primary sampling unit), which in a cluster survey is the variable that identifies the

Indicators and Methods for Cross-Sectional Surveys of Vitamin and Mineral Status of Populations 71
clusters. In this example, the variable is called cluster. The other parts of the screen (Strata,
Weight and Crosstab) are left blank. The results of the analysis are shown in Figure 6.2. The
interpretation of the output is that only 8.6% of the urine specimens had an iodine level <100 µg/L and
the 95% confidence limits are 3.8%, 13.4%. More details on the output in Figure 6.2 are provided below:
Obs The number of observations; in the example where UILT100 = 1, there were 31 children with a low urinary iodine
Percent V The “vertical” or column percent; in the example where UILT100=1, 8.587% (31/361) had a low urinary iodine (UILT100=1)
SE% The standard error LCL% The lower confidence limit in percent; in the example where UILT100 = 1, the lower
confidence limit is 3.793% UCL% The upper confidence limit in percent; in the example where UILT100 = 1, the upper
confidence limit is 13.382% Total Obs The total number of observations with valid data Design eff. The design effect
Figure 6.1 Example of initial Csample screen from Epi Info 6.04 (DOS version)
The design effect (DEFF) was 2.75, which would indicate that there was moderate variation in the
proportion of individuals with low UI values from school to school. In this example, the proportion of
students with low UI values by school ranged from 0% to 50% (data not shown).
If the cluster design of the survey had been ignored (i.e., an analysis ignoring the complex sample
design and analyzed as though the data were collected using simple random sampling), the proportion of
urine specimens with low values (<100 µg/L) would be the same (8.6%), but the confidence intervals
would be too narrow (5.7%, 11.5%).

Indicators and Methods for Cross-Sectional Surveys of Vitamin and Mineral Status of Populations 72
Figure 6.2 Example of output from Csample module of Epi Info 6.04 (DOS version) CTABLES COMPLEX SAMPLE DESIGN ANALYSIS Analysis of UILT100 UILT100 | |Total | |-----------|-----------| |1 | | | Obs | 31| | Percent V 8.587| | SE% | 2.446| | LCL% | 3.793| | UCL% | 13.382| |-----------|-----------| |2 | | | Obs | 330| | Percent V 91.413| | SE% | 2.446| | LCL% | 86.618| | UCL% | 96.207| |-----------|-----------| |Total Obs | 361| |-----------|-----------| |Design eff.| 2.752| ----------------------- Sample Design Included: ----------------------- Sampling Weights—None Primary Sampling Units from CLUSTER Stratification—None 839 records with missing values
6.3.2 Stratified PPS Surveys
If the overall survey were divided into different geographic areas (“strata”), and a separate PPS survey
performed in each area, this is referred to as a stratified PPS survey. The previous section is applicable to
the analysis of each stratum separately; however, usually an overall estimate is desired combining all
strata. In order to derive a correct overall estimate, sample weights most likely need to be applied to each
stratum to account for differences in population size in each. In this section the weighting of data will be
shown by two different methods; the first will be calculating the estimates by hand and the second will be
the use of Epi Info to perform a weighted analysis.
For example, say a country performs a stratified PPS survey; one survey in the capital area (Region
A); one in the mountainous region (Region B); and one in the rest of the country (Region C; Table 6.2).
Table 6.2 shows that 62.9% of the population lives in the capital area, 21.6% in the mountainous area, and
15.5% in the rest of the country.

Indicators and Methods for Cross-Sectional Surveys of Vitamin and Mineral Status of Populations 73
Table 6.2 Example of weighted analysis performed by hand
Population Distribution Urine Samples Tested Distribution
Low UI Region
n % n % n Prevalence of low UI
(%)* A 372,978 62.9 334 34.5 112 33.5
B 127,841 21.6 324 33.5 185 57.1
C 92,117 15.5 309 32.0 119 38.5
Total 592,936 100.0 967 100.0 416 -
*Number with low UI value divided by the number of samples tested
The number and percent of UI samples collected in each region are shown in columns 4 and 5,
respectively. The last two columns on the right are the number of urinary iodine values <100 μg/l and the
prevalence of low UI by region. When combining results from the three strata, the differences in
population size needs to be considered. An incorrect approach to estimating the percentage of the
population with low UI values would be to sum up the number of individuals with low UI and divide by
the number of samples tested (416 / 967 = 43.0%). This is the correct percentage of the number of
samples with low UI, but is not a correct estimate of the percentage of the target population with low UI.
To determine the weighted prevalence of low UI for the entire population, it is important to take into
account the size of the population in each region. For this example, we will use the percentage of the
population in each region. The correct overall population estimate would be:
[(62.9% x 33.5%) + (21.6% x 57.1%) + (15.5% x 38.5%)] / 100 = 39.4%
In the above calculation, the percent of the population that lives in each region is multiplied by the
percent of individuals with low UI and these values summed. The last step is to divide by 100, which
provides the more correct weighted estimate of 39.4%.
The previous example depicts how to perform weighted analyses by hand and is provided to present
the concept. The more common approach is to add sample weights to a data file and apply these weights
in the analysis. For the following example the Epi Info software program will be used, but similar
methods can be used to weight estimates in most statistical software programs. The steps to weight data
require some calculations by hand and then some programming. First, the weights are calculated by hand.
Using the example from Table 6.2, the first five columns are repeated in Table 6.3. The last column on
the right is for the weights for each region. The weight is determined by dividing the percent of the
population in each region by the percent of the sampled participant in each region. For example, for

Indicators and Methods for Cross-Sectional Surveys of Vitamin and Mineral Status of Populations 74
region A, the weight is 62.9 / 34.5 = 1.823. Once these weights are calculated, then they need to be added
to the data file. Each individual in the file from region A should have the weight 1.823. To do this in Epi
Info’s ANALYSIS program, you need to first create or DEFINE a variable and then give values to the
new variable. An example is as follows:
DEFINE SWEIGHT #.###
IF REGION = “A” THEN SWEIGHT = 1.823
IF REGION = “B” THEN SWEIGHT = 0.645
IF REGION = “C” THEN SWEIGHT = 0.484
Table 6.3 An example of calculating weights for use in computer program
Population
UI Samples Tested Region
n % n %
Sample
Weight
A 372,978 62.9 334 34.5 1.823
B 127,841 21.6 324 33.5 0.645
C 92,117 15.5 309 32.0 0.484
Total 592,936 100.0 967 100.0 -
Another acceptable approach to weighting the data is to divide the population in region by the number
sampled in that region. For example, the weight for Region A would be 372,978/334 = 11,167.03. This
calculated value can be thought of as follows: for every individual sampled for a urine specimen, they
represented 11,167.03 individuals of the region’s population. Weights could similarly be calculated for
Regions B and C. Use of either sample weights in a complex sample computer program would provide
the same estimates.
To have the analyses take these weights into account in Epi Info’s Csample program, you need to
provide the weight information in the dialog box (see Figure 6.1). Further details and examples can be
found in the chapter on Csample in the Epi Info documentation.
6.3.3 Non-PPS Surveys
It may not always be possible to perform a PPS survey. For example, if clusters were selected using a
simple random or systematic sampling methodology, and a sample of respondents interviewed in each
cluster, the population size of each sampled cluster is required to correctly analyze the data, which must

Indicators and Methods for Cross-Sectional Surveys of Vitamin and Mineral Status of Populations 75
be weighted. The approach to weighting is similar to that described in the previous section. The
difference would be that the population size in each cluster surveyed would be used to calculate the
weight.
6.4 Summary
This chapter describes issues related to data entry, data cleaning, and data analysis. These are important
aspects of assuring good data quality in the development of the preliminary and final reports. Issues
related to using programs that account for complex sample designs and weighted analyses were presented.
Examples of the types of tables for a survey report are provided in Appendix 8.

Indicators and Methods for Cross-Sectional Surveys of Vitamin and Mineral Status of Populations 76

Indicators and Methods for Cross-Sectional Surveys of Vitamin and Mineral Status of Populations 77
Chapter 7 Development of Preliminary Report, Final Report,
and Program Management
Analysis of data, producing preliminary and final reports, and using these results to improve the health of
the population are important aspects in the survey process. The amount of time allotted to data analysis
and report writing is frequently underestimated. Depending on the complexity of the survey, the final
report may be 100 to 200 pages or more and take 6 to 18 months to complete. Because of the long time it
usually takes to complete a final report, it is recommended preliminary report on the key survey outcomes
being developed and used for program management within a few months after the completion of the
survey.
The results of the survey should lead to a dissemination event which should include relevant groups
within the country to consider the results of the survey and how these should influence intervention
program planning and policy. It may be useful to have brochures on the key findings of the survey and
slide presentations with the key findings. Follow-up documents might include long-term planning
recommendation and policy documents to reduce disease prevalence and improve intervention coverage,
and documents that perform trend analysis and compare the results of the survey with other sources of
information.
In the following sections are more details on the preliminary report, final report, and other follow-up
activities.
7.1 Preliminary Report
A preliminary report should be produced as soon as possible presenting key results, usually within a few
months following the end of field collection, although this could be longer depending on the availability
of laboratory results. This document could be used for advocacy and program management and is
generally between three and 20 pages depending upon the complexity of the survey.
The Preliminary Report should include the following:

Indicators and Methods for Cross-Sectional Surveys of Vitamin and Mineral Status of Populations 78
• Background and objectives of the survey: The major objectives of the survey; how the survey fits
into the larger aspects of the national plan for micronutrient elimination; and institutions involved in
the survey process and funding agencies.
• Abbreviated Methods section that would include items measured and collected in the survey and the
survey methodology, which would include: Sample design; response rate; and processing of data.
The definition of the indicators, such as the definition for anemia, iron deficiency, and vitamin A
deficiency.
• Key results: Provide results of key indicators that can assist in planning purposes and also for
advocacy.
• Conclusions and plan of action: What are the major findings and a note of caution that the data are
preliminary and that a more complete report would be available in the near future.
7.2 Final Report
The completion of a comprehensive full report is essential. This final report serves many functions:
• Provides detailed results of the survey
• Allows others to evaluate the methods and quality of the survey results
• May serve as a guide for future surveys
Frequently the final report may take six to 18 months to complete and this report should be shared
with all interested agencies. The report is generally divided into different chapters. One way of
organizing the report is described below; however, different ways of organizing the report can be used.
An important decision that needs to be made in the development of the final report is whether it should
present only the results of the survey or whether it should also include recommendations. In general, a
report that presents results without recommendations can be completed in a shorter time period. Adding
recommendations to the report may make the report more of a policy document which may need to be
reviewed and approved by many individuals in different government agencies.
Executive Summary – This section presents a summary of the key findings and their implications on the
national program with primary recommendations. This section is generally a few pages long.
Introduction – The introduction usually has information on the health effects of micronutrient
malnutrition, the magnitude of the problem, and activities undertaken to eliminate micronutrient
malnutrition in the survey area. Information on previous surveys in the survey area or nearby areas

Indicators and Methods for Cross-Sectional Surveys of Vitamin and Mineral Status of Populations 79
should be included. The purpose of the survey described in the report should be clearly stated.
Frequently some basic demographic information for the country is provided.
Methods – The details of the methodology should be presented. This would include describing the
features of the survey methodology, e.g., stratification, primary sampling units, method of selecting
primary sampling units, methods for selecting households, etc. Laboratory methods used in the analyses
of specimens should be provided as well as which laboratories performed the analyses. The statistical
methods used, such as statistical weighting, and the software used for data entry and analysis should be
provided. Important here is to provide the reader with sufficient information to determine if a reasonable
approach to the analyses of data were used. The target groups and the type of information and specimens
collected in these groups are provided. Definitions used to define outcomes, such as hemoglobin cut-
points to define anemia, the definition for vitamin A deficiency, and other conditions. The definitions are
important because sometimes definitions may change over time and it is important to be absolutely clear
concerning the exact definitions used. Do not assume that everyone reading the report will be an expert
in micronutrients.
Results – The first part of the results should provide information on the quality of the survey, such as
response rates and frequency of key variables with missing or incorrect values. This will provide the
reader with some information to allow them to form an impression on the quality of the data, and
therefore the level of confidence to place on the results. The next part is to provide a description of those
who were surveyed, such as the number of individuals by age and sex categories. The final part provides
the detailed tables by topic, for example:
• Iron Deficiency and Anemia
• Vitamin A
• Iodine Deficiency
Examples of tables are provided in Appendix 8.
Conclusions – The most important findings should be provided. In addition, any weakness or problems
encountered in data collection and analysis should be provided with recommendations on how to improve
future surveys. If it has been decided to include recommendations into the final report, they would
usually be presented in this section.
Acknowledgements – Acknowledge individuals and institutions that assisted in the design,
implementation, and analysis of the survey.
Appendices – Appendices should include the questionnaires used in the survey and any other documents
that might have more details on the methodologies used to design the survey and training materials.

Indicators and Methods for Cross-Sectional Surveys of Vitamin and Mineral Status of Populations 80
7.3 Additional Reports
In addition to the final report, there may be other reports developed. These would include reports on
trend analysis, comparison of the survey results with other sources of data, and more in-depth analyses.
We recommend that these data files be made available to other researchers to perform more detailed
investigations.
7.4 Dissemination
An important element is to share the preliminary and final reports with government agencies,
institutions, donor agencies, NGO’s, and the press. In many settings the release of the results is first
shared with the key agencies and institutions, and then presented in a formal press conference by high-
ranking government officials. These results should be shared with regional and provincial health
authorities, especially if the survey included stratification of geographic areas. Frequently the longer the
interval between completion of the field collection and the release of results, there is less interest,
enthusiasm, and importance placed upon the results. There may be meetings that focus on specific topics,
such as flour fortification.
It would be important to hold meetings with key stakeholders on policies to improve national
intervention programs and, therefore, improve the health of the population. These meetings would
usually entail the development of long-term planning (e.g, five-year plans) that would identify key
individuals responsible for programs, provide timelines on improving intervention coverage, monitoring
programs to assess coverage between cross-sectional surveys, and sufficient budgets.

Indicators and Methods for Cross-Sectional Surveys of Vitamin and Mineral Status of Populations 81
Appendices

Indicators and Methods for Cross-Sectional Surveys of Vitamin and Mineral Status of Populations 82

Indicators and Methods for Cross-Sectional Surveys of Vitamin and Mineral Status of Populations 83
Appendix 1 Background on Micronutrient Deficiencies
The purpose of this Appendix is to provide an overview of the magnitude and consequences of
micronutrient deficiencies. While experts on micronutrients will be familiar with this information, those
involved in certain aspects of a micronutrient survey may not. This chapter also summarizes the
importance of assessing micronutrient deficiencies and their interventions.
A1.1 Iron Deficiency (ID), Anemia, and Iron Deficiency Anemia (IDA)
Iron deficiency is prevalent in both industrialized and developing countries. In the former, severe iron
deficiency is the main cause of anemia. In poor populations, diets may be monotonous and based on foods
low in iron and high in iron-absorption inhibitors. Populations living under these conditions frequently
have low iron stores, particularly young children and pregnant women. In addition to iron deficiency,
anemia is also associated with other nutrient deficiencies (folic acid, vitamin A, B12), malaria, intestinal
parasitic infestations (especially hookworm, schistosomiasis and amoebiasis), and chronic infections such
as HIV, cancer, and tuberculosis.8
A1.1.1 Global prevalence of ID, Anemia, and IDA
Iron deficiency (ID) is the most common nutrient deficiency and anemia, as an indicator of iron
deficiency, affects nearly 2 billion people worldwide, or about a third of the world's population. 8 Overall,
it is estimated that worldwide 39% of preschool children and 52% of pregnant women are anemic, the
majority living in developing countries.8 Many school-aged children, adults (male and female), and the
elderly are also anemic. Iron deficiency can affect all age groups and presents a major hurdle to national
development.

Indicators and Methods for Cross-Sectional Surveys of Vitamin and Mineral Status of Populations 84
A1.1.2 Consequences of ID, Anemia, and IDA
ID has profound negative effects on human health and development. In infants and young children,
functional consequences include: impaired immune function; slowed psychomotor development,
coordination, and scholastic achievement; and decreased physical activity levels.8 In adults, iron
deficiency results in fatigue and reduced work capacity. In pregnant women, iron deficiency anemia is
associated with an increased risk of maternal mortality and morbidity, perinatal mortality and morbidity,
and strongly associated with prematurity and intrauterine growth retardation.8
A1.1.3 Interventions for IDA
Common measures to prevent iron deficiency include: iron fortification of commonly eaten staple foods,
selected condiments, and complementary baby foods; iron supplementation; and general public health
measures to prevent parasitic diseases and common infections. At present, in most countries the primary
measure to control iron deficiency and anemia consists of providing iron supplements to pregnant women
and, less frequently, to young children. An increasing number of countries have iron fortification flour
programs. For additional information on the Flour Fortification Initiative see
www.sph.emory.edu/wheatflour/main.htm.
A1.2 Vitamin A Deficiency (VAD)
Vitamin A deficiency (VAD) is a major public health problem with the most vulnerable being preschool
children and lactating and pregnant women in low-income countries.2 Women in endemic vitamin A-
deficient areas should receive a vitamin A supplement following delivery. 2 The need for vitamin A
increases during lactation to replace vitamin A losses in breast milk. In children, VAD is the leading
cause of preventable visual impairment and blindness. An estimated 250,000 to 500,000 children become
blind every year due to VAD, with around half of whom die within a year of becoming blind.9

Indicators and Methods for Cross-Sectional Surveys of Vitamin and Mineral Status of Populations 85
A1.2.1 Global prevalence of VAD
WHO has estimated that vitamin A deficiency is a public health problem in 96 countries. 2 Africa has the
highest prevalence of VAD while the highest numbers of clinically affected are in South-East Asia.
Among children under 5 years of age affected by VAD, 3 million have signs of xerophthalmia. Most of
the estimated 140 and 250 million children affected by VAD do not have clinical manifestations but are at
greater risk of developing severe infections and mortality. 2
A1.2.2 Consequences of VAD
In addition to blindness, VAD significantly increases the risk of severe illness and death from common
childhood infections, particularly diarrheal diseases and measles. In communities where VAD exists,
children are, on average, 23% more likely to die and 50% more likely to suffer complications as a result
of measles infection. 2 In women, VAD may be an important factor contributing to maternal mortality and
poor pregnancy and lactation outcomes. 2 VAD is also likely to increase vulnerability to other disorders,
such as iron deficiency anemia. In VAD-endemic countries, pregnant women often experience deficiency
symptoms, such as night blindness, that continues into the early period of lactation. 2
In some countries of South-East Asia, the prevalence of night blindness has been reported to be as
high as 10-20% in pregnant women. 2 For nursing infants, the breast milk they receive from deficient
mothers is likely to contain insufficient vitamin A to build or maintain vitamin A stores. 2
A1.2.3 Interventions for VAD
Strategies for controlling VAD aim to provide an adequate intake through a combination of breastfeeding,
dietary improvement, supplementation, and food fortification. Protection, promotion and support of
breastfeeding are essential components in VAD prevention programs. Dietary improvement is an
important complement to supplementation and fortification. The challenge is that dietary improvement is
usually difficult to achieve in the short term, but in many countries, home gardens with vitamin-A rich
fruits and vegetables, particularly for vulnerable families, has been promoted as a long term solution.
The periodic use of high-dose vitamin A capsules is a highly effective means of improving vitamin A
status. Immunization programs provide a channel for the delivery of vitamin A supplements. Food

Indicators and Methods for Cross-Sectional Surveys of Vitamin and Mineral Status of Populations 86
fortification with vitamin A is becoming more common and this approach is increasingly feasible in
countries.
A1.3 Iodine Deficiency
Iodine deficiency constitutes the single greatest cause of preventable brain damage in the fetus and infant,
and of retarded psychomotor development in young children. It remains a major threat to the health and
development of populations the world over. 40
A1.3.1 Global prevalence of Iodine Deficiency Disorders (IDD)
Knowledge of the global magnitude of iodine deficiency has improved considerably since 1990. Iodine
deficiency is now identified as a significant public health problem in 130 countries, with an estimated 2
billion worldwide with insufficient iodine intake, or 24% of the world's population. The most affected
regions, in decreasing order of magnitude, are Europe (57%), Eastern Mediterranean (54%), Africa
(43%), South-East Asia (40%), Western Pacific (24%), and the Americas (10%). 10
A1.3.2 Consequences of Iodine Deficiency
Iodine deficiency results in goiter, stillbirth, and miscarriages, but its most devastating toll is mental
retardation, deaf-mutism, and impaired learning capacity.40 While cretinism is the most extreme
manifestation, of considerably greater significance are the more subtle degrees of mental impairment that
lead to poor school performance, reduced intellectual ability, and impaired work capacity.
A1.3.3 Interventions for IDD
The main intervention strategy for iodine deficiency prevention and control is universal salt iodization
(USI), which was established as a World Summit for Children goal in 1990 and adopted by the World
Heath Assembly in 1993. Salt was chosen as the food item to fortify with iodine for a number of reasons.
First, salt is widely consumed by most populations, and second, the costs of iodizing salt are low, around
five US cents per person per year.40 In high-risk areas, where populations cannot be reached by iodized
salt, an alternative is to administer iodine supplements with a focus particularly on women and children.

Indicators and Methods for Cross-Sectional Surveys of Vitamin and Mineral Status of Populations 87
In the early 1980s few countries were known to be affected by iodine deficiency with only a handful
having iodine deficiency control programs, usually iodized oil supplementation. Over the last decade,
extraordinary progress has been made in increasing the number of people consuming iodized salt. In 1990
only 46 countries had salt iodization programs, and by 1998 the number had increased to 93, of which
more than 80% have legislation requiring iodized salt.40 Overall, more than two-thirds of households in
now consume iodized salt.11

Indicators and Methods for Cross-Sectional Surveys of Vitamin and Mineral Status of Populations 88

Indicators and Methods for Cross-Sectional Surveys of Vitamin and Mineral Status of Populations 89
Appendix 2 Micronutrient Indicators
This Appendix provides more details on the indicators of micronutrient malnutrition and intervention
programs. Many of the indicators for micronutrient malnutrition, such as serum retinol, hemoglobin, and
serum ferritin, are affected by inflammation due to an acute or chronic condition. Indicators of
inflammation are described in this Appendix.
A2.1 Vitamin A Deficiency (VAD)
Different indicators for VAD are described next. WHO has recommended that at least two biologic
parameters, i.e., night blindness, biochemical, or histological indicators, be used to determine whether
VAD exists as a public health problem rather than relying solely on a single indicator.12 Alternatively,
one biologic indicator and at least four (two of which are nutrition and diet-related) demographic and
ecologic risk factors: high infant mortality, low immunization coverage, poor infant feeding practices, low
dietary intake, high prevalence of diarrhea, low education of women, and inadequate supply of safe water.
(Note: the WHO VAD document gives more details on the exact cutoffs for the demographic and
ecologic risk factors.) The most likely biochemical indicator of VAD to be collected in a cross-sectional
survey is serum retinol and described in more detail below.
A2.1.1 Serum retinol
Serum retinol is the key indicator to use in tracking progress towards the elimination of VAD.13 Serum
retinol values can reveal marginal vitamin A deficiency before the deficiency is severe enough to cause
clinical manifestations. Serum retinol is affected by inflammation and where possible, efforts should be
taken to collect information on infection status. As is the case with any biochemical parameter, it is
essential that sample collection, preparation, storage, transport, and laboratory analysis be considered in
the planning stage of the survey. Most commonly, retinol is measured from serum samples that are
separated by centrifuge from whole blood collected by venipuncture or finger stick and stored in tubes

Indicators and Methods for Cross-Sectional Surveys of Vitamin and Mineral Status of Populations 90
impermeable to light and refrigerated until laboratory analysis. 14 However, these procedures are often
difficult to implement in remote field conditions because of the need for a centrifuge and refrigeration.
The most common and accurate method for measuring serum retinol has been to analyze serum by
high-pressure liquid chromatography (HPLC). 15 This method has been adapted for use with blood
spotted onto filter paper, such as the method developed by Craft Laboratories (Wilson, NC, USA). These
dried blood spots (DBS) need to be stored in airtight plastic bags under cold chain conditions until they
are analyzed. The laboratory analysis of DBS serum retinol has been shown to correlate very closely with
conventional techniques.16 17 It is recommended that retinol be analyzed using HPLC with vigilant quality
control. There has been significant variation in the results of retinol analyses conducted in different
laboratories.18 The preparation of DBS and serum samples for analysis requires different technical
requirements, and while serum samples can be analyzed in many labs, at the current time, DBS analyses
is performed in a limited number of laboratories worldwide. Whenever possible, serum retinol from
serum specimens using HPLC is the recommended method. If serum samples cannot be collected, the
DBS method could be considered as an option with a subsample having serum retinol performed.
Interpretation of the prevalence of low serum retinol is presented in Table A2.1.
Table A2.1 Prevalence of serum values of vitamin A <0.70 μmol/l (<20 μg/L) in children >1 year Level of importance as a public health problem Prevalence Mild Moderate Severe
>2 to <10% >10 to <20%
>20% Source: WHO/NUT/96.10, Indicators for assessing vitamin A deficiency and their application in monitoring and evaluating intervention programmes.
A2.1.2 Retinol binding protein (RBP)
Retinol binding protein (RBP) has an approximate 1:1 molar relationship with retinol and has been
proposed as a surrogate indicator.19 20 21 An advantage of RBP is that, as a serum protein, it is relatively
stable compared to retinol. This relative durability and equi-molar relationship to retinol in serum has
facilitated the use of RBP as a surrogate measure of retinol as an indicator of VA status.22 23
There are several methods that have been developed to assess RBP. One test developed by the
Program for Appropriate Technology in Health (PATH) based on an ELISA platform has been validated.
The RBP-EIA developed by PATH is undergoing final field evaluation with specimens from at-risk
populations, and is commercially available (Scimedx, Denville, NJ). The RBP-EIA has been optimized to
use serum from both venous blood (collected by venipuncture) and from capillary blood (collected by
finger-prick and stored as DBS). More information on the RBP-EIA is available

Indicators and Methods for Cross-Sectional Surveys of Vitamin and Mineral Status of Populations 91
(http://www.path.org/technos/ht_rbp_eia.htm). At this time the recommendation is that the preferred
methods for assessing vitamin A status is through serum retinol and that RBP may be a promising
alternative once sufficient investigations have been performed. See also the report by Erhardt et al.24
A2.1.3 VAD clinical and morphologic indicators While clinical or functional indicators of VAD are generally not recommended for routine cross-sectional
surveys, they deserve mention. Clinical indicators of VAD include xerophthalmia which comprises a
succession of eye signs that worsen as the depletion of vitamin A stores progresses compromising the
integrity of retinal, conjunctival and corneal epithelia: night blindness (XN), Bitot's spots (X1B), corneal
xerosis (X2), corneal ulceration (X3A), and corneal keratomalacia (X3B). Because clinical
xerophthalmia is a rare event, even in areas where VAD is endemic, it is necessary to examine a large
number of children in order to gain statistically precise estimates, and therefore its assessment is often
prohibitive. The prevalence of night blindness in women during a pregnancy within the previous three
years may be a useful indicator in populations with a local term for night blindness; a prevalence >5%
would indicate significant VAD.13 Efforts have been developed using dark adaptometry as a non-invasive
approach to assessing VAD.
A2.1.4 VAD control program indicators (supplementation, fortification, and dietary diversification)
Indicators of control programs for vitamin A deficiency are described in the next two sections. These are
indicators of vitamin A supplement coverage, vitamin A-fortified product coverage, and dietary
diversification.
A2.1.4.i Vitamin A supplementation coverage
One of the most widely implemented interventions for the control of VAD is vitamin A supplementation.
Most vitamin A supplementation programs are targeted to preschool children with high doses of vitamin
A (usually from capsules). The distribution of vitamin A supplements may be delivered through routine
health services or as part of national or sub-national “immunization days” or “child health” days, usually
every 6 months. Vitamin A supplements may also be used therapeutically in the management of
infectious diseases. In many countries vitamin A supplements are provided to post-partum women up to

Indicators and Methods for Cross-Sectional Surveys of Vitamin and Mineral Status of Populations 92
eight weeks following delivery to increase stores of vitamin A and in turn, the concentration of vitamin A
in breast milk. In order to estimate coverage, the percentage of children receiving at least one high-dose
of vitamin A within the previous six months is often used as the primary indicator. For post-partum
women, the proportion receiving a vitamin A capsule within eight weeks of their last birth could be
determined, usually with a time period limit (e.g., among women having a birth within the previous three
or four years).
A2.1.4.ii Fortified Vitamin A product coverage
Foods that can be fortified with vitamin A with relatively low cost include cooking oil, sugar, and flour.
Countries with programs to reduce the prevalence of VAD through food fortification will usually want to
assess the coverage of the fortified products. For monitoring fortification programs, it is appropriate to
estimate the percentage of households with a vitamin A fortified product. If possible, the brand name,
manufacturer, and whether the package is labelled as fortified should be collected.
A2.1.4.iii Dietary intake of Vitamin A
For large cross-sectional surveys on vitamin A status, as a general rule it is not recommended to include
food frequency or 24 hour food recall modules to assess micronutrient status. If a country has specific
interventions to increase the intake of certain vitamin A rich foods, then it might be useful to assess these
specific foods. Some background information on vitamin A dietary intake is provided below.
Vitamin A deficiency is primarily caused by an inadequate intake of vitamin A in the diet. Until
recently, it was believed that the consumption of plant sources of vitamin A, particularly green leafy
vegetables (provitamin A carotenoids) would provide sufficient vitamin A to meet physiological needs. It
is now recognized that these are less bioavailable and convertible to the form of vitamin A that is used by
the body (preformed retinol) than previously thought. Animal foods, such as liver, milk, and eggs,
provide the form of vitamin A that is readily available for physiological functions. In addition, β-carotene
from yellow/orange fleshed fruits and vegetables is better absorbed than the β-carotene in green leafy
vegetables.25 Methods to measure vitamin A intake should include a distinction between the various
sources of vitamin A in the diet.
Two techniques developed and used in the field for the assessment of vitamin A intake are the “24-
hour Vitamin A Semi-Quantitative (VASQ)” and the “HKI Food Frequency Method” developed by Helen
Keller International (HKI).26

Indicators and Methods for Cross-Sectional Surveys of Vitamin and Mineral Status of Populations 93
A2.2 Iron Deficiency Anemia (IDA)
An important issue is to distinguish between anemia, iron deficiency (ID), and iron deficiency anemia
(IDA). Anemia is usually defined by a low hemoglobin (Hb) concentration and in some settings is used
as a proxy indicator for iron deficiency. In addition to iron deficiency, other factors that may cause
anemia include:
• Malaria
• Blood loss due to infection (e.g., hookworm, shistosomiasis)
• Other causes of blood loss (e.g., hemorrhage in childbirth, trauma)
• Deficits in other nutrients (e.g., vitamin A, folic acid)
Iron deficiency anemia (IDA) is defined as individuals who are both anemic (based on low
hemoglobin) and iron deficient (based on an indicator of iron status). Recommended indicators of iron
status are serum ferritin and serum transferrin receptor.
To understand the etiology of anemia, factors in addition to iron status may require investigation. For
example, in areas where malaria and/or hookworm are known to be prevalent, it would be useful to
determine infection status in survey participants to estimate the impact of these infections on prevalence
of iron deficiency and anemia.
The relationship between iron deficiency (ID), iron deficiency anemia (IDA) and anemia is presented
graphically in Figure A2.1. The level of overlap between ID, IDA and anemia will vary from population
to population, and within populations, such as between different age groups, gender, and geographic areas
depending on the severity of iron deficiency and the presence of other causes of anemia. In Figure A2.1,
two populations with the same prevalence of anemia are presented. In setting A, the prevalence of ID in
the population is high, as is the prevalence of IDA, while other causes of anemia are infrequent. In setting
B, the prevalence of iron deficiency is not as widespread as in Setting A, but other factors, perhaps
hookworm or malaria, are important causes of anemia.
The information on etiology of anemia is very important in designing intervention programs, as the
most effective strategies to prevent and control anemia will be those which address the main factors
implicated in its etiology.

Indicators and Methods for Cross-Sectional Surveys of Vitamin and Mineral Status of Populations 94
Figure A2.1 Relationship between iron deficiency, iron deficiency anemia, and anemia
Adapted from Yip R. Iron nutrition status define. In: Filer IJ, ed. Dietary Iron: birth to two years. New York, Raven Press, 1989:19-36; and WHO/NHD/01.3
While it is recognized that assessment of factors associated with anemia may be necessary, it is not
the focus of this manual. Consequently, this document does not describe procedures for the collection of
stool samples for estimating the incidence and burden of helminth infection or the collection of blood to
determine the presence of malaria. Some resources for the collection of information on helminth
infection and malaria are presented below:
• WHO. Report of the WHO informal consultation on hookworm infection and anaemia in girls and women. WHO/CTD/SIP/96.1. Geneva: World Health Organization, 1994. http://www.who.int/ctd/schisto/96-1.pdf
• Centers for Disease Control and Prevention, Division of Parasitic Diseases. A good summary of hookworm infection with a section on lab analysis. http://www.dpd.cdc.gov/dpdx/HTML/Hookworm.htm
• WHO. “Hookworm Infection and Anemia: Approaches to prevention and control”. Geneva: WHO, 1991. • WHO. 'Bench Aids for the Diagnosis of Malaria Infections' (1999) WHO, ISBN: 92 4 154524 0 • 'Diagnosis of malaria: review of alternatives to conventional microscopy' (1999) Hanscheid T., Clin. Lab.
Haem. 21, 235-245. • Medical Laboratory Manual for Tropical Countries, Monica Cheesbrough Edition:2ND Edition.
ISBN:0407004025, July 1987. Butterworth-Heinemann • General resource from WHO
http://mosquito.who.int/cmc_upload/0/000/015/867/epidemioligical_lg-en.pdf

Indicators and Methods for Cross-Sectional Surveys of Vitamin and Mineral Status of Populations 95
A2.2.1 Hemoglobin as the primary indicator of anemia
Hematologic indicators for anemia include hemoglobin, hematocrit, mean cell volume, and red blood cell
distribution width. It is recommended that hemoglobin be used for assessing anemia in cross-sectional
surveys. For assessing the prevalence of IDA, it is recommended that countries collect data on
hemoglobin and one biochemical test for iron deficiency.
The largest proportion of iron utilized for physiological functions is in the form of hemoglobin which
accounts for almost two-thirds of total body iron.8 To define anemia, WHO has established cut-off points
for hemoglobin as outlined in Table A2.2. Hemoglobin values should be adjusted to take into account
pregnancy, altitude, and smoking. The adjustments and the reasons they need to be made are described in
more detail in two documents, one by UNICEF/UNU/WHO (2001) and INACG (2002). Preference was
given to adjustments by UNICEF/UNU/WHO for Tables A2.2 and A2.3. These two documents adjust
cutoff points for each individual; in this document, the approach provided below adjusts each individual’s
hemoglobin value and the cutoff value for each group does not change. The adjustments for pregnancy
are in Table A2.3. If the exact trimester is not known, there is an overall adjustment for pregnancy.
Populations living at high altitudes where oxygen pressure is low have acclimated to their low oxygen
environment and have higher levels of Hb, reduced oxygen saturation, and an increased production of red
blood cells to ensure oxygen supply to tissues. Because of these factors, their Hb distributions are shifted
to the right (upward). This physiological characteristic results in identification of fewer cases of anemia
if cut-off points used to classify anemia for populations living at sea level are applied to those populations
living at higher altitudes.27 A correction for altitude was based on results from the Centers for Disease
Control and Prevention (CDC)28 and presented in Table A2.3.
Adjustments for current cigarette smoking are presented in Table A2.3. These adjustments are based on the average number of cigarettes per day.
A proposed scheme to classify the public health significance of anemia in a population is presented in
Table A2.4. For populations with a prevalence of anemia >40%, the prevalence would be interpreted as
being severe in terms of public health significance.

Indicators and Methods for Cross-Sectional Surveys of Vitamin and Mineral Status of Populations 96
Table A2.2 Hemoglobin cutoffs to define anemia in people living at sea level Age and sex Hemoglobin cutoff (g/dL) Children (males and females) >0.5, <5.0 years 11.0 >5.0, <12.0 years 11.5 >12.0, <15.0 years 12.0 Nonpregnant females > 15.0 years 12.0 Men > 15.0 years 13.0 UNICEF/UNU/WHO (2001) and INACG (2002)
Table A2.3 Hemoglobin adjustment for pregnancy, altitude, cigarette smoking, and ethnicity Trimester of pregnancy Adjustment to individual hemoglobin value (g/dL) First +1.0 Second +1.5 Third +1.0 Trimester unknown +1.0 Altitude (meters) <1000 No adjustment >1000, <1250 -0.2 >1250, <1750 -0.5 >1750, <2250 -0.8 >2250, <2750 -1.3 >2750, <3250 -1.9 >3250, <3750 -2.7 >3750, <4250 -3.5 >4250, <4750 -4.5 >4750, <5250 -5.5 >5250 -6.7 Cigarettes smoked per day <10 No adjustment >10, < 20 -0.3 >20, < 40 -0.5 >40 -0.7 Smoker, amount unknown -0.3 Ethnicity African extraction +1.0 Notes: The INACG document has adjustments by trimester; the UNICEF/UNU/WHO and INACG documents provide adjustments for pregnant vs. not pregnant. For altitude, the hemoglobin adjustments are based on the UNICEF/UNU/WHO document except for the highest two altitude values, which are based on the INACG document. A more accurate adjustment for altitude can be made based on the application of a formula.

Indicators and Methods for Cross-Sectional Surveys of Vitamin and Mineral Status of Populations 97
Table A2.4 Proposed classification of public health significance of anemia in a population on the basis of prevalence estimated from blood levels of haemoglobin.
Category of public health significance Prevalence of anemia Severe > 40% Moderate 20.0-39.9% Mild 5.0-19.9% Normal < 4.9% Source: WHO 2001 (WHO/NHD/01.3)
At the individual level, severe anemia in pregnancy is defined as hemoglobin <7 g/dL; very severe
anaemia in pregnancy is defined as hemoglobin <4 g/dL.
The recommended methods for measuring hemoglobin are the cyanmethemoglobin method and the
HemoCueTM system (see Figure A2.2). The reference ‘standard’ for Hb measurement is
cyanmethemoglobin.29 The HemoCueTM is a portable dual-wave length photometer based on the
laboratory procedure for the analysis of azide methemoglobin using disposable cuvettes coated with
sodium azide (HemoCueTM AB, Angelholm, Sweden; www.hemocue.se).30 Capillary blood from a finger
prick is collected by capillary action in a cuvette, which is then placed in the photometer which displays
the Hb level within one minute. Operating the HemoCueTM does not require specialized laboratory
personnel and the instrument may be operated on four AA batteries, which make it particularly useful in
the field. The procedures for specimen collection and analysis using the HemoCue require careful
training and standardization of survey technicians.31 32
Figure A2.2 HemoCue instrument
The HemoCueTM has been validated against traditional hemoglobin laboratory methods and found to
have adequate accuracy and precision. Each machine costs approximately US$500 and the costs per
cuvette is approximately US$0.50 when procured through UNICEF. The accuracy of hemoglobin
measurement may be improved by first collecting 250-500 μl of blood in a microtainer, mixing the blood,
and then performing a hemoglobin analysis from blood in the microtainer. While most of the field
Indicators and Methods for Cross-Sectional Surveys of Vitamin and Mineral Status of Populations 98
experience in the use of portable hemoglobinometers has been with the HemoCueTM , there are other
portable hemoglobinometers available produced by other manufacturers.
Finally, one important feature of Hb as an indicator of anemia is that its distribution among sub-
groups of the population can provide information concerning its etiology. If low intake of dietary iron
and/or low iron bioavailability is the main cause of anemia, then women and young children will be
disproportianately affected compared to adult men. On the other hand, if other causes of anemia (e.g.,
malaria, infectious disease) are also common, then the Hb distributions of men will also be shifted to
lower values.
A2.2.2 Indicators for assessing iron status
There are several tests available to determine iron status. WHO has recommended the use of serum
ferritin (SF) and transferrin receptor (sTfR) for one-time assessments of iron-status, and serum ferritin for
ongoing monitoring.33 The following sections describe these two indicators of iron status.
A2.2.2.i Serum ferritin (SF)
Serum ferritin is the most specific biochemical test that correlates with total body iron stores. A low
serum ferritin level reflects depleted iron stores and hence is a precondition for iron deficiency in the
absence of infection. However, serum ferritin is also an acute-phase reactant and is elevated in response to
infectious or inflammatory processes. Consequently, serum ferritin in the normal range reflects iron
sufficiency in the absence of infections of inflammatory illness and interpretation of serum ferritin is
problematic in populations in which the incidence of infection is high.
Serum ferritin cut-offs indicating iron depletion are presented in Table A2.5. The generally accepted
cut-off level for iron depletion for most segments of the population using serum ferritin is <15 μg/l, while
a cut-off of <12 μg/l is used for preschool children under 5 years of age.
A number of commerical assays are available for the assessment of serum ferritin. The costs per test
depends on the kit, but is generally around US$8.

Indicators and Methods for Cross-Sectional Surveys of Vitamin and Mineral Status of Populations 99
Table A2.5 Relative extent of iron stores on the basis of serum ferritin concentration; by age and sex Serum ferritin (μg/l)* Less than 5 years of age More than 5 years of age Iron Stores Male Female Male Female Depleted iron stores <12 <12 <15 <15 Severe risk of iron overload - - >200
(adult male) >150
(adult female) Source: WHO 2001 (WHO/NHD/01.3) and modified as recommended by WHO/CDC 2005 (WD 105) *Among those without an elevated acute phase protein
A2.2.2.ii Serum Transferrin Receptor
Serum transferrin receptors (sTfR) are found on cell membranes and allow iron-bound transferrin to enter
the cell. When the iron supply is inadequate, there is an up-regulation of transferrin receptors to enable
the cell to compete more effectively for iron. The number of membrane receptors is in proportion to the
receptors found in plasma. An increase in sTfR levels is seen in patients with iron deficient erythropoiesis
or iron deficiency anemia. The soluble sTfR seems to correlate well with the amount of receptor
expressed at the cell membrane, which in turn reflects the cellular need for iron.34 The sTfR increases
with tissue iron deficiency and with increased erythropoiesis.35 It does not appear to be elevated by
inflammatory diseases36, 37 and low biological and analytic variability has been reported.38
In controlled phlebotomy studies, the sTfR does not increase until iron stores are completely
exhausted.39 When SF falls below 12 μg/l, the sTfR begins to rise, roughly in proportion to the deficit in
functional iron. As mentioned above, the combination of SF and sTfR levels can portray the spectrum of
iron deficiency from normal to severe. This can be demonstrated by plotting body iron status against the
logarithm of the sTfR to SF ratio, resulting in a linear relationship. The sTfR measures the deficit in tissue
iron once ferritin levels drop below 12 μg/l.
Unlike SF, sTfR remains normal in patients with acute or chronic inflammation or liver disease and
appears to be effective in distinguishing iron deficiency anemia from anemia as a result of chronic
disease.40 The normal range for sTfR is 3-9 μg/ml. Levels of three to four times normal have been
reported for iron deficiency anemia.41 42 There is currently no universally agreed normal range for sTfR.
An increase in sTfR is a response during early development of iron deficiency. Levels of sTfR increase
progressively as the supply of iron to the tissues becomes progressively more deficient.
Major advantages of sTfR are that it is not an acute phase reactant and does not vary with age, gender,
or pregnancy. However, sTfR levels may be elevated when there is increased red blood cell production,
turnover, or both, such as in the case of hemolytic anemia.

Indicators and Methods for Cross-Sectional Surveys of Vitamin and Mineral Status of Populations 100
A2.2.2.iii Combination of Serum Ferritin and Serum Transferrin Receptor
The combination of SF and sTfR in populations provides the most complete picture of iron
status. Because serum ferritin levels increase in the presence of inflammation and sTfR, in
general, is not affected by inflammation, the combination of the tests is optimal and the
interpretation of the tests is provided in Table A2.6. Note that the classification proposed in
Table A2.6 requires further validation.
Table A2.6 The interpretation of low serum ferritin and high transferrin receptor concentrations in population surveys: this classification is based on experience of measuring ferritin and transferrin receptor in research studies and requires validation in population surveys.
Percentage of serum ferritin values below thresholda
Percentage of transferrin receptor values above
thresholdb
Interpretation <20%c <10% Iron deficiency is not prevalent <20%c >10% Iron deficiency is prevalent;
Inflammation is prevalent >20%d >10% Iron deficiency is prevalent >20%d <10% Iron depletion is prevalent
Source: WHO/CDC 2005 (WD 105) a Apply thresholds by age group for serum ferritin given in Table A2.5 b Apply thresholds recommended by manufacturer of assay until an international reference standard is available c <30% for pregnant women d >30% for pregnant women
A2.2.3 Iron Deficiency Anemia - Control program indicators Some national programs may have a mix of interventions to address iron deficiency, such as iron
supplementation of high prevalent groups, food fortification, and dietary approaches.
A2.2.3i Iron Supplementation Coverage In many countries the main intervention for controlling anemia is the routine use of iron supplements
during pregnancy. Although other strategies may be part of national programs, one of the imprortant
indicators is to estimate the proportion of pregnant women who are receiving and/or taking iron
supplements. In some circumstances it may be useful to identify factors of non-compliance and
determine the characteristics of women are taking supplements compared to those who do not. An
important constraint to the effective implementation of iron supplementation has been a lack of awareness
and compliance among targeted women, and the survey could provide an opportunity to understand some
of these factors. Use of qualitative methods, such as in-depth interviews or focus groups prior to the
survey would assist in the development of relevant questions and responses. As with any of the program
indicators based on recall, it is important to standardize the questions and field test them before

Indicators and Methods for Cross-Sectional Surveys of Vitamin and Mineral Status of Populations 101
implementation. In order to ‘validate’ recall of iron supplement compliance, it is possible to use
quantitative measures, such as the iron content in stools, but this is more often applied in research settings
rather than in large population-based surveys.
In countries with a high prevalence of anemia in children, there may be programs to provide iron
supplments to this group. As with women, the coverage of iron supplementation in children could be
assessed.
A2.2.3ii Iron Fortification of Food
A number of food items can be fortified with iron, such as flour and complementary foods. Countries
with fortification programs will most likely want to assess the proportion of households using fortified
products. For some fortified foods it may to be useful to obain a small sample of the food for laboratory
analysis. If possible, the brand name, manufacturer, and whether the package is labelled as fortified
should be collected.
A2.2.3iii Dietary-Related Factors
Certain foods contain substances that enhance or inhibit dietary iron absorption. Tea and coffee
consumption during a meal can inhibit iron absorption. Red meats have highly absorbable iron and
enhance the absorption of iron from other foods.8 Vitamin C enhances iron absorption. Some countries
may have public health interventions concerning dietary approaches to improve iron status and therefore
may want to assess the knowledge, attitudes, and practices concerning these messages and people’s
experiences with and preceptions of the intervention. In newborns, exclusive breastfeeding is an effective
way to improve iron deficiency in infants less than 6 months of age.8 As a general rule we would not
recommend a comprehensive dietary assessment to estimate iron intake. However, for countries that feel
a dietary assessment wold be useful, the International Life Science Institute (ILSI) has a tool for the
assessment of iron intake, “An Interactive 24-hour Recall for Assessing the Adequacy of Iron and Zinc
Intakes in Developing Countries” (http://www.ilsi.org/file/Recall.pdf).
A2.3 Iodine Deficiency
The primary indicator of iodine deficiency is urinary iodine concentration (UI) and the primary measure
of coverage in most areas is the proportion of households using adequately iodized salt (Table A2.7).
Details of these and other possible indicators and sustainable elimination criteria can be found
elsewhere.43 Some additional details of urinary iodine and salt iodine levels are described next.

Indicators and Methods for Cross-Sectional Surveys of Vitamin and Mineral Status of Populations 102
Table A2.7 Summary of criteria for monitoring progress towards sustainable elimination of IDD Indicators Goals Salt iodization - Proportion of households using adequately iodized salt* > 90% Urinary iodine - Proportion of school-age children with a UI below 100 μg/l < 50% - Proportion of school-age children with a UI below 50 μg/l < 20% *Internationally defined as >15 ppm Source: WHO/NHD/01.1, 2001
Although there are other clinical and biological indicators of iodine status, including goiter and
thyroid volume by ultrasonography, these are not recommended for cross-sectional surveys. Measures of
thyroid size are slow to respond to changes in iodine status, such as occurs when a salt iodization program
has been recently implemented, and could provide misleading information on the current status of iodine
deficiency in a population.44
A2.3.1 Urinary iodine as the primary indicator of iodine nutrition
For iodine deficiency, there are two goals: fewer than 50% of school-age children with urine specimens
having an iodine concentration less than 100 μg/l and fewer than 20% of school-age children with urine
specimens having an iodine concentration less than 50 μg/l (Table A2.7). Some important features of UI
include:
• Most survey participants are willing to provide urine specimens
• Only a small amount of urine is required (0.5-1.0 ml) for laboratory testing
• UI is a good marker of recent dietary iodine intake of the population
• In individuals, UI varies throughout the day and from day to day, therefore a single UI is not a
useful indicator of iodine status at the individual level
• Relating iodine to creatinine is unnecessary (per WHO recommendations) 43
• Transportation of urine specimens does not require refrigeration or preservation
Details on urinary specimen storage and iodine laboratory methods can be found elsewhere.43
Urinary iodine assays are relatively simple to perform but require special attention to prevent iodine
contamination of the laboratory area and equipment.
Additional interpretation of urinary iodine based on median levels in school-aged children is
presented in Table A2.8. For school-aged children, an “adequate” iodine intake is defined as a median
urinary iodine in the 100-299 μg/l range. The WHO/UNICEF/ICCIDD document on IDD mentions in
several places that “adult women” can be assessed, however, appropriate urinary iodine cutoffs were not

Indicators and Methods for Cross-Sectional Surveys of Vitamin and Mineral Status of Populations 103
provided. One author has recommended that an adequate iodine intake in adult women is the same as for
school-aged children, and for pregnant and lactating women the recommended median UI is in the 150-
230 μg/l range.45 A more recent WHO consultation recommends a median UI in pregnant women to be
>150 μg/l.(unpublished report)
Table A2.8 provides interpretation of median UI levels in school-age children. Populations with
“insufficient intake” of iodine may be defined as having severe, moderate, or mild iodine deficiency. A
common misinterpretation of Table A2.8 is to state that individuals with a urinary iodine <20 μg/l have
“severe” iodine deficiency, individuals with a urinary iodine 20-49 μg/l have “moderate” iodine
deficiency, and individuals with a urinary iodine 20-49 μg/l have “mild” iodine deficiency. As stated
earlier, casual urine specimens are not useful for classifying individuals, but summary information
(proportion below a cutoff or a median) is useful for classifying populations.
Table A2.8 Epidemiologic criteria for assessing iodine nutrition based on median urinary iodine concentrations in school-aged children
Median urinary iodine (μg/l)
Iodine intake Iodine nutrition
< 20 Insufficient Severe iodine deficiency 20-49 Insufficient Moderate iodine deficiency 50-99 Insufficient Mild iodine deficiency 100-199 Adequate Optimal 200-299 More than adequate
iodine intake Risk of iodine-induced hyperthyroidism within 5 or 10 years following introduction of iodised salt in susceptible groups
>300 Excessive iodine intake
Risk of adverse health consequences (Iodine-induced hyperthyroidism, autoimmune thyroid disease)
Source: WHO/NHD/01.1, 2001
A2.3.2 Salt iodine level
The goal is to have 90% of households using adequately iodized salt (Table A2.7), defined internationally
as >15 ppm. The primary indicator for iodized salt intervention programs is the proportion of households
with iodized salt.
The reference standard for testing iodine in salt is by iodometric titration. A complete iodometric
titration kit can be purchased from UNICEF for approximately US$ 1,000; materials from United States
companies can cost US$2,000 to $3,000. Reagents to process 1,000 salt samples cost approximately
US$330. In testing the level of potassium iodate (KIO3) or potassium iodide (KI) in salt, a salt sample is

Indicators and Methods for Cross-Sectional Surveys of Vitamin and Mineral Status of Populations 104
dissolved in water, sulfuric acid, and KI. This solution is then titrated with sodium thiosulfate in the
presence of a starch indicator until the solution is colorless. The volume of sodium thiosulfate used to turn
the salt solution colorless is then converted to determine the iodine concentration (parts per million) in the
original salt sample. The procedures for measuring KIO3 and KI differ slightly.
Another method for measuring iodine in salt is the WYD Iodine Checker (Salt Research Institute,
China National Salt Industry Corporation). This is a compact filter photometer, was tested independently
by the China National IDD Reference Laboratory, the University of Toronto, and CDC and shown to be
accurate, precise, stable, and easy to use and transport. The WYD Checker uses the same chemical
reaction system as iodometric titration, but removes the titration step and replaces it with a measurement
by a single-wavelength photometer.
At the household frequently a semi-quantitative rapid test kit is used to determine the level of iodine
in salt. There are many simple test kits available that use the principle of reducing iodate to elemental
iodine with excess KIO3 in the presence of dilute acid. The liberated iodine is then reacted with starch
beta-amylase to form a blue complex. Unfortunately, while these test kits provide an immediate result,
their sensitivity and specificity can be low. Most field test kits include a bottle of starch solution and a
color chart for qualitatively determining the level of iodine. The starch solution is dropped on a sample of
salt and the color intensity of the spot indicates the iodine content. UNICEF distributes field test kits
produced by Erirez MBI (Bangalore, India). Each ampule of starch solution can be used to test as many as
100 salt samples and a box of three ampoules costs approximately US$0.50.
We recommend that either the titration method or the WYD Iodine Checker be used in every survey
assessing the iodine content of salt. Either all salt collected in households could be tested or a sub-sample
of salt tested.
A2.3.3 Other Iodine Program-Related Information
If possible, when salt is tested, the brand name, manufacturer of the salt, and whether the package is
labelled as iodized should be collected. In some countries, information concerning the type of salt used,
such as whether it is refined or large crystal, packaged or sold in bulk, might be useful. Some countries
may also ask questions concerning knowledge of iodine deficiencies and iodized salt as well as attitudes
and practices concerning the use of iodized salt.

Indicators and Methods for Cross-Sectional Surveys of Vitamin and Mineral Status of Populations 105
A2.4 Acute Phase Reactant
Infection and trauma are accompanied by an acute phase response, a collection of non-specific changes
which includes the production of proteins to promote inflammation, activate complement, and stimulate
phagocytic cells. The main purpose is to prevent further damage to tissues and remove harmful
molecules and pathogens. During the acute phase response the concentration of some acute phase
proteins (APPs), called positive APPs, increase in the plasma, e.g., C-reactive protein (CRP), α-1 acid
glycoprotein (AGP) and ferritin. Other APPs decrease and are called negative APPs, e.g., retinol binding
protein (RBP), albumin, and transferrin. In many developing countries the prevalence of infection is high
and many individuals will have a low level acute phase response, even some may show no evidence of
clinical disease. An acute phase response will result in a change in many indicators of micronutrient
status, e.g., serum retinol, ferritin, hemoglobin, leading to an over- or under-estimation of deficiency.
Vitamin A and infection interact whereby both exacerbate and increase the vulnerability to the other.
Infection can induce vitamin A deficiency in a variety of ways depending on the cause, duration, and
severity of infection. Vitamin A status is estimated by measuring plasma or serum retinol, but because
serum retinol is lowered by clinical and sub-clinical infection, the serum retinol measurements may
overestimate the prevalence of vitamin A deficiency in a population with a high prevalence of infection.
To deal with the problem of potentially overestimating the prevalence of vitamin A deficiency, it would
be useful to measure one or more APPs in the survey.
A meta-analysis by Thurnham et al.,46 suggested two approaches for correcting serum retinol for the
presence of sub-clinical infection: the first is to use the serum retinol concentrations of only those
individuals classed as “healthy”, i.e., without an elevated APP. The second approach is to use a
correction factor for serum retinol based on the number of individuals with elevated APPs, with the
authors providing correction factors.
Calculating the prevalence of low retinol concentrations in the “healthy” group of a population to
estimate the prevalence of vitamin A deficiency is straightforward, but might result in small sample sizes,
especially in areas where there is a high prevalence of infection such as malaria. There is also concern
that healthy individuals may not be truly representative of the population which could bias the prevalence
of VAD downward.
While infection affects some of the other indicators of micronutrient status, there has been no meta-
analysis to establish whether a correction can be done.

Indicators and Methods for Cross-Sectional Surveys of Vitamin and Mineral Status of Populations 106

Indicators and Methods for Cross-Sectional Surveys of Vitamin and Mineral Status of Populations 107
Appendix 3 Modified UNICEF Multiple Indicator Cluster
Survey (MICS) Questionnaires
In this appendix is a modified form of the UNICEF MICS questionnaires that relate to micronutrients
(and factors that may affect micronutrient status) and anthropometry and is presented here as an example.
In general, there is a household questionnaire in which the household salt is tested for iodine. This is
followed by a questionnaire for a woman that collects information on vitamin A capsules after birth.
Next, information on children is collected. This has information on each child, their breastfeeding status,
whether the child has or has recently had a diarrheal or upper respiratory illness and treatment provided
for the illness, questions related to malaria, and then anthropometry. For more information on the
UNICEF MICS please visit www.childinfo.org.

Indicators and Methods for Cross-Sectional Surveys of Vitamin and Mineral Status of Populations 108
HOUSEHOLD QUESTIONNAIRE WE ARE FROM (country-specific affiliation). WE ARE WORKING ON A PROJECT CONCERNED WITH FAMILY
NUTRITION. I WOULD LIKE TO TALK TO YOU ABOUT THIS. THE INTERVIEW WILL TAKE ABOUT (number) MINUTES. ALL THE INFORMATION WE OBTAIN WILL REMAIN STRICTLY CONFIDENTIAL AND YOUR ANSWERS WILL NEVER BE IDENTIFIED. DURING THIS TIME I WOULD LIKE TO SPEAK WITH THE HOUSEHOLD HEAD AND ALL MOTHERS OR OTHERS WHO TAKE CARE OF CHILDREN IN THE HOUSEHOLD.
MAY I START NOW? If permission is given, begin the interview. HOUSEHOLD INFORMATION PANEL HH
HH1. Cluster number: HH2. Household number: ___ ___ ___ ___ ___ ___
HH3. Interviewer name and number: HH4. Supervisor name and number: Name ___ ___
Name ___ ___
HH5. Day/Month/Year of interview: ___ ___ / ___ ___ / ___ ___ ___ ___
HH6. Area: Urban....................................................... 1 Rural........................................................ 2
HH7. Region: Region 1 ..................................................1 Region 2 ..................................................2 Region 3 ..................................................3 Region 4 ..................................................4
HH 8. Name of head of household: _____________________________________________________
After all questionnaires for the household have been completed, fill in the following information:
HH10. Respondent to HH questionnaire: Name: Line No: ___ ___
HH11. Total number of household members:
HH9. Result of HH interview:
Completed ............................................... 1
Not at home............................................. 2 Refused ................................................... 3 HH not found/destroyed .......................... 4
Other (specify) .................................................. 6 ___ ___
HH12. No. of women eligible for interview: HH13. No. of eligible women questionnaires
completed: ___ ___ ___ ___
HH14. No. of children under age 5: HH15. No. of under-5 questionnaires completed: ___ ___ ___ ___

Indicators and Methods for Cross-Sectional Surveys of Vitamin and Mineral Status of Populations 109
INTERVIEWER/SUPERVISOR NOTES: Use this space to record notes about the interview with this household, such as call-back times, incomplete individual interview forms, number of attempts to re-visit, etc. HH16. Data entry clerk: ___ ___

Indicators and Methods for Cross-Sectional Surveys of Vitamin and Mineral Status of Populations 110
Cluster number: __ __ __ Household number: __ __ __
Household Listing Form FIRST, PLEASE TELL ME THE NAME OF EACH PERSON WHO USUALLY LIVES HERE, STARTING WITH THE HEAD OF THE HOUSEHOLD. List the head of the household in line 01. List all household members names (HL2), and their sex (HL4). Then ask: ARE THERE ANY OTHERS WHO LIVE HERE, EVEN IF THEY ARE NOT AT HOME NOW? (THESE MAY INCLUDE CHILDREN IN SCHOOL OR AT WORK). If yes, complete listing. Add a continuation sheet if there are more than 20 household members. Tick here if continuation sheet used Eligible for: Women’s
Module Child’s Module
HL1. Line No.
HL2. Name
HL3. Sex
1=Male 2=Female M F
HL4. How old is
(name) in years?
HL5. Circle if Female
AND 15-49 years (up to 50th birthday)
HL6. Circle if <5 years old
01 1 2 01 01
02 1 2 02 02
03 1 2 03 03
04 1 2 04 04
05 1 2 05 05
06 1 2 06 06
07 1 2 07 07
08 1 2 08 08
09 1 2 09 09
10 1 2 10 10
11 1 2 11 11
12 1 2 12 12
13 1 2 13 13
14 1 2 14 14
15 1 2 15 15
16 1 2 16 16
17 1 2 17 17
18 1 2 18 18
19 1 2 19 19
20 1 2 20 20
Totals ___ ___ ___ ___

Indicators and Methods for Cross-Sectional Surveys of Vitamin and Mineral Status of Populations 111
Cluster number __ __ __ Household number __ __ __ I WOULD LIKE TO TALK TO THE PERSON WHO DOES MOST OF THE COOKING FOR THE HOUSEHOLD. Ask the following questions to the person who prepares most meals for the household.
SALT IODIZATION MODULE SI SI1. WE WOULD LIKE TO CHECK WHETHER THE SALT
USED IN YOUR HOUSEHOLD IS IODIZED. MAY I SEE A SAMPLE OF THE SALT USED TO COOK THE MAIN MEAL EATEN BY MEMBERS OF YOUR HOUSEHOLD LAST NIGHT?
Once you have examined the salt, circle number that corresponds to test outcome.
Not iodized 0 PPM ......................................1 Less than 15 PPM .......................................2 15 PPM or more ..........................................3 No salt in home............................................6 Salt not tested..............................................7
Also, ask permission to take a small sample of salt for later analysis. If permission given, collect and label salt specimen. SI2. Was a salt sample collected?
Yes...............................................................1
No ................................................................2
SI3. MAY WE SEE THE ORIGINAL PACKAGE FOR THE SALT? Provide the most appropriate response.
Package not available .................................1
Package available - labeled iodized ............2
Package available - NOT labeled as iodized3
1 FF1
SI4. Please write the brand name of the salt
____________________________________
FOOD FORTIFICATION ** FF
FF1. WE WOULD LIKE TO KNOW IF SOME FOOD PRODUCTS ARE USED IN YOUR HOUSEHOLD. DO YOU HAVE [FORTIFIED FOOD PRODUCT] IN THE HOUSE?
REPEAT FOR EACH FORTIFIED FOOD
Yes.............................................................. 1
No ............................................................... 2
DK............................................................... 8
*Note to individual developing questionnaire and data entry; there are different salt kits, the most common kit providing potassium iodate in ppm as 0, 7, 15, and 30. There are kits available with different ppm values and kits for potassium iodide. Some countries may want to take a sample of salt for iodine titration testing, requiring a question concerning whether a sample of salt was obtained from this household. **This is a general food fortification questions that would need to be modified for each country. For example, some countries fortify flour with iron and folate and may ask flour-related questions; others that fortify sugar with vitamin A and may want to ask sugar-related questions. Similar to salt, it may be useful to collect information on the brand name and whether the packaging is labeled as fortified.

Indicators and Methods for Cross-Sectional Surveys of Vitamin and Mineral Status of Populations 112
QUESTIONNAIRE FOR INDIVIDUAL WOMEN
WOMEN’S INFORMATION PANEL WMThis module is to be administered to all women age 15 through 49 years (see column HL5 of HH listing). Fill in one form for each eligible woman Fill in the cluster and household number, and the name and line number of the woman in the space below. Fill in your name, number and the date. WM1. Cluster number: WM2. Household number:
___ ___ ___ ___ ___ ___
WM3. Woman’s Name: WM4. Woman’s Line Number: ___ ___
WM5.Interviewer name and number: WM6. Day/Month/Year of interview:
___ ___ / ___ ___ / ___ ___ ___ ___ WM7. Result of women’s interview Completed ...................................................1
Not at home.................................................2 Refused .......................................................3 Partly completed..........................................4 Incapacitated ...............................................5 Other (specify) _____________________ 6
Repeat greeting if not already read to this woman: WE ARE FROM (country-specific affiliation). WE ARE WORKING ON A PROJECT CONCERNED WITH FAMILY
NUTRITION. I WOULD LIKE TO TALK TO YOU ABOUT THIS. THE INTERVIEW WILL TAKE ABOUT (number) MINUTES. ALL THE INFORMATION WE OBTAIN WILL REMAIN STRICTLY CONFIDENTIAL AND YOUR ANSWERS WILL NEVER BE IDENTIFIED. ALSO, YOU ARE NOT OBLIGED TO ANSWER ANY QUESTION YOU DON’T WANT TO, AND YOU MAY WITHDRAW FROM THE INTERVIEW AT ANY TIME. MAY I START NOW?
If permission is given, begin the interview. If the woman does not agree to continue, thank her, complete WM7, and go
to the next interview. Discuss this result with your supervisor for a future revisit. WM8. IN WHAT MONTH AND YEAR WERE YOU
BORN? WM6. DOB of woman: Day/Month/Year ___ ___ / ___ ___ / ___ ___ ___ ___
WM9. HOW OLD WERE YOU AT YOUR LAST BIRTHDAY?
Age (in completed years) ..................... __ __
WM10. ARE YOU CURRENTLY PREGNANT? Yes .............................................................. 1 No................................................................ 2 DK/Not sure ................................................ 8
WM11. ARE YOU CURRENTLY MARRIED OR LIVING TOGETHER WITH A MAN AS IF MARRIED?
Yes, currently married................................. 1 Yes, living with a man ................................. 2 No, not in union........................................... 3

Indicators and Methods for Cross-Sectional Surveys of Vitamin and Mineral Status of Populations 113
WM12. HAVE YOU EVER ATTENDED SCHOOL?
Yes .............................................................. 1 No................................................................ 2
2 WM16
WM13. WHAT IS THE HIGHEST LEVEL OF SCHOOL YOU ATTENDED: PRIMARY, SECONDARY, OR HIGHER?
Primary........................................................ 1 Secondary................................................... 2 Higher.......................................................... 3 Non-standard curriculum............................. 6
WM14. WHAT IS THE HIGHEST GRADE YOU COMPLETED AT THAT LEVEL?
Grade ................................................... __ __
WM15. Check WM13:
Secondary or higher. Go to Next Module
Primary or non-standard curriculum. Continue with WM16 WM16. NOW I WOULD LIKE YOU TO READ THIS
SENTENCE TO ME. Show sentences to respondent. If respondent cannot read whole sentence, probe: CAN YOU READ PART OF THE SENTENCE TO ME? Example sentences for literacy test: 1. The child is reading a book. 2. The rains came late this year. 3. Parents must care for their children. 4. Farming is hard work.
Cannot read at all........................................ 1 Able to read only parts of sentence ............ 2 Able to read whole sentence ...................... 3 No sentence in required language_________________ 4 (specify language) Blind/mute, visually/speech impaired.......... 5
MATERNAL AND NEWBORN HEALTH MODULE MNThis module is to be administered to all women with a live birth in the 2 years preceding date of interview. Record name of last-born child here _____________________. Use this child’s name in the following questions, where indicated. MN1. NOW I WOULD LIKE TO ASK ABOUT ALL THE
BIRTHS YOU HAVE HAD DURING YOUR LIFE. HAVE YOU EVER GIVEN BIRTH?
If “No” probe by asking: I MEAN, TO A CHILD WHO EVER BREATHED OR
CRIED OR SHOWED OTHER SIGNS OF LIFE – EVEN IF HE OR SHE LIVED ONLY A FEW MINUTES OR HOURS?
Yes .............................................................. 1 No................................................................ 2
2 next module
MN2. OF THESE (total number) BIRTHS YOU HAVE
HAD, WHEN DID YOU DELIVER THE LAST ONE
(EVEN IF HE OR SHE HAS DIED)?
If day is not known, enter ‘98’ in space for day.
Date of last birth
Day/Month/Year .....__ __/__ __/__ __ __ __
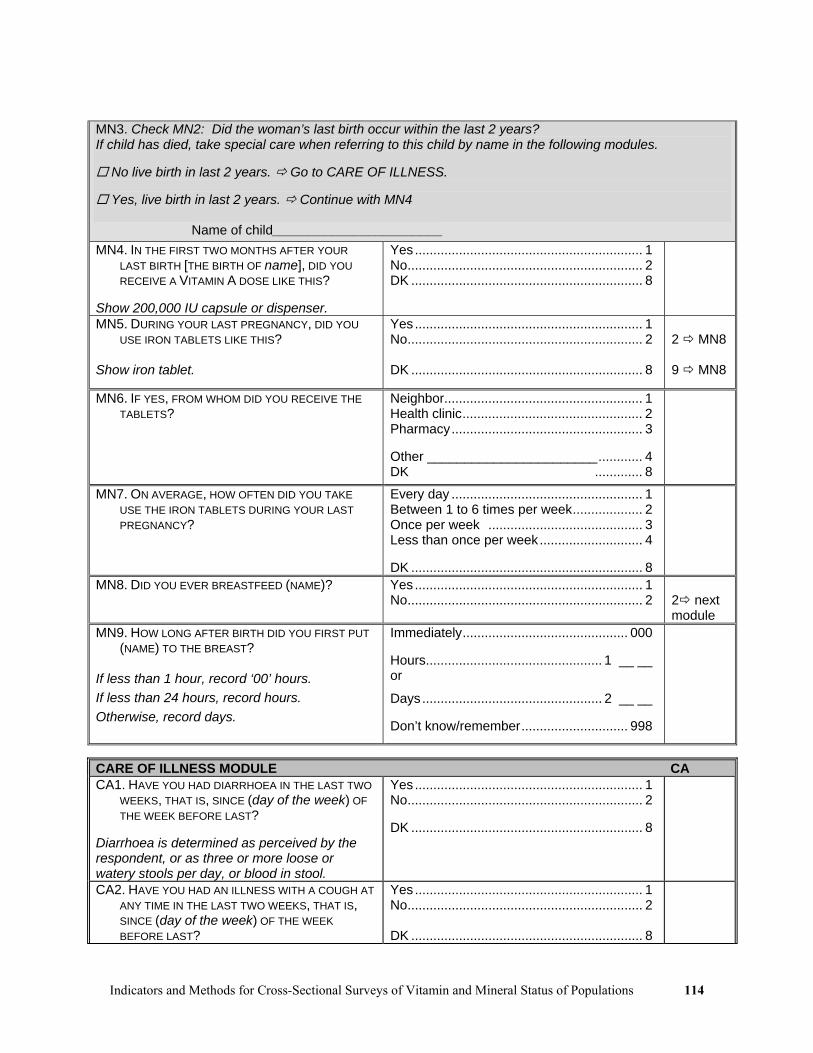
Indicators and Methods for Cross-Sectional Surveys of Vitamin and Mineral Status of Populations 114
MN3. Check MN2: Did the woman’s last birth occur within the last 2 years? If child has died, take special care when referring to this child by name in the following modules.
No live birth in last 2 years. Go to CARE OF ILLNESS.
Yes, live birth in last 2 years. Continue with MN4 Name of child_______________________ MN4. IN THE FIRST TWO MONTHS AFTER YOUR
LAST BIRTH [THE BIRTH OF name], DID YOU RECEIVE A VITAMIN A DOSE LIKE THIS?
Show 200,000 IU capsule or dispenser.
Yes.............................................................. 1 No................................................................ 2 DK ............................................................... 8
MN5. DURING YOUR LAST PREGNANCY, DID YOU USE IRON TABLETS LIKE THIS?
Show iron tablet.
Yes .............................................................. 1 No................................................................ 2 DK ............................................................... 8
2 MN8 9 MN8
MN6. IF YES, FROM WHOM DID YOU RECEIVE THE TABLETS?
Neighbor...................................................... 1 Health clinic................................................. 2 Pharmacy.................................................... 3 Other _______________________............ 4 DK ............. 8
MN7. ON AVERAGE, HOW OFTEN DID YOU TAKE USE THE IRON TABLETS DURING YOUR LAST PREGNANCY?
Every day .................................................... 1 Between 1 to 6 times per week................... 2 Once per week .......................................... 3 Less than once per week............................ 4 DK ............................................................... 8
MN8. DID YOU EVER BREASTFEED (NAME)? Yes .............................................................. 1 No................................................................ 2
2 next module
MN9. HOW LONG AFTER BIRTH DID YOU FIRST PUT (NAME) TO THE BREAST?
If less than 1 hour, record ‘00’ hours. If less than 24 hours, record hours. Otherwise, record days.
Immediately............................................. 000 Hours................................................ 1 __ __ or
Days................................................. 2 __ __ Don’t know/remember............................. 998
CARE OF ILLNESS MODULE CA CA1. HAVE YOU HAD DIARRHOEA IN THE LAST TWO
WEEKS, THAT IS, SINCE (day of the week) OF THE WEEK BEFORE LAST?
Diarrhoea is determined as perceived by the respondent, or as three or more loose or watery stools per day, or blood in stool.
Yes.............................................................. 1 No................................................................ 2 DK ............................................................... 8
CA2. HAVE YOU HAD AN ILLNESS WITH A COUGH AT ANY TIME IN THE LAST TWO WEEKS, THAT IS, SINCE (day of the week) OF THE WEEK BEFORE LAST?
Yes .............................................................. 1 No................................................................ 2 DK ............................................................... 8

Indicators and Methods for Cross-Sectional Surveys of Vitamin and Mineral Status of Populations 115
CA3. HAVE YOU HAD AN ILLNESS WITH A FEVER AT ANY TIME IN THE LAST TWO WEEKS, THAT IS, SINCE (day of the week) OF THE WEEK BEFORE LAST?
Yes .............................................................. 1 No................................................................ 2 DK ............................................................... 8
TEA/COFFEE CONSUMPTION TC TC1. DO YOU DRINK TEA OR COFFEE? Yes .............................................................. 1
No................................................................ 2 DK ............................................................... 8
2 next module 8 next module
TC2. HOW OFTEN DO YOU DRINK TEA OR COFFEE? Usually every day........................................ 1 Usually 1 to 6 times per week..................... 2 Usually around once per week ................... 3 Less than once per week............................ 4 DK ............................................................... 8
TC3. WHEN YOU DRINK TEA OR COFFEE, DO YOU USUALLY DRINK IT DURING A MEAL?
Yes .............................................................. 1 No................................................................ 2 DK ............................................................... 8
SPECIMEN COLLECTION SC1. Was a urine sample collected from the
woman?
Yes .............................................................. 1 No................................................................ 2 DK ............................................................... 8
SC2. Was a finger stick blood sample collected from the woman?
Yes .............................................................. 1 No................................................................ 2 DK ............................................................... 8
SC3. Hemoglobin level from HemoCue
Hemoglobin __ __ .__

Indicators and Methods for Cross-Sectional Surveys of Vitamin and Mineral Status of Populations 116
QUESTIONNAIRE FOR CHILDREN UNDER FIVE
UNDER-FIVE CHILD INFORMATION PANEL UFThis questionnaire is to be administered to all mothers or caretakers who care for a child that lives with them and is under the age of 5 years. A separate questionnaire should be used for each eligible child. Fill in the cluster and household number, and names and line numbers of the child and the mother/caretaker in the space below. Insert your own name and number, and the date. UF1. Cluster number: UF2. Household number:
___ ___ ___ ___ ___ ___
UF3. Child’s Name: UF4. Child’s Line Number: ___ ___
UF5. Mother’s/Caretaker’s Name: UF6. Mother’s/Caretaker’s Line Number: ___ ___
UF7. Interviewer name and number: UF8. Day/Month/Year of interview:
___ ___ / ___ ___ / ___ ___ ___ ___ UF9. Result of interview for children under 5 (Codes refer to mother/caretaker.)
Completed................................................... 1 Not at home ................................................ 2 Refused....................................................... 3 Partly completed ......................................... 4 Incapacitated............................................... 5 Other (specify) _____________________ 6
Repeat greeting if not already read to this respondent: WE ARE FROM (country-specific affiliation). WE ARE WORKING ON A PROJECT CONCERNED WITH FAMILY HEALTH
AND EDUCATION. I WOULD LIKE TO TALK TO YOU ABOUT THIS. THE INTERVIEW WILL TAKE ABOUT (number) MINUTES. ALL THE INFORMATION WE OBTAIN WILL REMAIN STRICTLY CONFIDENTIAL AND YOUR ANSWERS WILL NEVER BE IDENTIFIED. ALSO, YOU ARE NOT OBLIGED TO ANSWER ANY QUESTION YOU DON’T WANT TO, AND YOU MAY WITHDRAW FROM THE INTERVIEW AT ANY TIME. MAY I START NOW?
If permission is given, begin the interview. If the respondent does not agree to continue, thank him/her and go to the next interview. Discuss this result with your supervisor for a future revisit.

Indicators and Methods for Cross-Sectional Surveys of Vitamin and Mineral Status of Populations 117
UF10. NOW I WOULD LIKE TO ASK YOU SOME QUESTIONS ABOUT THE HEALTH OF EACH CHILD UNDER THE AGE OF 5 IN YOUR CARE, WHO LIVES WITH YOU NOW. NOW I WANT TO ASK YOU ABOUT (name). IN WHAT MONTH AND YEAR WAS (name) BORN?
Probe: WHAT IS HIS/HER BIRTHDAY? If the mother/caretaker knows the exact birth date, also enter the day; otherwise, circle 98 for day.
UF10. DOB of child: Day/Month/Year ___ ___ / ___ ___ / ___ ___ ___ ___
UF11. HOW OLD IS (name) IN MONTHS? Record age in completed months.
Age in completed months .................... __ __
VITAMIN A MODULE VAVA1. HAS (name) EVER RECEIVED A VITAMIN A
CAPSULE (SUPPLEMENT) LIKE THIS ONE? Show capsule or dispenser for different doses – 100,000 IU for those 6-11 months old, 200,000 IU for those 12-59 months old.
Yes .............................................................. 1 No................................................................ 2 DK ............................................................... 8
2 next module 8 next module
VA2. HOW MANY MONTHS AGO DID (name) TAKE THE LAST DOSE?
Months ago .......................................... __ __ DK ............................................................. 98
VA3. WHERE DID (name) GET THIS LAST DOSE? On routine visit to health facility ................. 1 Sick child visit to health facility ................... 2 National Immunization Day campaign ........ 3 Other (specify) _____________________ 6 DK ............................................................... 8
BREASTFEEDING MODULE BFBF1. HAS (name) EVER BEEN BREASTFED?
Yes .............................................................. 1 No................................................................ 2 DK ............................................................... 8
2 TC1 8 TC1
BF2. IS HE/SHE STILL BEING BREASTFED? Yes .............................................................. 1 No................................................................ 2 DK ............................................................... 8
TEA/COFFEE CONSUMPTION TC TC1. DOES (NAME) DRINK TEA OR COFFEE? Yes .............................................................. 1
No................................................................ 2 DK ............................................................... 8
2 CA1 8 CA1
TC2. HOW OFTEN DOES (NAME) DRINK TEA OR COFFEE?
Usually every day........................................ 1 Usually 2 to 3 times per week..................... 2 Usually around once per week ................... 3 Less than once per week............................ 4 DK ............................................................... 8

Indicators and Methods for Cross-Sectional Surveys of Vitamin and Mineral Status of Populations 118
TC3. WHEN (NAME) DRINKS TEA OR COFFEE, DOES HE/SHE USUALLY DRINK IT DURING A MEAL?
Yes .............................................................. 1 No................................................................ 2 DK ............................................................... 8
CARE OF ILLNESS MODULE CACA1. HAS (name) HAD DIARRHOEA IN THE LAST
TWO WEEKS, THAT IS, SINCE (day of the week) OF THE WEEK BEFORE LAST?
Diarrhoea is determined as perceived by mother or caretaker, or as three or more loose or watery stools per day, or blood in stool.
Yes.............................................................. 1 No................................................................ 2 DK ............................................................... 8
CA2. HAS (name) HAD AN ILLNESS WITH A COUGH AT ANY TIME IN THE LAST TWO WEEKS, THAT IS, SINCE (day of the week) OF THE WEEK BEFORE LAST?
Yes .............................................................. 1 No................................................................ 2 DK ............................................................... 8
CA3. HAS (name) HAD AN ILLNESS WITH A FEVER AT ANY TIME IN THE LAST TWO WEEKS, THAT IS, SINCE (day of the week) OF THE WEEK BEFORE LAST?
Yes .............................................................. 1 No................................................................ 2 DK ............................................................... 8
ANTHROPOMETRY MODULE ANAfter questionnaires for all children are complete, the measurer weighs and measures each child. Record weight and length/height below, taking care to record the measurements on the correct questionnaire for each child. Check the child’s name and line number on the household listing before recording measurements. AN1. Child’s weight.
Kilograms (kg)............................... __ __ . __
AN2. Child’s length or height. Check age of child in UF11:
Child under 2 years old. Measure length (lying down).
Child age 2 or more years. Measure height (standing up).
Length (cm) Lying down............................ 1 __ __ __ . __ Height (cm) Standing up........................... 2 __ __ __ . __
AN3. Measurer’s identification code. Measurer code ..................................... __ __
AN4. Result of measurement. Measured .................................................... 1 Not present ................................................. 2 Refused....................................................... 3 Other (specify) _____________________ 6
SPECIMEN COLLECTION SC SC1. Was a finger stick blood sample collected from
this child? Yes .............................................................. 1 No ............................................................... 2 DK .............................................................. 8
SC2. Hemoglobin level from HemoCue
Hemoglobin __ __ .__

Indicators and Methods for Cross-Sectional Surveys of Vitamin and Mineral Status of Populations 119
Appendix 4 Basic Issues in Sampling
A4.1 General sampling issues and terminology
One of the primary goals of a cross-sectional survey is to collect information on a sample population
representative of the target population. The representativeness is extremely important for a number of
reasons. First, the results may be used for improving or targeting interventions; second, the survey results
may be compared with previous estimates to determine trends and used for comparisons with future
surveys. When those surveyed are representative of the target population, the estimates from the sample
are said to be “valid”. If the group sampled differs systematically from the target population on
characteristics related to the outcome, then the estimates from the sample may be “biased”.
Precision around an estimate is another issue, which can be presented by use of confidence intervals.
Because a survey provides only an estimate, the confidence limits provide a range of values that most
likely capture the “true” target population proportion (assuming the sample is representative of the target
population). As a general rule, the larger the sample size, the better the precision (i.e., the narrower the
confidence interval).
Cross-sectional surveys provide estimates of the proportion (or percentage) of individuals or
households with a characteristic. The survey is cross-sectional in that it provides estimates at a point in
time, i.e., a “snapshot” of the health status of a population. When the characteristic is whether or not
individuals have a condition of interest, this proportion is frequently referred to as “prevalence”. For
example, a cross-sectional survey might estimate the prevalence of VAD or anemia. “Prevalence” is
different from “risk”; prevalence is the proportion of individuals with a condition at a point in time
whereas risk is the probability of initially disease-free individuals developing the disease over a specified
time period. Another term for risk is incidence.
When the characteristic in a cross-sectional survey being measured is the proportion (or percentage)
with an intervention, this is frequently referred to as “coverage”. For example, the proportion of children
who received a vitamin A supplement within the previous 6 months is frequently referred to as “vitamin
A supplement coverage”.

Indicators and Methods for Cross-Sectional Surveys of Vitamin and Mineral Status of Populations 120
A4.2 Example of Simple and Systematic Sampling
Before presenting the complexities associated with performing surveys on a national or sub-national
level, some of the concepts of sampling will be described for simpler situations. In situations where a list
of eligible individuals is available, to select a representative sample from this list, two common sampling
methods are simple random sampling (SRS) and systematic sampling. As a simple illustrative example,
Table A4.1 presents data from a clinic that has 50 non-pregnant women enrolled and their “true” anemia
status is presented. Of course in a field setting we would not know the anemia status of the population
prior to selection, but for illustrative purposes their status is shown. In this group of 50 women, 26 are
anemic for a prevalence of 52%. Say we want to sample ten women and determine their anemia status.
One way to select ten women would be to use a random number table (Appendix 6) or computer program
to identify 10 numbers between 1 and 50. For example, say the following 10 numbers were randomly
selected: 1, 16, 17, 18, 28, 38, 40, 42, 43, and 50. Of the 10 women with these numbers, five women
would be found to be anemic for a prevalence of 50%. With a different random selection of 10 the results
could be different; for example, randomly selecting women number 11, 18, 20, 21, 24, 30, 34, 41, 42, and
49 would identify 6 out of 10 as anemic for a prevalence of 60%. It is possible that 10 numbers could be
randomly selected where none of the women were anemic or where all of the women were anemic. These
probabilities are shown in Figure A4.1.
Table A4.1 Illustrative example of 50 non-pregnant women of childbearing age with anemia status
No. Anemic No. Anemic No. Anemic No. Anemic No. Anemic
1 Y 11 Y 21 N 31 N 41 Y
2 Y 12 N 22 N 32 Y 42 N
3 N 13 Y 23 Y 33 N 43 N
4 N 14 N 24 Y 34 N 44 Y
5 N 15 N 25 Y 35 Y 45 N
6 Y 16 Y 26 Y 36 Y 46 N
7 Y 17 N 27 Y 37 N 47 N
8 N 18 Y 28 Y 38 N 48 N
9 N 19 Y 29 N 39 Y 49 Y
10 Y 20 N 30 Y 40 Y 50 Y
In Figure A4.1 the probabilities of selecting between 0 and 10 anemic women out of 10 randomly
selected women from this clinic population is presented. While conceptual, the idea is that if you were to

Indicators and Methods for Cross-Sectional Surveys of Vitamin and Mineral Status of Populations 121
randomly select 10 women from this clinic population thousands of times, what would be the distribution
of the number of anemic women identified from all the thousands of samples? This is conceptual because
in practice we would only take one sample, however it is important to understand that different samples
could result in different estimates. The probability of randomly selecting zero anemic women is low
(only .06%); the probability of randomly selecting 10 anemic women is also low (0.1%), but either is
possible, just very unlikely. The most likely number of anemic women out of 10 would be 5 anemic
women, which would occur in 24.4% of the samples. That is, if you were to sample 10 women from the
clinic population 1000 times, in 244 samples you would find exactly 5 anemic women; the other 756
samples you would identify fewer or more anemic women.
Figure A4.1 Probability of randomly selecting anemic women; assumes there are 50 women from which 10 are randomly selected with a “true” proportion of 52%
0
5
10
15
20
25
30
0 1 2 3 4 5 6 7 8 9 10
Number of anemic women
Prob
abili
ty (%
)
The above provides an example of randomly selecting individuals from a list. It also illustrates the
concept that a prevalence estimate from a sample is only an estimate; it is hoped that this estimate will be
close to the “true” target population value.
Systematic sampling is another way that could be used to select women from Table A4.1. With
systematic sampling, divide the total number in the target population (in our example, 50) by the number
to be sampled (in our example 10) to determine a sampling interval (50/10=5). The sampling interval of
5 indicates that we would select every fifth woman from Table A4.1 to be in the survey. However, we
need to have a “random start”, that is, pick a random number using a random number table or program
from 1 to 5 to determine where to start the systematic selection. For example, say the number 2 was
selected, this would result in the following women being selected: 2, 7, 12, 17, 22, 27, 32, 37, 42, and 47.

Indicators and Methods for Cross-Sectional Surveys of Vitamin and Mineral Status of Populations 122
From these selected women, 4 out of 10 would be found to be anemic for a prevalence of 40%. The
prevalence that would be found for each of the random starting numbers from 1 to 5 and then
systematically selecting every fifth woman is shown below:
1 70%
2 40%
3 40%
4 50%
5 60%
Some might express concern over how far some of the sample estimates are from the target value,
noting that sample estimates of 40% and 70% are quite distant from “true” target prevalence of 52%.
This is an issue of precision and as sample size increases, each sample estimate will, on average, be closer
to the target value. For example, with systematic selection of 25 women and a random start of 1 the
prevalence would be 48% (12/25); with a random start of 2 the prevalence would be 56% (14/25).
Sample size is covered in more detail elsewhere in this document. From a statistical viewpoint simple
random sampling is preferred; however, from a practical viewpoint, in some situations it might be easier
to use systematic selection.
Confidence intervals around estimates are important and provide a range in which the true estimate is
likely to be captured. Figure A4.2 provides prevalence estimates (the bars) with 95% confidence intervals
(the vertical lines) for selecting 10 women at random from Table A4.1. For example, if 0 out of ten
women are anemic, the prevalence would be 0% and the 95% confidence interval would be (0%, 32.1%).
The horizontal line at 52% represents the true prevalence of anemia in this group. Note that if 0 women
would be found to be anemic, the 95% confidence interval would not capture the “true” prevalence.
Ninety five percent of the samples taken from a population would have a 95% confidence interval that
captured the true prevalence. Therefore, when a survey is performed and a 95% confidence interval
calculated, it is likely that truth is captured in the confidence interval, but there is a small chance it does
not. For example, if 0 out of 10 women are anemic, the 95% confidence interval would not include the
“true” prevalence of 52%. However, as mentioned earlier (see Figure A4.1), the probability of selecting 0
out of 10 women being anemic was very low, only .06%. More likely a random selection of 10 women
from this population would find between 2 and 8 to be anemic where the confidence intervals would
capture the true prevalence.

Indicators and Methods for Cross-Sectional Surveys of Vitamin and Mineral Status of Populations 123
0
20
40
60
80
100
0 1 2 3 4 5 6 7 8 9 10Number of Anemic Women (out of 10)
Prev
alen
ce o
f Ane
mia
(95%
CI)
Figure A4.2 Prevalence and 95% confidence intervals for selecting between 0 and 10 anemic women
out of 50 where the true prevalence is 52%.
(Note: calculation of confidence interval based on modified Wald procedure and does not take into account the finite population
correction factor)
A4.3 Sampling from Large Populations
At this point we have described the use of simple random and systematic sampling to select from a
list of eligible individuals. When performing a survey at a national or sub-national level, it is very
unlikely that a list of eligible individuals would be available for sampling purposes. However, even if
such a list were available, for a large geographic area, using simple random or systematic sampling might
be too costly because those selected would likely be widely geographically dispersed. Therefore, most
surveys performed in large geographic areas use a two-stage sampling procedure. At the first stage, a
listing of geographic units is assembled. These geographic units are sometimes referred to as
“enumeration units” or “census tracts” or might be a listing of municipalities (e.g., towns, villages, and
cities). From this listing, a sampling procedure is used to determine which geographic units are to be
included in the survey (selected geographic units are usually referred to as “clusters”). A more detailed
description of selecting clusters can be found in Chapter 3. At the second stage, within each selected
geographic unit or “cluster”, an attempt is made to develop a list of eligible units, which could be

Indicators and Methods for Cross-Sectional Surveys of Vitamin and Mineral Status of Populations 124
households in a household-based survey or individuals in a clinic-based survey, and a sampling
procedure, perhaps simple random or systematic selection, is used to select those to be surveyed.

Indicators and Methods for Cross-Sectional Surveys of Vitamin and Mineral Status of Populations 125
Appendix 5 Sample Size Tables
Sample sizes for estimating a proportion taking into account different design effects, confidence intervals,
and confidence width. The most commonly used values are a 95% confidence interval, a DEFF of around
2, and width of +5%, which is shown in Table A5.2. In Table A5.2, if it is estimated the proportion is
50% and the DEFF is 2, then the sample size is 769. Table A5.1 provides calculations for a d value of
+3% and Table A5.3 a d value of +10%.
Table A5.1 Total sample size required for 95% confidence interval with a width (d) of +3%. Design Effect (DEFF) Proportion
(%) 1 2 3 4 5 6 10 or 90 384 769 1153 1537 1921 2305 20 or 80 683 1366 2049 2732 3415 4098 30 or 70 897 1793 2689 3586 4482 5378 40 or 60 1025 2049 3074 4098 5122 6147
50 1068 2135 3202 4269 5336 6403 Table A5.2 Total sample size required for 95% confidence interval with a width (d) of +5%.
Design Effect (DEFF) Proportion (%) 1 2 3 4 5 6
10 or 90 139 277 415 554 692 830 20 or 80 246 492 738 984 1230 1476 30 or 70 323 646 969 1291 1614 1937 40 or 60 369 738 1107 1476 1844 2213
50 385 769 1153 1537 1921 2305 Table A5.3 Total sample size required for 95% confidence interval with a width (d) of +10%.
Design Effect (DEFF) Proportion (%) 1 2 3 4 5 6
10 or 90 35 70 104 139 173 208 20 or 80 62 123 185 246 308 369 30 or 70 81 162 242 323 404 485 40 or 60 93 185 277 369 461 554
50 97 193 289 385 481 577

Indicators and Methods for Cross-Sectional Surveys of Vitamin and Mineral Status of Populations 126

Indicators and Methods for Cross-Sectional Surveys of Vitamin and Mineral Status of Populations 127
Appendix 6 Random Number Table
To use the random number table in Table A6.1, first choose a direction in which numbers will be read (down, up, left, or right). Next, close your eyes and point to a place on the random number table. The number closest to the point touched on the table is the starting point. Read the numbers in the direction decided upon ahead of time using the number of digits required.
Example: In the selection of households, it was determined that every 26th household should be included in the survey. To select the first house, a random number is selected from 1 to (and including) 26. For this example, it was decided to read the numbers downward from the starting point, and the starting point is the first number in the fourth column (8535). In this example, we only need to use the first two digits, 85. Reading down the column, the next number is 61, then 74, 69, 55, 90, 77, 38, 73, and finally 09. The value 9 is between 1 and 26 and therefore the first house to be sampled is the 9th household, and after that, every 26th household.
If more than four digits are needed for the selection process, the numbers in the next column can be used. For example, say a five-digit number is needed for selecting villages and cities from a cumulative population listing to be included in a cluster survey. The first number in the upper left-hand corner of the random number table could be read as 20,570, and, reading downward, the next number as 64,352, etc.
A number of programs can produce random number tables including OpenEpi (www.OpenEpi.com).

Indicators and Methods for Cross-Sectional Surveys of Vitamin and Mineral Status of Populations 128
Table A6.1 Table of Random Numbers 2057 6435 3278 7888 4022
0888 0605 4398 7899 5375
1120 4625 5112 3915 9223
0122 4114 0774 1493 5727
5329 7058 0099 0659 1596
0545 6166 4117 8288 1577
9777 7306 8830 0649 4000
2282 8197 4222 1331 9245
9405 2824 1421 8862 0633
0762 2646 0500 6411 6540
3504 4640 8857 2623 2213
5436 5978 4318 9380 5629
0620 2462 7788 3425 7577
2475 4886 2200 0499 6230
4817 0733 9128 2958 9415
9879 1399 8623 6675 0001
5183 8865 6138 1221 8353
7493 0568 7905 5634 2973
1429 0295 7573 1631 7804
2651 8692 0221 9965 8481
8921 5266 5003 3918 6982
2140 2820 5011 0114 8631
8555 2373 2369 3671 3551
9267 6128 4402 3952 2710
4107 4910 7382 6679 3982
4865 0619 0639 3024 5373
9184 0885 1374 9431 0255
8535 6177 7426 6981 5528
9051 7712 3844 7366 0919
6457 7521 3532 5957 4138
5291 0414 4971 4662 0759
8172 5937 8140 2771 3506
0371 5076 2038 3918 8305
4685 0074 3570 6681 6805
6339 5693 6599 3839 1085
0309 9270 5079 1435 8997
9029 2755 3188 1972 4690
5764 9832 1823 0486 2350
8361 8488 6430 3603 2901
8499 7197 0848 0802 5430
1376 9383 4865 2104 5255
5284 1275 5331 5441 6371
8972 9746 5267 7699 6783
8762 4251 0124 2581 2086
0636 4830 5885 3847 5394
9745 3080 0187 4269 3586
7155 6607 4407 8185 7310
9849 6854 5679 6553 7592
3653 3854 0748 1125 9953
3459 5763 4874 9275 9108
2221 0830 7530 9365 6065
9948 3203 2355 0805 4715
8930 1158 6559 0017 3356
7980 5958 4803 1364 6188
3458 3275 7707 0022 9839
6489 0480 5914 5896 7106
9902 9203 5041 6247 1650
1727 2940 7103 8745 1426
6778 8004 4867 2118 0356
0196 7068 7453 9416 0247
4715 9962 7382 5125 6524
4058 1801 4921 4060 3530
3496 2679 4167 7439 2572
5023 0521 3047 3860 6641
2660 2557 7545 3985 0046
4244 2598 2108 8907 2580
0453 3500 3262 5513 0405
6917 8602 5206 8024 1225
1096 3991 0957 4897 1365
7049 6041 0171 3177 8615
0575 2006 5162 4781 7662
8936 5622 2356 1254 3427
3502 6623 4901 1580 0404
3341 3461 2362 3105 1683
2377 2673 1813 5282 5676
3032 8685 5182 9750 2109
0159 2457 0434 1033 1590
4899 3074 1607 7032 8204
0376 4534 7830 7846 3841
1083 1051 7018 6342 7278
4313 3936 0106 3347 4085
2436 1133 3519 6751 0735
8784 9755 2428 7210 6269
9213 2399 4235 1106 6470
2902 6131 1185 0695 2304
9635 9134 3845 0529 4395
5525 2971 6088 2475 0017
0882 0062 7416 6891 5508
2992 6518 2384 2808 7993
6417 8687 6433 7625 4168

Indicators and Methods for Cross-Sectional Surveys of Vitamin and Mineral Status of Populations 129
Appendix 7 Guidelines for Interviewers
A7.1 Human Rights and Consent Issues
Before performing any survey, care must be taken to assure and respect the rights of individuals. In each
country, guidelines concerning the rights of individuals should be followed. There may be a committee
that must review the survey procedures and provide approval before the survey can be initiated. In some
areas it may be necessary to obtain written consent from participants, or for children, from the
parents/caretakers to allow their children to participate in the survey. Confidentiality of results also needs
to be considered. Feedback to the individuals with significant health problems, such as severe anemia,
must be provided.
A7.2 Conducting interviews
Successful interviewing is an art and should not be treated as a mechanical process. Each interview is a
new source of information, so make it interesting and pleasant. The art of interviewing develops with
practice but there are certain basic principles that should be followed by every successful interviewer. In
this section you will find a number of general guidelines on how to build rapport with a respondent and
conduct a successful interview.
The interviewer and the respondent are strangers to each other and one of the main tasks of an
interviewer is to establish rapport. The respondent's first impression of you will influence her willingness
to co-operate with the survey. Be sure that your appearance is neat and your manner friendly as you
introduce yourself. Carry a visible identification tag, the more official and formal looking this tag is the
more seriously you will be taken. It also helps to use uniform like clothing that links the field worker with
the health system.

Indicators and Methods for Cross-Sectional Surveys of Vitamin and Mineral Status of Populations 130
A7.2.1 Make a Good First Impression
When first approaching the respondent, do your best to make him or her feel at ease. With a few well-
chosen words you can put the respondent in the right frame of mind for the interview. Open the interview
with a smile and greeting and then proceed with your introduction.
A7.2.2 Always have a Positive Approach
Never adopt an apologetic manner, and do not use words, as "Are you too busy?” "Would you spare a few
minutes?" or "Would you mind answering some questions?" Such questions invite refusal before you
start. Rather, tell the respondent, "I would like to ask you a few questions", or "I would like to talk with
you for a few moments".
A7.2.3 Stress Confidentiality of Responses when Necessary
If the respondent is hesitant about responding to the interview or asks what the data will be used for,
explain that the information you collect will remain confidential, no individual names will be used for any
purpose and that all information will be pooled to write a report. Also, you should never mention other
interviews or show completed questionnaires to other interviewers or supervisor in front of a respondent
or any other person.
A7.2.4 Answer Any Questions from the Respondent Frankly
Before agreeing to be interviewed, the respondent may ask you some questions about the survey or how
she was selected to be interviewed. Be direct and pleasant when you answer. However, if she asks
questions about medical or other issues, tell her that you will try to answer her questions after you have
finished the interview.
The respondent may ask about the length of the interview and you should tell her how long it will
take. Indicate your willingness to return at another time if it is inconvenient for her to sit for the interview
at that very moment.

Indicators and Methods for Cross-Sectional Surveys of Vitamin and Mineral Status of Populations 131
A7.2.5 Interview the Respondent Alone
The presence of a third person during an interview can keep you from getting frank, honest answers from
a respondent. It is, therefore, very important that the individual interview be conducted privately and that
all questions are answered by the respondent herself/himself.
If other people are present, explain to the respondent that some of the questions must be answered by
her only and ask where the best place you can talk with her alone is. Sometimes asking for privacy will
make others more curious, so they will want to listen; you will have to be creative. Establishing privacy
from the beginning will allow the respondent to be more attentive to your questions.
If it is impossible to get privacy, you may have to carry out the interview with the other people
present. However, try to separate yourself and the respondent from the others as much as possible. Extra
effort should be made to gain privacy if the other person is a man. Make sure your time and the time of
the respondent are not wasted but dedicate enough time that the subject feels treated as a human being.
A7.3 Tips for Successful Interview
A7.3.1 Be Neutral Throughout the Interview
Most people are polite and will tend to give answers that they think you want to hear. It is therefore very
important that you remain absolutely neutral as you ask the questions. Never either by the expression on
your face or by the tone of your voice, allow the respondent to think that she has given the "right" or
"Wrong" answers to the question. Never appear to approve or disapprove of any of the respondent's
replies.
The questions are all carefully worded to be neutral. They do not suggest that one answer is more
likely or preferable to another answer. If you fail to read the complete question, you may destroy that
neutrality.
If the respondent gives an ambiguous answer, try to probe in a neutral way, asking questions such as:
"Can you explain a little more?"
"I did not quite hear you, could you please tell me again?"
"There is no hurry. Take a moment to think about it"

Indicators and Methods for Cross-Sectional Surveys of Vitamin and Mineral Status of Populations 132
A7.3.2 Never Suggest Answers to the Respondent
If a respondent's answer is not relevant to a question, do not probe her by saying something like "I
suppose you mean that ...... Is that right?" In many cases, she will agree with your interpretation of her
answer, even when that is not what she meant. Rather, you should probe in such a manner that the
respondent herself comes up with the relevant answer. For some survey questions you may be allowed to
read out the list of coded answers to the respondent.
A7.3.3 Do not Change the Wording or Sequence of Questions
The wording of the questions and their sequence in the questionnaire must be maintained. If the
respondent has misunderstood the question, you should repeat the question slowly and clearly. Provide
only the minimum information required to get an appropriate response.
A7.3.4 Handle Hesitant Respondents Tactfully
There will be situations where the respondent simply says "I don't know", gives an irrelevant answer, acts
very bored or detached, contradicts something she has already said, or refuses to answer the question. In
these cases you must try to re-interest her in the conversation. For example, if you sense that she is shy or
afraid, try to remove her shyness or fear before asking the next question.
If the woman is giving irrelevant or elaborate answers, do not stop her abruptly or rudely, but listen to
what she has to say. Then try to steer her gently back to the original question. A good atmosphere must
be maintained throughout the interview. The best atmosphere for an interview is one in which the
respondent sees the interviewer as a friendly, sympathetic and responsive person who does not intimidate
her, and to whom she can say anything without feeling shy or embarrassed. As indicated earlier, the
major problem in controlling the interview may be one of privacy. This problem can be prevented if you
are able to obtain a private area in which to conduct the interview.
If the respondent is reluctant or unwilling to answer a question, try to overcome her reluctance,
explaining once again that the same question is being asked of women all over the country and that the
answers will be merged together.
If she still refuses, simply write REFUSED next to the question and proceed as if nothing had
happened. If you have successfully completed the interview, you may try to obtain the missing

Indicators and Methods for Cross-Sectional Surveys of Vitamin and Mineral Status of Populations 133
information at the end, but do not push too hard for an answer. Remember, the respondent cannot be
forced to give an answer.
A7.3.5 Do not Form Expectations
You must not form or express any opinions about the ability and knowledge of the respondent because
this can influence the interview. The respondent, believing that you are different from her, may be afraid
or mistrustful. You should always behave and speak in such a way that she is put at ease and is
comfortable talking to you.
A7.3.6 Do not hurry the Interview
Ask the questions slowly to ensure the respondent understands what she is being asked. After you have
asked a question, pause and give her time to think. If the respondent feels hurried or is not allowed to
formulate her own opinion she may respond with "I don't know" or give up the interview. Say to the
respondent, "There is no hurry. Your opinion is very important so consider your answers carefully".

Indicators and Methods for Cross-Sectional Surveys of Vitamin and Mineral Status of Populations 134

Indicators and Methods for Cross-Sectional Surveys of Vitamin and Mineral Status of Populations 135
Appendix 8 Example Tables
In this Appendix are examples of tables for presenting results on some of the indicators discussed in this
manual. These are just examples and each country may need to adapt the tables to their own needs. In
addition, there will be many other tables necessary for a survey report not shown here. In general we
recommend that tables should have confidence intervals taking into account the survey design, but note
that not all of the tables presented here include confidence intervals; sometimes the confidence interval
and the design effect may be provided in the text for the overall prevalence. These tables could be
adapted for use in other age groups and other indicators.

Indicators and Methods for Cross-Sectional Surveys of Vitamin and Mineral Status of Populations 136
Table A8.1 Urinary Iodine in non-pregnant women of childbearing age (15-49.9 years old), National Micronutrient Survey, Country, Year N %<50
µg/L1 %<100 µg/L2
%>100 µg/L
%>300 µg/L
Median µg/L3
Age group (years) 15-19.9 75 1.9 (0.4, 7.8) 8.4 (3.7,18.0)* 91.6 (82.0, 96.3)* 39.6 (29.7, 50.4)* 269.9 20-29.9 121 4.2 (1.7, 9.9) 20.6 (13.9, 29.5)* 79.4 (70.5, 86.1)* 26.9 (17.8, 38.3)* 193.1 30-39.9 81 8.9 (3.4, 21.6) 22.9 (14.1. 35.0)* 77.1 (65.0, 85.9)* 26.7 (16.9, 39.7)* 202.2 40-49.9 53 4.5 (1.0, 17.5) 10.3 (4.4, 22.1)* 89.7 (77.9, 95.6)* 51.5 (36.4, 66.3)* 306.2 Marital status Single/not married
138 1.6 (0.3, 7.4) 13.6 (7.6, 23.0) 86.4 (77.0, 92.4) 36.1(26.9, 46.5) 240.7
Married 176 7.1 (3.2, 14.9) 19.7 (12.8, 28.9) 80.3 (71.1, 87.2) 31.0 (23.4, 39.8) 203.6 Other 16 7.6 (1.0-40.8) 11.5 (2.6, 39.0) 88.5 (61.0, 97.4) 41.5 (18.5, 69.0) 315.0 Per capita monthly income <30 USD 36 0.0 2.1 (0.3, 14.7)* 97.9 (85.3, 99.7)* 36.9 (20.2, 57.4) 240.1 >30 USD 292 5.6 (2.8, 10.7) 18.8 (13.2, 26.0)* 81.2 (74.0, 86.8)* 33.5 (25.4, 42.6) 212.2 Education level of head of household None 75 3.4 (0.8, 14.0) 13.1 (7.2, 22.7) 86.9 (77.9, 92.8) 24.4 (15.3, 36.6) 226.0 Primary 134 6.0 (2.8,12.2) 17.6 (10.9, 27.3) 82.4 (72.7, 89.1) 36.6 (26.6, 48.0) 238.1 >Primary 119 4.7 (2.0, 10.7) 18.6 (11.3, 29.1) 81.4 (70.9, 88.7) 37.0 (26.7, 48.5) 210.9 HH Salt iodine Level (ppm) None 10 0.0* 39.2 (13.2, 73.2)* 60.8 (26.8, 86.8)* 19.5 (5.2, 51.5)* 143.0 0.1-14.9 114 8.7 (3.6, 19.4)* 30.4 (20.5, 42.6)* 69.6 (57.4, 79.5)* 16.7 (10.1, 26.5)* 146.5 15-29.9 204 13.4 (5.4, 29.5)* 22.2 (11.4, 38.9)* 77.8 (61.1, 88.6)* 27.3 (13.3, 47.9)* 212.2 30–69.9 170 0.8 (0.1, 6.1)* 6.5 (3.2, 12.7)* 93.5 (87.3, 96.8)* 35.5 (25.7, 46.6)* 257.2 ≥70 65 1.5 (0.2, 11.0)* 4.5 (1.0, 17.5)* 95.5 (82.5, 99.0)* 70.2 (58.5, 79.7)* 454.8 National 330 4.9 (2.5, 9.5) 16.8 (11.9, 23.2) 83.2 (76.8, 88.1) 33.6 (26.3, 41.8) 222.9 National data is weighted for proportions to account for survey design, however, median values are unweighted, * P<0.05 comparing against the demographic characteristic, e.g., by age, income, salt iodine levels. 1 WHO goal: <20%; 2 WHO goal: <50%; 3 WHO goal: median 100 to 300 µg/L

Indicators and Methods for Cross-Sectional Surveys of Vitamin and Mineral Status of Populations 137
Table A8.2 Households (HH) with salt available for testing and with presence of iodine based on a rapid salt iodine test kit, National Micronutrient Survey, Country Year. Household Characteristic
N HH with salt (%)
Results with color change* (%)**
SES Low 831 80.5 92.2 Moderate 517 92.6 91.9 High 101 99.3 87.4 Residence Urban 175 92.4 91.8 Rural 1286 85.3 91.7 Region Northern 490 87.1 94.1 Central 497 89.5 89.9 Southern 474 82.9 92.9 National 1461 86.1 91.7 *A change in color is an estimate of the presence of iodine in the salt using the MBI kit. **Based on households that had salt available for testing. Table A8.3 Households (HH) with various levels of iodine in salt and median iodine levels (ppm) based on salt titration analysis, National Micronutrient Survey, Country Year.
Proportion of households meeting WHO recommendations for elimination of IDD (≥15 ppm) (95% CI)
Household Characteristic
N
>15 ppm <15 ppm Median PPM Per capita monthly income <30 US Dollars 45 48.5 (24.2, 73.4) 51.5 (26.6, 75.8) 19.0 >30 US Dollars 341 60.3 (52.0, 68.0) 39.7 (32.0, 48.0) 31.1 Education level of head of household None 100 50.2 (37.8, 62.5) 49.8 (37.5, 62.2) 16.7 Primary 123 56.3 (46.2, 65.8) 43.7 (34.2, 53.8) 28.6
>Primary 163 59.0 (56.7, 66.7) 41.0 (33.3, 49.3) 37.9 National 390 59.3 (51.1, 67.0) 40.7 (33.0, 48.9) 30.7

Indicators and Methods for Cross-Sectional Surveys of Vitamin and Mineral Status of Populations 138
Figure A8.1 Percentage of households with various levels of iodine (ppm) in salt, National Micronutrient Survey, Country Year.
05
101520253035404550
0 ppm >=15 ppm >=25 ppm >=40 ppm >=80
%
National data is weighted to account for survey design.

Indicators and Methods for Cross-Sectional Surveys of Vitamin and Mineral Status of Populations 139
Table A8.4 Prevalence of low serum retinol levels and mean serum retinol levels among preschool children (6-36 months), National Micronutrient Survey, Country Year.
Prevalence (%) of serum retinol: Characteristics of Preschool children
N <10 μg/dl <20 μg/dl <30 μg/dl
Mean serum retinol (μg/dl)
Age Group (mos) 6-11.9 97 4.8 59.7 94.6 19.1 12-23.9 191 6.8 58.8 87.7 20.1 24-35.9 170 9.7 61.1 94.4 19.1 Sex Male 228 9.3 62.6 92.6 19.3 Female 248 5.6 55.9 89.9 19.9 SES Low 258 6.6 60.4 92.5 19.4 Moderate 181 9.5 63.6 93.7 18.8 High 36 3.0 30.3 72.2 24.8 Residence Urban 38 12.1 58.0 90.2 20.2 Rural 438 6.9 59.3 91.3 19.6 Region Northern 149 3.4 40.3 79.2 24.2 Central 175 4.6 63.4 90.9 19.5 Southern 152 10.5 59.9 94.1 18.7 National 476 7.4 59.2 91.2 19.6
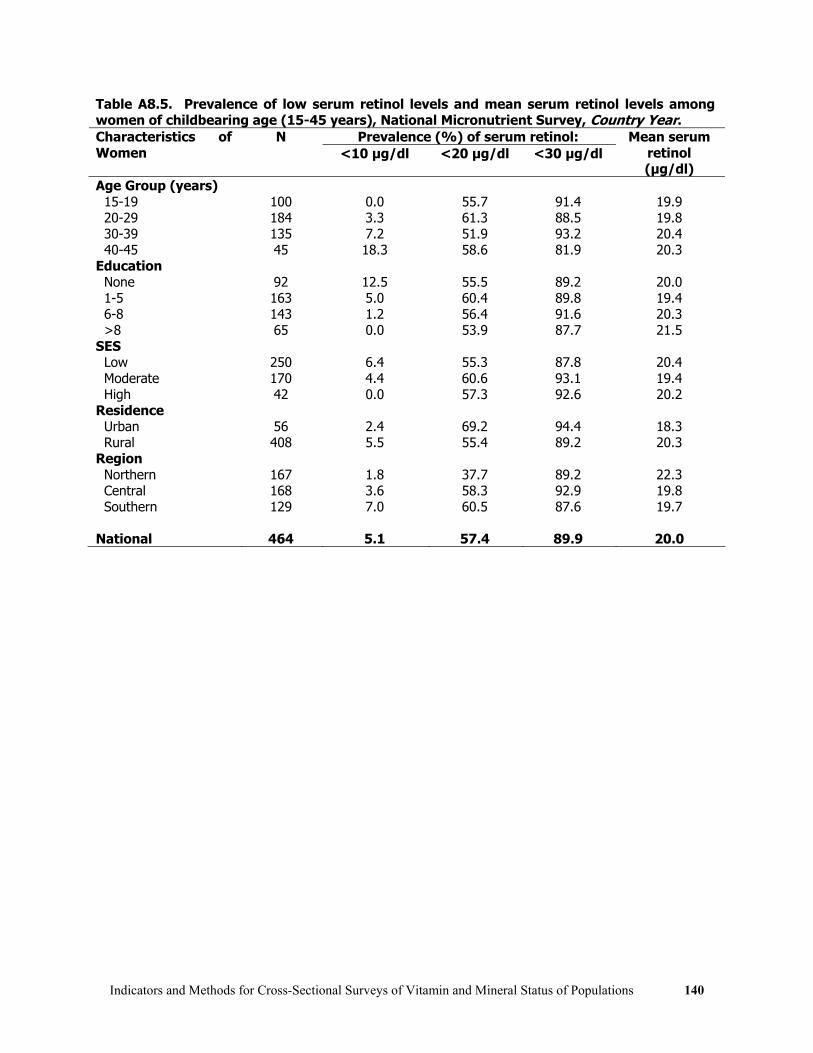
Indicators and Methods for Cross-Sectional Surveys of Vitamin and Mineral Status of Populations 140
Table A8.5. Prevalence of low serum retinol levels and mean serum retinol levels among women of childbearing age (15-45 years), National Micronutrient Survey, Country Year.
Prevalence (%) of serum retinol: Characteristics of Women
N <10 μg/dl <20 μg/dl <30 μg/dl
Mean serum retinol (μg/dl)
Age Group (years) 15-19 100 0.0 55.7 91.4 19.9 20-29 184 3.3 61.3 88.5 19.8 30-39 135 7.2 51.9 93.2 20.4 40-45 45 18.3 58.6 81.9 20.3 Education None 92 12.5 55.5 89.2 20.0 1-5 163 5.0 60.4 89.8 19.4 6-8 143 1.2 56.4 91.6 20.3 >8 65 0.0 53.9 87.7 21.5 SES Low 250 6.4 55.3 87.8 20.4 Moderate 170 4.4 60.6 93.1 19.4 High 42 0.0 57.3 92.6 20.2 Residence Urban 56 2.4 69.2 94.4 18.3 Rural 408 5.5 55.4 89.2 20.3 Region Northern 167 1.8 37.7 89.2 22.3 Central 168 3.6 58.3 92.9 19.8 Southern 129 7.0 60.5 87.6 19.7 National 464 5.1 57.4 89.9 20.0

Indicators and Methods for Cross-Sectional Surveys of Vitamin and Mineral Status of Populations 141
Table A8.6 Coverage of vitamin A supplements and months since last dose among preschool children (6-36 months), National Micronutrient Survey, Country Year.
Months since last dose Characteristics of Preschool Children
N Percent ever received vitamin A
supplement Median <6 mos <12 mos
Age Group (mos) 6-11.9 116 70.6 3 69.2 - 12-23.9 219 91.3 4 60.7 83.4 24-35.9 184 90.9 9 40.4 64.1 Sex Male 256 85.8 5 54.5 72.9 Female 284 86.7 4 56.6 74.4 SES Low 290 85.3 4 56.6 72.7 Moderate 208 88.9 5 59.2 76.1 High 40 79.1 9 30.2 70.2 Residence Urban 42 100.0 9 42.3 72.7 Rural 498 85.0 4 57.0 73.9 Region Northern 167 90.4 6 54.0 79.5 Central 207 82.6 5 50.2 70.5 Southern 166 88.6 4 60.7 75.2 National 540 86.3 5 55.6 73.7

Indicators and Methods for Cross-Sectional Surveys of Vitamin and Mineral Status of Populations 142
Table A8.7 Coverage of vitamin A supplements within the first two months after their last delivery* among women of childbearing age (15-45 years), National Micronutrient Survey, Country Year. Characteristics of women
N Percent reporting received vitamin A supplement within 2 mos. of delivery*
Age Group (years) 15-19 38 17.4 20-29 193 37.9 30-39 149 35.6 40-45 47 34.9 Education None 103 24.7 1-5 153 37.3 6-8 127 35.7 >8 44 52.8 SES Low 243 31.0 Moderate 150 40.3 High 32 42.1 Residence Urban 44 43.1 Rural 383 33.9 Region Northern 159 49.7 Central 140 33.6 Southern 128 32.8 National 427 34.9 *Restricted to women who had given birth within the previous two years.

Indicators and Methods for Cross-Sectional Surveys of Vitamin and Mineral Status of Populations 143
Table A8.8 Prevalence of anemia (hemoglobin <11 g/dL) and mean hemoglobin among children 6-59.9 months, National Micronutrient Survey, Country Year. Characteristics of Children N Percent anemic
(95% CI) Mean hemoglobin g/dl
(95% CI) [SD] Age Group (months) 6-11.9 35 90.7 (78.5, 96.3)* 10.2 ( 9.9, 10.6) [1.06]* 12-23.9 54 47.0 (34.1, 60.2)* 10.9 (10.5, 11.3) [1.06]* 24-35.9 55 29.0 (18.4, 42.7)* 11.4 (11.0, 11.8) [0.88]* 36-47.9 67 27.0 (16.3, 41.3)* 11.6 (11.4, 11.9) [1.01]* 48-59.9 36 21.0 (9.9, 39.3)* 11.5 (10.9, 12.0) [1.35]* 6-23.9 89 66.4 (54.2, 76.8)* 10.6 (10.3, 10.9) [1.13] 24-59.9 158 26.3 (19.1, 34.9)* 11.5 (11.3, 11.7) [1.05] Sex Male 130 39.7 (29.8, 50.5) 11.1 (10.9, 11.3) [1.05] Female 117 43.4 (32.1, 55.5) 11.2 (10.9, 11.5) [1.25] Average per capita monthly income within HH <30 USD 21 47.8 (26.6, 69.8) 10.7 ( 9.9, 11.5) [1.64] >30 USD 224 40.7 (32.6, 49.3) 11.2 (11.0, 11.4) [1.09] Education Level of Head of Household None 40 24.5 (11.4, 45.1) 11.6 (10.9, 12.3) [1.27] Primary 83 51.1 (36.3, 65.8) 11.0 (10.7, 11.3) [1.28] More than Primary 122 40.3 (30.9, 50.5) 11.2 (10.9, 11.4) [0.96] National 247 41.5 (34.2, 49.3) 11.2 (11.0, 11.3) [1.15] *P<.01 overall between age groups

Indicators and Methods for Cross-Sectional Surveys of Vitamin and Mineral Status of Populations 144
Table A8.9 Prevalence of anemia (hemoglobin <12 g/dL) and mean hemoglobin among non-pregnant women of childbearing age (15-49.9 years), National Micronutrient Survey, Country Year. Characteristics of Women N Percent anemic
(95% CI) Mean hemoglobin g/dl
(95% CI) [SD] Age Group (years) 15-19.9 81 39.6 (28.5, 51.8) 12.1 (11.8, 12.4) [1.21] 20-29.9 127 36.3 (28.1, 45.4) 12.2 (12.0, 12.4) [1.10] 30-39.9 84 37.8 (28.9, 47.6) 12.2 (12.0, 12.4) [0.98] 40-49.9 53 45.4 (31.6, 60.1) 12.0 (11.7, 12.4) [1.28] Marital Status Single (never Married) 151 38.3 (31.0, 46.1) 12.2 (12.0, 12.4) [1.18] Married 170 37.8 (29.9, 46.4) 12.2 (12.0, 12.4) [1.10] Other 16 51.7 (26.3, 76.3) 11.8 (11.4, 12.3) [0.95] Average per capita monthly income within HH <30 USD 36 40.1 (26.7, 55.1) 12.1 (11.9, 12.4) [1.14] >30 USD 316 38.6 (32.8, 44.8) 12.2 (12.0, 12.3) [1.13] Education Level of Head of Household None 82 35.3 (24.7, 47.7) 12.3 (12.0, 12.5) [0.99] Primary 143 44.3 (36.5, 52.4) 12.1 (11.9, 12.3) [1.20] More than Primary 127 34.8 (25.4, 45.7) 12.1 (11.8, 12.4) [1.13] National 352 38.8 (33.3, 44.6) 12.2 (12.0, 12.3) [1.13]

Indicators and Methods for Cross-Sectional Surveys of Vitamin and Mineral Status of Populations 145
Table A8.10 Prevalence of iron deficiency (serum ferritin <12 μg/L) among children 6-59.9 months with a normal CRP (<5 mg/L), National Micronutrient Survey, Country Year.
Prevalence (%) of iron deficiency (ID) With a Normal CRP Ignoring CRP
Characteristics of Children
N Prev. % (95% CI)* N Prev. % (95% CI)* Age Group (months) 6-11.9 2 - 3 - 12-23.9 33 23.1 (11.1, 41.9) 39 19.7 (9.7, 35.7) 24-35.9 48 29.1 (15.2, 48.5) 51 26.0 (14.2, 42.8) 36-47.9 57 10.9 (4.7, 23.3) 59 10.7 (4.7, 22.5) 48-59.9 31 15.8 (4.3, 43.9) 31 15.8 (4.3, 43.9) 6-23.9 35 21.8 (10.3, 40.4) 42 18.3 (8.8, 34.3) 24-59.9 136 17.8 (11.7, 26.1) 141 16.8 (11.1, 24.6) Sex Male 88 21.7 (12.1, 35.7) 93 19.9 (11.1, 32.9) Female 83 15.2 (8.5, 25.8) 90 14.3 (8.2, 23.9) Average per capita monthly income within HH <30 USD 17 35.3 (13.4, 65.9) 17 35.3 (13.4, 65.8) >30 USD 153 16.8 (11.1, 24.6) 165 15.3 (10.1, 22.6) Education Level of Head of Household None 31 15.5 (6.2, 33.9) 32 15.1 (6.0, 33.1) Primary 61 22.5 (12.9, 36.2) 64 21.1 (11.9, 34.7) More than Primary 78 16.4 (9.5, 26.8) 86 14.8 (8.7, 24.1) National 171 18.5 (12.9, 25.9) 183 17.1 (11.8, 24.1)
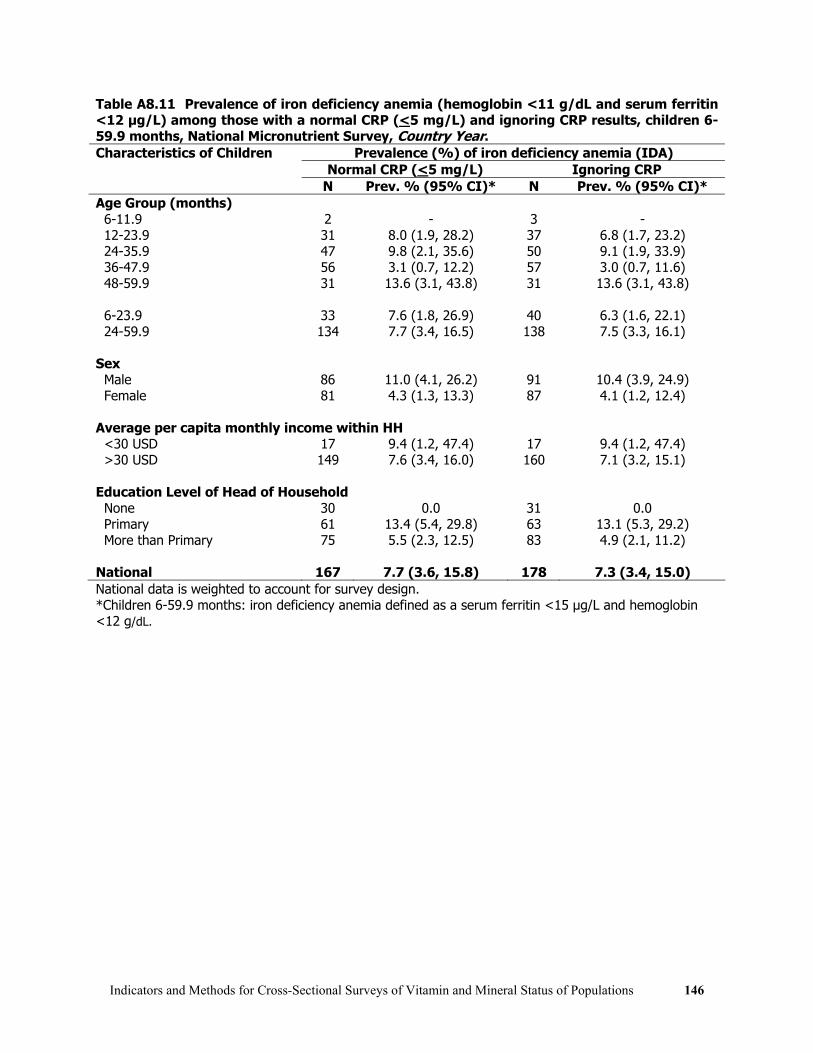
Indicators and Methods for Cross-Sectional Surveys of Vitamin and Mineral Status of Populations 146
Table A8.11 Prevalence of iron deficiency anemia (hemoglobin <11 g/dL and serum ferritin <12 μg/L) among those with a normal CRP (<5 mg/L) and ignoring CRP results, children 6-59.9 months, National Micronutrient Survey, Country Year.
Prevalence (%) of iron deficiency anemia (IDA) Normal CRP (<5 mg/L) Ignoring CRP
Characteristics of Children
N Prev. % (95% CI)* N Prev. % (95% CI)* Age Group (months) 6-11.9 2 - 3 - 12-23.9 31 8.0 (1.9, 28.2) 37 6.8 (1.7, 23.2) 24-35.9 47 9.8 (2.1, 35.6) 50 9.1 (1.9, 33.9) 36-47.9 56 3.1 (0.7, 12.2) 57 3.0 (0.7, 11.6) 48-59.9 31 13.6 (3.1, 43.8) 31 13.6 (3.1, 43.8) 6-23.9 33 7.6 (1.8, 26.9) 40 6.3 (1.6, 22.1) 24-59.9 134 7.7 (3.4, 16.5) 138 7.5 (3.3, 16.1) Sex Male 86 11.0 (4.1, 26.2) 91 10.4 (3.9, 24.9) Female 81 4.3 (1.3, 13.3) 87 4.1 (1.2, 12.4) Average per capita monthly income within HH <30 USD 17 9.4 (1.2, 47.4) 17 9.4 (1.2, 47.4) >30 USD 149 7.6 (3.4, 16.0) 160 7.1 (3.2, 15.1) Education Level of Head of Household None 30 0.0 31 0.0 Primary 61 13.4 (5.4, 29.8) 63 13.1 (5.3, 29.2) More than Primary 75 5.5 (2.3, 12.5) 83 4.9 (2.1, 11.2) National 167 7.7 (3.6, 15.8) 178 7.3 (3.4, 15.0) National data is weighted to account for survey design. *Children 6-59.9 months: iron deficiency anemia defined as a serum ferritin <15 μg/L and hemoglobin <12 g/dL.

Indicators and Methods for Cross-Sectional Surveys of Vitamin and Mineral Status of Populations 147
Table A8.11 Prevalence of an elevated CRP (>5 mg/L) among children 6-59.9 months, National Micronutrient Survey, Country Year. Characteristics of Children N Percent with elevated CRP
(95% CI) Age Group (months) 6-11.9 3 30.4 (3.4, 84.3) 12-23.9 39 11.2 (4.5, 25.0) 24-35.9 51 6.3 (1.8, 19.5) 36-47.9 59 4.5 (1.1, 16.4) 48-59.9 31 0.0 (-, -) 6-23.9 42 12.5 (5.2, 27.1) 24-59.9 141 3.9 (1.6, 9.3) Sex Male 93 3.8 (1.3, 10.7) Female 90 7.5 (3.4, 15.8) Average per capita monthly income within HH <30 USD 17 0.0 (-, -) >30 USD 165 6.3 (3.5, 11.1) Education Level of Head of Household None 33 2.3 (0.3, 16.7) Primary 64 4.5 (1.3, 14.5) More than Primary 85 8.2 (4.1, 15.4) National 183 5.6 (3.2, 9.9)

Indicators and Methods for Cross-Sectional Surveys of Vitamin and Mineral Status of Populations 148

Indicators and Methods for Cross-Sectional Surveys of Vitamin and Mineral Status of Populations 149
References 1 Underwood, BA. Perspectives from Micronutrient Malnutrition Elimination/Eradication
Programs. Morbidity and Mortality Weekly Report (1999) 48(SU01):37-42.
2 World Health Organization. Indicators for Assessing Vitamin A Deficiency and their Application in Monitoring and Evaluating Intervention Programs. WHO/NUT/96.10. Geneva: World Health Organization, 1996.
3 IVACG Statement. Maternal Night Blindness: A New Indicator of Vitamin A Deficiency. April 2002.
4 Sullivan KM, Houston R, Gorstein J, Cervinskas J. Monitoring Universal Salt Iodization Programmes. UNICEF/PAMM/MI/ICCIDD/WHO, 1995.
5 Binkin N, Sullivan K, Staehling N, Nieburg P. Rapid nutrition surveys: how many clusters are enough? Disasters, 16(2):97-103, 1992.
6 Dean AG, Dean JA, Coulombier D, Brendel KA, Smith DC, Burton AH, Dicker RC, Sullivan K, Fagan RF, Arner TG. Epi Info, Version 6: a word processing, database, and statistics program for epidemiology on IBM microcomputers. Centers for Disease Control and Prevention, Atlanta, Georgia, USA, 1995. (Available at www.cdc.gov)
7 Dean AG, Dean JA, Coulombier D, Brendel KA, Smith DC, Burton AH, Dicker RC, Sullivan K, Fagan RF, Arner TG. Epi Info, Version 6: a word processing, database, and statistics program for epidemiology on IBM microcomputers. Centers for Disease Control and Prevention, Atlanta, Georgia, USA, 1995. (Available at www.cdc.gov)
8 Iron Deficiency Anaemia: Assessment, Prevention, and Control. UNICEF/UNU/WHO, WHO/NHD/01.3, 2001.
9 Sommer. A. and West, K. Vitamin A Deficiency. Health Survival and Vision. New York: Oxford University Press, 1996. Pp. 1-19 and 27-55.
10 Iodine status worldwide: WHO Global Database on Iodine Deficiency. World Health Organization, Geneva, 2004.
11 State of the World’s Children 2006. UNICEF, New York, 2006.
12 World Health Organization. Indicators for Assessing Vitamin A Deficiency and their Application in Monitoring and Evaluating Intervention Programs. WHO/NUT/96.10. Geneva: World Health Organization, 1996.
13 Sommer A, Davidson FR. Assessment and control of vitamin A deficiency: The Annecy Accords.
J Nutr 132: 2845S-2850S, 2002.
14 http://www.sightandlife.org/info/manual1ed/Salmanchap4.pdf
15 May, W. Micronutrient Laboratory Equipment Manual. New York: UNICEF, 1996.
16 Craft NE, Haitema T, Brindle LK, Yamini S, Humphrey JS West, Jr KP. Retinol Analysis in
Indicators and Methods for Cross-Sectional Surveys of Vitamin and Mineral Status of Populations 150
Dried Blood Spots by HPLC Journal of Nutrition (2000) 130:882-885
17 Craft NE, Bulux J, Valdez C, Li Y, Solomons NW Retinol concentrations in capillary dried blood spots from healthy volunteers: method validation. American Journal of Clinical Nutrition (2000) 72(2):450-4
18 Hulshof P, Brouwer JT, et al. Bias and random error in retinol measurements of laboratories in countries with populations with mild to severe vitamin A deficiency. Clin Chem (2002) 48: 2061-2063.
19 Blaner WS. Retinol binding protein: the serum transport protein for vitamin A. Endocrine Rev 10:308-316, 1989
20 Hix J, Dary O, Martizez C, Buchanan I, Morgan J, Tam M. RBP-EIA: A New Approach to Assessing Vitamin A Deficiency. 20th IVACG Meeting: 25Years of Progress in Controlling Vitamin A Deficiency: Looking to the Future, 2001, pp.1-67 (abstract).
21 Gamble MV, Ramakrishnan R, Palafox NA, Briand K, Berglund L, Blaner WS. Retinol Binding Protein as a Surrogate Measure for Serum Retinol: Studies in Vitamin A-Deficient Children from the Republic of the Marshall Islands, American Journal of Clinical Nutrition (2001) 73:594-601.
22 Semba RD, Yuniar Y, Gamble MV, Natadisastra G, Muhilal. Assessment of vitamin A status of preschool children in Indonesia using plasma retinol-binding protein. Journal of Tropical Pediatrics (2002) 48(2):84-7.
23 Almekinder J, Manda W, Soko D, Lan Y, Hoover DR, Semba RD. Evaluation of plasma retinol-binding protein as a surrogate measure for plasma retinol concentrations. Scandinavian Journal of Clinical Laboratory Investigation ( 2000) 60(3):199-203.
24 Erhardt JG, Estes JE, Pfeiffer CM, Biesalski HK, Craft NE. Combined measurement of ferritin, soluble transferrin receptor, retinol binding protein, and C-reactive protein by an inexpensive, sensitive, and simple sandwich enzyme-linked immunosorbent assay technique. J Nutr. 2004 Nov;134(11):3127-32.
25 dePee, S. et al Orange fruit is more effective than are dark-green leafy vegetables in increasing serum concentrations of retinol and B-carotene in schoolchildren in Indonesia. American Journal of Clinical Nutrition (1998) 68: 1058-67.
26 de Pee S, Bloem MW. 24- VASQ Method for Estimating Vitamin A Intake. Jakarta, Indonesia:Helen Keller International, 1996.
27 Berger, J., Aguayo, V.M., San Miguel, J.L., et al. Definition and prevalence of anemia in Bolivian women of childbearing age living at high altitudes: the effect of iron-folate supplementation. Nutrition Reviews (1997) 55(6): 247-56.
28 Centers for Disease Control and Prevention. Reference criteria for anemia screening in children and childbearing age women. Morbidity and Mortality Weekly Review (1989) 38: 400-404.
29 Van Kampen EJ, Zijlstra WG. Clin. Chem. Acta (1961)6:538.

Indicators and Methods for Cross-Sectional Surveys of Vitamin and Mineral Status of Populations 151
30 Van Schenck, H., Falkensson, M. and Lundberg, B. Evaluation of ‘HemoCue’ – a new device for determining hemoglobin. Clinical Chemistry (1986) 32:526-29.
31 Burger, S. and Pierre-Louis, J. Micronutrient Global Leadership Project : A Procedure to Estimate the Accuracy and Reliability of HemoCue™ Measurements of Survey Workers. Washington, D.C. ILSI, 2003.
32 Lardi, A.M., Hirst, C., Mortimer, A.J. and McCollum, C.N. Evaluation of the Hemo Cue for measuring intra-operative hemoglobin concentrations: a comparison with the Coulter Max-M. Anaesthesia (1998) 53:349-352.
33 Report of a Joint World Health Organization/Centers for Disease Control and Prevention Technical Consultation on the Assessment of Iron Status at the Population Level. Assessing the Iron Status of Populations. WHO, Geneva, Switzerland (WD 105), 2004.
34 Huebers HA, Beguin Y, Pootrakul P, Einspahr D, Finch CA. Intact transferrin receptors in human plasma and their relation to erythropoiesis. Blood (1990)75:102–7.
35 Kohgo Y, Niitsu Y, Kondo H, et al. Serum transferrin receptor as a new index of erythropoiesis. Blood (1987) 70:1955–8.
36 Ferguson BJ, Skikne BS, Simpson KM, Baynes RD, Cook JD. Serum transferrin receptor distinguishes the anemia of chronic disease from iron deficiency anemia. Journal of Laboratory and Clinical Medicine (1992) 119:385–90.
37 Punnonen K, Irjala K, Rajamäki A. Iron-deficiency anemia is associated with high concentrations of transferrin receptor in serum. Clinical Chemistry (1994)40:774–6.
38 Cooper MJ, Zlotkin SH. Day-to-day variation of transferrin receptor and ferritin in healthy men and women. American Journal of Clinical Nutrition (1996)64:738–42.
39 Skikne BS, Flowers CH, Cook JD. Serum transferrin receptor: a quantitative measure of tissue iron deficiency. Blood (1990) 75: 1870-1876.
40 Skikne BS, Ferguson BJ, Simpson K, Baynes RD, Cook JD. Serum transferrin receptor distinguishes anemia of chronic disease from iron deficiency. Blood (1990); 76: 48a
41 Kohgo Y, Niitsu Y, Kondo H, et al. Serum transferrin receptor as a new index of erythropoiesis. Blood (1987) 70: 1955-1958.
42 Huebers HA, Beguin Y, Pootrakul P, Einspahr D, Finch CA. Intact transferrin receptors in human plasma and their relation to erythropoiesis. Blood (1990) 75: 102-107.
43 World Health Organization. UNICEF and International Council for the Control of Iodine Deficiency Disorders (ICCIDD) Assessment of Iodine Deficiency Disorders and Monitoring their Elimination WHO/NHD/01.01. Geneva: World Health Organization, 2001.
44 Gorstein J, Sullivan K, Houston R, Gerasmov G. Goiter assessment: help or hindrance in tracking progress in iodine deficiency disorders control program? Thyroid. (2001) 11(12):1201-1202.
45 Delange F. Optimal Iodine Nutrition during Pregnancy, Lactation and the Neonatal Period. International Journal of Endocrinology and Metabolism (2004) 2(1):1-12.

Indicators and Methods for Cross-Sectional Surveys of Vitamin and Mineral Status of Populations 152
46 Thurnham DI, McCabe GP, Northrop-Clewes CA, Nestel P. Effects of subclinical infection on
plasma retinol concentrations and assessment of prevalence of vitamin A deficiency: meta-analysis. Lancet 2003;362(9401):2052-8.

![Many-Objective Optimization: Problems and Evolutionary … · 2017-11-14 · objective optimization problems with four or more than four objectives [100]. Authors have also listed](https://static.fdocuments.in/doc/165x107/5f6cce129fd15e10910c88e7/many-objective-optimization-problems-and-evolutionary-2017-11-14-objective-optimization.jpg)