Evaluating India's national rural employment guarantee scheme
India’s National Rural Employment Guarantee Scheme:What Do We Really Know about the World’s Largest
Workfare Program?
Sandip Sukhtankar∗
November 29, 2016
Abstract
In the ten years since the rollout of India’s National Rural Employment GuaranteeScheme, there has been much research on its implementation and impact. This paperattempts to synthesize knowledge from the vast array of studies. I present four key take-aways. First, there is large heterogeneity in implementation, with consequences for notonly where impact is seen, but also interpretation of what “the program” entails. Second,the “Guarantee” in the title is a misnomer, as access is rationed. Third, NREGS seemsto have increased rural private sector wages, but led to worse educational outcomes forolder children, with contentiously net positive impacts on income and welfare. Fourth,key questions pertaining to overall impacts on rural productivity remain unanswered.Although research on these questions will be welcome, current standards for causal infer-ence and availability of data will remain high hurdles for those who wish to take on thischallenge.
Keywords: NREGS, MNREGA, workfare, India, rural employment guarantee
JEL codes: H53, I38, J08, J38, J45, J68, 029
∗University of Virginia, Monroe Hall, Charlottesville, VA 22904; [email protected]. I thankClement Imbert, Karthik Muralidharan, and Shekhar Shah for helpful discussions, the discussants RinkuMurgai and Surjit Bhalla, session chair Amarjeet Sinha as well as the IPF audience for comments, andMichael Kaiser, Kevin Li, Frances Lu and Katherine McAvoy for excellent research assistance.
1 Introduction
It has now been ten years since the first workers were employed in the schemes launched by
the Mahatma Gandhi National Rural Employment Guarantee Act (MNREGA).1 MNREGA
entitles every rural household the right to one hundred days of minimum-wage employment
per year. The state-level public employment schemes - collectively referred to as National
Rural Employment Guarantee Schemes (NREGS) - comprise the largest workfare program
in the world. The program has spawned various monikers - “landmark”, “flagship” - as well
as justifiable attention from policymakers, politicians, and academics in India and abroad.
Yet despite this attention, and reams of research and opinion on the program, there is still
enormous debate over the impact of the NREGS. Supporters have hailed the program as a
“tremendous success”, while opponents deride it as an “expensive gravy train”.2 While these
descriptions were coined in the early years of the program, the debate is still quite active:
for example, last year witnessed a vigorous debate played out in the print media between
groups of social scientists.
This paper tries to synthesize knowledge based on serious theoretical and empirical re-
search on this program, and presents avenues for future research. What complicates this
task is the vast array of studies on NREGS, of varying quality, on almost every imaginable
outcome and aspect of the program. This leads to what I facetiously call (with apologies to
Newton) the “third law of NREGS”: every result has an equal and opposite result. While
it is heartening to see the attention given to this important program, the volume of work
makes it impossible for the casual reader to ascertain which direction the weight of evidence
points to; finding a citation to bolster your favored opinion of the program is easy. One
of the main goals of this article is hence to guide the reader in weighing the evidence on
various aspects of the program. In addition, where results seem to contradict each other, I
attempt to reconcile them based on differences in data, sample, or methodology. I aim to
be clear about whether the evidence is anecdotal or representative, and whether it is merely
correlational or causal.
1MNREGA or NREGA or NREGS - which is correct? Technically the National Rural EmploymentGuarantee Act (NREGA) - ex post renamed the Mahatma Gandhi National Rural Employment GuaranteeAct (MNREGA) - is a piece of legislation that created an entitlement to employment, which was to befulfilled by state-level schemes, collectively referred to as National Rural Employment Guarantee Schemes(NREGS). But since no one is ever confused about which program is being referred to, many - includingmyself - refer to these acronyms interchangeably. I will attempt to use MNREGA when referring to the actand NREGS when referring to the actual implementation of the schemes.
2These terms were noted in the following op-ed by Jean Dreze: http://www.thehindu.com/todays-
paper/tp-opinion/employment-guarantee-beyond-propaganda/article1176799.ece.
1

Digging through the mound of literature, some clarity emerges. I present four key take-
aways:
First, almost every single empirical paper points out the large heterogeneity in implemen-
tation of NREGS. While this point may seem obvious, there are two nuances that are perhaps
not so obvious. The heterogeneity means that much of the impacts are seen only in better
implementing states; even impacts on average are driven largely by “star” implementing
states. Even less obvious is the point that with these implementation issues, what exactly
one is measuring the impact of is unclear. In other words, the “impact of the program” is
not really a logical construct; empirical studies are basically estimating the effects of the
program combined with varying implementation quality.
Second, there is widespread agreement that despite the legal guarantee, on-demand em-
ployment is simply not available. Even in the best implementing states, access is rationed,
even for the poorest. To what extent this matters is unclear; for example, if most of the
demand would have been during the slack labor season, and this is season in which NREGS
operates, then the harm from rationing may be limited. On the other hand, the poorest
states, where the need for the program is the greatest, seem to lack the capacity to imple-
ment NREGS.
Third, there are at least two outcomes for which the bulk of the evidence suggests impacts.
Rural private sector wages seem to have increased modestly as a result of NREGS. On the
other hand, this increase in wages may have led to worse educational outcomes for older
children, as the opportunity cost of attending school has now gone up. A number of pieces
of evidence indicate that incomes may have increased, but this evidence is not as strong and
universal as the previous two outcomes.
Fourth, despite ten years, despite much attention from researchers, and despite access
to data and transparency measures that are unprecedented for India, there are still large
unanswered questions. Perhaps the most important questions - related to NREGS effects on
productivity - remain contested. This is perhaps why there is still so much debate over the
impacts of program.
Why have researchers not been able to provide definitive answers to the big questions? It
is a non-trivial task to identify effects of a large program, particularly given the non-random
rollout and current high standards for causal inference. Complications arise given imple-
mentation problems and the consequent heterogeneity in implementation, and in particular
identifying mechanisms demands even more from data and empirical methods. Moreover,
even though data access reflects a vast improvement over other programs - compare, for ex-
2
ample, the tiny handful of papers published on the Public Distribution System (PDS) in top
social science journals versus the proliferation of similar quality papers in just ten years of
the NREGS - problems still remain. For example, even obtaining consistent data over time
on basic aspects of the program for this paper has proven far more difficult than expected,
with conflicting sources that are not easy to reconcile.
Finally, how exactly one measures standard for success of a program like NREGS is open
to debate. For example, in the case of educational interventions, rupees spent per standard
deviation increase in test scores might be one reasonable standard. In the NREGS case,
however, there is likely disagreement over outcomes: should income, poverty, welfare, distress
migration, insurance be counted? Further, what is the benchmark comparison? A natural
benchmark might be cash transfers (Murgai and Ravallion, 2005); however, we likely know
even less about the governments ability to target and deliver these payments as well as the
potential cost-effectiveness of these alternatives.
The roadmap for the rest of the paper is as follows. Before delving into details on the im-
pacts, I provide some background for the reader who is not well versed with the intricacies of
the program. Section 2 begins with salient features of MNREGA, including main provisions
and guidelines laid down by the act. The section also includes basic figures and numbers to
give the reader a sense of the size of the program, its growth over time, and its reach across
space and sectors of the population.
In Section 3, I describe how the program has actually been implemented on the ground
- or the “Schemes” as distinct from the “Act”. I begin with highlighting the incredible
heterogeneity in implementation across states and districts, a fact that every interpretation
of each empirical study of NREGS must take into account. This heterogeneity exists in key
features of implementation such as access, the efficiency of payments, corruption, and other
dimensions of of implementation such as worksite facilities and choice of projects.
Section 4 lays out conceptual frameworks for understanding the impact of NREGS. I
begin by presenting the basic theoretical underpinnings for the program, as well as the
main theoretical mechanisms for impacts on various outcomes that have been studied by
researchers. Following this, I present the main empirical strategies that have been used to
identify the impacts of NREGS, laying out the pros and cons of each.
In Section 5, I discuss empirical studies of the impact of NREGS on major outcomes
such as wages and employment, income, education, migration, agricultural technology and
investment, and conflict. For each outcome, I will attempt to not only summarize the existing
evidence but also resolve the direction that the best evidence points to. The survey of the
3
literature aims to be comprehensive, but in order to make the task manageable, this paper
includes papers based on objective criteria on sample selection, sample size, and identification
strategy that are defined below.3
Despite the large amount of research on MNREGA, there are still areas that are under-
studied. I highlight these areas about which we still know very little in Section 6. Finally,
Section 7 concludes with some speculation about the future of the program.
2 Background
MNREGA was passed by Parliament and notified in 2005, following up on an electoral
promise made by the United Progressive Alliance (UPA, a coalition led by the Congress
party) after it came into power in 2004. Schedule I of the act lays out its basic provisions.
The employment guarantee schemes mandated by the act became operational in the 200
“poorest” districts in the country in February 2006.4 An additional 130 districts received
the program in April and May 2007, while the remaining districts of the country became
operational in April 2008. Below I describe the main provisions of the act, and the following
subsection provides some basic numbers and figures.
2.1 MNREGA provisions and rules
While most readers familiar with MNREGA know that the act establishes a legal guarantee
of a hundred days of employment, there are many other provisions of the act as well as official
guidelines that are less well known.5 The fourth and most recent edition of the MGNREGA
operational guidelines produced by the Ministry of Rural Development is a rather detailed
232 page document listing workers rights and procedures to be followed by implementing
agencies.This comprehensive document does not preclude the production of other ad-hoc
documents with procedures.6
3Papers published in major economics, political science and development studies journals are automati-cally included. However, given the long delay in the publication process for these journals, there are numerousexcellent pieces of research that exist only as working papers as of now; by using the criteria, I hope to haveincluded as many of these as yet unpublished papers.
4In Section 4 below I describe in more detail how these districts were chosen.5For example, a little known feature that may be of interest to researchers is the fact that the Government
invites proposals for studies on MNREGA, and will pay for them! (see http://nrega.nic.in/Circular_
Archive/archive/Guideliness_Research_Studies_under_MGNREGA.pdf)6For example, “Guidelines for Construction of Play Ground in IAP Districts”. See http://nrega.nic.
in/netnrega/guidelines.aspx for more details.
4
Logistical challenges and deviations from these guidelines are to be expected given the
current level of implementation capacity across India. I discuss these implementation issues
in Section 3 below. The current section, however, is devoted to documenting the provisions
of the Act on paper, which I categorize into basics, projects, finances, administration, and
monitoring.
2.1.1 Basics
To begin with, the 100 day guarantee established by the act applies at the household level
for rural households in a financial year. Households are required to obtain jobcards from
local government offices, which list all adult members of the household, and also have space
for recording work done and payments received. Once the jobcard is obtained, households
are supposed to apply for work whenever they need. The local administration must provide
employment within 15 days and within 5 kilometers of the applicant’s home, failing which
the applicant is due to be paid unemployment allowance (for non-provision of work within 15
days) or a travel and subsistence allowance (if work is only available beyond 5 kilometers).
While in general the work involves doing manual unskilled labor and pays minimum wages,
there are provisions for other types of work that can pay slightly higher wages (for example,
supervisors at job sites). However, 60% of expenditure must be spent on wages. In addition,
33% of jobs must be reserved for women, and women are guaranteed the same wages as men
(which is not de facto true in the private sector, thus making NREGS more valuable for
women). Finally, wages are to be paid weekly, and no later than a fortnight of the work
being done.
2.1.2 Projects
Projects taken up under NREGS are typical of public employment schemes, and include
the construction of public goods such as roads and irrigation channels. One of the major
goals of MNREGA is related to water management, with both drought-proofing and flood
management as priority projects. Projects are meant to be chosen by the Gram Sabha, or
the full meeting of the village, in consultation with the block and district administration.
This process should produce a roster of projects in advance of the financial year that can be
taken up as demand dictates.
It is also possible for NREGS work to take place on private land, if the land is owned by
Scheduled Castes/Tribes (SC/ST). For example, clearing of land for cultivation is a common
5
such activity in order to provide livelihoods to the most disadvantaged groups. In any type
of project, there are also supposed to be provisions for worksite facilities such as drinking
water, shade, and a creche for workers’ children.
2.1.3 Finances and payments
In order to incentivize States to generate employment, the Central government pays all labor
costs fully, but only 75% of material costs. Since wage rates are set by States in order to
adjust to local conditions, this feature also incentivizes States to increase wage rates, and
has been a bone of contention between Central and State governments since the inception
of the act. Workers may either be paid a daily wage rate or piece rates depending on the
amount of work done.
Initially, payments were made in cash by the same administrative bodies in charge of
implementation. However, the most recent guidelines explicitly call for payments to be
made to bank or post office accounts, and also for separation between implementing and
payment officials. Cash payments are still possible, particularly in areas in which bank or
post office branches are inaccessible, although according to the rules administrative bodies
must obtain prior permission to make such payments.
2.1.4 Administration
Given that the act explicitly states that Gram Panchayats (GPs) - the lowest administrative
tier of the Indian bureaucracy - must implement at least 50% of the works in terms of cost,
MNREGA has advanced the legitimization of GPs as state actors. The GP is in charge
not only of implementing works, but also of keeping records (particularly “muster roles” of
work attendance and payments) and transmitting them to higher levels of administration. In
these tasks the GP is now assisted by a wider array of local officials, some of whose positions
were created by the Ministry of Rural Development explicitly to assist with MNREGA.
These include the Gram Rozgar Sahayak or Employment Guarantee Assistant, Mates or
work site supervisors or Field Assistants, Technical Assistant to measure and monitor work,
Computer Assistant to keep and update and transmit records,7 in addition to the elected
(e.g. Sarpanch) and appointed (e.g. GP Secretary) officials who are in charge of the program
overall.
7Every GP does not necessarily have each of these officials; for example, the Technical Assistant andComputer Assistant are generally based at the block level.
6
The Block and District level administrations are meant to support and assist the GP in
implementation, as well as implementing some work directly through line departments (for
example Irrigation department). These entities are meant to have Programme Officers in
charge of MNREGA implementation. These officials approve work plans and in some cases
also budgets, although this provision may be changing recently.
2.1.5 Monitoring
MNREGA is unusual among large welfare programs in creating provisions for transparency
and monitoring from the outset. The Monitoring and Information System (MIS) gives anyone
with an internet connection unprecedented access to official records of works and payments.
It relies on custom-built and sophisticated software - “NREGASoft” - to document every as-
pect of the program electronically, with the updated operational guidelines including detailed
instructions on how to enter information into the software.
District and state administrations are required to audit the works and expenses of GPs
and Blocks. In addition, “Social audits” are meant to be performed once every six months in
order to ensure accountability as per Rule 4 of Audit of Schemes Rules, 2011. These involve
public verification of muster rolls and other expenditure in a Gram Sabha, and can involve
workers as well as civil society organizations. The audits are also meant to be a platform for
workers to air grievances.
2.2 Figures and numbers
NREGS is a large program by any account. Over 121 million rural jobcards are registered
for the program as of 2014 (Figure 1), which would amount to practically all of India’s rural
population if each household had only one jobcard, although that is likely not the case.8 The
total number of person-days on the program in 2013-14 were 2.20 billion, which actually is
a decline from the peak of 2.83 billion in 2009-10 (Figure 2). Nearly 48 million individuals
actually worked on the program in 2013-14, belonging to 24.4% of rural households (Desai
et al., 2015).
A striking feature of the program is participation by women. Since the program pays
the same amount for women as men, while women are paid less than men in the private
sector market, women’s participation is high, amounting to an average of 47.5% over the
8Calculations by Muralidharan et al. (2016a) suggest 1.9 jobcards per NSS defined household in AndhraPradesh in 2011-12.
7

years 2006-2012. Participation by marginalized sections of society is also high, with SC/ST
accounting for 49.4% of persondays (Figure 3).
Expenditure on the program amounted to about Rs. 37,000 crores in 2013-14.9 This
makes it amongst the biggest public programs in India, although not the single largest
public expense. In comparison, subsidies for kerosene alone amounted to Rs 30,574 crores
in 2013-14. Fiscal expenditure on fertilizer subsidies - including consumer and producer
subsidies - amounted to Rs. 73,790 crores in the same year (Ministry of Finance, 2014).
Comparisons to programs across the world can be made by calculating expenditure as
a percentage of GDP. NREGS expenditure in 2013-14 was 0.33% of GDP in India. In
comparison, US spending on Medicaid was 2.9% of GDP, while spending on TANF (welfare)
was 0.19% of GDP.10
The trend in program statistics over its lifetime suggests that expenditure and participa-
tion on NREGS rose steadily as it scaled up from 2006 onwards, but have declined somewhat
over the last three to four years (Figure 4). For example, total expenditure on NREGS (in
2006 rupees) dropped to Rs. 14,982 crore in 2014-15 from Rs. 27,736 crore, its peak in
2009-10. Person-days have also dropped, as has expenditure per person-day, although how
much this is due to actual declines as opposed to reducing corruption (see Section 3 below) is
not known. Meanwhile, the utilization of funds available has steadily increased, and recently
state and local governments are using almost all the funds budgeted (Figure 6).
The almost 50% drop in real expenditure on NREGS between 2009-10 to 2014-5 deserves
some elucidation. A number of factors contribute to this drop. First and foremost, both
monsoon and annual rainfall in 2008 and 2009 were significantly lower than average and also
significantly lower than in 2013 and 2014, suggesting that demand likely has a role to play.
Second, as discussed below, it is likely that corruption has gone down over time, reducing
outlays.
3 Implementation
It will come as no surprise to anyone that the exhaustive list of guidelines laid down by
MoRD for MNREGA implementation is not followed to the letter, and the numbers cited
above are not entirely perfect. What is important for practical purposes, however, is the
9Despite the huge efforts in data transparency, it has proven difficult to pin down a precise figure forexpenditure in the last two financial years, with various conflicting figures available that are not easy toreconcile. Thankfully they are all in the same ballpark.
10Sources: Medicaid spending and GDP from www.cms.gov, and TANF spending from www.acf.hhs.gov.
8
extent and nuance of differences between on-the-ground practices and on-paper ideals. In
this section I present evidence collected on implementation of key features of MNREGA.
3.1 Heterogeneity in implementation
The most remarkable characteristic of NREGS implementation is the enormous heterogeneity
in implementation quality across and even within states. Heterogeneity of implementation
across states has been a feature since the very beginning of the program. Dreze and Oldiges
(2009) in commenting on performance in the first two years pointed out that just three states
- Rajasthan, Madhya Pradesh and Chhattisgarh - were responsible for over half of the total
employment generated. Imbert and Papp (2015a) coined the term “star states” to describe
the seven leading states, where employment on NREGS accounted for over one percent of
all working days in rural areas.
This situation has not changed much in recent years; Figures 7 and 8 show the large
variation in NREGS employment and expenditure per capita across the 15 largest states in
India in 2013-14. While Andhra Pradesh and Tamil Nadu consistently rank amongst the
states with best implementation, poorer states like Bihar and Uttar Pradesh, where one
might expect high demand for NREGS, implement with as much intensity as much richer
states like Gujarat and Maharashtra (with presumably much lower demand). Overall, there
is no relationship between spending per capita or NREGS participation and the rural poverty
headcount across states (Dutta et al., 2012).
There are a number of reasons for this heterogeneity. Most obviously, local labor market
conditions and the need and demand for employment differ across states. However, as
in previous examples of employment guarantee schemes (Ravallion et al., 1993), supply
constraints are also extremely important. These supply constraints are related to fiscal
capacity, implementation capacity (and the way the program is implemented at the local
level), as well as political incentives.
While the central government pays for most expenses under the program, states are still
responsible for a share of the costs as explained below, including some of the administrative
costs. If state governments have limited fiscal capacity to pay their parts, corresponding
transfers from the central government will be affected, perhaps explain the apparent regres-
sivity across states noted above.
Administrative capacity in poorer states may also be limited. Witsoe (2014), using detailed
anthropological work in one of the worst-performing states - Bihar - documents how the ide-
9
alized world of MGNREGA is a far cry from the reality of how NREGS is implemented. He
notes that “the state government lacks the capacity to run projects as documented... Limi-
tations on state capacity are complex, ranging from inadequate staffing, training and salaries
to an inability of officials to navigate panchayat politics and the entrenched opposition of
landowners.” On the other hand, in Andhra Pradesh the government was able to build on
the network of Self-Help Groups to employ women as Customer Service Providers (CSPs)
and successfully implement the Smartcards initiative to markedly improve functioning of
NREGS (Muralidharan et al., 2016a).
Finally, the motivation of bureaucrats and politicians to implement NREGS also matters.
Gulzar and Pasquale (2015) show that political incentives affect implementation of NREGS,
using a clever empirical strategy to identify the effects these incentives. Boundaries of politi-
cal constituencies and administrative units often do not coincide in India; thus administrative
units (blocks) can be entirely within political constituencies and answerable to a single politi-
cian, or split across constituencies and answerable to multiple politicians. The authors find
that person-days as well as the number of people employed in NREGS is higher when blocks
are entirely within constituencies as opposed to split across constituencies, even when the
comparison is restricted to boundaries of blocks within the same constituencies (where one
block is split and the other is not). They argue that politicians are better able to motivate
block officials to implement NREGS when blocks are not split largely because the politicians
can then more unambiguously claim credit for improvements. This paper makes clear how
even within district differences in implementation quality may arise.
The heterogeneity in observed NREGS implementation is important not only for the im-
plications on the effectiveness of NREGS, but also two other less obvious reasons. First, it
affects the interpretation of results and observations that rely on small and selected samples.
This is the normal caveat related to the extrapolation of results from one area to another.
Second, one-size-fits-all solutions must also be viewed with care.
3.2 Implementation of key features of MNREGA
The deviation of the abstract ideal of MNREGA from the reality of NREGS is best captured
by a quote from Witsoe (2014):
There are, in fact, three distinct NREGAs. The first is the NREGA enacted through
legislation, the vision of which is operationalized through a centrally maintained
documentary system. The second is the NREGA practiced by a vast bureaucracy
10

under control of state governments, whose main task is the production of documen-
tation within the broad parameters of the centrally maintained architecture. Since
this documentation is compiled into data and reports, this is the NREGA most
visible to academics. And lastly, there is the NREGA as practiced in villages.
Below, I present evidence on the extent of differences between the act on paper and the
schemes as practiced in villages on the key dimensions of the act, including access to work
and payments.
3.2.1 Access
Of all the features of MNREGA, the most important is simply access to work on demand.
How has the NREGS fared in fulfilling this key provision? The most comprehensive work
on this suggests that there is still a long way to go to fulfill the ambition of employment
when desired. Dutta et al. (2012) use data from the 2009/2010 National Sample Survey
(NSS) which is representative across India to find that 44% of those who desired work on
NREGS did not get it. As suggested by the previous section, there is wide variation across
states, with rates varying from 15% to 84%. Similar results are found in data from the India
Human Development Survey 2011-12 (IHDS), with 60% of participating households desiring
more work but not able to obtain it, and 29% of all rural households experiencing rationing
of some kind (Desai et al., 2015). Moreover, employment and spending on NREGS is not
strongly correlated with poverty across states, and poorer states have greater unmet demand
for NREGS. The lack of capacity described above could be one factor explaining this.
Evidence from our work in Andhra Pradesh suggests that this problem has not gone away.
Andhra Pradesh is generally considered one of the better implementing states - it is a “star
state” as defined by (Imbert and Papp, 2015a). However, even here in our endline survey
in 2012 we found that only 4% of respondents answered yes to a question that asked “In
general, can anyone in this village who wants work on NREGS get it?” Access looks better
when asked about specific personal experiences, with only 20% of respondents answering
that they were unable to get work despite asking for it in May, while 42% of respondents
answered that they were unable to get work despite asking for it in January.11
The seasonality indicated by these differences in May and January is common across India.
As suggested by the fact that a higher number of respondents were unable to get work in
11If more people wanted work in May rather than January - which seems likely - then the weighted averagerate would be very similar to the 25% reported rate for Andhra Pradesh from the Dutta et al. (2012) datain 2009-10.
11

January despite asking, the seasonality is not simply due to variation in demand. It is
accepted that no one really “applies” for work; projects happen when planned for the slack
labor season. For example, Witsoe (2014) notes that “contractors are the ones who initiate
projects and they are therefore the ones who actually generate demand for work.” Further
evidence from Dutta et al. (2013) based on a randomized experiment in Bihar suggests
that increasing awareness of workers rights, including the fact that workers can demand
work when needed, does not lead to actual increases in employment. This strengthens the
argument that supply, rather than demand, constrains NREGS employment.
In general, state and local governments seem to plan NREGS projects for the slack labor
months of May and June prior to the monsoon, while work generally does not happen in
peak harvest seasons of December and January. There is some suggestion that part of the
seasonality may due to elite pressure. For example, Lakha and Taneja (2009) suggest that
“in many parts of rural India, poverty-alleviation schemes such as the NREGS face resistance
from landlords whose control over labour is threatened by the availability of employment op-
portunities outside their authority.” Similar broad arguments have been made by Anderson
et al. (2015), who contend that landlords seek to control local governance in order to sup-
press wage pressure from schemes like the NREGS. More conclusive evidence of widespread
collusion between local governments and landlords to smother NREGS implementation is
lacking, however, since such evidence would clearly be difficult to obtain directly.
3.2.2 Targeting
How well does the self-selection aspect of MNREGA work to target the poor? On the one
hand, the poor are more likely to work on NREGS than the non-poor, with 30% of poor
households participating as compared to 21% of non-poor (Desai et al., 2015). Households
in which no adult is literate are also much more likely (30%) to participate than households
where at least one adult is a graduate (13%). Again, implementation matters, as 60% of poor
households participate in NREGS in better implementing states, as suggested by data from
the India Human Development Survey 2011-12. In the glass half empty column, however, is
the fact that 70% of poor households did not participate in NREGS that year, and mostly
because they were not able to access work, not because they did not desire to work.
Other papers corroborate both the targeting and rationing results above (Gaiha et al.,
2010). This paper also suggests that increasing statutory wages on NREGS to the point
where it is substantially higher than the agricultural wage worsens targeting, since the pro-
gram then draws in relatively richer workers. Dutta et al. (2014) summarize the situation
12

best: “the rationing process is pro-poor and the scheme is reaching poor families, though
richer households also share in the gains.”
Qualitative work also supports the glass half-full/half-empty nature of targeting. For
example, Marcesse (2016) points out that in Uttar Pradesh, although the workers actually
doing work were often from the poorest section of society, many other workers (from more
fortunate castes) also received payments for not doing any work. Moreover, he notes that
“variation in the extent to which work benefits were allocated, and whether the work was
performed reflected patterns of political allegiance at the village level.”
3.2.3 Payments
Operational guidelines clearly state that payment for work must be made within two weeks
of the work being done. This is far easier said than done; unless funds are made available
in advance to GPs, work must be recorded, these records uploaded, which triggers disbursal
of payments down the hierarchy from states to districts to blocks to GPs. While attempts
to circumvent this system are underway (Banerjee et al., 2015), the best available evidence
suggests that simply getting payments on time and in a predictable fashion is a recurring
problem. Even the operational guidelines state that “Timely payment of wages has emerged
as one of the main challenges of Mahatma Gandhi NREGA over the last few years.” (Ministry
of Rural Development, 2013)
Anecdotal evidence on payment delays abounds, with extreme cases such as suicides related
to delayed wages capturing media attention (Pai, 2013). Representative data at the all India
level are difficult to obtain, with the NSS not asking specific enough questions about the lag
between work and payment receipt. State level evidence from our work in Andhra Pradesh
suggests that the mean lag is over a month (34 days), easily more than the two weeks
allowed on paper (Muralidharan et al., 2016a). Again, Andhra Pradesh is one of the better
performing states.
While delays in payments receive media attention, the banal act of collecting payments
does not. The fact that there is no mention of this in extensive operational guidelines suggests
the lack of importance to this given by policymakers. However, the time spent on collecting
payments can result in significant lost wages. On average in Andhra Pradesh workers spent
close to two hours collecting their money for every payment. Moving to electronic funds
transfer, biometric authentication using Smartcards, and Customer Service Providers at
the village level reduced this collection time, as well as delays in payments, considerably
(Muralidharan et al., 2016a).
13
Perhaps the biggest stick wielded by NREGS critics is that of corruption in the program.
For example, Bhalla (2011) contends that programs such as NREGS comprise scams that
are annually the size of the famous 2G corruption scandal. While even its most fervent
supporters would not deny that some funds are captured by middlemen, putting a precise
number on country-wide annual leakage is very difficult.
A good starting point is the estimate by Imbert and Papp (2011), updated in Imbert
(2014). They use representative National Sample Survey data from 2009-10 and 2011-12,
which asks respondents how many days they were employed on NREGS, and compare these
numbers to official figures on employment provided from the Ministry of Rural Development.
They find that the household reports can only account for 42-56% of the official reports in
2009-10, while the number improves to about 80% in 2011-12. However, these numbers are
not a precise estimate of leakage of NREGS funds since they are in terms of days not Rupees.
A major complicating fact is that many states pay piece rates rather than daily wages, and
workers often work on NREGS in the mornings while working on their own farms later in
the day, making a comparison in terms of days biased.
If we did take these figures seriously, we could calculate fiscal losses due to leakages. This
would amount to approximately Rs. 19,000 crore in 2009-10, and Rs. 7,500 crore in 2011-12.
For comparison, leakage rates on the PDS range from 44-58% in the years 2004-05 and 2007-
08. The fiscal loss to the government of these leakages in 2013-14 amounts to Rs. 28,500
crores (Ministry of Finance, 2014), compared to the mean “scam” value of Rs. 36,000 crore
as calculated in Sukhtankar and Vaishnav (2015).
The only way to improve on the basic methodology would be to obtain official records of
employment and payments and attempt to track these down to actual beneficiaries. Clearly
this is labor intensive and would be difficult to do on a nationwide basis. Moreover, any
partial sample would need re-weighting to obtain population estimates, and this is a non-
trivial task since for many states the number of households in existence does not correspond
exactly to the number of jobcards in existence. Our level estimates using this methodology
in Andhra Pradesh suggest leakage rates of 30.7% in 2012 (Muralidharan et al., 2016a).
Previous estimates in Orissa with a similar methodology estimated rates of 70-80%, but that
survey had a much longer recall period of 6-8 months; moreover, they pertained to early
years of the program, and to what are regarded as particularly poorly administered districts
(Niehaus and Sukhtankar, 2013a,b).
In addition to levels of corruption, there is also some limited evidence on determinants of
corruption. The broad takeaway from Niehaus and Sukhtankar (2013a) is that bureaucrats
14
respond acutely to incentives to steal from the NREGS, trading off increased rents today for
the ability to stay in the job and steal more tomorrow. In Niehaus and Sukhtankar (2013b),
we find that workers’ ability to use their voice to tackle corrupt bureaucrats may be limited,
unless possibly helped by NGOs.
Finally, the AP Smartcards experience suggests that strengthening state capacity to im-
plement the program may reduce corruption in a highly cost-effective manner. By building a
new payments infrastructure relying on electronic transfers to NREGS workers and biomet-
ric authentication at the time of payment collection, leakage reduced by 40% (Muralidharan
et al., 2016a). Another technological innovation - this time from the other end of the imple-
mentation capacity spectrum, in Bihar - suggests that using an electronic system for fund
request and transfer that bypassed the middle layers of districts and blocks also reduced
corruption in NREGS (Banerjee et al., 2015). In this case a reduction in outlays rather than
an increase in receipts was the major source of reduced leakage.
4 Conceptual frameworks
In order to understand the impact of NREGS, I present first the theoretical basis for impact,
and then the most commonly used empirical strategies for estimating impact.
4.1 Theoretical
The basic premise underlying a workfare program like the NREGS as opposed to welfare
involves self-selection (Besley and Coate, 1992). Since it is difficult for governments, partic-
ularly in developing countries like India, to evaluate households’ income, adding on a work
component helps target funds to those who are poor. In addition, the on-demand nature of
NREGS is meant to tackle the information problem that the government may not know ex-
actly when particular households need assistance. The self-selection logic has a long history;
apparently it was the rationale for public works programs in India under the British as well
as similar programs in the US (Dreze and Sen, 1990).
The impacts of NREGS on a number of outcomes can be understood through its primary
micro and macro impacts. First, at the micro level, the program affects the household
time optimization problem by allowing households to work at a (potentially) higher wage on
NREGS. It also provides insurance for households who may not be able to find employment
in the lean season. At the basic macro level, it channels additional funds into rural areas.
15

In addition, the program also creates public goods which may affect productivity.
In terms of the household time allocation decision, for households who choose to work
on NREGS, the time that is now allocated to NREGS work might come from leisure or
other non- or less-productive activity, or it might come from other market work. The extent
to which it comes from the former versus the latter is an important factor in determining
the efficiency impact of NREGS on the economy. How households re-optimize given the
new budget constraint determines the impact on various other outcomes, including potential
general equilibrium impacts that change factor prices in the economy.
For example, much attention has been placed on the impact of NREGS on labor markets,
particularly on private sector wages and employment. It is straightforward to show that in
the case of perfectly competitive markets, the introduction of NREGS with a wage above
the market wage will lead to increases in the private sector wage and falls in private sector
employment (Imbert and Papp, 2015a). Under non-competitive markets, such programs
may actually increase both wages and employment (Basu et al., 2009). Whether these labor
market impacts lead to increases in average household annual income depends on labor
supply and demand elasticities in both cases, although income increases are clearly more
likely in the latter case with non-competitive markets.
To this standard framework Basu et al. (2009) add important twists related to access and
credibility. As highlighted multiple times already, implementation of NREGS is uneven and
access imperfect; even with an on-paper guarantee, discretion over access is afforded to local
agents. Under this scenario, the government must choose both the wage and access; Basu et
al. (2009) show theoretically that the government could target aggregate employment and
achieve the right mix of private and government employment. However, in order to be able
to do so, its commitment to provide the set wage and access targets must be credible.
A variant of the household optimization decision is related to the insurance channel. If
NREGS is able to protect households against shocks and improve insurance, this may - for
example - lead farmers to invest in higher variance but higher average yield crops.
At the macro level, the first channel relates to public goods or assets created through
NREGS. If these public goods lead to an increase in productivity - for example irrigation
canals could increase agricultural productivity - this may lead to increased employment and
household income.
Finally, it is worth mentioning channels that work simply through additional funds that
flow into rural areas, and hence are not necessarily extra channels compared to standard
welfare schemes. The first channel is the aggregate demand/ multiplier channel: the addi-
16
tional flow of funds could increase local economic activity if there are local scale economies
or internal trade frictions (Krugman, 1991). A second channel could be that the additional
money helps reduce credit constraints more generally in areas receiving NREGS.
Impacts on other outcomes derive chiefly from these above described primary channels. For
example, one might see impacts on education related to changing labor market opportunities
for child versus adult labor, or to simple income effects. Similarly, changes in labor market
opportunities as well as income might affect migration, civil conflict, or health.
4.2 Empirical
In this section I discuss the main empirical strategies used to identify the effects of the
program. At the outset it is important to figure out what the strategies are identifying
the impact of. This is not as obvious as it seems. Given the wide deviations from the
abstract world of MNREGA discussed in Section 3 above, in fact there is no logical construct
pertaining to the effects of “the program”. Any empirical study claiming to study the impact
of NREGS is thus simply estimating the effects of varying implementation quality. One could
conceptualize a scale from 0-100, with zero being no program and 100 being a perfectly
implemented program; every paper that identifies the “impact of the program” actually
identifies the effect of moving along the scale. For example, studies that use the rollout of
the program for identification might be identifying the impact of going from 0 to 20 on this
scale; our paper on the Andhra Pradesh Smartcards experiment might be identifying the
impact of moving from 50 to 70 (all numbers arbitrary).
Given the vast proliferation of studies attempting to examine the impact of NREGS, it is
difficult to parse through the results of every single study. The difficulty is magnified since
many are still in working paper stage - given long publication processes - making it harder to
judge quality. To be as inclusive as possible, I used a variety of academic search platforms,
including Google Scholar, EconLit, and JSTOR, with various combinations of search terms
including India, national rural employment guarantee, and every acronym used for the act
and schemes. From this large list, papers that were published in the main economics, political
science, and development journals were automatically included. The remaining unpublished
papers were subjected to the following inclusion criteria
1. Sample selection and representativeness. The first criterion is that samples selected must
be representative, i.e. randomly drawn from a larger universal sample, particularly at
the level of the unit of analysis: generally households and villages. Some arbitrariness in
17
selection at larger units of aggregation - for example states and districts - is inevitable
given logistical challenges as well as simply studies that intentionally plan to study a
particular state.12 However, the unit that is analyzed must not suffer from selection
bias.
2. Plausible identification strategy. The second criterion, and the hurdle that most em-
pirical studies of NREGS impact stumble upon, is that papers must aim to separate
out causation from correlation. For reasons described below, this hurdle is particularly
challenging in the case of NREGS, but papers must at least attempt to deal with the
problem head-on, and describe the threats and challenges clearly.
3. Sample size and effective sample size. This criterion applies in the following cases: i) a
study attempts to show no effect, but does not adequately discuss whether it has the
statistical power and sample size to detect an effect and ii) a study attempts to show
an effect, but does not adequately cluster standard errors for intra-cluster correlation.
4.2.1 Common strategies: advantages and pitfalls
In order to not repeat when discussing individual papers, I describe below the main empirical
strategies used in assessing impact, and discuss their advantages and pitfalls as they relate
to the particular instance of the NREGS.
1. Experiments. The gold standard for causal inference is a randomized experiment. In the
most famous case of evidence from an RCT used to determine public policy, the initial
rollout of Mexico’s PROGRESA was randomly assigned, and provided incontrovertible
evidence in favor of its impact, thus leading to both scale-up as well as the ability to
withstand political pressure after a change in government. In the MNREGA case, the
initial rollout was obviously not randomized. However, given difficulties in implementa-
tion, there is scope for experimentation via interventions that improve functioning, as
in the Muralidharan et al. (2016a) case. Nonetheless, there are at least two difficulties
in conducting RCTs on NREGS; first, getting governments to agree to randomize, and
second, doing so at a large enough scale. The latter, in particular, is an underappre-
ciated issue: given the size of NREGS, it is bound to have general equilibrium effects,
and in order to capture these effects the size of units randomized, not just the number
of units randomized, must be large (Muralidharan et al., 2016b). The common criticism
12Of course most large states in India are larger than most countries in the world.
18
of experiments is that while they have strong internal validity, they may lack external
validity as they may be done on smaller samples. Of course, the same issue applies to
many non-experimental studies as well, for example those that only focus on one state.
2. Difference-in-differences. Given the non-experimental but staggered rollout, the obvious
and commonly used strategy is a difference-in-differences approach. This strategy allows
for level differences between districts in various phases of rollout, as long as the trend in
outcomes prior to implementation of MNREGA was the same. Unfortunately, the major
problem with this strategy is that trends were not actually parallel for the vast majority
of outcomes studied. For example, wages in Phase 1 and 2 districts seemed to be
converging to wages in Phase 3 districts, as seen in Figure 2 in Berg et al. (2012). Figure
6 in Imbert and Papp (2015a) also confirms that pre-trends in wages were not parallel,
using NSS data. Given that rural wage series were not parallel, the likelihood is that
other outcomes also do not exhibit parallel trends. A second, possibly underappreciated
issue with this strategy is related to the implementation issues highlighted in Section
3: it is difficult to interpret impacts from the rollout. Given these difficulties, the
estimated impacts may be of limited value when extrapolating to steady-state NREGS
implementation. Moreover, since NREGS mainly works in the summer months, one
year of difference between Phase 1 and Phase 2 implementation may not correspond to
a large difference in intensity of treatment.
3. Regression Discontinuity. Given the lack of parallel trends in difference-in-differences
designs, some researchers have used regression discontinuity designs to estimate the
causal impact of NREGS implementation. This idea is based on the assumption that
MNREGA phases were assigned by an algorithm based on an underlying continuous
variable that measured backwardness, with an arbitrary cutoff determining the 200
districts assigned to Phase 1. Thus districts just above and below the cutoff value
are quasi-randomly allocated to receive NREGS treatment early or late. The problem
with this strategy is that the selection of districts for Phases was not fully based on
a technocratic algorithm. There are at least two known deviations, with states and
districts facing Naxalite issues prioritized, and also each state had to have at least one
district in Phase 1. Other political considerations, particularly at the state level, are also
possible (Chowdhury, 2014; Gupta, 2006). Thus the discontinuity is not very sharp, and
the controls used for the underlying forcing variable assume importance. Moreover, since
the actual algorithm is not known, there is also a lack of transparency when compared
19
to the difference-in-differences approach in which one can easily evaluate whether pre-
trends are parallel. This strategy also faces the issue highlighted above, which is related
to limited implementation in early years.
4. Other. While the above two represent main empirical strategies, other strategies in-
cluding those based on using household panels and those based on using instrumental
variables (IV) have also been used by researchers examining the impact of NREGS. For
these strategies, the standard issues remain: panels don’t account for selection in and
out of NREGS, and IV strategies must not have weak instruments and must satisfy
the exclusion restriction. Moreover, studies based on comparing participants to non-
participants may be biased if the program also affects non-participants, for example via
general equilibrium effects.
5 The Impact of NREGS
In this section I discuss the impact of the NREGS on six main categories of outcomes: labor
markets, income and consumption, education and health, migration, agricultural choices,
and conflict. In each case, I attempt to distill the key takeaways from the current literature,
and also highlight areas of conflicting research or missing knowledge.
5.1 Labor markets
Perhaps unsurprisingly, the impact of NREGS on labor markets has been intensely studied.
At least four papers study the impact using nationwide data and the phased in rollout for
identification, with another paper relying on experimental variation in Andhra Pradesh. The
main outcomes studied are private sector wages and employment.
The only published paper (Imbert and Papp, 2015a) uses the difference-in-differences
approach (empirical strategy 2 above) and NSS data for the periods 2004-05 (pre-MNREGA)
and 2007-08 (post-MNREGA) to find that private sector wages for casual labor (temporary,
informal contracts as defined by the NSS) rose by 4.7 percent as a result of NREGS. This
strategy basically compares trends in Phase 1 and 2 districts (“early phase”) to Phase 3
districts (“late phase”). They further find that the wage effect is concentrated in “star states”
- those states that implemented NREGS well. They attempt to control for the fact that wages
in the early phase districts were already converging to wages in late phase districts prior to
MNREGA by using district-level pre-program controls for caste composition, agricultural
20
wages and agricultural output per worker, as well as time-varying controls capturing rainfall
and the election cycle (separately for early and late phase districts. Worker level controls
attempt to control for selection into the labor force. The paper also finds that NREGS
employment crowds-out private sector employment (defined here as including casual labor,
salaried work, domestic work, and self-employment) almost one-for-one - a 1.17 percent
increase in public sector employment to a 1.46 percent decline in private sector work.
Using a similar approach and the same data, Azam (2012) finds broadly similar results.
He finds an increase in public employment resulting from NREGS, as well as an increase in
labor force participation, particularly for women. The results on wages are strikingly similar,
with a 5 percent overall increase in real wages due to NREGS. This paper also presents the
increase in wages separately for men and women, and finds that the increase for women (8
percent) is higher than the increase for men (3.8 percent).
Using a similar approach and different data, Berg et al. (2012) also find extremely similar
overall wage results as the previous two papers. This paper uses the Agricultural Wages
in India (AWI) series which provides wage rates at the month-district level, separating out
wages for unskilled labor and skilled labor, and even including various sub-categories such
as field labor including ploughing, sowing, weeding, and reaping. The headline result is
that real agricultural wages increased by 4.8 percent per year as a result of NREGS, with
the effects concentrated in the main agricultural season (i.e. the non-NREGS season). The
authors find no difference in impact on men’s versus women’s wages.
A change in empirical approach, however, leads to somewhat more substantial differences
in results. Zimmermann (2015) uses a regression discontinuity approach - empirical strategy
3 above - and the same NSS data to argue that NREGS did not lead to increases in public
employment or private sector wages. The advantage of the RD approach is that it does not
need the parallel trends assumption. On the other hand, it requires other assumptions on
assignment to treatment and control, which are difficult to evaluate since the “algorithm
values are not directly publicly available”; and also is most meaningful for the districts
closest to the cutoff between Phases 2 and 3. In addition, it is important to note that the
comparisons are between different samples: Zimmermann (2015) compares Phase 2 to Phase
3 districts, while the other papers all compare both Phase 1 and Phase 2 districts to Phase 3
districts. Since Phase 2 started in April and May 2007, while the NSS data collection started
on 1 July 2007, some of these Phase 2 districts will have barely had any experience with
NREGS; as the author notes, given implementation issues and the time taken to scale up the
program, many Phase 3 districts did not actually receive the program until after July 2008
21
even though officially the program started in April 2008. So the non-results in this paper
are not incompatible with the positive wage effects found in the other papers, particularly
given the large standard error bounds.
Although the results from the different approaches are reconcilable, it would be ideal if
there were a way to positively adjudicate using an empirical strategy that relies on less strong
assumptions. While experimental evidence at the all India level is not available, our experi-
ment examining Smartcards which improved the functioning of NREGS in Andhra Pradesh
provides a benchmark (Muralidharan et al., 2016b). We find that private sector wages for
unskilled labor increased by 6.2 percent in the month of June as a result of improvements
in NREGS, consistent with results in Imbert and Papp (2015a); Azam (2012); Berg et al.
(2012). It is interesting to note that the impact on wages of improving NREGS is of the
same magnitude or even slightly higher than that of the introduction of NREGS, which
again highlights the importance of implementation, and the fact that all papers are basically
identifying the impact of a shift on a scale of implementation. Moreover, this magnitude
may in fact be biased downward due to spillover effects onto control areas, for which we find
strong evidence.
In addition to the wage results, we find no statistically significant effects on private sec-
tor employment, again for the month of June. However, these are not incompatible with
the results in Imbert and Papp (2015a), since their measure of private sector employment
includes domestic work and self-employment. Since we ran our own survey and are able to
separate the types of work, we run separate regressions and find no effect on working for
others but a decline in self-employment and idle time. This is thus compatible with the
explanation provided in their paper which suggests that “the fall in private sector work may
in part represent a fall in disguised unemployment or private sector work with close to zero
productivity.”13
So what should the discerning reader take away from these results about the impact of
NREGS on the labor market? It seems very reasonable to conclude the program had a
modest positive effect on wages for agricultural/ unskilled labor. However, questions remain
about the precise seasonality of the effects. While it is most likely that wage effects happened
during times that NREGS was most active, it is also possible - particularly given nominal
13Zimmermann (2015) makes explicit in her paper the choice between working in the private sector forsomeone else, working for yourself, and working on NREGS, and points out that the former two may besubstitutes. In this model, if NREGS provides an insurance benefit, then one might choose to work foryourself rather than work in the stable private sector. While this is a helpful model in distinguishingbetween labor choices, the predicted results are the opposite of what we find in Andhra Pradesh.
22
wage rigidities (Kaur, 2015) - that these effects persist throughout the year. Moreover, the
effect of this “crowd-out” on productivity is still uncertain. Finally, the channels via which
wages increased are yet to be positively identified; while Imbert and Papp (2015a) and Azam
(2012) both seem to rule out an increase in labor productivity as a result of NREGS assets,
there is no actual evidence on the this. Indirect evidence from Muralidharan et al. (2016b)
suggests that perhaps there is a productivity effect; total employment in treated areas -
which saw work done on NREGS go up - increased (although not statistically significantly),
while total employment in control areas - which only saw wages increase as a result of labor
market competition - declined, suggesting perhaps that there was a productivity increase.
5.2 Income and consumption
How did the changes in labor markets affect income and consumption for poor households?
Given the uncertainty over private sector employment effects, it is not clear that an increase
in wages would unambiguously lead to increases in income and consumption. The additional
channel of insurance, which may lead to different agricultural choices (as discussed below),
might also lead to changes in income.
At the all India level, Klonner and Oldiges (2013) use NSS data and a combination of
strategies to attempt to tease out the effect of NREGS on consumption and poverty. They use
a fuzzy RD design that recognizes the fact that there was political interference in assignment
of districts to phases, combined with a difference-in-differences approach. They find no
overall effect of the program on consumption and poverty. While they claim to find a
reduction in poverty amongst SC/STs, this result is not robust, and the specification with
the most straightforward application of the fuzzy RD design does not show any significant
effects on consumption and poverty.
More unambiguous and robustly identified results come from Andhra Pradesh. The Smart-
cards experiment mentioned above led to a substantial improvement in the functioning of
NREGS, including higher payments to households, and also led to higher private sector
wages. The paper finds that the net effect of this improvement is a significant and ro-
bust increase in household income, verified not only in survey data, but also the entirely
independent Socio-Economic and Caste Census (SECC) that was conducted concurrently
(Muralidharan et al., 2016b). The survey data consists of a representative sample of jobcard
holders and pensioners (close to 70% of rural households), and they find an increase of Rs.
8761 (12.7%) in annual income. The SECC by definition tracks every single rural household,
23

and here they find that the highest income earner in the household was 24.7% more likely to
move out of the lowest income category (< Rs. 5000 monthly income) in treatment areas.
Interestingly, the vast majority of the increases in income are due to effects on the private
sector rather than directly through NREGS. Increases in NREGS income accounted for
only 1/9th of the income gains for NREGS beneficiaries, with the remaining coming from
increases in the private sector earnings, suggesting that general equilibrium effects of NREGS
are important. While we do not find statistically significant effects on consumption, our
standard errors are large given the difficulty in precisely measuring consumption in a survey
that mainly focused on NREGS functioning. We also do not find evidence of distortions
from NREGS on allocation of land or labor, although absence of evidence is not of course
evidence of absence. A dispositive identification of precise channels is not possible given our
data.
Our experimental evidence from Andhra Pradesh is corroborated by other evidence from
the same state. Ravi and Engler (2015), use panel data and the fact that some households
were denied employment in order to identify effects, comparing households who applied for
work and received it to households that also applied for work but did not receive it. They
find increases in consumption and food security as a result of work on NREGS. Although
the sample is somewhat restrictive - it consists of a thousand ultra-poor households from two
hundred villages in one district - the results are robust. Deininger and Liu (2013) also use
panel data from the same state, with a slightly larger sample (4000 households in 480 villages
and 5 districts) and a difference-in-differences approach. They find increased consumption,
particularly nutrition, for program participants compared to non-participants. The results
however must be viewed with some caution given the possibility for selection bias to affect
findings; also, given the fact that private wage effects obviously affect non-participants as
well, households may not be the right unit for comparison.
The key takeaway from this section is that it is likely that in places that implemented the
program well - like Andhra Pradesh - there were indeed increases in income. Moreover, since
NREGS income comprises a small part of overall income, any significant increases in income
must come from effects on private sector labor markets. Nonetheless, the precise channels
for any increase remain unclear, as does the evidence for median implementing state.
24

5.3 Education and health
Readers who have not followed the literature will perhaps be surprised to note that the
impact of NREGS on education has been more heavily studied than either the impact on
labor outcomes or income. Perhaps this is an artifact of data availability, or perhaps it is
the fact that the theoretical impact on education is ambiguous. The ambiguity results from
the potential of NREGS to have both income and substitution effects. If NREGS increases
incomes, then educational outcomes are likely to be positively affected. However, NREGS
also increases the opportunity cost of time, particularly for older kids who may be able
to work on NREGS themselves (despite adult-only rules), or be close substitutes for adult
labor and hence do more work in households or farms. These children may hence drop out
of school, reducing enrollment and eventually test scores.
Consistent with the ambiguous theoretical impact, the empirical literature finds a variety
of seemingly conflicting results. However, a closer examination of the breakdown of results
and data sources actually reveals a number of consistent stories, which I highlight below.
Perhaps the most comprehensive and clear paper uses data from Pratham’s Annual Status
of Education Report (ASER) as well as the NSS, combined with a difference-in-differences
strategy, to examine effects on test scores, enrollment, and child labor (Shah and Steinberg,
2015). The key advantage of ASER is that it tests children both in and out of school, with
a consistent methodology and a large (500,000), representative, repeated cross section. This
paper finds that NREGS leads to lower math and reading test scores for all children, with
the effects concentrated on older children (13-16). In addition, they find that enrollment
drops by two percentage points for 13-16 year olds with each additional year of exposure to
NREGS. These results are corroborated by data from the NSS, which suggests that children
aged 13-17 are 3 percentage points more likely to work, with girls doing more domestic work
and boys doing more productive work.
Consistent with the opportunity costs of time hypothesis, there are no or limited effects
for younger children (5-12). Meanwhile, the youngest children (2-4) benefit as a result of the
income effect, with increased test scores and higher enrollment at age 5. Shah and Steinberg
(2015) are able to show using NSS data that trends in educational outcomes were most likely
parallel, and also include phase specific linear time trends to assuage concerns regarding the
violation of the parallel trends assumption.
Islam and Sivasankaran (2015) also use NSS data and a difference-in-differences strategy
to unsurprisingly find similar results. They find that older children (15-17) spend 18% more
time working outside the household as a result of NREGS, while younger children (6-9)
25

spend 3% more time in school. They corroborate these results with panel data from 3 states
collected by the NSS, although it is not clear how the identification strategy in the latter
case is any different.
Using a different dataset - District Information System for Education (DISE), based on
school level data - Li and Sekhri (2013) examine the impact of NREGS on school enrollment
and pass rates. Like the previous papers, this one also finds declines in primary school
enrollment, on the order of 1 percentage point. A slight difference is that the results here
are driven mainly by primary schools (grades 1 through 5, or roughly ages 6-10) rather than
upper primary school (ages 11-13), but this could be explained by differences in the types
of schools that only offer upper primary schooling, and the paper does not have data on the
older kids in secondary school that might be most affected by NREGS. Li and Sekhri (2013)
also find declines in educational attainment, with pass rates declining and repeat rates rising
in private schools. The authors are able to include school and year fixed effects, and can
also show that differences in trends were not apparent in outcomes prior to the rollout of
NREGS.
A paper that also uses the ASER data but a regression discontinuity based empirical
strategy seems to find contradictory results to the papers above (Thomas, 2015). This
paper suggests that educational outcomes, including enrollment and test scores, actually
improved as a result of NREGS. However, the same paper shows strongly significant pre-
program differences in educational outcomes; and while it claims to show parallel trends
in educational outcomes pre-program, this is simply not possible as the ASER data only
starts in 2005-06, providing only one year of pre-program data. These results must thus be
discounted. The same paper, however, uses the District Level Household and Facility Survey
(DLHS-3 and DLHS-2) for 2007-08 and 2002-04, and seems to find improvements in child
and maternal health outcomes. These results would be consistent with the improvements in
schooling outcomes for younger children that the other papers find.
Another two studies which seemingly contradict the negative education results above are
in fact both based on data from only one state - Andhra Pradesh. The first uses data
from the Young Lives Panel Study, which covers 6 districts in Andhra Pradesh with 757
children residing in rural areas (Mani et al., 2014). Given this small sample of districts, 4
of which were in early phases of NREGS and 2 in later phases, the effective variation in the
sample is limited. The second paper uses sub-district level rainfall to instrument for female
participation in NREGS, and finds that this led to increased girls time spent in school, grade
progression, and female bargaining power (Afridi et al., 2012).
26

While the specifics may vary, and reading only the titles and abstracts of the papers may
give one a misleading impression, closer examination of all the other papers on the impact
of NREGS on education reveals that the set of results in Shah and Steinberg (2015) are
mostly corroborated. Educational enrollment and attainment worsened for older children,
while these outcomes and possibly health outcomes too improved for the youngest children.
5.4 Migration
Compared to education, papers examining the impact of NREGS on migration are few and
far between. Preventing short term, distress migration was one of the goals of NREGS as
a safety net Khera (2011). Moreover, the impact of NREGS on migration is ambiguous -
while distress migration might decrease, longer term rural-urban migration might increase as
a result of increased income, which may help mitigate risky migration (Bryan et al., 2014).
But the lack of data on migration is a binding constraint.
Imbert and Papp (2015b) is the notable exception. They use original survey data from
three states as well as NSS data to show that short-term migration is lower as a result
of NREGS. In their survey, eight percent of adults report not having migrated as a result
of NREGS. In addition, places that provide more government work exhibit less short-term
migration. Finally, data from the NSS in 2007-08 shows a lower incidence of short-term
migration in early phase districts as compared to late phase districts.
Our results from Andhra Pradesh are not exactly consistent with the above results (Mu-
ralidharan et al., 2016b). We find no significant results on migration, with the coefficient
being small and positive on both the extensive and intensive margins. However, these results
are based on slightly different questions related to migration, which ask how many days re-
spondents spent working outside their village. Moreover, the results relate to only one state;
thus, they do not necessarily contradict Imbert and Papp (2015b).
Overall, while it is likely that NREGS reduced short-term distress migration, more research
on this topic - particularly on impacts related to long-term structural transformation - would
be welcome.
5.5 Agricultural choices
Given the impacts on labor markets, and the potential insurance provided by the scheme,
potential impacts on agricultural choices may be expected. For example, if wages increase,
landlords may switch to more capital-intensive technologies. If households are confident
27
about the insurance value of NREGS, they may invest in higher yield, higher variance crops.
Bhargava (2014) examines the first possibility, focusing on technology adoption decisions
by landlords. The paper uses data from the Indian Agricultural Census Input Survey (ACIS),
collected in 2007, and the regression discontinuity approach, comparing districts just around
the Phase 1 and Phase 2 cutoff. It finds that NREGS reduces the proportion of farms using
labor-intensive technologies, while increasing the proportion of farms using animal-intensive
technologies, both by approximately 20 percentage points. These results are consistent with
farmers moving to labor-saving methods in response to higher wages.
Gehrke (2015) examines the second possibility, focusing on crop choices by farmers. The
paper uses panel data from the Young Lives Panel Study in six districts in Andhra Pradesh,
four of which were part of Phase 1 and the remaining two part of Phases 2 and III. The
results suggest that households in the phase 1 districts were more likely to increase the risk
profile of their crop mix. However, as in the Mani et al. (2014) paper that uses the same data
above, the variation in treatment is limited, and the results must be viewed with caution.
This is another topic on which further research would be welcome, since while the labor-
saving technologies result appears reasonable, there is not much else that can be said on this
very important issue.
5.6 Conflict
Another area which has received substantial attention - to the extent that an entire panel
for a broad development conference in the United States was titled “Impact of NREGS
on Conflict” - is civil violence. Perhaps this topic particularly interests researchers since
an explicit goal of MNREGA was to assist areas afflicted by the Maoist insurgency, or
perhaps it is interesting since theoretically effects could go different direction. For example,
the competition over resources theory of conflict would suggest that the greater financial
resources that NREGS brings in would lead to increased conflict, while the opportunity cost
of time theory of conflict would predict reduced violence given increased higher wages result
in an increased opportunity cost of participating in violence.
Dasgupta et al. (2015) use an originally constructed panel dataset on Maoist conflict
violence combined with a difference-in-differences approach to examine the impact of NREGS
on both violent incidents and deaths. The dataset is based on local language press sources,
allowing for a more comprehensive cataloguing of violence, from 144 districts in six states in
the Maoist affected “red belt.” The paper finds that NREGS leads to reduced violence, with
28
a large (50%) drop in violent incidents, that is larger in districts experiencing negative rainfall
shocks. Importantly, the results are entirely driven by Andhra Pradesh and Chattisgarh, two
high capacity states, to the extent that the authors state that there is no effect of NREGS
in the non-star states.
Given that NREGS was targeted to Maoist-affected districts, this paper faces an increased
burden of convincing readers that the parallel trends assumption holds. It attempts to do so
by including as controls a “backwardness index” which strongly predicts NREGS assignment
to phases, as well as an indicator for “left-wing extremist” district interacted by year. With
both district and year fixed effects in addition to the latter control, however, it is not clear
how much variation remains to identify the effects.
Fetzer (2014) focuses not on the overall impact of NREGS rollout on violence, but rather
on the impact of NREGS on the link between rainfall and violence. The paper points out
that rainfall shocks increase civil violence, and also affect agricultural output in wages. The
author also collects his own data on violence, using a semi-automatic technique based on
Natural Language Processing Tools. The paper uses an interaction of rainfall variation with
NREGS rollout, and shows basically that NREGS attenuates violence related to rainfall,
likely by providing insurance. While the results seem plausible, how the precise timing of
rainfall shocks interact with violence and NREGS rollout is a bit unclear.
Khanna and Zimmerman (2014) use a regression discontinuity design, with both cutoffs
(between Phase 1 and Phase 2 as well as Phase 2 and Phase 3), and data from the South
Asian Terrorism Portal (SATP), to examine impacts on civil violence. They find that violence
increases in the very short run, with increases in police-insurgent violence as well as attacks
on civilians by insurgents. However, the results are not apparent from the discontinuity
graphs. Moreover, the paper again must deal with the issue of violations of RD specifically
related to Maoist insurgency, which it attempts to do by dropping districts.
Finally, Amaral et al. (2015) examine the impact of NREGS on domestic, rather than
civil violence. They use data from the National Crime Record Bureau focusing on violence
against women, combined with a difference-in-differences approach that compares Phase 1
to Phase 3 districts. The idea is that increased female labor force participation - induced by
NREGS - could lead to women’s empowerment, but also increase domestic conflict. They
find that NREGS actually increases reports of domestic violence, but reduces cases of dowry
deaths. The paper uses controls to attempt to control for trends, but does not show the
basic parallel trends graph that would be helpful to gauge the assumption. Moreover, given
massive underreporting of incidents (Iyer et al., 2011), it is difficult to know whether the
29

impacts are on actual violence or merely reports.
Given the differing data sources, results, and issues with identification, it is difficult to
conclude much about the impact of NREGS on civil insurgency or domestic violence.
6 Outstanding questions
As the previous section makes clear, while we have learned from studies of NREGS impact,
there are still large holes in our knowledge that need to be filled. In addition to the spe-
cific issues highlighted in each subsection above, the following three broad areas represent
important open questions that will help our understanding of NREGS:
1. Labor efficiency impact. While we know that NREGS raised rural private sector wages,
and at the very least crowded out self-employment labor, we don’t know the net impact
on efficiency. This is very important to settle the debate over whether NREGS is
drawing away labor from productive uses in order to simply dig holes and fill them
up, whether it is simply providing employment to under-employed labor, or possibly
even breaking up non-competitive rural labor markets and enhancing efficiency. Given
data and identification constraints, it seems as though it will be difficult to answer this
question for the roll-out of the program. However, intensive margin changes as well as
improvements in implementation may allow us to make some progress on this subject.
2. Public goods creation. There are a large number of papers that study the assets cre-
ated by NREGS. However, a large scale, representative study that actually measures
return on investment is lacking. Moreover, whether these assets actually raise labor
productivity is a question that no reasonable study has been able to answer. This is
disappointing, because we are currently stuck with the extreme (and likely extremely
inaccurate) views of supporters and detractors. Unlike other questions the answers to
which rely on (difficult to find) exogenous variation, simply documenting the existence
and value of these assets is eminently doable. For example, Ranaware et al. (2015)
survey assets and households in 20 of the 33 districts in Maharashtra, documenting ex-
istence, type, and villager perceptions of usefulness. While in principle this study can be
informative, sample selection is flawed: the study selects the five best performing GPs
in the best performing block in each district. This severely limits the interpretation of
a statistic like 87% of completed works were found to be in existence a year and a half
after completion.
30

3. Longer term effects. Finally, many of the impact studies use the rollout of NREGS for
identification. As pointed out earlier, given implementation problems at the outset these
studies only capture a small part of the impact of steady state NREGS. Steady state,
long run impacts on major outcomes such as rural labor supply, rural labor demand,
migration, and technology adoption are nowhere to be found. Perhaps we will never
be able to identify these impacts, given that NREGS is universal and the gap between
phases is too small, so that long run impacts are not detectable. But at the very least
an attempt at capturing these impacts would be welcome.
7 Conclusion
I conclude not with a summary of findings, but rather lessons for the future from the experi-
ence of doing research on NREGS, as well as prospects for the near and middle term future
of the program.
Perhaps the abiding lesson is to build in evaluation prior to the rollout of any large
programs. Early evaluation might help in answering the big questions, and quell pointless
debate. This is not to criticize the founders of MNREGA: I appreciate that doing public
policy and getting acts passed through Parliament is difficult, and what precious political
momentum is available has to be seized. Moreover, the pressure to implement is enormous;
everyone wants to do, not necessarily do right. Nonetheless, since knowledge and learning
are public goods and no individual bureaucrat has the incentive to provide them, future
programs may do well to build in incentives to learn. The research environment of today, in
which large and rigorous experimentation is not unheard of, makes such learning possible.
Another lesson is to think harder about how mandates to capture data will actually be
implemented, and also plan for easy data dissemination from the outset. For example, Witsoe
(2014) notes that “The actors who create and maintain NREGASoft in Delhi have almost no
control over the documentary practices of the officials who produce the paper documentation
that is entered into the software platform.” Figuring out incentives for these local actors to
provide accurate data is of course far easier said than done, but must be attempted.
What about the future of the program itself? Does the evidence suggest that is a well-
designed program that might perhaps be badly implemented but has scope for improvement,
or a fundamentally faulty program that should be not be expected to alleviate poverty? This
question is particularly important in light of the recent advances in payments infrastructure,
via which a cash transfer program might be implemented. For example, calculations by
31

Dutta et al. (2014) suggest that a (hypothetical) crude cash transfer scheme would dominate
the NREGS in poverty reduction in Bihar.
Given that specific evidence is not available at the moment to answer the questions above,
I must step now into the realms of conjecture. I have two thoughts, deriving from my
own experience in conducing research on NREGS and on Direct Benefit Transfer (DBT)
initiatives, as well as from reading the literature. The first is that at the moment, the
state of infrastructure and implementation capacity does not support a large-scale shift to
pure cash transfers (Bihar hypothetical notwithstanding - most states have better NREGS
implementation). While this may change in the future - the demonetization policy just
introduced might push electronic payments further - purely based on anticipated problems
with logistics and targeting, such a shift does not seem currently warranted.
Second, NREGS has two features that are not shared by cash transfers: the creation
of public assets and changes in bargaining power for recipients which may impact non-
participants through general equilibrium effects on wages. Both these features may increase
output in the rural economy beyond what might be possible via simple cash transfers (the
latter via effects on potential monopsonistic labor markets). To date, evidence that these
features of NREGS may be influential is limited to the Muralidharan et al. (2016b) study
in Andhra Pradesh; however, if these results extrapolate to other states, this would indicate
that design features of NREGS are truly important and worth persevering with.
Ultimately, as Mr. Amarjeet Sinha (Secretary, Ministry of Rural Development) has pointed
out, the NREGS is not meant to be seen as a program in eternity: “no developed country
has a pool of 5 crore households wanting to do unskilled wage labour.” In the interim, the
NREGS is likely to remain a key policy for protecting rural households.
I end on a hopeful note. The fact that heterogeneity is enormous has been repeated ad
nauseam. The implications for policy, however, are that there is a balance needed between
central schemes and rules and allowing states to experiment to find local solutions. The
Andhra Pradesh experience with Smartcards suggests both that continued tinkering with
NREGS implementation may have large benefits, and also that these modular changes to
the program may allow for careful and rigorous evaluation. Down this path lies the likeliest
probability of success for large public programs such as the NREGS.
32
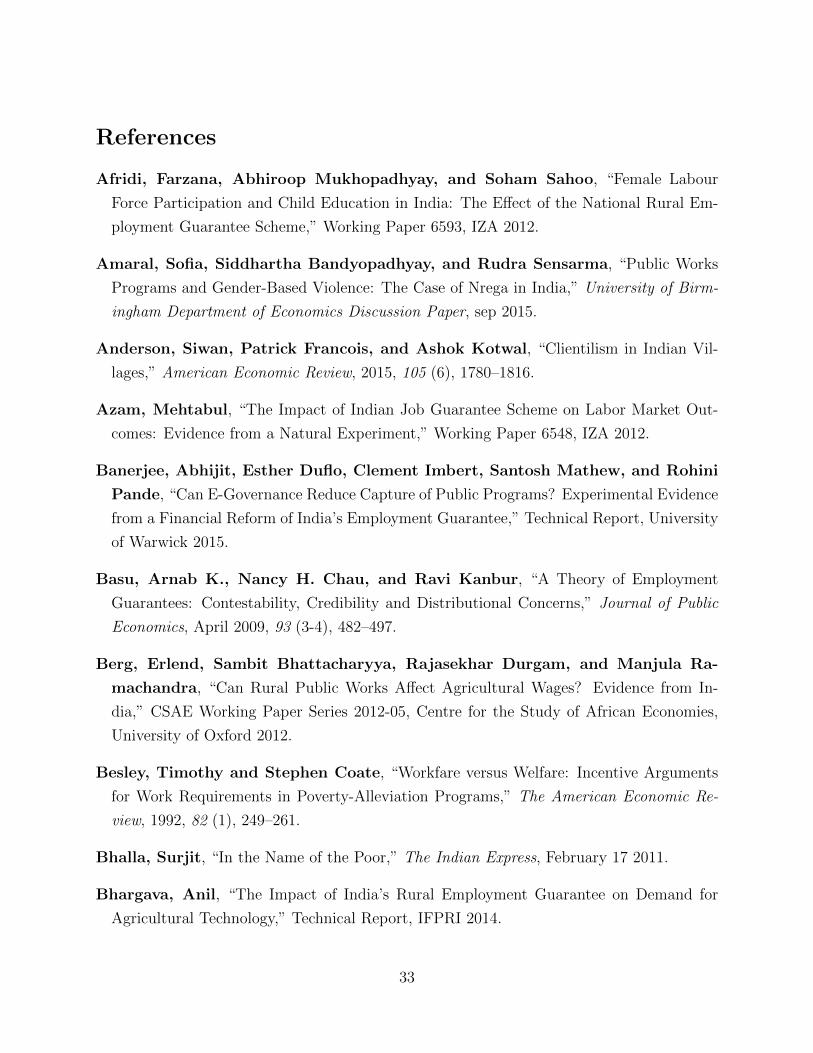
References
Afridi, Farzana, Abhiroop Mukhopadhyay, and Soham Sahoo, “Female Labour
Force Participation and Child Education in India: The Effect of the National Rural Em-
ployment Guarantee Scheme,” Working Paper 6593, IZA 2012.
Amaral, Sofia, Siddhartha Bandyopadhyay, and Rudra Sensarma, “Public Works
Programs and Gender-Based Violence: The Case of Nrega in India,” University of Birm-
ingham Department of Economics Discussion Paper, sep 2015.
Anderson, Siwan, Patrick Francois, and Ashok Kotwal, “Clientilism in Indian Vil-
lages,” American Economic Review, 2015, 105 (6), 1780–1816.
Azam, Mehtabul, “The Impact of Indian Job Guarantee Scheme on Labor Market Out-
comes: Evidence from a Natural Experiment,” Working Paper 6548, IZA 2012.
Banerjee, Abhijit, Esther Duflo, Clement Imbert, Santosh Mathew, and Rohini
Pande, “Can E-Governance Reduce Capture of Public Programs? Experimental Evidence
from a Financial Reform of India’s Employment Guarantee,” Technical Report, University
of Warwick 2015.
Basu, Arnab K., Nancy H. Chau, and Ravi Kanbur, “A Theory of Employment
Guarantees: Contestability, Credibility and Distributional Concerns,” Journal of Public
Economics, April 2009, 93 (3-4), 482–497.
Berg, Erlend, Sambit Bhattacharyya, Rajasekhar Durgam, and Manjula Ra-
machandra, “Can Rural Public Works Affect Agricultural Wages? Evidence from In-
dia,” CSAE Working Paper Series 2012-05, Centre for the Study of African Economies,
University of Oxford 2012.
Besley, Timothy and Stephen Coate, “Workfare versus Welfare: Incentive Arguments
for Work Requirements in Poverty-Alleviation Programs,” The American Economic Re-
view, 1992, 82 (1), 249–261.
Bhalla, Surjit, “In the Name of the Poor,” The Indian Express, February 17 2011.
Bhargava, Anil, “The Impact of India’s Rural Employment Guarantee on Demand for
Agricultural Technology,” Technical Report, IFPRI 2014.
33

Bryan, Gharad, Shyamal Chowdhury, and Ahmed Mushfiq Mobarak, “Underin-
vestment in a Profitable Technology: The Case of Seasonal Migration in Bangladesh,”
Econometrica, 2014, 82 (5), 1671–1748.
Chowdhury, Anirvan, “Poverty Alleviation or Political Calculation? Implementing Indias
Rural Employment Guarantee Scheme,” Technical Report, Georgetown University 2014.
Dasgupta, Aditya, Kishore Gawande, and Devesh Kapur, “(When) Do Anti-poverty
Programs Reduce Violence? India’s Rural Employment Guarantee and Maoist Conflict,”
Technical Report, Harvard University 2015.
Deininger, Klaus and Yanyan Liu, “Welfare and Poverty Impacts of India’s National
Rural Employment Guarantee Scheme Evidence from Andhra Pradesh,” Policy Research
Working Paper Series 6543, World Bank 2013.
Desai, Sonalde, Prem Vashishtha, and Omkar Joshi, Mahatma Gandhi National Rural
Employment Guarantee Act: A Catalyst for Rural Transformation, National Council of
Applied Economic Research, 2015.
Dreze, Jean and Amartya Sen, Hunger: Economics and Policy, Oxford University Press,
1990.
and Christian Oldiges, “Work in Progress,” Frontline, 2009, 26.
Dutta, Puja, Rinku Murgai, Martin Ravallion, and Dominique van de Walle,
“Does India’s Employment Guarantee Scheme Guarantee Employment?,” Policy Research
Working Paper Series 6003, World Bank 2012.
, , , and , “Testing information constraints on India’s largest antipoverty pro-
gram.,” Policy Research Working Paper Series 6598, World Bank 2013.
, , , and , Right to Work? Assessing India’s Employment Guarantee Scheme in
Bihar, Washington D.C.: World Bank, 2014.
Fetzer, Thiemo, “Social insurance and conflict: evidence from India,” Job Market Paper,
November, 2014, 14.
Gaiha, Raghav, Shylashri Shankar, and Raghbendra Jha, “Targeting Accuracy of the
NREG: Evidence from Rajasthan, Andhra Pradesh and Maharashtra,” Canberra: ASARC
Working Paper, 2010, 3.
34

Gehrke, Esther, “An employment guarantee as risk insurance? Assessing the effects of the
NREGS on agricultural production decisions,” Technical Report, German Development
Institute 2015.
Gulzar, Saad and Benjamin Pasquale, “Politicians, Bureaucrats, and Development:
Evidence from India,” Manuscript, New York University, 2015.
Gupta, S., “Were District Choices for NFFWP Appropriate?,” Journal of Indian School of
Political Economy, 2006, 18 (4), 641–648.
Imbert, Clement, “MGNREGS Labor Markets and Poverty,” Technical Report: Back-
ground paper for the Social Protection and Labour India Team, World Bank 2014.
and John Papp, “Estimating leakages in India’s employment guarantee,” in Reetika
Khera, ed., The Battle for Employment Guarantee, Oxford University Press, 2011.
and , “Labor Market Effects of Social Programs: Evidence from India’s Employment
Guarantee,” American Economic Journal: Applied Economics, 2015, 7 (2), 233–263.
and , “Short-term Migration, Rural Workfare Programs and Urban Labor Markets:
Evidence from India,” Technical Report, Oxford University 2015.
Islam, Mahnaz and Anita Sivasankaran, “How does Child Labor respond to changes
in Adult Work Opportunities? Evidence from NREGA,” Technical Report, Harvard Uni-
versity 2015.
Iyer, Lakshmi, Anandi Mani, Prachi Mishra, and Petia Topalova, “The Power of
Political Voice: Women’s Political Representation and Crime in India,” American Eco-
nomic Journal: Applied Economics, 2011, 4 (4), 165–193.
Kaur, Supreet, “Nominal wage rigidity in village labor markets,” NBER Working Paper
Series 20770, National Bureau of Economic Research, Inc 2015.
Khanna, Gaurav and Laura Zimmerman, “Guns and Butter? Fighting Violence with
the Promise of Development,” Technical Report, University of Michigan 2014.
Khera, Reetika, The Battle for Employment Guarantee, Oxford University Press, 2011.
35

Klonner, Stefan and Christian Oldiges, “Can an Employment Guarantee Alleviate
Poverty? Evidence from India?’s National Rural Employment Guarantee Act,” Technical
Report, University of Heidelberg 2013.
Krugman, Paul, “Increasing Returns and Economic Geography,” Journal of Political Econ-
omy, 1991, 99 (3), pp. 483–499.
Lakha, Salim and Pradeep Taneja, “Balancing Democracy and Globalisation: The Role
of the State in Poverty Alleviation in India,” South Asia: Journal of South Asian Studies,
2009, 32 (3), 408–424.
Li, Tianshu and Sheetal Sekhri, “The Unintended Consequences of Employment Based
Safety Net Programs,” Technical Report, University of Virginia 2013.
Mani, Shubha, Jere Behrman, Shaikh Ghalab, and Prudhvikar Reddy, “Impact of
the NREGS on Schooling and Intellectual Human Capital,” Technical Report, University
of Pennsylvania 2014.
Marcesse, Thibaud, “Public Policy Reform and Informal Institutions: A Moral Economy
of Poverty Alleviation in Rural India,” Technical Report, Cornell University 2016.
Ministry of Finance, Economic Survey of India 2014.
Ministry of Rural Development, The National Rural Employment Guarantee Act 2005:
Operation Guidelines 2013, 4th ed., Government of India, 2013.
Muralidharan, Karthik, Paul Niehaus, and Sandip Sukhtankar, “Building State
Capacity: Evidence from Biometric Smartcards in India,” American Economic Review,
2016, 106 (10), 2895–2929.
, , and , “General Equilibrium Effects of (Improving) Public Employment Programs:
Experimental Evidence from India,” Technical Report, University of California San Diego
2016.
Murgai, Rinku and Martin Ravallion, “Is a guaranteed living wage a good anti-poverty
policy?,” Policy Research Working Paper Series 3640, The World Bank June 2005.
Niehaus, Paul and Sandip Sukhtankar, “Corruption Dynamics: The Golden Goose
Effect,” American Economic Journal: Economic Policy, 2013, 5.
36
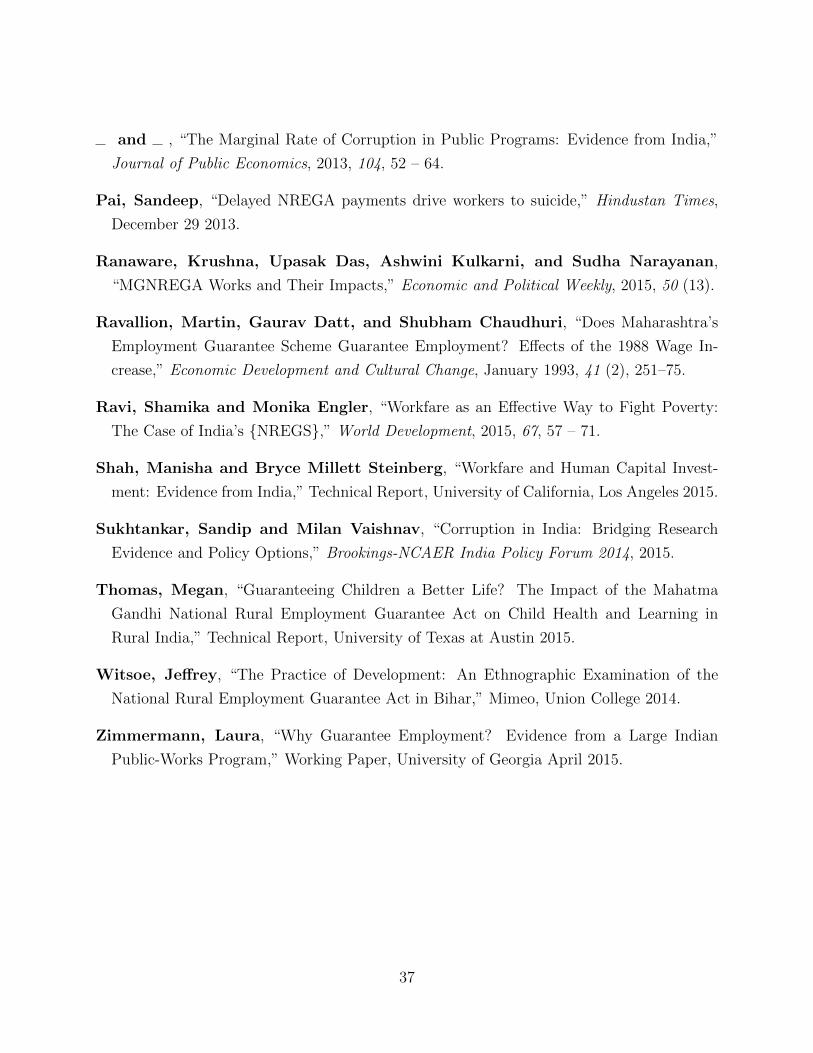
and , “The Marginal Rate of Corruption in Public Programs: Evidence from India,”
Journal of Public Economics, 2013, 104, 52 – 64.
Pai, Sandeep, “Delayed NREGA payments drive workers to suicide,” Hindustan Times,
December 29 2013.
Ranaware, Krushna, Upasak Das, Ashwini Kulkarni, and Sudha Narayanan,
“MGNREGA Works and Their Impacts,” Economic and Political Weekly, 2015, 50 (13).
Ravallion, Martin, Gaurav Datt, and Shubham Chaudhuri, “Does Maharashtra’s
Employment Guarantee Scheme Guarantee Employment? Effects of the 1988 Wage In-
crease,” Economic Development and Cultural Change, January 1993, 41 (2), 251–75.
Ravi, Shamika and Monika Engler, “Workfare as an Effective Way to Fight Poverty:
The Case of India’s {NREGS},” World Development, 2015, 67, 57 – 71.
Shah, Manisha and Bryce Millett Steinberg, “Workfare and Human Capital Invest-
ment: Evidence from India,” Technical Report, University of California, Los Angeles 2015.
Sukhtankar, Sandip and Milan Vaishnav, “Corruption in India: Bridging Research
Evidence and Policy Options,” Brookings-NCAER India Policy Forum 2014, 2015.
Thomas, Megan, “Guaranteeing Children a Better Life? The Impact of the Mahatma
Gandhi National Rural Employment Guarantee Act on Child Health and Learning in
Rural India,” Technical Report, University of Texas at Austin 2015.
Witsoe, Jeffrey, “The Practice of Development: An Ethnographic Examination of the
National Rural Employment Guarantee Act in Bihar,” Mimeo, Union College 2014.
Zimmermann, Laura, “Why Guarantee Employment? Evidence from a Large Indian
Public-Works Program,” Working Paper, University of Georgia April 2015.
37
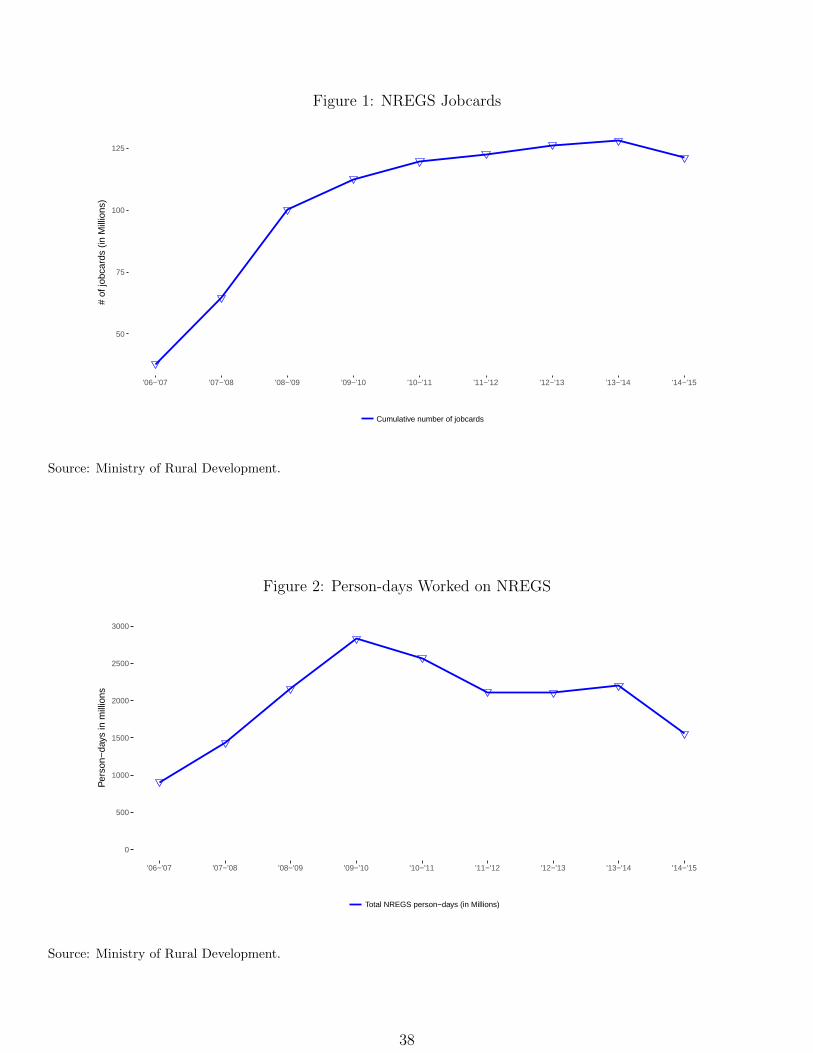
Figure 1: NREGS Jobcards
50
75
100
125
'06−'07 '07−'08 '08−'09 '09−'10 '10−'11 '11−'12 '12−'13 '13−'14 '14−'15
# of
jobc
ards
(in
Mill
ions
)
Cumulative number of jobcards
Source: Ministry of Rural Development.
Figure 2: Person-days Worked on NREGS
0
500
1000
1500
2000
2500
3000
'06−'07 '07−'08 '08−'09 '09−'10 '10−'11 '11−'12 '12−'13 '13−'14 '14−'15
Per
son−
days
in m
illio
ns
Total NREGS person−days (in Millions)
Source: Ministry of Rural Development.
38
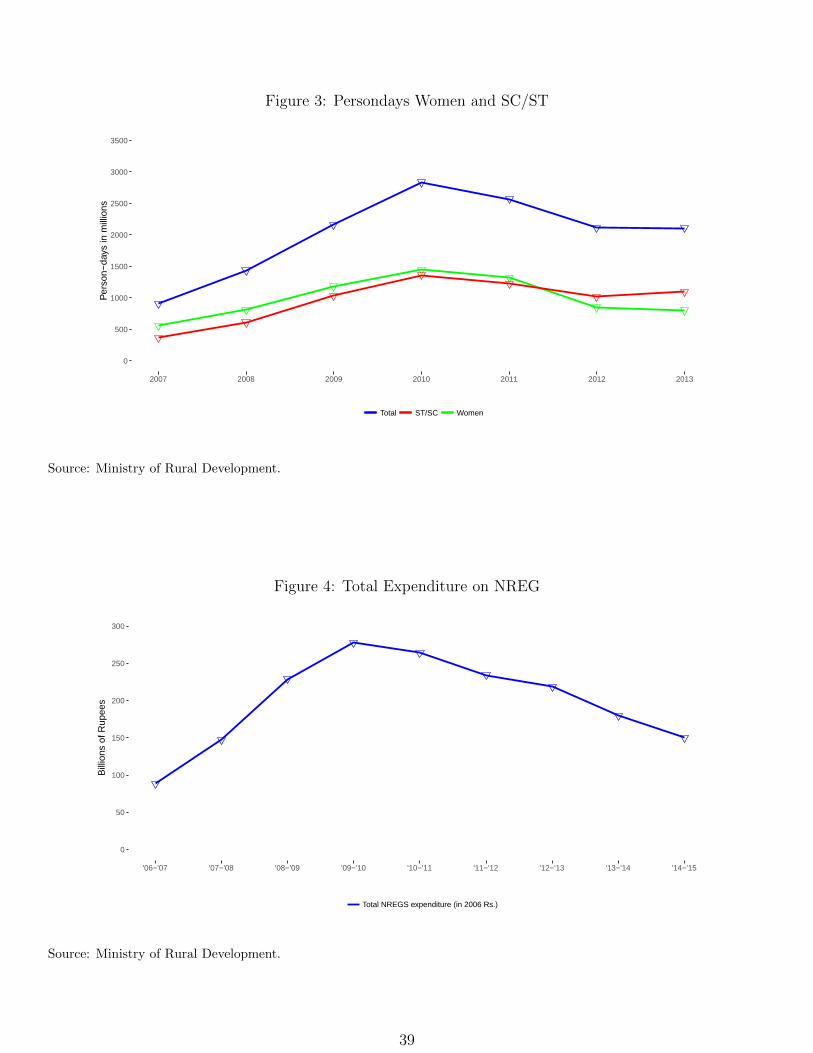
Figure 3: Persondays Women and SC/ST
0
500
1000
1500
2000
2500
3000
3500
2007 2008 2009 2010 2011 2012 2013
Per
son−
days
in m
illio
ns
Total ST/SC Women
Source: Ministry of Rural Development.
Figure 4: Total Expenditure on NREG
0
50
100
150
200
250
300
'06−'07 '07−'08 '08−'09 '09−'10 '10−'11 '11−'12 '12−'13 '13−'14 '14−'15
Bill
ions
of R
upee
s
Total NREGS expenditure (in 2006 Rs.)
Source: Ministry of Rural Development.
39
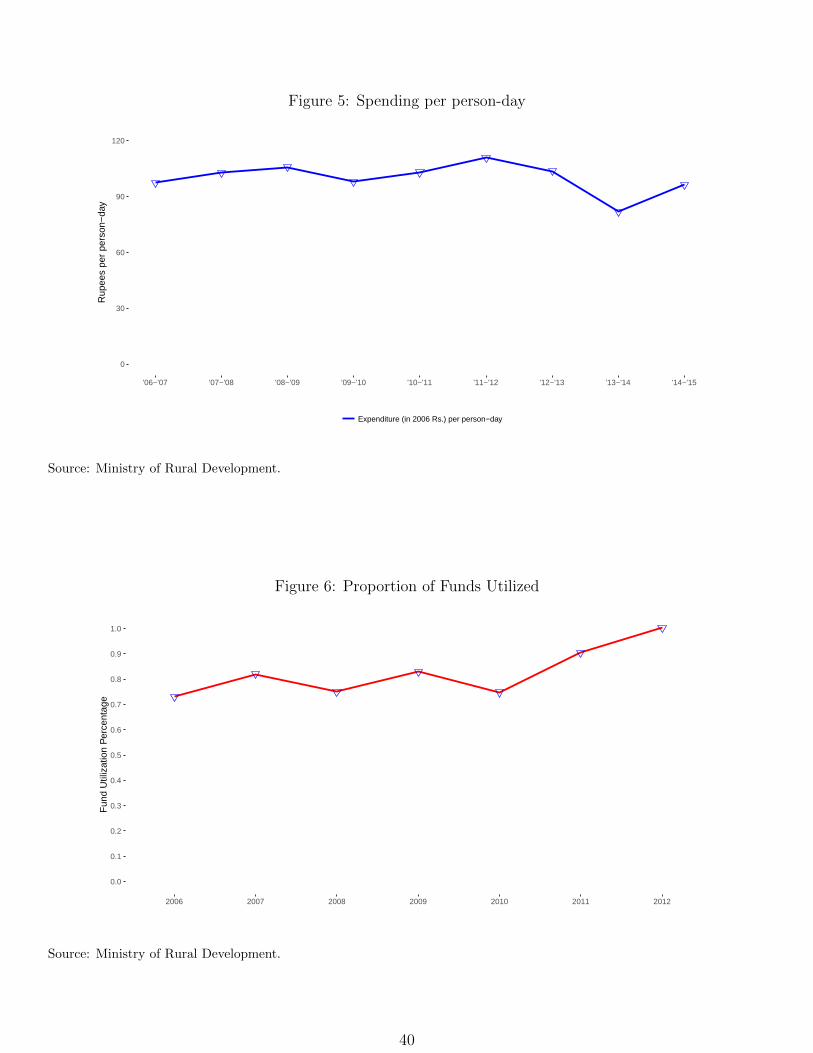
Figure 5: Spending per person-day
0
30
60
90
120
'06−'07 '07−'08 '08−'09 '09−'10 '10−'11 '11−'12 '12−'13 '13−'14 '14−'15
Rup
ees
per
pers
on−
day
Expenditure (in 2006 Rs.) per person−day
Source: Ministry of Rural Development.
Figure 6: Proportion of Funds Utilized
0.0
0.1
0.2
0.3
0.4
0.5
0.6
0.7
0.8
0.9
1.0
2006 2007 2008 2009 2010 2011 2012
Fun
d U
tiliz
atio
n P
erce
ntag
e
Source: Ministry of Rural Development.
40
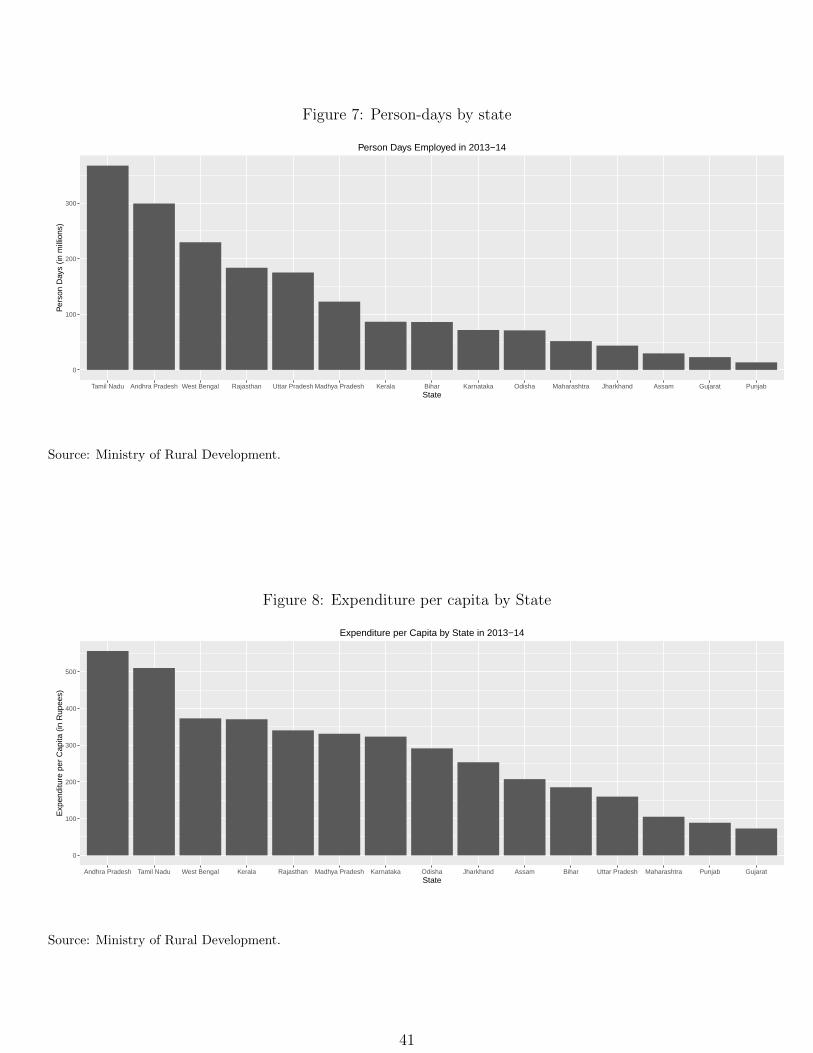
Figure 7: Person-days by state
0
100
200
300
Tamil Nadu Andhra Pradesh West Bengal Rajasthan Uttar Pradesh Madhya Pradesh Kerala Bihar Karnataka Odisha Maharashtra Jharkhand Assam Gujarat PunjabState
Per
son
Day
s (in
mill
ions
)
Person Days Employed in 2013−14
Source: Ministry of Rural Development.
Figure 8: Expenditure per capita by State
0
100
200
300
400
500
Andhra Pradesh Tamil Nadu West Bengal Kerala Rajasthan Madhya Pradesh Karnataka Odisha Jharkhand Assam Bihar Uttar Pradesh Maharashtra Punjab GujaratState
Exp
endi
ture
per
Cap
ita (
in R
upee
s)
Expenditure per Capita by State in 2013−14
Source: Ministry of Rural Development.
41