
INDIA AT $5 TRILLION - ORF
64
INDIA AT $5 TRILLION STRENGTHENING OPPORTUNITIES, REMOVING HURDLES INDIA AT $5 TRILLION Gautam Chikermane Ruchbah Rai Rakesh Sinha Tanushree Chandra
Transcript of INDIA AT $5 TRILLION - ORF
INDIA AT $5 TRILLION
STRENGTHENING OPPORTUNITIES, REMOVING HURDLES
INDIA AT $5 TRILLION
Gautam ChikermaneRuchbah RaiRakesh Sinha
Tanushree Chandra

Strengthening Opportunities, Removing Hurdles
India at $5 Trillion
© 2019 Observer Research Foundation All rights reserved. No part of this publication may be reproduced or transmitted in any form or by any means without permission in writing from ORF.
Attribution Gautam Chikermane, Ruchbah Rai, Rakesh Sinha and Tanushree Chandra India at $5 Trillion: Strengthening Opportunities, Removing HurdlesObserver Research Foundation, December 2019.
The Observer Research Foundation 20 Rouse Avenue, Institutional Area New Delhi, India 110002. [email protected] www.orfonline.org
ORF provides non-partisan, independent analyses and inputs on matters of security, strategy, economy, development, energy and global governance to diverse decision-makers (governments, business communities, academia and civil society). ORF’s mandate is to conduct in-depth research, provide inclusive platforms, and invest in tomorrow’s thought leaders today.
The American Chamber of Commerce in India (AMCHAM India) is an association of American businesses in India, established in 1992, with 500 members. The US Ambassador to India is the Honorary President. AMCHAM works closely with the Indian government for facilitating ease of doing business in India.
Design and layout: Rahil Miya Shaikh.
Acknowledgment: Valerie Swope, Program Coordinator, AMCHAM India.
ISBN: 978-93-89094-88-6 ISBN Digital: 978-93-89094-89-3
FOREWORD: PARTNERING WITH INDIA TOWARDS THE $5-TRILLION GOALRanjana Khanna
4
FOREWORD: A PARTNERSHIP GROUNDED IN THE FUTURESamir Saran
6
KEY FINDINGS 8
KEY RECOMMENDATIONS 9
I. INTRODUCTION 10
II. THE ORF-AMCHAM CEO SURVEY 13
III. CONCLUSIONS AND RECOMMENDATIONS 44
ANNEX: METHODOLOGY AND QUESTIONNAIRE 48
TABLE OF CONTENTS

FOREWORD: PARTNERING WITH INDIA TOWARDS THE $5-TRILLION GOAL
The Indian economy grew to $1 trillion in
2004 and further to $2 trillion in 2014. In
the past five years, the Indian economy
experienced a 50-percent growth rate
and saw unprecedented progress in innovation,
manufacturing, digitisation and skilling. With the
Government of India’s initiatives and proactive
emphasis on ease of doing business and inclusive
growth, the Indian economy can reach $5 trillion
even before 2025. The vision for the Indian economy
to reach the $5-trillion mark by 2025, and $10
trillion by 2032, is definitely achievable. The tectonic
shift in the global trade scenario could catapult the
Indian economy on a high growth trajectory. The
opportunity in the transforming global economic
scenario can be a critical driver for this vision, and
the thrust for an effective economic partnership
with the world’s largest economy could accelerate
Ranjana Khanna
5
FOREWORD: PARTNERING WITH INDIA TOWARDS THE $5-TRILLION GOAL
the process. It is time to propel the
Indian economy to achievable targets
utilising the core competencies of the
US industry and leverage positioning
India in the global value chain.
The bilateral trade between India and
the US has grown from $16 billion to
$142 billion in the last two decades
and is projected to reach $500
billion by 2025.The major drivers are
technology and defence.
With the objective of achieving
the target of India’s growth to a
$5-trillion economy, The American
Chamber of Commerce (AMCHAM)
and Observer Research Foundation
(ORF) undertook a survey with US
companies operating in India and are
pleased to present the findings and
recommendations. US companies
have been operating in India since
1907 with the largest FDI and creating
gainful employment for more than six
million people. We have partnered
extensively in India’s inclusive growth
story and in the Government of India’s
mission of accelerating its flagship
programmes, Make in India, Digital
India, and Skill India.
(Ranjana Khanna is Director General and CEO, American Chamber of Commerce in India.)
FOREWORD: A PARTNERSHIP GROUNDED IN THE FUTURE
Samir Saran
It is common today to assume that globalisation
is in crisis. After all, its chief guarantors
from the Atlantic communities are no longer
evangelical about it, while its 21st-century
proponents from Asia appear unable to fill the
void. In an attempt to verify these assertions,
AMCHAM and ORF undertook a survey of American
companies with operations in India. The results
give us cause for optimism.
First, there remains an enduring global
commitment to enhance trade and economic
ties, irrespective of temporary isolationist or
unilateral tendencies. While economic nationalism
is certainly the defining political zeitgeist of our
times, commercial and financial interdependence
cannot be easily undone. What we are seeing
FOREWORD: A PARTNERSHIP GROUNDED IN THE FUTURE
7
today is a debate about the methods
of economic engagement, not the
trajectory itself.
Second, India and the US are destined
to be the two largest democratic
economies by the middle of this
century. Both countries will occupy
this mantle as the global transition
from the third industrial revolution
to the fourth unfolds. It will therefore
be incumbent upon India and the US
to design and implement models of
economic growth and development,
and develop a new commercial and
social ethic.
And third, it is clear that markets
will have to respond to Sustainable
Development Goals. The past few
decades have made it clear that the
public sector alone cannot enhance
livelihoods and combat climate
change. Financial capitals and
international economic organisations
will have to create new financial tools
and regulatory frameworks to support
investments in green technologies
and sustainable urban infrastructure.
Authored by a team led by Gautam
Chikermane – an astute commentator
on the politics and economics of
growth and globalisation –this ORF-
AMCHAM report rises above the nitty
gritty of commercial engagements
and brings out the long-term
economic thinking that defines India-
US relations. There is much need
for such scholarship and this report
will be an important addition to
the literature on the economic and
political realities that are defining the
India-US relationship.
(Samir Saran is President, Observer Research Foundation)
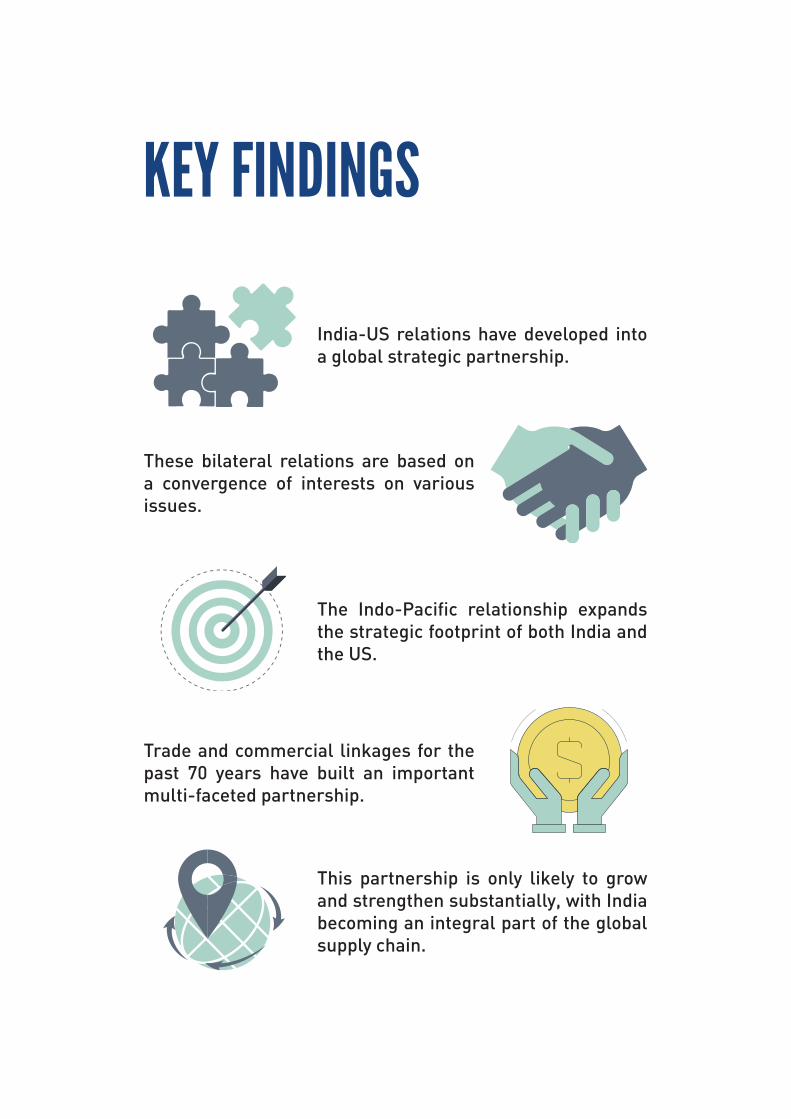
KEY FINDINGS
These bilateral relations are based on a convergence of interests on various issues.
The Indo-Pacific relationship expands the strategic footprint of both India and the US.
Trade and commercial linkages for the past 70 years have built an important multi-faceted partnership.
This partnership is only likely to grow and strengthen substantially, with India becoming an integral part of the global supply chain.
India-US relations have developed into a global strategic partnership.
KEY FINDINGS
KEY RECOMMENDATIONS
Both the Union and State governments should develop infrastructure, particularly roads and ports.
The Union and State governments must take a policy leap of faith and rethink land laws to facilitate the setting up of industries.
The Union government should rework labour laws so that they get in tune with the rising, 21st-century India.
India’s State governments need to provide an enabling environment to attract companies into manufacturing.
KEY RECOMMENDATIONS
India is the world’s fastest-growing large
economy; in the next five years, it expects to
be the world’s fourth-largest economy, after
Japan, with a GDP of $5 trillion from $2.7
trillion today. This growth momentum has been
increasing – from 3.6 percent between 1962 and
1971, the average GDP growth rose to 5.3 percent
between 1981 and 1991,when the economy began
opening up.1 It rose to 6.5 percent between 1992
and 1996, and further to 7.8 percent between 2003
and 2015.2 At a projected rate of 6.1 percent for
2019 and 7 percent for 2020, India is expected to
maintain its position as the world’s fastest-growing
economy.3 It has set its sights on a GDP of $5 trillion
in the next five years and $10 trillion by 2032.4
The US economy, meanwhile, at $20.9 trillion5 is
more than eight times India’s size – is expected
to grow by 2.4 percent,6 adding about $500 billion
to its GDP in 2019; the addition is greater than the
entire economies of Austria, Norway and the United
Arab Emirates, combined. To put this number in
perspective, what the US will add in 2019 will be
more than 16 percent of India’s GDP, illustrating the
INTRODUCTIONI.
INTRODUCTION
11
executives in the two countries
understand the compulsions and
the opportunities of functioning in
a democratic set up, with ease of
communication through the English
language and strong people-to-
people connections.
Second, this alliance is a cohesion of
the essential elements of capitalism
which encourages entrepreneurship
and celebrates free enterprise. The
currency of conversations, however,
differ. While the US seeks urgency of
speed, India is constrained by political
and economic negotiations among its
key constituencies.
Third, this is an alliance between
two large markets – the world’s
second-largest and the world’s third-
largest. Both economies display a
high consumption as part of their
GDPs (70.7 percent for India; and
82.4 percent for the US).8 They vary
because of the size of consumption,
which in turn maps itself around per
capita GDP—India’s $2,016 versus
the US’ $62,641 in nominal terms,9
and $7,762 and $62,641 in terms of
PPP (purchasing power parity).10
Fourth, this is an alliance between
strategic partners, where the
interests of the US and India merge
to create an inclusive environment
for the region and prevent any single
country’s economic dynamism and
technical innovation. This innovation,
driven by a spirit of entrepreneurship,
has unleashed the creative energies
of American businesses and is the
key to the US’ growth.
The economic partnership between
these two economies – the world’s
largest and the world’s fastest-
growing –is set to rise. For one, there
has been a huge growth in India-US
bilateral trade in goods and services
over the past two decades: from $16.3
billion in 1999, it stood at $142.3
billion in 2018, representing an 8.7-
fold jump or a compound annual
growth rate of 12.1 percent.7 Three
trends indicate that the economic
partnership will strengthen in the
coming years: India’s continuing GDP
growth; an increased share of trade
in this growth; and a rising share of
US in India’s trade. Indeed, US-India
trade is projected to reach $375
billion by 2024, and on to $750 billion
by 2032.
Overall India-US ties have historically
been supported by five key dynamics.
These drivers will remain in the
future.
First, this is an alliance of values
between the world’s oldest democracy
and the world’s largest democracy. As
a result, policymakers and business
12
INTRODUCTION
state to acquire domination either
militarily or through state-sponsored
terrorism. Such an alliance, whether
formal or informal, was inevitable.
The Indo-US relationship is not a
mere abstract engagement based
solely on shared values; rather,
it reflects a real convergence of
strategic interests and can serve
as the anchor for peace, prosperity
and stability from Asia to Africa and
from the Indian Ocean to the Pacific
Ocean.11 The increasing convergence
of US and Indian interests in the
Indo-Pacific region can be a great
opportunity to defend the rules-based
international order.
Finally, these strategic and economic
ties strengthen the two countries’
defence relationship. In June 2016, the
US gave India the unique designation
of a ‘Major Defence Partner’.12 The
designation seeks to elevate the
US defence partnership with India,
which in turn builds industry-to-
industry ties. Once fundamental
trust-building infrastructure is in
place, it allows agreements such as
the Logistics Exchange Memorandum
of Agreement (LEMOA) in 2016, and
Communications, Compatibility and
Security Agreement (COMCASA) in
2018 to ride it.13
Standing on these five pillars, India-
US relations are only set to grow
stronger. Differences on trade
and markets notwithstanding, the
relationship is sustainable and will
deepen further through significant
and growing opportunities for
commerce and a strong belief in
finding solutions through dialogue
and discussion. Collaboration in the
areas of international negotiations
such as nuclear priorities, defence,
space and terrorism are also set to
strengthen further.
This report looks ahead and envisions an India that is the world’s third-
largest economy, after the US and China, in a decade. It examines both the
opportunities and the constraints that line the path towards these goals. Two
methods are utilised in this report:
• First, a survey was executed covering US companies that are members of
the American Chamber of Commerce. This is a quantitative as well as a
qualitative survey.
• Second, based on the survey, this report conducted interviews with CEOs of
US-based companies doing business in India, and captures their insights
and concerns.
THE ORF-AMCHAM CEO SURVEY
II.
Between September and December
2018, ORF conducted a survey of 42
CEOs of US-based companies operating
in India. The survey had two parts: (1)
a common questionnaire of 24 questions, some of
them with sub-categories, that was answered by the
CEOs; and (2) face-to-face interviews with 29 of the
42 respondents that aimed to obtain more insights
based on their responses to the questionnaire.
Ten issues emerged from ORF’s conversations
with these US business leaders, ranging from
infrastructure and entry reasons, to compliance
and the future of India’s markets. While some
respondents lauded their India experience, others
were more critical. Overall, however, the business
leaders were optimistic about both their current
presence in India and their prospects.
14
THE ORF-AMCHAM CEO SURVEY
The following paragraphs outline some of the key responses to the ORF Survey.
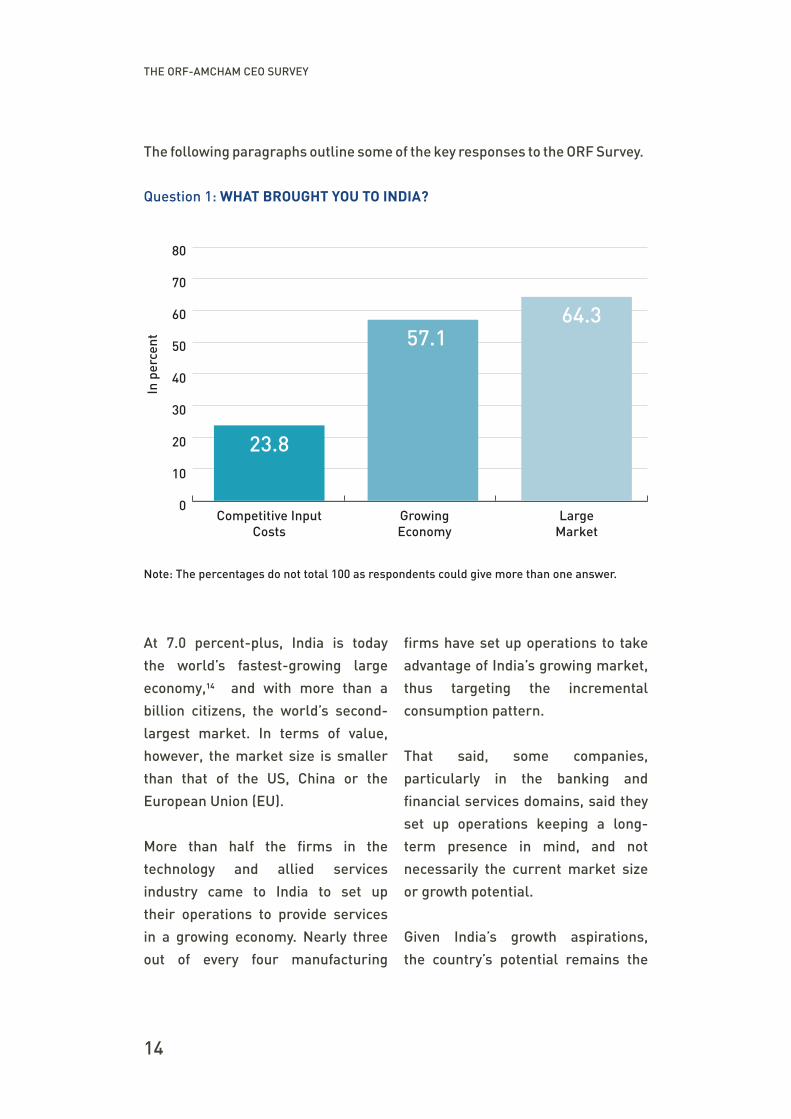
Question 1: WHAT BROUGHT YOU TO INDIA?
At 7.0 percent-plus, India is today
the world’s fastest-growing large
economy,14 and with more than a
billion citizens, the world’s second-
largest market. In terms of value,
however, the market size is smaller
than that of the US, China or the
European Union (EU).
More than half the firms in the
technology and allied services
industry came to India to set up
their operations to provide services
in a growing economy. Nearly three
out of every four manufacturing
firms have set up operations to take
advantage of India’s growing market,
thus targeting the incremental
consumption pattern.
That said, some companies,
particularly in the banking and
financial services domains, said they
set up operations keeping a long-
term presence in mind, and not
necessarily the current market size
or growth potential.
Given India’s growth aspirations,
the country’s potential remains the
Note: The percentages do not total 100 as respondents could give more than one answer.
In p
erce
nt
80
70
60
50
40
30
20
10
0Competitive Input
CostsGrowing Economy
Large Market
23.8
57.164.3
THE ORF-AMCHAM CEO SURVEY
15
highest among very large economies
(or the $2 trillion-plus nations).
This implies an annual growth rate
of around 10 percent. Such a high
rate, while being possible, depends
on how fast the government makes
doing business in India easier, builds
infrastructure upon which this growth
can ride and unleashes the latent
energies of India. It also depends on
external factors, including but not
restricted to, international growth
rates.
Global partnerships in general and
with US companies in particular,
through collaborations and
investments, can keep this growth
going, and increase the economic
stakes of foreign companies in India’s
growth story.
The desired jump in India’s GDP
growth to 10 percent-plus over the
next 13 years may be steep, but it is
not an impossibility. The seeds have
been sown: for one, India was among
the ‘top 10 improvers’ in World Bank’s
Doing Business Report for 2019,15
rising to rank 63 from 77 as the
government now hopes to enter the
top 50 club.16 This has helped to build
confidence and going forward is likely
to attract more investors.
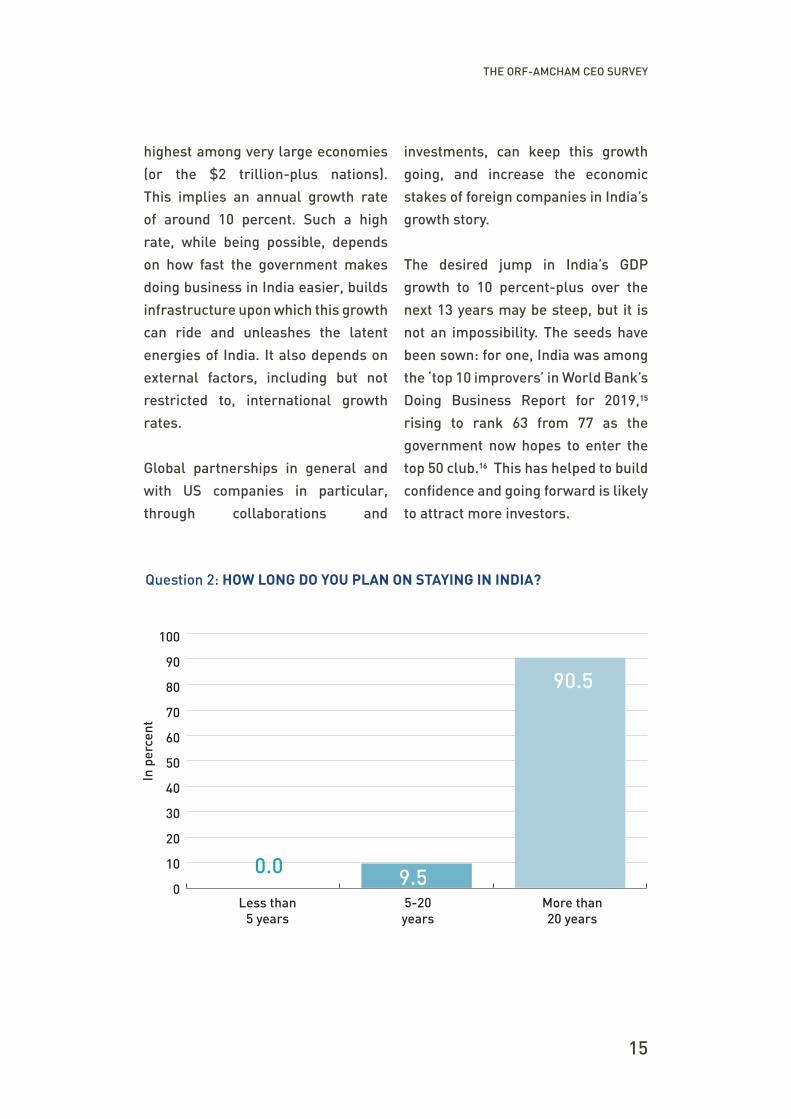
Question 2: HOW LONG DO YOU PLAN ON STAYING IN INDIA?
In p
erce
nt
100
90
80
70
60
50
40
30
20
10
0Less than
5 years5-20 years
More than 20 years
9.50.0
90.5
16
THE ORF-AMCHAM CEO SURVEY
Some CEOs said they were continuing
to do business in India as they have
a long-term outlook. They are
sourcing labour and merchandise at
competitive prices—something that
other emerging economies have not
been able to provide yet.
According to a
PricewaterhouseCoopers (PwC)
report, India has overtaken Japan
to become the fifth most attractive
market in 2018.17 This is hardly
unexpected in the context of the
various policy reforms that have been
initiated by India over the past decade.
“The opportunity we see in India is
that it is still not a fully penetrated
market and it is a major corridor to
other southeast Asian countries,” one
CEO said. What is needed is for more
companies to set up manufacturing
facilities in India. Given that states
are now competing with each other
to attract investments, there is scope
for manufacturing in India to support
markets of India.
Some companies set up their
businesses before independence and
thus have a long-term commitment
to the Indian market. Although
companies do not want to deal with
cumbersome bureaucratic rules
and regulations, as well as other
challenges like labour demands,
corruption, underdeveloped
institutions and inadequate physical
infrastructure, all the 29 CEOs
interviewed by ORF believed that they
are able to derive greater dividends
from focusing on local geographies.
While most CEOs are optimistic about
the long-term potential of India, their
headquarters are keeping a watchful
eye on the country. In the short term,
they are particularly concerned
about the business uncertainty that
is resulting from shifting policies,
international trade tensions between
the US and China, political unrest in
certain geographies, and an overall
slowing down of global economic
growth, including in India.
From India’s side, the recent policy
reforms to strengthen exports
and relations with international
companies doing business in India
has made companies optimistic about
their strategies to localise services
and products to the Indian customer.
“THE OPPORTUNITY WE SEE IN INDIA IS THAT IT IS STILL NOT A FULLY PENETRATED MARKET AND IT IS A MAJOR CORRIDOR TO
OTHER SOUTHEAST ASIAN COUNTRIES”
THE ORF-AMCHAM CEO SURVEY
17
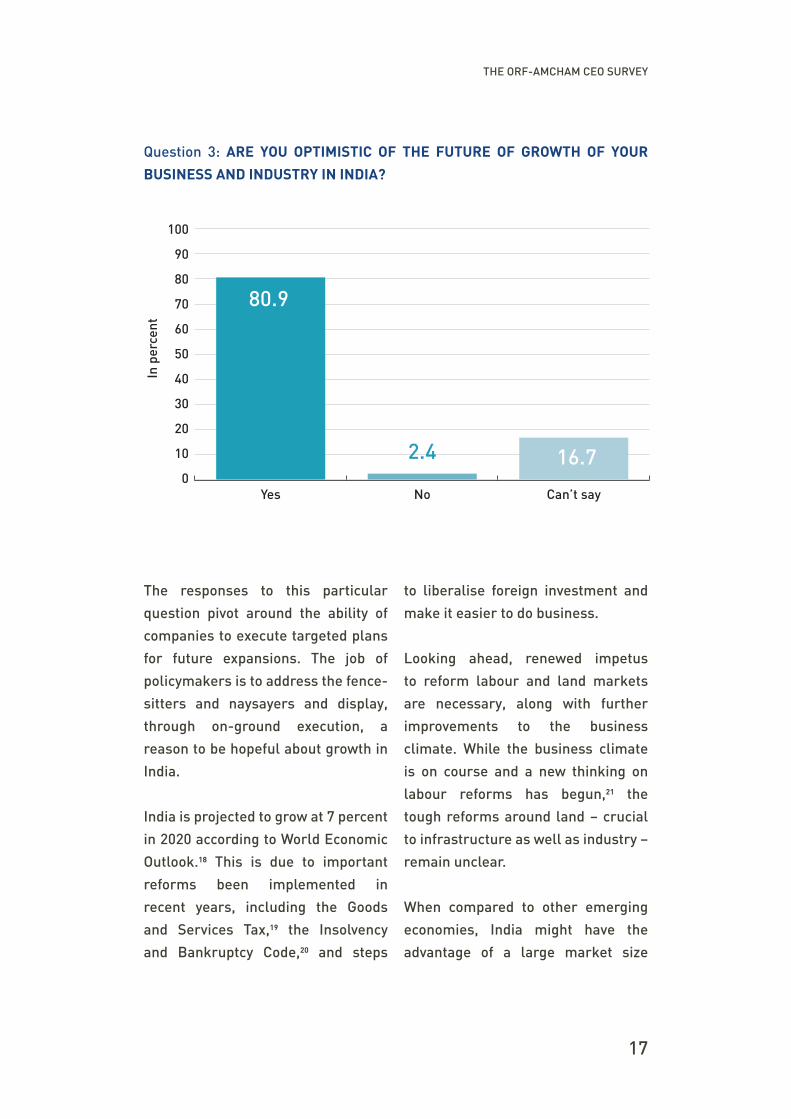
Question 3: ARE YOU OPTIMISTIC OF THE FUTURE OF GROWTH OF YOUR
BUSINESS AND INDUSTRY IN INDIA?
The responses to this particular
question pivot around the ability of
companies to execute targeted plans
for future expansions. The job of
policymakers is to address the fence-
sitters and naysayers and display,
through on-ground execution, a
reason to be hopeful about growth in
India.
India is projected to grow at 7 percent
in 2020 according to World Economic
Outlook.18 This is due to important
reforms been implemented in
recent years, including the Goods
and Services Tax,19 the Insolvency
and Bankruptcy Code,20 and steps
to liberalise foreign investment and
make it easier to do business.
Looking ahead, renewed impetus
to reform labour and land markets
are necessary, along with further
improvements to the business
climate. While the business climate
is on course and a new thinking on
labour reforms has begun,21 the
tough reforms around land – crucial
to infrastructure as well as industry –
remain unclear.
When compared to other emerging
economies, India might have the
advantage of a large market size
In p
erce
nt
100
90
80
70
60
50
40
30
20
10
0Yes No Can’t say
16.72.4
80.9
18
THE ORF-AMCHAM CEO SURVEY
but fails to promote itself as an
investment destination because of
political agendas and policies that do
not nurture enterprise growth and
wealth creation.
Due to regulatory and compliance
bottlenecks, for instance, the offset
policy that mandates foreign defence
manufacturers to spend at least 30
percent of their contract expenditure
in India has not been seamless.22
“The DPSUs (defence public sector
undertakings) have not adhered to
the spirit of law licence infraction
and legal processes,” one CEO said.
“They champion reverse engineering
claiming that foreign OEMs are not
necessary.”
Another point of concern is the
governmental preference to domestic
companies over foreign ones.
“The tendering process is a major
problem,” another CEO said. “Most
projects are given to local OEMs
(original equipment manufacturers)
with the intent of Make in India,
without any look at the kind of quality
or global technology other companies
are bringing in and can be used in
joint ventures.”
QUESTIONS:
• What are the different components of the business environment that need
urgent attention or are not of concern?
• Has there been a change in these components in India over the last ten
years?
These two questions listed the following key components that impact doing
business:
• Presence of quality infrastructure
• Ease of land acquisition
• Taxation policy
• Quality of bureaucracy
• Corruption in the government system
• Telecommunication facilities
• Availability of skilled labour
THE ORF-AMCHAM CEO SURVEY
19
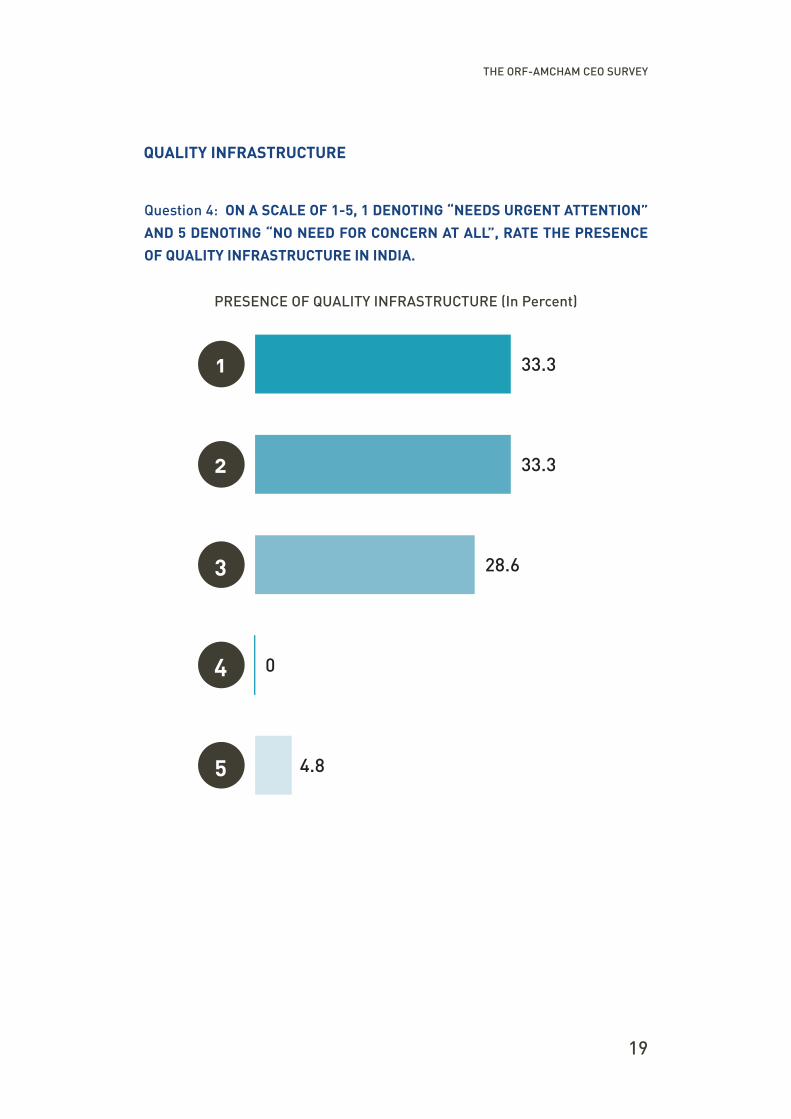
QUALITY INFRASTRUCTURE
Question 4: ON A SCALE OF 1-5, 1 DENOTING “NEEDS URGENT ATTENTION”
AND 5 DENOTING “NO NEED FOR CONCERN AT ALL”, RATE THE PRESENCE
OF QUALITY INFRASTRUCTURE IN INDIA.
PRESENCE OF QUALITY INFRASTRUCTURE (In Percent)
33.3
33.3
28.6
0
4.8
1
2
3
4
5
20
THE ORF-AMCHAM CEO SURVEY
The responses of the CEOs run
in parallel to the thrust – policy
as well as financial – that the
Indian government is giving to the
infrastructure sector. In 2018, for
instance, India aimed to invest Rs
5.97 trillion23 in infrastructure to
increase growth of GDP, connect and
integrate the nation with a network of
roads, airports, railways, ports and
inland waterways and to provide good
quality services to its people. Further,
the importance of infrastructure
came up in Vision 2030 for India
in the Interim Budget 2019.24 In its
final Budget 2019, the government
announced its intention to invest Rs
100 trillion in infrastructure over the
next five years.25
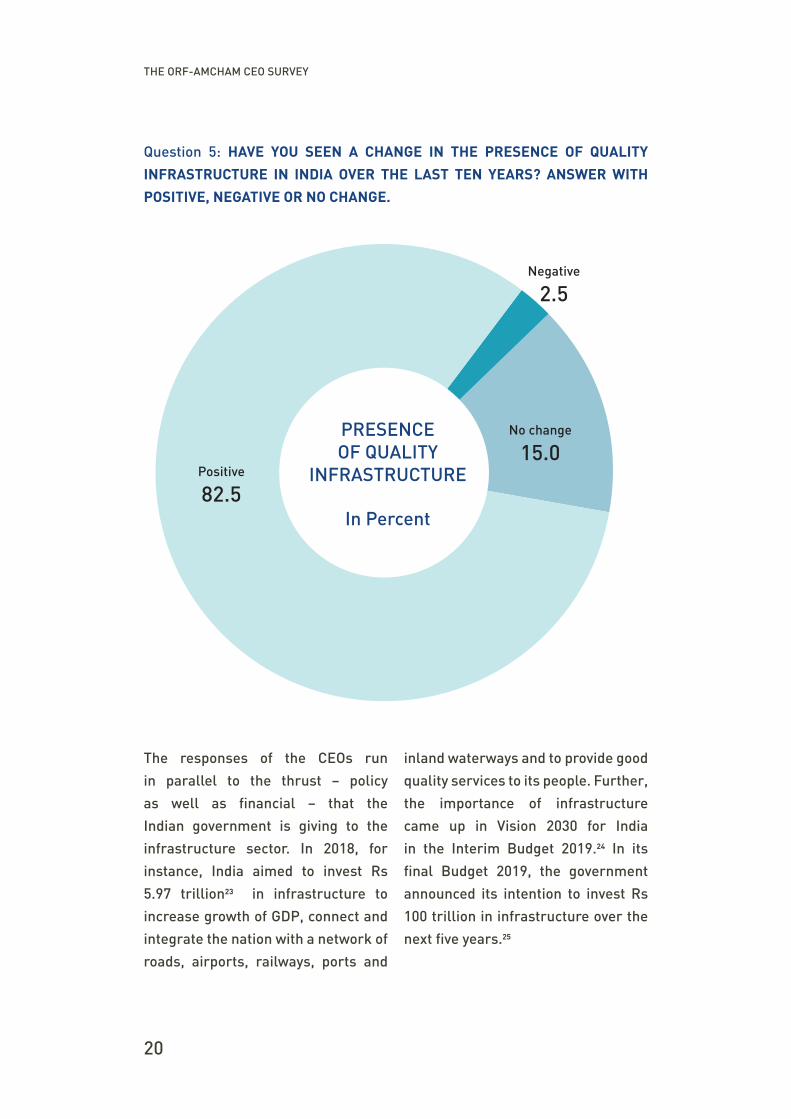
Question 5: HAVE YOU SEEN A CHANGE IN THE PRESENCE OF QUALITY
INFRASTRUCTURE IN INDIA OVER THE LAST TEN YEARS? ANSWER WITH
POSITIVE, NEGATIVE OR NO CHANGE.
In Percent
PRESENCE OF QUALITY
INFRASTRUCTUREPositive
82.5
Negative
2.5
No change 15.0
THE ORF-AMCHAM CEO SURVEY
21
The history of infrastructure policy
has come a long way since the era of
government-controlled framework,
to a more coordinated effort through
a public-private partnership.
The change in regulatory bodies
during this transition also led to
more competition among public
and private companies to ensure
delivery and more transparency
in the completion of a project. The
number of infrastructure projects has
increased sharply from five projects
in 1991, costing Rs 52.3 billion to
385 projects with a value of Rs 25.5
trillion, within a 20-year period. This
number fell to 208 projects worth Rs
7.5 trillion in 2017 compared to 1,174
projects worth Rs 48.5 trillion the
previous year.26 This lag is because
of several hurdles, from the stages
of proposal bidding to the execution.
Often, policies or projects around
infrastructure fail to get implemented
either due to lack of planning, state
control or politicisation around a
project.
According to a survey conducted by
World Economic Forum, the three
biggest obstacles to infrastructure
development in India are political and
regulatory risk, access to financing,
and macroeconomic instability.27
This leads to time and cost overruns
from conceptualisation of the project
to administrative approvals and
execution. There are five reasons
for these time and cost overruns
that companies—whether Indian
or foreign—need to negotiate:
technical factors, contractual delays,
organisational or institutional
challenges, vicious cycle of time delay
pushing a cost overrun, and economic
factors such as land acquisition.28
Not all infrastructure, however, is
about signing mega contracts or
delivering “extreme engineering”.
Often, it is the last mile that is the
steepest. “Even though we are based
in an industrial development zone,
there are shortages of water every
year,” a CEO said. “We have to buy
water from tankers. There are mafia
that create hurdles and problems in
accessing ground water because of
permits. If such small investments
cannot be managed, which are
essential for any industry, how do we
expect to bring in investments that
are 100 times of that?”
THE NUMBER OF INFRASTRUCTURE PROJECTS HAS INCREASED SHARPLY FROM FIVE PROJECTS IN 1991, COSTING RS 52.3 BILLION
TO 385 PROJECTS WITH A VALUE OF RS 25.5 TRILLION, WITHIN A 20-YEAR PERIOD.
22
THE ORF-AMCHAM CEO SURVEY
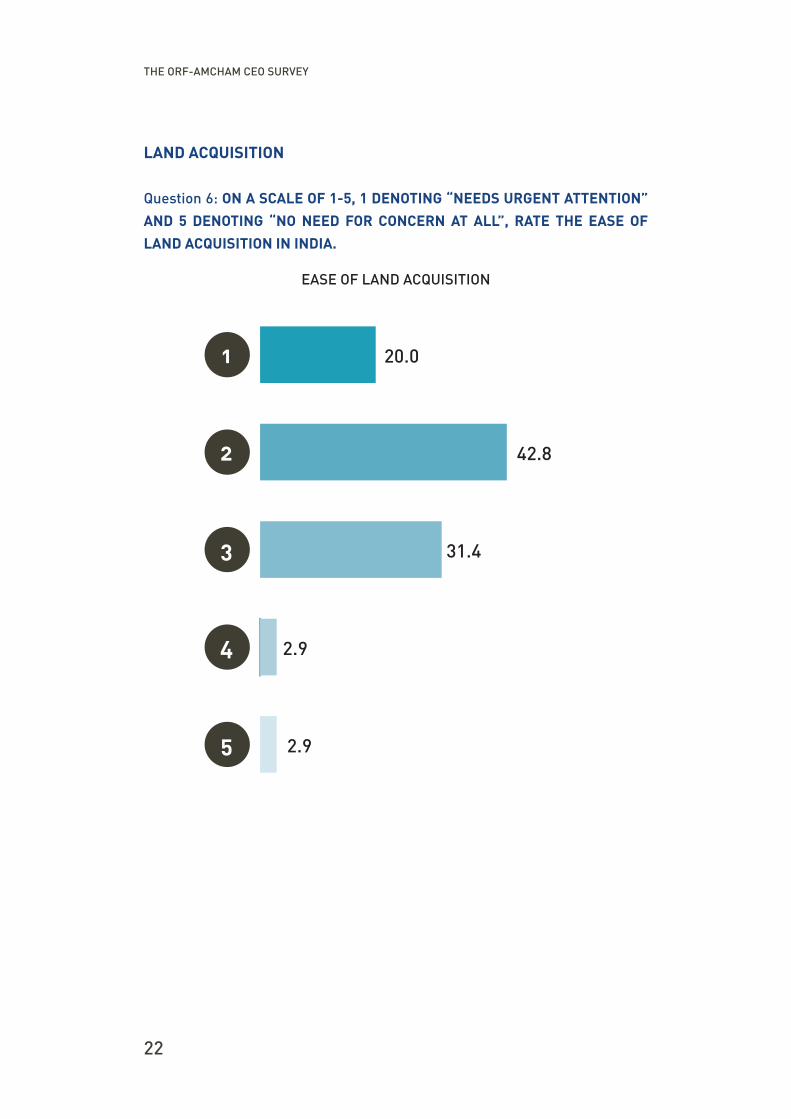
LAND ACQUISITION
Question 6: ON A SCALE OF 1-5, 1 DENOTING “NEEDS URGENT ATTENTION”
AND 5 DENOTING “NO NEED FOR CONCERN AT ALL”, RATE THE EASE OF
LAND ACQUISITION IN INDIA.
EASE OF LAND ACQUISITION
20.0
42.8
31.4
2.9
2.9
1
2
3
4
5
THE ORF-AMCHAM CEO SURVEY
23
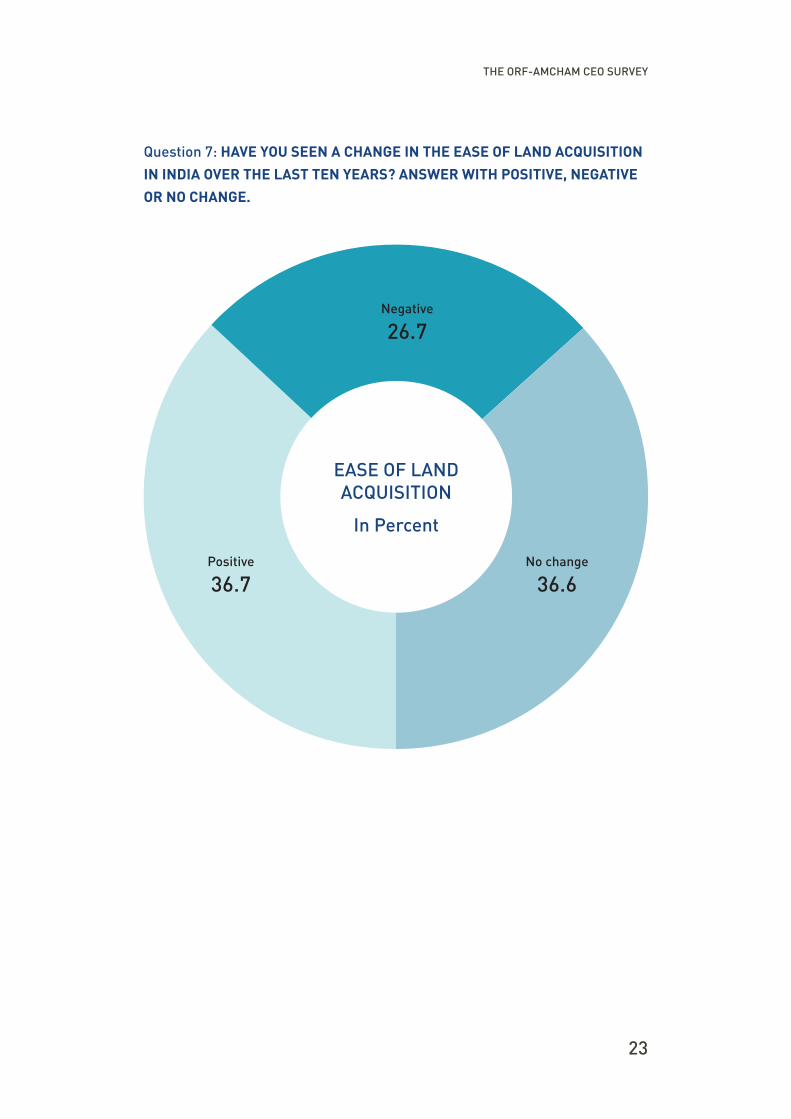
Question 7: HAVE YOU SEEN A CHANGE IN THE EASE OF LAND ACQUISITION
IN INDIA OVER THE LAST TEN YEARS? ANSWER WITH POSITIVE, NEGATIVE
OR NO CHANGE.
In Percent
EASE OF LAND ACQUISITION
Positive
36.7
Negative
26.7
No change
36.6
24
THE ORF-AMCHAM CEO SURVEY
One of the biggest hurdles in India’s
move towards infrastructure
development relates to the difficulties
in land acquisition. On an average,
three out of five CEOs said that land
acquisition is an area that creates
major hurdles and needs urgent
attention from the Indian government.
While 26.6 percent of the respondents
are of the opinion that land acquisition
laws have not improved in the past
10 years, 36.7 percent have seen no
change, and the rest have seen some
improvements over the past 10 years.
Ownership of land is highly
fragmented and there is no
mechanism for price discovery.
There are excessive negotiations
with landlords that stall the
implementation or execution of
projects. Clearly, land acquisition
laws—along with the lack of basic
amenities—have an impact on
whether or not businesses make
plans for expansion.
“We have almost 70,000 farmers
working with us but they don’t own
more than two acres of land due to
ownership restrictions,” a CEO said.
“This is a major barrier not only mass
manufacturing but also attaining the
raw materials to do so.”
Going forward, given that India is
going to see a rise in the amount of
land to be acquired for infrastructure
and industry, negotiating this
compensation to farmers is going
to place steep challenges before
governments and private companies
alike. Delays in land acquisition and
in securing environmental clearances
alone, caused the stalling Rs 4.3
trillion worth of projects, of which 60
percent were government ones.29
This is only one example of the conflict
between infrastructure creation and
politics. Unfortunately, it is not limited
here; it also includes managing
Centre-State relationships, bringing
a greater specialisation among
bureaucracies, carting technical
expertise into the decision-making
process, or simply communicating the
benefits of infrastructure creation to
the people with greater conviction.30
Problems in infrastructure do not only
pose a challenge to industry creation;
rather, on a day-to-day basis, gaps
in infrastructure—specifically urban
infrastructure—causes delays in the
functioning of business. “From an
infrastructure point of view, there
are issues with power shortages
and transportation,” a CEO said.
“Commute time increases, with no
good roads or public transport.”
THE ORF-AMCHAM CEO SURVEY
25
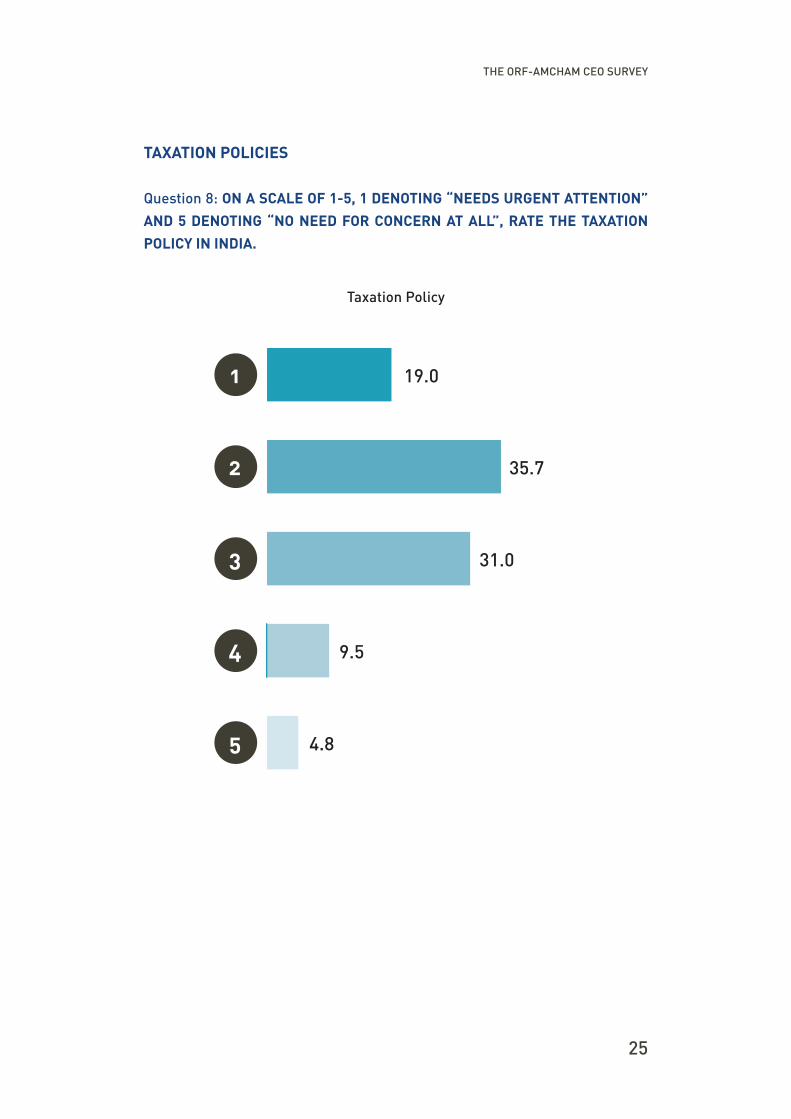
TAXATION POLICIES
Question 8: ON A SCALE OF 1-5, 1 DENOTING “NEEDS URGENT ATTENTION”
AND 5 DENOTING “NO NEED FOR CONCERN AT ALL”, RATE THE TAXATION
POLICY IN INDIA.
Taxation Policy
19.0
35.7
31.0
9.5
4.8
1
2
3
4
5
26
THE ORF-AMCHAM CEO SURVEY
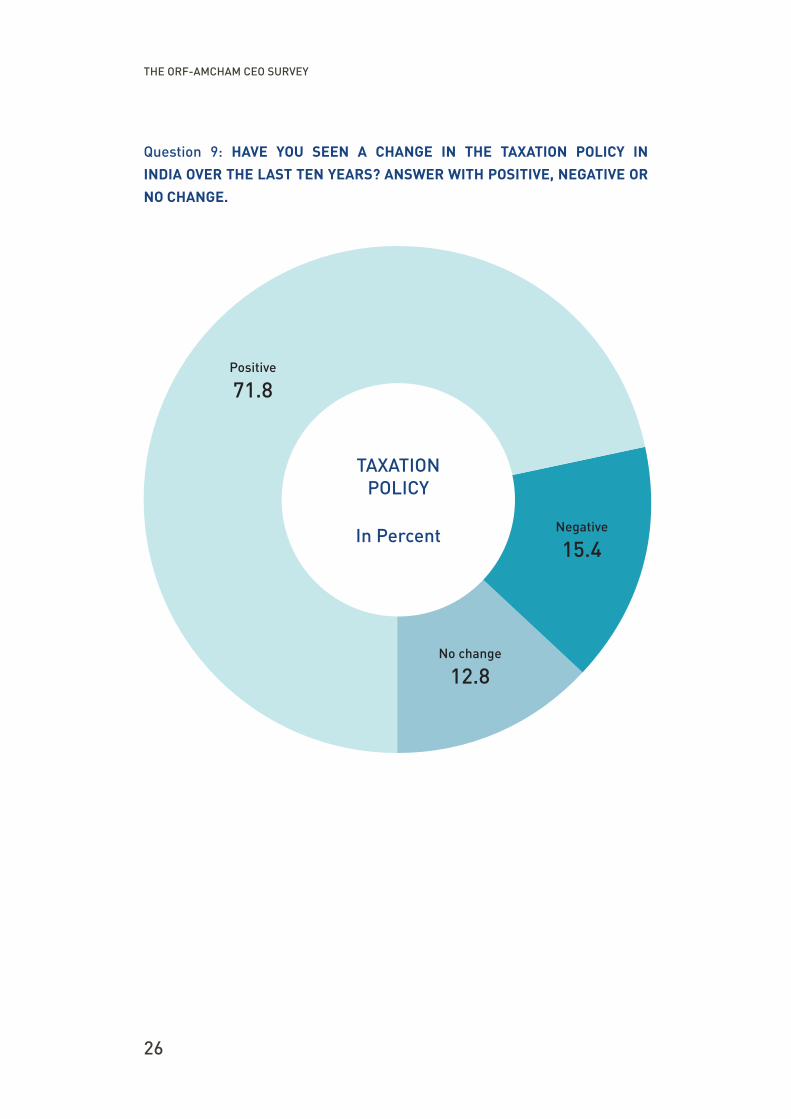
Question 9: HAVE YOU SEEN A CHANGE IN THE TAXATION POLICY IN
INDIA OVER THE LAST TEN YEARS? ANSWER WITH POSITIVE, NEGATIVE OR
NO CHANGE.
In Percent
TAXATION POLICY
Positive
71.8
Negative
15.4
No change
12.8
THE ORF-AMCHAM CEO SURVEY
27
More than half of all respondents said
that India’s taxation policies need
to be looked at urgently to ensure
transparency and non-ambiguity.
The Goods and Services Tax (GST)
– one of India’s most complex
economic legislations, involving one
Constitutional amendment, four
Central laws, 29 State laws and
seven notifications for Union
Territories – is one step in simplifying
taxes. After the abrogation of Article
370 of the Indian constitution on
6 August 2019, GST will now be
applicable to 28 Indian states and 9
Union Territories.31 This law allows
firms to create value for key business
processes, including procurement,
manufacturing, distribution, and
logistics. With the introduction of
GST, the slowdown of trucks,
examination of goods and collection
of octroi at inter-state check posts
has ended. The imposition of a
uniform tax rate on a product across
the states has made these routine
checks unnecessary, cutting down
transportation time which has in turn
led to increased savings.
For some US-based companies,
however, the GST does not help
in facilitating inter-country
business taxes. “GST has impacted
us negatively because ours is a
subsidised product,” a CEO said.
“We import at $400 dollars and sell
it to farmers minus the subsidy. But
we cannot claim tax credits on the
subsidy and thus we lose $8-9 per
tonne. The buying price is greater
than our selling price. This needs to
be fixed.”
On the other hand, most CEOs had a
positive view of GST and said that it
has had no adverse impact on their
business and, in fact, has hurt the
unorganised sector. “It [GST] will
consolidate the players and weaken
the weak and strengthen the strong,”
a CEO said. The compliance burden
on smaller firms was choking their
businesses. Today, with easier
norms, things have changed. “GST
has helped in an indirect manner as
it has brought a lot of unorganised
players in the organised sector,” one
CEO said. “This way, we get a bigger
market to sell to.”
“WE IMPORT AT $400 DOLLARS AND SELL IT TO FARMERS MINUS THE SUBSIDY. BUT WE CANNOT CLAIM TAX CREDITS ON THE SUBSIDY
AND THUS WE LOSE $8-9 PER TONNE. THE BUYING PRICE IS GREATER THAN OUR SELLING PRICE. THIS NEEDS TO BE FIXED.”
28
THE ORF-AMCHAM CEO SURVEY
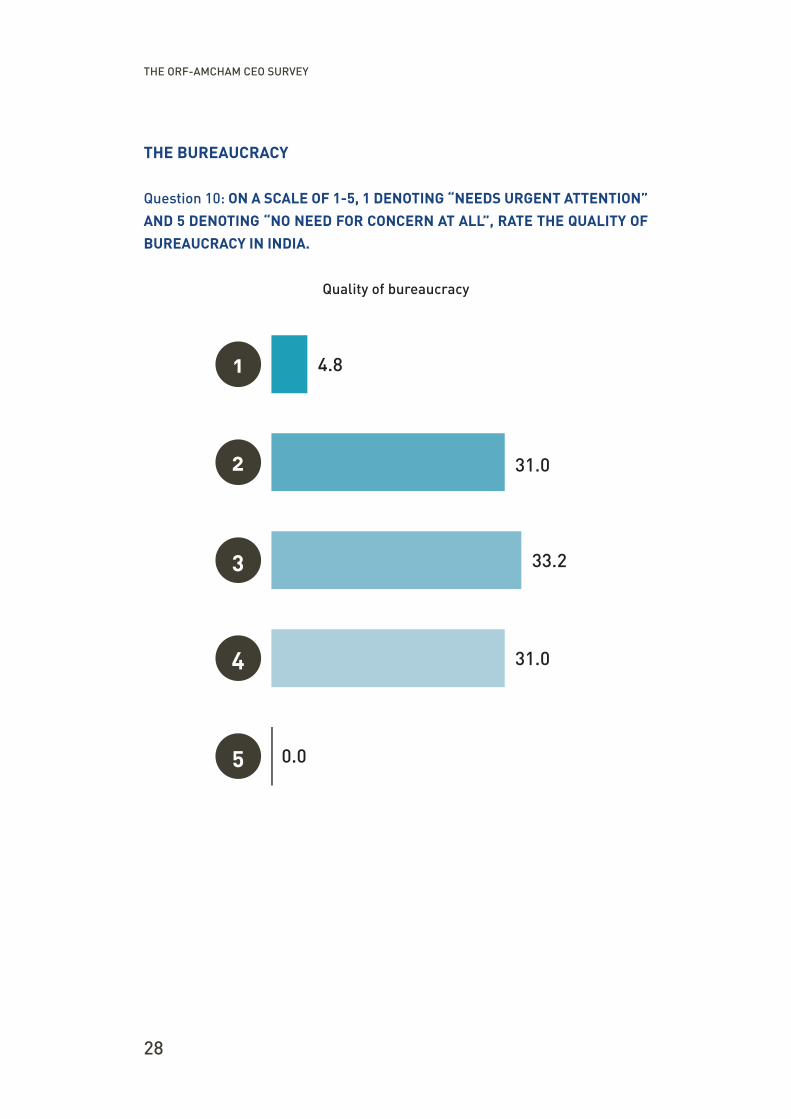
THE BUREAUCRACY
Question 10: ON A SCALE OF 1-5, 1 DENOTING “NEEDS URGENT ATTENTION”
AND 5 DENOTING “NO NEED FOR CONCERN AT ALL”, RATE THE QUALITY OF
BUREAUCRACY IN INDIA.
Quality of bureaucracy
4.8
31.0
33.2
31.0
0.0
1
2
3
4
5
THE ORF-AMCHAM CEO SURVEY
29
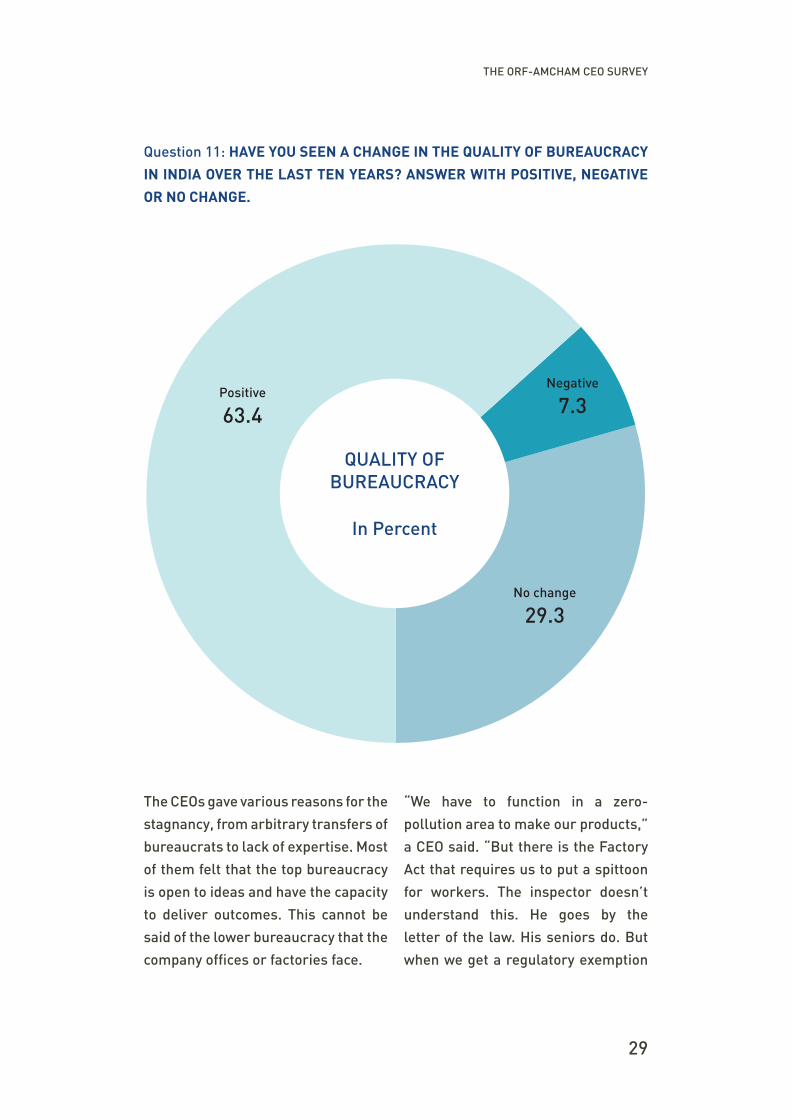
Question 11: HAVE YOU SEEN A CHANGE IN THE QUALITY OF BUREAUCRACY
IN INDIA OVER THE LAST TEN YEARS? ANSWER WITH POSITIVE, NEGATIVE
OR NO CHANGE.
In Percent
QUALITY OF BUREAUCRACY
Positive
63.4
Negative
7.3
No change
29.3
The CEOs gave various reasons for the
stagnancy, from arbitrary transfers of
bureaucrats to lack of expertise. Most
of them felt that the top bureaucracy
is open to ideas and have the capacity
to deliver outcomes. This cannot be
said of the lower bureaucracy that the
company offices or factories face.
“We have to function in a zero-
pollution area to make our products,”
a CEO said. “But there is the Factory
Act that requires us to put a spittoon
for workers. The inspector doesn’t
understand this. He goes by the
letter of the law. His seniors do. But
when we get a regulatory exemption
30
THE ORF-AMCHAM CEO SURVEY
from the senior, the inspector feels
slighted and gets other inspectors to
harass us.”
Civil servants have been fairly
effective in preserving the
overall Constitutional order but
perform poorly in impartially
implementing laws and policies at
the individual level. It has performed
badly in promoting economic growth
or providing good public services.32
The enforcement of laws has been
quite erratic as also described
by most of our interviewees, who
described India’s civil service as
being characterised by inconsistent
and arbitrary application of known
policy, delays in decision-making,
bribery and ineffectiveness of law
enforcement.33
CORRUPTION
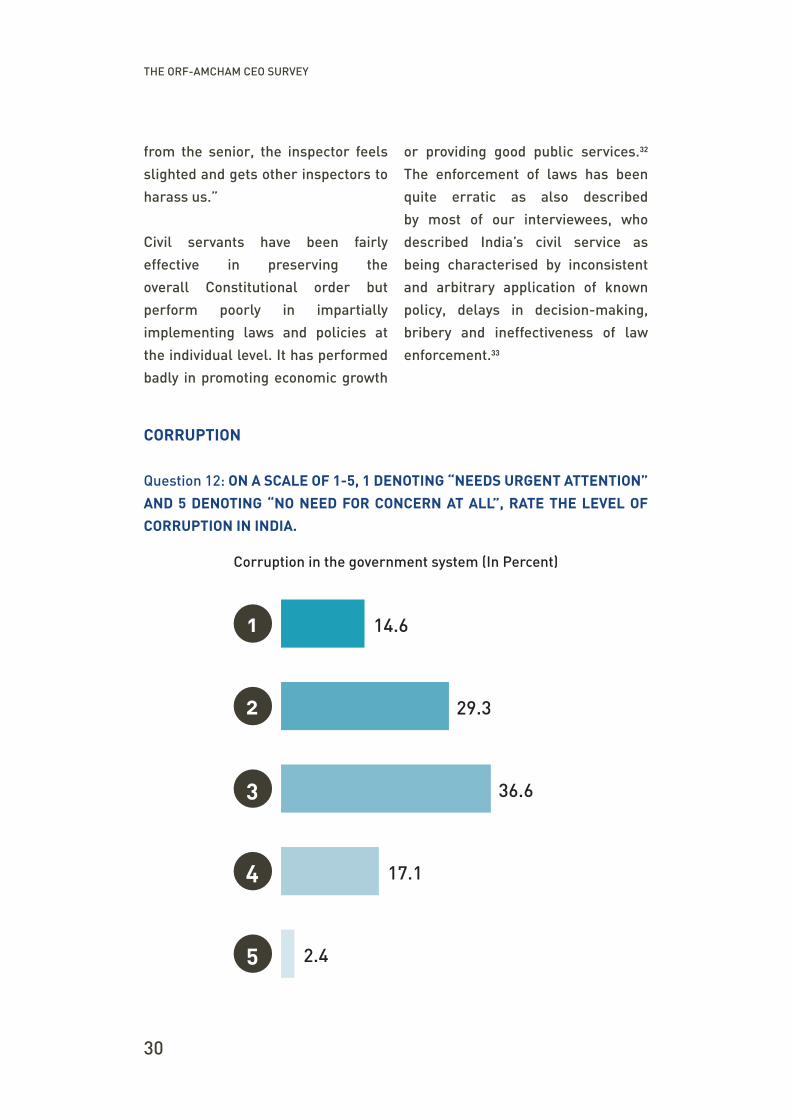
Question 12: ON A SCALE OF 1-5, 1 DENOTING “NEEDS URGENT ATTENTION”
AND 5 DENOTING “NO NEED FOR CONCERN AT ALL”, RATE THE LEVEL OF
CORRUPTION IN INDIA.
Corruption in the government system (In Percent)
14.6
29.3
36.6
17.1
2.4
1
2
3
4
5
THE ORF-AMCHAM CEO SURVEY
31
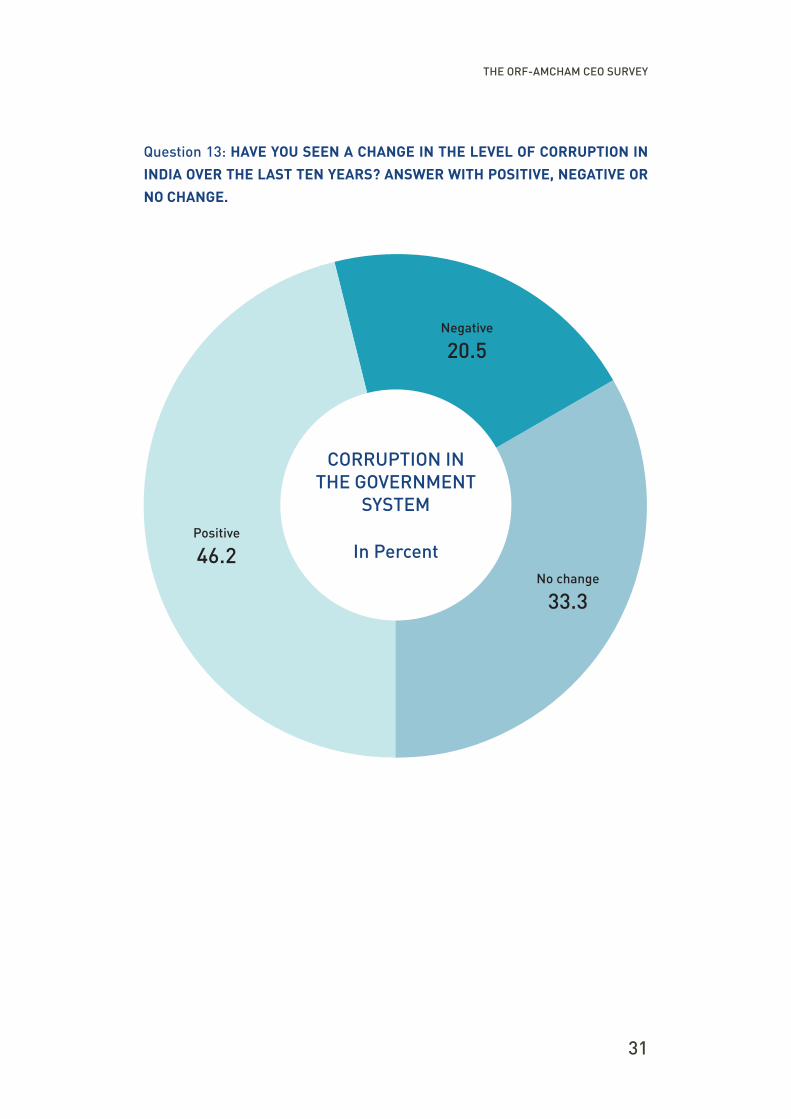
Question 13: HAVE YOU SEEN A CHANGE IN THE LEVEL OF CORRUPTION IN
INDIA OVER THE LAST TEN YEARS? ANSWER WITH POSITIVE, NEGATIVE OR
NO CHANGE.
In Percent
CORRUPTION IN THE GOVERNMENT
SYSTEM Positive
46.2
Negative
20.5
No change 33.3
32
THE ORF-AMCHAM CEO SURVEY
Close to half of the respondents,
or 46.2 percent, said that there is a
positive change in corruption levels in
the past 10 years and must continue
this way to ensure further improved
business. Although this is reflected
in improved scores on corruption,
India’s rank fell to 78 in 2018 from 76 in
2015 on the Corruption Perception
Index (CPI).34
The consensus on corruption is that
CEOs face more corrupt officials at the
State rather than at the Centre, and
down the line rather than at the top.
“There is concentrated corruption at
the lower levels,” one CEO said.
If we step back from India and
examine the idea of corruption and its
impact on business, we find that the
relationship is not direct – China has
seen its corruption rankings worsen,
to 87 from 72 over a decade,35 but
businesses continue to function.
“Corruption slows you down as there
are certain laws we are governed by
and even though we need quicker
approvals, we do not entertain any
sort of corrupt behaviour,” another
CEO said. “This causes delays.”
Despite Indian Parliament having
enacted various laws to prevent
corruption – defined as getting
monetary or non-monetary benefits
by a public servant through bribery
– it has been an intrinsic part of
India well before Independence, was
institutionalised over the past seven
decades, and threatens to continue
for a long time. A mix of legal
amendments and technology backed
by stronger political will should
catalyse change.
“CORRUPTION SLOWS YOU DOWN AS THERE ARE CERTAIN LAWS WE ARE GOVERNED BY AND EVEN THOUGH WE NEED QUICKER APPROVALS, WE DO NOT ENTERTAIN ANY SORT OF CORRUPT
BEHAVIOUR,” ANOTHER CEO SAID.
THE ORF-AMCHAM CEO SURVEY
33
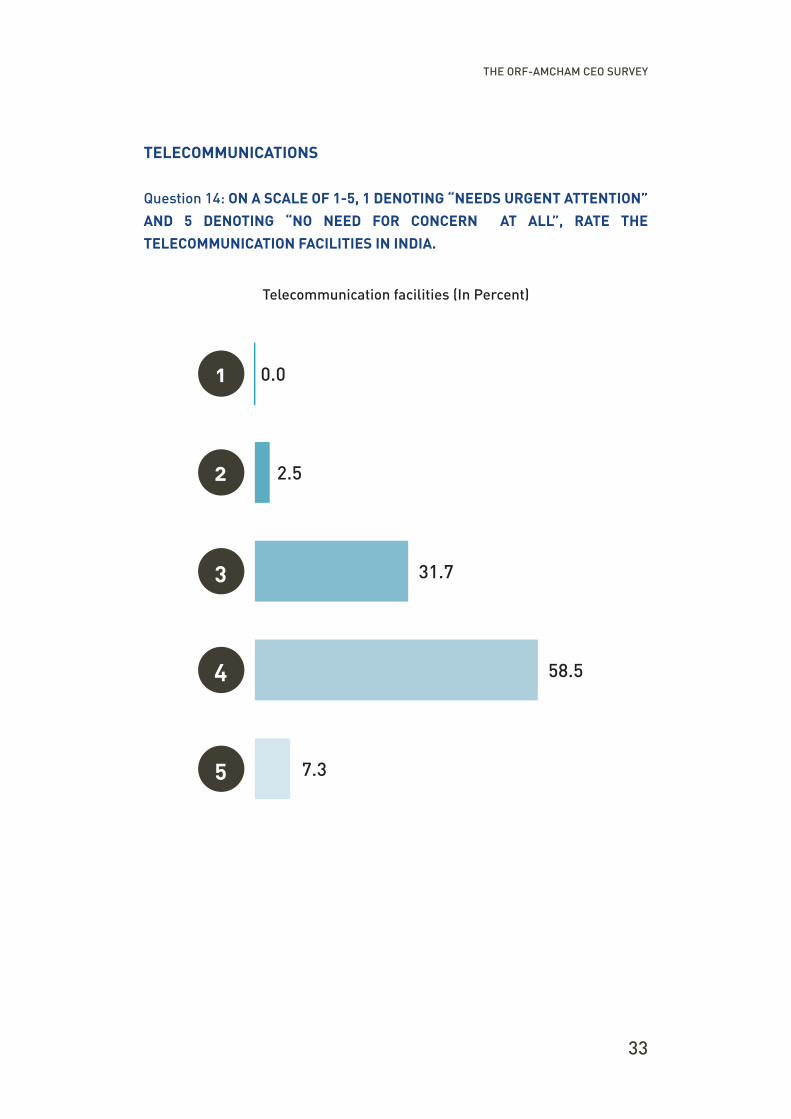
TELECOMMUNICATIONS
Question 14: ON A SCALE OF 1-5, 1 DENOTING “NEEDS URGENT ATTENTION”
AND 5 DENOTING “NO NEED FOR CONCERN AT ALL”, RATE THE
TELECOMMUNICATION FACILITIES IN INDIA.
Telecommunication facilities (In Percent)
0.0
2.5
31.7
58.5
7.3
1
2
3
4
5
34
THE ORF-AMCHAM CEO SURVEY
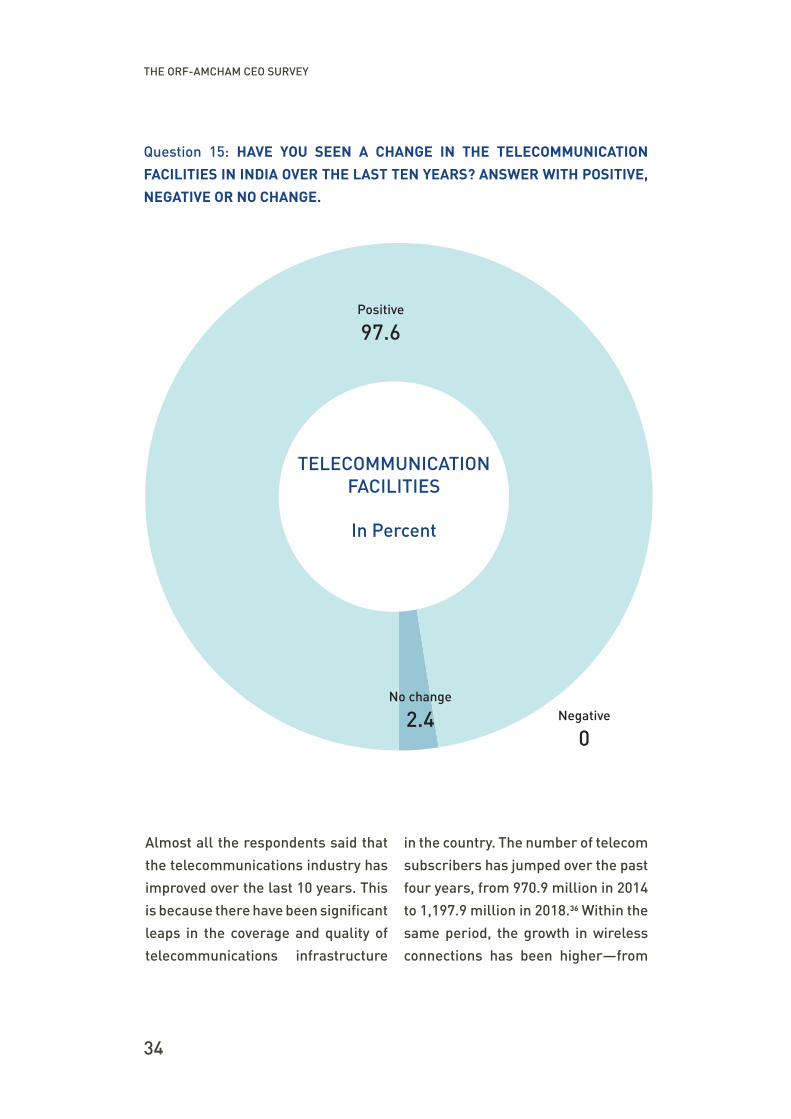
Question 15: HAVE YOU SEEN A CHANGE IN THE TELECOMMUNICATION
FACILITIES IN INDIA OVER THE LAST TEN YEARS? ANSWER WITH POSITIVE,
NEGATIVE OR NO CHANGE.
In Percent
TELECOMMUNICATION FACILITIES
Positive
97.6
Negative
0
No change 2.4
Almost all the respondents said that
the telecommunications industry has
improved over the last 10 years. This
is because there have been significant
leaps in the coverage and quality of
telecommunications infrastructure
in the country. The number of telecom
subscribers has jumped over the past
four years, from 970.9 million in 2014
to 1,197.9 million in 2018.36 Within the
same period, the growth in wireless
connections has been higher—from
THE ORF-AMCHAM CEO SURVEY
35
943.9 million to 1,176.0 million.37
When compared globally, India
has pole-vaulted in the use of
telecommunications technologies.
What it lagged in fixed lines, with
just 23 million fixed telephone
subscriptions in 2017 compared to
120 million for the US and 194 for
China,38 it has more than made up
for in mobile cellular subscriptions.
Against China’s 1.5 billion users,
India has 1.2 billion users and the US,
0.4 billion.39
A conducive regulatory framework
has enabled 100 percent FDI into
the sector. This policy change can
be seen with FDI inflows into this
sector increasing from $1.3 billion
in 2015 to $6.2 billion in 2017.40 This
infrastructure supports and catalyses
efficiency in business through digital
payment transactions through mobile
(up 3.5-fold, from 168 million in 2016
to 600 million in 2018). At 3.4 billion GB
per month, India is today the world’s
highest mobile data consumer.41
Recent research by a UK-based cable
company showed that India has the
cheapest mobile data rates at 0.26
dollars for a 1GB, compared to $9.89
in China or $7.38 in the US.42 The
research also stated that the reason
it stood first among 230 countries is
because of a young population having
technological awareness, a high
adoption rate and many competitors
that make data cheap.43
Despite having an excellent mobile
and broadband infrastructure,
however, the perception of a few
CEOs in certain states is different.
“Telecommunications facilities is
a huge challenge in Kolkata,” one
CEO said. “The infrastructure for all
mobile phone networks is quite poor
and there isn’t enough infrastructure
to support the number of increasing
subscribers.”
Further, reach is only the first step.
“India is probably five to six years
behind in the telecom industry
compared to other developing
countries,” another CEO said. “Korea
is far ahead, so is China. India is
slower than a lot of Asian countries
in terms of innovation, regulations,
providing services and consumer
experience.”
In an industry that is growing fast in
technology as well as in delivering
access, the lag in introducing 5G
services remains a concern for
another CEO. “We have still not
figured out how to bring in 5G even
though China and the US have already
started working in this spectrum,
licencing and pricing.”
36
THE ORF-AMCHAM CEO SURVEY
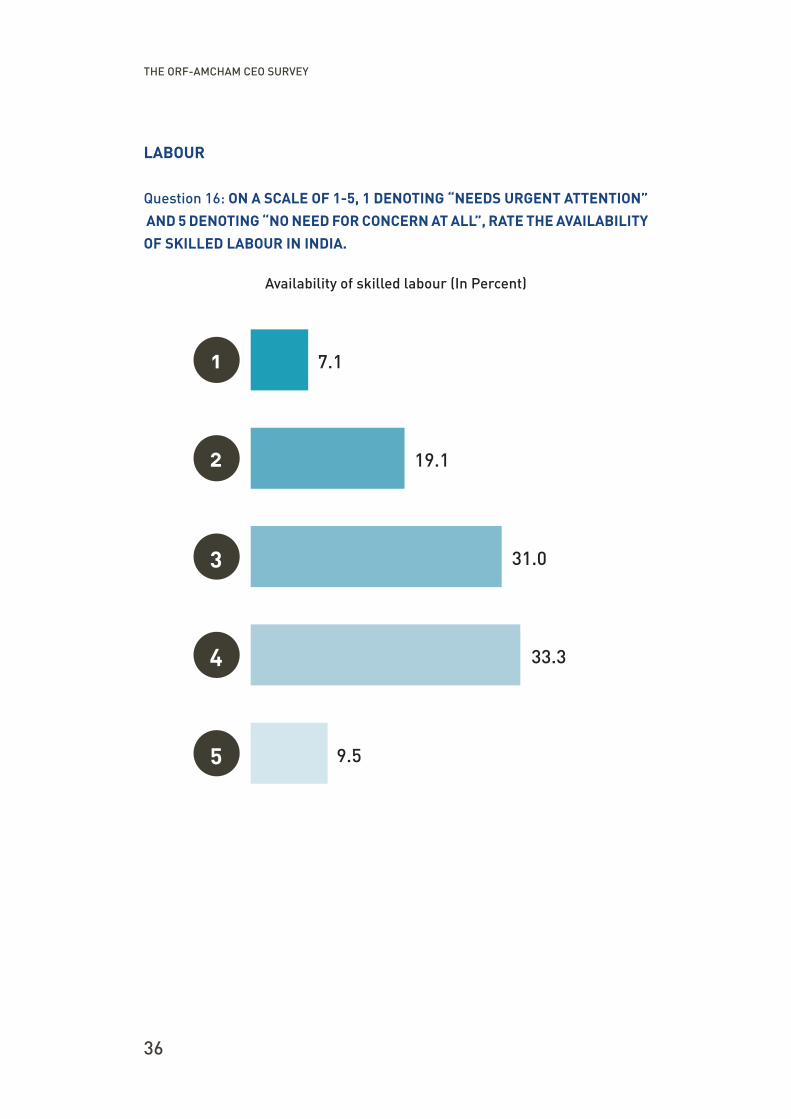
LABOUR
Question 16: ON A SCALE OF 1-5, 1 DENOTING “NEEDS URGENT ATTENTION”
AND 5 DENOTING “NO NEED FOR CONCERN AT ALL”, RATE THE AVAILABILITY
OF SKILLED LABOUR IN INDIA.
Availability of skilled labour (In Percent)
7.1
19.1
31.0
33.3
9.5
1
2
3
4
5
THE ORF-AMCHAM CEO SURVEY
37
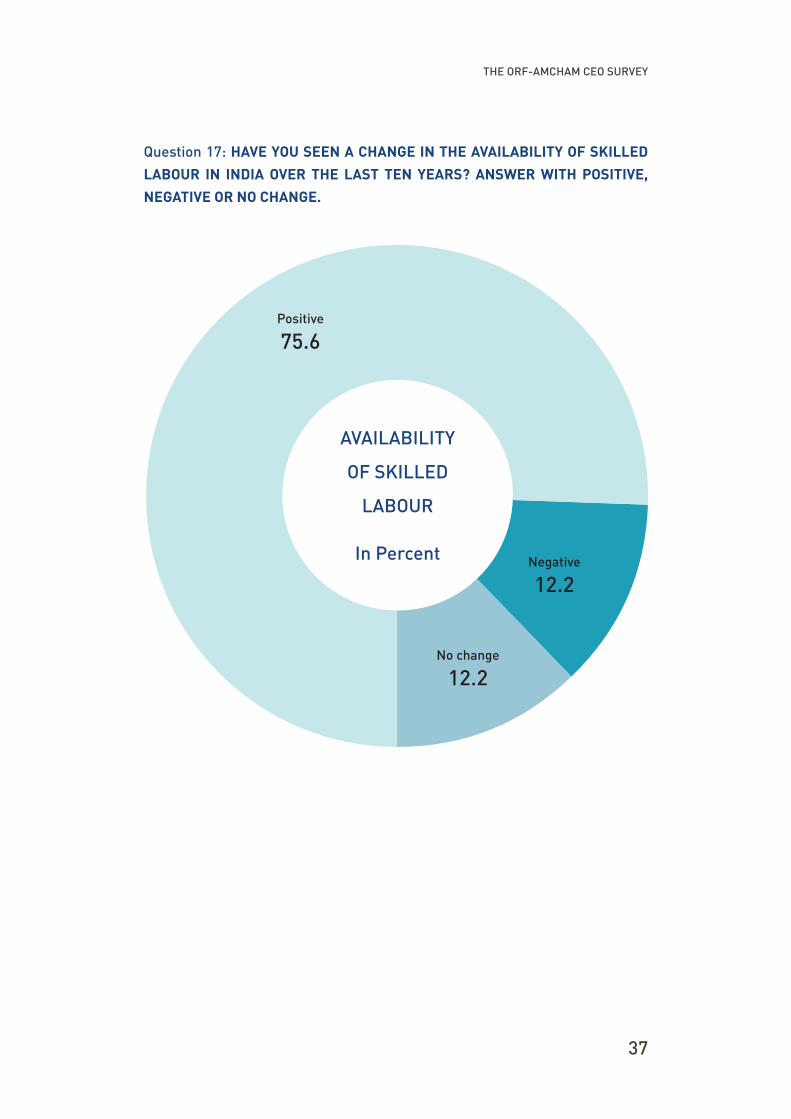
Question 17: HAVE YOU SEEN A CHANGE IN THE AVAILABILITY OF SKILLED
LABOUR IN INDIA OVER THE LAST TEN YEARS? ANSWER WITH POSITIVE,
NEGATIVE OR NO CHANGE.
In Percent
AVAILABILITY
OF SKILLED
LABOUR
Positive
75.6
Negative
12.2
No change
12.2
38
THE ORF-AMCHAM CEO SURVEY
WITH MORE THAN 54 PERCENT OF INDIA’S POPULATION BELOW THE AGE OF 25 YEARS, SKILLS DEVELOPMENT PROGRAMMES ARE IMPORTANT TO MAKE SURE THAT THE YOUTH ARE EMPLOYABLE.
India being a labour-surplus country,
finding labour is easy; talented labour,
however, is more difficult to muster.
Three-fourths of the CEOs said there
is a positive change in skilled talent
and managerial talent available in
India. But there are two major issues
that companies face under this head:
labour laws and skills required to
keep up with 21st-century needs.
First, the malaise in the country’s
labour laws is deeply rooted. There
are 36 Central laws governing labour
and several State laws. These laws
have become counterproductive to
the twin objectives of job creation
and industrial peace, hurting the very
same people it is meant to benefit.
A weak commitment to implement
labour laws and an ineffective
industrial disputes machinery have
been the major factors contributing
to unsound industrial relations.44
These laws deter businesses from
hiring labour. Given the rise of robotics
and artificial intelligence, technology
is the other risk. What is needed is a
policy solution that delivers a balance
between promoting the welfare of
labour and protecting the interests
of capital, all the while functioning
under the market mechanism. The
good news around positive change
needs to continue.
Second, there is a shortage of labour
with specialised skills as there is
high demand and takes a long time
to train and skill them. With more
than 54 percent of India’s population
below the age of 25 years, skills
development programmes are
important to make sure that the
youth are employable. The workforce
faces the “dual challenge of paucity of
highly trained workforce, as well as
non-employability of large sections
of the conventionally educated youth,
who possess little or no job skills”.45
“Engineering colleges have
mushroomed all over India but the
quality has not increased in terms
of education and infrastructure,”
a CEO said. “Only 20-25 percent of
these graduates are employable.
Middle managers are improving
but global experience is needed for
management positions in an MNC.”
THE ORF-AMCHAM CEO SURVEY
39
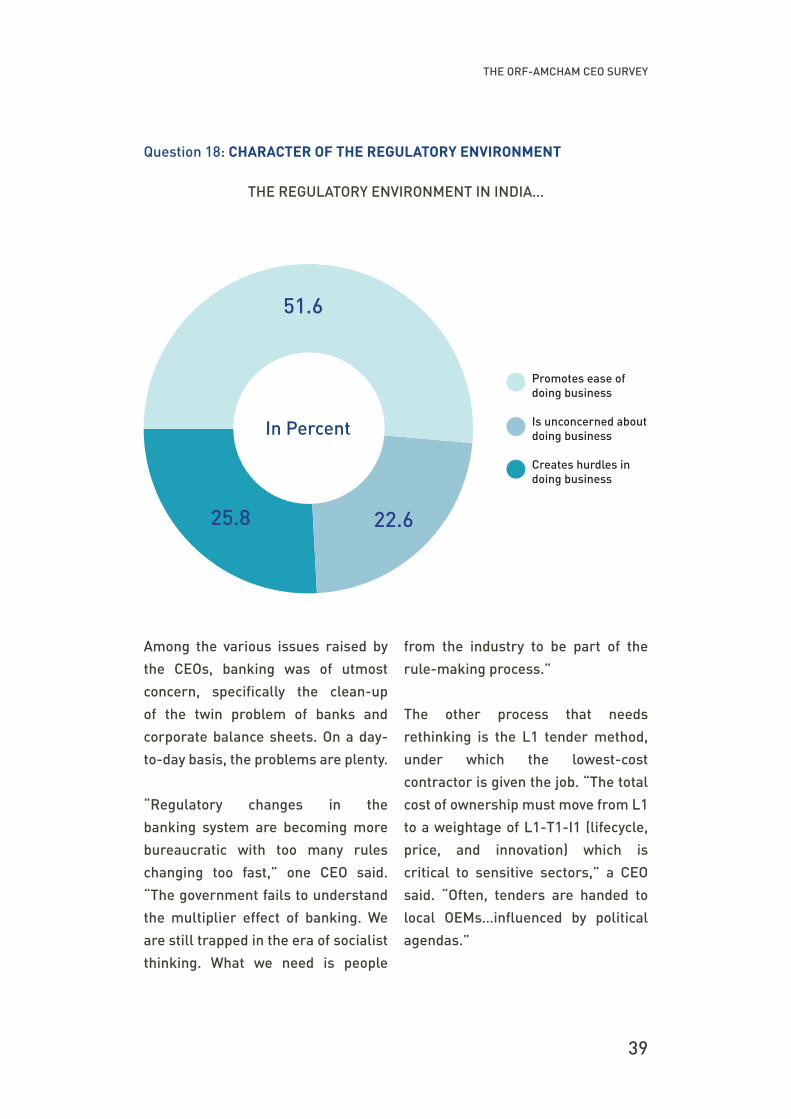
Question 18: CHARACTER OF THE REGULATORY ENVIRONMENT
THE REGULATORY ENVIRONMENT IN INDIA…
In Percent
51.6
22.625.8
Promotes ease of doing business
Is unconcerned about doing business
Creates hurdles in doing business
Among the various issues raised by
the CEOs, banking was of utmost
concern, specifically the clean-up
of the twin problem of banks and
corporate balance sheets. On a day-
to-day basis, the problems are plenty.
“Regulatory changes in the
banking system are becoming more
bureaucratic with too many rules
changing too fast,” one CEO said.
“The government fails to understand
the multiplier effect of banking. We
are still trapped in the era of socialist
thinking. What we need is people
from the industry to be part of the
rule-making process.”
The other process that needs
rethinking is the L1 tender method,
under which the lowest-cost
contractor is given the job. “The total
cost of ownership must move from L1
to a weightage of L1-T1-I1 (lifecycle,
price, and innovation) which is
critical to sensitive sectors,” a CEO
said. “Often, tenders are handed to
local OEMs…influenced by political
agendas.”
40
THE ORF-AMCHAM CEO SURVEY
India being a labour-surplus country, finding labour is easy; talented labour, however, is more difficult to muster.
Another CEO gave an example of
going through four chairmen, five
executive directors, a regime change
and six years before his request for
proposal (RFP) was accepted. While
a checks-and-balances system is a
good idea, it needs to be speeded up.
Multiplicity of regulators creates
another challenge – inconsistent
arbitration. Further, “for a subsidiary
of a foreign parent, regulations create
further restrictions,” another CEO
said.
Finally, rapidly-changing policies
tend to bring policy uncertainty and
introduces a sense of instability.
“There is a customs duty issue for
us,” one CEO said. “When we set up
a factory in India in 2013, there was 0
percent duty on raw material. The next
year, they put a 10 percent duty. In the
next four months, it fell to 5 percent. In
the next budget cycle, it was brought
back to 0 percent, only to increase it
to 5 percent in the next budget. In two
years, they have changed the duty on
a primary raw material five times.
Tariffs hurt, but flip-flop hurt even
more. Constant changes are a red-
flag by our headquarters.”
THE ORF-AMCHAM CEO SURVEY
41
The ‘Make in India’ programme aims
at promoting India as an important
investment destination and a global
hub for manufacturing, design and
innovation. There are 25 sectors
that have been identified under this
initiative, ranging from aviation to
tourism and hospitality.46
One of the larger US-based
technology firms working with OEMs
to localise manufacturing, is getting
government support and targeting
village-level support to sell such
technological ideas tweaked to the
needs of India, at the farm-level.
All is not smooth, however. “The
government needs to understand the
difference between manufacturing
and assembling,” a CEO said.
“Bringing in raw material for
manufacturing should be looked at
differently than raw components
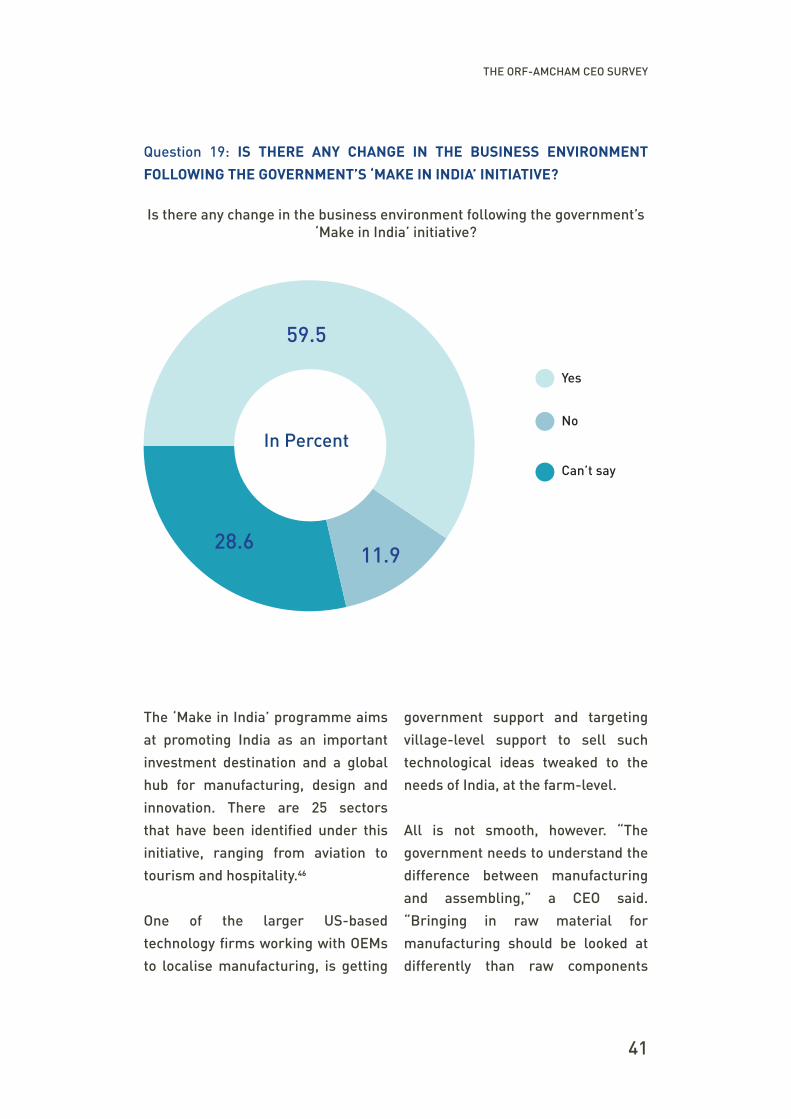
Question 19: IS THERE ANY CHANGE IN THE BUSINESS ENVIRONMENT
FOLLOWING THE GOVERNMENT’S ‘MAKE IN INDIA’ INITIATIVE?
Is there any change in the business environment following the government’s ‘Make in India’ initiative?
In Percent
59.5
11.928.6
Yes
No
Can’t say
42
THE ORF-AMCHAM CEO SURVEY
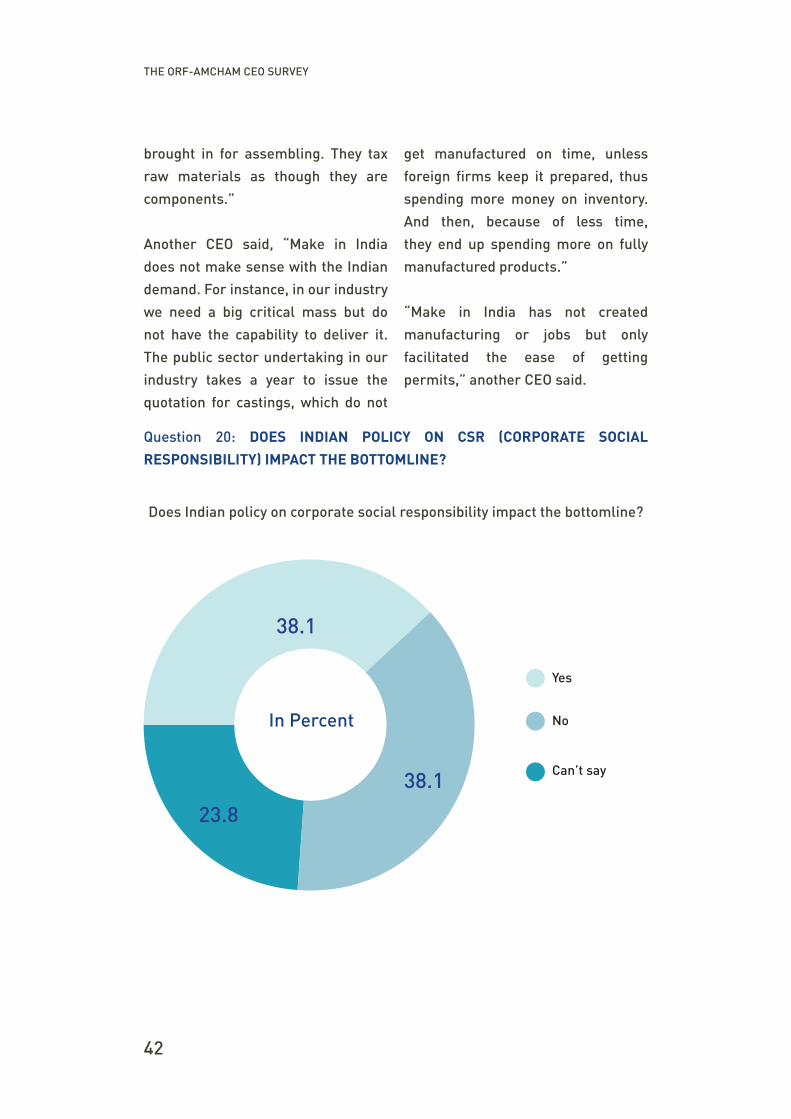
Question 20: DOES INDIAN POLICY ON CSR (CORPORATE SOCIAL
RESPONSIBILITY) IMPACT THE BOTTOMLINE?
Does Indian policy on corporate social responsibility impact the bottomline?
brought in for assembling. They tax
raw materials as though they are
components.”
Another CEO said, “Make in India
does not make sense with the Indian
demand. For instance, in our industry
we need a big critical mass but do
not have the capability to deliver it.
The public sector undertaking in our
industry takes a year to issue the
quotation for castings, which do not
get manufactured on time, unless
foreign firms keep it prepared, thus
spending more money on inventory.
And then, because of less time,
they end up spending more on fully
manufactured products.”
“Make in India has not created
manufacturing or jobs but only
facilitated the ease of getting
permits,” another CEO said.
In Percent
38.1
38.1
23.8
Yes
No
Can’t say
THE ORF-AMCHAM CEO SURVEY
43
Under Chapter IX, Section 135,47 a
company with a net worth of Rs 5
billion or more, or a turnover of at
least Rs 10 billion, or a net profit of Rs
50 million or more will need to create
a CSR Committee and spend “at least
two percent of the average net profits
of the company made during the three
immediately preceding financial
years,” on social endeavours in every
financial year.
The areas in which companies
undertook CSR activities included
education, community and economic
development, and skill development.
Counterintuitively, the fact that
in India it is mandatory for large
companies to spend 2 percent of
their net profits on CSR is not being
seen as a burden. Several CEOs said
that it is their firm’s global mandate
to spend on community and people
development, and thus the mandatory
policy does not in any way affect their
profits.
That said, there are blemishes in
the way the CSR scheme is being
executed on the ground. “In Chennai,
at the plant, officials said that we
must spend the 2 percent within
Tamil Nadu, mandating which project
should be funded,” a CEO said. “This
way, we cannot make an impact.
Some of these demands about where,
when and how to spend the CSR
money is getting out of bounds and
we were thinking about taking the
officials to court. But we decided
against it because the legal system is
so slow. In this way, they are literally
arm-twisting and blackmailing us
and sitting on our approvals till then.”
On the other side, impact is
an ambiguous concept. “Many
companies are averse to signing
multi-year projects,” the head of an
NGO we spoke to said. “But most
social impact projects can make a
change only after a couple of years
and without having the company sign
off on these, non-profits have to take
the risk of funding these projects.”
This finding is in tune with what CEOs
are doing. “There are many projects
that have a multi-year timeframe
to yield results but we don’t look at
that,” a CEO said. “What we look at
is whether we can see an immediate
impact.”
CONCLUSIONS AND RECOMMENDATIONS
III.
India and the US have a unique opportunity
to build a strategic relationship through
shared economic interests built over a strong
foundation of common democratic values.
Together, these can potentially resolve some
of the most critical problems faced by industry,
governments and consumers.
The following are the major lessons that this
analysis has derived from the survey of CEOs of US
companies based in India.
1. More than four out of every five CEOs of US
corporations said they set up business in India
because of its large market and fast growing
economy.
2. Almost all respondents – more than nine out of
every 10 CEOs – said they plan to continue with
their business activities in India for the next 20
years.
3. More than four out of every five CEOs said they
are optimistic about the expansion of their
business in India. In the extended interviews,
some of them said this optimism exists despite
CONCLUSIONS AND RECOMMENDATIONS
45
doubts about policy stability in
certain sectors.
4. The three areas that need
attention, according to the
respondents, are infrastructure,
land acquisition and taxation.
5. The four areas that do not need
urgent attention are bureaucracy,
corruption, telecommunications,
and labour.
6. More than half of the CEO
respondents believe that the
government is trying to make
doing business in India easier
through regulatory interventions.
However, a quarter of them said
the government creates hurdles
in doing business.
7. Almost three out of every five
CEOs said that the government’s
Make in India initiative has
brought change to the business
environment.
In a nutshell, the respondents are of the view that India has witnessed radical
changes to make a giant leap in expanding its economy over the past few
years. Still, the country needs to undertake certain reforms to continue to ride
this growth.
RECOMMENDATIONS
A $5-trillion strong economy has
now become the Indian government’s
stated economic objective. There are
three interventions48 the government
can make to push the country
faster towards such a goal through
manufacturing. First, financial:
subsidies on capital, loans and risk
covers. Second, fiscal incentives:
tax exemptions or reductions that
can be based on labour, capital
or sales on the indirect side and
reduced corporate taxes on the other.
And third, enabling the smooth and
inexpensive delivery of infrastructure
inputs such as power, water or
logistics to reduce costs and/or
create a dependable supporting
manufacturing environment.
Governments, both the Union
and those in the States, need to
negotiate the thin line of these policy
interventions to ensure growth.
1. Manufacturing happens in states
and state governments need
to bear the enabling burden,
the returns from which are
not only economic, through
direct investments (foreign and
domestic) and revenues, but
political as well, in the form of
46
CONCLUSIONS AND RECOMMENDATIONS
direct and indirect jobs. A new
form of competitive federalism
is needed, where states compete
for investments on their
terms. As far as foreign direct
investments are concerned, the
Union government can facilitate
such interactions. Seeking a
manufacturing sector growth
rate of 12-13 percent to reach
a gross state domestic product
share of 25 percent by 2023-24,
the Government of Maharashtra,
for example, through the
Maharashtra Industrial Policy
2019, is attempting to strengthen
its manufacturing ecosystem and
turn the state into a $1-trillion
economy by 2025.49 Likewise,
Gujarat’s Scheme for Incentive to
Industries (General) 2016-2021
seeks to attract manufacturing to
the state.50
2. Even though India has taken huge
steps forward, infrastructure
development, particularly of
roads and ports, needs urgent
attention the CEOs said. In
specialised industrial economic
zones, for instance, there are
last-mile problems such as water
and power, both of which need
local permits. Companies need
to negotiate these problems
alongside rent-seeking by water
tankers, or what one CEO called the
“water mafia” that are embedded
into the lower bureaucracy. India
must rethink its infrastructure
policy, keeping the market in
mind. This means redesigning
policies that leave room for a
changing dynamic of financing
patterns or technological
disruptions and allowing
contractual renegotiations
where necessary. Shifting
infrastructure building to a
principles-based approach rather
than a rules-based straitjacket
may deliver outcomes. Finally,
regulation of infrastructure too
needs to be re-examined on
two counts – first, ending the
process of turning regulators
into a monopoly of sinecures for
retired bureaucrats; and second,
creating a new balance between
independence and accountability.
3. Industry needs land to set up
its premises. There are two
interrelated problems in this
domain: One, the process of
acquiring land is long and
cumbersome; and two, this
raises the price of land, making
the business proposal unviable.
The laws on land acquisition
too have been made extremely
stringent. Not just industry, even
infrastructure development is
facing hurdles. On the other
CONCLUSIONS AND RECOMMENDATIONS
47
side, not all land is productive.
The government needs to
create a structure around which
infrastructure, particularly
roads, and large private
industries such as steel plants
can come up and create output,
jobs and allied opportunities.
4. Despite labour laws not being
seen as a hurdle by CEOs, India
needs to fix the excessively large
number of Acts of Parliament that
regulate labour. At last count,
there were more than 36 Central
laws governing various aspects of
labour, from minimum wages to
safety. These need consolidation.
The first step towards this has
been taken. In tune with the
recommendations of the Second
National Commission on Labour,
the government has initiated a
move towards formulating four
labour codes – wages, industrial
relations, social security and
welfare, and safety and working
conditions – by amalgamating,
simplifying and rationalising the
relevant provisions of extant laws.
This, however, is only the starting
point. A 21st-century new India
needs 21st-century new laws.
METHODOLOGY AND QUESTIONNAIRE
To arrive at a 360-degree look at the
opportunities and the hurdles US
companies face, we used a two-part
process – a questionnaire and face-to-
face interview. Both were answered by CEOs of the
companies.
The CEOs were picked from diverse industries –
manufacturing, retail, technology, banking, and
others. CEOs of two non-profit organisations were
also added to this collection, to receive a perspective
on the community agendas of big corporates in a
developing country like India.
QUESTIONNAIRE
The questionnaire has 24 questions and was
designed to capture the main critiques and
opportunities US companies see in the Indian
business environment. The questions are organised
along five thematic blocks.
• First, the company details.
• Second, the impact of different business
ANNEX
Annex: Methodology and Questionnaire
49
components and their influence on decisions to set up in India.
• Third, aspects related to policy responses.
• Fourth, the future of companies to compete globally.
• Fifth, community and corporate relations.
The questionnaire combined open-ended questions and multiple-choice
questions with predefined answers offering respondents the possibility to
choose and rank among several options or the possibility to grade on a “urgent”
to “no concern” scale. For these questions, an optional space was provided to
elaborate on the answer. This open part is considered of great importance for
a Survey of this kind as it contributes to improving the interpretation of its
overall results and provides with additional valuable material.
The total number of respondents was 42, of which 40 were CEOs of commercial
enterprises and two of not-for-profits.
INTERVIEWS
The survey above was followed by a face-to-face interview with CEOs.
Depending on the direction of the conversations, the length of these interviews
was between 45 minutes and 2 hours.
The total number of CEOs interviewed was 29.
QUESTIONS AND RESPONSES
PART 1: THE COMPANY
1. Company name: __________________
2. Industry (please tick one)
a. Manufacturing
b. Banking, financial services, insurance
c. Infrastructure
d. Retail
e. Transport and logistics
f. Technology and allied services
50
Annex: Methodology and Questionnaire
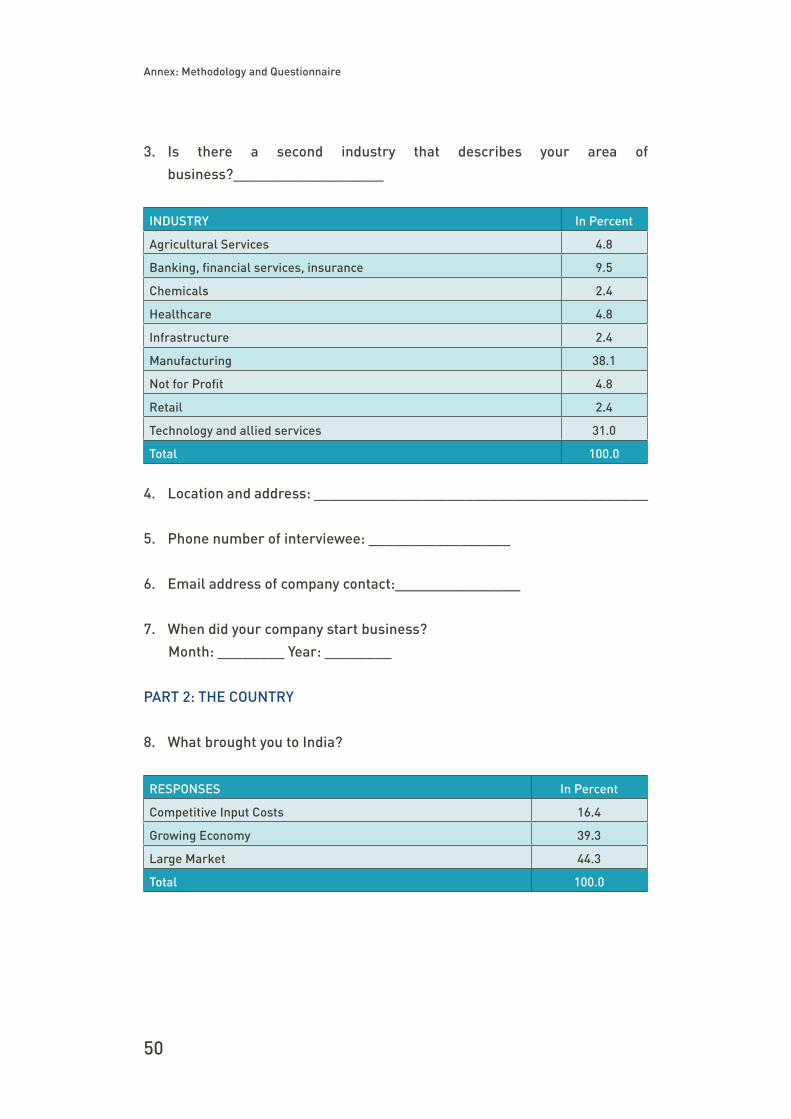
3. Is there a second industry that describes your area of
business?__________________
INDUSTRY In Percent
Agricultural Services 4.8
Banking, financial services, insurance 9.5
Chemicals 2.4
Healthcare 4.8
Infrastructure 2.4
Manufacturing 38.1
Not for Profit 4.8
Retail 2.4
Technology and allied services 31.0
Total 100.0
4. Location and address: ________________________________________
5. Phone number of interviewee: _________________
6. Email address of company contact:_______________
7. When did your company start business?
Month: ________ Year: ________
PART 2: THE COUNTRY
8. What brought you to India?
RESPONSES In Percent
Competitive Input Costs 16.4
Growing Economy 39.3
Large Market 44.3
Total 100.0
Annex: Methodology and Questionnaire
51
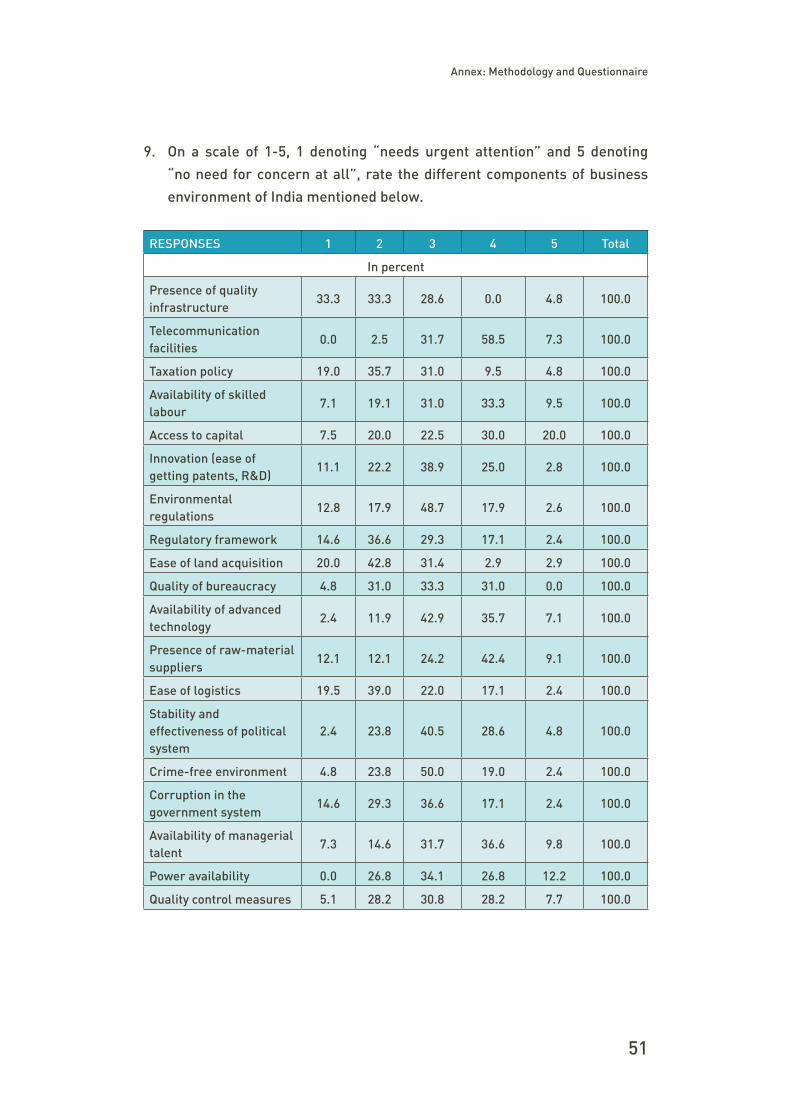
9. On a scale of 1-5, 1 denoting “needs urgent attention” and 5 denoting
“no need for concern at all”, rate the different components of business
environment of India mentioned below.
RESPONSES 1 2 3 4 5 Total
In percent
Presence of quality infrastructure
33.3 33.3 28.6 0.0 4.8 100.0
Telecommunication facilities
0.0 2.5 31.7 58.5 7.3 100.0
Taxation policy 19.0 35.7 31.0 9.5 4.8 100.0
Availability of skilled labour
7.1 19.1 31.0 33.3 9.5 100.0
Access to capital 7.5 20.0 22.5 30.0 20.0 100.0
Innovation (ease of getting patents, R&D)
11.1 22.2 38.9 25.0 2.8 100.0
Environmental regulations
12.8 17.9 48.7 17.9 2.6 100.0
Regulatory framework 14.6 36.6 29.3 17.1 2.4 100.0
Ease of land acquisition 20.0 42.8 31.4 2.9 2.9 100.0
Quality of bureaucracy 4.8 31.0 33.3 31.0 0.0 100.0
Availability of advanced technology
2.4 11.9 42.9 35.7 7.1 100.0
Presence of raw-material suppliers
12.1 12.1 24.2 42.4 9.1 100.0
Ease of logistics 19.5 39.0 22.0 17.1 2.4 100.0
Stability and effectiveness of political system
2.4 23.8 40.5 28.6 4.8 100.0
Crime-free environment 4.8 23.8 50.0 19.0 2.4 100.0
Corruption in the government system
14.6 29.3 36.6 17.1 2.4 100.0
Availability of managerial talent
7.3 14.6 31.7 36.6 9.8 100.0
Power availability 0.0 26.8 34.1 26.8 12.2 100.0
Quality control measures 5.1 28.2 30.8 28.2 7.7 100.0
52
Annex: Methodology and Questionnaire
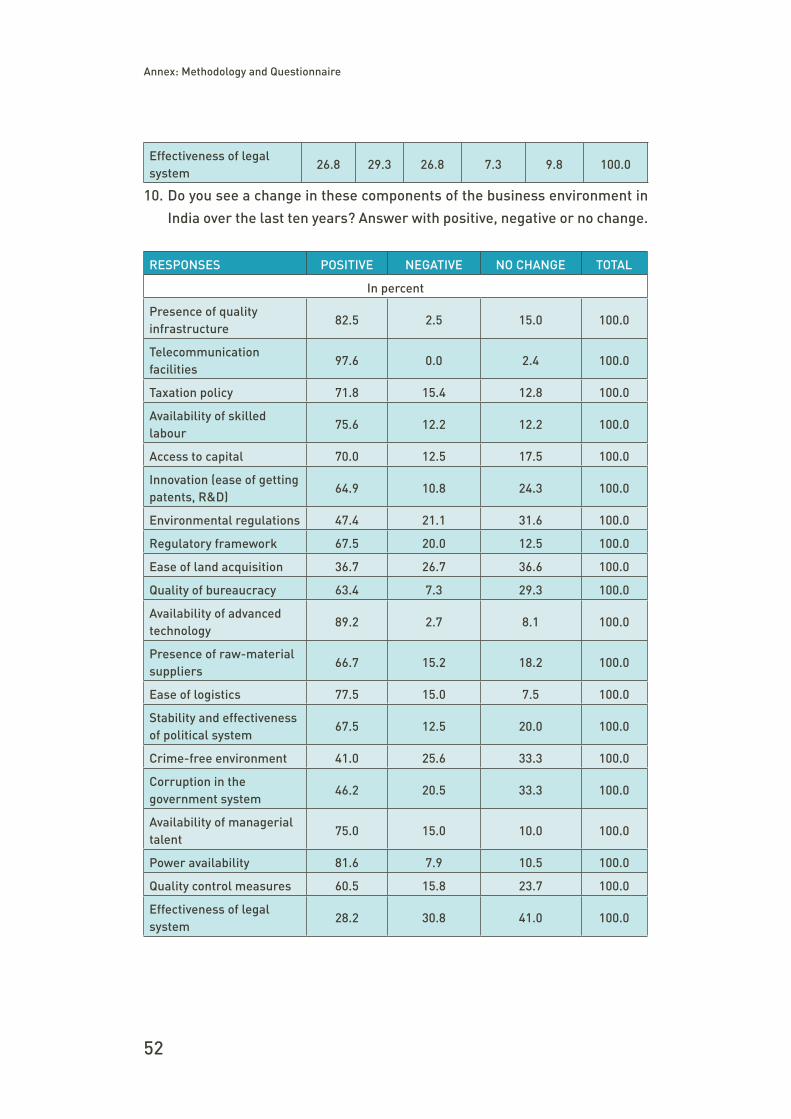
Effectiveness of legal system
26.8 29.3 26.8 7.3 9.8 100.0
10. Do you see a change in these components of the business environment in
India over the last ten years? Answer with positive, negative or no change.
RESPONSES POSITIVE NEGATIVE NO CHANGE TOTAL
In percent
Presence of quality infrastructure
82.5 2.5 15.0 100.0
Telecommunication facilities
97.6 0.0 2.4 100.0
Taxation policy 71.8 15.4 12.8 100.0
Availability of skilled labour
75.6 12.2 12.2 100.0
Access to capital 70.0 12.5 17.5 100.0
Innovation (ease of getting patents, R&D)
64.9 10.8 24.3 100.0
Environmental regulations 47.4 21.1 31.6 100.0
Regulatory framework 67.5 20.0 12.5 100.0
Ease of land acquisition 36.7 26.7 36.6 100.0
Quality of bureaucracy 63.4 7.3 29.3 100.0
Availability of advanced technology
89.2 2.7 8.1 100.0
Presence of raw-material suppliers
66.7 15.2 18.2 100.0
Ease of logistics 77.5 15.0 7.5 100.0
Stability and effectiveness of political system
67.5 12.5 20.0 100.0
Crime-free environment 41.0 25.6 33.3 100.0
Corruption in the government system
46.2 20.5 33.3 100.0
Availability of managerial talent
75.0 15.0 10.0 100.0
Power availability 81.6 7.9 10.5 100.0
Quality control measures 60.5 15.8 23.7 100.0
Effectiveness of legal system
28.2 30.8 41.0 100.0
Annex: Methodology and Questionnaire
53
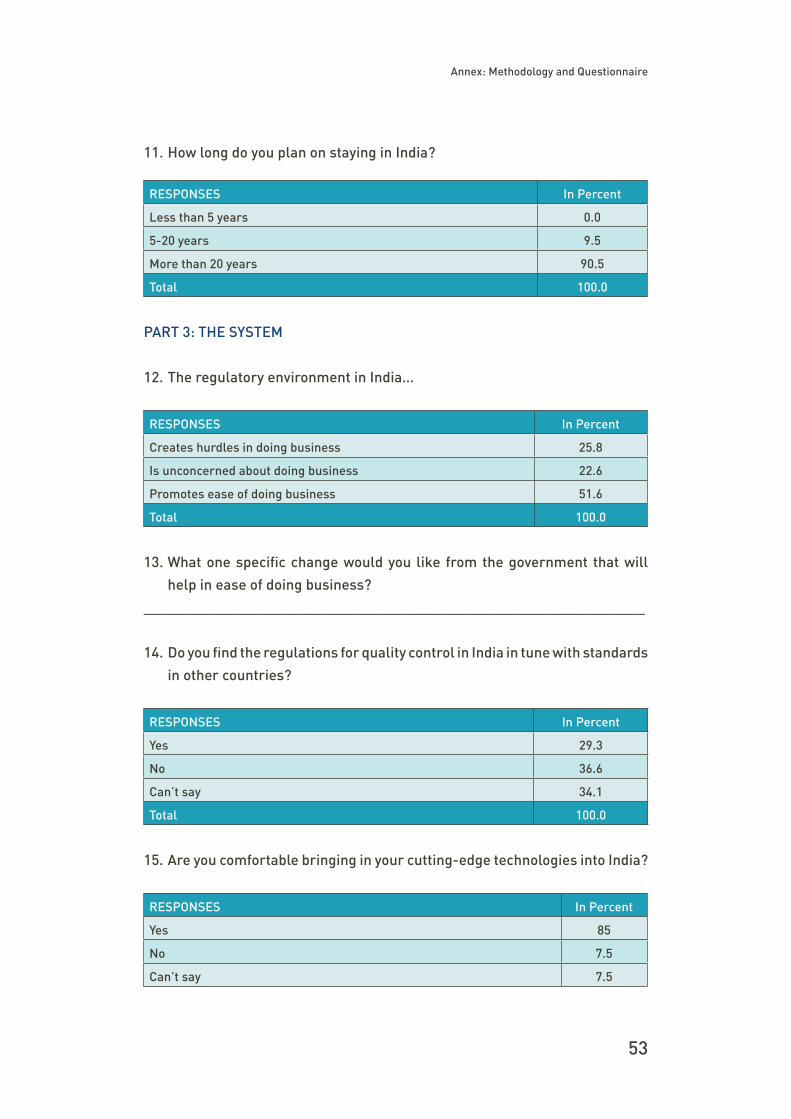
11. How long do you plan on staying in India?
RESPONSES In Percent
Less than 5 years 0.0
5-20 years 9.5
More than 20 years 90.5
Total 100.0
PART 3: THE SYSTEM
12. The regulatory environment in India…
RESPONSES In Percent
Creates hurdles in doing business 25.8
Is unconcerned about doing business 22.6
Promotes ease of doing business 51.6
Total 100.0
13. What one specific change would you like from the government that will
help in ease of doing business?
____________________________________________________________
14. Do you find the regulations for quality control in India in tune with standards
in other countries?
RESPONSES In Percent
Yes 29.3
No 36.6
Can’t say 34.1
Total 100.0
15. Are you comfortable bringing in your cutting-edge technologies into India?
RESPONSES In Percent
Yes 85
No 7.5
Can’t say 7.5
54
Annex: Methodology and Questionnaire
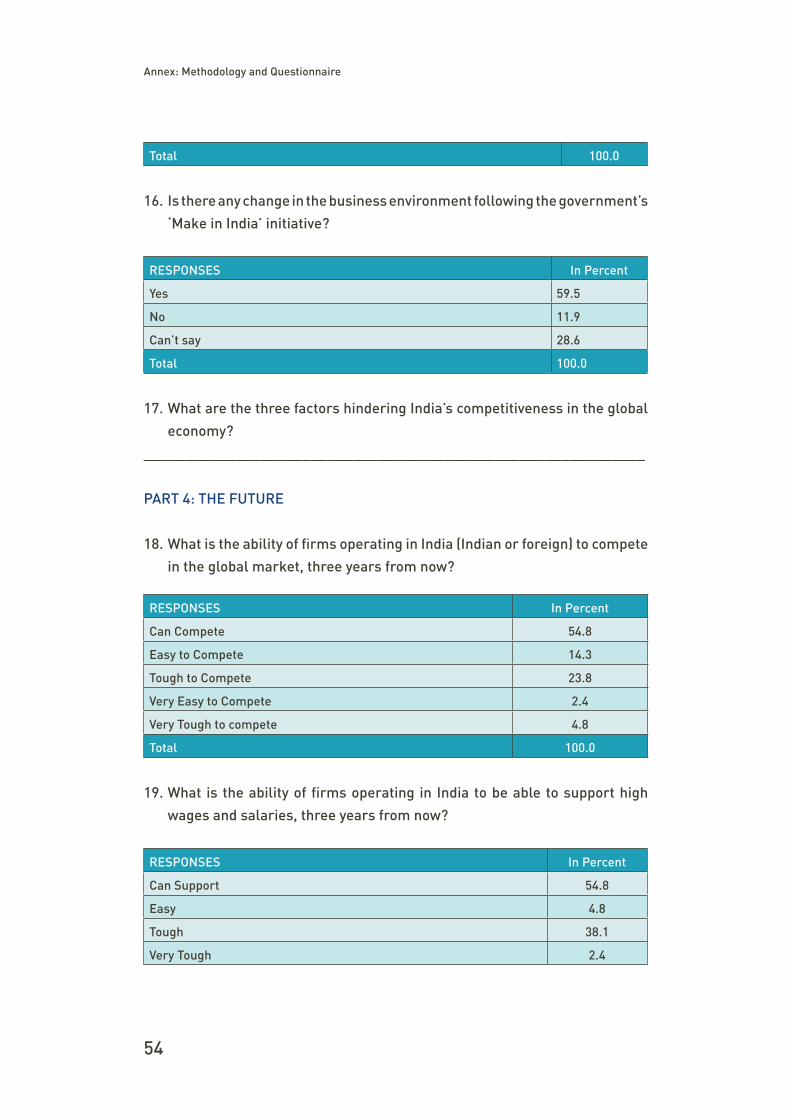
Total 100.0
16. Is there any change in the business environment following the government’s
‘Make in India’ initiative?
RESPONSES In Percent
Yes 59.5
No 11.9
Can’t say 28.6
Total 100.0
17. What are the three factors hindering India’s competitiveness in the global
economy?
____________________________________________________________
PART 4: THE FUTURE
18. What is the ability of firms operating in India (Indian or foreign) to compete
in the global market, three years from now?
RESPONSES In Percent
Can Compete 54.8
Easy to Compete 14.3
Tough to Compete 23.8
Very Easy to Compete 2.4
Very Tough to compete 4.8
Total 100.0
19. What is the ability of firms operating in India to be able to support high
wages and salaries, three years from now?
RESPONSES In Percent
Can Support 54.8
Easy 4.8
Tough 38.1
Very Tough 2.4
Annex: Methodology and Questionnaire
55
Total 100.0
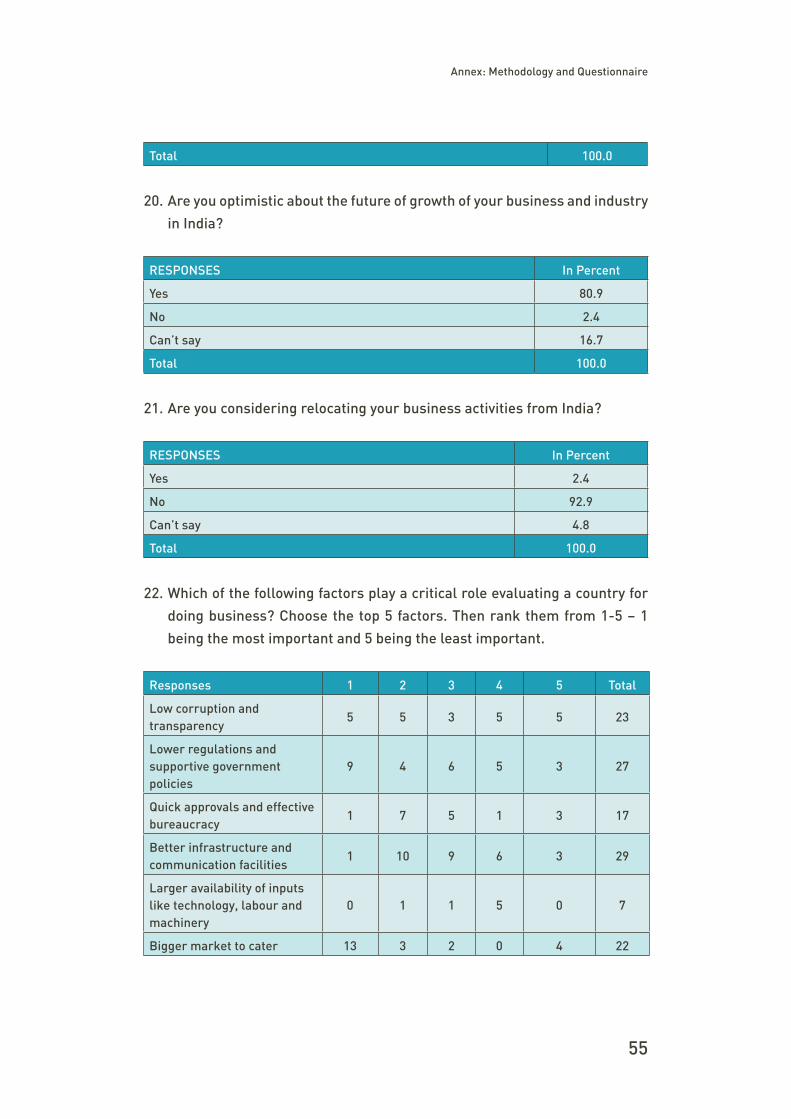
20. Are you optimistic about the future of growth of your business and industry
in India?
RESPONSES In Percent
Yes 80.9
No 2.4
Can’t say 16.7
Total 100.0
21. Are you considering relocating your business activities from India?
RESPONSES In Percent
Yes 2.4
No 92.9
Can’t say 4.8
Total 100.0
22. Which of the following factors play a critical role evaluating a country for
doing business? Choose the top 5 factors. Then rank them from 1-5 – 1
being the most important and 5 being the least important.
Responses 1 2 3 4 5 Total
Low corruption and transparency
5 5 3 5 5 23
Lower regulations and supportive government policies
9 4 6 5 3 27
Quick approvals and effective bureaucracy
1 7 5 1 3 17
Better infrastructure and communication facilities
1 10 9 6 3 29
Larger availability of inputs like technology, labour and machinery
0 1 1 5 0 7
Bigger market to cater 13 3 2 0 4 22
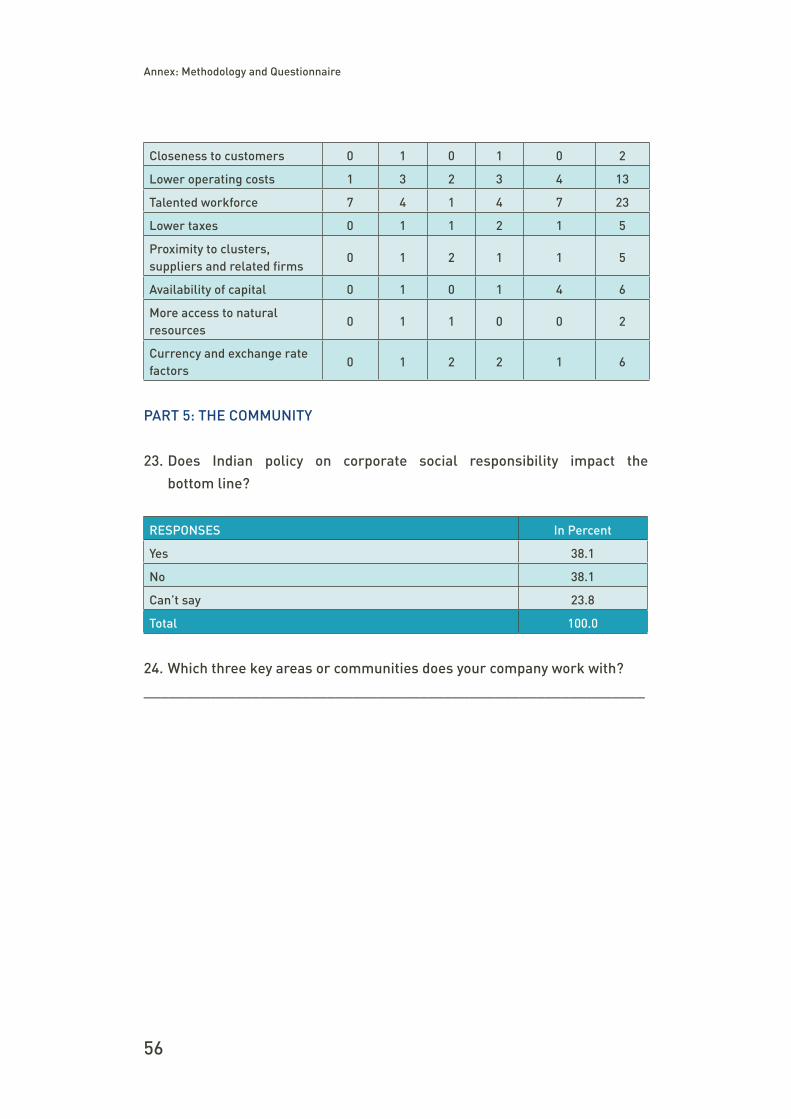
56
Annex: Methodology and Questionnaire
Closeness to customers 0 1 0 1 0 2
Lower operating costs 1 3 2 3 4 13
Talented workforce 7 4 1 4 7 23
Lower taxes 0 1 1 2 1 5
Proximity to clusters, suppliers and related firms
0 1 2 1 1 5
Availability of capital 0 1 0 1 4 6
More access to natural resources
0 1 1 0 0 2
Currency and exchange rate factors
0 1 2 2 1 6
PART 5: THE COMMUNITY
23. Does Indian policy on corporate social responsibility impact the
bottom line?
RESPONSES In Percent
Yes 38.1
No 38.1
Can’t say 23.8
Total 100.0
24. Which three key areas or communities does your company work with?
____________________________________________________________
ENDNOTES
1 Laveesh Bhandari, “Energizing the States, India’s 1991 Reforms,” in India Transformed: 25 Years of Economic Reforms, ed. Rakesh Mohan (Penguin Random House India, 2017), 255.
2 Montek Singh Ahluwalia, “India’s 1991 Reforms: A Retrospective Overview,” in India Transformed: 25 Years of Economic Reforms, ed. Rakesh Mohan , (Penguin Random House India, 2017), 56.
3 World Economic Outlook, International Monetary Fund (Washington DC: International Monetary Fund, 2019), 13, https://www.imf.org/en/Publications/WEO/Issues/2019/10/01/world-economic-outlook-october-2019.
4 “Interim Budget 2019-2020, Speech of Piyush Goyal Minister of Finance, 1 February 2019,” accessed 19 March 2019, https://www.indiabudget.gov.in/ub2019-20/bs/bs.pdf.
5 “Gross Domestic Product, 4th quarter and annual 2018 (third estimate); Corporate Profits, 4th quarter and annual 2018,” U.S. Bureau of Economic Analysis, accessed 10 April 2019, https://www.bea.gov/news/2019/gross-domestic-product-4th-quarter-and-annual-2018-third-estimate-corporate-profits-4th.
6 World Economic Outlook, International Monetary Fund (Washington DC: International Monetary Fund, 2019), 12, https://www.imf.org/en/Publications/WEO/Issues/2019/10/01/world-economic-outlook-october-2019.
7 “International Trade in Goods and Services,” Bureau of Economic Analysis, Department of Commerce, accessed 5 July 2019, https://www.bea.gov/data/intl-trade-investment/international-trade-goods-and-services.
8 World Bank Open Data, accessed 4 April 2019,https://data.worldbank.org/indicator/NE.CON.TOTL.ZS?locations=US.
9 Ibid., World Bank Open Data, accessed 4 April 2019, https://data.worldbank.org/indicator/NY.GDP.PCAP.CD?view=chart.
10 Ibid., World Bank Data, accessed 4 April 2019, https://data.worldbank.org/indicator/NY.GNP.PCAP.PP.CD?view=chart.
11 Prime Minister’s remark at the US Congress, 8 June 2016, Ministry of External Affairs, accessed 14 June 2019, https://www.mea.gov.in/Speeches-Statements.htm?dtl/26886/Prime_Ministers_remarks_at_the_US_Congress.
12 “Indo-Pacific Strategy Report: Preparedness, Partnerships and Promoting a Networked Region, 1 June 2019,” The Department of Defense, accessed 14 June 2019, https://media.defense.gov/2019/May/31/2002139210/-1/-1/1/DOD_INDO_PACIFIC_STRATEGY_REPORT_JUNE_2019.PDF.
13 Ibid.
14 Arun Jaitley, 19 March 2019, Twitter, accessed 19 March 2019, https://twitter.com/arunjaitley/status/1107979048624496642.
15 “Doing Business 2020,” World Bank Group, accessed 25 November 2019, https://openknowledge.worldbank.org/bitstream/handle/10986/32436 /9781464814402.pdf
16 Ibid.
17 “PWC’s 21st CEO Survey: The Anxious Optimist in the Corner Office,” PricewaterhouseCoopers, accessed on 14 February 2019, https://www.pwc.com/gx/en/ceo-survey/2018/pwc-ceo-survey-report-2018.pdf.
18 World Economic Outlook, International Monetary Fund (Washington DC: International Monetary Fund, 2019), 13, https://www.imf.org/en/Publications/WEO/Issues/2019/10/01/world-economic-outlook-october-2019.
19 Gautam Chikermane, 70 Policies that Shaped India (Observer Research Foundation, 2018), 151-152.
20 Ibid., 145-146
21 “Year End Review- 2018: Ministry of Labour & Employment,” Press Information Bureau, Government of India, 13 December 2018, accessed 25 June 2019, http://pib.nic.in/newsite/PrintRelease.aspx?relid=186346.
22 “Defence Procurement Procedure-2011,” Ministry of Defence, 23 July 2012, Chapter I, Appendix D, Section 2.2, accessed 29 March 2019, https://mod.gov.in/sites/default/files/revised-guidelines.pdf.
23 “Budget 2018: FM Arun Jaitley puts a premium on big expansion in rural infrastructure investment,” The Economic Times, 2 February 2018, https://economictimes.indiatimes.com/news/economy/infrastructure/budget-2018-fm-arun-jaitley-puts-a-premium-on-big-expansion-in-rural-infrastructure-investment/articleshow/62747667.cms.
24 “Budget 2019: 10 key dimensions of Center’s Vision 2030,” The Economic Times, 2 February 2019, https://economictimes.indiatimes.com/news/economy/policy/budget-2019-1o-key-dimensions-of-centers-vision-2030/articleshow/67802228.cms.
25 Budget 2019-2020, Speech of Nirmala Sitharaman, Minister of Finance, Government of India, 5 July 2019, accessed 23 August 2019, https://www.indiabudget.gov.in/budgetspeech.php.
26 “Department of Economic Affairs – Infrastructure,” Government of India, accessed on 27 February 2019, https://www.pppinindia.gov.in/infrastructureindia/web/guest/year-wise?p_p_id=yearwisesummaryreport_WAR_Projectportlet&p_p_lifecycle=0&p_p_state=normal&p_p_mode=view&p_p_col_id=column- 1&p_p_col_count=1&_yearwisesummaryreport_WAR_Projectportlet_jspPage=%2Fhtml%2Fyearwisesummaryreport%2Fview.jsp.
27 “What’s holding up India’s infrastructure?,” World Economic Forum, 6 November 2015, accessed on 27 February 2019, https://www.weforum.org/agenda/2015/11/india-infrastructure/.
28 Ram Singh, “Delays and Cost Overruns in Infrastructure Projects: Extent, Causes and Remedies,” Economic and Political Weekly, volume 45, no. 21, 22-28 (May 2010): 43-54, https://www.jstor.org/ stable/27807050.
29 “Asian Development Outlook 2018: How Technology Affects Jobs,” Asian Development Bank, April 2018, accessed 10 March 2019, https://www.adb.org/sites/default/files/publication/411666/ado2018.pdf.
30 Gautam Chikermane, Financing Green Transitions (Observer Research Foundation, 2019), Chapter 6, 66-79
31 “Declaration under Article 370(3) of the Constitution,” The Gazette of India, Ministry of Law and Justice, Government of India, 6 August 2019, accessed 18 November 2019, http://egazette.nic.in/WriteReadData/2019/210243.pdf
32 K.P. Krishnan and T.V. Somanathan, “The Civil Service,” in Rethinking Public Institutions in India, ed. D. Kapur, P.B. Mehta, and M. Vaishnav (Oxford University Press, 2017), 339-417.
33 Ibid., K.P. Krishnan.
34 “Corruption Perceptions Index 2018,” Transparency International, accessed 2 March 2019, https://www.transparency.org/cpi2018.
35 Ibid., Transparency International.
36 “The Indian Telecom Services Performance Indicators: October to December 2014,” Telecom Regulatory Authority of India, 8 May 2015, accessed 10 April 2019, https://main.trai.gov.in/sites/default/files/Indicator_Reports%20-%20Dec-14%3D08052015.pdf.
37 “The Indian Telecom Services Performance Indicators: October to December 2018,” Telecom Regulatory Authority of India, 4 April 2019, accessed 10 April 2019, https://main.trai.gov.in/sites/default/files/PIR_04042019_0.pdf.
38 Fixed telephone subscriptions, International Telecommunication Union, World Telecommunication/ICT Development Report and database, World Bank Open Data, World Bank, accessed 1 April 2019, https://data.worldbank.org/indicator/IT.MLT.MAIN?view=chart.
39 Ibid., accessed 1 April 2019, https://data.worldbank.org/indicator/IT.CEL.SETS?view=chart.
40 “Year End Review 2018: Ministry of Telecommunications,” Press Information Bureau, 9 January 2019, accessed 15 February 2019, http://pib.nic.in/newsite/PrintRelease.aspx?relid=187358.
41 Ibid.
42 “Worldwide Mobile Data Pricing League |Cost of 1GB in 230 countries,” 2018, accessed on 6 March 2019, https://www.cable.co.uk/mobiles/worldwide-data-pricing.
43 Ibid., accessed on 6 March 2019.
44 J.S. Sodhi, “Issues, Trends and Developments in Industrial Relations in India and Other South Asian Countries,” Indian Journal of Industrial Relations, vol. 30, no. 4 (1995): 359–385, accessed 7 March 2019, www.jstor.org/stable/27767378.
45 “National Policy for Skill Development and Entrepreneurship, 2015,” Ministry of Skill Development and Entrepreneurship, accessed on 10 March 2019, https://www.msde.gov.in/assets/images/Skill%20India/National%20Policy%20on%20Skill%20Development%20and%20Entreprenurship%20Final.pdf.
46 Make In India, accessed 1 March 2019, http://www.makeinindia.com/sectors.
47 Companies Act, 2013, Ministry of Corporate Affairs, Government of India, 29 August 2013, accessed 23 August 2019, http://www.mca.gov.in/Ministry/pdf/CompaniesAct2013.pdf.
48 “Incentives,” UNCTAD Series on Issues in International Investment Agreements, United Nations Conference on Trade and Development, December 2004, accessed 4 September 2019, https://unctad.org/en/Docs/iteiit20035_en.pdf.
49 “Maharashtra Industrial Policy 2019,” Government of Maharashtra, 9 March 2019, accessed 4 September 2019, https://maitri.mahaonline.gov.in/PDF/Maharashtra%20New%20Industrial%20Policy-2019.pdf.
50 “Gujarat Industrial Policy 2015 - Scheme for Incentive to Industries,”, Industries & Mines Department, Resolution No.INC-10201 5-645918-I, 25 July 2016, Government of Gujarat, accessed 4 September 2019, https://ic.gujarat.gov.in/documents/pagecontent/scheme-for-incentive-to-industries-2016-to-2021.pdf.

Observer Research Foundation (ORF)20, Rouse Avenue Institutional Area,
New Delhi - 110 002, INDIAPh. : +91-11-35332000 Fax : +91-11-35332005
E-mail: [email protected]: www.orfonline.org
American Chamber of Commerce in IndiaPHD House, 4th Floor, 4/2, Siri Institutional Area,
August Kranti Marg, New Delhi – 110 016Tel : +91-11-2652 5201/02 Fax: +91-11-2654 1222
Email: [email protected]: www.amchamindia.com