In rac ions aci ic una is enes
344
In rac ions o aci ic una is enes Volume 1 Summary report and papers on interaction Food and Agriculture Organization of the United Nations o r 11
Transcript of In rac ions aci ic una is enes
In rac ions oaci ic una
is enesVolume 1 Summary reportand papers on interaction
FoodandAgricultureOrganizationoftheUnitedNations
or
11
11
FAO LIBRARY AN: 346111-143

Interactionsacific tuna
fisheries
Volume i Summary reportand papers on interaction
Proceedings of the First FAO Expert Consultationon Interactions of Pacific Tuna Fisheries3-11 December 1 991Noumea, New Caledonia
Edited byRichard S. ShomuraHawaii Institute of Marine BiologyUniversity of Hawaii, ManoaHonolulu, Hawaii, USAJacek MajkowskiFAO Fisheries DepartmentSarah LangiNeiafu, Vava'uTonga
FoodandAgricultureOt ganizationofhe
UnitedNations
FA(FISHER]
TECHNA1...F'APER
Rome, 1994
The designations employed and the presentation of material in thispublication do not imply the expression of any opinion whatsoever onthe part of the Food and Agriculture Organization of the UnitedNations concerning the legal status of any country, territory, city orarea or of its authorities, or concerning the delimitation of its frontiersor boundaries.
M-43ISBN 92-5-103453-2
All rights reserved. No part of this publication may be reproduced, stored in aretrieval system, or transmitted in any form or by any means, electronic, mechani-cal, photocopying or otherwise, without the prior permission of the copyright owner.Applications for such permission, with a statement of the purpose and extent of thereproduction, should be addressed to the Director, Publications Division, Food andAgriculture Organization of the United Nations, Viale delle Terme di Caracalla,00100 Rome, Italy.
© FAO 1994

This publication results from the First FAO Expert Consultation on Interactionsof Pacific Tuna Fisheries hosted in Noumea, New Caledonia by the South PacificCommission in cooperation with the Institut Francais de Recherche Scientifiquepour le Développement en Coopération from 3 to 11 December 1991. TheConsultation was organized by the FAO Trust Fund project: "CooperativeResearch on Interactions of Pacific Tuna Fisheries" in close collaboration withregional and national institutions involved in tuna fisheries research in the Pacific(see Acknovvledgements).
The information presented at the Consultation was compiled by TUNET, anetwork of ten Working Groups organized by the FAO project. That informationwas contributed by scientists of the regional and national institutions studyingtuna stocks and fisheries mainly in the Pacific, but also outside of the region.
Distribution
PREPARATION OF THIS DOCUMENT
FAO Fisheries DepartmentFAO Regional Fisheries OfficersFAO fisheries projects and programmesInternational fisheries organizationsNational fisheries departmentsNational fisheries research laboratoriesMembers of TUNET (FAO's network of working groups
studying tuna fisheries interactions in the Pacific)
iv
Shomura, R.S.; Majkowski, J.;Langi, S. (eds.)Interactions of Pacific tuna fisheries. Proceedings of the first FAO ExpertConsultation on Interactions of Pacific Tuna Fisheries. 3-11 December 1991.Noumea, New Caledonia. Volume 1: summary report and papers oninteraction.FAO Fisheries Technical Paper. No. 336, Vol.1. Rome, FAO. 1993. 326p.
ABSTRACT
This publication presents papers and discussions of the First FAO ExpertConsultation on Interactions of Pacific Tuna Fisheries held in Noumea, NewCaledonia from 3 to 11 December 1991. The objectives of the Consultationincluded:
the identification and documentation of concern related to interactionsamong fisheries directed at tuna and tuna-like species in the Pacific,the classification of these interactions,the review of information on them and methods for their study, andthe formulation of recommendations for future research.
Volume 1 contains:the Summary Report of the Consultation,a review paper on methods for studying interactions in tuna fisheries,thirteen papers presenting new methods and case studies on suchinteractions, andseven reviews on fisheries interactions related to individual stocks ofPacific tuna and tuna-like species.
Volume 2 includes:eleven review papers on the biology, population dynamics and fisheriesassociated with the stocks of Pacific tuna, vvhich are supplemented byfour additional papers on specific fisheries.
The information contained herein demonstrates the potential for interactionsoccurring betvveen and among the fisheries directed at tunas and tuna-likespecies. Empirical evidence for such interactions, however, has beenavailable for only few fisheries, and these interactions have been quantifiedfor even fewer fisheries. It is unclear vvhether interactions are insignificantamong fisheries directed at tuna and tuna-like species or whether scientistsare unable to detect these interactions possibly due to various changes tofisheries and resources, resulting in a too-variable background which concealsthe effects of interactions.

ACKNOWLEDGEMENTS
The editors of this document would like to thank Convenors of TUNET'sWorking Groups, Session Chairmen, Rapporteurs and participants of theConsultation for their effort and collaboration in preparing the Summary Reportof the Consultation (see Volume 1 of this document). Thanks are also due toauthors and referees of the papers for their valuable contributions. Valuableassistance and advice were received from Dr William Bayliff, Ms Mary LynneGodfrey, and Mr Robert Harman in the editing and from Mr Harman in the finalformatting and lay-out of the document.
The Consultation and its Proceedings were made possible through the closecooperation of tuna scientists in the Pacific region. Funds for the organizationof the Consultation were provided by the Government of Japan and by FAO.Technical expertise, data, and computer facilities for the preparatory work andthe Consultation were contributed by many institutions, especially:
Commonwealth Scientific and Industrial Research Organization (Hobart,Australia),FAO/UNDP Regional Fisheries Support Programme (Suya, Fiji),Indo-Pacific Tuna Programme (Colombo, Sri Lanka),Inter-American Tropical Tuna Commission (La Jolla, USA),International Commission for the Conservation of Atlantic Tunas (Madrid,Spain),Institut Franoais de Recherche Scientifique pour le Développement enCooperation (Noumea, New Caledonia),Ministry of Agriculture and Fisheries (Wellington, New Zealand),National Marine Fisheries Service (La Jolla and Honolulu, USA),National Research Institute of Far Seas Fisheries (Shimizu, Japan),South Pacific Commission (Noumea, New Caledonia), andSouth Pacific Forum Fisheries Agency (Honiara, Solomon Islands).
National research laboratories of many countries of Latin America, SoutheastAsia, and the South Pacific also contributed significantly to the work before andduring the Consultation.Particular thanks are extended to local organizers from the institutions hostingthe Consultation, Dr Anthony Lewis of the South Pacific Commission inNoumea, New Caledonia and Mr Renaud Pianet of the Institut Francais deRecherche Scientifique pour le Développement en Coopération also in Noumea.
The editors would like to acknowledge the assistance and encouragement of thestaff of the Fishery Resources and Environment Division and the OperationsService of the FAO Fisheries Department (Rome, Italy), the FAO/UNDP RegionalFisheries Support Programme (Suya, Fiji), and the Indo-Pacific Tuna Programme(Colombo, Sri Lanka) and particularly to Dr John Caddy, Dr Serge Garcia, MrRobert Gillett, Mr Andhi lsarankura, Dr Yasuhisa Kato, Mrs Christiane Lagrange-Hall, Mr Toshifumi Sakurai, Mr Mitsuo Yesaki, and Mr Hugh Walton.


vi
INTERACTIONS OF PACIFIC TUNA FISHERIES
Proceedings of the First FAO Expert Consultation onInteractions of Pacific Tuna Fisheries
PREFACE
Tunas and tuna-like species are extremely valuable commercially, especiallyalbacore, bigeye, northern and southern bluefin, slcipjack, and yellowfin tuna.Collectively, these species are referred to as principal market tuna species, and are prizedfor canning, sashimi (raw fish dishes), and other products. The lesser known tunaspecies, however, should not be discounted because they provide considerable in-countrycommerce and are important sources of protein in some parts of the world. In recentyears, the Pacific Ocean has become the dominant ocean for tuna landings. Between1980 and 1991, the annual catch of tuna and tuna-like species in the Pacific increased by68% to about 3 million metric tons (mt). The 1991 Pacific total catch represented about68% of the world's catch of these species. While these very high catches in the Pacificare impressive, some recent studies suggest that there is potential for still highersustainable catches of some species.
The increases in the catches of Pacific tunas and tuna-like species have resultedfrom both intensification and expansion of existing fisheries, and the development of newfisheries. These changes have led to overlap of areas of operations of large and small-scale fisheries, as well as competition for the same tuna resources by large-scale fisheriesusing different gear. Detecting or predicting even this most direct type of interaction,however, is difficult and presents a serious research challenge. Presently, two or moretuna fisheries may be operating simultaneously on the same stock in overlappinggeographical areas, targeting fish of similar sizes. In such a situation, changes in thefishing intensity or pattern of one fishery may affect the catches of the other fisheries. Afurther factor in fisheries interaction among tunas is the ability of many tuna species toundertake rapid, long distance movements or migrations across or even between oceans.Under these circumstances, fisheries operating in different exclusive economic zones andon the high seas may significantly affect each other.
The knowledge of fisheries interactions is essential for rational management offisheries. The principal market tuna species and many tuna-like species are recognized bythe United Nations Convention for the Law of the Sea (UNCLOS) as highly migratory.Recently, considerable attention has been directed to the need for rational management offisheries for highly migratory species and resources that straddle adjacent exclusiveeconomic zones (EEZs). Such management would enhance economic and social benefitsto the countries involved in fishing, processing, and trade of these resources. Presently,small-scale tuna fisheries exist in many developing countries in the Pacific, and many ofthese fisheries operate in the same areas as the large industrial tuna fisheries (purse seine,pole and line, and longline).
viii
From 6 to 8 May 1992, the International Conference on Responsible Fishing washeld in Cancun, Mexico, leading to the Cancun Declaration. From 7 to 15 September1992, FAO organized the Technical Consultation on High Seas Fishing held in Rome,Italy, to consider technical issues related to such fishing. As a consequence of thesemeetings, FAO is involved in addressing the issue of flag of convenience. This issue isof major relevance to tuna fisheries and their management because many tuna vessels usesuch flags of convenience to avoid restrictive measures imposed by certain countries.Also, FAO actively participates in the development of a Code of Conduct of ResponsibleFishing, which will apply to both the high seas and economic exclusive zones.
In a broader context, fisheries issues were considered at the United NationsConference on Environment and Development (UNCED) held in Rio de Janeiro, Brazil,from 3 to 14 June 1993. The outcome of this Conference is relevant to fisheries directedat tuna and tuna-like species. The existing programme of action on environment anddevelopment (referred to as Agenda 21 or the Rio Declaration) and the two Conventionson Biodiversity and Climate Change are now open for ratification. These initiativesrepresent an important commitment at the highest national political level to resolve a widerange of problems associated with rational use of marine resources.
According to UNCLOS, fisheries management nee,ds to be based on the bestavailable scientific information. The recent attention directed to fisheries management ofhighly migratory and high seas resources has pointed the need for scientific informationon interactions of fisheries directed at tuna and tuna-like species. This need has alsobecome evident at recent regional and international meetings of fisheries scientists andadministrators.
In the Pacific, where most catch of tuna and tuna-like species is taken, there is anadditional urgent need to integrate available information and to coordinate fisheriesresearch. The Pacific is the only ocean where there is neither a single fisheries body nora technical programme directed to tuna and tuna-like species that encompass the entireocean. Some of the Pacific stocks of tuna and tuna-like species are only partly coveredby existing fisheries bodies and programmes in terms of their areas of distribution. Thissituation promoted FAO to initiate a project: "Cooperative Research on Interactions ofPacific Tuna Fisheries" and to create a network of ten working groups of scientists(TUNET) to provide direction and to facilitate the implementation of the project.
To provide an information base for the execution of the project, FAO organizedthe First FAO Expert Consultation on Interactions of Pacific Tuna Fisheries hosted inNoumea, New Caledonia, by the South Pacific Commission with collaboration of theInstitut Francais de Recherche Scientifique pour le Developpement en Cooperation(ORSTOM) from 3 to 11 December 1991. The Consultation was preceded by apreparatory meeting held in Noumea in late 1989. The success of the Consultation wasdue to the close collaboration and contribution of many other institutions; theseinstitutions and the host organizations are duly acknowledged in the Summary Reportpresented in Volume I.
The objectives of the First FAO Expert Consultation on Interactions of PacificTuna Fisheries included describing the concerns related to interactions of Pacific fisheriesdirected at tuna and tuna-like species, classifying these interactions, reviewing all

ix
available information on them and the methods applied to their study, and makingrecommendations for future research.
The information presented in the proceedings demonstrates that there is a potentialfor interactions occurring between and among the fisheries directed at tunas and tuna-likespecies. Empirical evidence for such interactions, however, has been available for onlyfew fisheries, and these interactions have been quantified for even fewer fisheries. It isunclear whether interactions are insignificant among fisheries directed at tuna and tuna-like species or whether scientists are unable to detect these interactions possibly due tovarious changes to fisheries and resources, resulting in a too-variable background whichconceals the effects of interactions.
These "Proceedings of the First FAO Expert Consultation on Interactions ofPacific Tuna Fisheries" are provided in two volumes:
Volume 1 contains the Summary Report of the Consultation. Volume 1 alsoincludes a review paper on methods for studying interactions in tuna fisheries,thirteen papers presenting new methods and case studies on such interactions, andseven reviews on fisheries interactions related to individual stocks of Pacific tunasand tuna-like species.
Volume 2 includes eleven review papers on the biology, population dynamics, andfisheries associated with the Pacific tuna resources. These reviews aresupplemented by four additional papers on specific fisheries.

xi
INTERACTIONS OF PACIFIC TUNA FISHERIES
Proceedings of the First FAO Expert Consultation onInteractions of Pacific Tuna Fisheries
VOLUME 1
CONTENTS
page
Summary Report
Types of tuna fishery interaction in the Pacific Ocean and methods of assessinginteraction, Pierre Kleiber 61
Methods for analyzing interactions of limited-range fisheries: Hawaii's pelagicfisheries, Christofer H. Boggs 74
Interactions among fisheries: tag-recapture methods for estimating the effect ofcatches of changing fishing intensity, William S. Hearn and AlexanderMazanov (Abstract only) 92
A tag-release/recovery method for predicting the effect of changing the catch ofone component of a fishery upon the remaining components, JacekMajkowski, William S. Hearn, and Ronald L. Sandland (Abstract only) 93
Assessment of skipjack fishery interaction in the eastern tropical Atlantic usingtagging data, Pierre Kleiber and Alain Fonteneau 94
Evaluation of advection-diffusion equations for estimation of movement patternsfrom tag recapture data, John R. Sibert and David A. Fournier 108
Discrete population field theory for tag analysis and fishery modeling, CarlosA.M. Salvad6 122
A Markov movement model of yellowfin tuna in the eastern Pacific Ocean andsome analyses for international management, Richard B. Deriso, RichardG. Punsly, and William H. Bayliff (Abstract only) 137
A review of tuna fishery-interaction issues in the western and central PacificOcean, John Hampton 138
xii
A review of interaction between purse seine and longline on yellowfin (Thunnusalbacares) in the western and central Pacific Ocean, Ziro Suzuki 158
Estimating the impact of purse-seine catches on longline, Paul A.H. Medley 182
Interaction in the yellowfin tuna fisheries of the eastern part of Indonesian waters,Nurzali Naamin and Sofri Bahar 199
Assessment of interaction between North Pacific albacore, Thunnus alalunga,fisheries by use of a simulation model, P. Kleiber and B. Baker (Abstractonly) 213
Evidence of interactions between high seas drift gillnet fisheries and the NorthAmerican troll fishery for albacore, Norman Bartoo, David Holts, andCheryl Brown 214
Albacore fisheries interactions in the South Pacific Ocean, Talbot Murray 228
A brief analysis of fishery interaction for bigeye tuna in the Pacific Ocean,Naozumi Miyabe 239
Interactions among fisheries for northern bluefin tuna, Thunnus thynnus, in thePacific Ocean, William H. Bayiff 249
An overview of interaction issues among the fisheries for southern bluefin tuna,Tom Polacheck 264
Interactions between fisheries for small tunas off the South China Sea coast ofThailand and Malaysia, Mitsuo Yesaki 300
Current state of the Mexican tuna fishery and ecological interactions between largeand small tunas in the pelagic Pacific environment, Arturo Muhlia-Melo . . . 320
FIRST FAO EXPERT CONSULTATION ONINTERACTIONS OF PACIFIC TUNA FISHERIES
Noumea, New Caledonia3-11 December 1991
SUMMARY REPORT
INTRODUCTION
Since the early 1970s, there has been a marked expansion in tuna fishingthroughout the world's oceans. This has been especially true in the central and westernPacific Ocean where purse seining became the dominant method of tuna fishing. Inaddition to the increase in catch, the number of countries actively engaged, directly orindirectly, in tuna fishing increased dramatically in the Pacific. The increase in tunafishing activities has increased the potential for fishery interactions.
The problem of tuna interactions prompted the Food and Agriculture Organization(FAO) to organize a preliminary meeting of the "Expert Consultation on Interactions ofPacific Ocean Tuna Fisheries". The meeting was held in Noumea, New Caledonia, from30 October to 3 November 1989. The status of the major tuna resources and fisheries inthe Pacific was reviewed and it became apparent that fishery interaction was a majorproblem that needed to be addressed. Several small-scale tuna fisheries operated in thesame region as large-scale, distant water tuna fleets, and in some regions, large-scale tunafishing using different gears operated in the same areas.
On the basis of the preliminary meeting, FAO organized a follow-up meetingwhich was held in Noumea, New Caledonia, from 3-11 December 1991. This reportrepresents the results of this meeting.
OBJECTIVES
The general objective of the Consultation was to enhance the capacity of countriesinvolved in tuna fishing in the Pacific, especially developing countries, to address in ascientific manner the problems of interactions of tuna fisheries in the region, and tooptimize the benefits from these fisheries.
The specific objectives noted for the Consultation were:
Identify the major types of interactions among tuna fisheries.
Identify the scientific problems related to these interactions that are relevantto tuna fisheries management in the Pacific.
Review methods and experiences used to address interaction problems,especially the applicability and effectiveness of these methods.
2
Review existing information on tuna fisheries interaction and determinedeficiencies in the available information and scientific understanding ofinteractions.
Make recommendations for:
improvements to the existing methods and for development of newmethods,other future research (e.g., collection and processing of data andbiological samples, and application of methods), andfuture activities of the FAO-executed Japan Trust Fund Projectentitled "Cooperative Research on Interactions of Pacific TunaFisheries".
3. ACKNIOWLEDGEMENTS
The FAO organized the Consultation and formulated the Provisional Programme.In preparation for the Consultation, FAO organized an informational network (TUNET)of tuna scientists and ten working groups, the latter to carry out preparatory work for theConsultation. Major funding support for the Consultation and for specific preparatorywork was provided by Japan under an FAO Trust Fund project entitled "CooperativeResearch on Interactions of Pacific Tuna Fisheries". FAO provided some additionalfunds to support participation of some scientists at the Consultation. The South PacificCommission (SPC) with cooperation from the Office de la Recherche Scientifique etTechnique Outre-Mer (ORSTOM) hosted the Consultation and provided secretarial andtechnical support. Several major institutions contributed technical expertise, data andcomputer facilities for the preparatory work for the Consultation. These institutionsincluded:
CSIRO Commonwealth Scientific and Industrial ResearchOrganization (Australia)
FAO/UNDP RFSP FAO/UNDP Regional Fisheries Support ProgrammeFFA Forum Fisheries AgencyIATTC Inter-American Tropical Tuna CommissionICCAT International Commission for the Conservation of Atlantic
TunasIPTP Indo-Pacific Tuna Development and Management ProgrammeMAF Ministry of Agriculture and Fisheries (New Zealand)NMFS National Marine Fisheries Service (USA)NRIFSF National Research Institute of Far Seas Fisheries (Japan)ORSTOM Office de la Recherche Scientifique et Technique Outre-Mer
(France)SPC South Pacific Commission
Many tuna experts participated in the Consultation with the full support of theirorganisations; these experts provided the technical expertise necessary for the success ofthe Consultation. National research laboratories of many countries of Latin America,Southeast Asia, and the South Pacific contributed significantly to the preparatory work ofthe Consultation; many scientists of these countries also participated actively in the
3
Consultation. Finally, FAO/UNDP RFSP was responsible for all administrative andfinancial matters relating to the Consultation, and provided local coordination and logisticarrangements for the Consultation.
4. OFFICIAL OPENING
The Consultation was officially opened on 3 December 1991 in the auditorium ofthe ORSTOM by the Chair, Mr. Richard Shomura, who welcomed participants andhonoured guests. Mr. Shomura introduced Dr. Jacek Majkowski of FAO, who thankedORSTOM and the South Pacific Commission (SPC) for their generosity in co-hosting themeeting. Dr. Majkowski provided the background information on the Consultation andthe history of efforts leading to this current meeting. He noted that a preliminarymeeting, kindly hosted by SPC, in 1989 established the framework for the presentConsultation. Then he acknowledged the contributions of various institutions inorganizing the Consultation (see section 3.). In particular, Dr. Majkowski expressedthanks to the government of Japan for financing an FAO Trust Fund project sponsoringthe Consultation. Also, he outlined the objectives of the Consultation and emphasizedtheir relevance to developing coastal countries of the Pacific.
The Chair then introduced Mr. Jean Fages of ORSTOM. Mr. Fages welcomedparticipants and stressed the importance of the topic of tuna fisheries interactions to thePacific, and the importance of the success of the Consultation to the Pacific islands.
Mr. Shomura then introduced Dr. Antony Lewis, who welcomed the participantson behalf of SPC. Dr. Lewis noted that the production of tunas from the South Pacifichas increased markedly in recent years and that the tuna resources have become veryimportant to the economy of the Pacific island communities.
The Chair then introduced Mr. Jacques Iekawe of the government of NewCaledonia. Mr. Iekawe stressed the increasing importance of the ocean and adjacentEEZs to the people of the Pacific. He mentioned that the open-ocean resources, such astuna, are becoming increasingly important economically to island nations. He alsodescribed how New Caledonia is now looking beyond the traditional reef and lagoonfisheries as the economic expectations of young people increase. Mr. Iekawe pointed outthe importance of research programme such as the SPC fisheries programme andconsultations such as this one to help develop the regional fisheries of the Pacific. Herecommended the continued financial support of such programme.
At an earlier preliminary meeting, organizational details were discussed. Theprovisional agenda was presented and accepted (Appendix A). The Chair, Mr. Shomura,introduced the Vice-Chair of the Consultation, Dr. Ziro Suzuki, and the Convenor, Dr.Majkowski from FAO, Rome. Dr. Majkowski welcomed all participants on behalf ofFAO and reviewed the objectives for the Consultation. He noted that FAO desires asignificant output from this meeting, and suggested that during the meeting several groupsof participants may wish to formulate proposals for projects to address tuna fisheriesinteractions in the Pacific. He also discussed report formats for each session, noting thatthey should be "output-oriented". The Chair reported that Dr. George Boehlert wouldserve as rapporteur for the plenary sessions.
4
A list of participants, list of organizers of the Consultation, and a list ofdocuments for the Consultation are given in Appendices B, C, and D, respectively.
5. METHODS FOR STUDYING TUNA FISHERIES INTERACTIONS
The technical sessions of the Consultation was opened with a session onmethodology. The session was chaired by Dr. Pierre Kleiber; vice-chair was Dr. JohnSibert and rapporteur Dr. Chris Boggs.
5.1 Types of Tuna Fisheries Interactions
Fishery interactions can be classified by their mechanisms (Kleiber, thisdocument). This classification can be useful in conceptualizing fishery interactions and indetermining appropriate methods to quantify them. The following mechanisms ofinteraction were suggested:
Direct resource-me,diated interaction, such as when the catch of one fisherydirectly influences the fish resource available to another fishery.
Non-resource-mediated interaction, such as when fishing gear of onefishery physically interferes with gear from another fishery, or whenproduction by one fishery depresses the profitability of another.
Resource-mediated interaction may also be indirect, such as when the catch of aprey species affects the abundance or availability of a pre,dator species which is a target ofanother fishery. Such interactions have been little studied in relation to tunas. Theresearch discussed at this Consultation focused on direct, resource-mediated interaction.Other research has been conducted on modifications of fisheries operations and oneconomic aspects, in order to identify and resolve conflicts of gear and of economicinterests. These are two types of non-resource-mediated interaction.
Mechanisms of direct interaction between resources may be complex, and dependon the biological characteristics (growth, movement, depth distribution, etc.) of theexploited fish. These mechanisms may further be complicated by age structure, forexample catches of young fish by one fishery may affect the catches of older fish inanother fishery. In many situations where fisheries do not overlap geographically, or doso partially, the intensity of interaction depends on movement of the fish from one fisheryto another. Where fisheries overlap, interaction may be most intense when there is littlenet movement of the fish.
Components of population turnover, mortality, recruitment, immigration, andemigration, all affect the rate at which fish become available to fisheries exploiting thepopulation. For fisheries covering a wide area, immigration and emigration tend to berelatively less important components of turnover than in limited-range fisheries. A "ruleof thumb" is that when fishing mortality is low relative to turnover (low exploitationrate), the magnitude of interaction between competing fisheries tends to be small. Theactual degree of interaction depends on characteristics of the two fisheries, including theirrelative levels of exploitation, and the relative geographical scales and geographical

5
arrangement (distance apart, degree of overlap, and conformation) of their areas ofoperation.
5.2 Methods of assessing interactions
Approaches to assessing fishery interactions can be classified into the followingtypes:
An empirical approach of regulating the activity of one fishery to observethe effect on the performance of another.
Tagging experiments to describe the effect one fishery has on otherfisheries.
Analyses of tagging data to estimate the movement parameters that governthe potential for fishery interaction.
Statistical analyses of fishery data to look for relationships between theactivity of one fishery and the performance of another.
Simulation models using a broad range of information about populationdynamics to observe the effects of one fishery on another under variousconditions.
Catch was explored as a measure of fishery activity (instead of effort) in anattempt to find a negative correlation between activity and the performance of certainlimited-range fisheries in Hawaii (Boggs, this document). The method showed someutility in theory, but in practice, fishery performance as measured by catch per unit ofeffort (CPUE) was dominated by exogenous influences. In attempting to measure fisheryinteraction in a limited-range fishery, it may be feasible to account for exogenousinfluences on performance through indexing local performance in relation to performancein more wide-ranging fisheries.
Two papers (Hearn and Mazanov, this document; Majkowski, Hearn andSandland, this document) presented methods of tagging a representative portion of thecatch of one fishery. In this method, the number or weight of recaptured fish in thesecond fishery represents the magnitude of interaction. The advantage of this method isthat it requires no fishery statistics or complex modelling, and the logic for the estimationof interaction is so clear that it can be understood by the fishermen whose cooperation isneeded to achieve the results. The ideal case requires tagged fish recaptured by the firstfishery to be re-released, or replacement fish tagged. Alternatively, some mathematicaladjustments need to be introduced to account for the recapture of tagged fish retained bythe first fishery.
Information on tuna movements has not been widely used in population-dynamicsmodels and stock-assessment techniques. The importance of considering fish movementsin assessing interaction was a theme of the working group on methods, which consideredseveral methods of integrating the estimation of movement parameters with the estimationof population dynamics parameters (integrated models) to provide improved methods of
6
extracting such information from a combination of tagging data and catch and effortstatistics. These new methods provide powerful new tools for the quantification offishery interaction.
Dr. Pierre Kleiber presented a case study of interaction among skipjack fisheriesalong the coast of west Africa (Kleiber and Fonteneau, this document). A populationdynamics and movement model was used in one (north-south) dimension. Movementincluded components of diffusion and seasonally-varying advection. They first fit themodel to tagging data, and then modified it to deal with untagged fish. The model wasthen used to predict catch under a variety of effort regimes to investigate the effect ofchanging effort in one fishery on the catch of other fisheries.
Dr. John Sibert presented a method for fitting tag returns predicted from atwo-dimensional advection-diffusion model to observed tag returns (Sibert and Fournier,this document). The estimation procedure uses an alternating direction-implicit method tosolve a partial differential equation. The method appears to give good estimates of aregionally- and seasonally-varying movement pattern. It is sensitive to differences inmovement patterns, so that the significance of these differences can be statistically tested.
Mr. Carlos Salvad6 presented a method by which tagged-fish data are used todetermine the transition probability densities of the fish through space and time,independent of the particular effort regime extant during the tagging experiment (Salvad6,this document). The resulting probability density function can be used to constructexpressions of population processes such as catch rate density for any assumed effortregime, which allows the estimation of fishery interaction. The moments of theprobability density function can be used to estimate parameters that are varying in spaceand time, such as diffusivity, advective velocity, and mortality.
Dr. Richard Deriso discussed recent research on quantifying movement ofyellowfin tuna in the eastern Pacific Ocean (EPO). One presentation was a summary ofthe paper "A Markov movement model of yellowfin tuna in the eastern Pacific Ocean andsome analyses for international management" (Deriso, Punsly and Bayliff, 1991, inFisheries Research 11: 375-395). That paper describes a maximum-likelihood approachapplied to tagging data, and then shows some mean residence-time calculations relevant toeffects of changes in the minimum retention size of yellowfin by the fishery. The secondpresentation was a summary of research at the Inter-American Tropical Tuna Commission(INITC) on the development of a general simulation model of the purse-seine fishery fortunas of the EPO. Sub-models are included for yellowfin tuna, skipjack tuna, dolphinmortality, and fleet dynamics. A novel feature of this research effort is the use ofage-specific yellowfin abundance estimates stratified by time and area to estimatemovement rates.
5.3 Problems in Quantifying Tuna Fishery Interactions
In analyzing fishery statistics to look for relationships between one fishery'sperformance and the activity of another fishery, the choice of method and indices forfishery activity and performance will alter the results obtained. Modern computersoftware has made correlation analysis easy, but interpreting the results is still difficult.Ultimately, rnost correlations are subject to several interpretations because more than one
7
factor, or unknown factors, may be hypothesized to account for the observed relationship.
Confusion and misinterpretation are common in attempts to identify or quantifyinteraction through correlation analyses. Positive correlation between the performance oftwo sectors has been interpreted as indicating a potential for interaction and negativecorrelation as indicating the existence of interaction, but neither may be correct. Apositive correlation indicates only the similar availability of the fish exploited by the twosectors, suggesting (but not proving) that they are exploiting the same resource. Anegative correlation indicates high availability in one fishery when availability is low inanother, which could result from fish distribution changes. However, convincingevidence of interaction can come from negative correlations between an index of relativeabundance in a fishery, and the activities of other fisheries or all fisheries combined.
Another problem with correlation analyses is that environmental influences on fishavailability and abundance are often great enough to obscure correlations between fisheryperformance and activity, or to give the impression of fishery interaction where noneexists. Undocumented changes in fishing gear efficiency can have the same effect.Acknowledging or accounting for such effects is important when considering evidence offishery interaction derived from correlation analyses.
Some drawbacks of tagging experiments are:
They are expensive.
It is difficult to tag the larger-sized tunas important in many fisheries (largetuna may behave differently than small tuna).
There are persistent questions regarding the interpretation of low recoveryrates (which may be due to tagging mortality, tag shedding, non-reporting,or a low rate of exploitation).
Estimates of movement and population dynamics parameters from taggingstudies are specific to the conditions existing at the time of the study. Suchestimates may be useful for simple linear extrapolation, but to investigateconditions that are different from those existing at the time of the studyrequires the development of models that capture the effects of the differentconditions.
Even with integrated procedures for estimating movement and population dynamicsparameters from tagging data and complete fisheries statistics, questions remain regardingthe statistical properties of the estimates. Furthermore, the ability of simulation models touse these parameters to predict real-world situations will to a great extent depend on thedevelopment of models to explain fish movement, behaviour, and population-dynamicsvariations due to ecological changes. To the extent that fish behaviour and populationdynamics during the tagging studies are typical, the current generation of simulationmodels should be useful for estimating fisheries interactions under current conditions.However, the usefulness of these models in simulating fisheries under widely differentfuture conditions needs to be explored.
5.4 Recommendations
The working group did not prioritize the following recommendations:
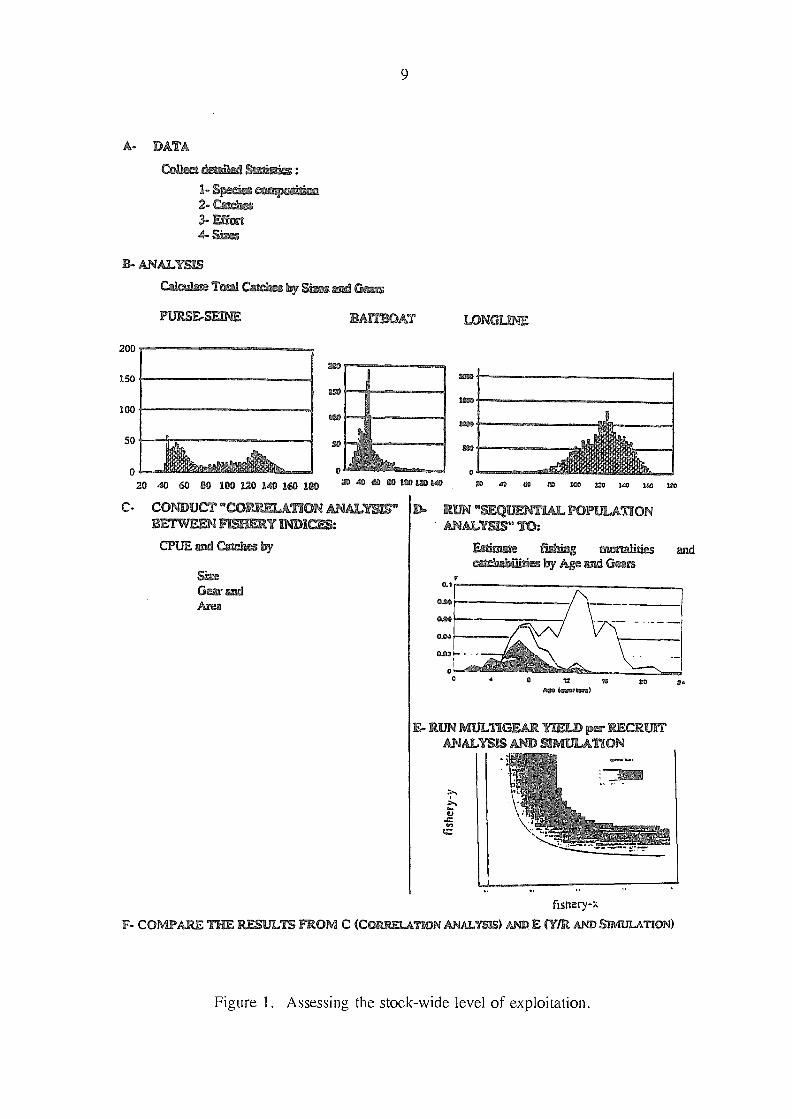
Complete and accurate statistics on species composition, size composition,catch and effort, by area, time, and gear should be collected for use inassessing the level of exploitation. [The exploitation rate is an indicator ofpotential for fishery interaction, and its determination is an importantpreliminary to more definitive assessment of fishery interaction (Figure 1).]
Methods of stock assessment should be improved to include considerationsof spatial structure and dynamics of the resource and the fishing fleets.[Although measurements of tuna movements exist, there has been littleprogress in using such data in stock assessment.]
Further development, testing, and improvement of integrated approaches tomodelling fisheries using tagging data, fisheries statistics, and biologicaland economic data should be carried out. [These models have wideapplicability in modelling other fisheries scenarios and in extrapolatingbeyond the conditions under which the model parameters were estimated.]
Three key elements in addressing interaction problems (and other stockassessment questions) are data gathering, data analysis, and modelling. Itis recommended that these activities be conducted simultaneously, becausethey all inform each other. [Data are necessary for analyses to estimateparameters to put into simulation models, but simulation models should beused in designing experiments and sampling regimes for gathering data.]
Tagging experiments should be conducted because they are a powerfulsource of information on interactions unavailable from normal fisherystatistics. In designing and conducting tagging experiments, considerationshould be given to using existing experienced personnel and equipment.[Tagging studies are needed to estimate exploitation rates, residence times,possible vertical segregation of exploited stocks, movement patterns, andthe environmental variables that produce variation in movements.]
The statistical properties of movement and population-dynamics esti matesfrom different methods of tagging-data analysis should be further explored,but great care should be taken in making extrapolations from suchesti mates.
The different approaches to the analysis and synthesis of tagging datashould be compared by analysing the same simulated data and the ability toextrapolate from such estimates should also be tested through simulation.
Generally-applicable software for generating simulated, tag-return andfishery data should be written for the development and evaluation ofvarious simulation models.
8
A. DATA
B- AN
200
150
100
o
422 221 vov.Slassz)C.37..'&9 3
Mart
PURSITE/..-3DaE
- 1 ` -has by Sizes OKI C%
lriEFOE.Y !NM
CPLTE C
V
9
LONG
ON ANAL11'
1=0 AI200.019B
o
ran
0.1
&OS
0.04
OA,
00
E- RUN 11ANAIT.T3IS AND Si
" 4"k;
TS FROM C (CartimA730N ANAL
eta CO co 00 i 141 ic° ¡co
va
Nuersers)
Figure 1. Assessing the stock-wide level of exploitation.
20
RECRON
fishery-x
E (Y/R AND SIMULATION)
,r
20 40 60 CO HO 120 340 160 1C0 ZD 40 CD Ca ix9
raIN nSEQUENFLALANAL. S" TO:
TIONAC. CONDUCT "COET_EXA/1 :
F- CO '

10
Work should continue on methods that can quantify fishery interactions,even when the interactions are small. [Such estimates may provide thebasis for extrapolating or forecasting the magnitude of fishery interactionunder different exploitation regimes, if due regard is given to potentialstochastic and non-linear effects.]
The confounding effects of tag shedding, tag-induce,d mortality, andnon-reporting of tags should be the subject of active research, and thesefactors should be included in all analyses of tagged-fish dynamics.
k) Several alternative methods should be applied to any analysis of interactionto test the robustness of the conclusions. [There is great potential forconfounding factors and noise to obscure important interactions. Integratedmodels, as well as separate analyses of tagging data and fishery statistics,may help in detecting the interaction.]
1) Social and bio-economic issues have not been the focus of the Consultation,although their importance has been recognized. A particularrecommendation is that decision theory be applied by managers to makechoices among alternatives where some cost estimate can be assigned to theconsequences of taking different actions.
Every opportunity should be used to take advantage of experiments ofeither purposeful design (adaptive management) or fortuitous events tomeasure response of fisheries to changes in exploitation.
Studies of the movement patterns and population dynamics of tunas inresponse to environmental and genetic variables should be conducted, andsuch factors should be incorporated into the models used to quantify fisheryinteraction.
Priority should be given to research on new technologies to measure andmodel tuna movement and population dynamics, such as the developmentof archival tags, new tracking methods, hydro-acoustics, synthetic- apertureradar, LIDAR (laser - light directing and ranging) scanning, and othermethods.
1)) Meetings other than the present full Consultation should be promoted and,where necessary, funded, to enable small groups of scientists to assembleand process data from disparate sources, to develop new analyticaltechniques (or adapt existing ones), to implement computer programmes,and to conduct analyses. [Attempting to undertake such work shortlybefore or simultaneously with a larger meeting has proved to be frustratingand inefficient.]
Because of the similarity of the problems to be solved in assessing tunafishery interactions in all oceans, expertise on the subject should be soughtworldwide.

6. PACIFIC SKIPJACK TUNA
The chair for the session on Pacific skipjack tuna 'was Dr. Richard Deriso; Dr.John Hampton served as co-chair, and Dr. Talbot Murray as rapporteur.
6.1 Fishery Components
It is currently believed that skipjack tuna in the Pacific Ocean belong to a singlepopulation. Larvae occur in tropical and subtropical waters of the western Pacific Ocean(WPO), central Pacific Ocean (CPO) and, to a much lesser extent, the eastern PacificOcean (EPO). Changes in allele frequencies suggest either different subpopulations in theWPO and EPO or a cine across the Pacific, but the data are insufficient to distinguishbetween the two cases.
Fisheries for skipjack are widely distributed, with EPO catches occurring innearshore waters and well offshore in the region of 100 N. The EPO catches are takenprimarily by purse seine, with about 36,280 mt to 163,260 mt caught per year. It isthought that the EPO fishery is sustained largely by recruitment from the CPO andtemporary residence in the EPO. In the WPO, fisheries are more diverse, and includeindustrial, artisanal, and subsistence fisheries, using purse seine (group and single seine),pole-and-line, troll, and other gear. The WPO fisheries are found mostly in equatorialwaters west of 1800; the skipjack catch has increased steadily and is currently about800,000 mt per year. In addition, a seasonal fishery by Japanese pole-and- line vesselsoccurs in northern subtropical waters of the WPO, generating annual catches of up to150,000 mt.
6.2 Scope of Fishery Interactions
In the EPO, the extent of fisheries interactions is considered small.Yield-per-recruit (Y/R) analyses for the EPO indicate that increasing effort and catchingskipjack as soon as they are available maximises the Y/R. The short residence time ofskipjack in the EPO suggests that interactions are likely to be low. Some concern existsthat recruitment to the EPO is from fish in the CPO which, in turn, may receive recruitsfrom the WPO. This recruitment pattern raises questions as to whether recent increasingyields in the WPO could reduce recruitment to the CPO and subsequently to the EPO.
The diverse range of industrial, artisanal, and subsistence skipjack fisheriesoperating in the same or adjacent areas of the WPO and the large harvests suggests thatthe scope for fisheries interactions is high in this area. Potential interactions may exist inthe WPO between (a) industrial purse-seine and pole-and-line fisheries, (b) distant waterfishing nations (DWFNs) and locally-based industrial fisheries, (c) industrial and thediverse artisanal and subsistence fisheries, and (d) fisheries operating in adjacentExclusive Economic Zones (EEZs).
Industrial pole-and-line and purse-seine fisheries have operated in overlappingWPO areas since the early 1980s. Although not adjusted for changes in fishing power,the variable pole-and-line catch per unit effort (CPUE) has had an upward trendthroughout the 1980s. Several DWFN purse-seine and pole-and-line fleets operatebroadly throughout the WPO, and overlap with locally-based Pacific island and
11

12
Associated Southeast Asian Nations' (ASEAN) fisheries. Locally-based fisheries aremostly small pole-and-line fisheries, with potential for direct competition for fish schools.In the WPO, a diverse range of mostly small artisanal and subsistence fisheries operate,in some cases, in proximity to industrial fisheries, suggesting a potential for interactions.To date, the low tag-recovery rate from artisanal and subsistence fisheries suggests thatinteractions due to large-scale DWFN activity are probably small, and these interactionswould likely be overwhelmed by other factors influencing local skipjack abundance. Theexception to this would be in cases of direct competition for schools between artisanal andindustrial fishing vessels. The potential for interactions betwe,en the municipal Philippinesskipjack fishery and industrial fisheries may be greater, given the larger contribution ofmunicipal fisheries to total catches, relative to the artisanal fisheries in Pacific islandstates. Analysis of data from early tagging experiments indicate that in some areas asubstantial percentage of tagged fish released in the EEZ of one country can be recoveredin the EEZ of an adjacent country. While movement between most countries appears tobe small, the potential for interaction among fisheries in some EEZs exists.
6.3 Importance for Fisheries Management
Previous management regimes have operated on a stock-wide basis in the EPOwith the goal of operating at maximum sustainable yield (MS Y), without individualfishery- allocation considerations. Given the short residence time of skipjack in the EPOand Y/R considerations, allocation among fisheries sectors has not been a problem.
In the WPO the diversity of artisanal, subsistence, local industrial, and DWFNindustrial fisheries has led to the perception among several sectors that catches by onegroup affect those of another. Estimating the extent of interaction between differentfishery components is therefore of greater importance in the WPO because of possibleresource-allocation implications. The generally limited operating range and fishing powerof artisanal and subsistence fisheries makes even occasional interaction with industrialfisheries a concern for management.
6.4 Methods Applied for Studying Interactions
Skipjack CPUE trends in industrial fisheries operating primarily within EEZ areashave generally not provided evidence of significant interactions between purse-seine andpole-and-line fisheries. The CPUE data are not available for most artisanal andsubsistence fisheries nor for most industrial fishing by DWFNs outside of EEZs. Anotherdifficulty with the use of CPUE data is that only nominal catch and effort data areavailable, so CPUE cannot be standardised for changes in fishing power and other factorsaffecting performance.
The extensive tagged-fish release and recapture data from the South PacificCommission's (SPC) Skipjack Survey and Assessment Programme (SSAP) in the early1980s are appropriate for the investigation of some interaction issues. The SSAP datahave already been used to identify the potential for interactions among some adjacent EEZfisheries. The SPC's Regional Tuna Tagging Project (RTTP), which is currentlyunderway, and its national components (e.g,., Solomon Islands' In-Country TaggingStudy) have specifically focussed on questions of interaction between fisheries. TheRTTP will provide data to allow estimation of the interaction between purse-seine and
13
pole-and-line fisheries in the WPO. Development and testing of models incorporatingmovement based on tag recoveries and related analytical approaches are continuing, and itis hoped that such models can be applied to interaction qUestions in WPO skipjackfisheries.
6.5 Information on Interactions
During the late 1950s and early 1960s, baitboats and purse seiners frequentlycompeted for tuna resources in nearshore waters in the EPO. However, purse seinersnow make up over 97% of the current fleet capacity and gear competition, for sldpjack inparticular, is virtually nonexistent in the EPO. Similarly, purse seiners now account formost of the catching capacity in the WPO; in 1990 purse seiners caught 66 percent of theestimated total skipjack catch of 785,000 mt. However, the possibility of interactionbetween purse-seine and baitboat fisheries is of concern in countries like the SolomonIslands and Fiji, where domestic fisheries have existe,d for some time. In the case of theSolomon Islands, purse-seine fishing has increased in recent years, and the SPC has beencollaborating with the Solomon Islands government in a tagging experiment designed toestimate the magnitude of the interaction between purse seiners and baitboats.
Although gear interactions are largely minor, interactions among geographicalareas (particularly EEZs) are of concern in some areas. In the WPO, the main area ofoperation of the purse-seine and baitboat fisheries is composed primarily of thelargely-contiguous EEZs of Philippines, Indonesia, Palau, Federated States of Micronesia,Papua New Guinea, the Solomon Islands, Nauru, Kiribati, and the Marshall Islands. Thedegre,e of interaction among areas such as these will be determined by controlling factorssuch as the size of the areas, the distances between them, skipjack movement rates, thenatural mortality rate, and the intensity of the fisheries. There has been some controversyregarding movement rates of skipjack and their possible effects on spatially-separatedfisheries. However, some specific analyses have been carried out. Using SSAP taggingdata, Sibert (pers. commun.) calculated a series of interaction coefficients based on theproportions of total throughput in receiver EEZs derived from immigration from donorEEZs. Most of the coefficients are low, indicating that with movement patternsprevailing when the SSAP data were gathered, there was generally little potential forfishery interaction. Not surprisingly, most cases of significant exchange occurredbetween adjacent EEZs. In particular, the results suggested that 37% of throughput in theMarshall Islands EEZ at the time of tagging resulted from immigration from FederatedStates of Micronesia. Relatively high interaction coefficients were also observed forNorthern Mariana Islands-Federated States of Micronesia and to a lesser extentPalau-Federated States of Micronesia, and Papua New Guinea-Solomon Islands, indicatingsome potential for fishery interaction between those countries. The only case of arelatively high interaction coefficient for widely-separated areas was New Zealand-Fiji.
This relatively simple representation of interaction does not explicitly specify thecontrolling factors noted above. A more rigorous method to estimate interaction betweentwo countries was derived at SPC and applied to Papua New Guinea and the SolomonIslands, both of which had substantial baitboat fisheries for skipjack at the time of the
tagging project. Estimations were made of exchange rates between the two EEZs, lossesfrom natural mortality and movement to other areas, the proportions that remainedresident and lived, and the proportions that were caught locally on a monthly basis. The
14
Solomon Islands stock was found to be relatively stable, with a low rate of naturalmortality and emigration (resulting in high survival) and low rate of movement to PapuaNew Guinea. The Papua New Guinea stock was found to be more dynamic, with ahigher rate of natural mortality and emigration (lower survival), but with a low rate ofmovement to the Solomon Islands. It was estimated from these results that an increase inthe catch of 1,000 mt in either EEZ would result in a decrease of only 1-3 mt in thesteady-state catch of the other.
Incomplete availability of catch and effort data has hindered a more thoroughanalysis of skipjack movement and its interpretation with respect to interaction in theWPO.
6.6 Recommendations
Further work is required that is relevant to both EPO and WPO skipjack tunafisheries in the following areas:
Further development, testing, and implementation of tag-recovery modelsand, more generally, population-dynamics models which incorporatemovements.
Fishery data compilation in the WPO, particularly with regard to industrialfisheries catch and effort data from high-seas areas.
Development of abundance indices. [Adequate data are needed tostandardize CPUE trends for changes in fishing power and other factors inpole-and-line and purse-seine fisheries to improve interpretations of changesin CPUE and increase the use of these data.]
Information on patterns of recruitment and origins. [Information on thesource of fish being exploite,d by a fishery would assist in the interpretationof interactions.]
The first two items are considered to be of the highest priority by those working inthe WPO, whereas the latter two items are of higher priority to those working in theEPO.
6.7 Institutional Arranements and Future Research
Research in the EPO is conducte,c1 primarily by the Inter-American Tropical TunaCommission (IATTC) and scientists of Mexico and other countries. In the WPO tunaresearch is carried out by the SPC and the National Research Institute of Far SeasFisheries (NRIFSF) of Japan. The WPO skipjack tuna research is to some extentcoordinated with research underway in ASEAN countries through the Western PacificFisheries Consultative Committee (WPFCC).
15
7. EASTERN PACIFIC YELLOWFIN TUNA
The chair for the session on eastern Pacific yellowfin tuna was Dr. RichardDeriso; the vice-chair was Dr. Alex Wild, and the rapporteur Dr. Norman Bartoo.
7.1 Fishery Components
Yellowfin tuna in the eastern Pacific Ocean (EPO) are considered to be a singlestock. In the EPO, the stock is currently producing near its estimatetl maximumsustainable production of 297,500 mt. The fish do not exhibit pronounced tendencies forpredictable movements in east-west or north-south directions, although the movements donot appear to be random. The overall implication of tagging information is that yellowfindo not usually undertake migrations in excess of several hundred miles, although thetagging experiments do not cover the entire size range or geographical range of thepopulation.
Yellowfin tuna in the EPO are fished primarily by purse seines, although a limitednumber of baitboats is in operation, and a small longline catch occurs. Total catches ofyellowfin in the EPO since 1985 have been between 226,000 mt and 302,000 mtannually. Longline catches during the same period are small, limited to a few thousandtons. Baitboat catches are small and coastal in distribution.
Purse seiners fish on schools of yellowfin associated with dolphins or with floatingobjects and on free-swimming schools, talcing fish about 40 to 150 cm long. Longlinescatch yellowfin of about 90 to 150 cm in length. Details on the size of yellowfin caughtin specific types of association are given by Wild (this document).
7.2 Scope of Interactions
In the EPO there exists a potential for interaction between longline and purse-seinegears. This interaction may have been greatest in the 1960s, when the distribution ofeffort by the two gears overlapped to some degree. Currently, fishermen are targettingbigeye tuna by fishing de,eper and in more southerly latitudes. The CPUE effort forlonglines and purse seines show nearly-parallel declining trends through the 1970s andearly 1980s. The declines in the longline catch and CPUE are thought to be caused bythe purse seines (resource-mediated interaction) and by changes in recruitment to the
population. In recent years, increased abundance of the yellowfin resource and decreasedeffort in the purse-seine fishery has effected an increase in CPUE. The longline CPUE,however, has recovered only two-thirds as much as the purse-seine CPUE, but it shouldbe note,d that yellowfin is only an incidental catch for the longline fishery.
The potential exists for interaction between purse-seine and baitboat gears.Currently, the baitboat fleet is small and stable in numbers and catch, and operates near
shore. Purse seiners also operate near shore and on similar-size fish, so there is apotential for localized interaction.
16
7.3 Importance for Fisheries Management
The yellowfin resource in the EPO is producing near its maximum sustainableproduction with the current yield per recruit.
7.4 Methods for Studying Interactions
Various methods for studying interactions have be,en undertaken with differingdegre,es of success. Statistical measures, such as CPUE time series for the purse-seineand longline fleets, have suggested that interactions exist. The CPUE data for these gearsspan a period of more than 30 years. A movement model incorporating predictedmovement through advection and diffusion, driven by existing tagging data, has been usedto address the effects of changes in minimum size of capture and the effects on localfisheries through resource redistribution. A general simulation model for tuna in the EPOis also being developed. This age-structured model, based on area-time strata, addressesinteractions between yellowfin and skipjack tunas and dolphins. This model incorporatesfleet dynamics and fish movements, and also allows different scenarios to be tested.
7.5 Recommendations
The following topics were considered to be equally important:
Further development of simulation methodology and applications iswarranted. Movement models and age-structured models can be used toaddress interaction questions in a cost-effe,ctive manner.
Additional data on timing and movement of fish betwe,en fisheries areneeded to provide parameters for models. This is best accomplished bytagging experiments. Modification of previous experimental designs andmethodology is needed to improve tag-recovery rates throughout thefisheries. In addition, technical advances are needed for tagging methodswhich would permit the successful tagging of purse-seine-caught yellowfin,particularly in offshore areas.
Further study of the spawning and maturity of yellowfin is needed to betterunderstand the distribution in space and time of reproduction of the stock.This can be examined for possible spawner, environmental, and recruitrelationships.
Collection of basic fishery data needs to be continued on a regular basis forall segments of the fishery to provide a basis for analysis of interactions, aswell as other topics.
e) Ecological studies of the species components in the purse-seine and baitboatfisheries should be examined for species interactions.
Future research is likely to be conducted by a nuMber of institutions. Theseinclude, but are not limited to, the Inter-American Tropical Tuna Commission, severalinstitutions in Mexico (e.g., Instituto Nacional de Pesca, Centro de InvestigacionesBiologicas, and Centro Interdisciplinario de Ciencias Marinas), the US National MarineFisheries Service, and the National Research Institute of Far Seas Fisheries of Japan.
8. WESTERN PACIFIC YELLOWFIN TUNA
The chair of the session on western Pacific yellowfin tuna was Dr. Ziro Suzuki;Mr. Atilio Coan was the vice-chair, and Mr. Peter Ward the rapporteur.
8.1 Fishery Components
Yellowfin tuna are distributed widely in the tropical Pacific and, during thesummer, also occur in higher latitudes. The western Pacific yellowfin tuna fishery ischaracterised by a significant expansion in fishing effort and catches during the 1980s.The term "western Pacific" is used here to refer to all waters of the Pacific west of150°W, including the Philippines and eastern Indonesia. Diverse fishing methods (purseseine, longline, baitboat, and handline) are use,d by fishermen of many nations to catchyellowfin tuna in the region. Components of the western Pacific yellowfin tuna fisheryare described by Suzuki (this document).
Purse seining, predbminantly by distant-water fishing nations, accounted for over50% of the 338,868 mt of yellowfin tuna caught in the region in 1990. Significantcatches were also taken by various methods in the Philippines (62,146 mt, mainly withringnet) and Indonesia (57,995 mt). The rapid expansion of purse-seining has raisedconcern over its possible effects on other components of the tuna fishery.
8.2 Scope of Interactions
There are many possibilities for interactions between tuna fisheries in the westernPacific. Several potential interactions for yellowfin tuna in the western Pacific wereidentified by the Consultation and are discussed below.
8.2.1 Purse-seine affecting longline
Concern has been expressed by groups using longlines (Japan, Korea, Taiwan, andseveral coastal states) that purse seining may affect longline catch rates. According to thesystem of classification developed by Hampton (this document), this would be a "Type BInteraction"; the effect one component (purse seine) fishing yellowfin tuna at an earlystage in its life cycle has upon a component using different gear (longline) at a later stage.There may also be instances of more direct competition, where the two groups operate in
the same area and the size composition of the catch overlaps. For example, purse seiningon free-swimming schools of a wide size range sometimes overlaps with longlining in thesame area.
17
7.6 Institutional Arr., ements and Future Research
18
8.2.2 Offshore activities affecting coastal activities
Many coastal states are concerned over the possible adverse effects of offshoreactivities on their commercial and subsistence fisheries for yellowfin tuna. There areseveral offshore activities, specifically purse seining, that are of particular concern.There is a range of coastal operations that might be affected, from surface activities suchas subsistence trolling and handline, to small-scale commercial longlining. Interactionoccurs where these local, surface fisheries compete with purse seining for yellowfin tunaat the same stage of their life cycle in adjacent or surrounding areas.
8.2.3 Purse seine interacting with purse seine
Direct competition occurs between vessels of different nationalities using the samefishing gear, e.g., purse seines, when they are active in the same areas. There may alsobe more diffuse interactions, with subtle variations in targetting between operations. Forexample, USA seiners, which sometimes target free-swimming schools over a wide area,might be affected by the Japanese who concentrate only on log-associated schools in morediscrete areas.
8.2.4 Commercial activities affecting artisanal or recreational components
Coastal states are often concerned over the effects of commercial fishing withintheir economic zones on artisanal or recreational components. Various commercialoperations may be responsible for interactions; these interactions would be direct andmainly affect surface activities of artisanal and recreational components. Concern forthese interactions, for example, have led to anglers successfully lobbying for area closuresto prevent competition from longliners.
8.2.5 Coastal fishing affecting longline
A unique situation of a local, small-scale operation affecting commercial fishingexists with the ringnet fishery in the Philippines. Large amounts of very small (20-40cm) yellowfin tuna are taken by ringnets, and declines in longline catch rates in ne,a.rbyareas two or three years later might be evidence of the adverse affects of ringnets.Rigorous experimental design and special techniques are required to investigate the effectof this component on offshore fishing activities.
8.3 Importance of Interactions for Fisheries Management
Despite growing fishing effort, there is still no evidence of a decline in theabundance of yellowfin tuna in the region. The situation of rapidly expanding effort on aspatially-heterogeneous resource has led many fisheries administrators to be moreconcerned with possible interactions than overall stock condition. This concern has beenexpressed by some coastal nations and international bodies.
8.4 Methods Applied for StudyinE Interactions
The Consultation noted general uncertainty as to whether there was evidence ofinteraction in components of the western Pacific fishery. Analyses of interaction have
19
been limited to the issue of purse seines interacting with longlines through examination ofabundance indices for negative correlations. More than 10 years ago, Lenarz and Zweifel(1979) suggested that the total yield of yellowfin tuna frorn coexisting surface andlongline fishing was greater than that by either gear operating alone. More recently,Hilborn (1989) showed that the total yield would be maximised if there was little mixingbetween components of the stock exploited by longline and surface gears. If the stockwas available to both fishing methods however, a longline fishery would maximise yield.
A preliminary study by Sibert (pers. commun.) found negative cross-correlationsbetwe,en longline catch rates and purse-seine catches by the Japanese in the Federate,dStates of Micronesia (FSM). Results, however, were generally inconclusive, with inversecorrelations in some analyses. In an analysis of catch and effort data, Hampton (1988)found no evidence of fishing activities affecting the stock available to surface ge,ars during1978-88.
More recently, Suzuki (this document) noted that the Japanese longline componenthad been relatively stable during the 1980s. The effects of large catches of yellowfin tunaby purse seines during 1987 and 1988 might be apparent in a decline in longline catchrates in 1989. Decline in longline catch rates tended to occur in areas where the twofisheries overlap, supporting the hypothesis that purse-seining was having an adverseaffect on longlining. No decline of catch rates however, was apparent in the Koreancomponent at that time (Park et al., this document). Medley (this document) assumedthat purse-seine catches affect longline catch rates in the same area, and developed amodel to estimate the effect on catches. Medley also provided a decision framework forassessing the costs and benefits of longlining and purse-seining.
The South Pacific Commission (SPC) tagging projects will add significantly toknowledge of movement patterns and provide data for modelling population dynamics.Over 30,000 yellowfin tuna have been tagged and released throughout the westernPacific; tags from over 2,500 recaptures of these have so far been received. TheConsultation noted the release of significant numbers of large (longer than 60 cm)yellowfin tuna in the Coral Sea, which may aid the study of recruitment to longlinecomponents.
8.5 Scientific Problems and Research Priorities
8.5.1 Fishery statistics and abundance indices
The coverage of data-collection programmes and the quality of catch, effort, andsize data were inadequate for many of the analyses required to answer interactionquestions. The Consultation noted the importance of accurate species identification inIndonesian and Philippines data and in purse-seine reports, particularly for distinguishingyellowfin tuna from bigeye tuna.
Accurate abundance indices were required for correlation analyses of time-seriesdata for the longline and purse-seine components. Detailed description of developmentsin fishing methods and investigation of their influence on catch rates were necessary for
refining abundance indices.
20
Trends in abundance depicted by indices may be masked by environmental noise.The large-scale effects'of extraneous influences (such as El Niño events) on apparentabundance must be taken into account.
8.5.2 Movement patterns
Movement patterns are complex and influenced by various biological andenvironmental factors, e.g., age, reproductive behaviour, water temperature, fishaggregating devices (FADs), and distribution of forage organisms. Archival and sonictags show promise for studying movement patterns, especially for large yellowfin tuna.
Investigation of interaction between surface fisheries and longline operationshighlighted specific problems faced in studying movement patterns. Reports of taggedyellowfin recaptured by longline are rare. For example, not one of the 2,500 yellowfinrecaptures reported to the SPC has come from a longliner, whereas at least 80 of theserecaptured fish were 90 cm or larger, the size at which yellowfin tuna are recruited to thelongline fishery. This is perplexing because recaptures of other tuna species by longlineare not uncommon, e.g., albacore, northern bluefin, and southern bluefin. It would beunlikely that a conspiracy existed among fishermen to not report tags, which extendedacross countries, and for yellowfin tuna, but not other species. There was concern overthe implications of the lack of returns of tags from the longline fishery. TheConsultation, therefore, recommended further investigation of reporting of tag recapturesin the longline fishery. [If non-reporting is significant, then remedial action might beconsidered, such as observer programmes to gauge non-reporting, increasing tag rewards,and promotion of tagging programmes directly with longline crews.]
8.5.3 Stock structure and recruitment
Detailed knowledge of stock structure is a useful starting point for studyinginteraction. Stock structure of yellowfin tuna in the region however, is poorlyunderstood. One hypothesis is that Pacific yellowfin tuna comprise three stocks, roughlycorresponding to the western Pacific, central Pacific, and eastern Pacific, but their exactboundaries and the level of mixing between them is not known. The relationship ofyellowfin tuna taken in Indonesian and Philippines waters to the rest of the westernPacific also requires investigation. Analyses of morphometric relationships indicate localheterogeneity, yet tag-recapture studies show the potential for yellowfin tuna to movegreat distances. An understanding of the heterogeneity of local groups or sub-populationswithin the stock is essential for assessing interaction between components of the fishery.
8.5.4 Biological parameters
In addition to movement and intensity of exploitation, the degree of interactionwill be dependent on growth and natural mortality. In the absence of comprehensivestudies in the western Pacific, assessments of interaction have used estimates of age andgrowth of yellowfin tuna from other regions, such as the eastern Pacific. Age and growthin the western Pacific, however, may be different to that in the eastern Pacific, andassessments of interaction based on these parameters may thus be misleading. Similarly,schedules for age-dependent mortality are required. Data collected by SPC taggingprojects will be useful in this regard.
8.5.5 Analytical tools
In the long term, an age-structured model for yellowfin tuna in the western Pacificis essential for effectively addressing interaction questions. Such a model shouldincorporate vulnerability schedules for the various gears used, and movement, particularlyexchange between surface and deep components of the stock. Yield-per-recruit analysesthat evaluate multiple gears would also provide a guide to administrators seeking adviceon optimum fishing regimes.
8.6 Recommendations
The following problems and recommendations are not necessarily liste,d in order ofpriority:
a) Inadequate fishery statistics.
1) SPC and IPTP should continue to improve collection systems andquality of data, particularly for high-seas operations'.
b) Uncertainty over movement patterns and mixing.
analyse data from SPC tagging projects,investigate non-reporting in longline fishery,conduct studies using sonic and/or archival tags, particularly forlarge fish, andinvestigate fine-scale genetic structure of the population(s).
c) Poor indices of abundance.
quantify changes in fishing efficiency by collecting information ondevelopments in targets of fisheries and in fishing gear andpractices, andinvestigate the relationship between environmental conditions andabundance.
d) Uncertainty over biological parameters.
conduct comprehensive studies of age and growth, andstudy natural mortality
e) Ad hoc approach to interaction questions.
1) develop comprehensive age-structured models.
21
The current US Multilateral Treaty on Fisheries is already providing high-seas data for all USApurse-seine vessels operating within the treaty area. It was noted that a set of Minimum Terms andConditions (147rs) is currently being applied by the 16 member states of the Forum Fisheries Agency (FFA).The 16 member states of FFA are currently attempting to apply a revised set of MTCs for accessagreements. If accepted, these would include provision of high seas data by foreign fishing vesselsoperating within the FFA region.
22
8.7 Institutional Arrangements for Future Research
Identification of problems and investigation of interaction depends to a large extenton comprehensive catch, effort, and size data. Most interaction problems identified bythe Consultation involve DWFNs. The SPC and IPTP, their member nations, and otherstalcing yellowfin tuna in the region, must continue to establish data collection andvalidation systems for these activities. In the absence of any formal arrangement for thecoordination of tuna research in the western Pacific, these organisations should encourageparticipation by all parties involved in western Pacific yellowfin tuna fisheries tocooperate in relevant research and exchange of data.
The first meeting of the Western Pacific Yellowfin Tuna Research Group was heldin June 1991. The group will provide an important international forum for analysing dataand providing advice on yellowfin tuna, including advice on interaction. Results of SPCtagging programmes will form an important data base for many of the analyses required.Scientists may need to develop collaborative projects through the stock assessment groupand SPC.
8.8 References
The following papers were cited in this session:
Hampton, J. 1988. Status of tuna fisheries in the western and central PacificOcean. IPTP Report of the 2nd Southeast Asian Tuna Conference and 3rdMeeting of Tuna Research Groups in the Southeast Asian Region, pp 187-200.
Hilborn, R. 1989. Yield estimation for spatially connected populations: anexample of surface and longline fisheries for yellowfin tuna. NorthAmer.J.Fish.Mgt. 9(4):402-10.
Lenarz, W., and J.R. Zweifel. 1979. A theoretical examination of some aspectsof the interactions between longline and surface fisheries for yellowfintuna, Thunnus albacares. Fish.Bull.NOAA-NMFS, 76(4):807-25.
9. NORTH PACIFIC ALBACORE
The session on North Pacific albacore was chaired by Dr. Norman Bartoo; therapporteurs were Dr. William Bayliff and Mr. Atilio Coan.
9.1 Fishery Components
There are four principal fisheries for North Pacific albacore: the USA/Canadiantroll fishery in the central to eastern North Pacific, the Japanese pole-and-line fishery thatoperates in waters off the Japanese homeland and further offshore in the KuroshioExtension waters, the large- and small-mesh drift gillnet fishery in the central and westernNorth Pacific, and the longline fishery of several nations which takes place over a widearea of the North Pacific. Pole-and-line and troll fisheries began in the early 1900s,

23
longline fisheries have operated since before World War II, and drift gillnet fisheriesstarted in 1981. The highest catches, in excess of 100,000 mt per year, occurred in theearly 1970s when the surface fisheries took over 80% of this catch. However, since themid-1970s, CPUE, catch, and effort of the pole-and-line and troll fisheries havedecreased. Currently, the catch from all gear is approximately 50,000 mt.
Albacore in the North Pacific are considered to be one stock. The drift gillnet andtroll fisheries take 3- and 4-year-old fish, the pole-and-line fishery takes mainly5-year-olds, and the longline fishery takes mostly fish older than 5 years old. There areoverlaps in age composition among fisheries.
9.2 Scope of Interactions
Albacore in the North Pacific have been extensively tagged in the commercialUSA troll and Japanese pole-and-line fisheries. Tagged fish have been recovered by thepole-and-line, troll, and longline fisheries. These results show that albacore migratefreely back and forth across the North Pacific through areas commonly exploited by allgears. Further, since the pole-and-line, troll, and drift gillnet fisheries take fish of aboutthe same age, there is considerable opportunity for interaction among these fisheries.Since the longline fishery takes almost entirely older fish, it can also be affected by theother fisheries, and may in turn affect recruitment to the surface fisheries. After the startof the drift gillnet fishery, drift gillnet-marked albacore began to be caught in the trollfishery, indicating direct interaction between these fisheries.
9.3 Importance of Interactions for Fisheries Management
Since albacore migrate through areas exploited by the pole-and-line, drift gillnet,and troll fisheries, and then through areas exploited by longlines, concerns have alwaysbeen present about the effects of fisheries on each other. Catches and CPUE of albacorefisheries in the North Pacific have decreased considerably since the mid-1970s. While thecause for this decrease is not known, it has caused interest in the role played byenvironmental factors on abundance/availability.
9.4 Methods for Studying Interactions
Tagging has yielded more information about interactions than has any othertechnique. Two types of tagging are utilized. The first is conventional tagging, which isemployed in the troll and pole-and-line fisheries. The second is accidental tagging, whichresults when fish make contact with drift gillnets but manage to escape. The netmarkings on the fish constitute the "tag". Accidental tagging is not as useful asconventional tagging because the number of fish tagged is not known, and the locationsand dates of tagging cannot be determined, so the methods used in conventional tagginganalyses and models are not useful for analysing accidental tagging data.
In addition, statistical data have been used to study interactions. The drift gillnetfishery began during the 1980s, so the catches by the other fisheries before and after thedrift gillnet fishery began were compared to attempt to determine the reduction in thecatches of the other fisheries caused by the drift gillnet fishery. The drift gillnet fisherywas recently terminated, so the catches by other fisheries before and after termination can
24
be compared. However, the effects of the drift gillnet fishery may be masked by theeffects of other factors, such as environmental conditions. Simulation models have alsobeen used to estimate interactions by incorporating age-structured movement andmortality.
9.5 Scientific Problems to be Resolved and their Priorities
There is considerable opposition, particularly from environmental groups, to thedrift gillnet fishery. The extent of the catches of non-target species should be determined,as should the effects of the catches on the abundance of those species. Also, the amountsof albacore which drop out of the nets should be estimated.
9.6 Recommendations
Further work is required in the following areas:
A variety of research should be undertaken to determine the interactionsbetween the various fisheries. Catches of the albacore fishery before,during, and after the drift gillnet fishery should be compared in order todetermine the effects of the drift gillnet fishery on troll, pole-and-line, andlongline fisheries. Loss rates from drift gillnets should be estimated andused in the interaction study.
Continued analyses of the tagging data should be conducted to quantifyinteractions and movements.
Simulation modelling of tagging data should be conducted to furtherquantify interactions among gear types.
Interactions between gears should be analysed by age-structured methodsleading to yield-per-recruit analyses by fishery and time period.
9.7 Institutional Arrangements for Future Research
Research is being conducted principally by the fisheries agencies of the USA,Canada, Japan, Taiwan, and Korea, and continuation is encouraged. Data and results ofanalyses on the status of albacore stocks are shared at biennial albacore workshopsinvolving scientists of these organisations. These workshops provide a means ofcoordinating and conducting future interaction research.
10. SOUTH PACIFIC ALBACORE
The session on South Pacific albacore was chaired by Dr. Talbot Murray; thevice-chair was Dr. Mark Labelle, and the rapporteur Mr. Albert Caton.
10.1 Components of the Fishery
Larval distribution patterns and apparent physiological barriers for larval andjuvenile albacore in equatorial waters suggest that albacore form a discrete stock in the
25
South Pacific. Separate North Pacific and Indian Ocean stocks are also suggested by lowlongline catch rates of adults in equatorial waters and in waters south of Tasmania. TheSouth American land mass serves as an eastern boundary between the Pacific and Atlanticstocks of albacore.
Major surface fisheries for juveniles and longline fisheries for adults exploit theresource throughout most of its range. One surface fishery component, a drift gillnetfishery in the Tasman Sea and Sub-tropical Convergence Zone (STCZ), developed rapidlyin the mid- to late 1980s, and ceased in 1991. The biology and description of thefisheries for South Pacific albacore is reviewed by Murray (this document), and thepotential for interactions among fishery components is discussed by Murray (thisdocument).
The surface fishery began in 1968 in New Zealand waters, where a troll fleetcontinues to operate off the west coast of the South Island from January to April. Thefle,et, consisting of over 200 vessels in some years, made catches ranging from less than1,000 mt to over 4,000 mt of juvenile albacore annually. The drift gillnet fishery,composed of fleets from Taiwan and Japan, expanded rapidly during the mid to late 1980sto an estimated 136 vessels in 1988/89 (Anon., in press).
The estimate of the 1988/89 drift gillnet catch was nearly 22,000 mt; the totalsurface-fishery catches for the entire South Pacific was almost 31,000 mt for that period.Following this peak season, when the surface fishery catch exceeded the previous high bythreefold, the number of vessels in the drift gillnet fleets declined due to internationalpressure to terminate this method of fishing. Drift gillnet fishing in the South Pacificended in June 1991 in accordance with United Nations Resolution 44/225. While thedrift gillnet fishery was developing, another major surface fishery, the STCZ troll fishery,developed in the same area and season as the drift gillnet fishery. The STCZ troll fisheryincreased from two vessels in 1985/86 to more than 70 vessels in 1991; the catch of thistroll fishery was about 5,400 mt. There have also been indications that during 1991 somepole-and-line vessels fished in the Tasman Sea, in the same area and season as driftgillnet vessels were operating. The target species of this small pole-and-line fleet isunknown, but it is likely that some albacore were caught.
Japanese longlining began in the South Pacific during the early 1950s. Koreanlongliners joined the fishery in 1958 and Taiwanese vessels in 1967. The annual longlinecatch of albacore has ranged between 20,000 mt and 40,000 mt. Japanese activity peakedin 1962, and then declined with a change in target species. The catch by Koreanlongliners has varied from about 6,000 mt to almost 19,000 mt, declining since 1986when there was a shift in the target species. The Taiwanese longline catch has been lessvariable (averaging around 13,500 mt each year since 1980) with most of the fleet effortdirected to albacore. In recent years, some Taiwanese longline vessels may have shifte,dfrom albacore to target other tuna species.
Since the mid-1980s, several South Pacific countries (Australia, Tonga, NewCaledonia, and New Zealand) have started to develop domestic longline fisheries. Thetotal catch from these fisheries in 1990 was less than 2,000 mt; most of the fishing tookplace in waters in, and adjacent to, their respective EEZs. Since 1980, the albacore catchby all tuna fleets operating in the South Pacific ranged from 21,000 mt to 39,000 mt; theaverage was 29,300 mt.
10.2 Scope of Interactions
The drift gillnet and troll fisheries catch similar sizes of juvenile albacore from thesame areas (particularly in the STCZ) and in the same season, suggesting a high potentialfor interaction. The longline fishery exploits predominantly adult albacore throughout theyear over a broader area north of the surface fishery region. The spatial separation offleets and size differences in the catch would seem to suggest that most surface andlongline interactions would occur after some time lag. On the contrary, some longlineoperations occur immediately north of the STCZ troll fishery, and follow the STCZfishing season. The proximity of these fisheries and the oceanographic conditions of theregion appear to be responsible for the overlap in the albacore size compositions of thetwo fisheries. These observations suggest there is a potential for some interactionbetween the surface and longline fisheries without a substantial time lag.
10.3 Information on Interactions
Based on CPUE estimates (Anon., in press) there is no clear correlation betweendrift gillnet catch and troll CPUE. Drift gillnet CPUE generally increased until 1987/88,but dropped in 1988/89, a period when drift gillnet catch increased sharply.Subsequently, the drift gillnet catch declined abruptly in 1989/90, while the CPUEincreased again. Troll fishery CPUE showed a less marked trend during the period and,in fact, declined in 1990/91 when drift gillnet catch was low. Subsequently, as driftgillnet fleets were reduced, catch rates of the remaining drift gillnetters and the troll fleetimproved. The USA trollers have reported gear conflict where fishing has beenhampered by the risk of troll vessels becoming entangled in drift gillnets. Some fishersalso claim that albacore behaviour changes (become less vulnerable) in the vicinity ofdrift gillnet operations.
Spatial and temporal patterns of drift gillnet damaged albacore subsequently caughtby trolling indicate that the highest incidence of net-marked fish occurs in the vicinity ofthe drift gillnet fleet with declining incidence to the east and low incidence to the west.Similar indicators were evident in the New Zealand troll fishery, where incidence ofnet-marked fish increased from about 1% to 7% during the 1989/90 season when driftgillnetters operated in the western Tasman Sea (i.e. , west of the New Zealand surfacefishery). Observations of drift gillnet marked fish in longline catches off New Zealand,indicated net marks occurred on a substantial portion of the catch in the size categoriesexploited by surface fisheries. In contrast, observations in the Australian Fishery Zone tothe west of the Tasman Sea drift gillnet fishing area did not reveal any net-marked fish.These observations suggest a direction of surface albacore movements, and consequentlyimply a spatial pattern of interaction between surface and longline fisheries in the TasmanSea and New Zealand area.
There are other indications of surface and longline fishery interaction fromlongline catch rates. Longline catch rates in sub-equatorial latitudes, where large adultalbacore are the main catch component, were fairly stable through the 1980s. Farthersouth (20"-30°S), the CPUE was more variable and has shown a decline since 1986.Variability in CPUE and the magnitude of the CPUE decline is greatest in the latitudinalband immediately north of the STCZ troll fishery, where juveniles make up a strongcomponent of the longline catch. While the link is rather tenuous, the catch rate in the
26

27
30-40°S band declined after 1986. However, the most recent longline CPUE in thisregion is at a similar level to the period before the development of the surface fishery.
Movement patterns inferred from parasite studies and tagging experiments areconsistent with the patterns suggested by net-marked fish and longline fishing patterns.The parasite studies confirmed the tropical origin for recruitment of juveniles to the NewZealand troll fishery; a parasite unique to the tropics was associated with albacore caughtin New Zealand waters. Subsequent prevalence of the parasite declined, suggestingmovement eastward. Prevalence also declined with increasing albacore size until aboutthe size of female maturity, after which prevalence increased again. This pattern ofparasite prevalence is consistent with juveniles remaining in temperate waters until thefirst spawning migration to the tropics and a subsequent return to temperate waters. Sofar, only 11 tagged albacore have been recovered from more than 10,000 releases ofjuveniles in the troll fishery. However, the movements of the 11 recoveries wereconsistent with either short-term west-to-east movements or movement northward. Nineof the recoveries were made by the longline fishery and times at liberty ranged from afew months to several years. The results provide direct indication of interaction betweenthe surface and longline fishery.
10.4 Scientific Problems and Research Requirements
The low recovery rate of tags from the relatively large number of releases insurface troll fishery (11 recoveries from more than 10,000 tag releases) contrasts sharplywith results from similar albacore tagging in other oceans. The low tag returns couldindicate substantial non-reporting of tags, high mortality of tagged fish, or lowexploitation rates. Several observations suggest that non-reporting of tags may explainthe low recovery rates. The use of a proven tagging method which still resulted in lowrecovery rates, the reports by some individuals in the surface fishery of a generalunwillingness to return tags, the non-return of a few tags "seeded" in the catch of thedrift gillnet fishery, and the reduction of the longline CPUE, which was predicted ifeffort continued at the 1988/89 level (Hampton, 1990), suggest that substantialnon-reporting of tags may be occurring. Other tagging experiments involving tropicalspecies with higher mortality rates in the South Pacific (e.g., skipjack tuna tagged in theSolomon Islands) resulted in tag recovery rates many times higher than that for albacore,further suggesting that non-reporting may be a major problem.
Available data from longline fisheries was useful. However, higher-resolutioncatch-and-effort data were needed to monitor size-specific changes in longline CPUEfollowing the 1988/89 surface fishery peak. Better information on fishery targets andother longline operational details was also needed to standardize CPUE data. Work isplanned to extend the length-frequency-based growth rate and population-at-age estimationprocedure to incorporate a preliminary size-structured stock assessment for South Pacificalbacore.
Development of models of albacore fisheries interaction will require incorporationof spatial and temporal movement patterns. Consideration of spatial distribution iscomplicated by different depth distributions for juveniles and adults and apparentdifferences in depth distributions of adults in the western, central, and eastern SouthPacific. However, with juvenile catches currently occurring at an order of magnitude
28
lower than adult catches, there may be limited scope for the present troll catch to exert adetectable impact on the longline fishery. This observation adds an impetus to monitorthe historical impact of the peak surface catch in 1988/89 when the juvenile catchequalled or exceeded the adult catch. A simulation model which assumed similarparameters as albacore populations in other oceans and which incorporated estimates ofsurface and longline catches, suggested that continued surface catches at 1988/89 levelcould cause a significant reduction (perhaps 60% in 5 years) in longline catch.
As further increases in surface-fishery catch cannot be ruled out, it is stillappropriate to assess the potential impact of a range of surface-fishery catches on thelongline fishery. For this reason, further studies of historical drift gillnet catches couldprovide a valuable benchrnark. If estimates of the number of fish escaping drift gillnetswere available it might be possible to do a more detailed analysis of the net-markobservations as a form of tag-recapture study to shed more light on the extent ofinteraction. In general, the impact of interactions is closely linked with exploitation rate;assessment studies in progress or proposed should lead to considerably improvedestimates of relative exploitation rates.
10.5 Recommendations
The following research activities are recommended for the South Pacific albacore:
a) Fishery data collection from all sectors needs to be maintained and, wherepossible, data coverage should be increased. In particular:
there is a need to improve the resolution of available high seas catch,effort, and size-composition data, especially to take advantage of theopportunity to monitor any size-specific, longline-CPUE changesfollowing the 1988/89 surface fishery catches, andbetter information on target species and other longline operational detailsis also needed to standardise CPUE data for use as abundance indices.
b) Tagging experiments should be expanded and reasons for low recoveryrates identified. Where possible, tag-reporting rates should be estimatedfor each fishery sector.
c) Further work should be done to determine the potential for interactionbetween surface-troll and longline fisheries, particularly with regard togear-specific yield-per-recruit analyses.
d) There is a need to determine the sampling regime and sample sizes requiredto detect a given level of interaction.
10.6 Institutional A ran e ents for Future Research
Scientists from the South Pacific and DWFNs interested in albacore formed aninformal "South Pacific Albacore Research Working Group" (SPAR) in 1986, with theobjective of determining the appropriate aggregate yields of surface and longline fisheries.The need arose because of interest in the scope for development of surface fishing when
29
longline fisheries were already regarded as operating close to MSY. Consequently,SPAR's focus was on stock assessment and fisheries interaction. Regular updates offisheries developments and research results are produced for discussion at each SPARmeeting.
With the rapid expansion of the drift gillnet fishery in 1988, interaction issueswere highlighted as a research priority, as was the need for management. The SPARgroup was asked by South Pacific and DWFNs fisheries managers to serve as an interimscientific advisory body during South Pacific Albacore Management Consultationsbetween and DWFN and South Pacific Island States. While a core function of SPARremains that of research coordination and planning, it also produces a summary "Status ofthe Stock" report in which the potential for fisheries interactions is an importantconsideration. SPAR, is therefore, in a good position to continue to review developmentsin South Pacific albacore fisheries and coordinate future research activities addressinginteractions and related issues.
10.7 References
Anon. In Press. Report of the Fourth South Pacific Albacore ResearchWorkshop, November, 1991. National Taiwan University, Taipei.
Hampton, J. 1990. Simulations of the South Pacific albacore population: effectsof rapid developments in the surface fishery. Third South Pacific AlbacoreResearch Workshop, Information Paper No. 1.
11. PACIFIC BIGEYE TUNA
The session on Pacific bigeye tuna was chaired by Dr. Naozumi Miyabe;vice-chair was Dr. Chris Boggs, and rapporteur Dr. Antony Lewis.
11.1 Fishe Com onents
Both surface and longline fisheries capture bigeye over wide areas of the Pacificbetween 45°N and 40°S, with longline catches comprising the great majority of the catchby volume. Japanese longliners take the largest proportion of this catch (75-85%) on ayear-round basis in mostly equatorial areas, especially east of 140'W. Korean andTaiwanese longliners also take bigeye in quantity principally in the central South Pacific.A recent development has been the increased activity of small (<20 GRT) longliners inseveral areas; these vessels supply fresh fish to sashimi markets. This fishery catchesadult-sized bigeye.
Baitboats in the eastern and western Pacific and in some Pacific islands areas havea long history of capturing juvenile bigeye, although in relatively minor quantities. Therapid expansion of purse-seine fisheries in the western Pacific in recent years hasundoubtedly led to a significant increase in incidental bigeye catches. Knowledge of thespecies composition in surface catches is improving, but is still incomplete. A variety ofgears in Indonesia and the Philippines no doubt takes sizeable quantities of juvenilebigeye.
According to declared statistics, recent bigeye catches have ranged from 110,000to 150,000 mt annually; however, this is likely to be an underestimate. Productionmodels based on longline time-series data provide MSY estimates of the stock in therange of 100,000 to 170,000 mt. Longline CPUEs are now at approximately 45% of itsinitial levels, but they have been relatively stable since the mid 1960s.
11.2 Scope of Interactions
The recent expansion of purse-seine fisheries in the western Pacific, and otherfisheries in Indonesia and Philippines, suggests the potential for interaction with thewidely-distributed, established longline fisheries, even though these fisheries may bespatially separated. In some coastal and island states, adjacent surface and longlinefisheries could provide a potential source of interaction.
11.3 Importance of Interactions for Fisheries Management
The increase in surface catches combined with the uncertainty about precisespecies composition of these catches, may have implications for the more valuablelongline fishery. Indeed, excluding skipjack, bigeye catches represent the largest volumeand highest total value in the Japanese tuna fishery.
11.4 Methods A
30
Inte actions
A Y/R model was applied to the four groups of fisheries, longline, Japanesebaitboat in the northwest Pacific, western Pacific surface fishery, and eastern Pacificsurface fishery. Two sets of catch levels were assumed, the second accounting forunreported catches and assumed misidentification of juvenile bigeye as yellowfin. Thesecond of these cases, with F 0.4, seemed to fit the situation presently observed in thefisheries, and indicates that any further increase in the catch of very small (0+) fish willbe detrimental to the longline fishery. The application of this approach wasrecommended, and its general utility recognize,d for other tuna species.
11.5 Information on Interactions
There is no reliable information on interactions.
11.6 Recommendations
The following scientific problems were identified and research recommended:
The biology of bigeye remains less known than that of either yellowfin orskipjack. Further work is essential on selected aspects in order to assiststudies of interaction. These include stock identification, movementpatterns for all stages of the life history, and growth.
More reliable catch statistics, with greater emphasis on separation andcorrect identification of bigeye and yellowfin in the catches, are needed.The recently-expanded activity of small longliners directing their catches to
I I lied for St d 'n
31
the sashimi markets and operating in several areas of the Pacific needs tobe better documented.
Migration and stock structure of bigeye in the Pacific are not wellunderstood; lack of information is partly due to the fewer taggingexperiments conducted on bigeye relative to other tunas. Recently, sonictagging has confirmed the species' ability to range down to 350 m depth.A single Pacific-wide stock is assumed, based on fishery data and extent ofspawning. There is an observed east-west cine in the size oflongline-caught fish, and, given the distribution of optimal habitat, it isprobable that Pacific-wide mixing is possible over the entire life history ofthe bigeye.
11.7 Research Required and Priorities
Biological research needs, as identified above, should be pursued with somepriority. The present Regional Tuna Tagging Programme (RITP) work should providesome useful information in this regard, particularly with respect to movement,age-specific migrations, and growth. Continued refinement of the Y/R approach shouldbe encouraged as better estimates of the parameters become available.
11.8 Institutional Arrangements for Future Research
Research on bigeye tuna stocks is likely to be continued by, but not limited to, thefollowing organisations: the National Research Institute for Far Seas Fisheries, Japan(NRIFSF), the South Pacific Commission (SPC), the Inter-American Tropical TunaCommission (IATIC), the Indo-Pacific Tuna Development and Management Programme(IPTP), and national fisheries agencies in Southeast Asia. Regular communication andcooperation among concerned agencies should be encouraged, with the possibility offorming a working group sometime in the future. The Consultation however, did notconsider any such arrangements.
12. NORTHERN BLUEFIN TUNA
The session on northern bluefin tuna was chaired by Dr. William Bayliff; thevice-chair was Mr. Yoshio Ishizuka, and the rapporteur Dr. Alex Wild.
12.1 Fisher Com ionents
The northern bluefin tuna has a complex life history, which results in exposure toa variety of fishing gears in the western, central, and eastern Pacific Ocean. The fish arehatched south of Japan and in the Sea of Japan, and are exploited at age-0 by the troll andtrap fisheries in the northwestern Pacific Ocean; these fish are about 15 to 55 cm long.
Some fish in their first or second year of life begin a migration to the easternPacific Ocean (EPO) during the fall or winter; others remain in the western Pacific Ocean
(WPO). It is possible that there are two stocks that sustain the northern bluefin fisheries,one stock remaining in the WPO and the other migrating to the EPO, but the tagging dataoffer little support for this hypothesis.
32
The journey from the WPO to the EPO takes as little as seven months. On theway the fish are exposed to small-mesh drift gillnets used to catch flying squid. Uponarriving in the EPO, the migrants form the basis of the fishery that is carried out by purseseiners and, to a much lesser extent, by other commercial and sport gear. The fish maystay in the EPO for a period varying from possibly less than a year to six years beforereturning to the WPO. The minimum time between the release of a tagged fish in theEPO and its recapture in the WPO is 674 days, so the return journey may take 1-1/2 ormore years. In the central and western Pacific the fish are exposed to baitboat andlongline fisheries, and to the large-mesh drift gillnets used for albacore. After returningto the WPO they are exposed to purse-seine, trap, and longline fisheries.
The non-migrants are exposed to troll, gillnet, purse-seine, baitboat, trap, andlongline fisheries in the WPO.
Northern bluefin are also caught, to a much lesser extent, by longlining east of thePhilippines, northeast of Papua New Guinea, southeast of Australia, and especially nearNew Zealand. It is not known if these fish were juveniles which migrated directly fromthe spawning grounds, immature fish which migrated south from Japan, or older fishwhich migrated south after spawning.
12.2 Scope of Interactions
The factors which determine whether the fish migrate to the EPO or remain in theWPO are probably independent of the fisheries. Nevertheless, for the proportion destinedto migrate, the mortality inflicted by the various gears prior to and during the migrationreduces the potential yield in the EPO. Similarly, the potential catches and reproductionof the fish which would return to the WPO are reduced by the catches taken in the centraland eastern Pacific. The potential for fisheries interactions also exists within differentoceanic regions. In the WPO, for example, there is interaction among the different geartypes. In the EPO, the fish are caught principally by purse seining, so the onlysignificant interaction involves vessels from Mexico and the USA.
12.3 Importance of Interactions for Fisheries Management
There has been a decline in the catch of northern bluefin in the EPO in recentyears. The analysis of catch data and the results of tagging experiments initiated in theEPO and WPO suggest that the decline is due principally to a decline in the proportion offish that migrate to the EPO. Rough calculations based on catch data suggest that thesquid drift gillnet fishery in the central Pacific has only a minor etTect on the fishery ofthe EPO. Elimination of the drift gillnet fishery will end that type of interaction. Theinteraction in the EPO between purse-seine vessels of Mexico and the USA does notappear to warrant study at this time.
12.4 Methods A ied for Stud in Interactions
Tagging experiments have been the principal source of information to evaluate themovements of the fish and the relationships between the fisheries in the western andeastern Pacific. The growth rates obtained from tagging data have also been used toestimate size at age. Together with catch and length-frequency data for the WPO and
33
EPO, this information has been used to estimate the age compositions of the catches inboth regions.
12.5 Research Required
The following research requirements were identified:
Catch and effort data are needed for the various fisheries that capturenorthern bluefin in the western Pacific. The data should be stratified bygear, are,a, month, and length frequencies.
Further information is needed on the migrations, growth, mortality, andsize-related abundance of the fish.
Whether there are separate migrant and non-migrant stocks of northernbluefin needs to be determined.
The oceanographic conditions which influence the migration to and fromthe EPO should be determinetl.
12.6 Recommendations
The following recommendations were made:
Improved data on catch and effort are needed to permit more sophisticatedyield-per-recruit and cohort analyses. The Inter-American Tropical TunaCommission (IATTC) intends to reprocess the available length-fre,quencydata for the EPO fisheries to improve their reliability. The NationalResearch Institute of Far Seas Fisheries (NRIFSF) has estimated theamounts of bluefin in meiji catches, and intends to make furtherimprovements to the bluefin catch data, beginning in 1992.
There is a need to standardize the effort directed at northern bluefin in theEPO. Contacts with fishermen are planned to help evaluate the meaning ofvariations in apparent abundance and possibly to obtain information usefulfor standardization of effort.
Tagging in the Japanese troll fishery would provide useful information onthe migrations, mortality, growth, and size-related abundance of the fish.Consideration should be given to the use of new types of tags that wouldnot affect adversely the growth or mortality of the fish, that would providemaximum retention, and that would discourage detection and removal bynon-scientific personnel.
The stock structure of the population should be explored by means otherthan tagging, such as DNA or electrophoretic studies, in order to test thetentative conclusion that there is only one stock of northern bluefin in thePacific Ocean.
34
12.7 Institutional Arrangements for Future Research
Future research will be conducted by the NRIFSF and the IATTC, and throughcooperation with other scientific organisations; e.g., one or more of those in Mexico.
13. SOUTHERN BLUEFIN TUNA
The session on southern bluefin tuna was chaired by Dr. Tom Polacheck;vice-chair was Dr. Talbot Murray, and rapporteurs Mr. Peter Ward and Mr. AlbertCaton.
13.1 Fishery Components
Southern bluefin tuna comprise a single stock of circumpolar distribution,generally between 35°-50°S. They are also found in the tropical Indian Ocean, south ofJava, where' they spawn.
Components of the southern bluefin tuna fishery are described by Caton (thisdocument). Three nations (Australia, Japan and New Zealand) target southern bluefintuna and take the majority of the catch. Bycatches have been reported or suspected inother fisheries, including longline fisheries of Indonesia, Taiwan and Korea, drift gillnetfisheries of Taiwan and, less commonly, inshore fisheries of South Africa. There arealso minor catches by recreational anglers, mainly in Australia. The southern bluefintuna stock is currently characterised by a major decline in the parental biomass and, inrecent years, Australia, Japan, and New Zealand have managed the fishery usingrestrictive catch limits.
Catches of southern bluefin tuna by the Japanese using longlines peaked at about78,000 mt in 1961 and then declined. Ages of southern bluefin taken range from 3 to 20years old. The Australian surface fishery, which has mainly taken juvenile southernbluefin tuna aged 2-4 years, expanded rapidly in later years, reaching a peak catch of21,000 mt in 1982/83. Catches by all components of the Australian surface fishery havealso declined or were reduced, with the New South Wales surface component failingaltogether in the early 1980s. This failure and concern over the condition of the stock ledto the introduction of catch quotas during the 1980s. The quota agreed to by Australia,Japan and New Zealand for 1991/92 was 11,750 mt.
The Japanese longline catch in 1989 was about 9,200 mt. The 1990/91 Australiansurface catch was less than 3,000 mt. The remainder of the Australian quota was beingtaken by local or joint-venture longline operations. The New Zealand catch in 1990 wasabout 520 int, the bulk taken by domestic or joint-venture longline operations. Catchesby Taiwanese Indonesian, and Korean vessels were not known with certainty, but in totalmay have exceeded 1,000 mt in 1989.
13.2 Scope of Interactions
Several features of the fisheries and the biology of southern bluefin tuna lead toconcern over interactions between the various components of the fishery:

35
Southern bluefin tuna are long-lived and slow-growing; some live to be 20years or more. They do not mature until 8 years of age, but informationon their reproductive biology is sketchy.
The species is broadly distributed and is capable of moving rapidly overlong distances.
Spawning occurs in tropical waters south of Java, while adult feedinggrounds occur in widely-dispersed areas of the Southern Ocean.
A substantial, but unknown, proportion of juvenile southern bluefin tuna(2-4 yea.rs old) occurs in surface schools in inshore waters of southern andsoutheastern Australia.
Fishing activities take southern bluefin tuna at sequential stages of itslife-cycle.
The geographic expanse of fishing grounds has become progressivelycondensed.
Southern bluefin tuna are subject to high rates of exploitation, and theirabundance is currently at historically low levels, e.g., the spawningbiomass has been reduced to 16-25% of pre-exploitation levels.
Several nations fish for southern bluefin tuna on the high seas and withinexclusive economic zones (EEZs).
Despite the critical state of the southern bluefin tuna stock and the potential forinteraction problems, no formal, broad-based management arrangement exists for thesouthern bluefin tuna fisheries.
Polacheck (this document), provided details on the interactions and classified theminto six types:
Interactions among the three components of the Australian surface fishery.
Interactions among surface and longline gear in the same area at the sametime.
Effect of the Australian surface catch on subsequent catches in the longlinefishery for the same cohorts.
Interactions among longliners in different geographic areas.
Effect of longline, driftnet, and surface fisheries on recruitment and, thus,future catches.
Interaction among longline vessels of different nationalities.

36
13.3 Importance of In eractions for Fisheries Management
The importance of different interaction issues among the various components haschanged as a consequence of the declining condition of the stock. Historically, the maininteraction issues of concern were the effects of catches in the various surface componentson current yields and catch rates in the surface fishery, the effects of the surface fisheryon subsequent longline catches, and local effects of longline and surface catches on eachother.
In recent years, management has been concerned with rebuilding the parentalbiomass. Therefore the effects of current catches on spawning biomass and futurerecruitment are the most critical management issues. The associated need for restrainingcatches, and the decline of catches in major fishery components have intensifiedinteraction issues. Particular emphasis has been placed on evaluating the relative impactsof various components (e.g., the South Australian surface fishery) on the overallcondition of the stock.
Interaction among longline fisheries operating in different areas has been a critical,unresolved issue. A large amount of spatial structuring (e.g., "site fidelity") may existamong adults on different feeding grounds. Concern has been expressed over thepossibility of sequential depletion of areas as longline activity shifts and effort becomesspatially concentrated.
Another management issue is the effect of altering the structure (gear or location)of the fishery. For example, the Australian industry is shifting towards supplying thehigh-value sashimi market by converting to longline operations. This should enhance thespawning-biomass-per-recruit and promote escape from the surface fishery in thelong-term. In the short term, however, these structural changes may reduce the currentspawning biomass, and there is uncertainty about their immediate impact on recent andcurrent cohorts of sub-adults that have escaped the surface fishery.
ied for Stt d in Interactions
Data used to study interactions in the past are described by Polocheck (thisdocument). Primary data sets for these analyses included catch, effort and size data formajor fisheries and tag-recapture information. Observer reports and various observationsby fishermen were important sources of supplementary information.
Comparisons and evaluation of changes in the size composition of the catch havebeen used to assess the potential for interactions among components of the Australiansurface fishery. Southern bluefin tuna movement patterns, based on tag-recapture data,have provided further insight into interactions between components of the surface andlongline fisheries. For example, recent recaptures of tagged fish have demonstratedextensive and rapid movement from the Tasmanian troll fishery to the longline fishery.Recaptures of tagged southern bluefin tuna also show rapid movement between the SouthAustralian surface fishery and nearby longline activities. Interaction occurred between thesurface and longline fisheries within the first year of release.
13.4 Methods A I 1
37
Two different analytical methods have been used with the tag-recapture data formeasuring interaction. Applications of the methods of Majkowski et al. (1988) and Hearnand Marzanov (this document) suggested that the level of interaction among the variouscomponents of the Australian surface fisheries was minimal during the 1960s. During themid-1980s, however, results based on these methods indicate that significant and directinteractions occurred between Western Australia and South Australia surface fisheries.Hampton (1989) developed a parametric model to estimate transfer rates betweenfisheries, natural mortality rates and fisheries-specific catchability coefficients fromtagging data collected during the 1960s. Results showed rates of mixing and movementbetween New South Wales and South Australia/Western Australia and vice-versa in theorder of 0.1 to 0.2 yr-'. The estimated transfer rate into the longline fishery was from0.6 to 1.8 yr-1. However, the robustness of the results from these two analyticalapproaches is poorly known. Factors of particular concern are the effects of pooling datafrom different years and cohorts, and the robustness of the results to assumptions aboutsteady-state conditions, tag-reporting rates, and/or structural components of the models.A need exists for improved models and analyses of these tagging data.
Finally, Y/R analyses have been employed to evaluate relative yields from acohort in relation to a range of levels of effort in the Australian surface fishery andJapanese longline fishery. The Y/R analyses, however, assume a spatially-homogeneousstock and fishery. The large degree of spatial heterogeneity, both in the stock and thefishery, rnakes Y/R analyses difficult to interpret to some extent. Of particular concern isthe uncertainty over the proportion of juveniles that are vulnerable to the surfacefisheries. Nevertheless, Y/R analyses indicate the potential for large interactions betweenthe surface and longline fisheries.
13.5 Scientific Problems and Recommendations
The most important research and data needs centre on questions of movement,migration routes, mixing rates and site fidelity, particularly for the component of thestock that is vulnerable to the longline fisheries. There is a need for further analysis ofexisting data, development of new analytical methods and models, improved collection ofcatch-and-effort statistics and development of new approaches for assessing the spatialstructure of southern bluefin tuna. Recommendations are listed below; the order of therecommendations do itot indicate any ranking or priority:
a) Uncertainty over mixing patterns, movement rates, migration rou es andstock dynamics (for juvenile and adult components of the stock).
continue to tag and release juveniles off Western Australia, SouthAustralia, and Tasmania,improve coverage and geographic resolution of high-seas catch, effort,and length frequency data,develop and apply models which take into account age-specific spatialand temporal dynamics, fishery changes, and environmental factors,tag in fishery components other than the Australia surface fishery, (e.g.,explore feasibility of tagging from longline vessels and in South Africa),
38
conduct detailed studies of southern bluefin tuna, particularly for largefish, using sonic and archival tags, and relate this to feeding andenvironmental conditions, andconduct genetic analyses of different sizes and classes of fish caughtover a range of geographic locations.
b) Uncertainty over bycatch by other fisheries.
enhance data collection in all fisheries components with known orsuspected by-catches (i.e., Indonesian, Taiwanese, and Kore,an longline,Taiwanese drift gillnets, and South African inshore fisheries), anddevelop port sampling for length-frequency data from all fisheries withbycatch.
c) Uncertainty over biological parameters.
validate estimates of age, using hard parts, andconduct studies on reproductive biology.
13.6 Institutional Arrangements for Future Research
Australia, Japan, and New Zealand (nations regulating their catches of southernbluefin tuna) undertake research and collect catch and effort statistics. However, there isa need for additional coordination and collaboration among these institutions, in order toprevent duplication and to achieve the most effective use of the limited resources availablefor research. Scientists from these organisations review the condition of the stock atinformal scientific meetings each year prior to trilateral management meetings.Involvement of scientists from other nations catching southern bluefin tuna has beenrecommended by scientists at these trilateral meetings.
The Consultation identified several interaction issues involving high-seascomponents of the fisheries. Currently information on bycatch from vessels that do nottarget southern bluefin tuna is critical for assessing these issues. Regional fisheriesagencies could assist in collecting data on these incidental catches of southern bluefin. Inlieu of effective actions by a regional agency in obtaining these data, collection andprovision of such data will most likely depend on informal and cooperative arrangementsbetwe,en countries. Indonesia and Australia are currently exploring the possibility ofdeveloping a joint sampling and monitoring programme for southern bluefin tuna caughtaround Indonesia.
13.7 References
The following papers are cited in this section:
Hampton, J. 1989. Population dynamics, stock assessment, and fisherymanagement of the southern bluefin tuna (Thunnu.v maccoyii). Univ. ofNew South Wales, Australia. PhD Thesis: 273 pp.
39
Majkowski, J., W.S. Hearn, and R.L. Sandland. 1988. A tag-release-recoverymethod for predicting the effect of changing the catch of one component ofa fishery upon the remaining components. Can.J.Fish.Aquat.Sci. 45:675-84.
14. SMALL TUNAS
The session on small tunas was chaired by Mr. Mitsuo Yesalci; vice-chair was Dr.Nurzali Naamin and rapporteurs were Ms. Flerida Arce and Ms. Chee Phaik Ean.
Only the small tunas of Southeast Asia were reviewed at the Consultation. Thereare fisheries for black skipjack (Euthynnus lineatus) and eastern Pacific bonito (Sardaorientalis) off Central and South America which were not considered. Also, there isevidence from stomach contents and larval studies, of a large resource of Auxis spp. inthe eastern Pacific Ocean which has not been exploited to date.
14.1 Fishery Components
Three species or groups of species of small tunas are important in Southeast Asia.These are the longtail tuna (Thunnus tonggol), kawakawa (Euthynnus affinis), and Auxisspp.
The largest catches of longtail tuna in 1989 were made by Thailand (65,900 mt)and Malaysia (5,600 mt). The Philippines landed the highest catches of kawakawa with57,900 mt, followed by Thailand with 26,000 mt. Approximately 117,000 mt of Auxisspp. were landed by the Philippines in 1989. Indonesia caught over 120,000 mt of smalltunas. However, Indonesia does not report landings separately for these species.
The fisheries for small tunas off the South China Sea coast of Thailand andPeninsular Malaysia were examined for interactions. In Thailand, two major gearsexploit small tunas: gillnets and purse seines. Gillnets historically fished narrow-barredSpanish mackerel; however, a shift to small tunas probably started around 1981. Luringpurse seines operated in conjunction with FADs and lights, while one-boat purse seinestargetted small pelagic fish and also caught small tunas as by-catches. The tuna purseseine was reportedly introduced in 1981 to specifically target small tunas.
Off the South China Sea coast of Peninsular Malaysia, drift gillnets and the luringpurse seines catch small tunas as a bycatch. Troll lines that target small tunas are also animportant gear.
14.2 Scope of Interactions
Landings of small tunas from the South China Sea coast of Thailand and Malaysiaincreased from 19,000 mt in 1980 to 141,000 mt in 1989. In 1989, Thailand accountedfor 93% of this total, while the remainder of the landings was from Malaysia.
Small-tuna landings from the South China Sea coast of Thailand increasedgradually from 4,000 mt in 1970 to 13,000 mt in 1980. In 1983, landings increased
A critical management issue that needs to be addressed is whether the Thai andMalaysian fisheries are harvesting the same stocks. If studies should show homogeneityin the various species of small tunas, the problem of allocation will be of majorimportance, especially if overfishing is evident.
14.4 Methods for Studying Interactions
An indication of interactions between fisheries exploiting small tunas has beenobtained from an analysis of the available catch-and-effort statistics from Thailand andMalaysia. The correlative approach to studying fisheries interactions may be the onlymethod available to study interactions among small tuna fisheries of the South China Sea.More detailed catch-and-effort statistics obtained from the tuna-sampling programme forthe Thai tuna purse-seine fishery may help better understand the relationship of thisfishery with the others. Also, more detailed data on the species and size compositions ofluring and one-boat purse seines are required to better assess the magnitude of incidentalcatches by these gears.
14.5 Information on Interactions
40
markedly to 82,000 mt and totalled 131,000 mt in 1989. Landings by purse seiners andgillnetters were of equal magnitude up to 1982, but thereafter, purse-seine landingsgreatly exceeded those of gillnetters. Purse-seine landings have increased by 150% andgillnet landings have decreased by 62% since 1984.
Small-tuna landings from the South China Sea coast of Peninsular Malaysiafluctuated between 13,000 mt in 1981 and 19,000 mt in 1988. In 1989, landingsdecreased to 10,000 mt. Troll and gillnet landings decreased from 1987, whilepurse-seine landings decreased from 1988.
Of the five basic fisheries exploiting small tunas in the South China Sea offThailand and Malaysia, catches have increased in recent years only for the Thaipurse-seine fishery. Catches of small tunas have decreased in the Thai gillnet and in theMalaysian troll, purse-seine, and gillnet fisheries.
Although specific studies to identify the relationship of these fisheries to eachother have not been undertaken, one obvious hypothesis is that the Thai purse seinefishery is having an impact on the other types of fisheries. Catch rates of small tunas bythe Thai purse-seine fishery increased from 11 kg/day in 1973 to 522 kg/day in 1988;catch rates of other gears showed a general decline.
14.3 Im s ortance of Interactions for Fisheries Mana e e t
The preliminary analysis suggests that the Thai purse-seine fishery may beaffecting the magnitude, species, and size compositions of small tuna catches made byThai gillnet and Malaysian gillnet, troll, and purse-seine fisheries.
14.6 Scientific Problems to be Resolved
The study of interactions between fisheries for small tunas in the South China Seais of lesser importance than the assessment of the status of these stocks. Availableevidence suggests that the longtail tuna and kawakawa stocks are being affected byexploitation. Priority should be given to developing methods based on minimal datainputs for evaluating the status of these stocks.
14.7 Recommendations
The following recommendations were made; the list is not given in priority order:
The catch-and-effort data generated by the tuna-sampling programmes inThailand and Malaysia are essential to adequately assess the status of thestocks. The total landings of small tunas from the South China Sea are stillincreasing, but evidence indicates that some fisheries and some stocks arebeing affected by exploitation. Hence, there is a need to continuemonitoring the small tuna fisheries of Malaysia and Thailand in order toestablish a data base adequate for an assessment of the small tuna stocks.
Additional biological information is needed on the small tunas if the variousmethods that have been developed to study interactions are to be used.
14.8 Institutional Arrangements
The tuna-sampling programmes which would generate the required information forsmall tunas will be carried out by the Marine Fisheries Department of Thailand and theDepartment of Fisheries of Malaysia, with assistance from the Indo-Pacific TunaDevelopment and Management Programme (IPTP).
15. INFORMAL SESSIONS
During the Consultation several informal sessions were organized to discuss topicsof interest to participants. Included were southeast Asian fisheries interactions, easternPacific Ocean fisheries interactions, Pacific Islands perspectives, and E-mail. Thefollowing sections summarize these informal discussions.
15.1 Southeast Asian Fisheries Interactions
Mr. Mitsuo Yesaki introduced the topic and summarized the discussion that tookplace in the special session on southeast Asian fisheries interactions.
The Philippines and Indonesia are concerned about the effect increasing westernPacific skipjack and yellowfin tuna catch may have on the national fisheries for those
species. Both species are important to those countries, and the purse-seine fisheries ofdistant water fishing nations (DWFN) are located in the general proximity. It waspointed out that a great deal of fisheries data exists, as does tagging information; both setsof data need to be analysed further. The tagging data from the Philippines experiment areapparently inadequate for assessing movement; a low tag-return rate of only 1.5% was
41
42
noted. It was suggested that the tagging programme was focused on small fish and thathigh, intervening mortality is probably the reason that so few tags are returned. It wasnoted that only small and large yellowfin are captured in the Philippines, with nointermediate-sized fish present.
There is also concern in the Philippines that fisheries (ring-net or purse-seine)utilizing FADs are having negative impacts on small-scale fisheries. In many cases, thefisheries-interaction effects also require that social and economic issues be addressed.Some consideration is being given to closing areas within soine distance from shore(perhaps 15 km) to industrial fisheries, but the data are inadequate to justify such action.
In Indonesia, good time-series data are available for the pole-and-line fisheries.FADs have been introduced to this fishery in recent years. There is interest to determinethe effect FADs have had on this fishery and also on small-scale fisheries in neighbouringareas. The distances over which FADs exert an attractive force should be determined inorder to assess the potential for interaction. Studies on the number of FADs that caneffectively be used is important to local areas to make optimal use of this technology.
In Malaysia, there is concern about the interactions of small-tuna fisheries becausethe stocks of small tunas are spatially-restricted. The statistics on catch and CPUE fromthe tuna-sampling programme in Thailand have not been used for analysis of fisheriesinteraction because of their short duration. Catch trends suggest an interaction betweenthe Thai purse seiners and the traditional troll boats.
The general recommendations from this session included (1) stronger governmentsupport to allow the use of newer techniques to address these problems, (2) improvedstatistics throughout the region, and (3) resolution of stock boundaries.
15.2 Eastern Pacific Ocean Fisheries Interactions
Mr. Guillermo Compean described several issues in the eastern Pacific Oceanpurse-seine fisheries for yellowfin and skipjack tuna. These fisheries are changing interms of the composition of the fleet, as well as the components of the stock fished. Twodifferent size groups are being taken: older, larger yellowfin in porpoise sets, andyounger yellowfin and skipjack in other types of sets. There is also a distinct spatialcomponent of the fishery that may result in interactions. A variety of research is neededto study the interactions of all components of the eastern Pacific Ocean (EPO) fleet. Dr.Deriso pointed out that many aspects of this research are currently being carried out bythe Inter-American Tropical Tuna Commission (IATTC), which continues to conductresearch on the spatial and temporal aspects of tunas and their fisheries in the EPO. Thegeneral simulation model being developed by IA'TTC will address the effects of howchanges in one component of the fishery will affect another, particularly relating todifferent size or age groups of fish. It was concluded that all interested parties shoulddiscuss the research needed to address fisheries issues in the EPO and to develop researchand appropriate methodologies, while insuring that duplication of effort is kept to aminimum.

15.3 Pacific Island Perspectives
Mr. Noah Idechong discussed the results of an infOrmal session held to discussPacific Island perceptions of tuna-interaction issues, and to identify areas deserving ofconsideration under the Consultation. At an earlier meeting involving a wider group(representatives of developing countries), participants were asked to identify interactionissues in their area. A variety of interaction concerns was identified by the group, withemphasis on artisanal/industrial interactions and spatial-exclusion concerns associate,d withprotecting domestic fisheries. The need to continue improving area-coverage and qualityof data was also emphasized.
Noting these concerns, the informal session identified three avenues for furtheraction. These were:
Undertake a representative case study in a Pacific-island situation whereartisanal, domestic-commercial, and DWFN industrial fleets operate inproximity, and where reasonable data-coverage of all fisheries is available.The case study would include biological and economic analyses.
Continue development of general models to analyse fisheries interactions,to further the progress made so far with a movement model.
Assemble historical data from purse-seine fleets; increased coverageprovided by these data will facilitate interaction studies.
Mr. Idechong noted that the above actions, will provide representative benefits toPacific island countries in terms of enhancing their capability to address interactionissues, with the assistance and support of regional organisations (South PacificCommission and Forum Fisheries Agency).
The subsequent discussion considered the best candidates for such a representativecase study. Although the group identified no specific case study, it was noted that Palauand Kiribati were candidates because of the characteristics of their fisheries andavailability of past tagging data. In the case of Kiribati, for example, over 12,000 fishhave been tagged in the past year by the SPC's Regional Tuna Tagging Programme(RTTP). Some concern was voiced about the problems of non-reporting in artisanalfisheries, but this problem has been improved with better publicity of programmes; it hasbeen evident in the past year that these efforts by the RTIP are paying off.
Questions were also raised about the adequacy of existing methodology, such asthe Sibert/Fournier model, to address the interactions in such an island setting. It wasrevealed that the current modelling effort has been directed at skipjack tuna, and thatmodification to consider yellowfin tuna in these island settings would involve refinements
to the existing model. It was also pointed out that an interaction study has been proposedfor the domestic-pelagic fisheries around the main Hawaiian islands. Although the typesof fisheries in the latter case are less diverse than those desired for the study outline,dabove, it was noted that this study and its methods should be coordinated with anysubsequent study developed around other Pacific islands.
43
15.4 E-mail
Dr. Kleiber chaired the special session on e-mail, convened to introduceparticipants to electronic communication and data-file transfer. He discussed the systemscurrently in use, both commercial (fee-based) and organisational (often free or charging anominal connection fee). He pointed out that Mr. Les Allinson of the Forum FisheriesAgency is developing a proposal to have an e-mail and data-transfer system specificallytailored to fisheries and fisheries officers in the Pacific; the proposed system would utilizethe PEACESAT system. It was noted that the timetable for the PEACESAT proposalimplementation is uncertain. It is possible however, to use PEACESAT individually atpresent, for voice and data transmission at many locations throughout the Pacific. Acoordinated system targetted directly at fisheries is the intent of the proposal, and this willtake at least several months to implement. It was noted that there is no charge for the useof PEACESAT lines.
Dr. Kleiber noted that a good example of an e-mail system that goes torelatively-undeveloped regions is the ORSTOM system. Dr. Fonteneau stated thatORSTOM would gladly assist in developing this type of system. ORSTOM experts canhelp with development problems. This assistance, as well as providing access to thecurrent system, would probably be free in countries where ORSTOM is currently based.In other countries, there could be assistance given, but probably at some cost. Alltelephone-line costs within the ORSTOM e-mail system are charged to each user, butthese are minimal because of the reduced costs of data transmission. Dr. Kleibersuggested that it would be useful to widely distribute the document describing theORSTOM e-mail system, and suggested that each TUNET member should receive acopy.
16. GENERAL DISCUSSION
This session was convened to stimulate a general discussion among the participantsand to elicit thoughts and observations arising from the preceding sessions. As such, thecomments in the following text do not necessarily represent the consensus opinion of theparticipants. The session began with a series of general observations by the Chair Mr.Richard Shomura. He noted that, although he was concerned with the limited scope ofdiscussion during some of the sessions, he was pleased with the written material providedby the working groups. As an example, he noted that little time was spent on fisheriesinteractions where the available data are lacking or only partially available, such as in thePhilippines. He also noted that the general sessions spent too little time on anticipatedfuture interactions. There is a lot taking place in tuna-resource development in thePacific, and he stated that this group is perhaps best suited to anticipate data needs andpotential interaction problems. It was noted that fisheries interaction problems in thefuture will most likely occur in those stocks that are currently exploited at a near-optimallevel. The assumption is that these fisheries will eventually be subject to over-exploitation, so potential interaction problems should be explored before that occurs.
Mr. Shomura noted that in any large group with diverse scientific disciplines andexpertise, developing a dialogue is difficult due to differing interest levels in the range oftopics at hand. He suggested that this may have hindered discussions at this Consultation.As an example, he pointed out that modellers should recognize that many participants
44
45
were not capable of evaluating the mathematics of the models and that they shouldtherefore be careful to communicate their findings and approach in a language easilyunderstood. Likewise, biologists should take great pains'to effectively communicate theirresults to modellers to ensure the maximum use of biological or fisheries data.
In addition to improving communication between biologists and modellers, it waspointed out that good fisheries management adopts a comprehensive point of view, notsimply concentrating on any component parts; informed decisions require a variety ofinput. One must deal with the "trade-off" of gaining further types of information anddetermining whether the added cost is justified. This should be a common approach indeciding where to put limited research funds. If the benefits are small relative to theresearch costs, we should carefully examine the need for that research. The consensus onthis issue se,emed to be that informed decisions require input from a range of disciplinesand expertise and that communication among the people involved is therefore crucial.
Mr. Shomura covered several issues related to methodology. Most modellingwork requires movement data (typically from tagging), catch-and- effort data, andbiological data. He noted specifically that despite 40 years of research and datagathering, tuna scientists still seek improvement in these sources of information.
In tagging data, there remain problems with tagging mortality, tag shedding, andnon-reporting and/or incomplete reporting (returning tags with incomplete recapture data).It was pointed out that methods which do not rely on some level of reporting are of realimportance to understanding the interaction problem. Although this generated somedissenting views, most agreed that modelling efforts must estimate non-reporting in somemanner, and take into account the impacts of this problem. Various means of minimizingthe problem were discussed in detail, including tag seeding, improved port sampling,rewards, and observer coverage. It was also pointed out that the improvements in taggingover the last decade in the Pacific have been significant. The group was also remindedthat alternative methods for assessing movement need to be discussed, including archivaltags, remote-sensing methodology, and other high-technology applications that mayadvance the quality and quantity of information presently generated in tagging studies.Finally, the difference between estimation and forecasting of tuna movements was noted.Tagging experiments are good for estimating movement, but one can question their usefor forecasting it; the issue is extrapolation beyond one's data, and this will apply togeneralities about interactions, as well. If exploitation increases, are data on movementpatterns collected earlier still useful? In the eastern Pacific Ocean, experience has shownthat tagging experiments in different years can give contrasting estimates of movement,resulting in a bias depending upon when the work was done. The need to understand thebiological rationale for movement is important, i.e., to answer the question "why do thefish move?" Understanding the causes of variation in movement is inherently important,and must be related to physical, chemical, and biological conditions in the ocean.
Fisheries catch and effort data were then discussed, and the continued need forimproved data was identified. In the Pacific, there is no ocean-wide database that insuresthat good catch-and-effort data are available. Development of methods to standardizeeffort based on gear type, fishing power, effect of FADs, has lagged, possibly due, atleast partly, to lack of such a data base. The overall improvement of measures of effortwas briefly discussed, and all agreed that such improvements are needed. It was

46
suggested that a common data apparatus would help solve many data- related problems;this has been effective in other oceans.
In the area of biological data, tuna scientists have been collecting these for years,but even many basic types of information are not available in some of the are,as wherethey are needed. Current data on maturation, spawning, growth, and natural mortality intunas are insufficient in some areas. In terms of stock structure, morphometric andmeristic data have been studied for years and are now being reconsidered, indicating theimportance of spatial structure to the modelling efforts currently underway.
Models of fisheries interaction integrate all of these sources of information.General simulation models are quite useful, so that "what-if" questions can be asked,particularly as they relate to impacts on the stock. The question of fleet dynamics,however, must also be addressed. If fleets are dislocated by management, potentialchanges in interaction will likely occur and should be taken into account.
A final issue raised concerned interaction effects near islands as a subset of themore global interaction effects. In the Philippines, for example, local and distant waterfishery interactions must be considered; results obtained there may be applicable to otherlocations. The Philippines situation may not be unique if the same range of samplingtypes was used in other island areas, but the apparent magnitude of yellowfin tuna nurserygrounds in the Philippines is probably unique. In Hawaii, the longline fishery takes largeyellowfin that are not evident in many other island areas. The lack of large yellowfintuna near other islands does not necessarily mean that they are not there, but perhaps thatthey are not subject to a fishery. Finally, compared to the open ocean, nearshore watersof islands appear to be characterized by high levels of spawning by several species oftunas, e.g., yellowfin. Additional biological research will be needed to be incorporatedinto any interaction studies around islands. It was agreed that several appropriate sitesmay exist for local-interaction studies. The local interactions issue has an additionalbenefit in that adaptive management approaches may be used; manipulative experimentscan address many questions about fisheries interaction. Research on local interactionstudies may assist progress on larger-scale interactions.
17. RECOMME ATIONS
The Consultation reviewed a summary of the technical recommendations made inthe session reports and a general recommendation of possible follow-up action.
17.1 Technical Recommendations
During the course of the Consultation, extensive discussions were held on "state ofthe art" methodologies to study tuna interactions. It became apparent that substantiallymore work needs to be done to develop models, especially simulation models, thatincorporate fisheries information, resource assessment information, and biologicalinformation.
The specific recommendations resulting from the Consultation can be found in theappropriate sections of the session reports. The majority of these specificrecommendations can be grouped into six major categories as follows:
17.1.1 Methodology
Effort should be increased in developing models, eSpecially simulation models,that integrate fisheries statistics, movement information, assessment information, andbiological information.
17.1.2 Resource assessment
Effort should be increased to obtain resource assessment information which can beincorporated into tuna interaction studies. The list includes horizontal and vertical spatialmovements and age-structure information.
17.1.3 Fisheries statistics
Effort should be drastically increased to improve the quality and quantity offisheries statistics needed to understand tuna interaction issues and the tuna resources.
17.1.4 Tagging
Effort should be increased while carrying out tagging experiments to provideinformation on tuna movement and population assessment studies. An important aspect ofthese studies should be the defining of statistical properties of the tagging results.
17.1.5 Biological and ecological
Effort should be increased to undertake biological and ecological studies of tunasthat relate to the interaction issues. Included in the needed research is some basicinformation on life history parameters, e.g., age and growth, maturation and spawning,mortality and time-and-space movements. Particular attention should be paid to the tuna-environment relationship as it affects all aspects of tuna science.
17.1.6 Management
The "decision theory" methodology (Medley, this document) should be consideredin fisheries management where choices need to made in addressing interaction issues.
17.2 General Recommendations
The Consultation recognized the importance of tuna-fisheries interactions,particularly for developing countries, and the possible funding limitations to adequatelyaddress all fisheries-interaction issues. The Consultation recommended that:
a) FAO review and update guidelines for proposals to seek funding forinteraction studies and distribute these through the TUNET network.
47
b) FAO develop procedures for the review and establishment of priorities forresearch proposals related to studies of interaction issues.

48
FAO ensure that adequate funding is available to conduct approvedresearch proposals on interaction issues.
If funds available through the FAO Trust Fund Project (CooperativeResearch on Interaction of Pacific Tuna Fisheries) are insufficient toimplement projects judged worthy of funding, FAO should seek additionalresources adequate to meet identifie,d ne,eds.
18. CLOSING SESSION
Before the Consultation was closed during the afternoon of 11 December 1991,Dr. Majkowski thanked SPC and ORSTOM for hosting the Consultation and thanked allindividuals for their active participation and contribution during the Consultation. Mr.Shomura in closing the Consultation extended his personal thanks to participants forbearing with him as Chair and concluding, in his opinion, a very successful and fruitfulmeeting.

49
APPENDIX A. Provisional Agenda.
FAO EXPERT CONSULTATION ON INTERACTIONSOF PACIFIC TUNA FISHERIES
Noumea, New Caledonia3-11 December 1991
Provisional Agenda
3 December 1991 (Tuesday)
08.30 - 09.00 Registration (SPC conference room foyer)09.00 - 10.00 Preliminaries (SPC conference room)10.30 - 12.00 Opening of the Consultation (ORSTOM)12.00 - 01.30 Lunch breakAfternoon Types of Tuna Fisheries Interaction and Related Scientific Problems
Scientific Methods for Studying Tuna Fisheries Interactions18.30 - 20.30 Cocktail Party
4 December 1991 (Wednesday)
Morning Scientific Methods for Studying Fisheries Interactions (cont.)Afternoon Interactions of Pacific Slcipjack FisheriesEvening Informal discussions
5 December 1991 (Thursday)
Morning Interactions of Eastern Pacific Yellowfin Tuna FisheriesAfternoon Interactions of Western Pacific Yellowfin Tuna FisheriesEvening Informal discussions
6 December 1991 (Friday)
Morning Interactions of North Pacific Albacore FisheriesMorning/Afternoon Interactions of South Pacific Albacore FisheriesAfternoon Interactions of Pacific Bigeye Tuna (PBT) FisheriesEvening Informal discussions
7 December 1991 (Satm-day)
All day Additional sessions if required, or excursions and free time.
8 December 1991 (Sunday)
Morning Demonstration of Computer Software Related to Studying TunaFisheries Interactions (Informal Session)
Afternoon Scientific Methods for Studying Fisheries Interactions (InformalSession)

9 December 1991 (Monday)
Morning Interactions of Pacific Northern Bluefin Tuna FisheriesMorning/Afternoon Interactions of Southern Bluefin Tuna FisheriesAfternoon Session on Interactions of Pacific Small Tuna FisheriesEvening Informal discussions
10 December 1991 (Tuesday)
Morning Reports from Informal Sessions and General DiscussionsAfternoon Formulation of Recommendations19.00 - 22.00 Barbecue at SPC
11 December 1991 (Wednesday)
Morning Additional session if requiredAfternoon Distribution of the Report
Summary of the Consultation by the Consultation and SessionChairmen
50

51
APPENDIX B. List of Participants.
FAO EXPERT CONSULTATION ON INTERACTIONSOF PACIFIC TUNA FISHERIES
Noumea, New Caledonia3-11 December 1991
List of Participants(Current known address as of October 1993)
Ms. Flerida ArceBureau of Fisheries & Aquatic ResourcesDepartment of Agriculture860 Quezon Avenue, Quezon CityMetro Manila 3008 PHILIPPINESTel: (632) 965498/965428Fax: (632) 988517Tlx: 23149/64111
Dr. Norman BartooSouthwest Fisheries Science CenterNational Marine Fisheries ServiceLa Jolla, California 92038 USATel: (619) 5467000Fax: (619) 54677003Tlx: 3734386 UC WWD SIO SDG (USA)E-Mail net: OMNETE-Mail add: N.BARTOO
Mr. Noel BarutBureau of Fisheries & Aquatic ResourcesResearch Division860 Quezon Avenue, Quezon CityPHILIPPINESTel: (632) 991249/965428Fax: (632) 988517
Dr. William BayliffInter-American Tropical Tuna Commission8604 La Jolla Shores DriveLa Jolla, California 92037 USATel: (619) 5467025Fax: (619) 5467133Tlx: 697 115 TUNACOME-Mail net: BITNETE-Mail add: WBAYLIFF 8604 UCSD
Dr. George BoehlertSouthwest Fisheries Science CenterNational Marine Fisheries ServiceP.O. Box 831Monterey, California 93942 USATel: (408) 656-4689 or 656-3311Fax: (408) 656-3319E-Mail net: OMNETE-Mail add: G.BOEHLERT,Internet [email protected]
Dr. Chris BoggsHonolulu LaboratorySouthwest Fisheries Science CenterNational Marine Fisheries Service2570 Dole StreetHonolulu, Hawaii 96822-2396 USATel: (808) 943-1222Fax: (808) 943-1290E-Mail net: BITNETE-Mail add: T110700@UHCCMVS
Mr. John BungitakMarshall Islands Marine Resources
Authority (MIMRA)Ministry of Resources & DevelopmentP.O. Box 860Majuro, MARSHALL ISLANDS 96960Tel: (692) 3262, 3202, 3206Fax: (692) 3685Tlx: 730-0927

Mr. Albert CatonBureau of Rural ResourcesDepartment of Primary Industries &
EnergyP.O. Box Ell Queen Victoria TceParkes ACT 2600 AUSTRALIATel: (616) 272-5287Fax: (616) 272-4013
Mr. Atilio CoanSouthwest Fisheries Science CenterNational Marine Fisheries ServiceP.O. Box 271La Jolla, California 92038 USATel: (619) 546-7000Fax: (619) 546-7003Tlx: 3734386E-Mail net: SCIENCEnetE-Mail add: A.Coan
Mr. Guillermo CompeanUniversidad Autonoma de Nuevo LeonFacultad de Ciencias BiologicasA.P. 16-FCiudad Universitaria66450 San Nicolas de Los GarzaN.L. MEXICOTel: (52 83) 522139Fax: (52 83) 762813
Dr. Richard DerisoInter-American Tropical Tuna Commission8604 La Jolla Shores DriveLa Jolla, California 92037 USATel: (619) 546-7100Fax: (619) 546-7133Tlx: 697 115 TUNACOME-Mail net: BITNETE-Mail add: [email protected]
Mr. Sylvester DiakeFisheries DivisionMinistry of Natural ResourcesP.O. Box G24Honiara, SOLOMON ISLANDSTel: (677) 30107Fax: (677) 30256Tlx: 66465 SOLFISH
52
Ms. Chee Phaik EanFisheries Research InstituteDepartment of FisheriesMinistry of Agriculture11700 GlugorPenang, MALAYSIATel: (04) 872777, 873150Fax: (604) 876388Tlx: MA 28157
Dr. Alain FonteneauInstitut Senegalais de Recherches
OceanographiquesCentre de Recherches OceanographiquesB.P. 2241, Dakar, SENEGALTel: (32) 340534/340462Fax: (221) 324307 ORSTOM DAKARTlx: 468 ORSTOM SGE-Mail net: FNETE-Mail add: FONTENEA%0RSTOM.FR
Dr. David FournierOtter Research Ltd.Box 265, Station ANanaimo, B.C. V9R 5K9 CANADATel: (604) 756-0956Fax: (604) 2482531E-Mail net: INTERNETE-Mail add: [email protected]
Mr. Reuben GanadenBureau of Fisheries & AquaticResources, Department of AgricultureArcadia Building860 Quezon Avenue, Quezon City3008 PHILIPPINESTel: (632) 991249/987075Fax: (632) 988517/965444
Ms. Sofia Ortega GarciaCentro Interdisciplinario de
Ciencias MarinasApartado Postal 592La Paz, Baja California SurMEXICOTel: (91 682) 25366/25322/25344Fax: (91 682) 25322

Mr. Robert GillettMinistry of FisheriesP.O. Box 871Nuku'alofa, KINGDOM OF TONGATel: (676) 21399Fax: (676) 23891
Dr. John HamptonSouth Pacific CommissionB.P.D5, Noumea, NEW CALEDONIATel: (687) 262000Fax: (687) 263818Tlx: SOPACOM 3139 NME-Mail net: BITNETE-Mail add: DASNET, USER,
MP 1 SH 66/USA
Mr. Victor Gomez MunozCentro Interdisciplinariode Ciencias Marinas
Apartado, Postal 592La Paz, Baja California SurMEXICOTel: (682) 25322/25344/25366Fax: (682) 25322
Dr. Bill HearnDivision of FisheriesCSIRO Marine LaboratoriesGPO Box 1538Hobart, Tasmania 7001 AUSTRALIATel: (6102) 20-6222Fax: (6102) 24-0530
Mr. Noah IdechongChief Marine Resources DivisionMinistry of National ResourcesP.O. Box 100Koror, PALAU 96940Tel: (680 9) 488-2266Fax: (680 9) 488-1475, 488-1725
53
Mr. Yoshio IshizukaNational Research Institute of Far SeasFisheries
7-1, Orido 5-ChomeShimizu-shi 424 JAPANTel: (0543) 340715Fax: (0543) 359642Tlx: 03965689FARSEA JE-Mail net: OMNETE-Mail add: J.SUZUKI
Mr. Erwan JosseORSTOMB.P. 529Papeete, TahitiFRENCH POLYNESIATel: (689) 43 98 87Fax: (689) 42 95 55E-Mail net: FNETE-Mail add: ORSTOM.ORSTOM.FR
JOSSE@
Dr. Pierre KleiberSouthwest Fisheries Science CenterNational Marine Fisheries ServiceP.O. Box 271La Jolla, California 92038 USATel: (619) 546-7076Fax: (619) 546-7003Tlx: SOPACOM 3139 NME-Mail: [email protected]
Dr. Marc LabelleSouth Pacific CommissionB.P. D5Noumea CedexNEW CALEDONIATel: (687) 262-000Fax: (687) 263-818Tlx: SOPACOM 3139 NME-Mail net: bitnetE-Mail add: DANET.USER/MEP.1SM66/USA

Mr. Philip LangfordDepartment of Marine and WildlifeResources
P.O. Box 3730Pago Pago, AMERICAN SAMOA 96799Tel: (684) 633-4456Fax: (684) 633-5944
Mr. Viliami LangiRDA InternationalP.O. Box 83Vavau, KINDGOM OF TONGATel: (676) 70055Fax: (676) 70130
Dr. Antony D. LewisTuna and Billfish Assessment ProgrammeSouth Pacific CommissionB.P. D5Noumea Cedex, NEW CALEDONIATel: (687) 262000Fax: (687) 263818Tlx: SOPACOM 3139 NM
Ms. Dorothy LowmanWestern Pacific Regional Fishery
Management Council1164 Bishop Street #1405Honolulu, Hawaii 96813 USATel: (808) 523-1368Fax: (808) 526-0824
Dr. Jacek MajkowskiNF 512, FIRMFood and Agriculture Organization of theUnited Nations
Via delle Terme di Caracalla00100 Rome ITALYTel: (396) 52256656Fax: (396) 52253020 or 52256656Tlx: 600181 FAO IE-Mail net: INTERNETE-Mail add: [email protected]@INTERNET
54
Dr. Naozumi MiyabeNational Research Institute of Far SeasFisheries
7-1, Orido 5-ChomeShimizu-shi 424 JAPANTel: (543) 340715Fax: (543) 359642Tlx: 03965689FARSEAJ
Mr. Arturo Muhlia-MeloBiological Research CenterKM 2 Carr San Juan de La CostaEL COMITAN Apdo Postal 128La Paz, Baja Califonia SurMEXICO CP 23000Tel: 52 (682) 53633/53626Fax: 52 (682) 53625Tlx: CIBPME 52223
Dr. Paul MedleyFisheries DepartmentTurks & Caicos IslandsWEST INDIESTel/Fax: (809) 946 2970
Dr. Talbot MurrayResearch CentreMAFF FisheriesP.O. Box 287Wellington, NEW ZEALANDTel: (644) 386-1029Fax: (644) 386-1299Tlx: MAFFCC NZ 30049E-Mail net: USENETE-Mail add: TEM%FRCMAFGOVTNZ
Dr. Nurzali NaaminResearch Institute for Marine FisheriesKomplek PelabuhanPerikanan SamuderaJI, Muara Baru UjingJakarta Utara INDONESIAFax: (6221) 570-9158

Mr. Paul NicholsForum Fisheries AgencyP.O. Box 629Honiara, SOLOMON ISLANDSTel: (677) 21124Fax: (677) 23995
Dr. Yeong Chu11 ParkDeep-Sea Resources DivisionNational Fisheries Research &Development Agency
Shirang-ri, Kijang-up, Yangsan-gunKyoungsangnam-do 626-900REPUBLIC OF KOREATel: (051) 465 0091
(0523) 361 8052Fax: (0523) 361 8076Tlx: K 52647
Dr. Tom PolacheckDivision of FisheriesCSIRO Marine LaboratoriesG.P.O. Box 1538Hobart, Tasmania 7001, AUSTRALIATel: (61) 02 206222Fax: (61) 02 240530Tlx: AA 57182
Mr. Renaud PianetORSTOMB.P. A5Noumea CedexNEW CALEDONIATel: (687) 261000Fax: (687) 264326Tlx: ORSTOM 3193 NME-Mail net: FNETE-Mail add: IANET%ORSTOM.FR
Mr. Andrew RichardsResearch & Survey BranchDepartment of Fisheries and
Marine ResourcesP.O. Box 165Konedobu, PAPUA NEW GUINEATel: (675) 214522Fax: (675) 214369
55
Mr. Carlos Salvad6Southwest Fisheries Science CenterNational Marine Fisheries ServiceP.O. Box 271La Jolla, CA 92038 USATel: (619) 546-7000Fax: (619) 546-7003Tlx: 3734386 UC WVVD STO SDG (USA)E-Mail: [email protected]
Mr. Richard ShomuraSchool of Ocean and Earth ScienceHawaii Institute of Marine BiologyUniversity of Hawaii, Manoa1000 Pope RoadHonolulu, Hawaii 96813 USATel: (808) 956-6715Fax: (808) 956-6751
Dr. John SibertPelagic Fisheries Research ProgramJIMAR, University of Hawaii1000 Pope RoadHonolulu, Hawaii 96822 USATel: (808) 856-4109Fax: (808) 956-4104E-Mail net: INTERNETE-Mail add: [email protected].
Dr. Ziro SuzukiNational Research Instituteof Far Seas FisheriesShimizu-shi 424 JAPANTel: (543) 340715Fax: (543) 359642Tlx: 03965689FARSEAJE-Mail net: OMNETE-Mail add: J.SUZUKI
Mr. Jacobus C.B. UktolsejaTuna Research and Programme DivisionResearch Institute for Marine FisheriesJ1. Muara Baru UjungKomplek Pelabuhan Perikanan Samudera(Jakarta Fishing Port)Jakarta 14440 INDONESIATel: (6221) 6602044Fax: (6221) 661-2137

Mr. Hugh WaltonSouth Pacific CommissionB.P.D5Noumea, NEW CALEDONIATel: (687) 262000Fax: (687) 263818Tlx: SOPACOM 3139 NM
Mr. Peter WardFisheries Resources BranchBureau of Rural ResourcesP.O. Box El 1Queen Victoria TerraceParkes ACT 2600 AUSTRALIATel: (61) 6272 5534Fax: (61) 6272 4014
Dr. Alex WildInter-American Tropical Tuna Commission8604 La Jolla Shores DriveLa Jolla, California 92037 USATel: (619) 546-7100Fax: (619) 546-7133Tlx: 697 115 TUNACOME-Mail net: BITNETE-Mail add: AWILD%UCSD.EDU
Mr. Mitsuo Yesaki6180 Steveston HighwayRichmond, B.C. CANADA V7E 2K8
56

Consultation Chair:
Vice-Chair:
Convenor andTechnical Secretary:
ConsultationSecretaries
Local Organisers:
57
APPENDIX C. Organisation of Consultation.
FAO EXPERT CONSULTATION ON INTERACTIONSOF PACIFIC TUNA FISHERIES
Noumea, New Caledonia3-11 December 1991
Organisation of Consultation
Mr. Richard S. ShomuraHawaii Institute of Marine BiologySchool of Ocean and Earth Science and TechnologyUniversity of Hawaii, Manoa
Dr. Ziro SuzukiNational Research Institute of Far Seas FisheriesJapan Fisheries Agency
Dr. Jacek MajkowskiMarine Resources ServicesFishery Resources and Environment DivisionFood and Agriculture Organization of the United Nations
Mr. Robert GillettFAO/UNDP South Pacific Regional Fisheries Programme
Mr. Hugh WaltonFAO/UNDP South Pacific Regional Fisheries Programme
Dr. Antony LewisTuna and Billfish Assessment ProgrammeSouth Pacific Commission
Mr. Renaud PianetInstitut Francais de Recherche pour le Developpement en
Cooperation (ORSTOM)

58
APPENDIX D. List of Documents.
FAO EXPERT CONSULTATION ON INTERACTIONSOF PACIFIC TUNA FISHERIES
Noumea., New Caledonia3-11 December 1991
List of Documents
Evaluation of albacore tuna fishery interaction by use of a simulation model (P.Kleiber and B. Baker)
Interactions between two fisheries: a tag- recapture method for estimating theeffects on catches of changing fishing intensity (W. Hearn and A. Mazanov)
Interaction between tuna fisheries in the Federated States of Micronesia (J. Sibert)
A review of skipjack tuna biology and fisheries in the Pacific Ocean (A. Wild andJ. Hampton)
A review of yellowfin tuna biology and fisheries in the eastern Pacific Ocean (A.Wild)
A review of the biology and fisheries for yellowfin tuna, Thunnus albacares, inthe western and central Pacific Ocean (Z. Suzuki)
A synopsis of the biology and fisheries for North Pacific albacore, Thunnusalalunga (N. Bartoo and T. Foreman)
A review of the biology and fisheries of albacore tuna in the southern PacificOcean (T. Murray)
General, review for Pacific bigeye tuna (N. Miyabe)
A review of information on the biology of northern bluefin tuna, Thunnus thynnus,and the fisheries for this species in the Pacific Ocean (W. Bayliff)
Review of aspects of southern bluefin tuna biology, populations, and fisheries(A.E. Caton, editor)
A review of the Auxis fisheries of the Philippines and some aspects of the biologyof frigate (A. thazard) and bullet (A. rochei) tunas in the Indo-Pacific region (M.Yesaki and F. Arce)
A review of the biology and fisheries for longtail tuna (Thunnus tonggol) in theIndo-Pacific region (M. Yesaki)

59
A review of the biology and fisheries for kawakawa (Euthynnus affinis) in theIndo-Pacific region (M. Yesaki)
A tag release-recovery method for predicting the effect of changing the catch ofone component of a fishery upon the remaining components (J. Majkowski, W.Hearn and R. Sandland)
Population field theory for tag analysis and fisheries modeling: the empiricalpropagator (C. Salvadó)
Status of Korean tuna longline and purse-seine fisheries in the Pacific Ocean (Y.C.Park, W.S. Yang and T.I. Kim)
The Mexican tuna fishery (A. Muhlia-Melo)
Relationship between sea surface temperature and dolphin-associated fishingactivities by the Mexican tuna fleet (V.M. Gomez-Monoz and S. Ortega-Garcia)
Types of fishery interaction in the Pacific Ocean and methods of assessinginteraction (P. Kleiber)
Discrete population field theory for modeling fisheries interaction based on taggingdata (C. Salvad6)
Assessment of skipjack fishery interaction in the eastern tropical Atlantic usingtagging data (P. Kleiber, and A. Fonteneau)
Evaluation of diffusion advection equations for the estimation of movementpatterns from tag-recapture data (J. Sibert and D. Fournier)
Methods of analysing interaction in Hawaii's pelagic fisheries (C. Boggs)
A review of skipjack fishery interaction in the western and central Pacific Ocean(J. Hampton)
Skipjack tuna fishery interaction in the Solomon Islands: an example of small scalespatial interaction with FADs as an influencing factor (P. Kleiber and J. Hampton)
A brief review of interaction between purse-seine and longline on yellowfin tunaThunnus albacares, in the western and central Pacific Ocean (Z. Suzuki)
U.S. distant water and artisanal fisheries for yellowfin tuna in the central and
western Pacific (A. Coan)
Taiwanese yellowfin fisheries in the Pacific Ocean (C. Wang)
The interactions of yellowfin tuna fisheries in the eastern part of Indonesian waters
(N. Naamin and E. Bahar)

60
Estimating the impact of purse seine catches on longline (P. Medley)
Evidence of interactions between high seas driftnet fisheries and the NorthAmerican troll fishery for albacore (N. Bartoo and D. HoIts)
Examples of interactions among fisheries exploiting the southern Pacific albacorestock (T. Murray)
Application of SSA method in South Pacific albacore, 1971-1989 (C. Wang)
A brief analysis of fishery interaction betwe,en fisheries for Pacific bigeye tuna,Thunnus obesus in the Pacific Ocean (N. Miyabe)
Interactions among fisheries for northern bluefin tuna, Thunnus thynnus, in thePacific Ocean (W. Bayliff)
Commercial and recreational components of the southern bluefin tuna (Thunnusmaccoyii) fishery (A.E. Caton)
Interactions among fisheries for southern bluefin tuna (T. Polacheck)
Interactions between fisheries for small tunas off the South China Sea coast ofThailand and Malaysia (M. Yesaki)
Skipjack pole-and-line fishing in east Indonesia: effect of location upon catch sizeand catch variability, with and without FADs, and other interactive effects (J.K.McElroy and J.C.B. Uktolseja)
A review of tuna fishery interaction in the western and central Pacific Ocean (J.Hampton)
61
TYPES OF TUNA FISHERY INTERACTIOP,T IN THE PACIFIC OCEANAND METHODS OF ASSESSING INTERACTION
Pierre KleiberSouthwest Fisheries Science Center
National Marine Fisheries Service, NOAALa Jolla, California 92038 U.S.A.
ABSTRACT
Fishery interaction can be classified by the causal mechanisms by which onefishery can affect another. This paper focuses on mechanisms of direct competitionfor the same fish stock. This type of interaction can occur between two fisheriesoperating in overlapping or separated fishing grounds and between fisheries harvestingthe sarne or different size classes or life stages of the target species. Characteristicsof tuna that pertain to the mechanisms of competitive interaction are their migratorynature, fast growth, and high fecundity. Relevant characteristics of the fisheries arethe range of gear types and the geographic and temporal deployment of fleets.
A second way to classify fishery interaction is by the type of index used to mea-sure it. There are proxy indices, and also indices that attempt to directly measurethe impact of one fishery on another. The choice of index can affect the results ofthe assessment. A simple model presented in this paper gives an example of howwith increasing effort in one fishery, the measured impact on another can increasein severity according to one type of index and can decrease in severity according toanother.
Various strategies for estimating interaction indices are reviewed, including anal-ysis of fishery statistics, analysis of tag data, and use of models. Analytical modelsapplied to data such as fishery statistics and tagging data can be used to estimaterelevant parameters of population, harvest and movement dynamics. Simulationmodels can be used to conduct experimental manipulations aimed at testing forfishery interaction manipulations that are not feasible in the real world.
1. INTRODUCTION
The tuna fisheries in the Pacific are a complex mixture of several gear typesand fleet characteristics. Gear types include hand line, troll, pole and line, purseseine, gill net, and longline. Fleet characteristics range from local artisana1 fisheriesto local industrial fisheries to large fleets from several distant water fishing nations(DWFNs). The characteristics of the tuna stocks are also complex. There are severaleconomically important tuna species in the tropical and temperate waters of thePacific. All are pelagic animals, roaming freely in the oceanic environment, but thenature of their wandering varies considerably from species to species.
In the central and western tropical Pacific, where islands are plentiful, the oceansurface is covered by a mosaic of economic zones of the island countries, most of
FAO LIBRARY AN: 346113
62
which are home to small-scale, artisanal fisheries, and some of which have developedlocal, industrial-scale fleets. Superimposed on the mosaic and on the internationalwaters are broad and partially overlapping fishing grounds of DWFN fleets. Most ofthe gear types listed above can be found in both local and DWFN fleets. Some fleetsmake extensive use of fish aggregating devices (FADs) which attract concentrationsof tuna. Some fleets are aided in locating concentrations of tuna by aircraft, radar,sonar and other electronic gear, and for other fleets such assistance is unavailableor infeasible. The situation is rife with possibilities for interaction among variouscombinations of the different fisheries.
This paper is a review of the types of fishery interaction that might occur amongtuna fisheries in the Pacific Ocean. The purpose is to set the stage for the work ofthe Expert Consultation on Interactions of Pacific Tuna Fisheries (hereafter "theconsultation") in considering methods to assess fishery interaction and in investigat-ing specific instances of actual or suspected fishery interaction. What constitutes a"fishery", we will purposefully leave vague. It could be a fleet, a management unit,an industrial unit, or even a sub-grouping within a fleet any delineation of a groupof fishermen who might be concerned about impacts on them resulting from activitiesof another group.
We will examine two basic ways to classify fishery interaction. One way con-siders the biological and fishery-related mechanisms by which one fishery may affectanother. Because our focus is on tuna fisheries in the Pacific, we will review generalfeatures of tuna biology and behaviour, and of the Pacific tuna fisheries, and we willnote those features that could help, or hinder, the effects of one fishery being visitedupon another. Details of specific fish stocks, regions, and fisheries will be presented inother working papers.
The second classification of fishery interaction considers the type of metric wechoose to assess interaction. To have an objective assessment, we need to measuresomething, and it turns out that there is a variety of possible types of interactionindex to choose from. We shall see that different indices have different propertieswhich in some cases can lead to different assessments of the seriousness of interaction.We will consider indices of interaction not only from the point of view of fisheriesscientists but also of those who might make use of the results of an interaction as-sessment, for example, fisherics administrators making management decisions orconducting negotiations with other fisheries administrators.
The discussion of what to measure naturally leads to discussion of how to mea-sure. We will review some of the methods that have been used. For an exhaustivereview of methods, see Anonymous (1988).
2. CLASSIFICATION OF FISHERY INTERACTION MECHANISMS
The mechanisms of fishery interaction can be loosely categorized into impacts ofone fishery on another mediated by effects on a common resource stock and impactsunrelated to the resource stock. We will dispense with the latter category quicklybecause it will probably get little attention in the consultation. It includes non-harvest competition such as competition in marketing and a variety of other types

63
of interaction not mediated by effects on the resource population gear interference,for example.
Resource-mediated interaction comprises direct competition between fisheriesharvesting the saxne or overlapping resources and secondary effects of one fisheryon another's resource. Secondary effects include impact by one fishery on the envi-ronment of the target species of a second fishery. For exarnple, harvesting the foodresource of another fishery's target species might havea significant effect on thatspecies. Such an interaction is theoretically possible but is not known to be signifi-cant in tuna fisheries. Another secondary effect would be over-harvest of spawningstock (known. as "recruitment over-fishing") by one fishery which could depress theresource of another fishery (and presumably of the first fishery as well). Exceptpossibly for southern bluefin tuna, recruitment over-fishing has never been thoroughlydocumented in tuna fisheries.
It is the category of interaction through harvest competition that will likely drawmost of our attention in this consultation, and from now on this is what we will meanby the unnaodified term "competition". This is where one fishery harvests animalsthat would otherwise be destined to be harvested by another fishery. The fish stockin question does not need to be the principal target of both fisheries. The targetstock of one fishery may well be by-catch of another, and that by-catch rnay have asignificant impact on the stock, thereby affecting the fishery that targets it.
A general property of this kind of interaction is that the overall exploitation rateaffects the severity of interaction. In the case of lightly exploited stocks, most fish aredestined to die naturally. Therefore a particular fish caught in one fishery is unlikelyto have been otherwise d.estined to be harvested by another fishery. Thus competitionbetween fisheries for lightly exploited stocks would be less than for heavily exploitedstocks.
It is not necessary for two fisheries to target the same size range or life stageof the fish for competitive interaction to occur. If fish are exposed to a series offisheries as they grow in size or pass through stages of their life cycle, we can haveconsecutive interaction where fisheries harvesting early stages may have an effect onfisheries harvesting later stages, but, where the converse is less likely to be true. Anexception would be recruitment overfishing by a later-sta,ge fishery, but that would bea secondary effect rather than direct competition in our classification. If two fisheriesharvest the same size classes or life cycle stages, we have concurrent interaction wherethe effects can go both ways. Of course there can be intermediate situations wheresize distributions of the catch in different fisheries overlap, but are not completelycongruent.
It is furthermore not necessary for competing fisheries to operate in the samegeographic area. Certainly we would expect that fisheries could intera,ct with eachother if they operate in congruent or proximal fishing grounds (coincident interac-tion), but given that fish can migrate from one area to another or exchange diffusivelybetween two regions, it is entirely possible for fisheries located at some distance fromeach other to interact competitively (remote interaction). With diffusive movementwe would expect the severity of remote interaction to diminish with distance between
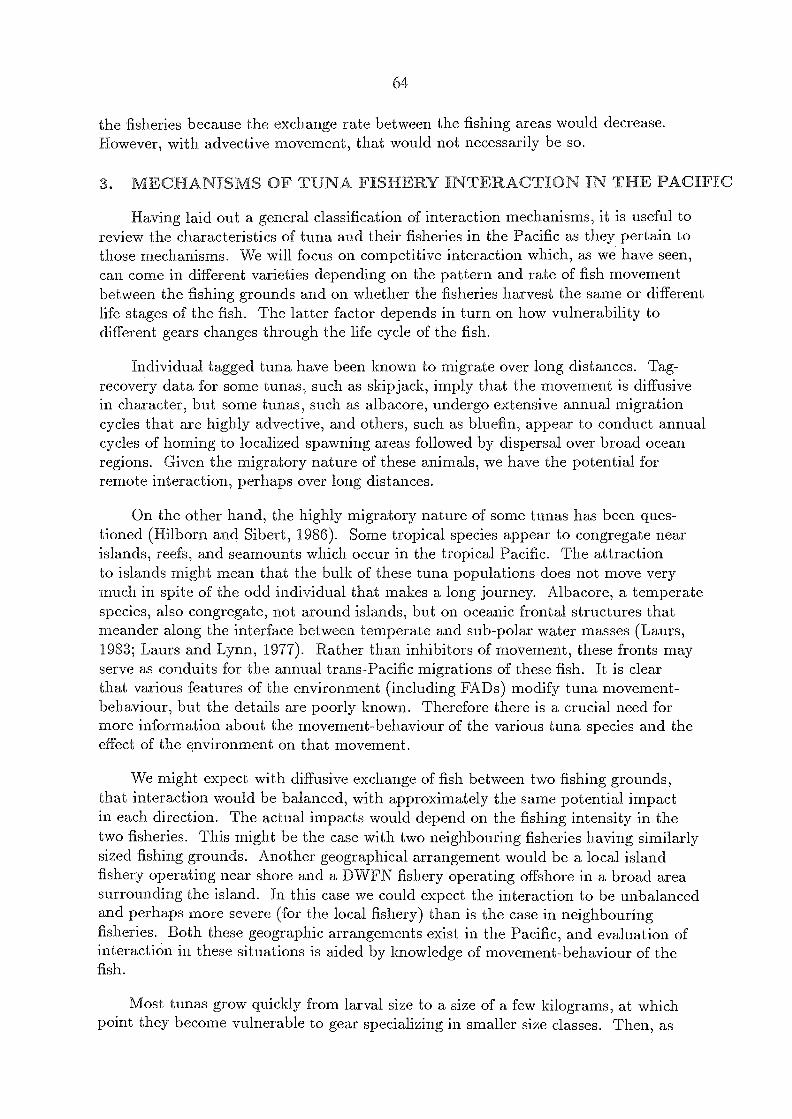
64
the fisheries because the exchange rate between the fishing areas would decrease.However, with advective movement, that would not necessarily be so.
. MECHANISMS OF TUNA FISHERY INTERACTION IN THE PACIFIC
Having laid out a general classification of interaction mechanisms, it is useful toreview the characteristics of tuna and their fisheries in the Pacific as they pertain tothose mechanisms. We will focus on competitive interaction which, as we have seen,can come in different varieties depending on the pattern and rate of fish movementbetween the fishing grounds and on whether the fisheries harvest the same or differentlife stages of the fish. The latter factor depends in turn on how vulnerability todifferent gears changes through the life cycle of the fish.
Individual tagged tuna have been known to migrate over long distances. Tag-recovery data for some tunas, such as skip jack, imply that the movement is diffusivein character, but some tunas, such as albacore, undergo extensive annual migrationcycles that are highly advective, and others, such as bluefin, appear to conduct annualcycles of homing to localized spawning areas followed by dispersal over broad oceanregion.s. Given the migratory nature of these animals, we have the potential forremote interaction, perhaps over long distances.
On the other hand, the highly migratory nature of some tunas has been ques-tioned (Hilborn and Sibert, 1986). Some tropical species appear to congregate nearislands, reefs, and seamounts which occur in the tropical Pacific. The attractionto islands might mean that the bulk of these tuna populations does not move verymuch in spite of the odd individual that makes a long journey. Albacore, a temperatespecies, also congregate, not around islands, but on oceanic frontal structures thatmeander along the interface between temperate and sub-polar water masses (Laurs,1983; Laurs and Lynn, 1977). Rather than inhibitors of movement, these fronts mayserve as conduits for the annual trans-Pacific migrations of these fish. It is clearthat various features of the environment (including FADs) modify tuna movement-behaviour, but the details are poorly known. Therefore there is a crucial need formore information about the movement-behaviour of the various tuna species and theeffect of the environment on that movement.
We might expect with diffusive exchange of fish between two fishing grounds,that interaction would be balanced, with approximately the same potential impactin each direction. The actual impacts would depend on the fishing intensity in thetwo fisheries. This might be the case with two neighbouring fisheries having similarlysized fishing grounds. Another geographical arrangement would be a local islandfishery operating near shore and a DWFN fishery operating offshore in a broad areasurrounding the island. In this case we could expect the interaction to be unbalancedand perhaps more severe (for the local fishery) than is the case in neighbouringfisheries. Both these geographic arrangements exist in the Pacific, and evaluation ofinteraction in these situations is aided by knowledge of movement-behaviour of thefish.
Most tunas grow quickly from larval size to a size of a few kilograms, at whichpoint they become vulnerable to gear specializing in smaller size classes. Then, as

65
they continue to increase in size and perhaps change behaviour (swimming deeper,for example), many tunas become vulnerable to other fishing gear which may leadto consecutive interaction between a series of gear types.' In some cases the fish canbe exposed to a series of fisheries simply because the fisheries are located at differ-ent positions along the migratory path of the fish. Therefore, we may find cases ofconsecutive interaction between similar or different gear types located in distantlyseparated fishing grounds.
If we were managing a particular fishery and were concerned about potentialimpacts of other fisheries outside our area, a critical question would be the origin ofthe fish targeted by our fishery. The inputs to that stock can be immigrants that areexposed, or potentially exposed, to other fisheries before reaching our fishing grounds,or they can be local recruits for which the first exposure of their lives is to our fishery.Obviously, the greater the proportion of inputs due to immigration of already re-cruited fish, the greater our concern must be. Therefore knowledge of the geographicand seasonal pattern of recruitment would be useful for judging which instances ofpotential interaction might be significant. But that information is sketchy for most ofthe tuna species. We do know that the pattern of spawning is variable amongst thetuna species. Some spawn over broad areas, and some are localized. Therefore wecan expect that the pattern of recruitment will also vary among species, and we mayfind instances of localized recruitment where one or a few fisheries have exclusive firstaccess to each cohort, or other instances of recruitment over a broad area where firstaccess to each cohort is shared by many fisheries.
The fast growth and high fecundity of some tuna species mean that there is ahigh turnover rate in the population. The fish have a high natural death rate, butthey are also replaced at a high rate. This is a situation that can mitigate fishery in-teraction because for a given catch rate, a higher turnover means a lesser exploitationrate, which would lessen the degree of interaction.
4. CLASSIFICATION OF INTERACTION INDICES
In addition to the types of interaction mechanisms, it is useful for us to reviewthe types of indicators that could be used to evaluate interaction. The choice ofwhich indices we want to evaluate is critical. It affects the kind of data that we needto collect. It also affects the interpretations that we can safely draw from our resultsbecause different indicators have different properties.
One of the approaches that has been used to assess interaction is to look forcross-correlations between time series of various fishery statistics in two potentiallycompeting fisheries. The statistical techniques could range from simple to complex.Such an interaction index, then, is a correlation coefficient or perhaps more sophisti-cated indicator of statistical relationship between various series of fishery data in thetwo fisheries.
Another index of potential interaction (Kleiber et al., 1984) is a measure of therate of input of animals to the area of one fishery (fishery-y) due to immigration fromthe area of another fishery (fishery-x). The index is the estimated proportion of thetotal rate of input (local recruitment plus total immigration) to fishery-y's area.

66
The above are really only proxy indices for the root measurement that needs tobe made, which is how much the actual performance of one fishery is affected by theactivity of another fishery. To develop such a direct index of interaction, we needto specify just what parameter we want as a measure of performance in the affectedfishery and what parameter we want as a measure of activity in the affecting fishery.There is a wide choice ranging from strictly fishing-related parameters (such as catch,catch per effort, and effort) to economic parameters (such as profits) to socioeconomicparameters (such as employment or availability of protein). Some parameters (suchas catch per effort) may be appropriate for performance, some (such as effort) may beappropriate for activity, and some (such as catch) may be appropriate for both.
In asking about the effect of fishery-s on fishery-y, we are presuming that perfor-mance of fishery-y is a function of activity in fishery-s. Fishery-y certainly also affectsitself. Therefore we should be able to write
Py - Py(AX7 Ay 7 " (1)
where P and A are respectively the parameters of performance and activity that wehave chosen, and the subscripts, x and y, indicate the fishery the parameter refersto. The dots indicate that Py, is a function of factors other than just current activitylevels. We will neglect these other factors for the moment, but we should not forgetthem.
If we could measure function, Py, at many different values of Az, and Ay, itcould be plotted as a 3-dimensional surface as in the contour plot in Figure 1. Thedata in this figure come from a model which predicts steady-state catch in fishery-ywhen it and fishery-x exploit a common stock. In each fishing ground, the localpopulation dynamics in the model follow the simple Schaefer model (logistic dynamicswith harvest) and there is a diffusional exchange of fish between the two areas. Iffishery-x is inactive, Az = 0, then fishery-y has an optimum activity, Ay, somewhatless than 1.0, but with increasing activity in fishery-s, the optimum for activity infishery-y decreases as does the maximum catch. The blank area in the upper rightof the figure is where the total activity in the two fisheries is enough to wipe out thepopulation; that is, the model predicts negative population levels in this area.
Information such as in Figure 1 would be ideal in assessing the effect of fishery-son fishery-y. The current effort levels of both fisheries define a position on the plot,and a change in effort in fishery-s would move that position parallel to the Az axis.We can then read the resulting change in the catch of fishery-y. The rate at whichthe performance changes in one fishery with small changes in the activity of anotherhas been proposed as a measure of interaction (Sibert, 1984). This is the marginaleffect of one fishery on another. In our example, it is the slope of the surface inFigure 1 parallel to the Az, axis. A mathematical definition of marginal interactionis the partial derivative of Py, with respect to A, is,
marginal interaction =OAxPY(Ax' AY)
(2)
where the subscript, x y, indicates the effect of fishery-x on fishery-y as distinctfrom the reverse. Another possible measure of interaction could be the absolute effect
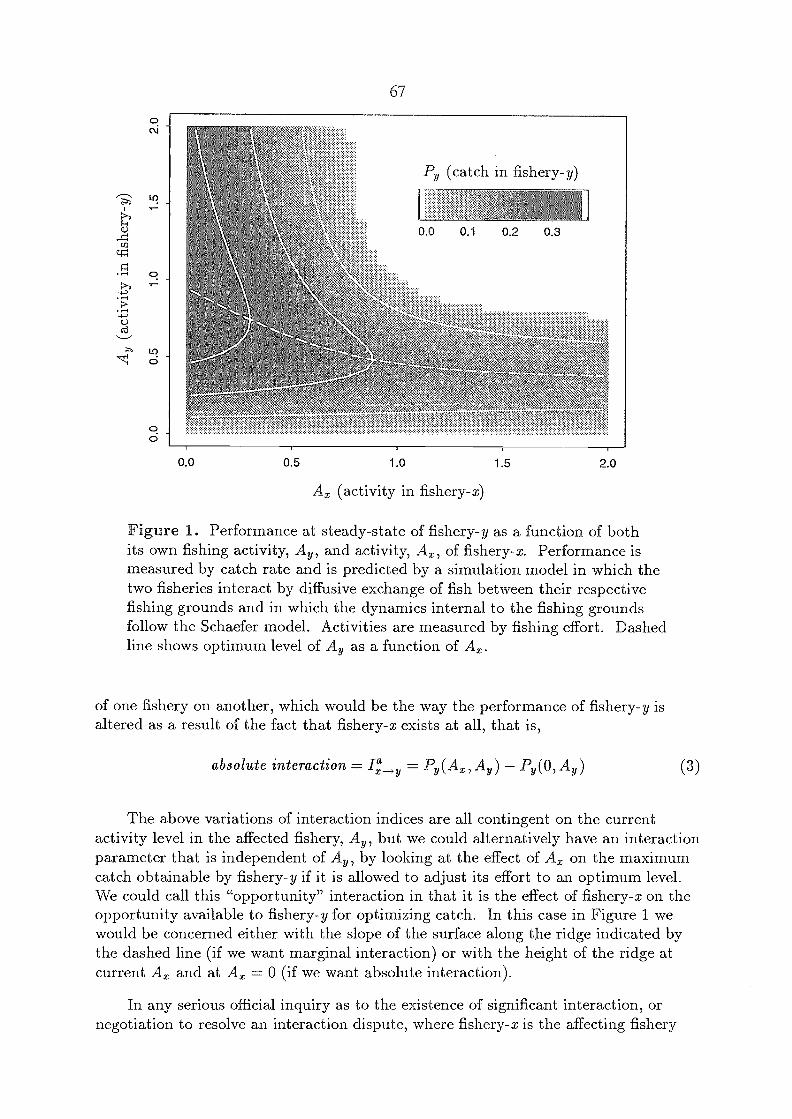
67
0.0 0.5 1.0 1.5 2.0
Az (activity in fishery-x)
Figure 1. Performance at steady-state of fishery-y as a function of bothits own fishing activity, Ay, and activity, Az, of fishery-x. Performance ismeasured by catch rate and is predicted by a simulation model in which thetwo fisheries interact by diffusive exchange of fish between their respectivefishing grounds and in which the dynamics internal to the fishing groundsfollow the Schaefer model. Activities are measured by fishing effort. Dashedline shows optimum level of Ay as a function of A.
of one fishery on another, which would be the way the performance of fishery-y isaltered as a result of the fact that fishery-x exists at all, that is,
absolute interaction = = Py(Ax, Ay) Py(0, Ay) (3)
The above variations of interaction indices are all contingent on the currentactivity level in the affected fishery, Ay, but we could alternatively have an interactionparameter that is independent of Ay, by looking at the effect of Az on the maximumcatch obtainable by fishery-y if it is allowed to adjust its effort to an optimum level.We could call this "opportunity" interaction in that it is the effect of fishery-x on theopportunity available to fishery-y for optimizing catch. In this case in Figure 1 wewould be concerned either with the slope of the surface along the ridge indicated bythe dashed line (if we want marginal interaction) or with the height of the ridge atcurrent Az and at Az = 0 (if we want absolute interaction).
In any serious official inquiry as to the existence of significant interaction, ornegotiation to resolve an interaction dispute, where fishery-x is the affecting fishery
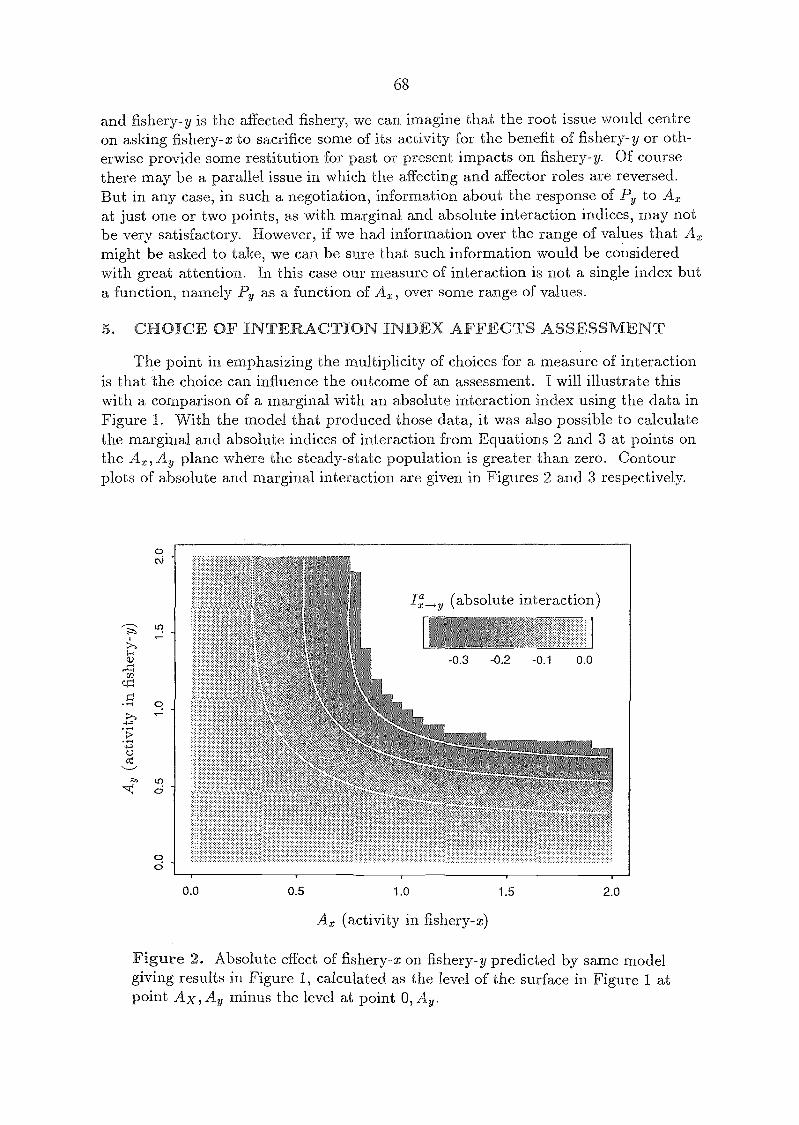
68
and fishery-y is the affected fishery, we can imagine that the root issue would centreon asking fishery-x to sacrifice some of its activity for the benefit of fishery-y or oth-erwise provide some restitution for past or present impacts on fishery-y. Of coursethere may be a parallel issue in which the affecting and affector roles are reversed.But in any case, in such a negotiation, information about the response of Py to A,at just one or two points, as with marginal and absolute intera,ction indices, may notbe very satisfactory. However, if we had information over the range of values that A,might be asked to take, we can be sure that such information would be consideredwith great attention. In this case our measure of interaction is not a single index buta function, namely Py as a function of Ax, over some range of values.
5. CHOICE OF INTERACTION INDEX AFFECTS ASSESSMENT
The point in emphasizing the multiplicity of choices for a measure of interactionis that the choice can influence the outcome of an assessment. I will illustrate thiswith a comparison of a marginal with an absolute interaction index using the data inFigure 1. With the model that produced those data, it was also possible to calculatethe marginal and absolute indices of interaction from Equations 2 and 3 at points onthe Ax, Ay plane where the steady-state population is greater than zero. Contourplots of absolute and marginal interaction are given in Figures 2 and 3 respectively.
Ax (activity in fishery-x)
Figure 2. Absolute effect of fishery-x on fishery-y predicted by same modelgiving results in Figure 1, calculated as the level of the surface in Figure 1 atpoint Ax, Ay minus the level at point 0, Ay.
(absolute interaction)
0.0 0.5 1.0 1.5 2.0
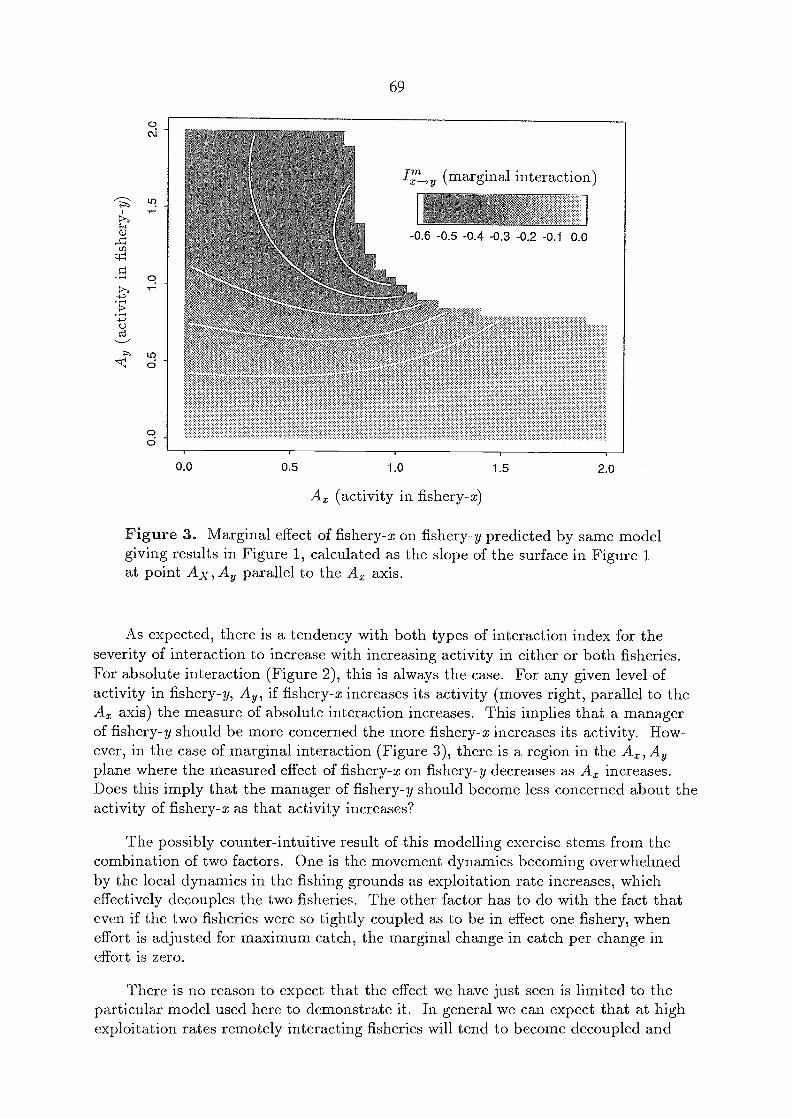
o
69
-0.6 -0.5 -04 -0.3 -0.2 -0.1 00
I' (marginal interaction)x y
00 0.5 1.0 1.5 2.0
A, (activity in fishery-x)
Figure 3. Marginal effect of fishery-x on fishery-y predicted by same modelgiving results in Figure 1, calculated as the slope of the surface in Figure 1at point Ax, Ay parallel to the A, axis.
As expected, there is a tendency with both types of interaction index for theseverity of interaction to increase with increasing activity in either or both fisheries.For absolute interaction (Figure 2), this is always the case. For any given level ofactivity in fishery-y, Ay, if fishery-x increases its activity (moves right, parallel to theAz axis) the measure of absolute interaction increases. This implies that a managerof fishery-y should be more concerned the more fishery-x increases its activity. How-ever, in the case of marginal interaction (Figure 3), there is a region in the Az, Ayplane where the measured effect of fishery-x on fishery-y decreases as A, increases.Does this imply that the manager of fishcry-y should become less concerned about theactivity of fishery-x as that activity increases?
The possibly counter-intuitive result of this modelling exercise stems from thecombination of two factors. One is the movement dynamics becoming overwhelmedby the local dynamics in the fishing grounds as exploitation rate increases, whicheffectively decouples the two fisheries. The other factor has to do with the fact thateven if the two fisheries were so tightly coupled as to be in effect one fishery, wheneffort is adjusted for maximum catch, the marginal change in catch per change ineffort is zero.
There is no reason to expect that the effect we have just seen is limited to theparticular model used here to demonstrate it. In general we can expect that at highexploitation rates remotely interacting fisheries will tend to become decoupled and
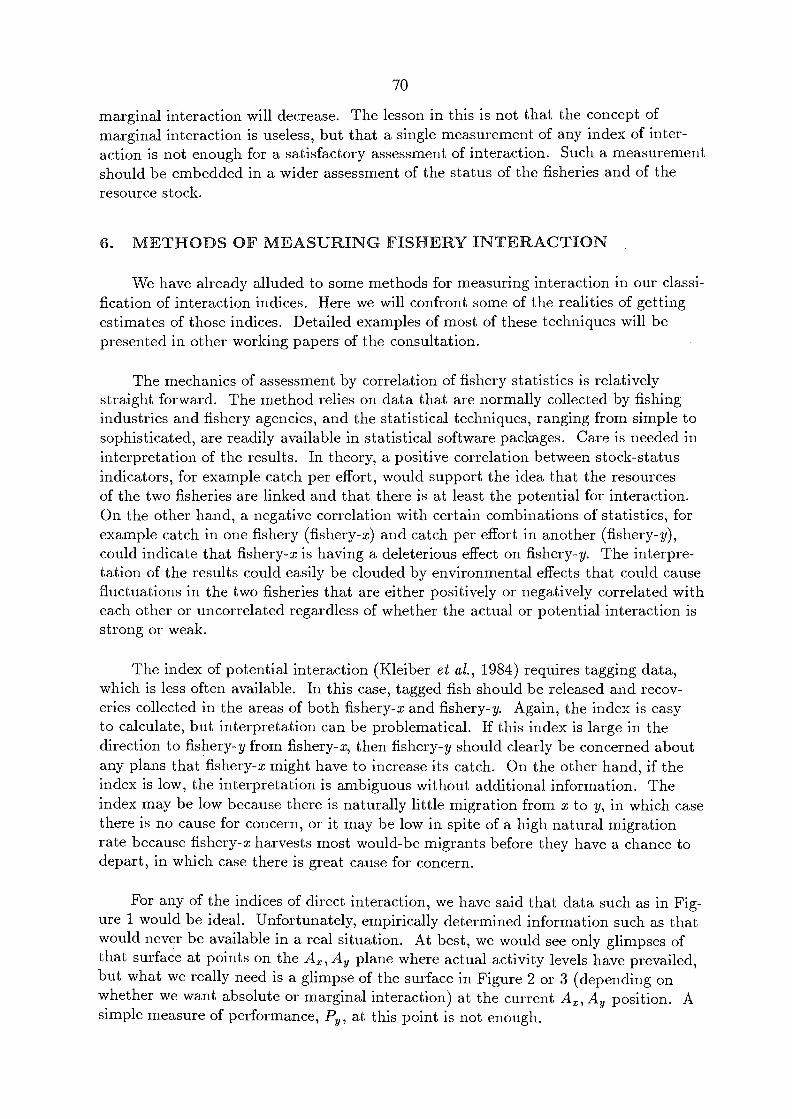
70
marginal interaction will decrease. The lesson in this is not that the concept ofmarginal interaction is useless, but that a single measurement of any index of inter-action is not enough for a satisfactory assessment of interaction. Such a measurementshould be embedded in a wider assessment of the status of the fisheries and of theresource stock.
6. METHODS OF MEASURING FISHERY INTERACTION
We have already alluded to some methods for measuring interaction in our classi-fication of interaction indices. Here we will confront some of the realities of gettingestimates of those indices. Detailed examples of most of these techniques will bepresented in other working papers of the consultation.
The mechanics of assessment by correlation of fishery statistics is relativelystraight forward. The method relies on data that are normally collected by fishingindustries and fishery agencies, and the statistical techniques, ranging from simple tosophisticated, are readily available in statistical software packages. Care is needed ininterpretation of the results. In theory, a positive correlation between stock-statusindicators, for example catch per effort, would support the idea that the resourcesof the two fisheries are linked and that there is at least the potential for interaction.On the other hand, a negative correlation with certain combinations of statistics, forexample catch in one fishery (fishery-x) and catch per effort in another (fishery-y),could indicate that fishery-x is having a deleterious effect on fishery-y. The interpre-tation of the results could easily be clouded by environmental effects that could causefluctuations in the two fisheries that are either positively or negatively correlated witheach other or uncorrelated regardless of whether the actual or potential interaction isstrong or weak.
The index of potential interaction (Kleiber et al., 1984) requires tagging data,which is less often available. In this case, tagged fish should be released and recov-eries collected in the areas of both fishery-x and fishery-y. Again, the index is easyto calculate, but interpretation can be problematical. If this index is large in thedirection to fishery-y from fishery-x, then fishery-y should clearly be concerned aboutany plans that fishery-x might have to increase its catch. On the other hand, if theindex is low, the interpretation is ambiguous without additional information. Theindex may be low because there is naturally little migration from z to y, in which casethere is no cause for concern, or it may be low in spite of a high natural migrationrate because fishery-x harvests most would-be migrants before they have a chance todepart, in which case there is great cause for concern.
For any of the indices of direct interaction, we have said that data such as in Fig-ure 1 would be ideal. Unfortunately, empirically determined information such as thatwould never be available in a real situation. At best, we would see only glimpses ofthat surface at points on the Ax, Ay plane where actual activity levels have prevailed,but what we really need is a glimpse of the surface in Figure 2 or 3 (depending onwhether we want absolute or marginal interaction) at the current Ax, Ay position. Asimple measure of performance, Pi,, at this point is not enough.
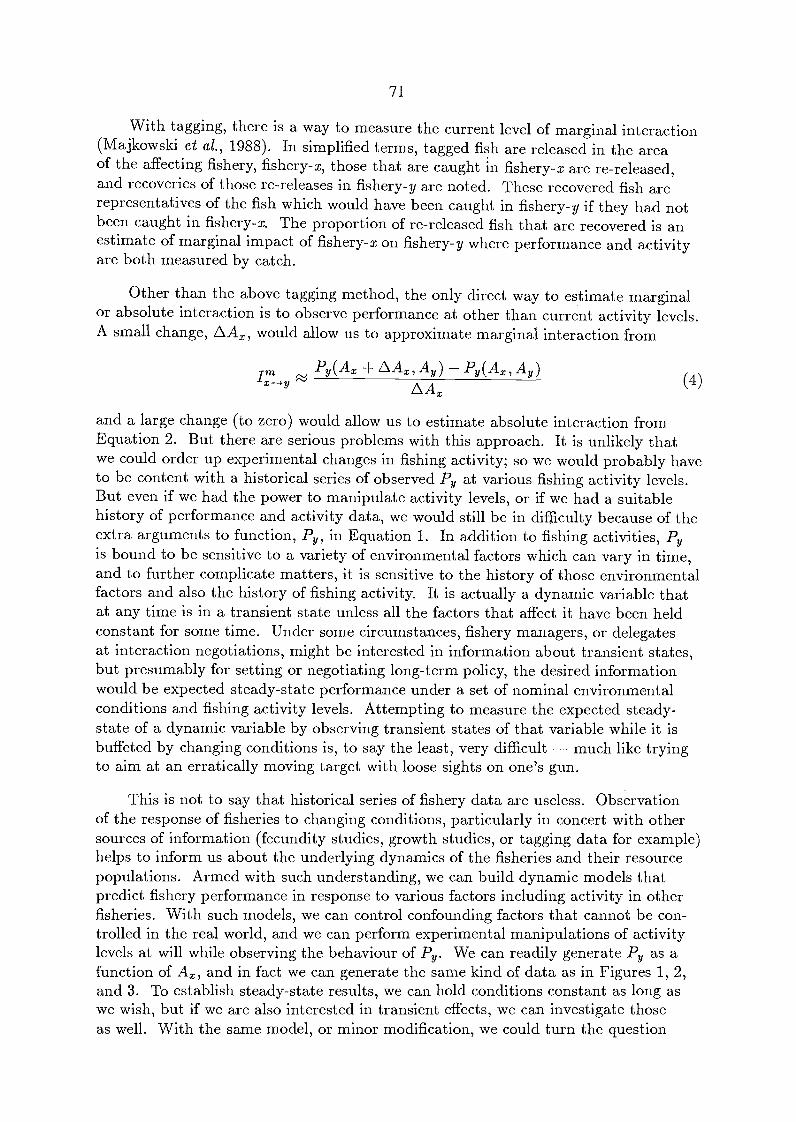
rnx
71
With tagging, there is a way to measure the current level of marginal interaction(Majkowski et al., 1988). In simplified terms, tagged fish are released in the areaof the affecting fishery, fishery-x, those that are caught in fishery-x are re-released,and recoveries of those re-releases in fishery-y are noted. These recovered fish arerepresentatives of the fish which would have been caught in fishery-y if they had notbeen caught in fishery-x. The proportion of re-released fish that are recovered is anestimate of marginal impact of fishery-x on fishery-y where performance and activityare both measured by catch.
Other than the above tagging method, the only direct way to estimate marginalor absolute interaction is to observe performance at other than current activity levels.A small change, AAx, would allow us to approximate marginal interaction from
Py(Ax AAx, Ay) Py(Ax, Ay)L\Ax
and a large change (to zero) would allow us to estimate absolute interaction fromEquation 2. But there are serious problems with this approach. It is unlikely thatwe could order up experimental changes in fishing activity; so we would probably haveto be content with a historical series of observed Py at various fishing activity levels.But even if we had the power to manipulate activity levels, or if we had a suitablehistory of performance and activity data, we would still be in difficulty because of theextra arguments to function, Py, in Equation 1. In addition to fishing activities, Pyis bound to be sensitive to a variety of environmental factors which can vary in time,and to further complicate matters, it is sensitive to the history of those environmentalfactors and also the history of fishing activity. It is actually a dynamic variable thatat any time is in a transient state unless all the factors that affect it have been heldconstant for some time. Under some circumstances, fishery managers, or delegatesat interaction negotiations, might be interested in information about transient states,but presumably for setting or negotiating long-term policy, the desired informationwould be expected steady-state performance under a set of nominal environmentalconditions and fishing activity levels. Attempting to measure the expected steady-state of a dynamic variable by observing transient states of that variable while it isbuffeted by changing conditions is, to say the least, very difficult much like tryingto aim at an erratically moving target with loose sights on one's gun.
This is not to say that historical series of fishery data are useless. Observationof the response of fisheries to changing conditions, particularly in concert with othersources of information (fecundity studies, growth studies, or tagging data for example)helps to inform us about the underlying dynamics of the fisheries and their resourcepopulations. Armed with such understanding, we can build dynamic models thatpredict fishery performance in response to various factors including activity in otherfisheries. With such models, we can control confounding factors that cannot be con-trolled in the real world, and we can perform experimental manipulations of activitylevels at will while observing the behaviour of P. We can readily generate Py as afunction of Ax, and in fact we can generate the same kind of data as in Figures 1, 2,and 3. To establish steady-state results, we can hold conditions constant as long aswe wish, but if we are also interested in transient effects, we can investigate thoseas well. With the same model, or minor modification, we could turn the question
(4)
72
around and deal with the effect of fishery-y on fishery-x, and we could incorporatemultiple fisheries if appropriate.
To implement an interaction model suitable formulations and parameter valuesneed to be found for all the processes to be incorporated in the model, includingat minimum the population dynamics of the fish stocks, the harvest of fish by therelevant fisheries, and the movement of fish between the fisheries. Examples of in-teraction models of Pacific tuna fisheries that explicitly incorporate those processesare described by Sibert (1984), and Kleiber and Baker (1987).
The process of fish movement has been slow to be incorporated into fisherymodels in general partly because of computational overhead, and partly because ofignorance of relevant movement parameters (exchange rates, advective velocities,diffusivities, and the like). Tag data are probably the best source of movement in-formation, but when the recovery effort is non-uniform in time and space (as is thecase with most tagging experiments), the analysis of tag data to estimate movementparameters is not straight forward. Computational techniques to overcome these dif-ficulties and thereby estimate parameters of movement models from tag recovery datahave been developed only recently, to a large extent using tag data from Pacific tuna(Ishii, 1979; Sibert, 1984; Hilborn, 1990). These techniques are still being refinedand improved, and new techniques are being developed, both with tag data and withother sources of information, such as genetic data. Since fish movement is a centralissue in assessing interaction for tuna fisheries, many of the methodological papersin this consultation will focus mostly, or entirely, on techniques for estimating fish-movement parameters.
7. CONCLUSION
Our review of types of fishery interaction mechanisms has illustrated the manypotentialities for interaction between tuna fisheries in the Pacific. Our review ofthe variety of indices for evaluating interaction has underscored the need for carein choosing interaction indicators and in interpreting them in a way that addressesthe particular concerns of a given situation. Of the methods for measuring fisheryinteraction, the most flexible for addressing a variety of interaction concerns is theconstruction of suitable models which can serve as test beds for various experimentalmanipulations aimed at revealing the effect of one fishery on another. Much of themethodology development needed for assessment of tuna-fishery interaction is thenthe development of methods to gain the underlying knowledge and understandingnecessary to produce such models. Thus what is needed is more knowledge of the lifeprocesses of tunas, tuna movement in particular, and better understanding of the waythose processes are affected by fishing activities and by environmental changes. Theseare fundamental issues for any approach to effective assessment of fishery interactionas well as to a panoply of other kinds of stock assessment and fishery managementquestions.
8. REFERENCES CITED
Anonymous. 1988. Methods of studying fishery interaction. Paper presented at20th Regional Technical Meeting on Fisheries, S.Pac.Comm., Noumea, New Caledo-nia, 1-5 August 1988, WP/5:14 p.
Hilborn, R. 1990. Determination of fish movement patterns from tag recoveriesusing maximum likelihood estimators. Can.J.Fish.Aguat.Sci., 47(3):635-43.
Hilborn, R. and J.R. Sibert. 1986. Is international management of tuna necessary?Fish.Newsl., S.Pac.Comrn., (39):31-40.
Ishii, T. 1979. Attempt to estimate migration of a fish population with survivalparameters from tagging experiment data by the simulation method. Inv.Pesq.,43:301-17.
Kleiber, P. and B. Baker. 1987. Assessment of interaction between north Pacificalbacore, Th,unnus alalunga, fisheries by use of a simulation model. Fish,.Bull.NOAA-NMFS, 85:703-11.
Kleiber, P., A.W. Argue, J.R. Sibert, and L.S. Hammond. 1984. A parameterfor estimating potential interaction between fisheries for skipjack tuna (Katsu-wonus pelarais) in the western Pacific. Tech.Rep. Tuna Billfish Assess.Programme,S.Pac.Comm., (12):11 p.
Laurs, R.M. 1983. The North Pacific Albacore An Important Visitor To Califor-nia Current Waters. Rep.CCOFI, 24:99-106.
Laurs, R.M., and R.J. Lynn. 1977. Seasonal migration of North Pacific albacore,Thunnus alaunga, into North American coastal waters: Distribution, relative abun-dance, and association with Transition Zone waters. Fish.Bull.NOAA-NMFS, 75:795-822.
Majkowski, J., W.S. Hearn, and R.K. Sandland. 1988. A tag-release/recoverymethod for predicting the effect of changing the catch of one component of a fisheryupon the remaining components. Can.J.Fish.Aquat.Sci., 45:675-84.
Sibert, J.R. 1984. A two-fishery tag attrition model for the analysis of mortality,recruitment and fishery interaction. Tech.Rep.Tuna Billfish Assess.Programme,S.Pac.Coram., (13):27 p.
73
74
METHODS FOR ANALYZING INTERACTIONSOF LIMITED--ZANGE FISHERIES: HAWAH'S PELAGIC FISHERIES
Christofer H. BoggsHonolulu Laboratory
Southwest Fisheries Science CenterNational Marine Fisheries Service, NOAA
Honolulu, Hawaii, USA
ABSTRACT
A review of previous studies indicated that local fishing intensity can affect localpelagic fish abundance, but overall abundance on a wider scale may have a greater localeffect. Interactions of limited-range fisheries were explored using a theoretical model inwhich local catch per unit effort (CPUE) declines as the catch approaches or exceeds therates of fish immigration and recruitment in a limited area. The model has the local catchincrease with effort to an asymptotic level. This simple model was used to simulate localCPUE in relation to varying rates of immigration and local fishing. Simulated data wereused to test an analytical approach--the regression of CPUE on catch--which was thenapplied to real data from Hawaii's troll fishery. Analyzing CPUE in relation to catchrather than effort was convenient because fishing effort i. poorly documented in Hawaiiand includes effort by diverse methods. The analysis indicated that the CPUE ofyellowfin tuna (Thunnus albacares) in Hawaii's troll fishery was not affected significantlyby total yellowfin tuna catch in Hawaii in 1987-90, but was directly related to an index ofabundance for surface-caught yellowfin tuna in the western Pacific.
1. INTRODUCTION
In Hawaii and in many Pacific island nations, locally-caught pelagic fishesconstitute a small fraction of stocks that extend far beyond the range of the local fisheries.Primary concern over the status of these stocks is appropriately focused on abundance andproduction throughout their range (Suzuki, 1989). However, the rate of replacement offish within any area is finite. Theoretically, if fishing mortality in an area increasesgreatly in relation to net immigration and recruitment, local catch per unit effort (CPUE)will decline. If there are several fisheries in such an area, fishery interactions may occur.
Fishery production models, which typically are used to estimate maximumsustainable yields for pelagic species (Suzuki, 1989; IATTC, 1992), are not very usefulfor detecting fishery interactions. Nor are they useful for estimating the optimal level offishing effort in localized fisheries that are too small to significantly affect the size of thestock or its level of production (Sathiendrakumar and Tisdell, 1987). In many areas ofthe Pacific, including Hawaii, tropical tuna and billfish production may be limited mostlyby immigration from surrounding areas rather than by the reproduction and growth ofresident fish. For such fisheries, a model in which the local catch increases with efforttowards an asymptote was proposed by Sathiendrakumar and Tisdell (1987).
FAO LIBRARY AN: 346115

75
In this paper, I develop a simple model for the relationship between catch andeffort in a limited-range fishery on a highly mobile pelagic stock. The model is similar tothat of Sathiendrakumar and Tisdell (1987) but is explicitly formulated as a function ofimmigration, emigration, natural mortality, and catchability. I use the model to simulatedata for a fishery in which immigration, emigration, and fishing effort are seasonal. Thesimulated data are used to test whether the effect of fishing intensity on local catch ratescan be adequately quantified by regressing CPUE on catch rather than on effort. Usingcatch rather than effort to quantify fishing intensity is helpful if total fishing effort ispoorly documented and derived from widely different fishing methods, as is the case inHawaii. Finally, the CPUE in Hawaii's troll fishery for yellowfin tuna (Thunnusalbacares) is analyzed in relation to the total catch by troll, handline, and longlinefisheries to determine whether the troll CPUE has been affected by total fishing intensity.
2. REGULATING LOCAL FISHING EFFORT IN HAWAII
Local fishery managers in the USA Exclusive Economic Zones (EEZs) of thecentral and western Pacific can do little about the distant-water foreign fisheries, whichoperate outside the EEZs and harvest the majority of pelagic fish caught in the region(NMFS, 1991). The primary USA fishery-management objective is to preventrecruitment overfishing (NMFS, 1989), defined in relation to pelagic populations whichare mostly exploited beyond USA jurisdiction. This objective is dysfunctional, sincethere exists no international management organization through which stock-wideobjectives can be achieved (NMFS, 1991). Therefore the USA Western Pacific RegionalFishery Management Council (WPRFMC) has focused its objectives on "equitabledomestic utilization of the resources. . ." among user groups (WPRFMC, 1991).Recognizing that the domestic catch within the EEZs of the USA may be large enough toreduce local CPUE and cause local fishery interactions, the WPRFMC has attempted toregulate fishing effort in Hawaii's EEZ (WPRFMC, 1991).
Recent increases in the total catch of pelagic species in the USA Pacific EEZshave mostly been due to an expanding domestic longline fishery in Hawaii (Ito, 1991;WPRFMC, 1991). The less mobile, small-vessel troll and handline fisheries in Hawaiihave experienced declines in total catch and CPUE (Boggs, 1991) as the longline fisheryhas expanded. Concern by troll, handline, and longline fishermen over reduced CPUE,together with gear conflicts, dangerous confrontations between fishermen, andovercrowding of dock facilities, induced the WPRFMC to pass regulations halting theentry of additional vessels into the USA domestic longline fishery in Hawaii in 1990. Toprevent gear conflicts, the WPRFMC in 1991 also passed regulations closing nearshoreareas (<50-70 miles, depending on location) to longline fishermen.
Scientific evidence in support of limiting longline-fishery participation in Hawaiihas been sparse. Prior to 1986 the WPRFMC focused on the impacts of foreign longlinefishing within Hawaii's EEZ on catch rates for pelagic management unit species (PMUS)which included billfish, mahimahi (Coryphaena hippurus), wahoo (Acanthocybiumsolandri), and pelagic sharks, but not tunas (Lovejoy, 1977, 1981; Wetherall and Yong,1983; Skillman and Kamer, 1992). The possible impacts of foreign fishing in the EEZwere regulated by the original Pelagic Fisheries Management Plan (WPRFMC, 1986) butbecame irrelevant as no foreign longliners exercised the option to fish legally in Hawaii'sEEZ after 1980. However, the expanding domestic longline fishery in Hawaii now
76
catches more fish than the foreign longliners did before 1980 within the EEZ (WPRFMC,1991). This catch increase, plus the inclusion of tunas as a Pacific Pelagic ManagementUnit Species (PPMUS) in 1992, provided some impetus to regulate the domestic fisheries.
Regulating fishing effort rationally requires a quantification of the effect of localfishing pressure on local CPUE for pelagic species, and a means of choosing a desirablelevel of fishing effort. An optimal level of fishing effort can be estimated if the cost ofeffort and the value of catch are defined and the relationship between catch and effort isquantified as an asymptotic curve (Sathiendrakumar and Tisdell, 1987). In the asymptoticcatch model, although catch never declines because of overfishing, CPUE does decline aseffort increases. Thus, detecting and quantifying an asymptotic relationship between localcatch and fishing effort would help indicate whether regulating the local fishing effort isjustified.
The optimization of fishing effort, in relation to the appropriate costs and benefits,depends on the relative mix of the fisheries comprising the total effort. Thus, theallocation of fishing effort among interacting fisheries is an additional problem. Changingthe composition of effort by different gear types will alter the optimum. Furthermore, thedecision as to which fishery to regulate, and how, may be strongly influenced byhistorical, social, or logistical considerations. For example, the least-mobile fisheries aremost vulnerable to local declines in CPUE, and this could be a reason to limit the effortof the more mobile longliners in some areas rather than the effort of all the fisheries inthose areas. In any case, evidence that local fishing pressure affects local CPUE shouldbe the basis of any scheme for regulating fishing effort.
3. REVIEW OF PREVIOUS RESEARCH
Several previous studies suggest that localized fishing effort can reduce catch rates(CPUE) for wide-ranging pelagic stocks in a local area (Lovejoy, 1977, 1981; Wetheralland Yong, 1983; Squire and Au, 1990; Skillman and Kamer, 1992). Lovejoy (1977,1981) simulated the pelagic fisheries in Hawaii's EEZ and predicted that small increasesin the domestic catch of blue and marlin (Makaira mazara) and striped marlin(Tetrapturus audax) would result if foreign fishing in the EEZ was eliminated. Wetheralland Yong (1983) modelled blue marlin catch rates near Hawaii as a function ofmid-Pacific abundance, recruitment, and fishing effort, and found that increases in local,adjacent, and mid-Pacific effort had negative impacts on CPUE near Hawaii. Skillmanand Kamer (1992) found significant negative correlations between foreign longline effortand Hawaii's longline catch rates for blue and striped marlins. Most recently, Squire andAu (1990) found that local longline and troll catch rates of striped marlin rebounded whenlongline fishing was temporarily excluded from an area off Mexico. All of these studiesfound that local fishing effort affected local CPUE, but they lacked the appropriate modelor sufficient data to accurately quantify the relationship, and thus provided no means ofchoosing an optimal intensity for local fishing effort.
The model of Lovejoy (1977) demonstrated that short-term abundance of transientpopulations was reduced by increasing local fishing effort, but the relative magnitude ofthe reduction was dependent on the actual (but unknown) number of fish in the area.Lovejoy (1977) used monthly Japanese longline CPUE data (1962-75) to model the spatialdistribution, abundance, and catch of marlin in 27 subareas of Hawaii's EEZ and a single
77
Pacific (pooled) area. Fish movements through the EEZ were simulated to matchgeographic changes in Japanese CPUE in the 27 Hawaiian areas, assuming generalnorth-south movements for blue marlin and northwest-southeast movements for stripedmarlin. However, the estimates of abundance and catchability were essentially guesses,and the catches predicted by the model were very sensitive to these parameters. Thismarlin-fishery simulation (Lovejoy, 1977) was repeated with the removal of the fishingmortality caused by longline fisheries in the EEZ (i.e. , set to zero). When Japaneselongline fishing in the EEZ was eliminated, the changes in the fish abundance were smallin areas fished by the small-vessel trollers, as were the effects of changes in abundanceon troll catches of blue and striped marlins (2 and 5%, respectively). The simulatedincreases in troll catches were larger when domestic longline fishing also was eliminated(5 and 21%, respectively). Though smaller than the Japanese fishery in the EEZ at thattime, the domestic longline fishery had a greater simulated impact because it had a greatergeographic overlap with the troll fishery.
The sensitivity of the Lovejoy (1977) simulations to parameter estimates wasillustrated when the estimated abundances of the marlin stocks were altered (Lovejoy,1981). When the number of marlins moving from the Pacific-pooled area to Hawaii'sEEZ was halved (Lovejoy, 1981) and catchability was increased to simulate the samecatches as in the original model, eliminating all longline-fishing mortality increased thesimulated troll catches of blue marlin by 13% and striped marlin by 45%, respectively.In contrast, when abundances were doubled, eliminating all longline fishing increased thetroll catch of blue marlin by only 1% and striped marlin by 3%.
Exogenous factors may overwhelm the influence of local fishing effort on localcatch rates of highly-mobile pelagic fish. Indices of abundance (CPUE) in local areas,for example, have been found to be significantly correlated with CPUE over a muchwider range. Using Japanese longline catch-and-effort statistics for 1962-79 to computeestimates of abundance, Wetherall and Yong (1983) found that variation in blue marlincatch rates at the beginning of a year in a mid-Pacific area explained 80% of the annualvariation in peak third-quarter catch rates in a 5x10 degree (latitude x longitude) areaaround the main Hawaiian Islands. No other statistically-significant predictors of localcatch rates were found, but by including the variables for a recruitment trend and theforeign fishing effort in local, adjacent, and mid-Pacific areas, Wetherall and Yong's(1983) regression model increased the amount of accountable variation from 80% to 95%.Their analysis suggests that the impact of local effort on Hawaii's blue marlin fishery wassmall compared with the impact of abundance on a wider scale, under the conditionsprevailing in 1962-79.
Pronounced seasonal cycles characterize the local, apparent abundance of large,tropical, pelagic species, especially towards the higher latitudes. The effect of local efforton CPUE may well depend on the season. Wetherall and Yong (1983) and Squire andAu (1990) accounted for seasonal effects by eliminating all but the data for the season ofpeak CPUE. Another method used by Skillman and Kamer (1992) was to decompose theseasonal and nonseasonal components of quarterly and monthly time series and examinethe nonseasonal component. At a quarterly resolution, deseasonalized, local, domesticlongline CPUE statistics for blue and striped marlins in Hawaii (1962-78) weresignificantly negatively correlated with foreign longline effort in local and adjacent areas(P < 0.05), whereas no significant correlation was found at the annual resolution
78
(Skillman and Kamer, 1992). The correlation coefficients were low (-0.26 to -0.32,nonparametric Spearman coefficients), and no attempt was made to quantify therelationships. Domestic longline CPUE statistics were most negatively correlated withJapanese longline effort in the local area, again suggesting a stronger relationship withincreased proximity.
An unintended "experiment" on the effect of local fishing effort on local marlinCPUE was performed by the government of Mexico in 1977 when it enforced regulationsagainst foreign longline fishing within its 200-mile exclusive economic zone. Theenforcement caused a major decrease in fishing effort, allowing an interesting comparisonto be made between catch rates before and after 1977 (Squire and Au, 1990). Stripedmarlin catch rates by troll fishermen in the area west of Mazatlan and around the tip ofBaja California doubled during 1977-80 (Squire and Au, 1990). Joint-venture longlineoperations beginning in 1979-80 in the area also experienced catch rates twice as high asthose in 1976. This series of events suggests a much stronger effect of local fishingeffort on CPUE than that indicated for Hawaii's fisheries (Lovejoy, 1977; Wetherall andYong, 1983; Skillman and Kamer, 1992). The opportunity to make a comparison likethat of Squire and Au (1990) between CPUE statistics before and after the abatement offoreign longline fishing in Hawaii's EEZ (1980) was given as a reason for regulatingforeign longline fishing (WPRFMC, 1986). Unfortunately this analysis was neverundertaken, partly because of a severe decline in reporting of Hawaii's fishery statisticsbeginning around 1979 (S. Pooley, Honolulu Laboratory, National Marine FisheriesService, Honolulu, HI 96822-2396, unpubl. manuscr.).
Squire and Au (1990) described the Mexico striped marlin fishery as operating ina "core area" in which fish naturally aggregate in concentrations that are much higherthan throughout the population range. When they analyzed catch rates of the joint-venturefishery and the foreign longline fishery off Mexico in relation to fishing effort during1962-84, they found no clear quantitative relationship. This was largely because theCPUE in the core area declined in 1981-84, despite relatively low levels of effort. Squireand Au (1990) suggested that a reduction in core-area fishing effort disproportionatelyraises the local CPUE, because core-area CPUE depends more on the formation andfishing down of "hot spots" than on stock production. Hypothetically, the relationshipbetween fishing effort and CPUE in "hot spots" could be different from that in a largerarea. Such a relationship could be demonstrated only if the data had very fine geographicresolution.
4. ASYMPTOTIC MODEL FOR LOCAL CATCH
A model for a local fishery in which the catches reach an asymptote as fishingeffort increases was proposed by Sathiendrakumar and Tisdell (1987) to determine theoptimal level of local fishing effort. I propose a similar model except that the parametersare defined in relation to immigration, emigration, mortality, and catchability.Emigration is treated as if it were analogous to natural mortality, so the two arecombined. In the simplest case of this model (i.e. , assuming steady-state equilibrium andconstant "natural mortality" and catchability), the asymptotic maximum catch is governedby the level of immigration (Figure 1). The parameters and derivation of the model areas follows (all fluxesimmigration, catch, and mortalityare annual, and numberedexpressions are considered axiomatic):
I = local immigration (metric tons)--analogous tobiological production but independent oflocal biomass;
= catch (metric tons) at effort level i;
f = effort (103 hooks) at level i;
q = catchability (1/103 hooks)
= fishing mortality
M' = "natural mortality"including emigration
Z'i = total "mortality"including emigration
B. = equilibrium biomass (metric tons)in the local area
= BiFi (metric tons);
IFi(metric tons)
Z'i
and
lqf(metric tons)
M' + qf
79
[assumed constant];
[Fi = qf,i;
[assumed constant],
[Z'i = M' + qf];
[Bi = I/Z'i];
[from (3)];
[from (2)].
(1)
The example shown (Figure 1) uses arbitrary values: I = 5,000, 10,000, and20,000 metric tons, q = 0.0001/1,000 hooks, and M' = 0.06. When fitting the model todata where I, q, and M' are unknown, the model can be simplified:
lqIf a= and b=
M' M'
then Ci = a( ) (metric tons).1+bli
Algebraic manipulation of the model equation yields the following linear relationship
between CPUE and catch (Figure 2):
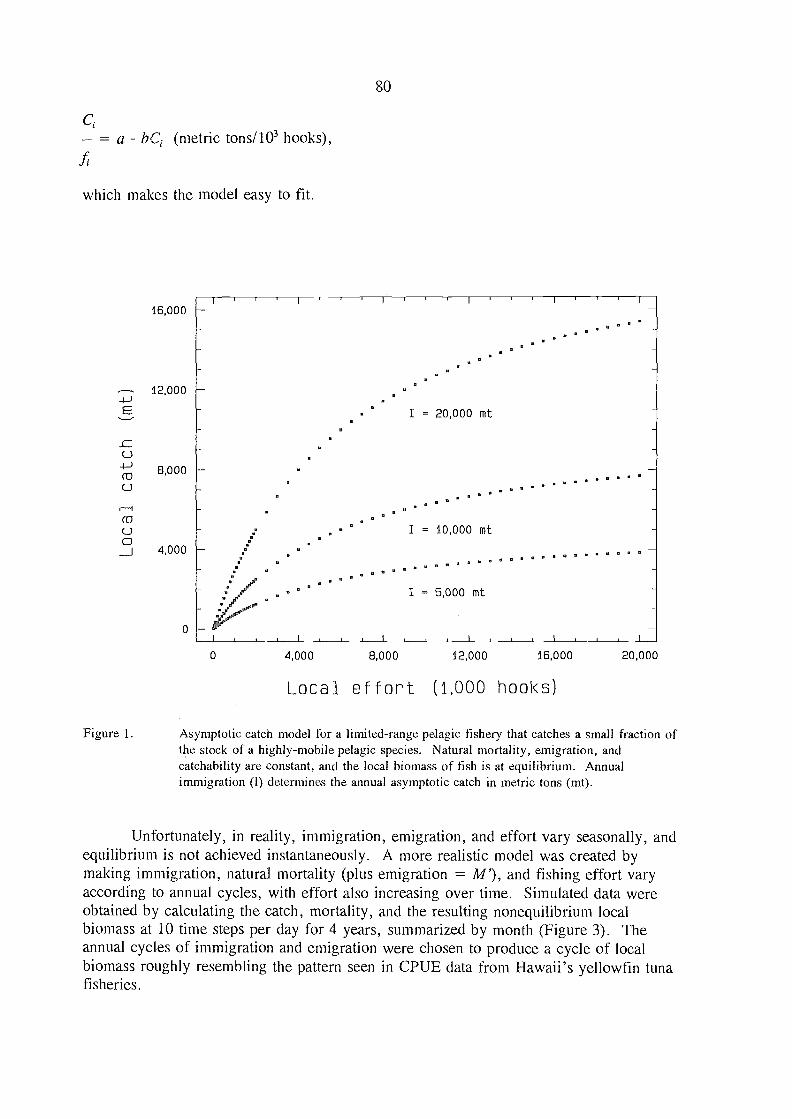
ci= a - bC, (metric tons/103 hooks),
which makes the model easy to fit.
16,000
12,000
E
_Cu8,000co
u
uo4,000
o
80
o 4,000 8,000 12,000 16,000 20,000
Local effort (1,000 hooks)
Figure 1. Asymptotic catch model for a limited-range pelagic fishery that catches a small fraction ofthe stock of a highly-mobile pelagic spe,cies. Natural mortality, emigration, andcatchability are constant, and the local biomass of fish is at equilibrium. Annualimmigration (I) determines the annual asymptotic catch in metric tons (mt).
Unfortunately, in reality, immigration, emigration, and effort vary seasonally, andequilibrium is not achieved instantaneously. A more realistic model was created bymaking immigration, natural mortality (plus emigration Al), and fishing effort varyaccording to annual cycles, with effort also increasing over time. Simulated data wereobtained by calculating the catch, mortality, and the resulting nonequilibrium localbiomass at 10 time steps per day for 4 years, summarized by month (Figure 3). Theannual cycles of immigration and emigration were chosen to produce a cycle of localbiomass roughly resembling the pattern seen in CPUE data from Hawaii's yellowfin tunafisheries.
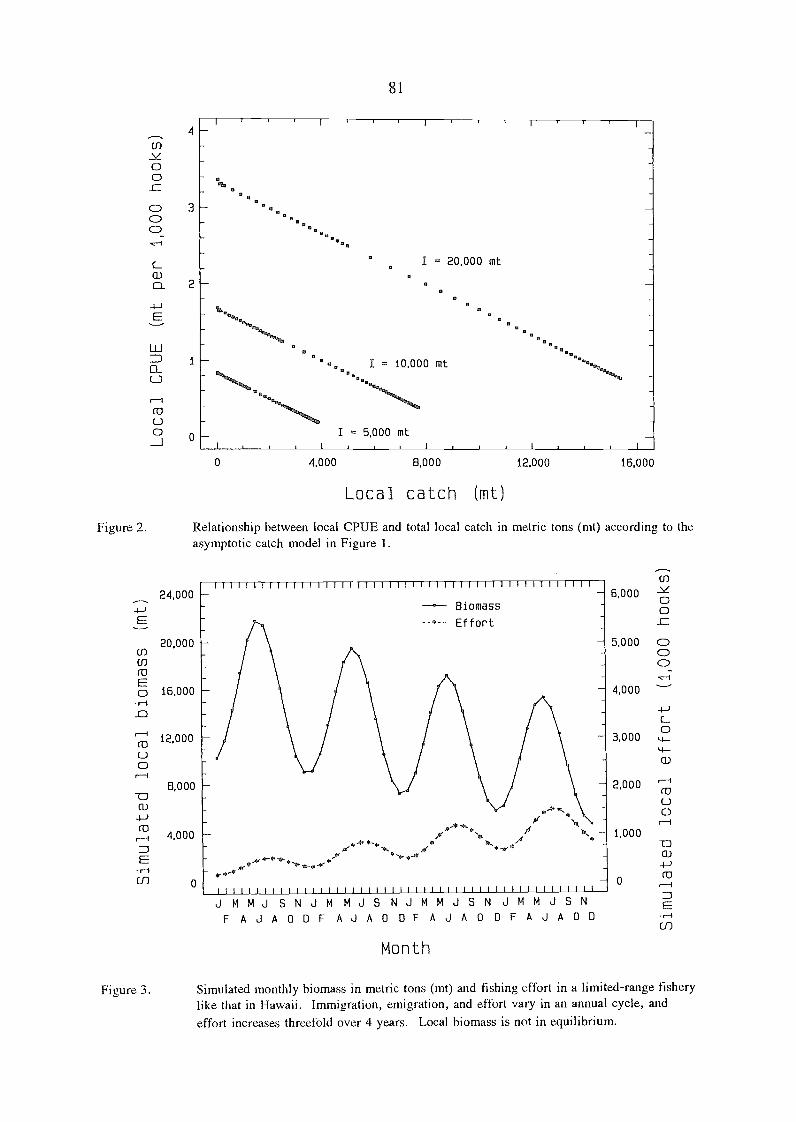
4
c_
o_ 2
E
o
24,000
E
20,000
81
Month
1111IITTIIIIIIIIIII1111-1111111111111111111111111Biomass
--e-- Effort
/1.
ilir. +1.- 4.-. T 1. . '4
Jr ..*. A' -,--...,,,v1,-*
1 1 1 1 1 1 1 1 1 1 1 1 1 1 1 1 1 1 1 1 1 1 1 1 1 1 1 1 1 1 1 1 1 1 1 1 1 1 1 1111JMMJSNJMMJSNJMMJSNJMMJSNF AJAODF AJAD DF AJAODFAJAOD
6,000o0
5,000 0e-1
4,000
4-)C-
3,000
o
16,00012,0000 4,000 8,000
Local catch (mt)
Figure 2. Relationship between local CPUE and total local catch in metric tons (mt) according to theasymptotic catch model in Figure 1.
2,000 rouorH
12,000rouo8,000
-0
r-1 4,000
EU) 0
SimulateAJ monthly biomass in metric tons (mt) and fishing effort in a limited-range fisherylike that in Hawaii. Immigration, emigration, and effort vary in an annual cycle, andeffort increases threefold over 4 years. Local biomass is not in eAvilibrium.
Figure 3.

When the simulated CPUE data and catch are plotted, there is a clear relationshipbetween CPUE and catch, although the slope is different for each month of the year(Figure 4) in keeping with the monthly changes in /, M', and F. The nonlinearity ofrelationships for each month is due to lag effects under nonequilibrium conditions (thenonlinearity disappears when CPUE for each month is plotted versus catch for the 5-month period ending that month). Ignoring the nonlinearity, multiple regression ofseasonally-adjusted CPUE on catch and first-order interactions between catch and monthsexplains 96% of the variance in the simulated data, suggesting that this simple analyticalapproach could work with real data. However, the simulated data contain no randomcomponents which might obscure weak relationships.
Figure 4.
2.0
1 . 6
LiJ 0.8
Cl_
82
Simulated local catch (mt)
.Simulated local catch per unit effort (CPUE) plotted versus simulated local catch in metrictons (mt) for the limited-range fishery model with seasonal variation and increasing effortas in Figure 3. Relationships between CPUE and catch for the first (dashed lines) and last(solid lines) 6 months of each year are identified by characters (1-9 for January-September,and 0, N, D for October, November, and De,cember, respectively).
Further realism was added by making immigration vary annually as well asseasonally. When immigration was reduced by 40% in alternate years, the resultingrelationship between simulated CPUE and catch was hard to perceive (Figure 5).However, using a dummy variable (1 or 0) for high and low immigration years (andincluding first-order interactions between immigration and months) made it possible to usemultiple regression to describe the slopes and intercepts of the CPUE- versus-catchrelationships for each month and level of immigration (Figure 5). These slopes andintercepts were then used to compute the asymptotic relationships between catch andeffort (Figure 6).
4-)E
1.2
o 400 800 1,200 1,600 2,000 2,400

Figure 5.
E
2.0
1.6
1.2
0.4
o
83
Simulated local catch (mt)
Simulated local catch per unit effort (CPUE) plotted versus simulated local catch in metrictons (mt) for the limited-range fishery model with immigration (I) alternating from high tolow (40% less than high) in alternate years. Relationships for an average amount ofimmigration, calculated with the multiple regression analysis are shown for June (pointslabelle,d 6) and October (points labelled 0).
In reality, local immigration is an unknown quantity, but the apparent abundanceof fish over a larger area can be used as an index of immigration in a multiple regressionanalysis of real data. It is logical that more fish would immigrate in years when they aremore abundant in the surrounding area, and this behaviour would be consistent with workshowing strong correspondence between the apparent abundance of pelagic fish in localareas and abundance on a wider scale (Wetherall and Yong, 1983; Squire and Au, 1990;Skillman and Kamer, 1992). Another mechanism that would explain the correspondencein apparent abundance would be widespread changes in catchability. In contrast, changesin immigration or local catchability due to localized environmental conditions would notbe consistent with the observed correspondence in apparent abundance, and thus the localenvironment may represent an additional source of variation.
The simulations illustrate how relationships betwe,en catch and effort within alimited area may differ seasonally and annually. The optimal level of fishing effort maybe highly dynamic, making the rational management of fishing effort difficult. AnalyzingCPUE data versus catch should at least be useful for detecting an impact of local fishingpressure on local CPUE, even when that impact differs seasonally and annually.Detecting such an impact however may require quantifying variation due to other factors.
2,400400 BOO 1,200 1,600 2,000O
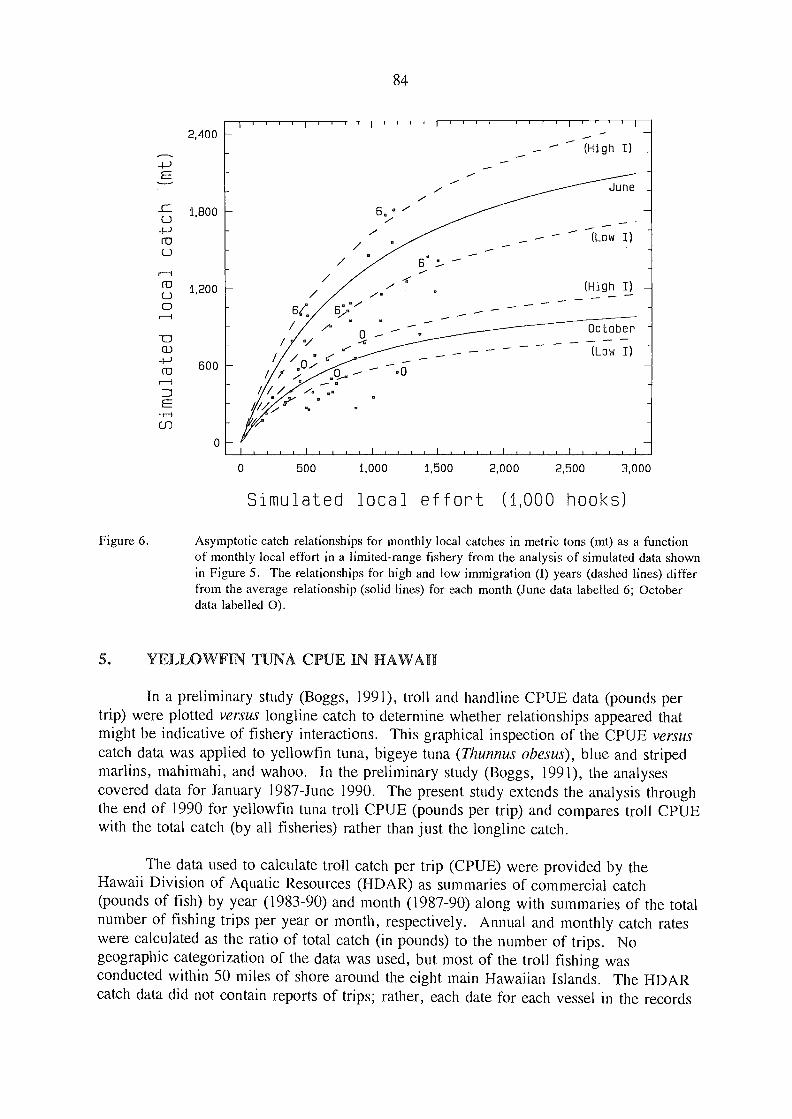
Figure 6.
E
2,400
600
84
5. YELLOWFIN TUNA CPUE IN HAWAII
In a preliminary study (Boggs, 1991), troll and handline CPUE data (pounds pertrip) were plotted versus longline catch to determine whether relationships appeared thatmight be indicative of fishery interactions. This graphical inspection of the CPUE versuscatch data was applied to yellowfin tuna, bigeye tuna (Thunnus obesus), blue and stripedmarlins, mahimahi, and wahoo. In the preliminary study (Boggs, 1991), the analysescovered data for January 1987-June 1990. The present study extends the analysis throughthe end of 1990 for yellowfin tuna troll CPUE (pounds per trip) and compares troll CPUEwith the total catch (by all fisheries) rather than just the longline catch.
The data used to calculate troll catch per trip (CPUE) were provided by theHawaii Division of Aquatic Resources (HDAR) as summaries of commercial catch(pounds of fish) by year (1983-90) and month (1987-90) along with summaries of the totalnumber of fishing trips per year or month, respectively. Annual and monthly catch rateswere calculated as the ratio of total catch (in pounds) to the number of trips. Nogeographic categorization of the data was used, but most of the troll fishing wasconducted within 50 miles of shore around the eight main Hawaiian Islands. The HDARcatch data did not contain reports of trips; rather, each date for each vessel in the records
500 1,000 1,500 2000,
I I
(High I) _
--/ .. June _-
6'i/z (Low I)/"'--/ 6' :.'-
.---/ -4.-
..-... (High I)/
6e 6').''".
--n
.. _ --/ /44 October -
.--- (Low I)
/y ;0/..-44 0
Simulated local effort (1,000 hooks)
I 1
2,500 3,000
Asymptotic catch relationships for monthly local catches in metric tons (mt) as a functionof monthly local effort in a limited-range fishery from the analysis of simulated data shownin Figure 5. The relationships for high and low immigration (I) years (dashed lines) differfrom the average relationship (solid lines) for each month (June data labelled 6; Octoberdata labelled 0).
a/ //

85
was counted as a trip if any PMUS or tuna was reported caught. The assumption of1-day trips is fairly realistic for the small-vessel troll and handline fisheries.
Catch per trip may not be a good measure of yellowfin tuna abundance sinceimportant operational changes and improvements in trolling methods have undoubtedlyoccurred over the years. The catch per trip index contains no data from trips with zerocatches, no standardization of trips as a unit of effort, no estimate or correction forunderreporting, and no estimate or correction for changes in reporting over time. Any ofthese factors could bias trends or relationships in the data, or give the appearance of atrend or relationship where none exists.
Despite these potential problems, catch per trip as an abundance index can providesome indication of changes in the local abundance or availability of fish to trollers andhandliners in Hawaii. Catch per trip indices based on HDAR data often mirror patternsseen in more sophisticated CPUE indices, such as catch per hook or catch per set, fromnearby fisheries (Wetherall and Yong, 1983; Skillman and Kamer, 1992). When the datafrom several different sources show a similar pattern, those data probably indicate a truepattern of apparent abundance unless some unknown bias affects several sources of datasimilarly. In any case, catch per trip is the only available measure of CPUE for Hawaii'stroll and handline fisheries. More definitive examinations of trends in CPUE will requiredata that more accurately specify fishing effort.
Annual troll CPUE (pounds per trip) for yellowfin tuna declined from a relativelyhigh level in 1979 to low levels in 1982-84 (WPRFMC, 1991). Troll CPUE foryellowfin tuna returned to high levels in 1987, dropped again and remained low through1989, and showed some recovery in 1990 (Boggs, 1991). The decline in troll CPUE foryellowfin tuna in 1987-1989 corresponded with a period of dramatic expansion ofHawaii's domestic longline fishery (Boggs, 1991; Ito, 1991; WPRFMC, 1991),suggesting that some fishery interactions may be occurring. The low troll CPUE seen in1982-84, however, occurred before the domestic longline fishery expanded and after theforeign longliners ceased fishing in Hawaii's EEZ, suggesting that periods of low trollCPUE may be unrelated to longline fishing effort.
The total longline catch, as estimated by the National Marine Fisheries Service(NMFS) shoreside monitoring programme, showed increasing monthly variation and anupward trend from 1987 through 1989, levelling off somewhat (annual average) in 1990(Figure 7). The longline catch estimates were for the entire range of the longline fishery,mostly within the Hawaii EEZ but extending beyond it. The range of the troll andhandline fisheries is much smaller and is roughly centred within the area fished by thelongline fishery (these data precede the establishment of nearshore area closures forlongline fishing).
The NMFS data rather than the HDAR data were used to estimate longline catchbecause they cover most of the longline catch in Hawaii, whereas the HDAR data coveronly a small fraction of that catch. Conversely, the NMFS market sample data coveronly a fraction of the troll and handline catch and do not distinguish between these twogear types, which have markedly different catch rates. Therefore to obtain total catch,the HDAR data on the catch by gear other than longline (mostly troll and handline) werecombined with NMFS estimates of the longline catch. A potentially large component of
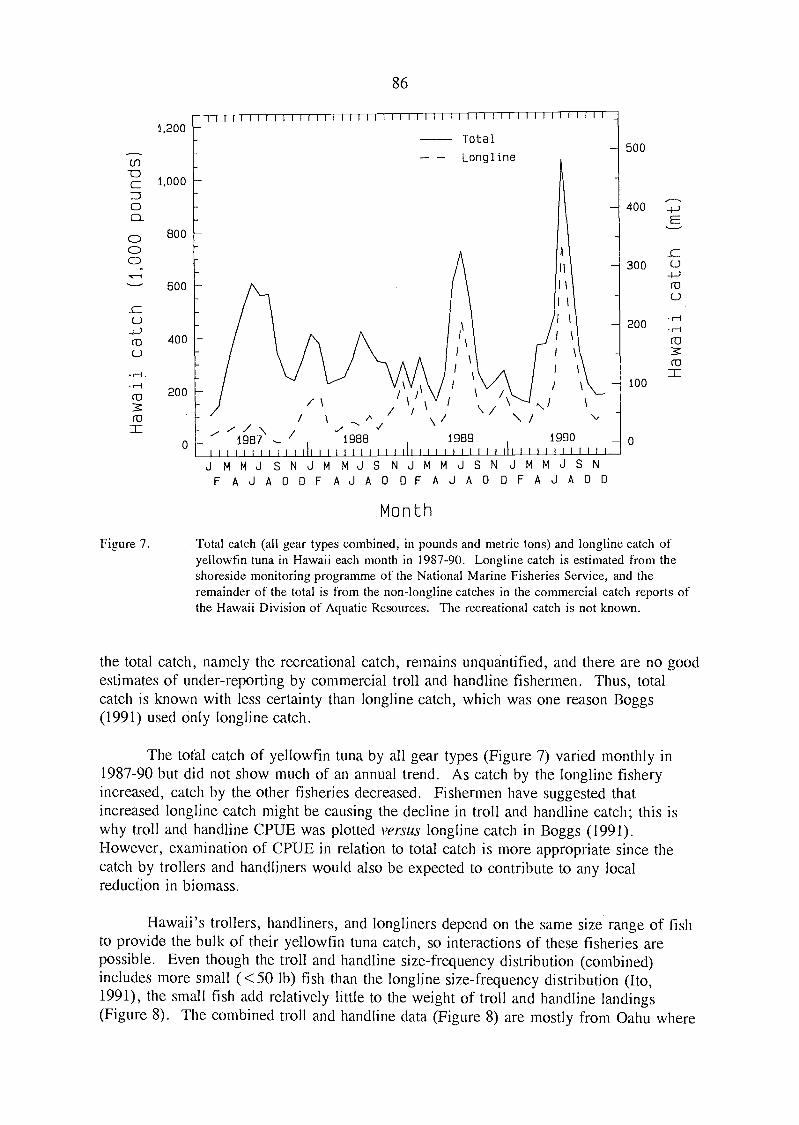
Figure 7.
1,200
600
(-J4-)co 400L)
0
86
111111111111111111111111111111111111111111111111Total
- - Longline
A
\1
/ / \ -/ /
I \J \
..
/\
//7\
/ \ ..,/ / / N
\ \ / ,-... ..,
1987 -/ ..,
198897i[1 Ili 1
1989
J MMJ SNJM MJS NJMMJSN JMMJSNF AJAODF AJAD DF AJAD OF AJAOD
Month
500
400E
_c300 u
4-1ro
u-
200
(13
ro
IC100
o
Total catch (all gear types combined, in pounds and metric tons) and longline catch ofyellowfin tuna in Hawaii each month in 1987-90. Longline catch is estimated from theshoreside monitoring programme of the National Marine Fisheries Service, and theremainder of the total is from the non-longline catches in the commercial catch reports ofthe Hawaii Division of Aquatic Resources. The recreational catch is not known.
the total catch, namely the recreational catch, remains unquantified, and there are no goodestimates of under-reporting by commercial troll and handline fishermen. Thus, totalcatch is known with less certainty than longline catch, which was one reason Boggs(1991) used only longline catch.
The total catch of yellowfin tuna by all gear types (Figure 7) varied monthly in1987-90 but did not show much of an annual trend. As catch by the longline fisheryincreased, catch by the other fisheries decrease,d. Fishermen have suggested thatincreased longline catch might be causing the decline in troll and handline catch; this iswhy troll and handline CPUE was plotted versus longline catch in Boggs (1991).However, examination of CPUE in relation to total catch is more appropriate since thecatch by trollers and handliners would also be expected to contribute to any localreduction in biomass.
Hawaii's trollers, handliners, and longliners depend on the same size range of fishto provide the bulk of their yellowfin tuna catch, so interactions of these fisheries arepossible. Even though the troll and handline size-frequency distribution (combined)includes more small (<50 lb) fish than the longline size-frequency distribution (Ito,1991), the small fish add relatively little to the weight of troll and handline landings(Figure 8). The combined troll and handline data (Figure 8) are mostly from Oahu where
800CD
CD
200
r-I- r-1
ro
ro
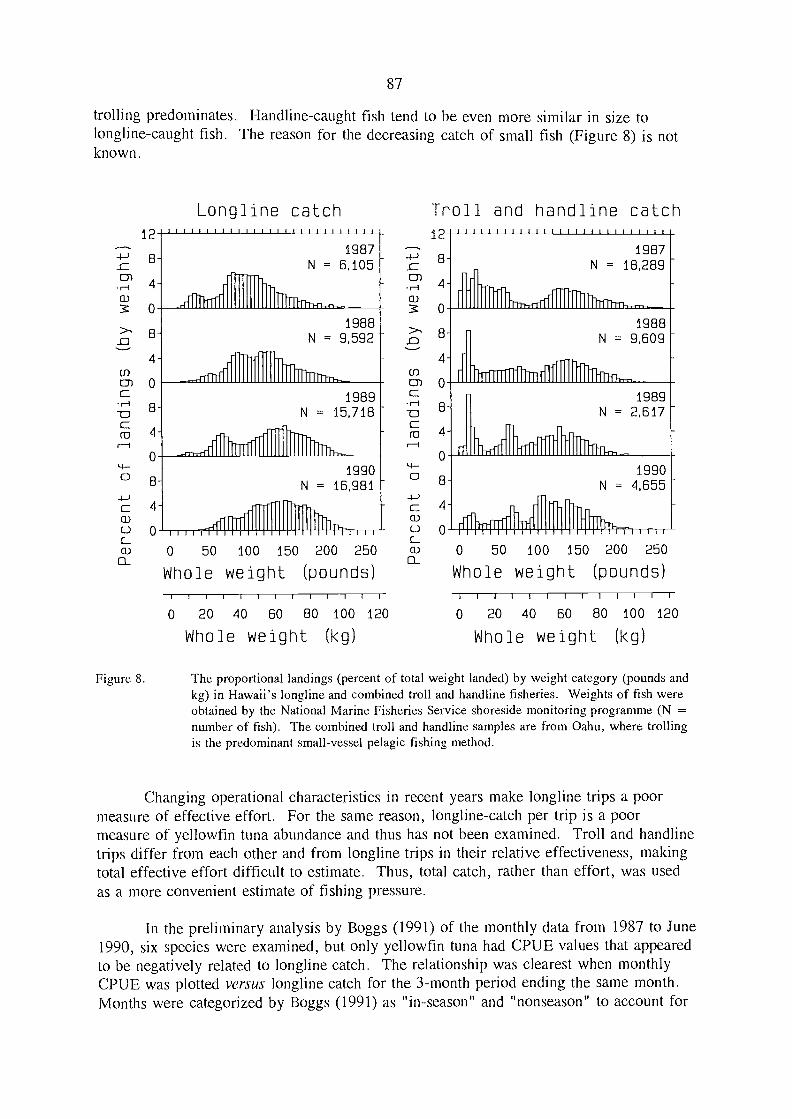
trolling predominates. Handline-caught fish tend to be even more similar in size tolongline-caught fish. The reason for the decreasing catch of small fish (Figure 8) is notknown.
o
>'
Figure 8.
4-
Longline catch
rarrff
,fr
it 111111 t t il 11
1987N = 6,105
1988N = 9,592 -
Titrrrm,
1989N = 15,718 -
1990N = 16,981 -
aiU n TrfarC_
CD 0 50 100 150 200 250
Whole weight (pounds)
0 20 40 60 BO 100 120
Whole weight (kg)
87
Troll and handline catch
12 '1.1 11111 1 1111
4-
O
8-
4-
O
0 50 100 150
1987N = 18,289
1Trrn-m
1989N = 2,617 -
1990N = 4,655
200
litt250
Whole weight (pounds)
1 1 i t 1 1 1 1 j 1 1 1 1 1 1 1 1 1 1
0 20 40 60 80 100 120
Whole weight (kg)
The proportional landings (percent of total weight landed) by weight category (pounds andkg) in Hawaii's longline and combine,d troll and handline fisheries. Weights of fish wereobtaine,d by the National Marine Fisheries Service shoreside monitoring programme (N =number of fish). The combined troll and hanclline samples are from Oahu, where trollingis the predominant small-vessel pelagic fishing method.
Changing operational characteristics in recent years make longline trips a poormeasure of effective effort. For the same reason, longline-catch per trip is a poormeasure of yellowfin tuna abundance and thus has not been examined. Troll and handlinetrips differ from each other and from longline trips in their relative effectiveness, makingtotal effective effort difficult to estimate. Thus, total catch, rather than effort, was usedas a more convenient estimate of fishing pressure.
In the preliminary analysis by Boggs (1991) of the monthly data from 1987 to June1990, six species were examined, but only yellowfin tuna had CPUE values that appearedto be negatively related to longline catch. The relationship was clearest when monthlyCPUE was plotted versus longline catch for the 3-month period ending the same month.Months were categorized by Boggs (1991) as "in-season" and "nonseason" to account for
12
_c8
CD
a)4
8-1988
N = 9,609 -
-p-Tr.
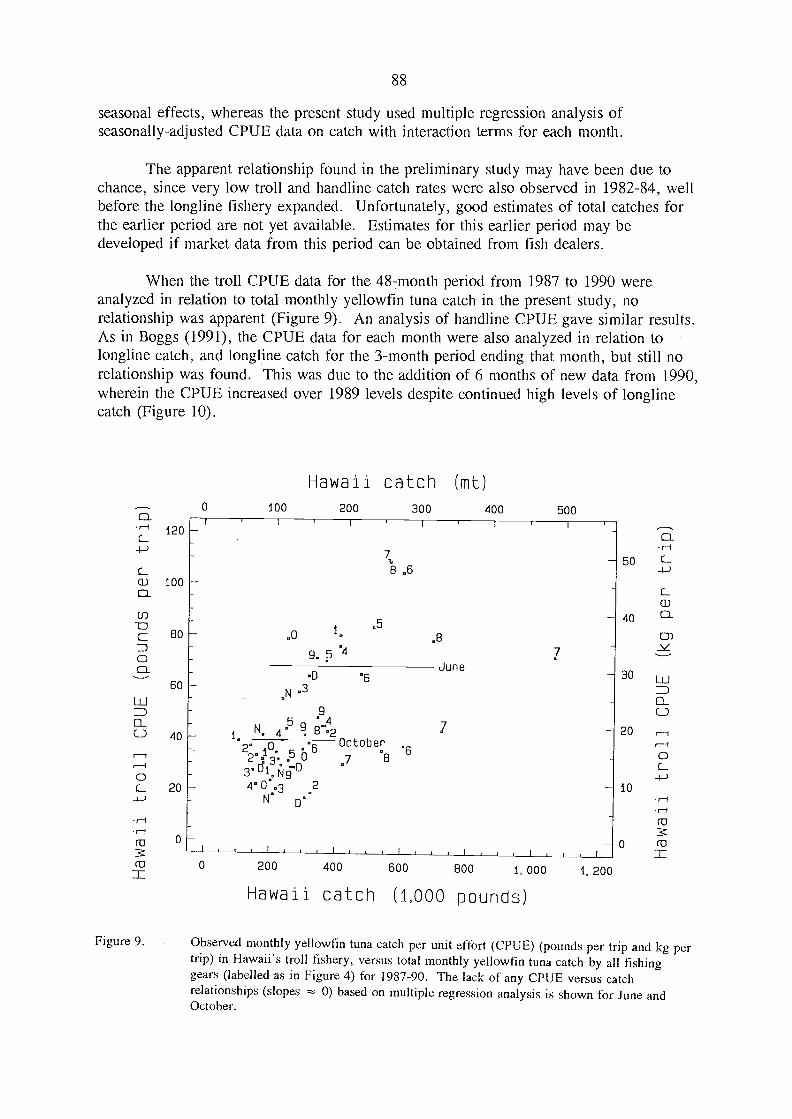
Figure 9.
88
seasonal effects, whereas the present study used multiple regression analysis ofseasonally-adjusted CPUE data on catch with interaction terms for each month.
The apparent relationship found in the preliminary study may have been due tochance, since very low troll and handline catch rates were also observed in 1982-84, wellbefore the longline fishery expanded. Unfortunately, good estimates of total catches forthe earlier period are not yet available. Estimates for this earlier period may bedeveloped if market data from this period can be obtained from fish dealers.
When the troll CPUE data for the 48-month period from 1987 to 1990 wereanalyzed in relation to total monthly yellowfin tuna catch in the present study, norelationship was apparent (Figure 9). An analysis of handline CPUE gave similar results.As in Boggs (1991), the CPUE data for each month were also analyzed in relation tolongline catch, and longline catch for the 3-month period ending that month, but still norelationship was found. This was due to the addition of 6 months of new data from 1990,wherein the CPUE increased over 1989 levels despite continued high levels of longlinecatch (Figure 10).
Observed monthly yellowfin tuna catch per unit effort (CPUE) (pounds per trip and kg pertrip) in Hawaii's troll fishery, versus total monthly yellowfin tuna catch by all fishinggears (labelled as in Figure 4) for 1987-90. The lack of any CPUE versus catchrelationships (slopes 0) based on multiple regression analysis is shown for june andOctober.
EL
Hawaii catch (mt)O 100 200 300 400 500
120C_
50 C_
8 .6CD
ca100
C_
a)c.o
-oBO
.5.0 1.
.8
40
C:n
o 9. p
.D °6June
30LL..160 y-
°3.NLLI
9 C.)D- 5 ° 4
U 40 N°8'02
1.°6
20 r-I
o- October2° 10. 5 6
.8.7o 3. [5i.
L 20 4° 0".3 2 10
co
(1:) o n3
O 200 400 600 BOO 1, 000 1, 200
Hawaii catch (1,000 pounds)
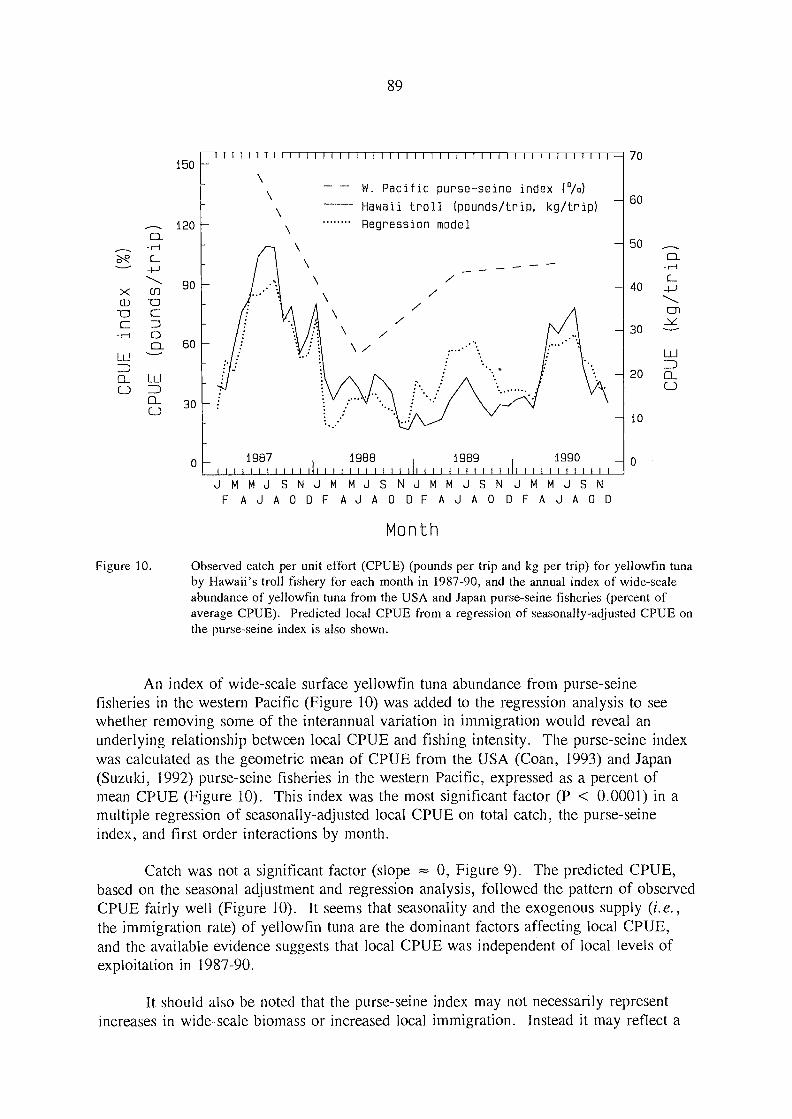
150
90X U1
-o CEJc
CI 60
Figure 10,
30
o
89
111111111111111111111111111111111111111111111111
W. Pacific purseseine index (°/o)
Hawaii troll (pounds/trip, kg/trip)
Regression model
JMMJSNJMMJS NJMMJSNJMMJSNF AJAODF AJAODF AJA 0 OF AJAOD
Month
70
60
50
40
30
20
10
o
Observed catch per unit effort (CPUE) (pounds per trip and kg per trip) for yellowfin tunaby Hawaii's troll fishery for each month in 1987-90, and the annual index of wide-scaleabundance of yellowfin tuna from the USA and Japan purse-seine fisheries (percent ofaverage CPUE). Predicted local CPUE from a regression of seasonally-adjusted CPUE onthe purse-seine index is also shown.
An index of wide-scale surface yellowfin tuna abundance from purse-seinefisheries in the western Pacific (Figure 10) was added to the regression analysis to seewhether removing some of the interannual variation in immigration would reveal anunderlying relationship between local CPUE and fishing intensity. The purse-seine indexwas calculated as the ge,ometric mean of CPUE from the USA (Coan, 1993) and Japan(Suzuki, 1992) purse-seine fisheries in the western Pacific, expressed as a percent ofmean CPUE (Figure 10). This index was the most significant factor (P < 0.0001) in amultiple regression of seasonally-adjusted local CPUE on total catch, the purse-seineindex, and first order interactions by month.
Catch was not a significant factor (slope 0, Figure 9). The predicted CPUE,base,d on the seasonal adjustment and regression analysis, followed the pattern of observedCPUE fairly well (Figure 10). It seems that seasonality and the exogenous supply (i.e.,the immigration rate) of yellowfin tuna are the dominant factors affecting local CPUE,and the available evidence suggests that local CPUE was independent of local levels ofexploitation in 1987-90.
It should also be note,d that the purse-seine index may not necessarily representincreases in wide-scale biomass or increased local immigration. Instead it may reflect a
1987 1988 1989 19901111111111 1 1111111111111111 1 1 1 1 III 11111111111
90
widespread change in catchability caused by environmentally-induced changes inbehaviour and vulnerability to fishing gear.
There is clearly a need for more research on the local distribution dynamics oftropical pelagic species. Simulation models could be much more helpful if more wasknown about true abundance and fish-movement dynamics. Tagging studies would be agood way to get such information, if they coincide with improved fisheries data collectionemphasizing the geographic distribution of fishing effort and catch. The results ofprevious studies make it clear that local fisheries data alone may not provide evidence ofexisting fisheries interactions, because of the important effects of exogenous factors suchas changes in stock-wide abundance and catchability. Environmental influences on fishmovements and catchability may also play an important role that must be investigated.
ACKNOWLEDGMENTS
The NMFS data summaries for this study were provided by Sam Pooley (NMFSHonolulu Laboratory), and the HDAR data summaries were provided by Reggie Kokubun(State of Hawaii Department of Land and Natural Resources) and Reese Tokunaga(NMFS Honolulu Laboratory).
REFERENCES CITED
Boggs, C.H. 1991. A preliminary examination of catch rates in Hawaii's troll andhandline fisheries over a period of domestic longline fishery expansion. NOAAAdmin.Rep.NMFS-SWFC, Honolulu, H-91-05:62 p.
Coan, A. 1993. U.S. distant-water and artisanal fisheries for yellowfin tuna in thecentral and western Pacific. In Proceedings of the First FAO Expert Consultation onInteractions of Pacific Tuna Fisheries, edited by R.S. Shomura, J. Majkowski, and S.Langi, 3-11 December 1991, Noumea, New Caledonia. [See this docuinent.]
IATTC. 1992. Annual report of the Inter-American Tropical Tuna Commission, 1990.Annu.Rep.1-A17C, (1990):261 p.
Ito, R.Y. 1991. Western Pacific pelagic fisheries in 1990. NOAA Admin.Rep.NMFS-SWFC, Honolulu, H-91-10:43 p.
Lovejoy, W.S. 1977. A BFISH population dynamics analysis of the impact of severalalternative fishery management policies in the Hawaiian Fishery Conservation Zone(FCZ) on the Pacific stocks and Hawaiian sport fishing yields of blue and striped marlins.Western Pac.Reg.Fish.Mgt.Council, Honolulu, Contract Report, WP-77-107:33 p.
Lovejoy, W.S. 1981. BFISH revisited. Western Pac.Reg.Fish.Mgt. Council, Honolulu,Contract Report:37 p.
NMFS. 1989. Guidelines for fishery management plans. U.S. Dep. Commer., NOAA,NMFS, 50 CFR, Part 602, 96 p.
91
NMFS. 1991. Status of Pacific oceanic living marine resources of interest to the USAfor 1991. NOAA Tech.Memo.NMFS-SWFC, (165):78 p.
Sathiendrakumar, R., and C.A. Tisdell. 1987. Optimal economic fishery effort in theMaldivian tuna fishery: an appropriate model. Mar.Res.Econ., 4:15-44.
Skillman, R.A., and G.L. Kamer. 1992. A correlation analysis of Hawaii and foreignfisheries statistics for billfishes, mahimahi, wahoo, and pelagic sharks, 1962-78. NOAAAdmin.Rep.NMFS-SWFC, Honolulu, H-92-05:44 p.
Squire, J., and D. Au. 1990. A case for local depletion and core area management. InPlanning the future of billfishes, research and management in the 90's and beyond. Part2. Contributed papers, edited by R.H. Stroud. Mar.Rec.Fish., Natl. Coalition Mar.Conserv., 13:199-214.
Suzuki, Z. 1989. Catch and fishing effort relationships for striped marlin, blue marlin,and black marlin in the Pacific Ocean, 1952 to 1985. In Planning the future of billfishes,research and management in the 90's and beyond. Part 1. Fisheries and stock synopses,data needs, and management, edited by R.H. Stroud. Mar.Rec.Fish., Natl. CoalitionMar. Conserv., 13:165-77.
Suzuki, Z. 1992. A brief review of interaction between purse seine and longline onyellowfin tuna Thunnus albacares, in the western and central Pacific ocean. InProceedings of the First FAO Expert Consultation on Interactions of Pacific TunaFisheries, edited by R.S. Shomura, J. Majkowski, and S. Langi, 3-11 December 1991,Noumea, New Caledonia. [See this document.]
Wetherall, J.A., and M.Y.Y. Yong. 1983. An analysis of some factors affecting theabundance of blue marlin in Hawaiian waters. NOAA Admin.Rep. NMFS-SWFC,Honolulu, H-83-16:33 p.
WPRFMC. 1986. Fishery management plan for the pelagic fisheries of the WesternPacific Region. Western Pac.Reg.Fish.Mgt.Council, Honolulu.
WPRFMC. 1991. Pelagic fisheries of the Western Pacific Region 1990 -- AnnualReport. Western Pac.Reg.Fish.Mgt.Council, Honolulu, 98 p.
92
INTERACTIONS AMONG FISHERIES: TAG-RECAPTURE METHODS FORESTIMATING THE EFFECT ON CATCHES OF
C IANGING FISHING INTENSITY'
William S. HearnCSIRO Division of Fisheries, Marine Laboratories
G.P.O. Box 1538, Hobart, Tasmania, 7001, Australia
and
Alexander Mazanov2School of Biological Science
University of New South WalesP.O. Box 1, Kenningston
New South Wales, 2033, Australia
ABSTRACT
A tag-recapture experiment is suggested for determining the effect that a change inthe fishing intensity of one fishery will have on its own catch and on the catch of another.The results are expressed as size-based formulae in terms of one control variable: theproportional change in the fishing intensity of the altered fishery. There is norequirement to develop a complex parametric model of the dynamics of the populationand fisheries or to collect comprehensive effort data. For the year-class being studied,the ideal experimental design requires that a representative sample of the fish caught byone fishery be tagged, and all tagged fish recaptured by the same fishery be re-released.In the second fishery (or fisheries), no fish need be tagged or re-released. Alternativeequivalent procedures to re-releasing tagged fish are described. The fish population andfisheries are assumed to be independent of the sizes of the population and catch, i.e. alinear dynamic system is postulated. The formulae are proven for two population modelsfor which, (i) two fisheries catch fish from a common, homogeneously mixed population,and (ii) two fisheries catch fish from separate grounds (fish may migrate betweengrounds). Experimental design and formulae are developed to assess interactions whenthe fishing intensities of two or more fisheries are to be changed or a new fishery isproposed. The results are compared with those from another experiment that requires arepresentative sample of the population be tagged before they are old enough to berecruited to the fisheries.
Paper submitted to ICES J.Mar.Sci. for publication.
2 Dial shortly after preparation of an early draft of the manuscript.
93
A TAG-RELEASE/RECOVERY METHOD FOTI PREDICTINGTHE EFFECT OF CHANGING THE CATCH OF ONE COMPONENT OF
A FISHERY UPON THE REMAINING COMPONENTS'
Jacek Majkowski and William S. HearnCSIRO Division of Fisheries, Marine Laboratories
G.P.O. Box 1538, Hobart, Tasmania, 7001, Australia
and
Ronald L. SandlandCSIRO Division of Mathematics and Statistics
P.O. Box 218, Lindfield, NSW, 2070, Australia
ABSTRACT
We describe (and illustrate, using data on southern bluefin tuna, Thunnusmaccoyii) a tag-release/recovery experiment designed to predict the effect of changing thecatch of one component of a fishery upon the remaining components for which fishingpatterns and intensities are fixed. Formulae are developed for estimating the predictedchanges and their standard errors. We also demonstrate how to determine the number offish that should be tagged to achieve a desired accuracy of results from such anexperiment. The proposed approach requires neither comprehensive knowledge ofmechanisms governing the fish population and fishery being considered nor extensivehistorical catch and fishing effort data, but it will reflect all aspects of the dynamics of thesystem if the tag-release/recovery experiment is properly implemented. Consequently, itcan be applied to many complex fisheries systems for which this knowledge is lacking.However, the proposed approach does not enable predictions to be made when the changein the catch significantly alters the number of recruits to the fishable stock, changes thefish behaviour, or changes the rates of natural mortzlity, migration, or growth.
Published: Majkowski, J., W.S. Hearn, and R.L. Sandland. 1988. A tag-release/re,covery method forpredicting the effect of changing the catch of one component of a fishery upon theremaining components. Can.J.Fish.Aquat.Sci., 45:675-84.
94
ASSESSMENT OF SKIPJACK FISHERY INTERACTION INTHE EASTERN TROPICAL ATLANTIC USING TAGGING DATA
Pierre KleiberLa Jolla Laboratory
Southwest Fisheries Science CenterNational Marine Fisheries Service, NOAA
La Jolla, California 92038 U.S.A.
and
Alain FonteneauO.R.S.T.O.M
Centre de Recherches OcéanographiquesDakar, Senegal
ABSTRACT
Using tagging data and catch-and-effort data from the eastern tropical Atlanticskipjack fisheries, two models were constructed for the purpose of assessing fisheryinteraction among skipjack fisheries in that area.
The first model deals with fish harvest, natural mortality, diffusive movement,and seasonal advective movement of tagged fish. Fitting this model to tagging datagave estimates of catchability, natural mortality, and parameters of movement. Theresults concerning movement imply that diffusive movement and advective movementare of about equal importance. The amplitude of annual cyclic advective displace-ment in the model is of the order of 1,000 km, and the average diffusive displacementin 6 months is approximately the same.
The parameter estimates obtained from the first model were incorporated intoa similar model for untagged fish with a recruitment sub-model added in. By fittingthis second model to catch-and-effort data, we were able to estimate paraxneters ofthe recruitment sub-model. We could then investigate interaction with this modelby running it under various hypothetical regimes of fishing effort to determine howchanging the effort in one region would affect the catch of fisheries operating in otherregions. The interaction was small. Doubling the effort in one zone caused at most a5% decrease in the catch of other zones.
. INTRODUCTION
Although this work concerns the Atlantic Ocean, rather than the Pacific, it ispresented here as an exercise in assessing interaction among fisheries operating inseparate geographic zones. The degree of interaction between fisheries depends onthe exploitation rate, that is, the fraction of total population turnover that is dueto fishing mortality. Interaction between geographically separated fisheries dependsadditionally on movement of fish from one fishing zone to another. Tagging datacontain powerful information on both turnover and movement. Our purpose, there-
FAO LIBRARY AN: 346117

95
fore, was to use skipjack tagging data as well as fishery data from the eastern tropicalAtlantic (ETA) to estimate parameters of a simulation model of fish populationdynamics, harvest, and movement. In the fitting procedu're we utilized two similarmodels one dealing with tagged fish to get movement and turnover informationfrom tagging data, and one dealing with untagged fish to get recruitment informationfrom catch data. The tag data we used are the results of the International Skip jackYear Programme conducted by the International Commission for the Conservation ofAtlantic Tuna (ICCAT), for which tagged skipjack were released in various zones andvarious months during 1980 and 1981.
After estimating the parameters, we adjusted the untagged fish model to listpredicted catch under the existing (or nominal) regime of effort in the fisheries. Thenwe compared the nominal catch with catch under various altered regimes of effort tosee to what degree changes in the effort in one fishery can affect the catches in otherfisheries.
The skip jack fisheries in the ETA are located along the coast of west Africa fromSenegal to Angola (Figure 1). They consist of two gear types, purse-seine and pole-and-line. Previous analyses of data from the International Skip jack Year have indi-cated that skipjack in the ETA are under-exploited (Bard, 1986; Cayré et al., 1986;Kleiber et al., 1984). As such, little interaction among fisheries is to be expected.These assessments were not conducted with the benefit of quantitative informationon skip jack movement within the region. They therefore dealt with the region asa whole and did not exclude the possibility of local areas within the region havinghigher than average exploitation rates and thereby having a deleterious effect on otherlocal areas. The present assessment of interaction among fisheries in the region dealsexplicitly and quantitatively with movement.
2. FIRST MODEL
2.1 Desc ° °on of the Mode
The catch-and-effort data for ETA skip jack fisheries were aggregated into fivezones along the west African coast (Figure 1). Little fishing effort, and no tag re-turns, have occurred outside these zones. Accordingly, we decided to simplify mattersby making a movement model in one dimension (along the coast) rather than in twodimensions. Movement of fish away from the coast was therefore confounded withnatural mortality, and our model has five spatial compartments corresponding tothe five fishing zones. Skip jack do range beyond the northern and southern limitsof these fishing zones. We therefore added five extra compartments to the north andfive to the south so as not to impose artificial restrictions on skip jack movement dueto the boundaries of the model.
The change in the number of tagged fish at large in any zone, T1, depends on thepopulation of tagged fish in zone i and in neighboring zones as follows:
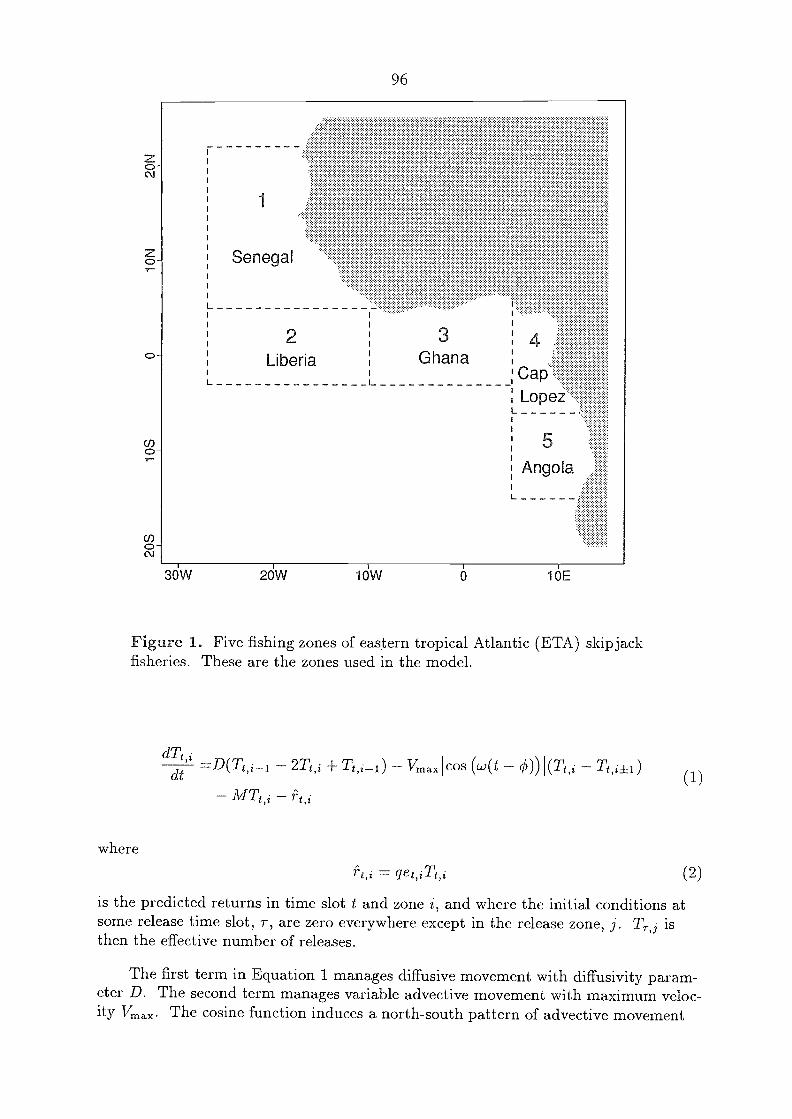
Senegal
2 3 4Liberia Ghana
CapLopez
5
Angola
Figure 1. Five fishing zones of eastern tropical Atlantic (ETA) skip jackfisheries. These are the zones used in the model.
dTt,i
96
dt,D(Tt,i_i 2Ti,i Tt,i-1) Vmax
MTt,i
where
= get,iTt,i (2)
is the predicted returns in time slot t and zone i, and where the initial conditions atsome release time slot, 7-, are zero everywhere except in the release zone, j. T,-,1 isthen the effective number of releases.
The first term in Equation 1 manages diffusive movement with diffusivity param-eter D. The second term manages variable advective movement with maximum veloc-ity Vmax. The cosine function induces a north-south pattern of advective movement
cos (w(t 0))I(Tt,i Tt,i±1)(1)
3(}W 2ÓW 16E
97
that cycles in intensity and direction. We did this because in the catch-per-unit-effort (CPUE) data there is a hint of annual north-south movement (Figure 2a). Thesubscript, i 1, points to the neighbouring zone that' is upstream in the movement.Plus or minus in that subscript is chosen appropriately, depending on the sign of thecosine function.
The third term in Equation 1 is natural mortality with parameter M, and thefourth term is capture by the fishery. The number of captures in any time slot, t, andzone, i, is given by Equation 2, where q is the catchability and et,i is the fishing effort.
2.2 Fitting the First Model to Tag Data
We aggregated the tag-release data into sets consisting of releases in one zonewithin one month, and for each release set we eliminated releases, and returns there-from, of fish that seemed to be in a different cohort from the bulk of the fish in theset. Six of the resulting release sets had 1999 or more releases. Two of those oc-curred within a few months of the end of the available fishery data, and we chose toconcentrate on the remaining four sets. The zones and months of release are indi-cated in Figures 3a-d, along with plots of the number of returns by zone and month.
The effective number of releases is less than the actual number released by afactor, a, that is
T = aR (3)
where a is the proportion of fish that survive and do not shed their tags shortly aftertagging multiplied by the proportion of recaptured tags that are returned by fisher-men with useful information on time and location of recapture. In working with theInternational Skip jack Year tagging data, Bard (1986) estimated that a is between0.48 and 0.72. We chose to use a value of 0.6, which is the middle of the range.
Because there are two gear types involved in the ETA skip jack fisheries, we hadto deal with returns from both types of gear. Rather than explicitly providing formore than one gear type in our models, we chose to combine the purse-seine and pole-and-line catch, effort, and recovery data. To combine the effort data, we estimateda conversion factor for converting pole-and-line effort into purse-seine equivalents bycomparing CPUE for the two gears for the three years covering the period of recovery(1980-1982). For the middle zone (Ghana), where most of the pole-and-line effortis exerted, the conversion procedure was more involved because the size distributionin the catch in this zone was markedly different for the two gear types (Figure 4).Because the skip jack grow rapidly (approximately 1 cm per month at the size atwhich they were tagged), the conversion from effort in one gear-type to equivalentsin the other changes significantly during the time the fish are at large. Thereforefor each tag set we generated a time series of effort in the Ghana zone by noting theaverage size of tagged fish at time of release and advancing the presumed size of thecohort of tagged fish by 1 cm per month. We then assumed that the ratio of pole-and-line effectiveness to purse-seine effectiveness for each month was the ratio of thepole-and-line and the purse-seine selectivity line in Figure 4 at the presumed averagefish size for that month.
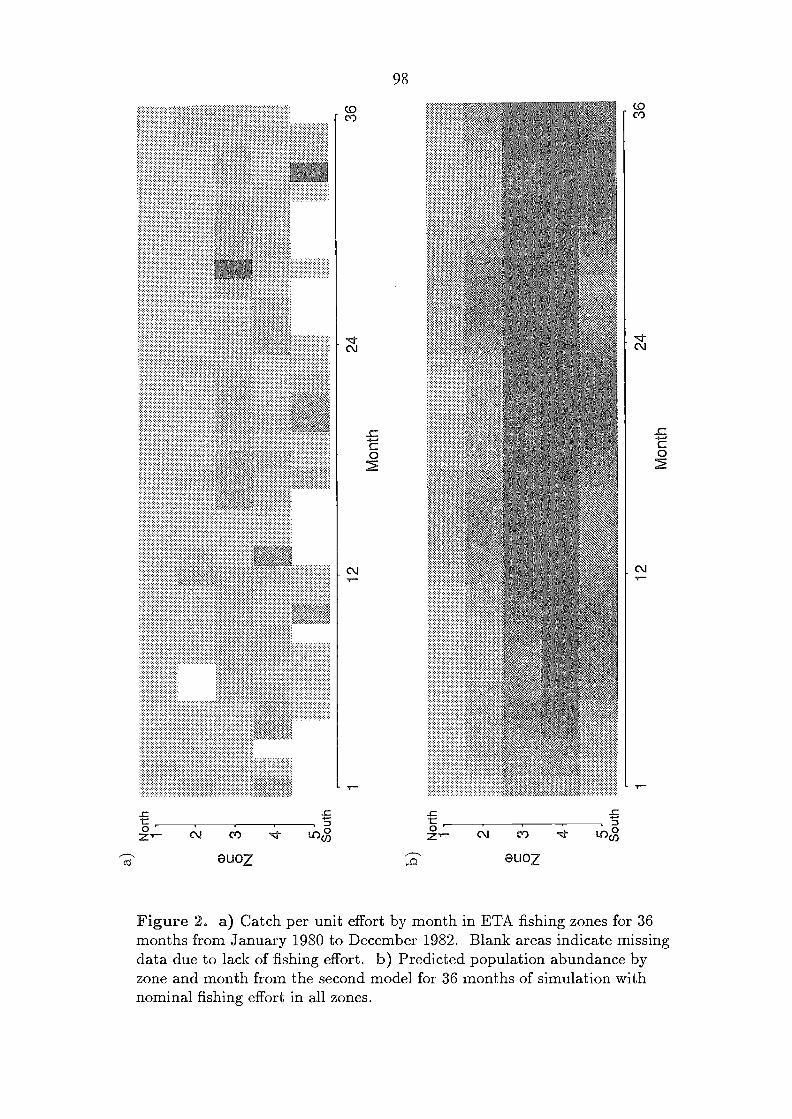
_c _cc "5o '
c4) mug)zY-
OUOZ
Figure 2. a) Catch per unit effort by month in ETA fishing zones for 36months from January 1980 to December 1982. Blank areas indicate missingdata due to lack of fishing effort. b) Predicted population abundance byzone and month from the second model for 36 months of simulation withnominal fishing effort in all zones.
98
Nr
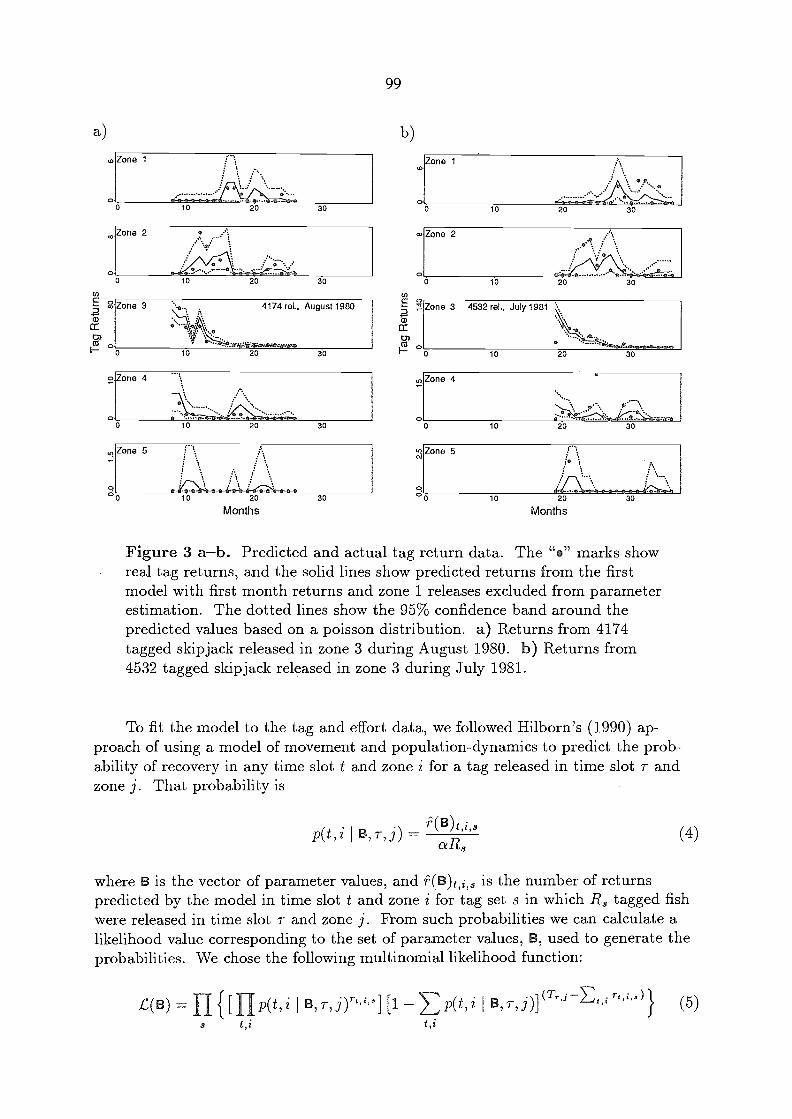
o
o
o
99
Figure 3 ab. Predicted and actual tag return data. The "e" marks showreal tag returns, and the solid lines show predicted returns from the firstmodel with first month returns and zone 1 releases excluded from parameterestimation. The dotted lines show the 95% confidence hand around thepredicted values based on a poisson distribution. a) Returns from 4174tagged skipjack released in zone 3 during August 1980. b) Returns from4532 tagged skip jack released in zone 3 during July 1981.
To fit the model to the tag and effort data, we followed Hilborn's (1990) ap-proach of using a model of movement and population-dynamics to predict the prob-ability of recovery in any time slot t and zone i for a tag released in time slot T andzone j. That probability is
p(t,i 13,7 i) (4)
where B is the vector of parameter values, and f-(B)t,i,, is the number of returnspredicted by the model in time slot t and zone i for tag set s in which R, tagged fishwere released in time slot T and zone j. From such probabilities we can calculate alikelihood value corresponding to the set of parameter values, B, used to generate theprobabilities. We chose the following multinomial likelihood function:
C(B) II { 11P(t7i 113, 7-11)rt "][1
fZone 5
A
00 10 20
Months30
Zone 5
20
Months3010
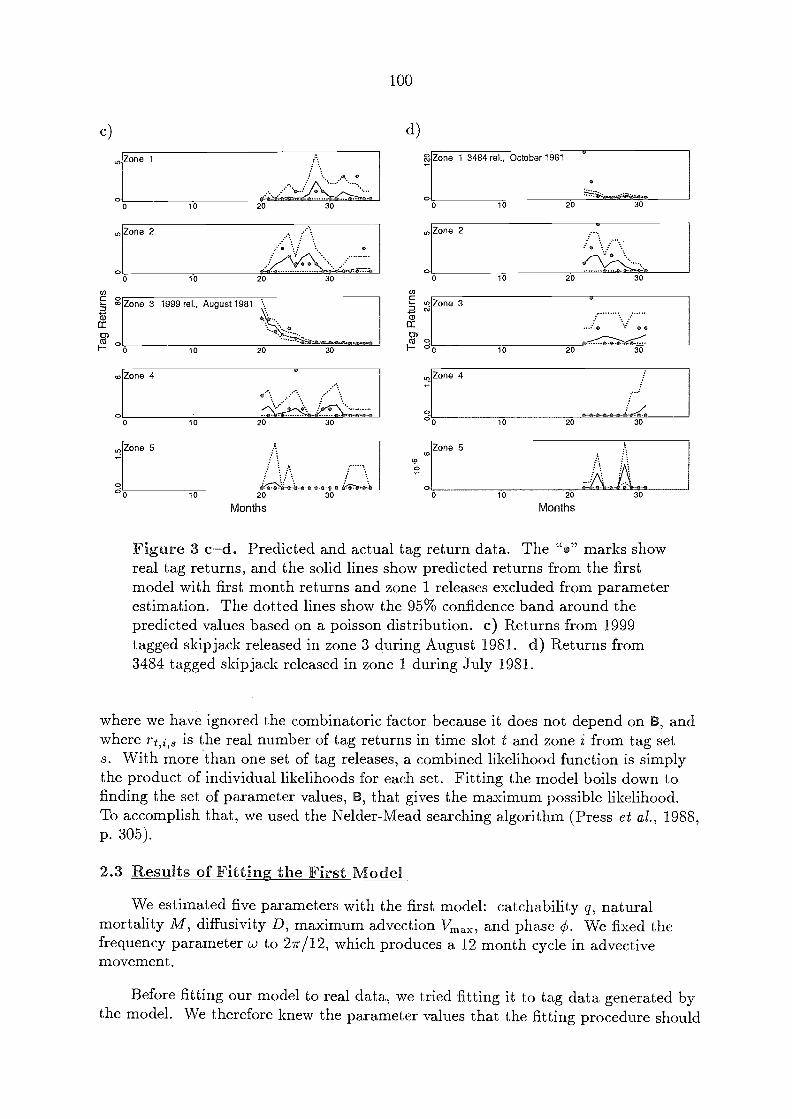
, Zone 2
Zone 3 19 9 rel., August 198
\00
30
100
c) d)
Zone 1 3484 rel., October 1981
Figure 3 cd. Predicted and actual tag return data. The "." marks showreal tag returns, and the solid lines show predicted returns from the firstmodel with first month returns and zone 1 releases excluded from parameterestimation. The dotted lines show the 95% confidence band around thepredicted values based on a poisson distribution. c) Returns from 1999tagged skipjack released in zone 3 during August 1981. d) Returns from3484 tagged skip jack released in zone 1 during July 1981.
where we have ignored the combinatoric factor because it does not depend on B, andwhere r,j,3 is the real number of tag returns in time slot t and zone i from tag sets. With more than one set of tag releases, a combined likelihood function is simplythe product of individual likelihoods for each set. Fitting the model boils down tofinding the set of parameter values, B, that gives the maximum possible likelihood.To accomplish that, we used the Nelder-Mead searching algorithm (Press et al., 1988,p. 305).
2.3 Results of Fitting the First Model
We estimated five parameters with the first model: catchability q, naturalmortality M, diffusivity D, maximum advection Vmax, and phase 0. We fixed thefrequency parameter co to 27/12, which produces a 12 month cycle in advcctivemovement.
Before fitting our model to real data, we tried fitting it to tag data generated bythe model. We therefore knew the parameter values that the fitting procedure should
o
.....
o 10 20 30
Zone 2
o 10 20 3010 20 o
2010
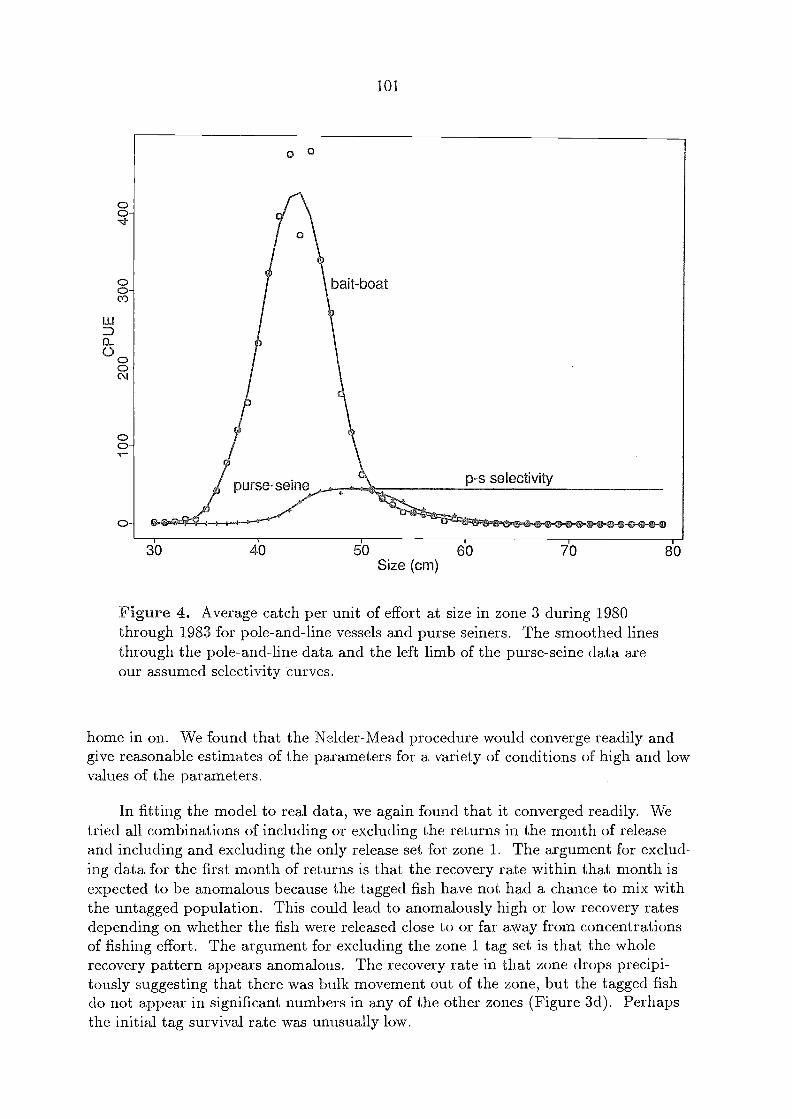
cp-
101
310 410 50 610Size (cm)
Figure 4. Average catch per unit of effort at size in zone 3 during 1980through 1983 for pole-and-line vessels and purse seiners. The smoothed linesthrough the pole-and-line data and the left limb of the purse-seine data areour assumed selectivity curves.
home in on. We found that the Nelder-Mead procedure would converge readily andgive reasonable estimates of the parameters for a variety of conditions of high and lowvalues of the parameters.
In fitting the model to real data, we again found that it converged readily. Wetried all combinations of including or excluding the returns in the month of releaseand including and excluding the only release set for zone 1. The argument for exclud-ing data for the first month of returns is that thc recovery rate within that month isexpected to be anomalous because the tagged fish have not had a chance to mix withthe untagged population. This could lead to anomalously high or low recovery ratesdepending on whether the fish were released close to or far away from concentrationsof fishing effort. The argument for excluding the zone 1 tag set is that the wholerecovery pattern appears anomalous. The recovery rate in that zone drops precipi-tously suggesting that there was bulk movement out of the zone, but the tagged fishdo not appear in significant numbers in any of the other zones (Figure 3d). Perhapsthe initial tag survival rate was unusually low.
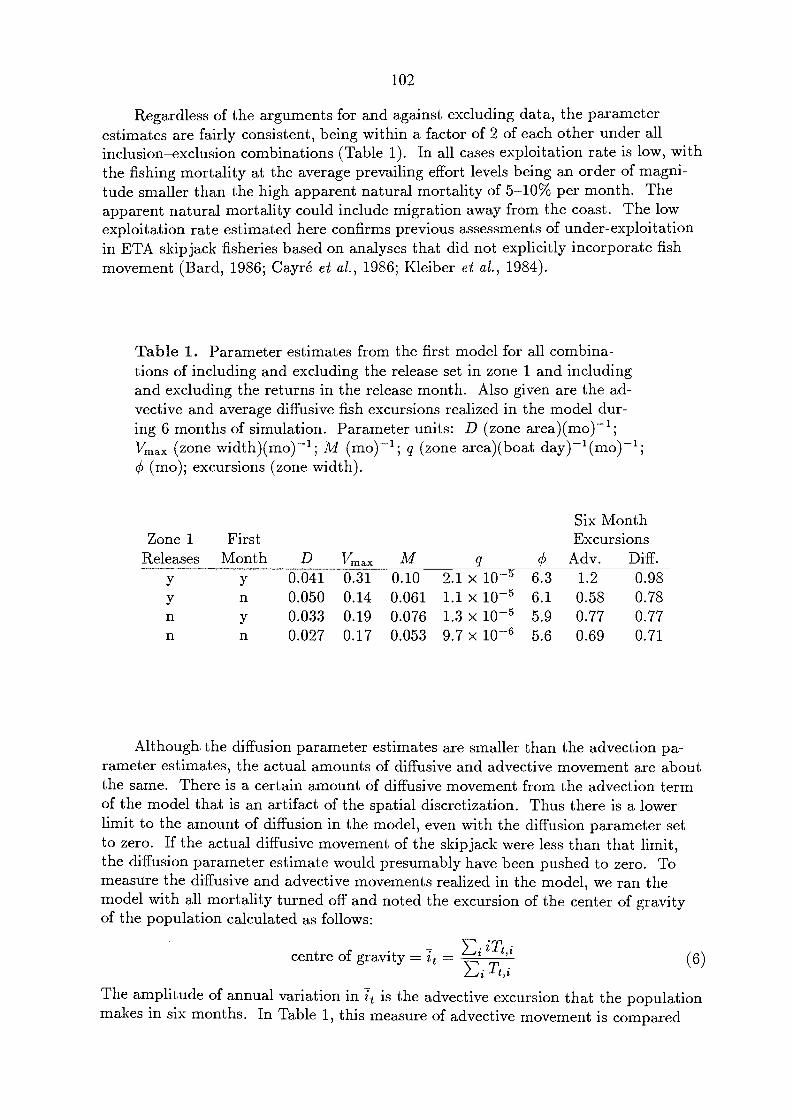
102
Regardless of the arguments for and against excluding data, the parameterestimates are fairly consistent, being within a factor of 2 of each other under allinclusion-exclusion combinations (Table 1). In all cases exploitation rate is low, withthe fishing mortality at the average prevailing effort levels being an order of magni-tude smaller than the high apparent natural mortality of 5-10% per month. Theapparent natural mortality could include migration away from the coast. The lowexploitation rate estimated here confirms previous assessments of under-exploitationin ETA skipjack fisheries based on analyses that did not explicitly incorporate fishmovement (Bard, 1986; Cayré et al., 1986; Kleiber et al., 1984).
Table 1. Parameter estimates from the first model for all combina-tions of including and excluding the release set in zone 1 and includingand excluding the returns in the release month. Also given are the ad-vective and average diffusive fish excursions realized in the model dur-ing 6 months of simulation. Parameter units: D (zone area)(mo)';Vmax (zone width)(mo)-1; M (mo)-1; q (zone area)(boat day)-1(mo)-1;
(mo); excursions (zone width).
Although. the diffusion parameter estimates are smaller than the advection pa-rameter estimates, the actual amounts of diffusive and advective movement are aboutthe same. There is a certain amount of diffusive movement from the advection termof the model that is an artifact of the spatial discretization. Thus there is a lowerlimit to the amount of diffusion in the model, even with the diffusion parameter setto zero. If the actual diffusive movement of the skip jack were less than that limit,the diffusion parameter estimate would presumably have been pushed to zero. Tomeasure the diffusive and advective movements realized in the model, we ran themodel with all mortality turned off and noted the excursion of the center of gravityof the population calculated as follows:
E. iTtcentre of gravity = zt = (6)Ei it,,
The amplitude of annual variation in it is the advective excursion that the populationmakes in six months. In Table 1, this measure of advective movement is compared
Six MonthZone I First Excursions
Releases Month D Vm a x M q 0 Adv. Diff.y y 0.041 0.31 0.10 2.1 x 10⁻⁵ 6.3 1.2 0.98y n 0.050 0.14 0.061 1.1 x 10⁻⁵ 6.1 0.58 0.78n y 0.033 0.19 0.076 1.3 x 10⁻⁵ 5.9 0.77 0.77n n 0.027 0.17 0.053 9.7 x 10⁻⁶ 5.6 0.69 0.71

103
with the average diffusive movement in six months, calculated as the average displace-ment of the population from its centre of gravity following six months of simulationstarting with releases at one location:
average displacement = (7)
These excursions are in units of model zone widths which are of the order of 1000km. This is only a rough approximation because of the loose correspondence betweenzones in Figure 1 and the linear array of zones in the model.
The predicted tag returns under the last set of parameter values in Table 1 areshown in Figures 3a-d along with the real returns. For each tag set, the best fitseems to be in the release zone for that tag set with the exception of the one setreleased in zone 1 (Figure 3d) with its anomalously high attrition rate in the first twomonths. This tag set was excluded from the parameter estimating procedure for theresults shown in these figures, yet the fit of predicted returns in zones other than therelease zone is about as good as is the fit in non-release zones for the other tag sets(Figures 3a-c), that is, not so bad when the high stochastic variability evidenced bythe 95% confidence bands is considered. The broad bands result from the low numberof predicted tags in individual zone-time strata.
3. SECOND MODEL
3.1 Description of the Model
The second model is very similar to the first. It deals with the total fish pop-ulation in each zone rather than just tagged fish. As such, it needs to incorporaterecruitment by growth of fish into the vulnerable size class, and there need to be non-zero initial conditions in all zones rather than a single release zone. For our secondmodel, the change in the population of fish in a,ny zone Pi is as follows:
=D(Pt,i_i - 2Pt,i Pt,i_1) - Vmax cos (w (t - 0))1(13t,idt (8)
- MPt,i - ê + gi
whereget,iPt,i
is the predicted catch in time slot t and zone i, and where recruitment and initialconditions are given by
(i (i _1)2
2o-2 2)x exP(
o-2g, = G exp(
The rationale for the last pair of equations, which give respectively recruitmentand initial conditions, is that we wanted to avoid estimating 30 parameters of recruit-ment and starting population for all of the 15 zones. Because the population shouldbe close to zero at the extremes of the array of zones with a maximum somewhere in
104
the middle, we assumed that the north-south distribution could be characterized bya Gaussian curve with mean I and standard deviation a. As further approximationswe assumed that the parameters of the Gaussian curve would be the same for bothinitial population and recruitment except for the scale factors, G and Pmax, and weassumed that recruitment would be constant in time. We are aware that these areonly rough approximations, and not even entirely self-consistent (u would be expectedto be larger for the population distribution than for the recruitment distribution),but considering the short life span of fish in the population (high apparent naturalmortality) and the high degree of noise in the data, we believe that these are minorconsiderations.
3.2 Fitting Second Model to Catch Data
The parameters of this second model that were not either fixed a priori or es-timated from the first model are the scale factors of recruitment and population, Gand Pmax, and the location and spread of the Gaussian curve, I, and a. For a givenset of values for the above four parameters, the model predicts catch by time slot andzone from which we could calculate a sum of squares of differences from the real catchdata. Again using the Nelder-Mead algorithm, we found the set of those parametersthat minimized the sum of squares.
For all runs of the second model, we fixed D, Vmax q, and 0, which were es-timated from the first model, to the values in the last row of Table 1. As before, theNelder-Mead algorithm converged readily to give estimates for G, Prnax , I, and a (Ta-ble 2). The corresponding predicted population levels increase during the 36 monthsof simulation and approach a quasi-steady-state of annual north-south movement dueto cyclical advection (Figure 2b). The north-south shifting of population abundancein the model compares well with the shifting CPUE pattern in Figure 2a, particularlyin the seasonal timing of abundance peaks. This correspondence is remarkable in thatthe model parameters that determine fish movement are all estimated from tag datathat is independent of the CPUE data in Figure 2a. The detailed historical sequenceof CPUE is not so well predicted by the model, which is not surprising because themodel has no mechanism for predicting the highly variable and episodic events in theCPUE data.
The reason for the growth in the predicted population is that the estimated ini-tial population parameter is low relative to the equilibrium population level supportedby the estimate of recruitment. These parameter estimates do depend on the catchand effort data used to calculate the CPUE levels shown in Figure 2a. They reflectgrowth in CPUE that is evident in that figure, particularly in zone 3 in which CPUEwas lower than usual in the first year and extra high towards the end in month 28.
Zone 3 accounts for the predominant amount of catch and therefore has a predomi-nant influence in the estimation procedure (Table 3). We are uncertain as to whatextent this growth in the model population represents real growth of the populationduring 1980-1982, or some other effect such as increasing catchability or availability,or simply an anomalous event in zone 3 during month 28.
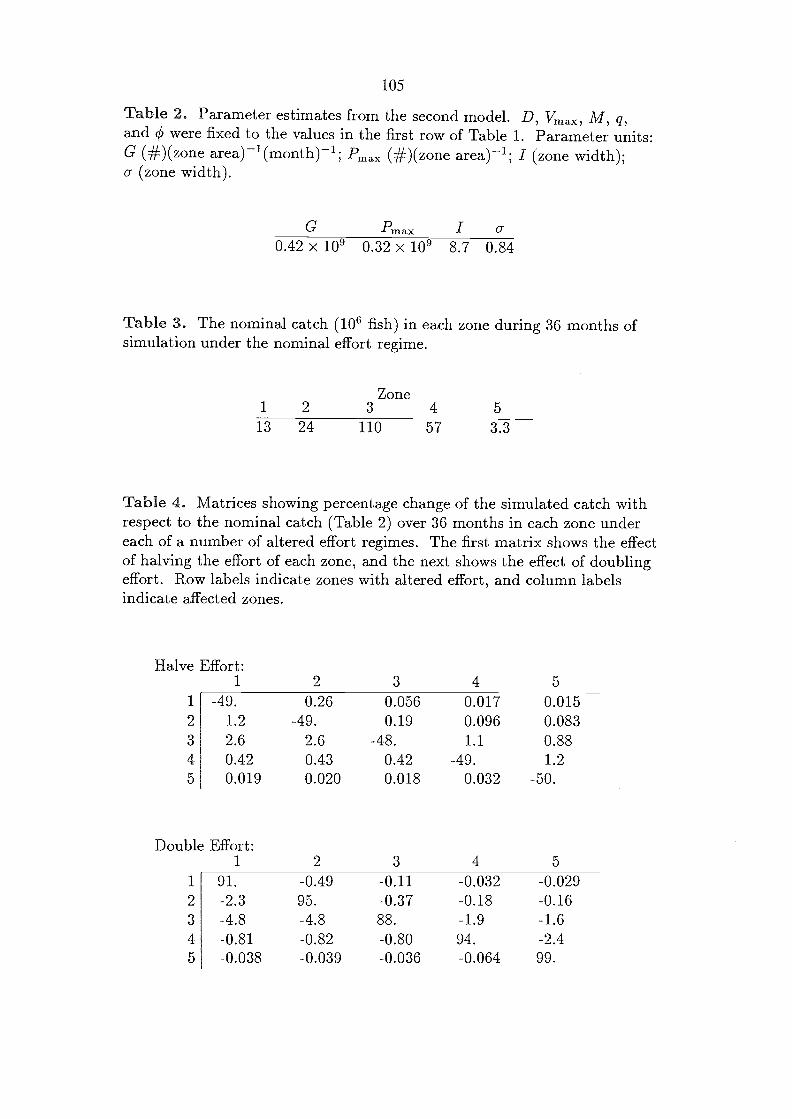
105
Table 2. Parameter estimates from the second model. D, Vmax, M, q,and 0 were fixed to the values in the first row of Table 1. Parameter units:G (#)(zone area)-1(month)-1; Pmax (#)(zone area)l; I (zone width);o- (zone width).
G Pmax I a0.42 x 109 0.32 x 10⁹ 8.7 0.84
Table 3. The nominal catch (106 fish) in each zone during 36 months ofsimulation under the nominal effort regime.
Zone
Table 4. Matrices showing percentage change of the simulated catch withrespect to the nominal catch (Table 2) over 36 months in each zone undereach of a number of altered effort regimes. The first matrix shows the effectof halving the effort of each zone, and the next shows the effect of doublingeffort. Row labels indicate zones with altered effort, and column labelsindicate affected zones.
Halve Effort:1 2 3 4 5
1 -49. 0.26 0.056 0.017 0.0152 1.2 -49. 0.19 0.096 0.0833 2.6 2.6 -48. 1.1 0.884 0.42 0.43 0.42 -49. 1.25 0.019 0.020 0.018 0.032 -50.
Double Effort:1 2 3 4 5
1 91. -0.49 -0.11 -0.032 -0.0292 -2.3 95. -0.37 -0.18 -0.163 -4.8 -4.8 88. -1.9 -1.64 -0.81 -0.82 -0.80 94. -2.45 -0.038 -0.039 -0.036 -0.064 99.
1 2 3 4 5
13 24 110 57 3.3

106
USING SECOND MODEL TO ESTIMATE FISHERY INTERACTION
To investigate interaction, we collected the total nominal catch by zone (Table 2)from a run of the second model with best fitting parameter values and the actual(nominal) effort levels. We then made several runs of the model, two for each of thefive fished zones, halving the effort in the zone for one of the runs and doubling theeffort in the other run. For each run we compared the total catch by zone with thecorresponding nominal catch (Table 4). By far the largest effect of such alteration ofthe effort is on the catch in the zone of the altered effort, the change in catch beingalmost proportional to the change in effort. This would be what we would expectfor an under-exploited population. By contrast, in the zones other than the one withaltered effort, the catch was only lightly affected, the largest effect being a 4.8% cut inthe catch of zones 1 and 2 caused by a doubling of effort in zone 3.
The message of Table 4 is that interaction among the ETA skip jack fishing zonesis negligible under the 1980-1982 pattern and levels of fishing effort. If anything, theinteraction estimates probably err on the high side because our analysis used values ofmovement parameters from the first row of Table 1, that is, the highest of the rangeof such estimates.
DISCUSSION
We have confirmed previous assessments indicating that there is a low exploita-tion rate in ETA skip jack fisheries, and, within the limitations of our model, wehave excluded the possibility that local areas with above average exploitation havea significant effect on neighbouring areas even though the overall exploitation rateis low. One of the limitations of the model is its degree of spatial resolution. Wecannot exclude interactive effects on a smaller spatial scale within the model zones,for example, interaction between artisanal fisheries operating very close to the coastand commercial fisheries operating further off-shore.
It would be possible to adjust our model to finer spatial scales, but this wouldcause increasing problems of stochastic variability because as the data are dividedinto smaller and smaller strata, the number of tag returns in those strata diminishesgiving rise to higher stochastic variability. Also, at finer resolution, our simplificationof a linear array of zones would become untenable, and the greater complexity oftwo spatial dimensions would have to be introduced. Our assumptions about thedistribution of recruitment and starting population would then clearly need to berevised. These are not insurmountable difficulties. The most problematic wouldbe the need for more tagging data. A comparison of the current model with a finerscale simulation model (probably in two spatial dimensions), might be a good wayto demonstrate the need for and help justify the expense of more tagging. However,justification of the modeling effort (and tagging effort) from the point of view ofinteraction concerns might depend on a substantial increase in fishing activity in theregion so that there is a more substantial expectation of significant interaction than atpresent.
The current model could be refined in other ways besides increasing the spatialresolution. The timing and direction of advective movement, for example, might be
107
linked to environmental parameters for which data exist, which could allow the cosinefunction in the advection term of the model to be replaced by an environmental driv-ing function. Or the recruitment function could be relaied so that it is not strictlysymmetrical, and it could be allowed to vary, or shift north-south with season. Ourguess is that as long as the skipjack population is under-exploited, our conclusionswith respect to interaction would be robust to such refinements.
6. REFERENCES CITED
Bard, F.X. 1986. Analyse des taux de décroissance numerique des listaos marqueen Atlantic Est. In Proceedings of the ICCAT Conference on the International Skip-jack Program, edited by P.E.K. Symons, P.M. Miyake, and G.T. Sakagawa, Madrid,Spain, ICCAT, pp. 348-62.
Cayré, P., A. Fonteneau, an.d T. Diouf. 1986. Elements de biologie affectant lacomposition en taille des listaos (Katsuwonus pelamis) exploités dans l'Atlantic trop-ical oriental et leur effet sur l'analyse de la croissance par la methode de Petersen.In Proceedings of the ICCAT Conference on the International Skip jack Program,edited by P.E.K. Symons, P.M. Miyake, and G.T. Sakagawa, Madrid, Spain, ICCAT,pp. 326-34.
Hilborn, R. 1990. Determination of fish movement patterns from tag recoveriesusing maximum likelihood estimators. Can.J.Fish.Aquat.Sci., 47(3):635-43.
Kleiber, P., S. Chivers, and E. Weber. 1984. Analysis of ISYP skip jack taggingresults using the methods of the South Pacific Commission. Collect.Vol.Sci.Pap.ICCAT, 20(1):212-16.
Press, W.H., B.P. Flannery, S.A. Teukolsky, and W.T. Vetterling. 1988. Numericalrecipes in C. The art of scientific computing. Cambridge University Press, 735 p.
FAO LIBRARY AN: 346119108
EVALUATION OF ADVECTION-DIFFUSION EQUATIONS FESTIMATION OF MOVEMENT PATTERNS FROM TAG REC E IATA
John R. Sibert and David A. FournierOtter Research Ltd.
P. 0. Box 265, Station ANanaimo, British Columbia, Canada
ABSTRACT
A version of the diffusion-advection differential equation is evaluated a as methodof describing the large scale movement patterns of tunas. The equation is solved on a50 x 50 grid to model a 3,000 nmi square section of the ocean. Simulated tag recapturesdisplay features that are qualitatively similar to observed tag recaptures. An estimationprocedure based on the same equation is able to recover the parameters used in the simula-tion from the simulated tag recaptures.
I. INTRODUCTION
Expansion of fishing grounds and total fishery yields have broadened managementissues from simple questions of sustainable yield to include questions about the effects offisheries in one area on fisheries in another area. If these effects indeed occur, they willoccur because the fish stocks on which these fisheries depend may move between areas.The ability to describe quantitatively the movements of fish populations would, therefore,be critical to a quantitative assessment of interaction between fisheries in different areas.
Models traditionally used to assess stocks, for example the general production modelof Pella and Tomlinson (1969), are "closed" in that there are no explicit terms to accountfor immigration and emigration of individuals to and from the vulnerable population. Iffisheries in different areas interact, interaction is presumably due to exchange of fish be-tween the two vulnerable populations. (Excluding secondary effects such as habitat de-struction or ghost fishing.)
There are remarkably few fisheries models described in the literature that considerthe question of movement and that also include methods for estimating movement parame-ters. One such model was briefly discussed by Beverton and Holt (1957), but no parameterestimation method was presented. Ishii (1979a, 1979b) used tag return data to estimateexchange rates of yellowfin tuna between different regions in the eastern tropical Pacific.Sibert (1984), using a model of skipjack movement very similar to that proposed by Bev-erton and Holt (1957), derived a folinula to describe the effects of catches in one fisheryon catches in another based on exchange rates between the two fisheries estimated fromtag return data. An important result of this study was to show explicitly that the potentialfor interaction between areas depended not only on movement between areas but alsoon the magnitude of natural mortality and the intensity of fishing. A fishery exploiting apopulation with a high natural mortality in one area is not likely to have a large impact ona fishery in a different area. Hampton (1991) applied a similar model to southern bluefintuna with three recapture fisheries. Hilborn (1990) applied an approximation of the Sibert(1984) model to a larger number of fisheries and also to different species of fish.
*

109
All of these models parameterize movement by instantaneous bulk transfer coeffi-cients which express the proportion of the population in one area moving to another in aunit of time. Such transfer coefficients implicitly carry the assumption that the populationis uniformly distributed within an area, and depend on the sizes of the areas selected andthe distances between them. Thus, it is difficult to use these models to predict movementto areas not explicitly included in the model when its parameters were estimated.
General transport models based on the so-called "advection-diffusion" equationare much less restrictive and do not have the same scale dependency as the bulk transfermodels. There are other important advantages to using models based on general transportequations to describe movements of fish. These models have well known properties andhave enjoyed considerable success in predicting the transport of various materials. Fur-theitnore, there are general procedures for obtaining stable numerical solutions to theseequations in several dimensions (Carnahan et al., 1969; Press et al., 1988).
The general transport model not only describes transport of materials. It can alsobe interpreted as a limiting case of certain classes of biased random walks. Various deriva-tions of the general transport model and its application to biological systems are exten-sively discussed by Okubo (1980). The more recent review by Othmer et al. (1988) presentssome alternative variations of the same general class of models.
Perhaps the simplest assumption about the movement of fish is that there are twocomponents to movement: directed movement and random movement. Directed movementis represented by a vector of movement velocities (u, y) where u is the eastward com-ponent of directed movement and y is the northward component of directed movement.Random movement is represented by a single scalar quantity a which is the same in alldirections. The movement parameters of a general transport model applied to fish havean obvious relation to the similar parameters in models of physical transport in the sea.The vector (u, y) corresponds to advection by water currents and a corresponds to thediffusion coefficient (hence the name diffusion-advection equation). General transportmodels may thus be used to model fish movement in conjunction with models in whichphysical transport mechanisms also modify fish distribution.
Although the general transport equation would appear to be well suited to the quan-titative description of movement, estimation of model parameters from biological data hasreceived relatively little attention. Banks et al. (1985 and 1988) describe procedures forestimating parameters of a one-dimensional transport model from beetle tagging data anda two-dimensional model of fly dispersion. Dalgaard and Larsen (1990) discuss parameterestimation in models involving numerical solutions of differential equations in the contextof physiology.
Preliminary efforts to produce a parameter estimation procedure for a small-scaletwo dimensional general transport model suggested that such a model would be a use-ful tool for the planning and analysis of large scale tuna tagging experiments (Sibert andFournier, 1989). The purpose of this report is to evaluate the usefulness of the this modelon a more realistic scale. Three criteria will be used: Does the model move tags in areasonable fashion? Does the model estimate the parameters accurately? Is the estimationprocedure computationally practical? This report should be interpreted as an interim reportof work in progress. Suggestions for further work will be included.
2. GENERALIZED MODEL
Three steps are involved in the development of a procedure for estimating the pa-rameters of a general transport model from tagging data. First, the appropriate partialdifferential equation must be defined. Second, the partial differential equation must besolved on a computer using a numerically-stable discrete approximation (usually a finitedifferencing scheme) in such a way that the dynamics of the equation are retained. Finally,a numerical parameter estimation procedure must be applied to estimate the model parame-ters from tag return data.
The derivation of the partial differential equation for the advection-diffusion modelcan be found in Okubo (1980) and will not be reproduced here. The general transportmodel for tagged fish in two dimensions can be written as
dA (52 A a2A ) a+ (u ,A)
a(v,A)-(F, + M) A
dt 2 ay 2 axDywhere A(x , y, t) denotes the population density of a cohort of tagged fish (or more sim-ply tags) at the point (x, y, t) . The parameters F, and M are components of mortalityattributable to fishing and "natural" causes respectively, that is, fractions of the local popu-lation which are caught or die in a unit of time. The subscript s indicates seasonal depen-dence of some model parameters. A "season" is defined as a period of time over whichall model parameters are constant, and is discussed in more detail below. The directedcomponents of movement and fishing mortality are assumed to have seasonal dependency.The random component of movement and natural mortality are assumed to be constantover all seasons. The subscript s is dropped in the following discussions to simplify thenotation unless season is pertinent.
Several types of boundary conditions are possible. In general, boundaries may beclosed or permeable, straight or regular, or these conditions may be combined. Closed orreflective boundaries simulate continental land masses and islands. Open or permeableboundaries simulate conditions when fish migrate out of the study region or through alethal boundary (such as a low temperature isotheini for tropical tunas). For the purposesof this evaluation, only closed straight boundaries are considered:
DA=0. x= 0, x = X
dxDA
ay ";y = 0, y = Y
The obvious initial conditions for A are
= =A(x , y, 0) = xx r and yyrAr;0; otherwise,
where A, is the number of tagged fished released at point (xr, yr) at time 0.
110
(1)
3. NUMERICAL SOLUTION OF THE DIFFERENTIAL EQUATION
The above differential equations are solved by finite-difference techniques using anetwork of regularly-spaced grid points through the region o. f interest. The spacing of gridpoints are x, y, and t which are indexed by the subscripts i, j, and k respectively wherei 1, 2, . , m; m =- X I x; j = 1, 2, . . . , n; n = Y/y and k = K1,K + 1, , K2 1,112where K1 and 112 are the first and last time steps in season s. Thus Ai,j,k is used toapproximate A(ix , j y , kt) or A(x ,y ,t) .
The following finite difference approximations are used:
Dependency on time step k + 1 leads to "implicit" solution methods. The implicitmethod is used because it converges to a solution of the partial differential equations re-gardless of the value of the ratios t/(x)2 and t (y)2 (Carnahan et al., 1969). The alternat-ing direction method is used to find solution of the equations resulting from the implicitdifferencing scheme (Press et al., 1988). This method solves the equations in one directionafter one half time step then solves the equations in the other direction in the second halftime step.
Defining Hji,k = , the complete finite difference equation for tc,,3 > 0,vz, > 0,1 < i < M, 1 < j < N for the first half time step in the x direction is
OA Ai,j,k+i - Ai,j,k,..,at At
82A Aii,j,k+i 2Ai,j,k+1 + Ai+1k+1rs,ax2 (Ax)2
Ai,i--1,k+102 A - 2Ai,j,k+1 -I- Ai,j+1,k+1,-..,
ay2 (AY)2Ai,j,k+i Aii,j,k+1 iii_i, Ui,j Ui--1,j
a {ui7;Ax(uA) r-,
Ox Ai+1,j,k+i Ai,j,k+i Ai+10,k Ui-I-1,AXj U i7.1j,i
Ax AxVi, - Vi,j-1Ai,j,k+1
+ Ai,3-1,k1 Ai,j-1,k+1Vi ,i )a Ay Ay
--Fy(vA) ,--,Ai,j+i,k+1 Ai,j,k+1+ Ai,i+i,k vi,3+1 ui,i
Ay Ay
Hi,j,k A
At/2(1, M)H.
cr
Ai,j-i,k
111
21110 Hi,j,k - i-i,j,k ui, ui_u1,j i_i,j,k
(Ax)2 Ax Ax
A,+1,k(AY)2
vio - (7)-1,k Ai J-1 ,kAyAy
The terms on the right hand side of the equation depend only on the values of A at theend of time step k. Re-arrangement yields
Hio,k (_ a. )11i+ i,j,k =(Ax)22 2o- , _i_ F. .
z,k (Ai -1- (Ax)2(Ax)2 Ax
(8)(:02 A 1,k2 2u. Ui5j)Aio,)Aj,j-1,k ( At+ (Ay)2 AY(AuY)2 AY
(6)
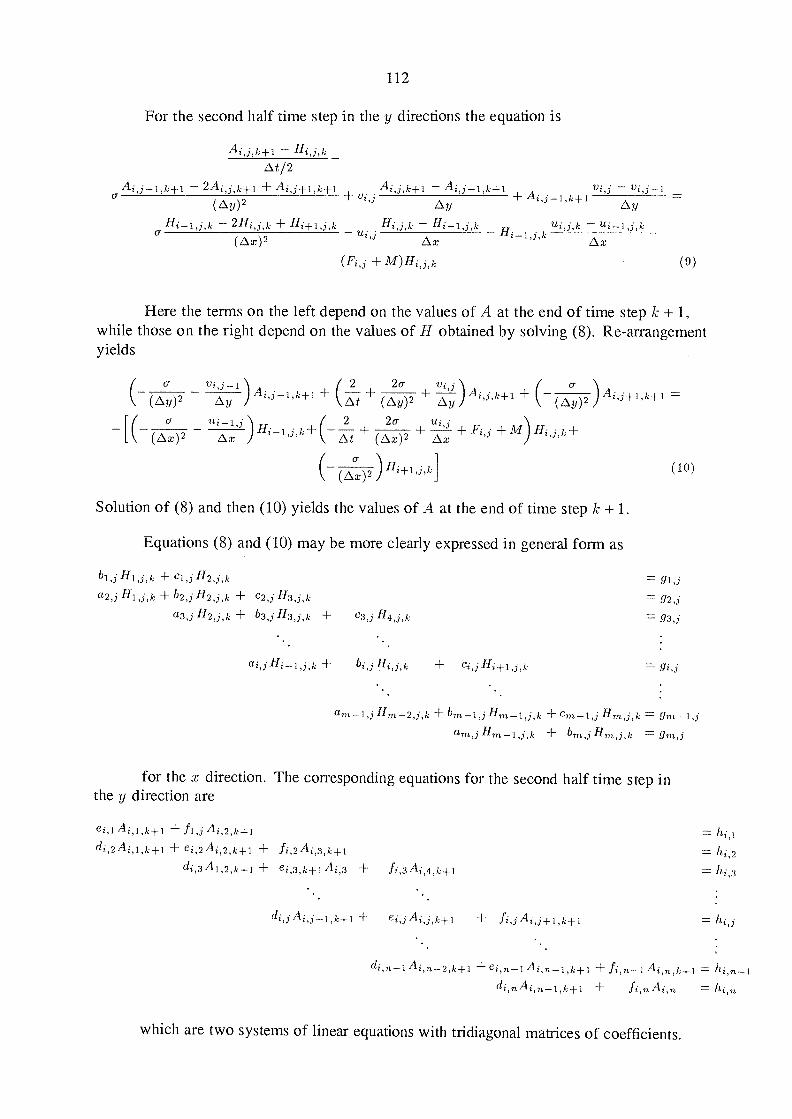
For the second half time step in the y directions the equation is
Ai, j,k+1 i,j,kAt/2
A.i'+ Ai, j-1-1,k+1 Ai,j,k+1 Ai,j-1,k+1(y)2v Ay
Hi_i,j,k 2Hi,j,k Hi+1,j,k Hi-1,i,kcr
(Ax)2 Ax
(Fi,j M)Hi,j,k
112
vi,i vi,jiAi,j-1,k+1 Ay
,j,k Ax
Here the terms on the left depend on the values of A at the end of time step k + 1,while those on the right depend on the values of H obtained by solving (8). Re-arrangementyields
(2 2o- j,k+1 (Acryr Az,t+1,k+1Aj,j-1,k+1 At 2 Ay
)Ay (Ay)(AY)2
2 2o-t(u t'j M) Hi,j,k+Ax)2 ( ()2At AxAx
(Acrx)2)Hi+1,j,k
Solution of (8) and then (10) yields the values of A at the end of time step k + 1.
Equations (8) and (10) may be more clearly expressed in general form as
Ci,j 112,j ,k = 91,jb2,j H2J,k e2,j H3,j,k = 92,j
b3,j113,j,k e3, j H4,j,k = g3,j
Ci,j Hi+1.,j,k = gi
am-1,j 11m-2,j,k b11, Hni 1,j,k em 1,j Hm,j,k 97n 1,jk b,,,j Hni,j,k = gm,i
for the x direction. The corresponding equations for the second half time step inthe y direction are
Ai,2,k+id1,2 Ai,1,k+1 ei,2 Ai,2,k+1 2 A1,3,k+1
di,3 A1,2,k+1 ei,3,k+1 A1,3 + fi,3A1,4,k+1
Ai,j-1,k+1 Ai,j,k+1 fi,j Ai,j+1,k+1
di ,ri-1 Ai,n-2,k+1 ei,n-1 fi,n 1 Ai,n,k+1 = Iii,n-1di,n Ai,n-1,k+1 fi, n Iii,n
which are two systems of linear equations with tridiagonal matrices of coefficients.
(9)
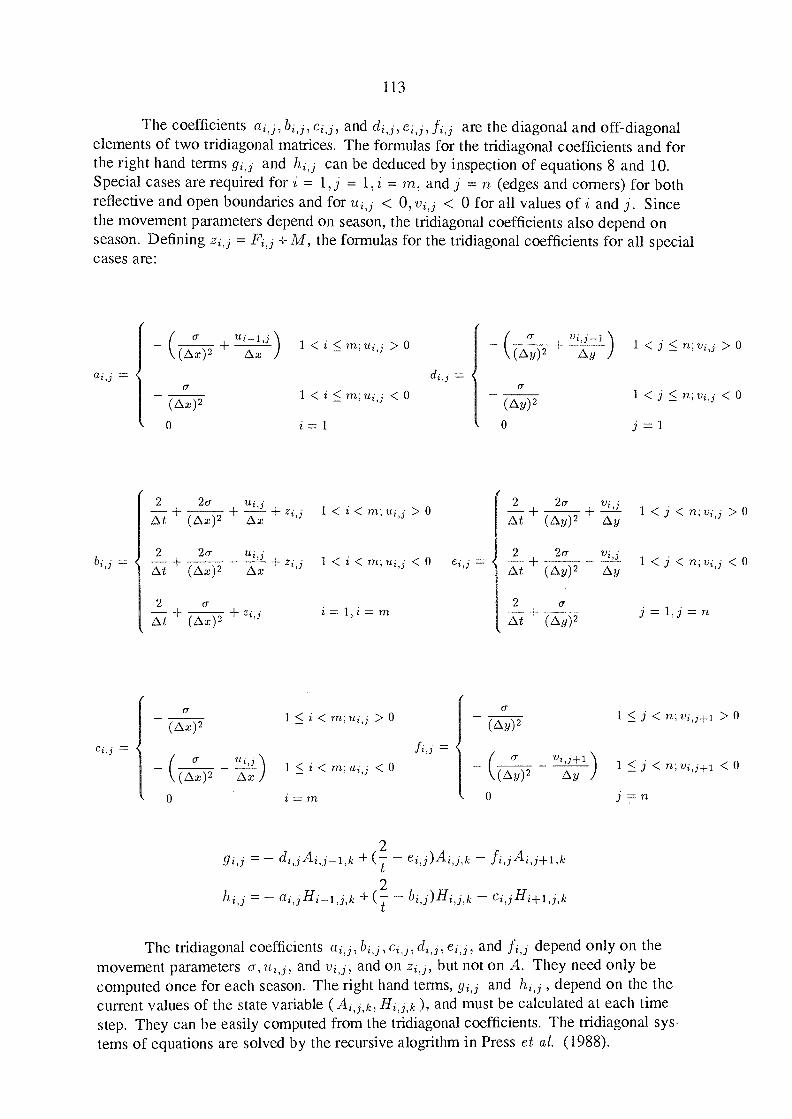
The coefficients cj, and clio, e, are the diagonal and off-diagonalelements of two tridiagonal matrices. The formulas for the tridiagonal coefficients and forthe right hand terms gio and 11,20 can be deduced by inspection of equations 8 and 10.Special cases are required for i = 1,j = 1, i = m, and j = n (edges and corners) for bothreflective and open boundaries and for ttio < 0, vio < 0 for all values of i and j. Sincethe movement parameters depend on season, the tridiagonal coefficients also depend onseason. Defining zio = Fio + M, the formulas for the tridiagonal coefficients for all specialcases are:
-
(U i <i < m; ui,i >0(Ax)2 Ax
1 < i < m; uio <
i::::1
o-
(px)2
gz,3
1 < i < ni; ui, >
, 2z, -1,k +
-tei,j)Ai,j,k fi,jAi,j+1,k
/2 t= 1,j,k i,j,k Cid Hi+1,j,k
The tridiagonal coefficients , bio , , dio , e, and fio depend only on themovement parameters a, u, and vio , and on z, but not on A. They need only becomputed once for each season. The right hand terms, gio and lizo , depend on the thecurrent values of the state variable ( ), and must be calculated at each timestep. They can be easily computed from the tridiagonal coefficients. The tridiagonal sys-tems of equations are solved by the recursive alogrithm in Press et al. (1988).
113
{f
=i,;
= {(a+ vi,j-i
(AY)2 Ay
(AY)2
o
1 <j < n; vi >
1 <j < n; <0
j=i
2 2U' zi j 1 <i < m; ui,j >
2 2U Vij 1 <j < n; >0(Ax)2 As At + (Ay)2At
2
At
2
2U ui,jzi,j 1 < < rn; < 0
i = 1, i = m
ei, j2 2U vi,j 1 <i < n;
j = 1,j = n
<0x(A)2
u
Ax At (Ay)2
2
Ay
(Ax)2 At (Ay)2At
Cj,i =
cr
{1 < i < rn; ui, < _
rr
Vj,ji 1 <i < n; vi,j+1 <0
71,
Axro
Ax Ay)2
O
Ay
1 <i < n; vi, >0(AY)2
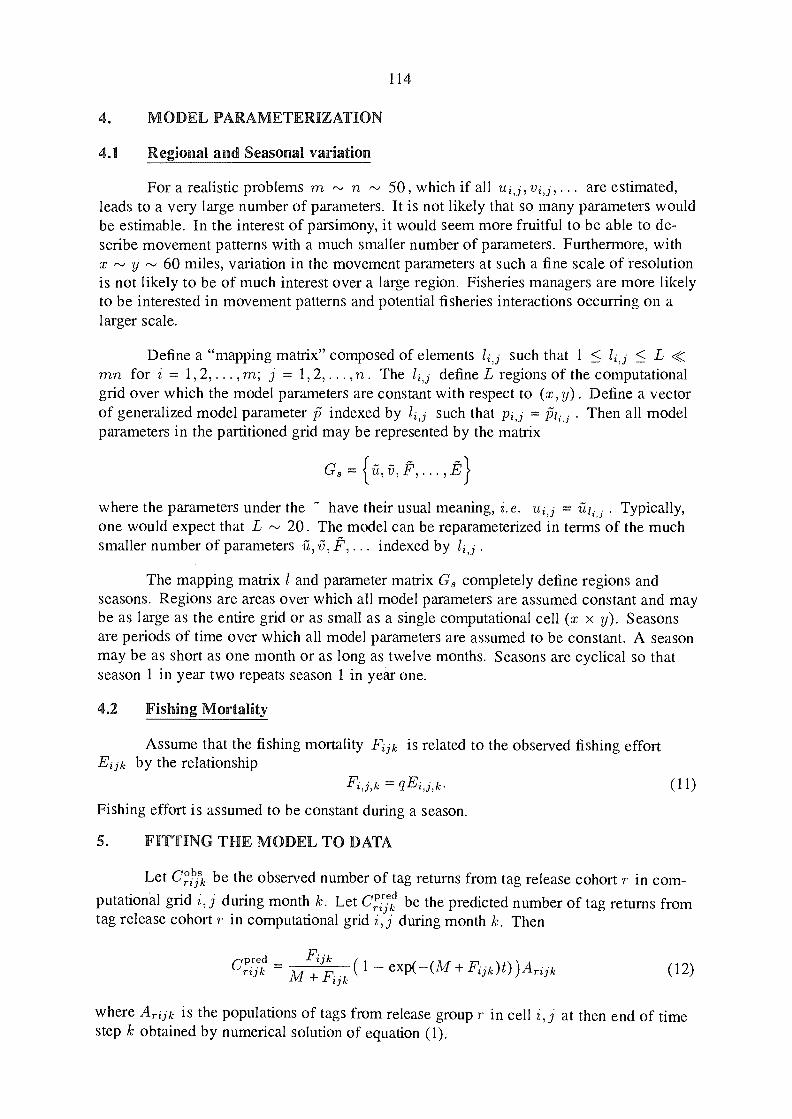
MODEL PARAMETERIZATION
4.1 Regional and Seasonal variation
For a realistic problems m n 50, which if all ui,j,v,,,, ... are estimated,leads to a very large number of parameters. It is not likely that so many parameters wouldbe estimable. In the interest of parsimony, it would seem more fruitful to be able to de-scribe movement patterns with a much smaller number of parameters. Furthermore, withx y 60 miles, variation in the movement parameters at such a fine scale of resolutionis not likely to be of much interest over a large region. Fisheries managers are more likelyto be interested in movement patterns and potential fisheries interactions occurring on alarger scale.
Define a "mapping matrix" composed of elements 1, such that 1 < 1,0 < L <mn for i = 1,2, ... , m; j = 1,2, ... , n. The lj define L regions of the computationalgrid over which the model parameters are constant with respect to (x, y) . Define a vectorof generalized model parameter 3 indexed by lzo such that pio = i5i . Then all modelparameters in the partitioned grid may be represented by the matrix
114
where the parameters under the - have their usual meaning, i. e. u3 = fir; . Typically,one would expect that L 20. The model can be reparameterized in terms' of the muchsmaller number of parameters ii, P,... indexed by kJ .
The mapping matrix i and parameter matrix Gs completely define regions andseasons. Regions are areas over which all model parameters are assumed constant and maybe as large as the entire grid or as small as a single computational cell (x x y). Seasonsare periods of time over which all model parameters are assumed to be constant. A seasonmay be as short as one month or as long as twelve months. Seasons are cyclical so thatseason 1 in year two repeats season 1 in year one.
4.2 Fishing Mortality
Assume that the fishing mortality Fijk is related to the observed fishing effortEijk by the relationship
Fz,j,k = q
Fishing effort is assumed to be constant during a season.
FITTING THE MODEL TO DATA
Let Cr°141 be the observed number of tag returns from tag release cohort r in com-putational grid i, j during month k. Let CrP,V, be the predicted number of tag returns fromtag release cohort r in computational grid i, j during month k. Then
CP!-Fi.d = 2- ( 1 exp((M + Fijk)0)Arijkm Fijk
where Ariik is the populations of tags from release group r in cell i,j at then end of timestep k obtained by numerical solution of equation (1).
(12)

At present, the model parameters are estimated by minimizing the robust X2 tune-
rypred (-fobs )2L'rijk 'rijk.)
rzjk
The constant 1 in the denominator of (13) is to reduce the influence of improbable events(such as the occasional aberrant tag recapture) on the parameter estimates. Equation (13) isminimized by a quasi-Newton function minimization algorithm which uses the first partialderivatives of (13) with respect to the parameters. These derivatives are computed byanalytically correct methods to the limit of machine accuracy using an algorithm relatedto the reverse mode of automatic differentiation (Griewank and Corliss, 1991).
115
(13)
1
2
4
6 7
10
.Kaa<
5
1/.
Figure 1. Regions and movement pattern used in the simulations. Nwnbers indicate region numbersused in Table I (see below). Arrows represent movement vectors (u, y) in each region.
tion
rijk
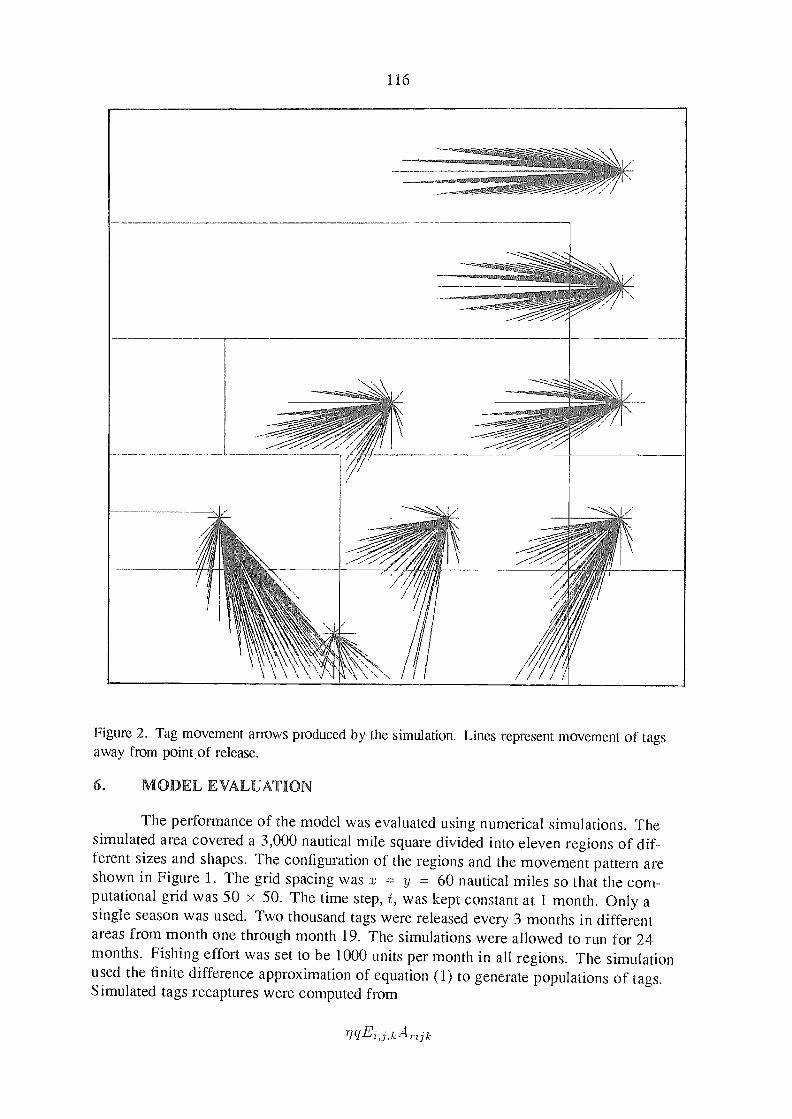
116
Figure 2. Tag movement arrows produced by the simulation. Lines represent movement of tagsaway from point of release.
6. MODEL EVALUATION
The performance of the model was evaluated using numerical simulations. Thesimulated area covered a 3,000 nautical mile square divided into eleven regions of dif-ferent sizes and shapes. The configuration of the regions and the movement pattern areshown in Figure 1. The grid spacing was x = 60 nautical miles so that the com-putational grid was 50 x 50. The time step, t, was kept constant at 1 month. Only asingle season was used. Two thousand tags were released every 3 months in differentareas from month one through month 19. The simulations were allowed to run for 24months. Fishing effort was set to be 1000 units per month in all regions. The simulationused the finite difference approximation of equation (1) to generate populations of tags.Simulated tags recaptures were computed from
rzjk
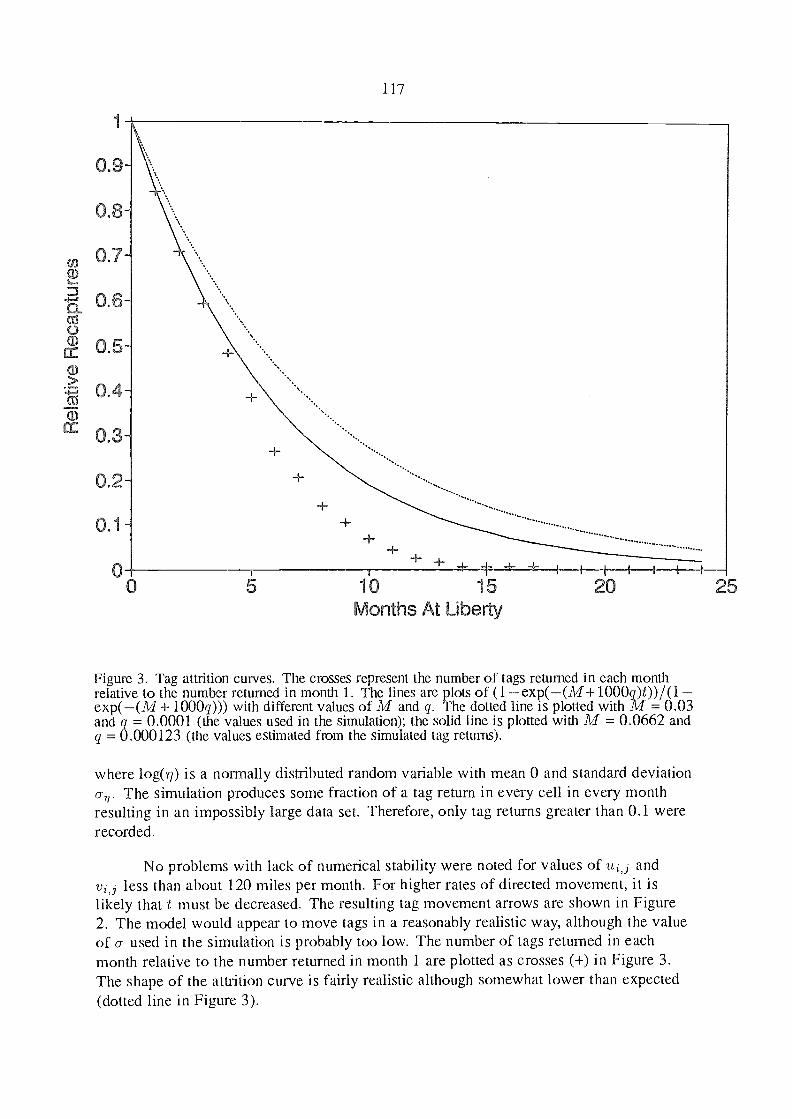
0.9-
0.8-
0.2-
0.1
Oo
117
................
.............. .............
+ t ±15 20 25
Months At Liberty
Figure 3. Tag attrition curves. The crosses represent the number of tags returned in each monthrelative to the number returned in month 1. The lines are plots of (1exp((M+1000q)t))/(1exp((M+ 1000q))) with different values of M and q. The dotted line is plotted with M = 0.03and q = 0.0001 (the values used in the simulation); the solid line is plotted with M = 0.0662 andq = 0.000123 (the values estimated from the simulated tag returns).
where log(77) is a normally distributed random variable with mean 0 and standard deviationan. The simulation produces some fraction of a tag return in every cell in every monthresulting in an impossibly large data set. Therefore, only tag returns greater than 0.1 wererecorded.
No problems with lack of numerical stability were noted for values of ui,j andvi,j less than about 120 miles per month. For higher rates of directed movement, it islikely that t must be decreased. The resulting tag movement arrows are shown in Figure2. The model would appear to move tags in a reasonably realistic way, although the valueof a used in the simulation is probably too low. The number of tags returned in eachmonth relative to the number returned in month 1 are plotted as crosses (+) in Figure 3.The shape of the attrition curve is fairly realistic although somewhat lower than expected(dotted line in Figure 3).
III
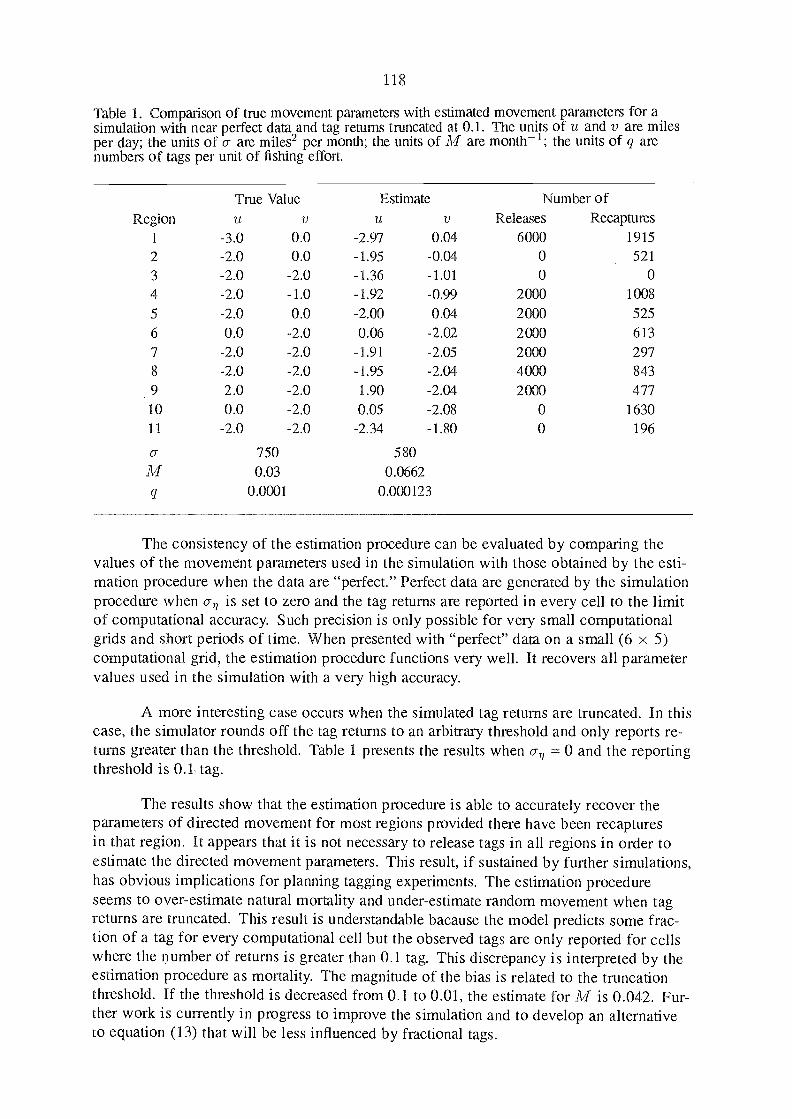
118
Table 1. Comparison of true movement parameters with estimated movement parameters for asimulation with near perfect data and tag retums truncated at 0.1. The units of u and y are milesper day; the units of a are miles2 per month; the units of M are month-1; the units of q arenumbers of tags per unit of fishing effort.
The consistency of the estimation procedure can be evaluated by comparing thevalues of the movement parameters used in the simulation with those obtained by the esti-mation procedure when the data are "perfect." Perfect data are generated by the simulationprocedure when a-71 is set to zero and the tag returns are reported in every cell to the limitof computational accuracy. Such precision is only possible for very small computationalgrids and short periods of time. When presented with "perfect" data on a small (6 x 5)computational grid, the estimation procedure functions very well. It recovers all parametervalues used in the simulation with a very high accuracy.
A more interesting case occurs when the simulated tag retur-ns are truncated. In thiscase, the simulator rounds off the tag returns to an arbitrary threshold and only reports re-turns greater than the threshold. Table 1 presents the results when an 0 and the reportingthreshold is 0.1 tag.
The results show that the estimation procedure is able to accurately recover theparameters of directed movement for most regions provided there have been recapturesin that region. It appears that it is not necessary to release tags in all regions in order toestimate the directed movement parameters. This result, if sustained by further simulations,has obvious implications for planning tagging experiments. The estimation procedureseems to over-estimate natural mortality and under-estimate random movement when tagreturns are truncated. This result is understandable bacause the model predicts some frac-tion of a tag for every computational cell but the observed tags are only reported for cellswhere the number of returns is greater than 0.1 tag. This discrepancy is interpreted by theestimation procedure as mortality. The magnitude of the bias is related to the truncationthreshold. If the threshold is decreased from 0.1 to 0.01, the estimate for M is 0.042. Fur-ther work is currently in progress to improve the simulation and to develop an alternativeto equation (13) that will be less influenced by fractional tags.
RegionTrue Valueu y
Estimateu y
Number ofReleases Recaptures
1 -3.0 0.0 -2.97 0.04 6000 1915
2 -2.0 0.0 -1.95 -0.04 0 521
3 -2.0 -2.0 -1.36 -1.01
4 -2.0 -1.0 -1.92 -0.99 2 1118
5 -2.0 0.0 -2.00 0.04 2 111 525
6 0.0 -2.0 0.06 -2.02 2(300 613
7 -2.0 -2.0 -1.91 -2.05 2 1 II 1 2978 -2.0 -2.0 -1.95 -2.04 4000 843
9 2.0 -2.0 1.90 -2.04 2000 47710 0.0 -2.0 0.05 -2.08 O 163011 -2.0 -2.0 -2.34 -1.80 O 196
a 750 580M 0.03 0.0662
q 0.0001 0.000123
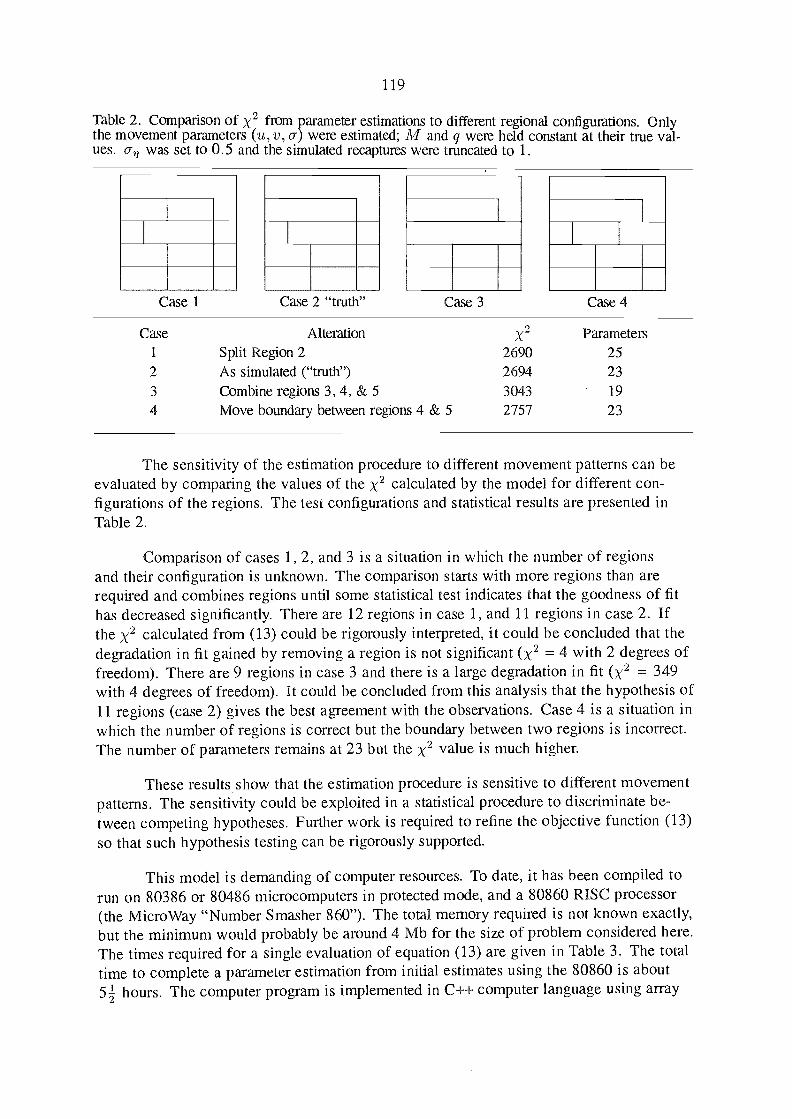
Table 2. Comparison of x2 from parameter estimations to different regional configurations. Onlythe movement parameters (u, y, a) were estimated; M and q were held constant at their true val-ues. an was set to 0.5 and the simulated recaptures were truncated to 1.
119
Case 1 Case 2 "truth" Case 3 Case 4
Case Alteration X2 Parameters
The sensitivity of the estimation procedure to different movement patterns can beevaluated by comparing the values of the )(2 calculated by the model for different con-figurations of the regions. The test configurations and statistical results are presented inTable 2.
Comparison of cases 1, 2, and 3 is a situation in which the number of regionsand their configuration is unknown. The comparison starts with more regions than arerequired and combines regions until some statistical test indicates that the goodness of fithas decreased significantly. There are 12 regions in case 1, and 11 regions in case 2. Ifthe x2 calculated from (13) could be rigorously interpreted, it could be concluded that thedegradation in fit gained by removing a region is not significant (x2 = 4 with 2 degrees offreedom). There are 9 regions in case 3 and there is a large degradation in fit (x2 = 349with 4 degrees of freedom). It could be concluded from this analysis that the hypothesis of11 regions (case 2) gives the best agreement with the observations. Case 4 is a situation inwhich the number of regions is correct but the boundary between two regions is incorrect.The number of parameters remains at 23 but the x2 value is much higher.
These results show that the estimation procedure is sensitive to different movementpatterns. The sensitivity could be exploited in a statistical procedure to discriminate be-
tween competing hypotheses. Further work is required to refine the objective function (13)so that such hypothesis testing can be rigorously supported.
This model is demanding of computer resources. To date, it has been compiled torun on 80386 or 80486 microcomputers in protected mode, and a 80860 RISC processor(the MicroWay "Number Smasher 860"). The total memory required is not known exactly,but the minimum would probably be around 4 Mb for the size of problem considered here.The times required for a single evaluation of equation (13) are given in Table 3. The totaltime to complete a parameter estimation from initial estimates using the 80860 is about5:21 hours. The computer program is implemented in C++ computer language using array
1 Split Region 2 2690 252 As simulated ("truth") 2694 23
3 Combine regions 3, 4, & 5 3043 19
4 Move boundary between regions 4 & 5 2757 23
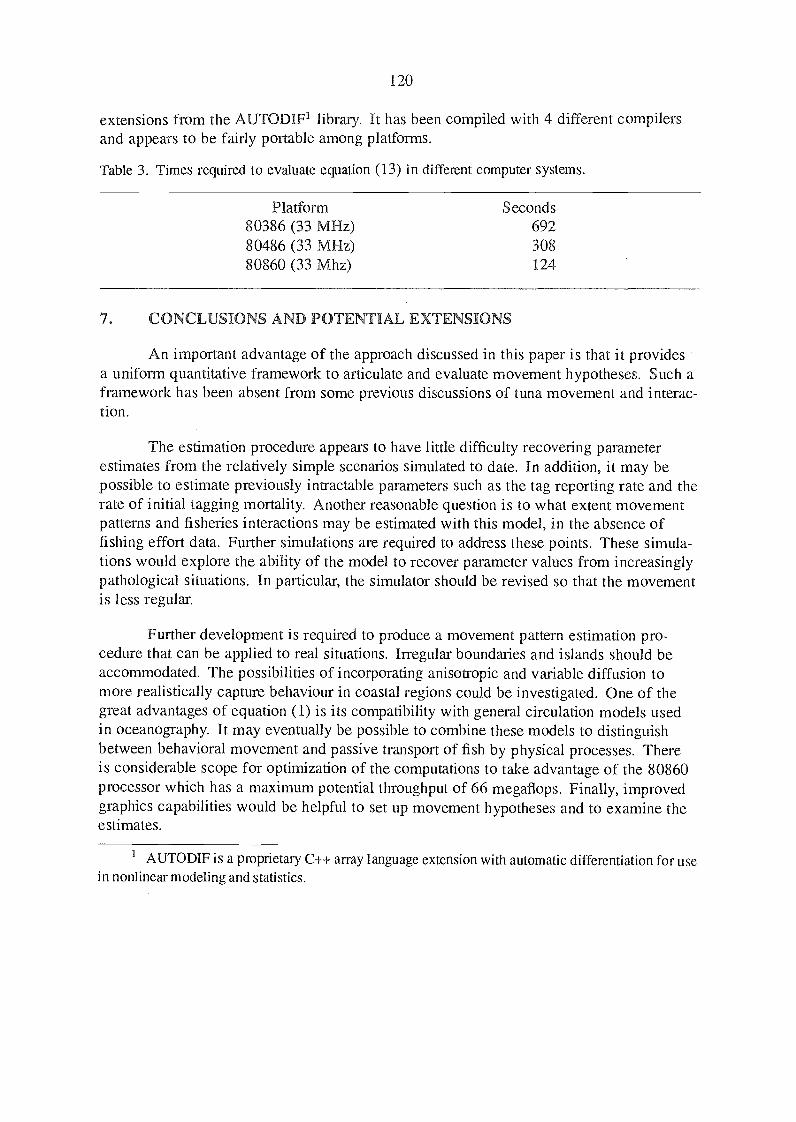
120
extensions from the AUTODIF1 library. It has been compiled with 4 different compilersand appears to be fairly portable among platforms.
Table 3. Times required to evaluate equation (13) in different computer systems.
Platform S econds80386 (33 MHz) 69280486 (33 MHz) 30880860 (33 Mhz) 124
7. CONCLUSIONS AND POTENTIAL EXTENSIONS
An important advantage of the approach discussed in this paper is that it providesa uniform quantitative framework to articulate and evaluate movement hypotheses. Such aframework has been absent from some previous discussions of tuna movement and interac-tion.
The estimation procedure appears to have little difficulty recovering parameterestimates from the relatively simple scenarios simulated to date. In addition, it may bepossible to estimate previously intractable parameters such as the tag reporting rate and therate of initial tagging mortality. Another reasonable question is to what extent movementpatterns and fisheries interactions may be estimated with this model, in the absence offishing effort data. Further simulations are required to address these points. These simula-tions would explore the ability of the model to recover parameter values from increasinglypathological situations. In particular, the simulator should be revised so that the rnovementis less regular.
Further development is required to produce a movement pattern estimation pro-cedure that can be applied to real situations. Irregular boundaries and islands should beaccommodated. The possibilities of incorporating anisotropic and variable diffusion tomore realistically capture behaviour in coastal regions could be investigated. One of thegreat advantages of equation (1) is its compatibility with general circulation models usedin oceanography. It may eventually be possible to combine these models to distinguishbetween behavioral movement and passive transport of fish by physical processes. Thereis considerable scope for optimization of the computations to take advantage of the 80860processor which has a maximum potential throughput of 66 megaflops. Finally, improvedgraphics capabilities would be helpful to set up movement hypotheses and to examine theestimates.
3 AUTODIF is a proprietary C++ away language extension with automatic differentiation for usein nonlinear modeling and statistics.

8. REFERENCES CITED
Banks, H.T., P.M. Kareiva, and P.K. Lamm. 1985. Modeling insect dispersal and esti-mating parameters when mark-release techniques may cause initial disturbances. J. Math. Biol. ,
22:259-77.
Banks, H.T., P.M. Kareiva, and L. Zia. 1988. Analyzing field studies of insect dispersalusing two-dimensional transport equations. Environmental Entomology, 17:815-20.
Beverton, R. J. H. and S. J. Holt. 1957. On the dynamics of exploited fish populations.U. K. Min. Agric. Fish., Fish. Invest. (Ser. 2)19:533 p.
Carnahan, B., H.A. Luther, and J.O. Wilkes. 1969. Applied numerical methods. NewYork, John Wiley & Sons, 604 p.
Dalgaard, P. and M. Larsen. 1990. Fitting numerical solutions of differential equations toexperimental data:a case study and some general remarks. Biometrics 46:1097-1109.
Griewank, A. and G.F. Corliss. 1991. Automatic differentiation of algorithms: Theory,practice and application. Philadelphia, SIAM.
Hilborn, R. 1990. Determination of fish movement patterns from tag recoveries usingmaximum likelihood estimators. Can.J.Fish.Aquat.Sci., 47:635-43.
Hampton, J. 1991. Estimation of southern bluefin tuna Thunnus maccoyii mortality andmovement rates from tagging experiments. Fish.Bull.NOAA-NMFS 89:591-610.
Ishii, T. 1979a. Estimating parameters of a fish population supplied by sequential recruit-ment. Inv.Pesq., 43:123-37.
Ishii, T. 1979b. Attempt to estimate migration of fish population with survival parametersfrom tagging experiment data by the simulation method. Inv. P es q. , 43:301-17.
Okubo, A. 1980. Diffusion and ecological problems:mathematical models. New York,Springer, 254 p.
Othmer, H.G., S.R. Dunbar, and W. Alt. 1988. Models of dispersal in biological systems.J.Math.Biol,. 26:263-98.
Pella, J.J. and P.K. Tomlinson. 1969. A generalized stock production model. Bull. I-ATTC 13(3):421-96.
Press, W.H., B.P. Flannery, S.A. Teukolsky, and W.T. Vetterling. 1988. Numerical recipesin C. New York, Cambridge Univ. Press, 735 p.
Sibert, J. 1984. A two-fishery tag attrition model for the analysis of mortality, recruit-ment, and fishery interaction. Tech.Rep.Tuna Billfish Assess.Programme, S.Pac.Comm.13:27 p.
Sibert, J. and D. Fournier. 1989. Statistical Modeling of Tuna Movement. Proceedingsof the 40t1 Tuna Conference, May 1989, edited by M. Hinton.
121

122
DISCRETE POPULATION FIELD THEORYFOR TAG ANALYSIS AND FISHERY MODELING
Carlos A. M. Salvad61Southwest Fisheries Science Center
National Marine Fisheries Service, NOAABox 271
La Jolla, CA 92038-0271
ABSTRACT
I consider discrete fields representing population processes: population density andpopulation density rate. Using the fields for a tagged fish population I construct theprobability density of movement from cell to cell over an interval of time of length equalto the time the tagged fish survive in their domain. I formulate rules for the constructionof expressions of these population processes using the principle of linear superposition,where each population process at a particular cell and at a particular interval of time isweighted by the probability density of an individual slIrviving movement into anothercell over that interval of time. These expressions can be used to answer questions offisheries interaction such as how increased effort in a portion of the population domainwill affect the catch in another portion. They will also be found to be of the same formas the discrete version of the integral equation solutions of partial differential equationsthat model the dynamics in space-time of tagged and untagged fish populations if weidentify the probability density of movement from point to point in space-time with thepoint-source solution, or Creen function, of the differential equations.
1. INTRODUCTION
To begin, for the purposes of this paper I define "field" to mean a quantity that has adefinite value at any point in space-time. As in a field in the country, with depressionsand promontories, deep valleys and high mountains, every point in a field has anelevation, a certain value to its height relative to some level, which in the case of thecountry field is sometimes chosen to be sea level. A population distributed in space-timeconstitutes a field because there is a definite value, relative to the zero population level,for example to the number of individuals in any region at any time I choose. In thiswork applied to fisheries, some of the fields I will be considering are the populationdensity (e.g., numbers of fish per unit area), the effort density (e.g., number of hooks orboat-time spent fishing per unit area), the catch density rate (e.g., number of fishcaught per unit area per unit time) and the recruitment density rate (e.g., number offish recruited per unit area per unit time).
In formulating a continuous population field theory based on tagging data Salvad6
1Graduate Program, CICESE, Ensenada, Baja California.
FAO LIBRARY AN: 346121
123
(1993) derived field equations (i.e., partial differential equations) for the populationdensities of tagged and untagged fish. These were solved in terms of integral equationsby invoking the point-source solutions (or Green functions) that are associated with thedifferential operators of the field equations (Courant and Hilbert 1953; Bjorken andDrell 1964; Salvad6 1993) . The Green function, or propagator (Bjorken and Drell1964), for the fishery can be interpreted as the probability density of surviving themovement from point to point in space-time (Salvadó 1993). This formulation of fisheryproblems based on tagging data has several features that makes it quite simple to use.First of all, the whole fisheries interaction problem can be solved by matrixmultiplication. These matrix equations are the result of the discretization of the integralequations mentioned above, which for a single interval of time coincide with theMarkovian formulation of the interaction between the discrete areas of the fishery. Theadvantage of the method by Salvad6 (1993) over the strictly Markovian approach is thatthe probability density of fish movement is derivable from a field equation with anassumed parametrization. The parameters can then be evaluated by simply taking themoments of the probability density. However, the approach by Salvad6 (1993) has theproblem that the mathematics necessary to derive it are abstract, requiring methodsthat are not usually taught to fishery biologists. Therefore the work by Salvad6 (1993)will not have a broad appeal to the fishery biology community unless it can be derivedin a simpler way using mathematics with which most fishery biologists are familiar.
This work is a different approach to the same problem. The linear superposition of fieldsrepresenting population processes is considered. The probability density of fishmovement from point to point in discrete space-time is defined as the tagged fishpopulation density divided by the number of tagged fish released. Based on thedefinition of probability density of fish movement, rules are formulated for the linearsuperposition of fields representing population processes. Expressions for the populationdensities of tagged and untagged fish are constructed given that there is an untagged fishpopulation source due to recruitment, and tagged and untagged fish population sinksdue to catch. The mathematical expressions that will result from this superposition forthe population density and the catch density rate are matrix equations which correspondto the discretized integral equations solutions of the continuum field equations (Salvad61993). The probability density of causal movement from cell to cell will be identifiedwith the causal Green function or propagator associated with the field equations(Salvad6 1993). This will be done strictly algebraically making no use of differentialequations. The price that I will pay for this simplification is an inability to derivediscretely the deeper results attainable with the continuum approach. However, becausethe linkage to the continuum field theory of Salvadó (1993) is made, all the resultsderived in the continuum can also be used discretely. So I warn the reader that theapproach in this work is not mathematically rigourous. For the precise derivation of theresults the reader must go to Salvad6 (1993). The approach in this work is intuitive.
The symbols, and their meaning, used in this document are as follows:
A = area inhabited by a fish population, called the domain of the populationAi = area of the the ith cell of A
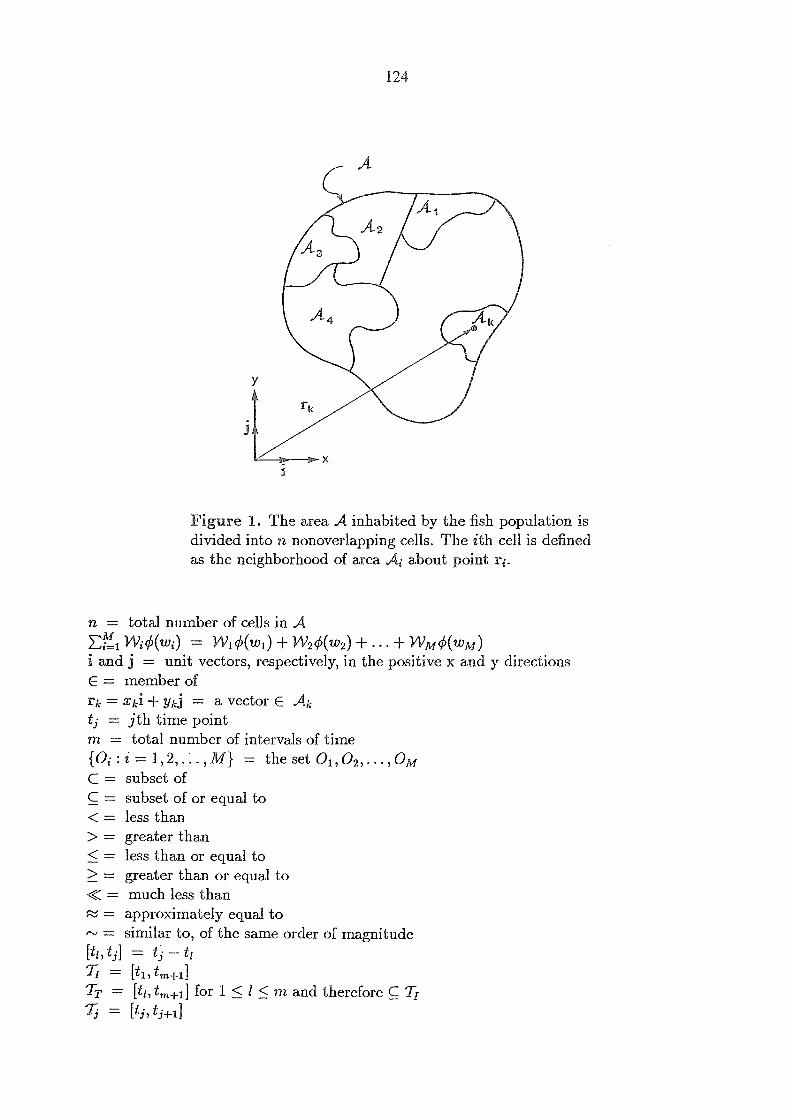
124
Figure 1. The area A inhabited by the fish population isdivided into n nonoverlapping cells. The ith cell is definedas the neighborhood of area A about point ri.
n = total number of cells in AE1YViO(wi) = WiO(wi) + W29(w2) +... + Wm0(wm)i and j = unit vectors, respectively, in the positive x and y directionsE = member ofrk = xki ykj = a vector E Akt = jth time pointm = total number of intervals of time{0i : i= 1,2, ... ,M} = the set 01,02,..., OmC = subset ofC = subset of or equal to<= less than> = greater than< = less than or equal to> = greater than or equal to
much less than= approximately equal to= similar to, of the same order of magnitude
[thti] = ti -t1TI = [ti,tm+i]TT = [ti, tm_f_i] for 1 <i < m and therefore C 7-1Tj [tilt+1]
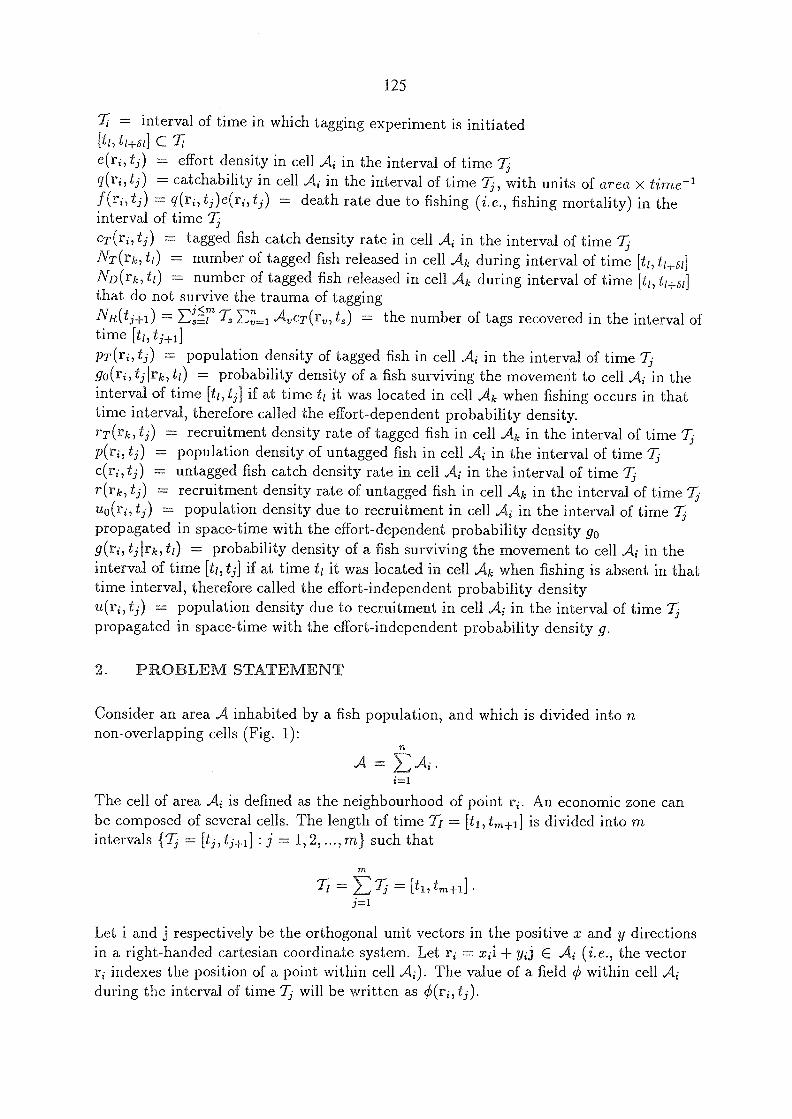
= interval of time in which tagging experiment is initiated[t1, t1+51] c
e(ri, t;) = effort density in cell Ai in the interval of time T;g(ri,t;) = catchability in cell Ai in the interval of time with units of area x time-1f(ri,t;) = q(ri,ti)e(ri,t;) = death rate due to fishing (i.e., fishing mortality) in theinterval of time Tic2-(ri,t;) = tagged fish catch density rate in cell Ai in the interval of time T.,NT(rk,t1) = number of tagged fish released in cell Ak during interval of time [ti,ND (rk, ti) = number of tagged fish released in cell Ak during interval of time [ti,ti+si]that do not survive the trauma of taggingNR(ti+i) =E-73. ELI AucT(r,,ts) = the number of tags recovered in the interval oftime [t1, ti+i]PT(ri, ti) -= population density of tagged fish in cell Ai in the interval of time Tigo(ri, tilrk, ti) = probability density of a fish surviving the movement to cell Ai in theinterval of time [t,, t] if at time ti it was located in cell Ak when fishing occurs in thattime interval, therefore called the effort-dependent probability density.rT(rk,t;) = recruitment density rate of tagged fish in cell Ak in the interval of time Ti
= population density of untagged fish in cell Ai in the interval of time Tic(ri,t;) = untagged fish catch density rate in cell Ai in the interval of time 7-3-r(rk, ti) =- recruitment density rate of untagged fish in cell Ak in the interval of time Tiuo(ri, = population density due to recruitment in cell Ai in the interval of time T.;propagated in space-time with the effort-dependent probability density go
g(r1, trk, ti) = probability density of a fish surviving the movement to cell Ai in theinterval of time [11,t, if at time ti it was located in cell Ak when fishing is absent in thattime interval, therefore called the effort-independent probability densityu(ri, ti) = population density due to recruitment in cell Ai in the interval of timepropagated in space-time with the effort-independent probability density g.
2. PROBLEM STATEMENT
Consider an area A inhabited by a fish population, and which is divided into nnon-overlapping cells (Fig. 1):
A
The cell of area Ai is defined as the neighbourhood of point ri. An economic zone canbe composed of several cells. The length of time 7} = [ti,t,i+i] is divided into mintervals {'T [ti, :j 1,2,..., m} such that
1:7 [ti,tm.+1]
Let i and j respectively be the orthogonal unit vectors in the positive x and y directionsin a right-handed cartesian coordinate system. Let ri xii yij E Ai (i.e., the vector
indexes the position of a point within cell Ai). The value of a field within cell Aiduring the interval of time 7:i will be written as 0(ri,t;).
125
Ai.
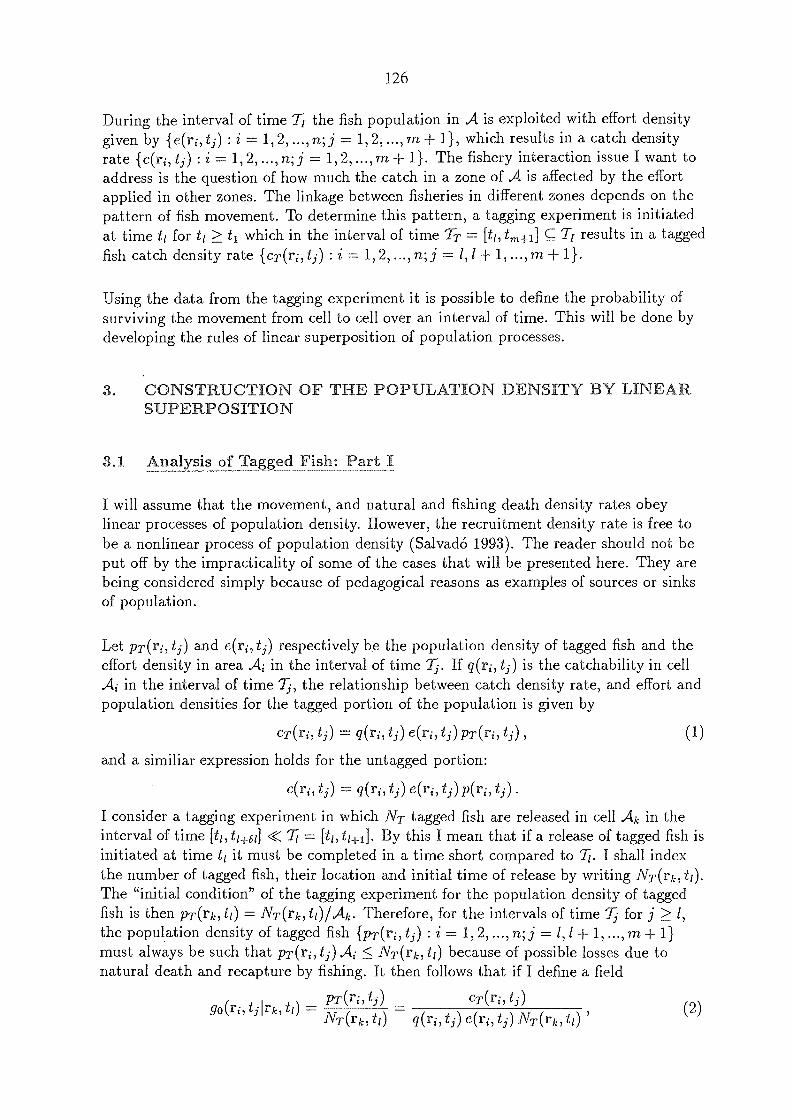
126
During the interval of time 71 the fish population in A is exploited with effort densitygiven by { e(ri, ti): i = 1,2, ..., n; j = 1,2, ...,m 1}, which results in a catch densityrate Ic(ri, ti) : i = 1,2, ...,n; j = 1,2, ...,m 11. The fishery interaction issue I want toaddress is the question of how much the catch in a zone of A is affected by the effortapplied in other zones. The linkage between fisheries in different zones depends on thepattern of fish movement. To determine this pattern, a tagging experiment is initiatedat time ti for ti > t1 which in the interval of time TT = [thtm+i] C 7i results in a taggedfish catch density rate {cT(ri,ti) : i = 1,2, ..., n; j = 1,1+ 1, ...,m 1}.
Using the data from the tagging experiment it is possible to define the probability ofsurviving the movement from cell to cell over an interval of time. This will be done bydeveloping the rules of linear superposition of population processes.
3. CONSTRUCTION OF THE POPULATION DENSITY BY LINEARSUPERPOSITION
3.1 Analysis of Tagged Fish: Part I
I will assume that the movement, and natural and fishing death density rates obeylinear processes of population density. However, the recruitment density rate is free tobe a nonlinear process of population density (Salvad6 1993). The reader should not beput off by the impracticality of some of the cases that will be presented here. They arebeing considered simply because of pedagogical reasons as examples of sources or sinksof population.
Let pT(ri,ti) and c(ri, ti) respectively be the population density of tagged fish and theeffort density in area Ai in the interval of time 7;. If q(ri, t i) is the catchability in cellAi in the interval of time 7;, the relationship between catch density rate, and effort andpopulation densities for the tagged portion of the population is given by
or(ri,t;) = g(ri, tj) e(ri, t1)PT(ri,t1) ,
and a similiar expression holds for the untagged portion:
t1) = q(ri,t 1) e(r, t p(r, t 1) .
I consider a tagging experiment in which NT tagged fish are released in cell Ak in theinterval of time [t,, t,,] <77 = [t,, t,1]. By this I mean that if a release of tag,ged fish isinitiated at time ti it must be completed in a time short compared to 77. I shall indexthe number of tagged fish, their location and initial time of release by writing NT(rk,ti).The "initial condition" of the tagging experiment for the population density of taggedfish is then pT(rk,t1) = NT(rk,ti)I Ak. Therefore, for the intervals of time Ti for j > 1,the population density of tagged fish IpT(ri,ti) : i = 1,2, ..., n; j = 1,1 + 1, ..., m 1)must always be such that pT(ri,ti) Ai < NT(rk,ti) because of possible losses due tonatural death and recapture by fishing. It then follows that if I define a field
PT(ri,t;) cT(ri,ti)go(ri, tArk, tl) = (2)
NT(rk,ti) q(ri,ti) c(ri, t1) NT(rk,t1)
(1)

127
this four-indexed quantity go has the following properties:
Dimensional
A dimensional analysis of (2) reveals that go is a density. That is, go has the dimensionsof area-1.
Causal
Because tagged fish can exist in their domain at time t; only if they are present at anequal or earlier time tl, go must satisfy
go(ri,tilrk,t1) = 0 for t; < ti.
Initial
If the tagged fish are released in cell Ak at time tu, assuming they disperse at a finiterate, initially they must be present in the cell of release only. Therefore, go must satisfy
Sikgo(Ti,tilrk,t1) =Ai
where the Kroenecker delta function Sik is defined by
1 if i = k
0 otherwise.
However, it is underst000d that the time ti here refers to the time ii+61 when all thetagged fish have been released.
Normalization
As a consequence of the initial property
E Aigo(r1,tilrk,t1) = 1,
where I have weighted the sum with the corresponding area because of the dimensionalproperty of go. Here again, the time tu refers to time tu+su when all the tagged fish havebeen released.
Probabilistic
Because the number of tagged fish recaptured cannot be greater than those released, for
t; > ti
and therefore
O
Sik =
<, 6ik
go(ri,tilrk,to 5 Ai'
Aigo(ri, t;Irk, ti) < 1.
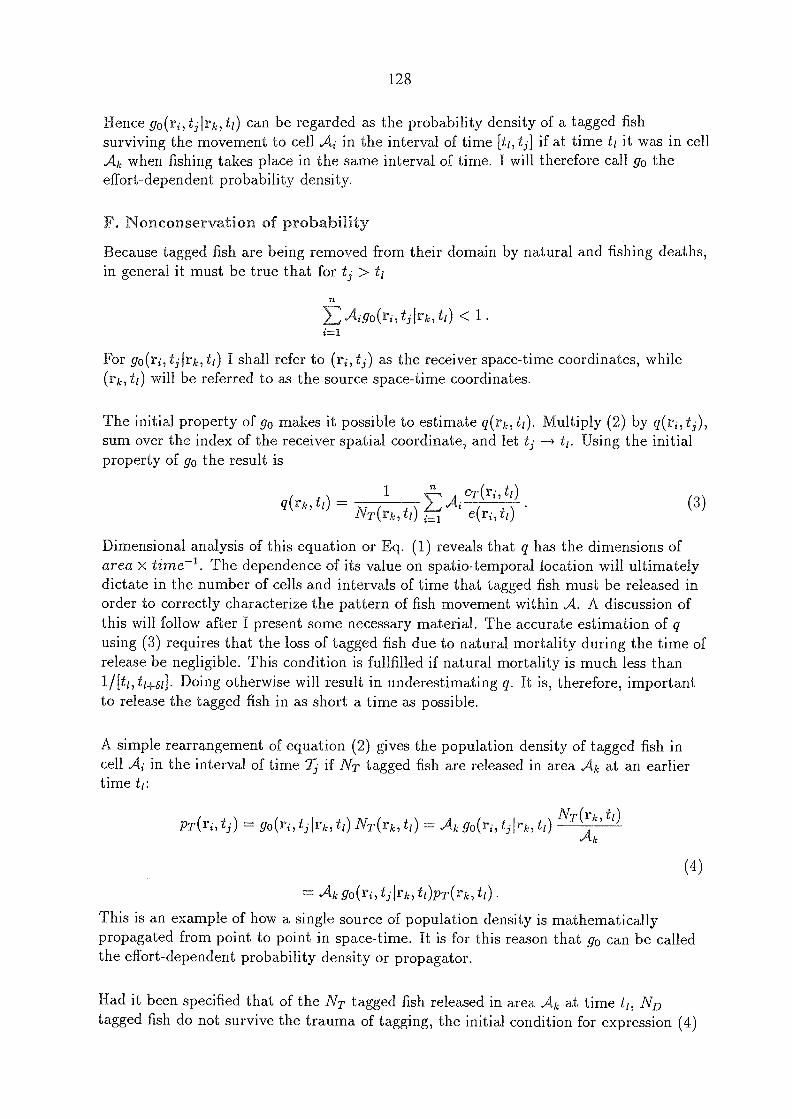
128
Hence go(ri, ti ti) can be regarded as the probability density of a tagged fishsurviving the movement to cell Ai in the interval of time [ti, ti] if at time ti it was in cellAk when fishing takes place in the same interval of time. I will therefore call go theeffort-dependent probability density.
F. Nonconservation of probability
Because tagged fish are being removed from their domain by natural and fishing deaths,in general it must be true that for ti > ti
TI
Eit,go(ri,t_drk,t,) < 1.
For go(ri, tilrk, ti) I shall refer to (ri, ti) as the receiver space-time coordinates, while(rk,ti) will be referred to as the source space-time coordinates.
The initial property of go makes it possible to estimate q(rk,ti). Multiply (2) by q(ri, ti),sum over the index of the receiver spatial coordinate, and let ti ti. Using the initialproperty of go the result is
q(rk,ti) =NT(rk,ti) e(ri, ti)
cT(ri,ti)
Dimensional analysis of this equation or Eq. (1) reveals that q has the dimensions ofarea x time'. The dependence of its value on spatio-temporal location will ultimatelydictate in the number of cells and intervals of time that taed fish must be released inorder to correctly characterize the pattern of fish movement within A. A discussion ofthis will follow after I present some necessary material. The accurate estimation of qusing (3) requires that the loss of tagged fish due to natural mortality during the time ofrelease be negligible. This condition is fullfilled if natural mortality is much less than1/[ti, ti+61]. Doing otherwise will result in underestimating q. It is, therefore, importantto release the tagged fish in as short a time as possible.
A simple rearra,ngement of equation (2) gives the population density of tagged fish incell Ai in the interval of time Ti if NT tagged fish are released in area Ak at an earliertime
pT(ri,ti) go(r1,tilrk,t1) NT(rk,i1) Ak go(ri, tilrk,toNT(rk,t1)
Ak
(4)
Ak go(riltilrk,ti)pT(rk, ii)
This is an example of how a single source of population density is mathematicallypropagated from point to point in space-time. It is for this reason that go can be calledthe effort-dependent probability density or propagator.
(3)
Had it been specified that of the NT tagged fish released in area Ak at time ti, NDtagged fish do not survive the trauma of tagging, the initial condition for expression (4)

129
would have to be modified to pT(ri,t1) =[NT(rk,ti) ND(rk,t1)11.14. Although inpriciple it is possible to know the number of tagged fish, that do not survive the traumaof tagging once they are released, it is very difficult to make such a determination. Thisis one of the pedagogical examples that I referred to at the beginning of this section.The case is being considered here as an example of a sink of population density whichwill enable me to formulate the rules of superposition for the construction of expressionsfor the population density involving both sources and sinks of population.
Suppose now that tagged fish are released simultaneously in several cells over an intervalof time [t1, t,+51] < 'T. Letting NT(r,,ti) be the number of tagged fish releasedcorrespondingly in cells {A : = 1,2, ... , n} during interval of time [t,, t,,], then the"initial condition" for the tagged fish population density is given byPT(rintl) = NT(r, t,)/A for y = 1,2, ,n. Following the prescription of Eq. (4), thepopulation density of tagged fish in cell Ai in the interval of time Ti is then given by thelinear superposition
PT(ri, go(ri, tr1, tONT(ri,t1)-F go(ri, ijir2, ti)NT(r2,t1) +
...-F go(r1,t;Irn,t1)NT(rn,t1) = Aigo(ri,t_dri,tOPT(ri,ti)
A2go(ri, tiir2, tOPT(r2,t1)-f- + Anso(ri,tilrn,tOpT(rn,t1) (5)
tOpT(r,t1).E tiir,n=1
This is an example of how multiple simultaneous sources of population density aremathematically propagated from point to point in space-time.
As was considered for the tagging experiment in a single cell, suppose that of theNT(r,t1) tagged fish that are released in cell A during interval of time [4,t1+81}ND(r,,ti) tagged fish do not survive the trauma of tagging. Then the initial conditionfor the population density in expression (5) would have to be modified to
pT(rv,t1) = [NT(r,t1) ND(r.,t1)11 Av -
With the result given in (5) I can deduce a property for the summation of probabilitydensities. I can use pT(ri,t;), the final condition of (5), as the initial condition forpropagation to a later time, say t, > ti:
PT(rk, ts) =- Aigo(rk,tslri,ti)pT(ri,ti). (6)i=1
Substituting (5) into (6) and interchanging summations, I get
71
PT(rk,t.,) E Aigo(rk, ti)go(ri, ti) pT(r.,t1) . (7)v=1
Because (7) must be of the form of (5) and (6) I can deduce the following property of go:
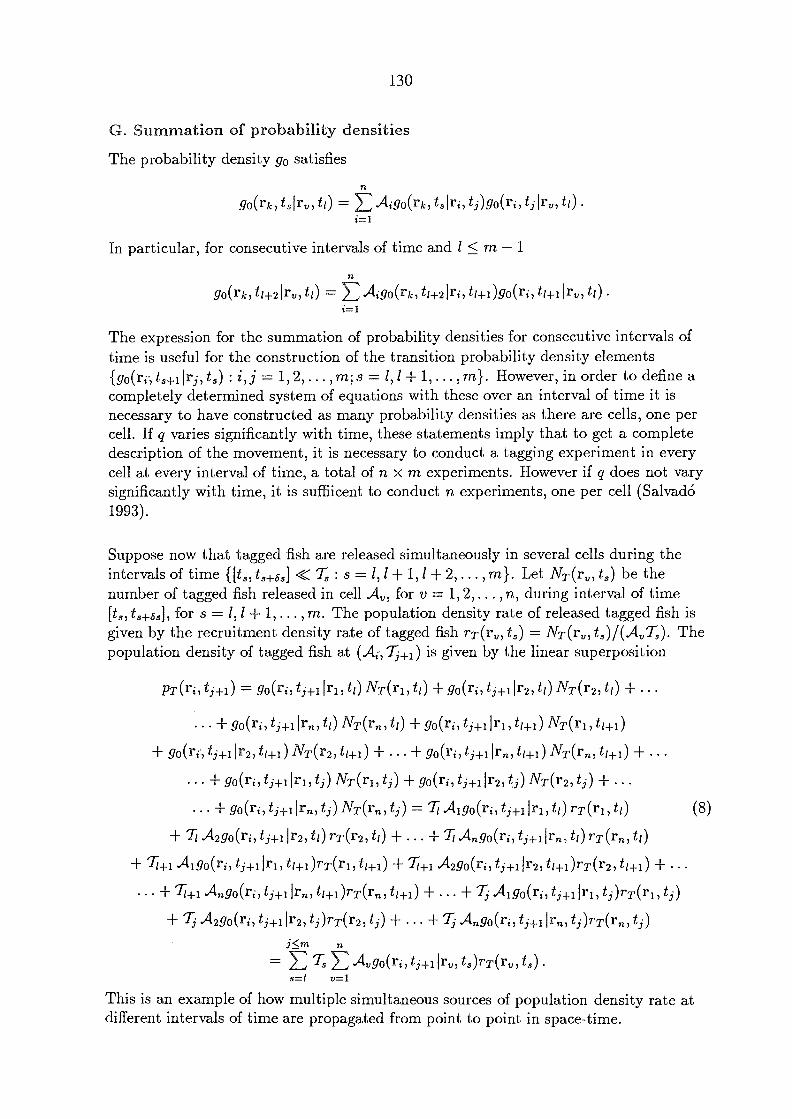
130
G. Summation of probability densities
The probability density go satisfies
go(rk,tsirv,t1) Aigo(rk,tslri7t;)go(ri,t.dr,,t1).i=1
In particular, for consecutive intervals of time and / < m
gO(ric, t1-1-21rv, t1) = EAig0(rk, t1+2Iri, ti+i)go(ri, ii1 r, tl)i=1
The expression for the summation of probability densities for consecutive intervals oftime is useful for the construction of the transition probability density elements{go(ri, ts+ilri, ts) : i,j = 1,2, ... ,m; s = 1,1+ 1, ... ,m}. However, in order to define acompletely determined system of equations with these over an interval of time it isnecessary to have constructed as many probability densities as there are cells, one percell. If q varies significantly with time, these statements imply that to get a completedescription of the movement, it is necessary to conduct a tagging experiment in everycell at every interval of time, a total of n x m experiments. However if q does not varysignificantly with time, it is suffiicent to conduct n experiments, one per cell (Salvad61993).
Suppose now that tagged fish are released simultaneously in several cells during theintervals of time {[t3, t363] < : .s = /7/ + 1, / + 2, ... ,m}. Let NT(r,,t3) be thenumber of tagged fish released in cell Ay, for y = 1,2,... ,n, during interval of time[t5, ts+53], for s = /,/ + 1, ... rn. The population density rate of released tagged fish isgiven by the recruitment density rate of tagged fish rT(r,t,) = NT(r,,t,)1(AT,). Thepopulation density of tagged fish at (Ai,7i) is given by the linear superposition
PT(ri,ti+1) go(ri, tj1 ri, t1) NT(ri,t1) go(ri, t3i ir2, t1) NT(r2, ti)
go(ri, Irn, tr) NT(rn, tr) + go(ri, tj-{-111%, ti+1) NT(ri, t1-1-1)
tj-1-11r27 t1-1-1)NT(r27t1-1-1) .. + gO(ri, tj+1 NT(rn, t1+1) +
+ go(ri, ti) NT(ri, ti) go(ri, t,j) NT(r2, ti)
go(rj, ti+i Irn, t;) NT(rn, ti) = 7-1 Aigo(ri,t;+1 tr) rT(ri, (8)
+ .4290(ri, t111'2, ti) rT(r2, tr) Ango(ri, iji Ira, t1)rT(r,t1)
Tr+i Aigo(ri, tt+i)rT(ri, t1+1) + T/4-1 Azgo(ri, tj+11r2, tt-1-1)rT(r2,t0-1.) +
+ T1+1 Ango(ri, jrn, ti+OrT(rT1 t1+1) + + Ti Aigo(ri, t;)rT(ri, tj)
+ 7 A2go(rt, ti+11r2, ti)rT(r2, t;) + . . T.; Ango(ri,t11rn,t;)rT(rn,t;)j<m n
EZE Avgo(ri,iii-i ts)rT(rv, ts)3=i
This is an example of how multiple simultaneous sources of population density rate atdifferent intervals of time are propagated from point to point in space-time.
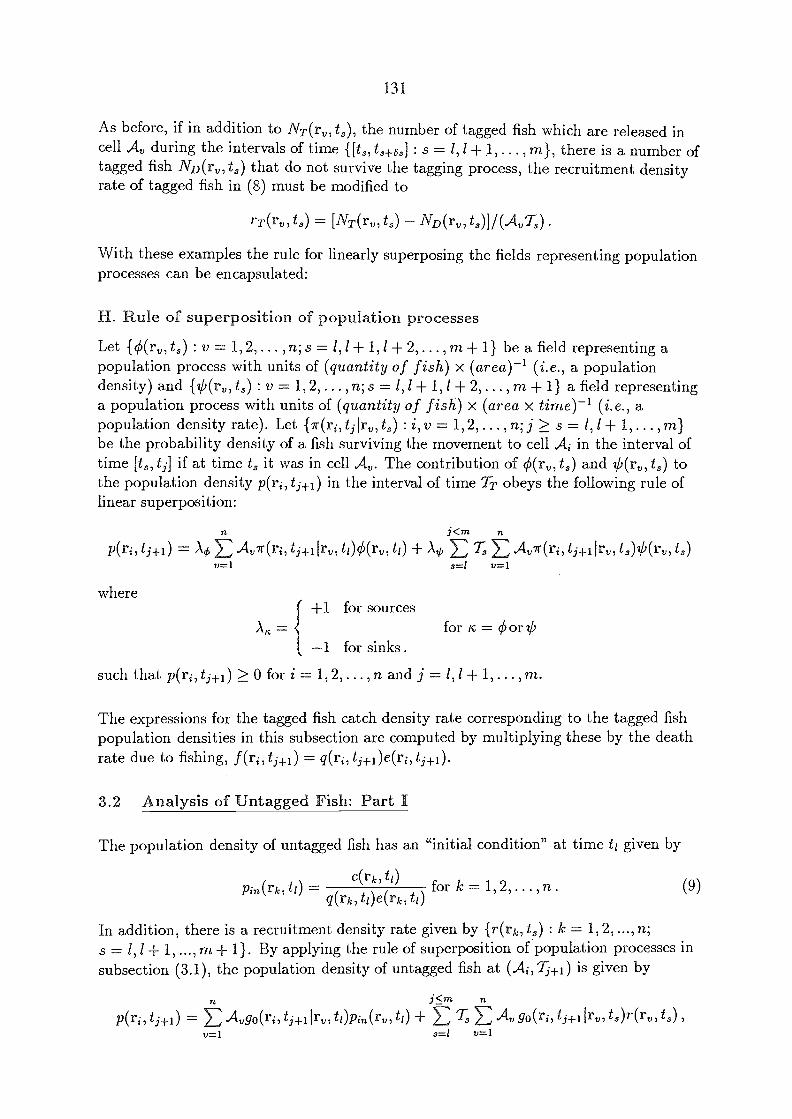
131
As before, if in addition to NT(rv,t,), the number of tagged fish which are released incell A during the intervals of time {[t3, t3+63] : s 1,1+ 1,...,m}, there is a number oftagged fish ND(rv,t,) that do not survive the tagging process, the recruitment densityrate of tagged fish in (8) must be modified to
rT(rv, t) [NT(r,ts) ND(rv,ts)11(.402-s)
With these examples the rule for linearly superposing the fields representing populationprocesses can be encapsulated:
H. Rule of superposition of population processes
Let {0(r,,t3) : y = 1, 2, ... ,n; s = 1,1+ 1, / + 2, ... , m + 1} be a field representing apopulation process with units of (quantity of fish) X (area)-1 (i.e., a populationdensity) and {Cry, t,) : y = 1,2, ... , n; s = 1,1+ 1, / + 2, ... , m + 1} a field representinga population process with units of (quantity of fish) x (area X time)' (i.e., apopulation density rate). Let {r(ri, ti Irv, ts) : i,v = 1,2, ... ,n; j > s = 1,1+ 1, ... rn}be the probability density of a fish surviving the movement to cell Ai in the interval oftime [t.ti] if at time t, it was in cell A. The contribution of 0(rv, t,) and 0(rv, t,) tothe population density p(ri,ti+4) in the interval of time TT obeys the following rule oflinear superposition:
j(rn n
p(ri, = Ao E Avir rv, ti)(15(r,,t1)+ T, E.Aor(ri, t,+ ,,t8)0(r,,t,)v=1 s=1 v=1
where
such that p(ri, ti÷i) > 0 for i = 1,2, ... ,n and j 1,1 + 1, . , m.
The expressions for the tagged fish catch density rate corresponding to the tagged fishpopulation densities in this subsection are computed by multiplying these by the deathrate due to fishing, f(ri,t;+i) = q(ri, ti+i)e(ri, t;+1).
3.2 Analysis of Untagged Fish: Part I
The population density of untagged fish has an "initial condition" at time ti given by
c(rk,t1)Pin(rk,t1) = , for k = 1,2,...,n.
wk,ti)e(rk, t 1 )
In addition, there is a recruitment density rate given by { r(rk, ts) : k = 1,2, ..., n;s = 1,1+ 1, ..., m 11. By applying the rule of superposition of population processes insubsection (3.1), the population density of untagged fish at (Ai,7i+1) is given by
j<m n
P(ri,ti+i) =E Aso(r1,ti+11rv,ti)P1n(rv, Li) + Y3E A, go(ri, ti+1 r, ts)r(r,,t,),v=.1 8.1 v=1
(9)
A, =+1 for sources
for K = 0. or1 for sinks .

132
and it has been assumed that the untagged fish have the same movement patterns asthose of tagged ones. This assumption is correct if many tagged fish are released so thatgo, constructed as (2) indicates, approximately represents the average movement of thefish population.
The catch density rate of untagged fish is computed from this last equation bymultiplication by f(ri,ti) = g(ri, ti+i)e(ri, :
c(ri, = f (ri, ti+i) E Avgo(ri, t j+11r ,t1)pjn(r v,t1) 110(ti,ti+1) , (10)v=1
where uo(ri, 1) is the contribution to the population density due to recruitment and isgiven by
j<rn n
uo(ri, t.i+1) = ii 7E A, go(ri, ti+i r, ts)r(rv, t5) .v=i
Because I have knowledge of the fields go, f and c in the interval of time TT, uo can becomputed in that interval of time by use of
c(ri, ti+i)U0(17i, tj+1) = E Aygo(ri, t.i+ Ir, (1,, \rv,
f (1-6 tj+1) v=1
for j < m. Once this is done, it is possible to use (10) to model catch density rate ofuntagged fish in the interval of time TT, but only at the level of effort density for whichgo was constructed. No other case may be considered rigorously. To consider other levelsof effort, other tagging experiments at the new levels of effort must be performed,because go is the effort-dependent probability density of fish movement as can beappreciated in Eq. (2). The history of recapture of tagged fish will affect the value of go.Although in principle I could conduct a tagging experiment at any level of effort, it is avery impractical and expensive method. It would be more convenient to be able toconstruct an effort-independent propagator, that is, the probability density of survivingmovement from point to point in space from one time to a later one when no fishingtakes place in the interval of time under consideration. This will be accomplished byextracting from the effort-dependent propagator the fishing death rate. What will beleft in the propagator will be a measure of movement and natural death rate of the fish.
3.3 Analysis of Tagged Fish: Part II
The goal here is to derive expressions for the population density of tagged fish using aprobability density of movement from point to point in space-time when fishing effort isnot being applied. I will call this probability density g.
As in the first example of subsection (3.1), NT tagged fish are released in cell Ak in ainterval of time [t1, t151] C 7. During the interval of time TT the fishing effort appliedresulted in a tagged-fish catch density rate {cT(ri, tj) : i = 1, 2, ... ,n; j = 1,1+ 1,...,m +1}. Let g(ri, ti ti) be the effort-independent probability density of a fishsurviving the movement to cell Ai in the interval of time [t1, i] if at an earlier time ti it
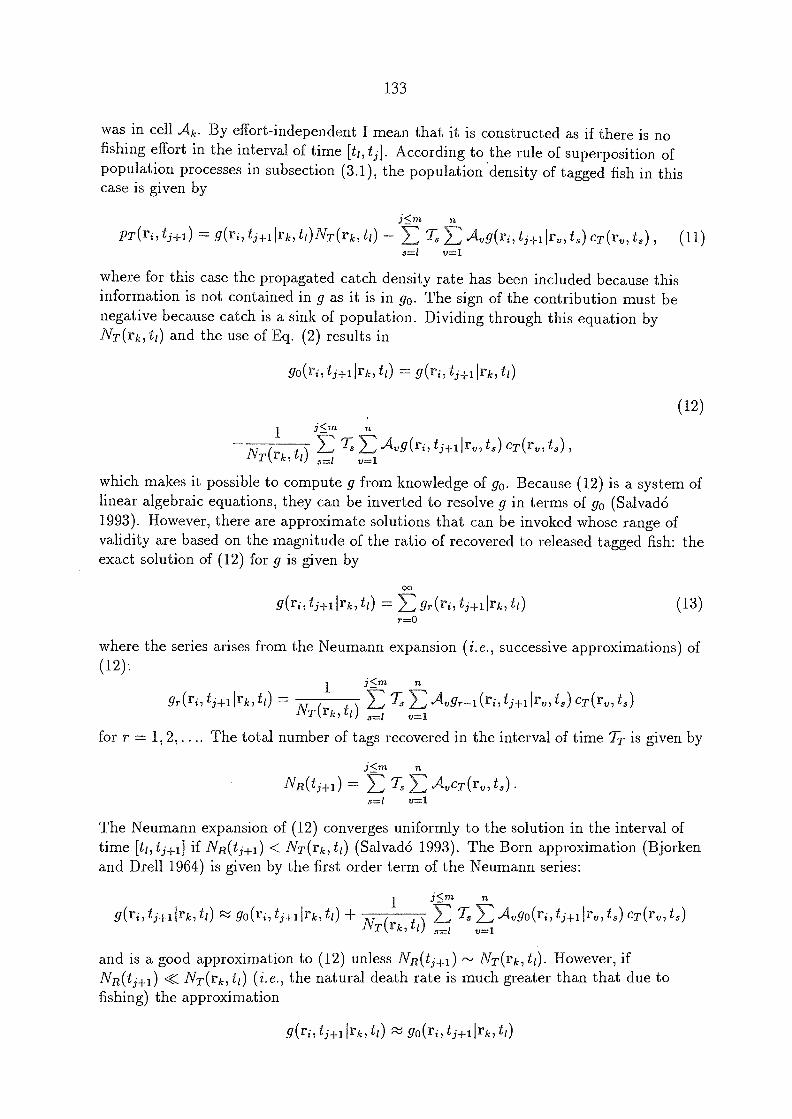
go(ri, tj+1 tl)
133
was in cell Ak. By effort-independent I mean that it is constructed as if there is nofishing effort in the interval of time [t1, t]. According to the rule of superposition ofpopulation processes in subsection (3.1), the population 'density of tagged fish in thiscase is given by
j<m n
PT(ri,t;-}-1) = g(ri,ti+ilrk,t1)NT(rk,t1) - z Avg(ri, tj+11rv,ts)CT(rv,t3) , (11)s=-1 v=-1
where for this case the propagated catch density rate has been included because thisinformation is not contained in g as it is in go. The sign of the contribution must benegative because catch is a sink of population. Dividing through this equation byNT(rk,ti) and the use of Eq. (2) results in
go(ri, ti+i Irk, ti) = g(ri, t1 Iri, ti)
(12)
1j<m
7-3 E Avg(ri,t11.rv,ts)cT(r,,ts),NT(rk,ti) 3=1 v-1
which makes it possible to compute g from knowledge of go. Because (12) is a system oflinear algebraic equations, they can be inverted to resolve g in terms of go (Salvadó1993). However, there are approximate solutions that can be invoked whose range ofvalidity are based on the magnitude of the ratio of recovered to released tagged fish: theexact solution of (12) for g is given by
g(ri, ij+i Irk, ii) = E gr (ri, ti+i Irk, ti) (13)r=0
where the series arises from the Neumann expansion (i.e., successive approximations) of(12)
1j<m
gr(ri,t;+i ti)= LE Avgr_i (ri, ts)cT(r.,ts)NT(rk,ti) 3=1 v=1
for r = 1,2, .... The total number of tags recovered in the interval of time TT is given by
j<m n
NR(tj+1) T5 E AuCT(rv, ts).5=1 v=1
The Neumann expansion of (12) converges uniformly to the solution in the interval oftime [ti,t;+1] if NR(ti+i) < NT(rk,ti) (Salvadó 1993). The Born approximation (Bjorkenand Drell 1964) is given by the first order term of the Neumann series:
1j<rn n
Avgo(ri, t1 Ire, t) cT(rv,t.)NT(rk,ti) 3=1 v=1
and is a good approximation to (12) unless NR(t.i+i) NT(rk,t1). However, ifNR(t.i+i) < NT(rk,t1) (i.e., the natural death rate is much greater than that due tofishing) the approximation
g(ri,t;+1 Irk, ti) go(ri,ti+i Irk, ti)
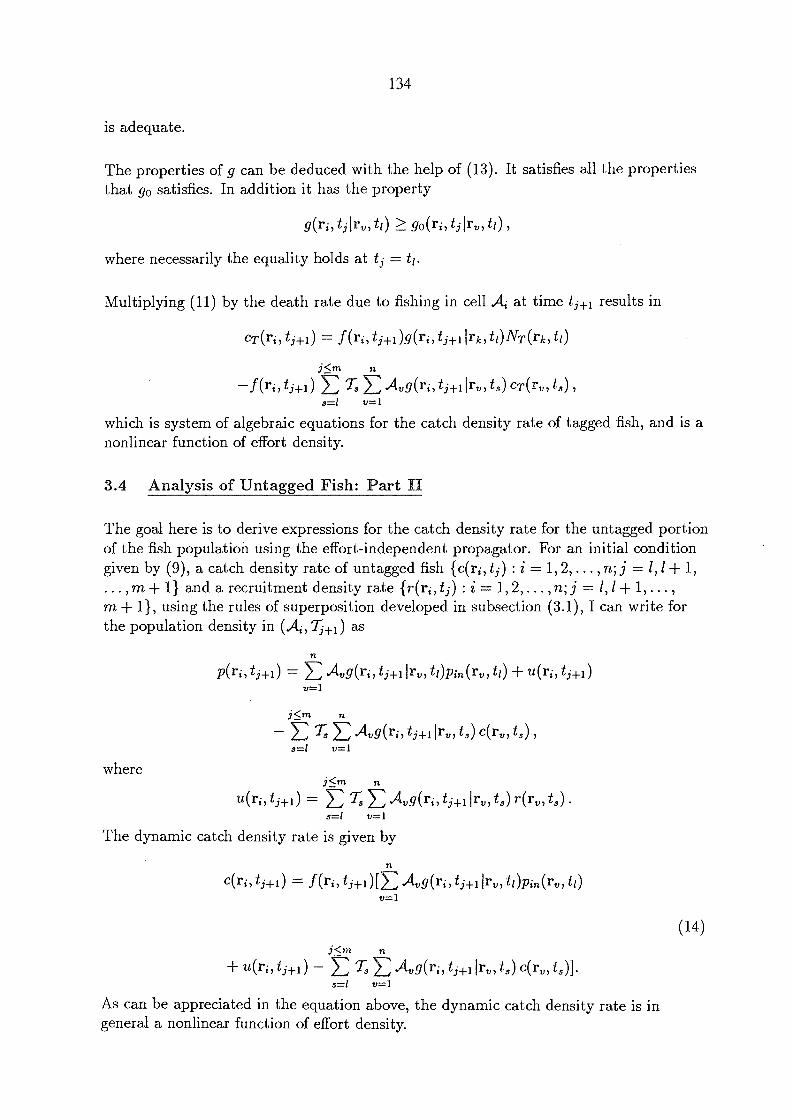
is adequate.
The properties of g can be deduced with the help of (13). It satisfies all the propertiesthat go satisfies. In addition it has the property
g(ri, tilrv, go(ri,t1lry,t1),
where necessarily the equality holds at ti = t1.
Multiplying (11) by the death rate due to fishing in cell Ai at time results in
cT(r1,t1) = f ti+i irk, tI)NT(rk,t1)
j<m n
f (ri,ti+i) E 7; E Avg(ri,ti+i t,)cT(r,,ts) ,
5=1 v=1
which is system of algebraic equations for the catch density rate of tagged fish, and is anonlinear function of effort density.
3.4 Analysis of Untagged Fish: Part II
The goal here is to derive expressions for the catch density rate for the untagged portionof the fish population using the effort-independent propagator. For an initial conditiongiven by (9), a catch density rate of untagged fish {c(ri, ti) : i = 1,2, ... ,n; j = 1,1 + 1,
, m + 1} and a recruitment density rate {r(ri, t;) : i = 1,2, ... ,n; j = 1,1+ 1,...,m + 1}, using the rules of superposition developed in subsection (3.1), I can write forthe population density in (A1, T) as
p(ri,t j+i) = E u(ri, ti+i )v=1
i<m n
EAvg(ri, tj-1-11rv, ts)C(rv, ts)8=1 v=1
wherej<m n
u(ri, ti+i) = ti+ 5) r(rv, is) .
8=1 v-1
The dynamic catch density rate is given by
C(Ti, ti+1) =-- f(Ti, tj-F1)[E Avg(ril tj+ rv, tOPin(rv, t/)v=1
134
j<m n+ u(ri, t.i+1) E 7; E Avg(ri, i+ t3) c(r,,t,)].
3=r v-1
As can be appreciated in the equation above, the dynamic catch density rate is ingeneral a nonlinear function of effort density.
(14)
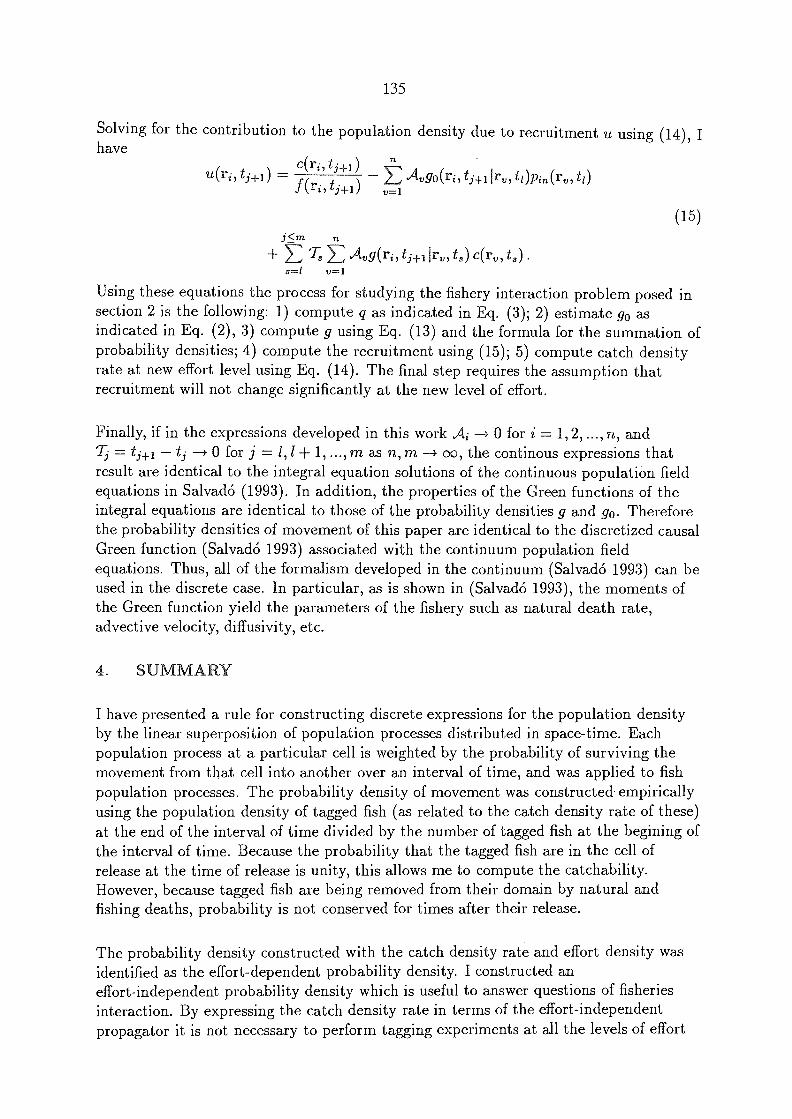
i<m n
Avg(ri, t Irv, is) c(rv, t 3) .
s=1 v=1
Using these equations the process for studying the fishery interaction problem posed insection 2 is the following: 1) compute q as indicated in Eq. (3); 2) estimate go asindicated in Eq. (2), 3) compute g using Eq. (13) and the formula for the summation ofprobability densities; 4) compute the recruitment using (15); 5) compute catch densityrate at new effort level using Eq. (14). The final step requires the assumption thatrecruitment will not change significantly at the new level of effort.
Finally, if in the expressions developed in this work Ai > 0 for i = 1, 2, ..., n, and= tj 0 for j =1,1+ 1, ..., m as n, oo, the continous expressions that
result are identical to the integral equation solutions of the continuous population fieldequations in Salvad6 (1993). In addition, the properties of the Green functions of theintegral equations are identical to those of the probability densities g and go. Thereforethe probability densities of movement of this paper are identical to the discretized causalGreen function (Salvad6 1993) associated with the continuum population fieldequations. Thus, all of the formalism developed in the continuum (Salvad6 1993) can beused in the discrete case. In particular, as is shown in (Salvad6 1993), the moments ofthe Green function yield the parameters of the fishery such as natural death rate,advective velocity, diffusivity, etc.
4. SUMMARY
I have presented a rule for constructing discrete expressions for the population densityby the linear superposition of population processes distributed in space-time. Eachpopulation process at a particular cell is weighted by the probability of surviving themovement from that cell into another over an interval of time, and was applied to fishpopulation processes. The probability density of movement was constructed empiricallyusing the population density of tagged fish (as related to the catch density rate of these)at the end of the interval of time divided by the number of tagged fish at the begining ofthe interval of time. Because the probability that the tagged fish are in the cell ofrelease at the time of release is unity, this allows me to compute the catchability.However, because tagged fish are being removed from their domain by natural andfishing deaths, probability is not conserved for times after their release.
The probability density constructed with the catch density rate and effort density wasidentified as the effort-dependent probability density. I constructed aneffort-independent probability density which is useful to answer questions of fisheriesinteraction. By expressing the catch density rate in terms of the effort-independentpropagator it is not necessary to perform tagging experiments at all the levels of effort
135
Solving for the contribution to the population density due to recruitment u using (14), Ihave
u(ri,tc(ri,;+i) = \ 2_, AvgcAri, ti+1 Irv, ti)pin(ru,ti)J ti+i)
(15)
136
that are to be considered. Only n tagging experiments, one per cell, at one level of effortis necessary if the recruitment and movement behaviour does not change significantly atthe different levels of effort.
The expressions constructed for the population density are identical to the discretizedintegral equations which are solutions of partial differential equations if the probabilitydensity of movement is identified with the Green function associated with thedifferential operators.
5. REFERENCES CITED
Bjorken, J.D. and S.D. Drell. 1964. Relativistic quantum mechanics. McGraw-HillBook Co. New York, NY. 300 p.
Courant, R. and D. Hilbert. 1953. Methods of mathematical physics, v. I. Interscience.New York, NY. 560 p.
Salvad6, C.A.M. 1993. Population field theory with applications to tag analysis andfisheries modeling: the empirical Green function. Can. J. Fish. Aquat. Sci. (In Press).
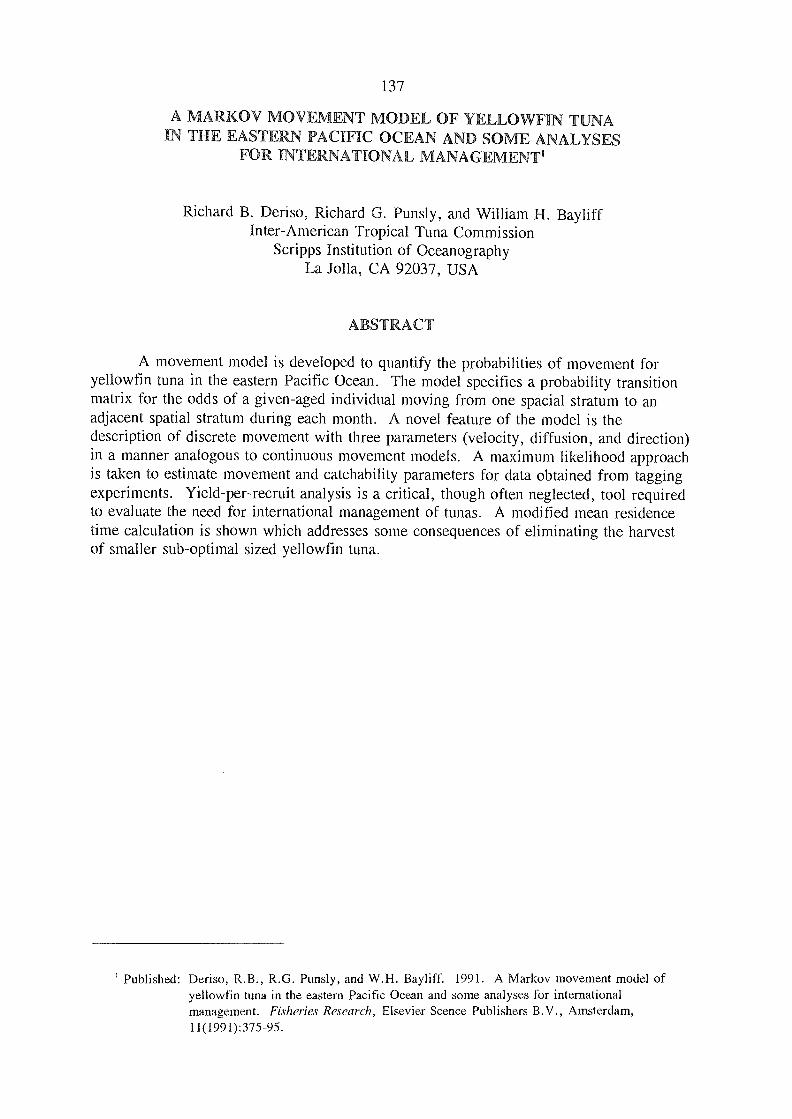
137
A MARKOV MOVEMENT MODEL OF YELLOWFIN TUNAIN THE EASTERN PACIFIC OCEAN AND SOME ANALYSES
FOR INTERNATIONAL MANAGEMENT'
Richard B. Deriso, Richard G. Punsly, and William H. BayliffInter-American Tropical Tuna Commission
Scripps Institution of OceanographyLa Jolla, CA 92037, USA
ABSTRACT
A movement model is developed to quantify the probabilities of movement foryellowfin tuna in the eastern Pacific Ocean. The model specifies a probability transitionmatrix for the odds of a given-aged individual moving from one spacial stratum to anadjacent spatial stratum during each month. A novel feature of the model is thedescription of discrete movement with three parameters (velocity, diffusion, and direction)in a manner analogous to continuous movement models. A maximum likelihood approachis taken to estimate movement and catchability parameters for data obtained from taggingexperiments. Yield-per-recruit analysis is a critical, though often neglected, tool requiredto evaluate the need for international management of tunas. A modified mean residencetime calculation is shown which addresses some consequences of eliminating the harvestof smaller sub-optimal sized yellowfin tuna.
I Published: Deriso, R.B., R.G. Punsly, and W.H. Bayliff. 1991. A Markov movement model ofyellowfin tuna in the eastern Pacific Ocean and some analyses for internationalmanagement. Fisheries Research, Elsevier Scence Publishers By., Amsterdam,11(1991):375-95.
138
A REVIEW OF A FISHERY-INTERACTION ISSUESIN THE WESTERN ANI CENTRAL PACIFIC OCEAN
John HamptonSouth Pacific CommissionNoumea, New Caledonia
ABSTRACT
The rapid expansion of tuna fisheries in the western and central Pacific Ocean inthe past ten years has brought into prominence a number of fisheries-interaction issues.Most of these issues fall into three general categories: A) coinpetition for fish at the samestage in -their life cycle in the same general area by two or more fisheries; B) the effect offishing a stock at an early stage of its life cycle upon a fishery that exploits the stock at alater stage, typically with a different gear; and C) the effect of fishing a stock in one areaupon a fishery that exploits the stock elsewhere. Some of the specific issues includeinteraction between large-scale fisheries operated by distant-water fishing nations(DWFNs) using different gear types; the effect of DWFN fisheries on locally-based,commercial fisheries; the effect of industrial fisheries on artisanal/subsistence fisheries;the effect of fisheries in different EEZs on one another; and the effe,ct of different fishingcompanies operating in the same EEZ on one another. The issues cover the whole rangeof major commercial tuna fishing methods in the Pacific Islands and Southeast Asia (purseseine, pole and line, longline, troll, handline and drift gillnet) and all of the tuna speciesthat support major fisheries in these areas (skipjack, yellowfin, bigeye and albacore).Much of the data required to assess many of these interaction issues (detailed catch andeffort, tagging and biological data) exist, although their restricted availability, in manycases, has hindered thorough analytical treatment. Some of these problems have nowbeen overcome through cooperative research programmes and the increasing quality of theSouth Pacific Commission's fisheries and tagging databases. Future work recommendedincludes the compilation of fisheries data for interaction studies; the continueddevelopment of models of tagged-tuna dynamics explicitly incorporating movement; thedevelopment of abundance indices; analyses and experiments to investigate the question ofpossible heterogeneity of the yellowfin population with respect to surface and longlinegears; estimation of the geographical distribution of skipjack and yellowfin recruitmentrelative to the surface fisheries and the effect this might have on interaction; and furthertagging and modelling work on South Pacific albacore.
. INTRODUCTION
The tuna fisheries of the western and central Pacific Ocean (WCPO), in this paperdefined as the South Pacific Commission (SPC) statistical area (Figure 1), are extremelydiverse, ranging from artisanal/subsistence fishing in Pacific Island and Southeast Asiancountries, through small-scale commercial tuna fishing in several of those countries, tothe large, distant-water purse-seine, pole-and-line and longline fisheries active on the highseas and, by way of licensing agreements, in the exclusive economic zones (EEZs) ofmany countries.
FAO LIBRARY AN: 346123
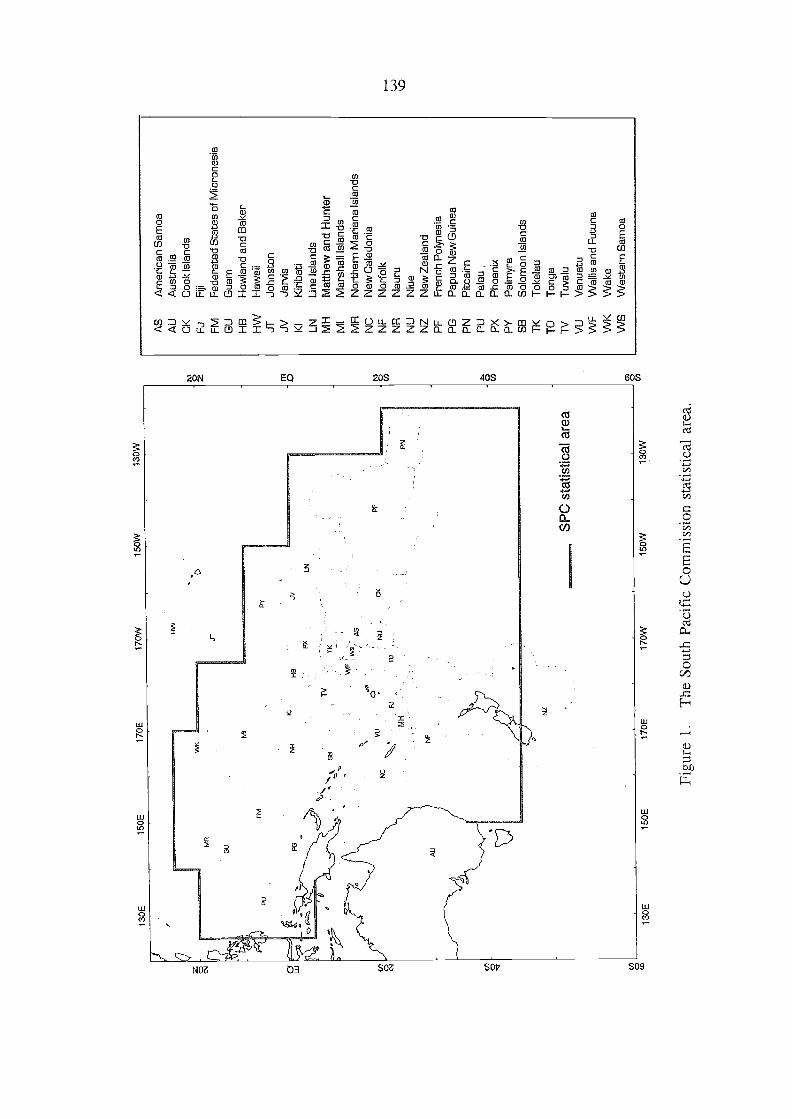
130E
150E
170E
170W
150W
130W
130E
150E
170E
170W
150W
130W
Figu
re 1
.T
he S
outh
Pac
ific
Com
mis
sion
sta
tistic
al a
rea.
rn o
AS
Arn
eric
an S
amoa
AU
Aus
tral
iaC
KC
ook
Isla
nds
FJ
Fiji
FM
Fed
erat
ad S
tate
s of
Mic
rone
sia
GU
Gua
mH
BH
owla
nd a
nd B
aker
HW
Haw
aii
JIJo
hnst
onJV
Jarv
isK
1K
iriba
tiLN
Une
Isla
nds
MH
Mat
thew
and
Hun
ter
MI
Mar
shal
l Isl
ands
MR
Nor
ther
n M
aria
na Is
land
sN
CN
ew C
aled
onia
NF
Nor
folk
NR
Nau
ruN
UN
iue
NZ
New
Zea
land
PF
Fre
nch
Pol
ynes
iaP
GP
apua
New
Gui
nea
PN
Pitc
airn
PU
Pal
au
PX
Pho
enix
PY
Pal
myr
aS
BS
olom
on Is
land
sT
KT
okel
auT
OT
onga
IVT
uval
u
VU
Van
uatu
VV
FW
allis
and
Fut
una
VV
KW
ake
WS
Wes
tern
Sam
oa
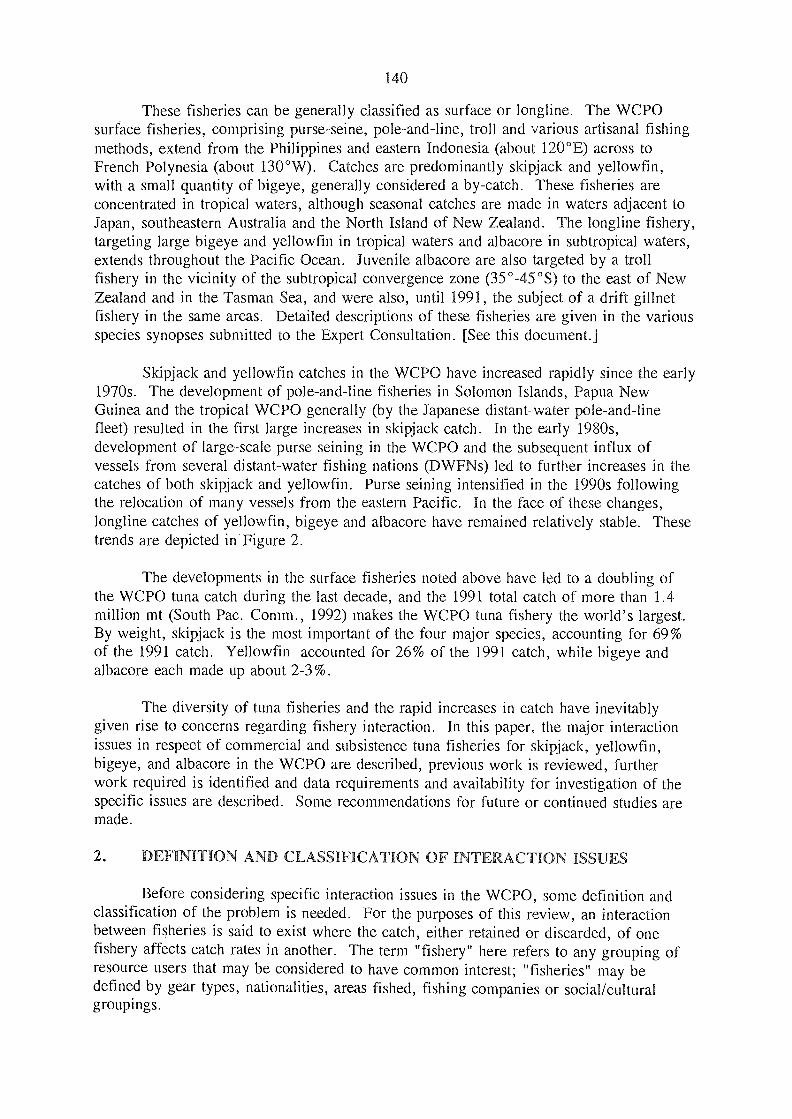
140
These fisheries can be generally classified as surface or longline. The WCPOsurface fisheries, comprising purse-seine, pole-and-line, troll and various artisanal fishingmethods, extend from the Philippines and eastern Indonesia (about 120°E) across toFrench Polynesia (about 130°W). Catches are predominantly skipjack and yellowfin,with a small quantity of bigeye, generally considered a by-catch. These fisheries areconcentrated in tropical waters, although seasonal catches are made in waters adjacent toJapan, southeastern Australia and the North Island of New Zealand. The longline fishery,targeting large bigeye and yellowfin in tropical waters and albacore in subtropical waters,extends throughout the Pacific Ocean. Juvenile albacore are also targeted by a trollfishery in the vicinity of the subtropical convergence zone (35°-45°S) to the east of NewZealand and in the Tasman Sea, and were also, until 1991, the subject of a drift gillnetfishery in the same areas. Detailed descriptions of these fisheries are given in the variousspecies synopses submitted to the Expert Consultation. [See this document.]
Skipjack and yellowfin catches in the WCPO have increased rapidly since the early1970s. The development of pole-and-line fisheries in Solomon Islands, Papua NewGuinea and the tropical WCPO generally (by the Japanese distant-water pole-and-linefleet) resulted in the first large increases in skipjack catch. In the early 1980s,development of large-scale purse seining in the WCPO and the subsequent influx ofvessels from several distant-water fishing nations (DWFNs) led to further increases in thecatches of both skipjack and yellowfin. Purse seining intensified in the 1990s followingthe relocation of many vessels from the eastern Pacific. In the face of these changes,longline catches of yellowfin, bigeye and albacore have remained relatively stable. Thesetrends are depicted in Figure 2.
The developments in the surface fisheries noted above have led to a doubling ofthe WCPO tuna catch during the last decade, and the 1991 total catch of more than 1.4million mt (South Pac. Comm., 1992) makes the WCPO tuna fishery the world's largest.By weight, skipjack is the most important of the four major species, accounting for 69%of the 1991 catch. Yellowfin accounted for 26% of the 1991 catch, while bigeye andalbacore each made up about 2-3%.
The diversity of tuna fisheries and the rapid increases in catch have inevitablygiven rise to concerns regarding fishery interaction. In this paper, the major interactionissues in respect of commercial and subsistence tuna fisheries for skipjack, yellowfin,bigeye, and albacore in the WCPO are described, previous work is reviewed, furtherwork required is identified and data requirements and availability for investigation of thespecific issues are described. Some recommendations for future or continued studies aremade.
2. DEFINITION AND CLASSIFICATION OF INTERACTION ISSUES
Before considering specific interaction issues in the WCPO, some definition andclassification of the problem is needed. For the purposes of this review, an interactionbetween fisheries is said to exist where the catch, either retained or discarded, of onefishery affects catch rates in another. The term "fishery" here refers to any grouping ofresource users that may be considered to have common interest; "fisheries" may bedefined by gear types, nationalities, areas fished, fishing companies or social/culturalgroupings.
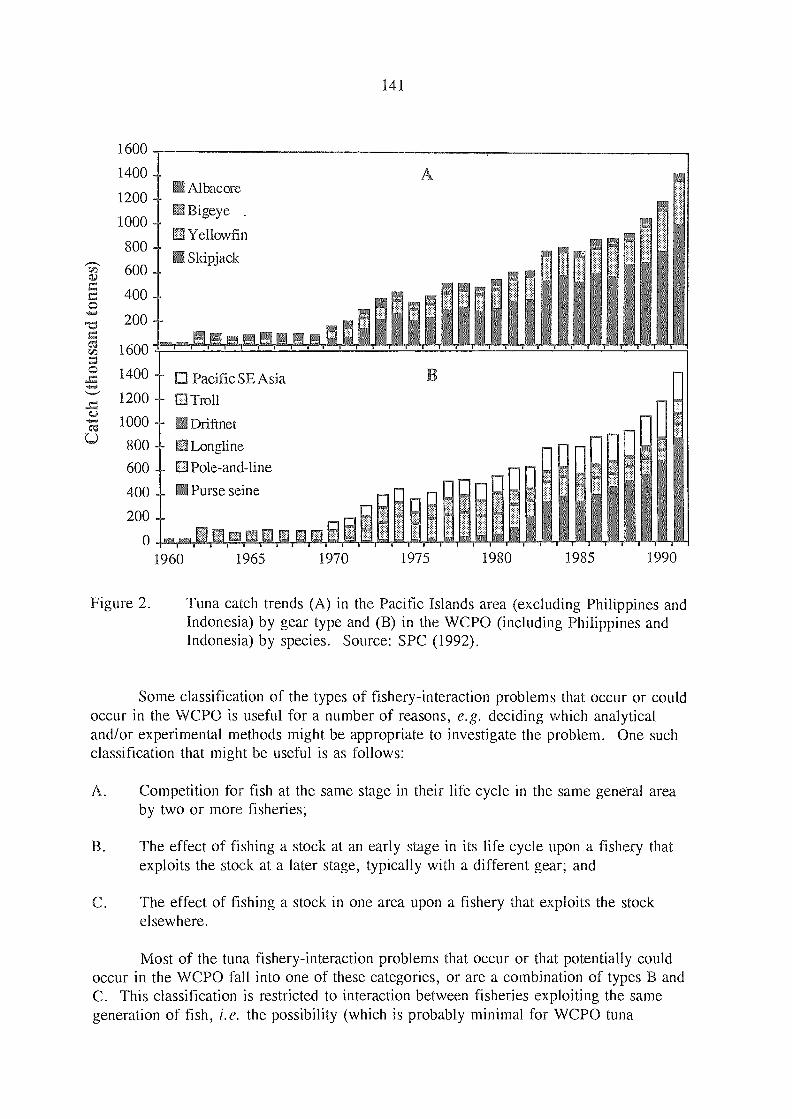
1600
1400
1200
1000
800
600
400
200
III Albacore
Bigeye
Yellowfin
Slcipjack
1600
1400 D Pacific SE Asia1200 E3 Troll
1000 1111 Driftnet
800 Longline
600 E3Pole-and-line
400 IN Purse seine
200
O '
1960 1965 1970
141
1975 1980 985 1990
Figure 2. Tuna catch trends (A) in the Pacific Islands area (excluding Philippines andIndonesia) by gear type and (B) in the WCPO (including Philippines andIndonesia) by species. Source: SPC (1992).
Some classification of the types of fishery-interaction problems that occur or couldoccur in the WCPO is useful for a number of reasons, e.g. deciding which analyticaland/or experimental methods might be appropriate to investigate the problem. One suchclassification that might be useful is as follows:
Competition for fish at the same stage in their life cycle in the same general areaby two or more fisheries;
The effect of fishing a stock at an early stage in its life cycle upon a fishery thatexploits the stock at a later stage, typically with a different gear; and
The effect of fishing a stock in one area upon a fishery that exploits the stockelsewhere.
Most of the tuna fishery-interaction problems that occur or that potentially couldoccur in the WCPO fall into one of these categories, or are a combination of types B andC. This classification is restricted to interaction between fisheries exploiting the samegeneration of fish, i.e. the possibility (which is probably minimal for WCPO tuna
142
fisheries at current levels of exploitation) of interaction resulting from the effects of heavyexploitation of the spawning stock on subsequent recruitment is ignored. Also, thepossible effects of fisheries on interactions among tuna species, e.g. via trophicrelationships, are not considered.
SPECIFIC ISSUES
Tuna fishery-interaction issues that are of current concern among Pacific Islandcountries, Southeast Asian countries (Philippines and eastern Indonesia) and DWFNs aresummarised in Table 1. Each of these issues is reviewed with an assessment of thecurrent state of interaction, further studies required and data requirements and availabilityfor such studies.
3.1 Large-Scale Interaction Between Pole-and-Line and Purse-Seine Fisheries
As the distant-water purse-seine fishery began to develop in the early 1980s, themajor concern among fisheries administrators in the Pacific Islands region was initiallythe effect that this fishery may have on catch rates of skipjack by the large-scalepole-and-line fishery. (At this time, a major benefit from tuna resources to many PacificIsland countries was access fees paid by the Japanese long-range, pole-and-line fleet.)Then, the Japanese pole-and-line fishery ranged from 130°E to 160°W in tropical waters(Tanaka, 1989) with annual catches of 100,000-150,000 mt (South Pac. Comm., 1992).By contrast, the developing purse-seine fishery was much more concentrated, at least forJapanese vessels, in the area 140°-165°E (Tanaka, 1989), with some indications ofdeliberate separation of the two fleets in time and space.
At the same time as the purse-seine fishery was developing, catches by theJapanese long-range, pole-and-line fishery began to decline because of effort reduction.That, along with the emergence of other important interaction issues, has resulted in somelessening in the concern by Pacific Island countries regarding interaction between thelarge-scale, purse-seine and pole-and-line fisheries.
3.1.1 Current assessment
No specific analyses of this interaction problem have been undertaken, butobservations of the time series of Japanese pole-and-line catch per unit effort (CPUE)would suggest that there has been little, if any, effect of catches by purse seiners onpole-and-line CPUE (Figure 3). However, the increasing trend evident in CPUE may bedue to increased efficacy of the Japanese pole-and-line fleet, which could also mask anynegative impact the purse-seine fishery may be having.
3.1.2 Further work and data required
Because of the differences in spatial distribution of the fisheries alluded to ea.rlier,a more thorough investigation of this problem would ideally incorporate the movementdynamics of skipjacic. The development of such a model is currently underway andshows considerable promise (Sibert and Fournier, 1993). The model describes thedynamics of tagged tuna, explicitly incorporating a generalised moveinent sub-model,
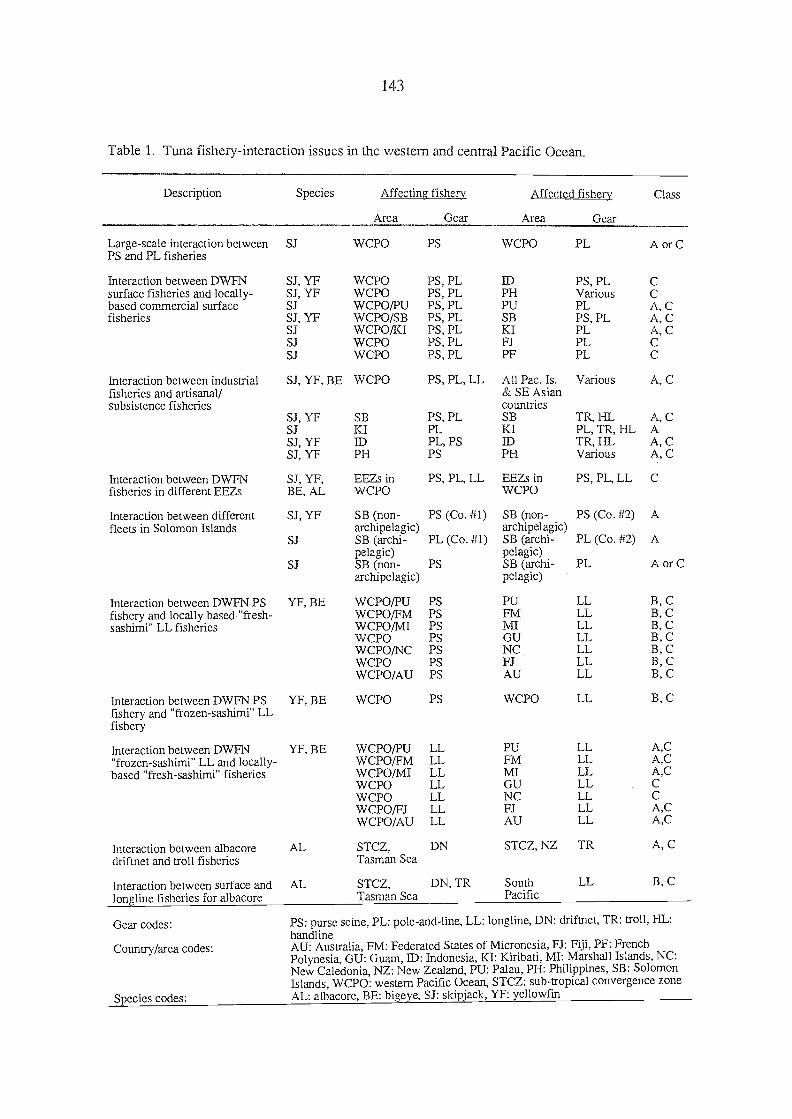
Table 1. Tuna fishery-interaction issues in the western and central Pacific Ocean.
Description
Large-scale interaction betweenPS and PL fisheries
Interaction between DWFNsurface fisheries and locally-based commercial surfacefisheries
Interaction between industrialfisheries and artisanal/subsistence fisheries
Interaction between DWFNfisheries in different EEZs
Interaction between differentfleets in Solomon Islands
Interaction between DWFN PSfishery and locally based "fresh-sashimi" LL fisheries
Interaction between DWFN PSfishery and "ftozen-sashimi" LLfishery
Interaction between DWFN"frozen-sashimi" LL and locally-based "fresh-sashimi" fisheries
Interaction between albacoredriftnet and troll fisheries
Interaction between surface andlonglinc fisheries for albacore
Gear codes:
Country/area codes:
Species codes:
143
PS: purse seine, PL: pole-and-line, LL: longline, DN: driftnet, TR: troll, HL:handl meAU: Australia, FM: Federated States of Micronesia, FJ: Fiji, PF: FrenchPolynesia, GU: Guam, ID: Indonesia, KI: Kiribati, MI: Marshall Islands, NC:New Caledonia, NZ: New Zealand, PU: Palau, PH: Philippines, SB: SolomonIslands, WCPO: western Pacific Ocean, STCZ: sub-tropical convergence zoneAL: albacore, BE: bigeye, SJ: skipjack, YF: yellowfin
Species Aff. 'n fi h Affected fishery Class
Area Gear Area Gear
SJ WCPO PS WCPO PL A or C
SJ, YF WCPO PS, PL ID PS, PLSJ, YF WCPO PS, PL PH VariousSJ WCPO/PU PS, PL PU PL A, CSJ, YF WCPO/SB PS, PL SB PS, PL A, CSJ WCPO/KI PS, PL KI PL A, CSJ WCPO PS, PL FJ PLSJ WCPO PS, PL PF PL
SJ, YF, BE WCPO PS, PL, LL All Pac. Is. Various A, C& SE Asiancountries
SJ, YF SB PS, PL SB TR, HL A, CSJ KI PL KI PL, TR, HL ASJ, YF ID PL, PS ID TR, HL A, CSJ, YF PH PS PH Various A, C
SJ, YF,BE, AL
EEZs inWCPO
PS, PL, LL EEZs inWCPO
PS, PL, LL
SJ, YF SB (non-archipelagic)
PS (Co. #1) SB (non-archipelagic)
PS (Co. #2) A
SJ SB (archi-pelagic)
PL (Co. #1) SB (archi-pelagic)
PL (Co. #2) A
SJ SB (non-archipelagic)
PS SB (archi-pelagic)
PL A or C
YF, BE WCPO/PU PS PU LL B, CWCPO/FM PS FM LL B, CWCPO/MI PS MI LL B, CWCPO PS GU LL B, CWCPO/NC PS NC LL B, CWCPO PS FJ LL B, CWCPO/AU PS AU LL B, C
YF, BE WCPO PS WCPO LL B, C
YF, BE WCPO/PU LL PU LL A,CWCPO/FM LL FM LL A,CWCPO/MI LL MI LL A,CWCPO LL GU LLWCPO LL NC LLWCPO/FJ LL FJ LL A,CWCPO/AU LL AU LL A,C
AL STCZ,Tasman Sea
DN STCZ, NZ TR A, C
AL STCZ,Tasman Sea
DN, TR SouthPacific
LL B, C
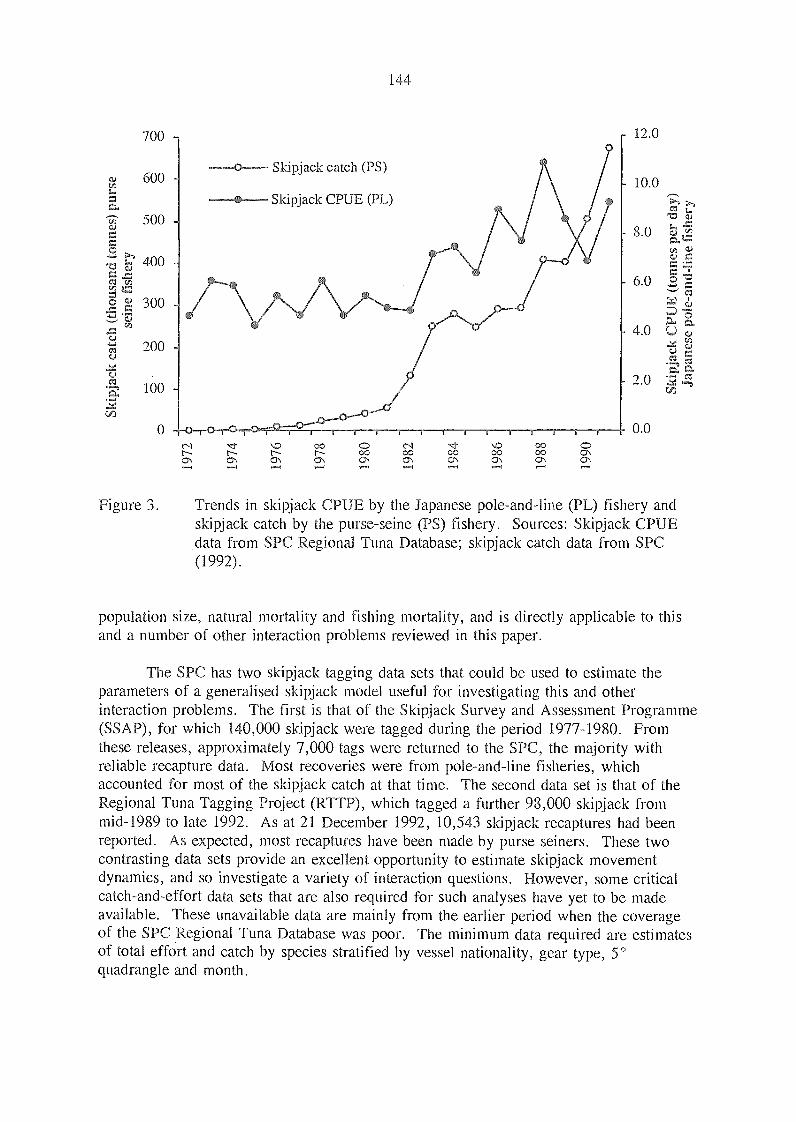
Q.) 600
500
400-oe
300
200.t4
100
(ID
700
Skipjack catch (PS)
Skipjack CPUE (PL)
144
12.0
10.0
0.0
Figure 3. Trends in skipjack CPUE by the Japanese pole-and-line (PL) fishery andskipjack catch by the purse-seine (PS) fishery. Sources: Skipjack CPUEdata from SPC Regional Tuna Database; skipjack catch data from SPC(1992).
population size, natural mortality and fishing mortality, and is directly applicable to thisand a number of other interaction problems reviewed in this paper.
The SPC has two skipjack tagging data sets that could be used to estimate theparameters of a generalised slcipjack model useful for investigating this and otherinteraction problems. The first is that of the Skipjack Survey and Assessment Programme(SSAP), for which 140,000 skipjack were tagged during the period 1977-1980. Fromthese releases, approximately 7,000 tags were returned to the SPC, the majority withreliable recapture data. Most re,coveries were from pole-and-line fisheries, whichaccounted for most of the skipjack catch at that time. The second data set is that of theRegional Tuna Tagging Project (RTTP), which tagged a further 98,000 skipjack frommid-1989 to late 1992. As at 21 December 1992, 10,543 skipjack recaptures had beenreported. As expectexl, most recaptures have been made by purse seiners. These twocontrasting data sets provide an excellent opportunity to estimate skipjack movementdynamics, and so investigate a variety of interaction questions. However, some criticalcatch-and-effort data sets that are also required for such analyses have yet to be madeavailable. These unavailable data are mainly from the earlier period when the coverageof the SPC Regional Tuna Database was poor. The minimum data required are estimatesof total effort and catch by species stratified by vessel nationality, gear type, 5°quadrangle and month.
71- CC
ca.00r-
CCcr.
00\
00 00
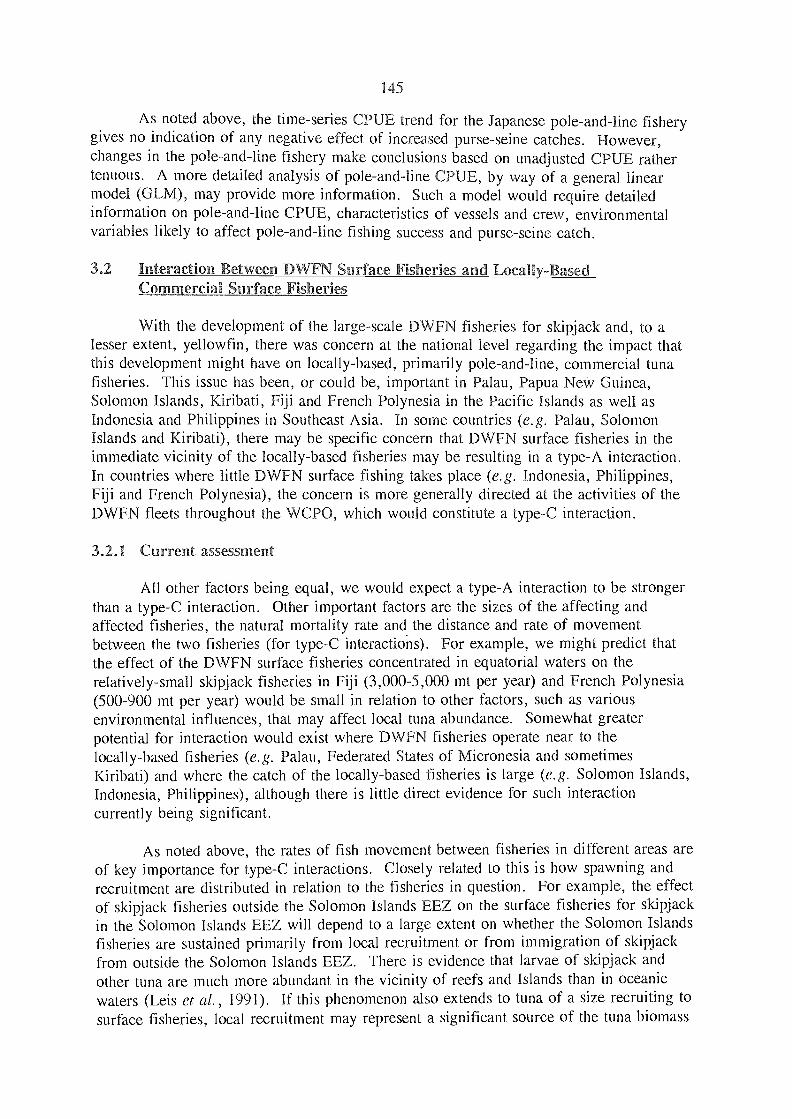
a
145
As noted above, the time-series CPUE trend for the Japanese pole-and-line fisherygives no indication of any negative effe,ct of increased purse-seine catches. However,changes in the pole-and-line fishery make conclusions based on unadjusted CPUE rathertenuous. A more detailed analysis of pole-and-line CPUE, by way of a general linearmodel (GLM), may provide more information. Such a model would require detailedinformation on pole-and-line CPUE, characteristics of vessels and crew, environmentalvariables likely to affect pole-and-line fishing success and purse-seine catch.
3.2 Interaction Between DWFN Surface Fishe ies and LocaCommercial Surface Fisheries
With the development of the large-scale DWFN fisheries for skipjack and, to alesser extent, yellowfin, there was concern at the national level regarding the impact thatthis development might have on locally-based, primarily pole-and-line, commercial tunafisheries. This issue has been, or could be, important in Palau, Papua New Guinea,Solomon Islands, Kiribati, Fiji and French Polynesia in the Pacific Islands as well asIndonesia and Philippines in Southeast Asia. In some countries (e.g. Palau, SolomonIslands and Kiribati), there may be specific concern that DWFN surface fisheries in theimmediate vicinity of the locally-based fisheries may be resulting in a type-A interaction.In countries where little DWFN surface fishing takes place (e.g. Indonesia, Philippines,Fiji and French Polynesia), the concern is more generally directe,d at the activities of theDWFN fleets throughout the WCPO, which would constitute a type-C interaction.
3.2.1 Current assessment
All other factors being equal, we would expect a type-A interaction to be strongerthan a type-C interaction. Other important factors are the sizes of the affecting andaffected fisheries, the natural mortality rate and the distance and rate of movementbetween the two fisheries (for type-C interactiohs). For example, we might predict thatthe effect of the DWFN surface fisheries concentrated in equatorial waters on therelatively-small skipjack fisheries in Fiji (3,000-5,000 mt per yeas) and French Polynesia(500-900 mt per year) would be small in relation to other factors, such as variousenvironmental influences, that may affect local tuna abundance. Somewhat greaterpotential for interaction would exist where DWFN fisheries operate near to thelocally-based fisheries (e.g. Palau, Federated States of Micronesia and sometimesKiribati) and where the catch of the locally-based fisheries is large (e.g. Solomon Islands,Indonesia, Philippines), although there is little direct evidence for such interactioncurrently being significant.
As noted above, the rates of fish movement between fisheries in different areas areof key importance for type-C interactions. Closely related to this is how spawning andrecruitment are distributed in relation to the fisheries in question. For example, the effe,ctof skipjack fisheries outside the Solomon Islands EEZ on the surface fisheries for skipjackin the Solomon Islands EEZ will depend to a large extent on whether the Solomon Islandsfisheries are sustained primarily from local recruitment or from immigration of skipjackfrom outside the Solomon Islands EEZ. There is evidence that larvae of skipjack andother tuna are much more abundant in the vicinity of reefs and Islands than in oceanicwaters (Leis et al., 1991). If this phenomenon also extends to tuna of a size recruiting tosurface fisheries, local recruitment may represent a significant source of the tuna biomass
sed
146
available to some locally-based surface fisheries. This would be a double-edged swordfor the larger locally-based fisheries. While large local recruitment would reduce thepotential for negative interaction with outside fisheries, there would be a grea.ter chancethat the activities of the locally-based fisheries themselves may affect the population; thene,ed for local regulation of catches may be greater under these circumstances.
3.2.2 Further work and data required
No detailed analyses of these types of interaction questions have yet been undertaken.The assessment of type-C interaction problems involving relatively large locally-basedfisheries such as those of Solomon Islands could be undertaken by estimating explicitmovement rates and other parameters of a two-fishery tag-attrition model (Sibert, 1984)fitted to the RTIP tagging data. For a complete picture, the question of local recruitmentwould also ne,ed to be addressed. For similar problems involving small locally-basedfisheries, sufficient numbers of tag recoveries in the locally-based fishery are unlikely tobe generated from a regional tagging project and obtaining of answers would thereforerequire some extrapolation from general movement characteristics estimated as describedin section 3.2.1. If type-A interactions are identified (i.e. if the assumption of ahomogeneous "stock" relative to the two fisheries is re,asonable), simpler methods, suchas a multi-gear, yield-per-recruit model, can be employed. The data required toundertake these types of analyses will be available on completion of the RTTP.
3.3 Interaction Between Industrial Fisheries and Artisanal/Subsistence Fisheries
In most Pacific Island and Southeast Asian countries, small-scale artisanal orsubsistence fishing is important for the economic, social and nutritional well-being of alarge percentage of the population. Therefore, questions regarding the possible effects ofindustrial fisheries, both DWFN and locally-based, on artisanal/subsistence fisheries arefrequently raised.
3.3.1 Current assessment
Specific analyses have not been undertaken, due in part to the absence of reliablecatch statistics for artisanal/subsistence fisheries in many countries. Because thesefisheries in the Pacific Islands are relatively small and of restricted range, it is likely thatany interaction with large, industrial fisheries would be minor in comparison with catchrate variability associated with environmentally-driven variation in local tuna availabilityand catchability. The exception to this might be where an industrial fishery operates inthe same area as the artisanal/subsistence fishery, e.g. Solomon Islands and Kiribati. InKiribati, artisanal skiff fishers may, in fact, frequently benefit from fishing near to thelocally-based, pole-and-line vessels by fishing schools located and chummed to the surfaceby the larger vessels; in this case, the interaction may be positive. However, preliminarydata from the RITP would suggest that the effect on artisanal/subsistence fisheries isslight. As of December 1992, only 34 of approximately 10,000 skipjack tag returns hadbeen recovered by artisanal/subsistence fishers in the Pacific Islands. If the overallexploitation rate of skipjack is moderate, as suggested by the interim skipjack recoveryrate of approximately 11%, the low number of recoveries by artisanal/subsistence fishersis indicative of the small effect of the industrial fisheries on their catch rates. Thissituation is in contrast with that in the Philippines, where the artisanal/subsistence
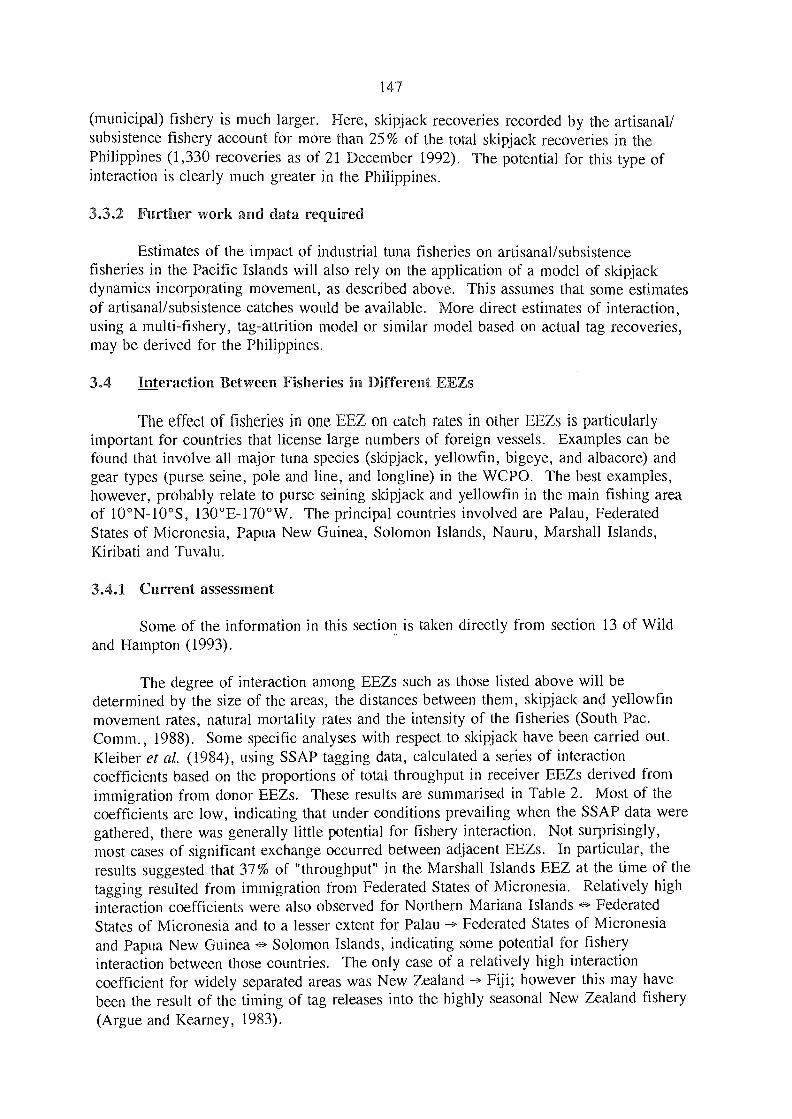
147
(municipal) fishery is much larger. Here, skipjack recoveries recorded by the artisanal/subsistence fishery account for more than 25% of the total skipjack recoveries in thePhilippines (1,330 recoveries as of 21 December 1992). The potential for this type ofinteraction is clearly much greater in the Philippines.
3.3.2 Further work and data required
Estimates of the impact of industrial tuna fisheries on artisanal/subsistencefisheries in the Pacific Islands will also rely on the application of a model of skipjackdynamics incorporating movement, as described above. This assumes that some estimatesof artisanal/subsistence catches would be available. More direct estimates of interaction,using a multi-fishery, tag-attrition model or similar model based on actual tag recoveries,may be derived for the Philippines.
3.4 Interaction Between Fisheries in Different EEZs
The effect of fisheries in one EEZ on catch rates in other EEZs is particularlyimportant for countries that license large numbers of foreign vessels. Examples can befound that involve all major tuna species (skipjack, yellowfin, bigeye, and albacore) andgear types (purse seine, pole and line, and longline) in the WCPO. The best examples,however, probably relate to purse seining skipjack and yellowfin in the main fishing areaof 10°N-10°S, 130°E-170°W. The principal countries involved are Palau, FederatedStates of Micronesia, Papua New Guinea, Solomon Islands, Nauru, Marshall Islands,Kiribati and Tuvalu.
3.4.1 Current assessment
Some of the information in this section is taken directly from section 13 of Wildand Hampton (1993).
The degree of interaction among EEZs such as those listed above will bedetermined by the size of the areas, the distances between them, skipjack and yellowfinmovement rates, natural mortality rates and the intensity of the fisheries (South Pac.Comm., 1988). Some specific analyses with respect to skipjack have been carried out.Kleiber et al. (1984), using SSAP tagging data, calculated a series of interactioncoefficients based on the proportions of total throughput in receiver EEZs derived fromimmigration from donor EEZs. These results are summarised in Table 2. Most of thecoefficients are low, indicating that under conditions prevailing when the SSAP data weregathered, there was generally little potential for fishery interaction. Not surprisingly,most cases of significant exchange occurred between adjacent EEZs. In particular, theresults suggested that 37% of "throughput" in the Marshall Islands EEZ at the time of thetagging resulted from immigration from Federated States of Micronesia. Relatively highinteraction coefficients were also observed for Northern Mariana Islands <4. FederatedStates of Micronesia and to a lesser extent for Palau > Federated States of Micronesiaand Papua New Guinea <-> Solomon Islands, indicating some potential for fisheryinteraction between those countries. The only case of a relatively high interactioncoefficient for widely separated areas was New Zealand > Fiji; however this may havebeen the result of the timing of tag rele.ases into the highly seasonal New Zealand fishery
(Argue and Kearney, 1983).
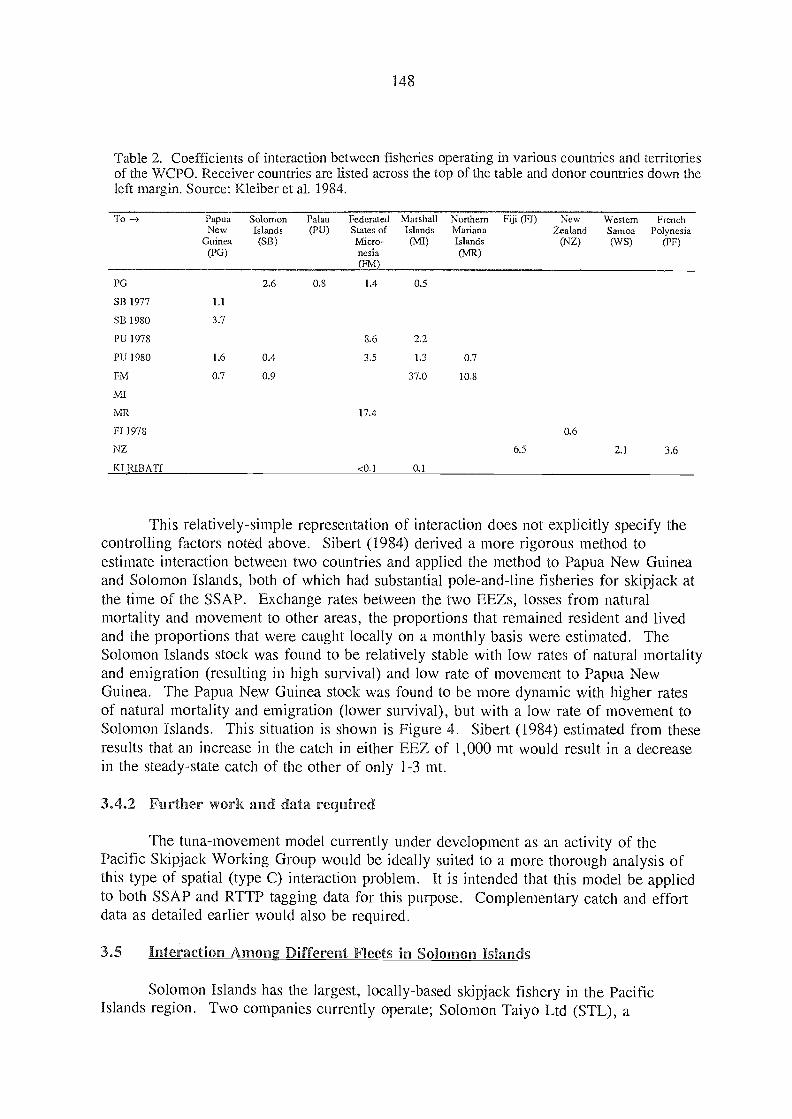
148
Table 2. Coefficients of interaction between fisheries operating in various countries and territoriesof the WCPO. Receiver countries are listed across the top of the table and donor countries down thcleft margin. Source: Kleiber et al. 1984.
This relatively-simple representation of interaction does not explicitly specify thecontrolling factors noted above. Sibert (1984) derived a more rigorous method toestimate interaction between two countries and applied the method to Papua New Guineaand Solomon Islands, both of which had substantial pole-and-line fisheries for skipjack atthe time of the SSAP. Exchange rates between the two EEZs, losses from naturalmortality and movement to other areas, the proportions that remained resident and livedand the proportions that were caught locally on a monthly basis were estimated. TheSolomon Islands stock was found to be relatively stable with low rates of natural mortalityand emigration (resulting in high survival) and low rate of movement to Papua NewGuinea. The Papua New Guinea stock was found to be more dynamic with higher ratesof natural mortality and emigration (lower survival), but with a low rate of movement toSolomon Islands. This situation is shown is Figure 4. Sibert (1984) estimated from theseresults that an increase in the catch in either EEZ of 1,000 mt would result in a decreasein the steady-state catch of the other of only 1-3 mt.
3.4.2 Further work and data required
The tuna-movement model currently under development as an activity of thePacific Skipjack Working Group would be ideally suited to a more thorough analysis ofthis type of spatial (type C) interaction problem. It is intended that this model be appliedto both SSAP and RTTP tagging data for this purpose. Complementary catch and effortdata as detailed earlier would also be required.
3.5 Interaction A on Different Fle ts in Solomon Islands
Solomon Islands has the largest, locally-based skipjack fishery in the PacificIslands region. Two companies currently operate; Solomon Taiyo Ltd (STL), a
To --) PapuaNew
Guinea(PG)
SolomonIslands
(SB)
Palau(PU)
FederatedStates ofMicro-nesia(FM)
MarshallIslands(MI)
NorthemMarianaIslands(MR)
Fiji (FI) NewZealand
(NZ)
WesternSamoa(WS)
FrenchPolynesia
(PF)
PG 2.6 0.8 1.4 0.5
SB 1977 1.1
SB 1980 3.7
PU 1978 8.6 2.2
PU 1980 1.6 0.4 3.5 1.3 0.7
FM 0.7 0.9 37.0 10.8
MI
MR 17.4
FJ 1978 0.6
NZ 6.5 2.1 3.6
<0.1 0.1
149
Papua New Guinea Solomon Islands
S
D
MC
Figure 4. Relative proportion of tagged skipjack released in Papua New Guinea andSolomon Islands that survive without migrating (S), disappear for unknownreasons (D), migrate to the other country (M), and are caught in the fisheryof release (C) each month. Source: Sibert (1984).
joint-venture company between Taiyo Fisheries (Japan) and the Solomon IslandsGovernment, and National Fisheries Development (NFD), formerly a Government-ownedenterprise but now owned by British Colombia Packers and operated by its subsidiary,Mar Fishing Company. A third company, Makirabelle, a joint-venture between MakiraProvince and Frabelle Fishing Corporation of the Philippines will soon begin operations.STL operates a fleet of 20 pole-and-line vessels, predominantly 59-GRT, as well as onegroup-seine operation. The NFD consists of a fleet of ten pole-and-line vessels (59-GRT)and one single seiner. Makirabelle will operate two group seiners. In general,pole-and-line vessels have access to all waters in the EEZ out side of three miles, whereaspurse seiners, setting mainly on fish aggregation devices (FADs), are excluded fromwaters inside the main group archipelagic (MGA) baseline. The Solomon IslandsGovernment has allocated total tuna quotas of 47,500 mt, 37,500 mt and 35,000 mt, toSTL, NFD and Makirabelle, respectively. For STL and NFD, catches inside the MGAby their pole-and-line fleets are restricted by quotas of 30,000 mt and 20,000 mt,respectively. In 1990, approximately 30,000 mt of tuna (80% skipjack) were caught bylocally-based fleets in Solomon Islands. Of the skipjack catch, about 80% was caught bythe pole-and-line fleet and 20% by the purse-seine fleet. Additionally, Japanesedistant-water, pole-and-line vessels caught about 6,000 mt of skipjack in non-archipelagicwaters of the Solomon Islands EEZ in 1990, while Japanese longliners caught about 3,500mt, mostly yellowfin.
3.5.1 Current assessment
This diversity of interests in the Solomon Islands fishery has provided considerablescope for interaction issues to develop. The recent allocation of quota to the thirdcompany (Makirabelle) caused concerns in the other two companies (STL and NFD) thattheir catch rates would be affected. Also, STL's proposals to introduce an additionalgroup-seine operation have to date been refused by the Government because of fears thatpole-and-line catch rates might be reduced as a result.
150
In response to these types of interaction question and to questions regarding theoverall potential productivity of the skipjack resource in Solomon Islands, the SPC andSolomon Islands Ministry of Natural Resources undertook a tagging programme inSolomon Islands during 1989-1990. In all, six tagging cruises were undertaken over a 12month period, tagging more than 8,000 skipjack. From these, more than 1,000recoveries have been recorded, and detailed analyses of the data are now in progress. Amodel incorporating diffusive movement modifie,d by the presence of FADs in variousareas has recently been developed, and preliminary results have been reported at theExpert Consultation.
3.5.2 Further work and data required
The need for further work on interaction problems in the Solomon Islands will bedetermined when the results of the above study have been fully analysed. Quality taggingdata are available, as outlined above, as well as complete catch-and-effort data andsize-composition samples from the fisheries concerned. The case of Solomon Islandsprovides an excellent example of the analysis of specific interaction problems through adirected research project and a well documented fishery.
3.6 Interaction Between the DWFN Purse-Seine Fishery and Longline Fishery
The impact of the DWFN purse-seine fishery, which catches, in addition toskipjack, large quantities of yellowfin over a broad size range, on the various longlinefisheries of the region has probably been the foremost interaction issue during the pastfive years. Concerns have been expressed that the large catches of mainly 1 year old and2 year old yellowfin by purse seiners may ultimately have a "downstream" negative effecton longline catch rates of predominantly 2, 3, and 4 year old yellowfin. Longlinefisheries provide substantial income for many Pacific Island countries, both throughlicensed fishing by DWFNs and, recently in several countries, the development oftranshipment bases for fleets of small, "fresh-sashimi" longliners that air-freight theirproduct to sashimi markets in Japan and Honolulu. The consequences of any interactionof this type are greater than for the skipjack-interaction issues reviewed elsewhere in thispaper because the market value of longline-caught yellowfin is typically several timesgreater than that of purse-seine-caught skipjack and yellowfin.
In the WCP0, the purse-seine fishery is confined largely to the are,a 10°N-10°S,130°E-170°W. The longline fishery includes this area, but also extends further to theeast, north and south. Interaction between the two fisheries would therefore be primarilya type-B interaction, with some spatial (type-C) characteristics. The concerns regardingthe possibility of a purse-seine-longline interaction were largely responsible for theinitiation of the RTTP, which has gathered information on yellowfin dynamics though atargeted tagging programme. It is worth noting that a similar, if lesser, problem couldpotentially exist with bigeye, also a target species of the longline fishery and caughtincidentally in generally unknown numbers at small size by purse seiners.
3.6.1 Current assessment
Various analyses of catch-and-effort data, on both large and local scales, havebeen undertaken (Suzuki 1988, 1993). For various reasons, none of these studies has
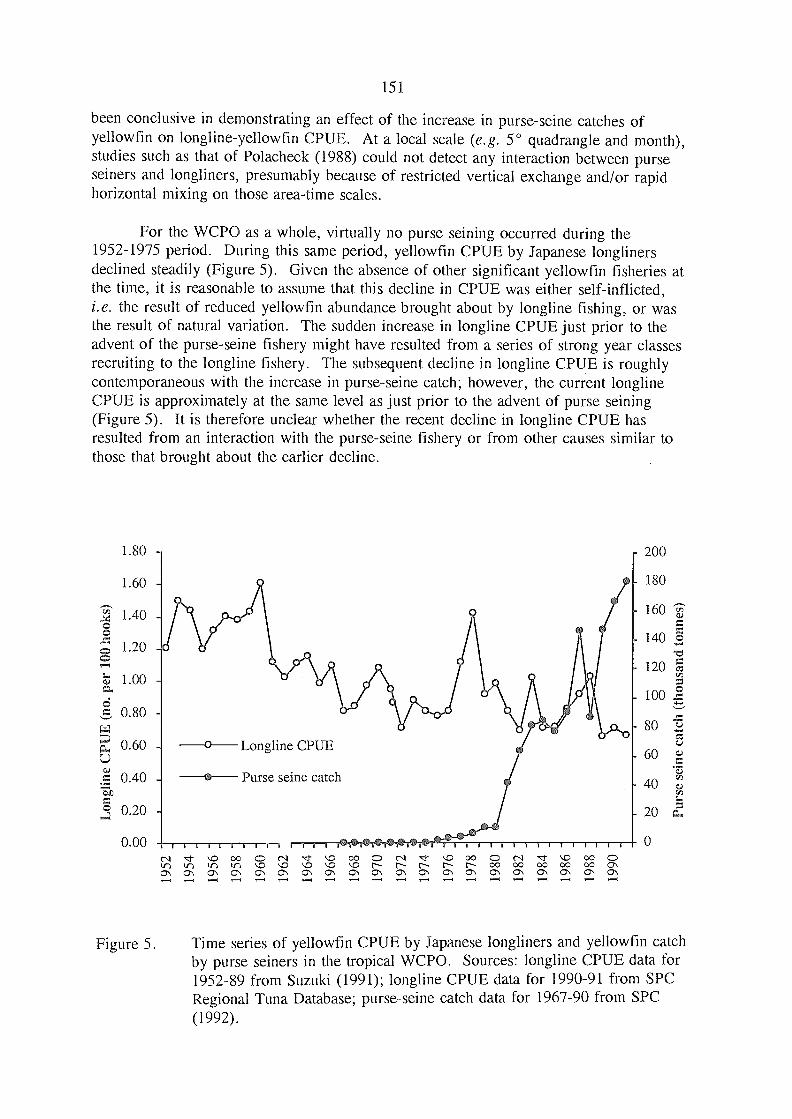
1.80
1.60
1.40o
1.20-a6c 0.80 -
LT.7
E 0.60
C 0.40
0.20
0.00
Longline CPUE
to-- Purse seine catch
151
been conclusive in demonstrating an effect of the increase in purse-seine catches ofyellowfin on longline-yellowfin CPUE. At a local scale (e.g. 5° quadrangle and month),studies such as that of Polacheck (1988) could not detect any interaction between purseseiners and longliners, presumably because of restricted vertical exchange and/or rapidhorizontal mixing on those area-time scales.
For the WCPO as a whole, virtually no purse seining occurred during the1952-1975 period. During this same period, yellowfin CPUE by Japanese longlinersdeclined steadily (Figure 5). Given the absence of other significant yellowfin fisheries atthe time, it is reasonable to assume that this decline in CPUE was either self-inflicted,i.e. the result of reduced yellowfin abundance brought about by longline fishing, or wasthe result of natural variation. The sudden increase in longline CPUE just prior to theadvent of the purse-seine fishery might have resulted from a series of strong year classesrecruiting to the longline fishery. The subsequent decline in longline CPUE is roughlycontemporaneous with the increase in purse-seine catch; however, the current longlineCPUE is approximately at the same level as just prior to the advent of purse seining(Figure 5). It is therefore unclear whether the recent decline in longline CPUE hasresulted from an interaction with the purse-seine fishery or from other causes similar tothose that brought about the earlier decline.
*
'CrCC C) rq 71- <31, 00 CD cNI 12, 00 CD c-.1 -71- co C;)ir) tr, \C) .0 r-- r-- 00 00 00 00 00 01
01 01 CT C\ \ C7, ON CrN \ 0 C\ 0 \ 0\ \ \r- -- e 1-4 I. 1-1 1.-1 1-1
200
180
160
- 140
120
- 100
- 80
- 60
- 40
- 20
o
Figure 5. Time series of yellowfin CPUE by Japanese longliners and yellowfin catchby purse seiners in the tropical WCPO. Sources: longline CPUE data for1952-89 from Suzuki (1991); longline CPUE data for 1990-91 from SPCRegional Tuna Database; purse-seine catch data for 1967-90 from SPC(1992).
I 111111'11111i
3.6.2 Further work and data required
Quantification of the purse-seine-longline interaction will require the developmentof a yellowfin population model that incorporates age structure, movement and otherpopulation dynamics. The yellowfin-tagging results of the RTTP will contributesignificantly to the development of such a model; however detailed catch, effort andsize-composition statistics, stratified by area (5° quadrangle), time (month), gear type andfishing method would be re,quired. Some of these data are available to the SPC, althoughthe assistance of DWFNs will be required to fill gaps in data coverage.
At this point it is worth noting that most tuna tagging experiments, where taggedfish have been released into a surface fishery with the expectation of recaptures firstly inthe surface fishery and, after a period of time, in the longline fishery, have almostinvariably resulted in fewer longline recoveries than expected. This has occurred withyellowfin-tagging experiments in the eastern Pacific (Lenarz and Zweifel, 1979) andAtlantic Oceans (Fonteneau, 1986), with southern bluefin tagging in the Pacific, Southernand Indian Oceans (Hampton, 1989) and may well occur in the present RTTP in theWCPO. As at 21 December 1992, only ten longline recoveries of RTTP-taggedyellowfin had been reported to the SPC, but there had been more than 100 recoveries byother gear types, mostly purse-seine, of a size (>100 cm) normally considered vulnerableto longlining. We have yet to determine if the number of longline recoveries is indee,dless than expected, taking into account the size and geographical distribution of yellowfincatches in relation to tag releases. If there is a discrepancy, there are several possibleexplanations. First, there may be a tag-reporting problem with longline-caught yellowfinthat is not apparent with purse-seine-caught yellowfin. As longline-caught tuna arehandled individually, as opposed to the bulk-catch-handling techniques of purse seiners,detection of tagged tuna should be easier on longliners. Therefore, if non-reporting is thecause of low longline recoveries, it must be a deliberate and common practice of mostfleets. However, there are other possible explanations. The sample of fish originallytagged may be representative of yellowfin available to the purse-seine fishery, but not ofthose that ultimately become available to the longline fishery. In other words, at leastsome of the fish vulnerable to longlining may never have been available to the purse-seinefishery. This would create a dilution effect, and would imply a larger that expectedpopulation available to longlining. Also, in addition to the above, the population ofwhich the tagged fish are representative might only be partially recruited to the longlinefishery. In other words, there might be some mechanism that restricts exchange betweensurface and sub-surface populations. Unfortunately, conventional tagging experiments donot provide sufficient information to determine what such a mechanism might be.Tagging of longline-caught fish, in addition to surface-caught fish, may clarify thismatter, especially if archival tags, which can store a digital record of the tagged tuna'shorizontal and vertical position with time, were used.
3.7 Interaction Between DWFN Longline Fishery and Locally-Based"Fresh-Sashimi" Longline Fisheries
Interaction between the large-scale DWFN longline fleet of freezer vessels andvarious locally-based, "fresh-sashimi" longline fleets targeting yellowfin and bigeye maybecome an important issue for countries in which the latter fleets are based. In somecountries, the locally-based fleets are comprised of foreign-owned vessels, e.g. Palau,
152

Longline Fisheries
Interaction among drift gillnet, troll and longline fleets in the South Pacificalbacore fishery emerged as an important issue in 1988 with the rapid buildup of driftgillnet vessels in the Tasman Sea and sub-tropical convergence zone, areas also fished bytroll vessels. The issue of interaction between the troll and drift gillnet fisheries waslargely one of direct competition (type A), demonstrable by the occurrence of drift gillnetmarks on a considerable proportion (14% overall for the 1988-1989 season) oftroll-caught albacore during the height of the drift gillnet fishery. (The drift gillnet fisheryceased operations in the South Pacific in 1991.) Interaction between these surfacefisheries and the longline fishery, which generally operates further north on somewhatlarger albacore, is essentially a type-B/C interaction similar in many respects to theyellowfin purse-seine-longline interaction.
3.8.1 Current assessment
The interaction among South Pacific albacore fisheries is currently not wellunderstood because of a lack of information on basic population parameters, distributionof the stock and, until recently, catch, effort, and size composition from the fisheries.There have been reports of falling catch rates in the longline fishery, with the popularinterpretation being that this is a direct result of the large surface fishery catches of1988-1989 and 1989-1990. Confirmation or otherwise of this hypothesis awaits scientificevaluation of the data currently being collected.
153
Guam, Federated States of Micronesia and Marshall Islands, whereas in others, e.g. NewCaledonia and Australia, the locally-based fleets are locally owned. In Fiji, there arelocally-based fleets of locally-owned and Taiwanese-owned longliners. Several of thesecountries, e.g. Palau, Federated States of Micronesia, Marshall Islands and Australia,also license foreign-based longliners to fish in their EEZs. A variety of interactionquestions, falling into the local, type-A category or the spatial, type-C category, can thusarise. These are analogous to the purse-seine issues discussed above.
3.7.1 Current assessment
No analyses of interaction between longline fleets have been carried out to date.As in other cases, the type-A interactions are likely to emerge as the most important, andin some cases, steps may be necessary to avoid physical conflicts of deployed gear.
3.7.2 Further work and data required
The rates of movement of larger yellowfin and bigeye are unknown, so assessmentof the potential for type-C interactions are not yet possible. The difficulty in tagginglongline-caught tunas in large numbers will limit the practicality of this method ofassessment, although the R'TTP has had recent success in tagging large yellowfin andbigeye caught by handline. A tagging experiment using archival tags could providedetailed information on the movements of large yellowfin and bigeye and should bepursued if possible. Analyses of fishery statistics using GLM techniques may alsoproduce useful results.
3.8 Interaction Amon e South Pacific A bacore Dr' Gillnet, Troll, and

3.8.2 Further work and data required
Efforts to mount an effective tagging programme are currently being made, and ifsuccessful, will provide much of the basic biological information required. Also, theSouth Pacific Albacore Research group is assembling catch-and-effort andsize-composition databases to enable specific analyses to be carried out. These effortsshould be continued and encouraged. Some important methodological development is alsorequired, namely the development of an age-structured model based on size data fromwhich estimates of interaction can be derived. This work is currently being undertakenthrough SPC's Albacore Research Project.
4. RECO ENDATIONS FOR CONT ED OR FUTURE STUDIES
4.1 Fishery Data Compilation
Analysis of any of the interaction issues described above requires access to somelevel of fisheries statistics. The detail and scope of the statistics required depends on thetype of interaction problem and the method of analysis employed. For simple, type-Ainteraction problems, time series of total catch-and-effort data for the competing fisheriesmay be sufficient. For type-B problems, a time series of size composition data wouldalso be required. For the more complex, spatial, type-C problems, catch, effort andsize-composition data stratified by area for the interacting fisheries are required. Certainanalytical techniques may require much more detailed claim For example, the analysis oftype-A and B interaction problems using GLM techniques requires access to detailed dailycatch and effort logbook data, descriptions of vessel and crew characteristics andenvironmental data. SPC has begun to compile an aggregate,d database for the WCPOthat it hopes will be useful fOr the analysis of the majority of interaction and stockassessment problems. This database will have catch/effort and size compositioncomponents, with these variables being aggregated by vessel nationality, gear type,fishing method, 5° quadrangle and month. The database will attempt to represent theentire industrial tuna fishing activity in the WCPO, i.e. all estimates will be raised. Inthe first instance, the database will be compiled from daily catch-and-effort logbook dataprovided to SPC by its member countries, statistics published by DWFNs or otherwisemade available to the SPC for this purpose, estimates of total catch and effort for variousfleets and data currently available from various port sampling programmes. The SPCwould welcome the opportunity to collaborate with other organisations on this initiative.
While the proposed database would satisfy many of the fishery-data requirementsfor interaction studies, some more specific data may be required in some instances. Forexample, the thorough analysis of interaction problems involving artisanal/subsistencefisheries would require reliable catch, effort and ideally size-composition data on thosefisheries. In most cases, such data have not been collected from these fisheries, and theestablishment of data-collection systems would be a time-consuming and costly exercise.Some preliminary work with simulation models incorporating movement may be useful inindicating the desirability of collecting detailed data on artisanal/subsistence fisheries.
154

155
4.2 S atial Models of Ta ed-T na Dnamics
It is clear that most of the type-C interaction problems can only be ade,quatelyaddressed by spatially-disaggregated models of tagged-tuna dynamics that explicitlyinclude a generalised movement component. Efforts to develop such models, forapplication to the SSAP, RTTP, and other tagging data sets, are currently being made andshould be continued as a matter of priority. Ideally, such models should be structured toallow extrapolation to real fisheries situations, and in particular allow estimates of theeffect that an existing fishery has on another, both at its current level of exploitation andfor alternative levels and distributions of effort. Detailed catch/effort statistics from thefisheries involved are required for such studies.
4.3 Abundance Indices
The interpretation of various CPUE trends is confounded by improvements insearching and catching technology, variation in the spatial and temporal distributions ofthe fisheries and the effects of environmental variation. Without more detailed analysis,it is difficult to attribute variation in CPUE specifically to any of these factors or to theactivities of another fishery. The GLM techniques may provide useful information on therelative effects of different factors on CPUE. In particular, variouspole-and-line/purse-seine interactions could be investigated with models of pole-and-lineCPUE incorporating the effects of spatio-temporal distribution of fishing, pole-and-linevessel characteristics and fishing techniques, environmental variables affectingpole-and-line fishing success and purse-seine catch. Detailed, daily catch-and-effortlogbook data and information on affecting factors would be required for such analyses.
4.4 Availability of Yellowfin to Surface and Longline Gears
Investigation of the question of possible heterogeneity of the yellowfin populationwith respect to surface and longline gears is required. In the first instance, a thoroughanalysis of existing tagging data is needed to compare "expected" longline recaptures oftagged yellowfin, under a null hypothesis of equal availability, with reported recaptures.If differences in recapture rates are significant and cannot be attributed to non-reporting,field experiments may be required to determine the extent and the cause of theheterogeneity. One useful experiment might be to tag yellowfin in both surface andlongline fisheries on a small-area scale where both gear types are present. If sufficientreleases were made from both gear types, a direct comparison of the vulnerability ofsurface- and longline-caught releases might be possible. The use of archival tags in suchan experiment would add enormously to its value, and continued efforts should be madeto develop a cost-effective tag of this type.
4.5 Distribution of Recruitment
Investigation of the distribution of skipjack and yellowfin recruitment in relation tothe distribution of surface fisheries, both locally-based and DWFN, operating in theWCPO is required for a more thorough understanding of type-C interactions, particularly
in the case of oce,anic versus island-base,d fisheries. Tagging experiments may providesome insight into these matters in an indirect way, e.g. it might be possible to estimatethe proportion of recruitment in a particular area from particular sources outside that
156
area, as was done in Kleiber et al. (1984). Survey approaches and analyses ofsize-composition and catch-and-effort data stratified by area may provide the necessaryinformation.
4.6 South Pacific Albacore Research
The continuation of efforts to mount an effective tagging programme on SouthPacific albacore should be continued, and in particular experiments carried out todetermine the reasons for the very low recovery rates of tagging programmes to date.The development of an age/size-structured model from which estimates ofsurface-longline fishery interaction can be derived should also be undertaken.
5. REFERENCES CITED
Argue, A.W., and R.E. Kea.rney. 1983. An assessment of the skipjack and baitfishresources of New Zealand. Final Ctry.Rep.Skipjack Surv.Asse.vs.Programme,S.Pac. COMM. , (8):47 p.
Fonteneau, A. 1986. Surface versus longline tropical fisheries in the Atlantic Ocean -what interaction? Coll.Vol.Indo-PacTuna Dev.Mgt.Programme, Colombo, Sri Lanka,Working Doc.: 191-216.
Hampton, J. 1989. Population dynamics, stock assessment and fishery management ofthe southern bluefin tuna (Thunnus maccoyii). Ph.D. Thesis, University of New SouthWales, Australia, 273 p.
Kleiber, P., A.W. Argue, J.R. Sibert, and L.S. Hammond. 1984. A parameter forestimating potential interaction between fisheries for skipjack tuna (Katsuwonus pelami.v)in the western Pacific. Tech.Rep.Tuna Billfish Assess.Programme, S.Pac.Comm., (12):11 p.
Leis, J.M., T. Trnski, M. Harmelin-Vivien, J.-P. Renon, V. Dufour, M.K. El Moudni,and R. Gazlin. 1991. High concentrations of tuna larvae (Pisces: Scombridae) innear-reef waters of French Polynesia (Society and Tuamotu Islands). Bull.Mar.Sci.,48:150-8.
Lenarz, W.H., and J.R. Zweifel. 1979. A theoretical examination of some aspects ofthe interaction between longline and surface fisheries for yellowfin tuna, Thunnusalbacares. Fish.Bull.NOAA-NMFS, 76:807-25.
Polacheck, T. 1988. Yellowfin tuna, Thunnus albacores, catch rates in the westernPacific. Fish.Bull.NOAA-NMFS, 87:123-44.
Sibert, J.R. 1984. A two-fishery tag attrition model for the analysis of mortality,recruitment and fishery interaction. Tech.Rep.Tuna Biílfish Assess.Programme,S.Pac.Comm., (13):27 p.
Sibert, J. and D. Fournier. 1993. Evaluation of diffusion-advection equations for theestimation of movement patterns from tag recapture data. In Proceedings of the First
157
FAO Expert Consultation on Interactions of Pacific Tuna Fisheries, edited by R.S.Shomura, J. Majkowski, and S. Langi, 3-11 December 1991, Noumea, New Caledonia.[See this document.]
South Pacific Commission. 1988. Interaction among South Pacific skipjack fisheries.Paper presented at the South Pacific Commission Twentieth Regional Technical Meetingon Fisheries, 1-5 August 1988, Noumea, New Caledonia, Info. Pap. 4.
South Pacific Commission. 1992. Status of tuna fisheries in the SPC area during 1991,with revised annual catches since 1952. Tech.Rep.Tunu Bilfish Assess.Programme,S.Pac.Comm., 29:73 p.
Suzuki, Z. 1988. Study of interaction between longline and purse seine fisheries onyellowfin tuna, Thunnus albacares (Bonnaterre). Bull.Far Seas Fish.Res.Lab.,(25):73-144.
Suzuki, Z. 1993. A review of interaction between purse seine and longline on yellowfintuna, Thunnus albacares, in the western and central Pacific. In Proceedings of the FirstFAO Expert Consultation on Interactions of Pacific Tuna Fisheries, edited by R.S.Shomura, J. Majkowski, and S. Langi, 3-11 December 1991, Noumea, New Caledonia.[See this document.]
Tanaka, T. 1989. Shift of the fishing ground and features of shoals caught by purse seinefishery in the tropical seas of the western Pacific Ocean. Bull.Tohoku Reg.Fish.Res.Lab.,(51):75-88.
Wild, A., and J. Hampton. 1993. A review of the biology and fisheries for skipjacktuna, Katsuwonus pelamis, in the Pacific Ocea.n. In Proceedings of the First FAO ExpertConsultation on Interactions of Pacific Tuna Fisheries, edited by R.S. Shomura, J.Majkowski, and S. Langi, 3-11 December 1991, Noumea, New Caledonia. [See thisdocument.]
INTR DUCTION
158
A REVIEW OF INTERACTION ETWEEN nURSE SEINEATkID LONGLIE N YELLOWFIN (THU1VNUS ALPACARES)
IN THE WESTERN AND CENTRAL PACIFIC OCEAN
Ziro SuzukiNational Research Institute of Far Seas Fisheries
Shimizu, Japan
ABSTRACT
Interaction between purse-seine and longline fisheries for yellowfin tuna in thewestern and central Pacific Ocean was reviewed mainly through fisheries informationsuch as trends in catch, fishing effort, CPUE, and size of fish captured. In spite of asignificant increase of the purse-seine fishery, there has been little sign of a clearinteraction between the two fisheries except a decline in the longline CPUE within thepurse-seine fishing ground. In addition, it was inferred from relatively small rates ofdecline in the historical CPUE series of the longline fishery that the yellowfin stock in thewestern and central Pacific is significantly larger than other yellowfin stocks.Recommendations for improvement of the interaction studies were made.
Since the rapid development of a purse-seine fishery for skipjack and yellowfintuna in the western and central Pacific in the early 1980s, the estimation of maximumsustainable yield (MS Y) as well as possible interaction between the purse-seine and thelongline fisheries for yellowfin tuna have been major subjects of concern in this region.However, inadequate basic fisheries statistics and biological information on yellowfin tunain this area hinder the progress of the studies on these problem's.
Theoretical studies suggest that the total yield from the yellowfin stock is larger inthe case of coexistence of the two fisheries than in the case of exploitation by either oneof the two fisheries alone (Lenarz and Zweifel, 1979), especially if the stock is somewhatdiscrete for thelongline and the surface fisheries (Hilborn, 1989). In this regard,knowledge about mixing and migration of yellowfin tuna, especially for medium- andlarge-sized fish on which little information is available so far, is critical for understandingof the interaction studies and therefore for international management of this species(Deriso et al., 1991). An interesting finding on transatlantic migration of the largeyellowfin tuna has been reported recently, including the first recoveries of taggedyellowfin tuna in the Atlantic by the longline boats (ICCAT, 1992).
As for small fish, it is anticipated that the ongoing large scale tagging by the SouthPacific Commission (SPC) will provide good material for various quantitative studiesincluding the interactions among the fisheries. As later mentioned in the Section 3, theinteractions among the fisheries on yellowfin tuna are much more complicated thanpreviously assumed.
FAO LIBRARY AN: 346125

SERVED TREN
159
S Ilk' BASIC STATISTICS ON YELLOWF1N IN THE
As frequently mentioned elsewhere, it is difficult to estimate the total catch ofyellowfin tuna from the western and central Pacific due mainly to the lack of acoordinated data acquisition system with binding power for data submission from thecountries in the area. Two sets of statistics, however, are available which approximatethe total catch of yellowfin tuna from the western and central Pacific. One is the Foodand Agriculture Organization (FAO) yearbook for fisheries statistics of catch and landings(e.g., FAO, 1991), the other is statistical publications from the SPC (e.g., SPC, 1991).
There is fairly good accordance, at least in trend and magnitude, on the total catchbetween the two sets of statistics (Tables 1 and 2) despite difference in their datacollecting areas (Figure 1) and data collecting system. The total catch given in the SPCstatistics tends to be far smaller than those recorded by the FAO before 1979, due partlyto exclusion of the Philippine and Indonesian catches. Other than that period, the SPCstatistics show consistently larger catches than those from the FAO area 71, probably be-cause the former statistics cover larger areas than the latter. The catch prior to 1962 isunavailable in the SPC statistics but sizable longline catches, mainly by the Japanese fleet,were recorded since 1952 (Table 3). It should be noted that in addition to the totalestimate of the SPC statistical area, the catches from the contiguous area to the north,i.e., FAO area 61, produces about 30 to 40 thousand tons of yellowfin, caughtpredominantly by Japanese and Taiwanese longline fisheries. Therefore, the overall totalcatch from the western and central Pacific including the temperate areas may be on theorder of 370-380 thousand tons in 1990.
Table 2 shows gear breakdown of the total catch for the SPC statistical area. It isclear that the increase in the total catches is due to increase in purse-seine catch andcatches by the Philippine and Indonesian fisheries. The longline catch fluctuates duringthe past three decades with a slight decrease in the last decade while the baitboat catchshows a clear decreasing trend after 1980. These trends in the catch by major fishinggear category are largely driven by the corresponding trends of fishing effort in each gearcategory.
2.2 Catch Fishin. Effort. and Catc er Unit Effort CPUE b a'or Fisheries
As shown in Table 2, the baitboat catch of yellowfin tuna is very small comparedto the purse-seine and longline fisheries. Therefore, only purse-seine and longlinefisheries as well as the fisheries of the Philippines and Indonesia are described in thisstudy. The major distant-water fishing countries with purse-seine and longline fleets inthe region are the Japanese with purse-seine and longline fleets and the United States ofAmerica (USA) with a purse-seine fleet.
WESTERN AT CENTRAL PACIFIC
In this section, factual aspects of fisheries information relevant to the interactionsbetween purse-seine and longline fisheries are described.
2.1 Total Catch and Catch b Fishino Gear
2. e

160
Table 1. Catch of yellowfin tuna by countries from the FAO area71 (Pacific, Central west).
Unit:ton
Country(Gear)/Year 1971 1972 1973 1974 1975 1976 1977 1978
FIJI 12 II 74 151 540
Indonesia 11062 8037 10859 10601
Japan Total 23531 24315 29822 31670 33070 37813 50822 73080Lanolin,' 22807 24021 29286 29528 41987 59044Purse solne 379 481 2176 7159 7036Baltboat. 345 294 55 55 1676 769
Other 6231
Kiribati 25 25 25 2771 2930
Korea Rep. 259 3664 5462 5088
Papua New Guinea 1420 1420 1743 8563 3695 3115
Philippines 14900 51732 52793 44478 63059 47629
Solomon In.U.S.A.
Other 4229 4319 2510 2805 1870
Total 23531 24315 46142 89088 92209 105164 138904 144853
-Japan/Total 1.00 1.00 0.65 0.36 0.36 0.36 0.37 0.50
Country(Geer)/Year 1979 1980 1981 1982 1983 1984 1985 1986
FIJI 361 240 846 1157 1586 1771 1128 995
Indonesia 14663 17550 21869 24340 20200 26450 31022 34140
Japan, Total 54789 75990 77145 72362 70682 61767 76513 73108
Lonaline 43488 55888 49003 38162 40193 28433 30766 24872
Purss seine 10528 9918 21827 28054 25567 32057 37523 42388
Baitboat 773 6143 2706 1531 1030 1275 3229 1827
Other 4041 3609 4014 3892 2 4995 4021
Kiribati 3000 3148 3000 3000 2135 4036 4844 1065
Korea Rep. 6881 7424 2712 2528 1156 1373 1893 3251
Papua New Guinea 2881 3019 3516 0 0 372 370 400
Philippines 49224 48023 56176 51922 62036 58927 64293 59510
Solomon le. 192 314 1167 2165 3328 2816 3698 2769
U.S.A. 772 12867 14345 51066 41455 28798 36520
Other 2084 2363 1444 1036 433 1031 1062 1009
Total 134075 158843 180762 172855 212622 199998 213621 212767
Japan/Total 0.41 0.48 0.43 0.42 0.33 0.31 0.36 0.34
Country
(Gear)/Tear 1987 1988 1989
FIJI 1199 628 617
Indonesia 33080 34920 46422
Japan Total 75535 48139 62818
Longline 23568 16432 21679Purse seine 46442 26283 36078Baltboat 1590 1112 1074
Other 3935 4312 3987
Kiribati 350 395 385Kores Rep 18279 15710 16283Philippines 51809 57060 62146Solomon In. 6565 11581 9541 After Suzuki et al. (1989) and FAO (1991)Tuvalu 74 31 30 The Japanese catches shown in the TableU.S.A. 69636Vanuatu 60
25272GO
4127460
do not always accord with those by the
Other 4376 7566 5573 FAO statistics due to revision madeTotal 260963 201362 245149 afterward by Statistics and InformationJapan/Total 0.29 0.24 0.26 Division of Japanese Government.
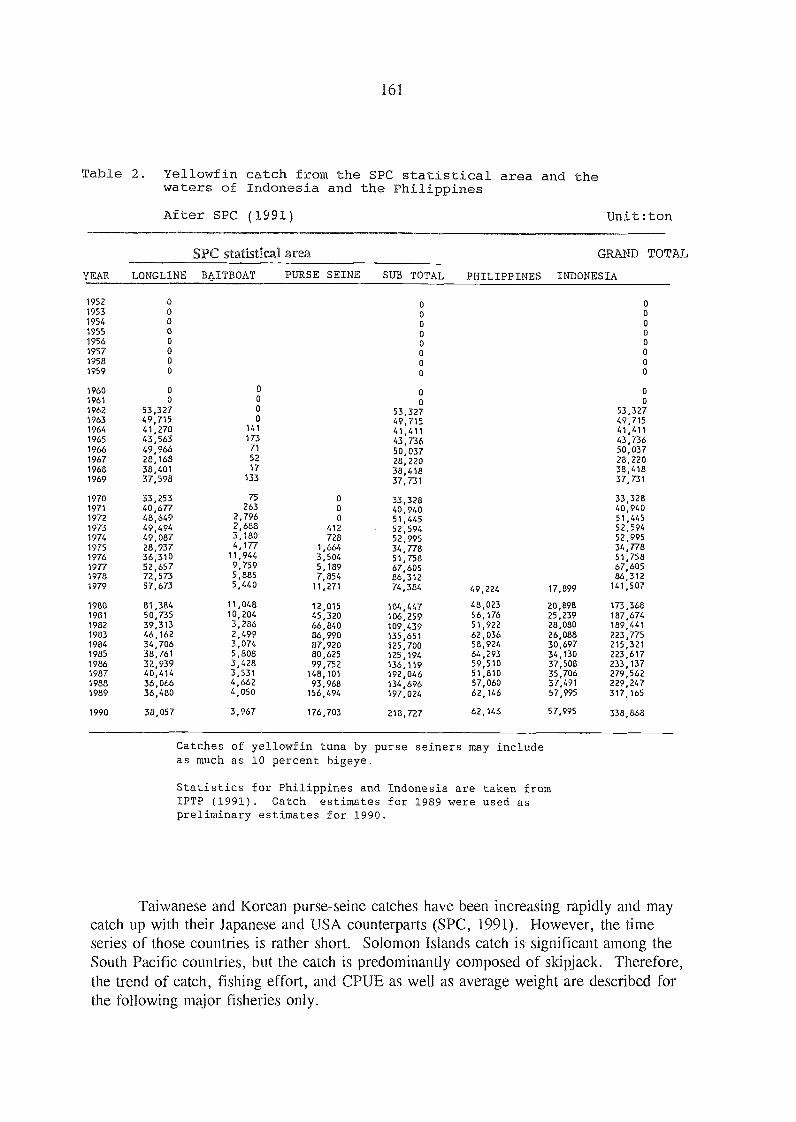
161
Table 2. Yellowfin catch from the SPC statistical area and thewaters of Indonesia and the Philippines
After SPC (1991) Unit:ton
Catches of yellowfin tuna by purse seiners may includeas much as 10 percent bigeye.
Statistics for Philippines and Indonesia are taken fromIPTP (1991). Catch estimates for 1989 were used aspreliminary estimates for 1990.
Taiwanese and Korean purse-seine catches have been increasing rapidly and maycatch up with their Japanese and USA counterparts (SPC, 1991). However, the timeseries of those countries is rather short. Solomon Islands catch is significant among theSouth Pacific countries, but the catch is predominantly composed of skipjack. Therefore,the trend of catch, fishing effort, and CPUE as well as average weight are described forthe following major fisheries only.
YEAR
SPC statistical area
PHILIPPINES
GRAND TOTAL
INDONESIALONGLINE BAITBOAT PURSE SEINE SUB TOTAL
1952 0 0 o
1953 0 0 o
1954 0 0 o
1955 0 0 o
1956 0 0 o1957 0 0 o1958 0 0 o1959 0 0 o
1960 0 0 0 01961 0 0 0 0
1962 53,327 0 53,327 53,3271963 49,715 0 49,715 49,7151964 41,270 141 41,411 41,4111965 43,563 173 43,736 43,7361966 49,966 71 50,037 50,0371967 28,168 52 28,220 28,2201968 38,401 17 38,418 38,4181969 37,598 133 37,731 37,731
1970 33,253 75 0 33,328 33,3281971 40,677 263 0 40,940 40,9401972 48,649 2,796 0 51,445 51,4451973 49,494 2,688 412 52,594 52,5941974 49,087 3,180 728 52,995 52,9951975 28,937 4,177 1,664 34,778 34,7781976 36,310 11,944 3,504 51,758 51,7581977 52,657 9,759 5,189 67,605 67,6051978 72,573 5,885 7,854 86,312 86,3121979 57,673 5,440 11,271 74,384 49,224 17,849 141,507
1980 81,384 11,048 12,015 104,447 48,023 20,898 173,3681981 50,735 10,204 45,320 106,259 56,176 25,239 187,6741982 39,313 3,286 66,840 109,439 51,922 28,080 189,4411983 46,162 2,499 86,990 135,651 62,036 26,088 223,7751984 34,706 3,074 87,920 125,700 58,924 30,697 215,3211985 38,761 5,808 80,625 125,194 64,293 34,130 223,6171986 32,939 3,428 99,752 136,119 59,510 37,508 233,1371987 40,414 3,531 148,101 192,046 51,810 35,706 279,5621988 36,066 4,662 93,968 134,696 57,060 37,491 229,2471989 36,480 4,050 156,494 197,024 62,146 57,995 317,165
1990 38,057 3,967 176,703 218,727 62,146 57,995 338,868
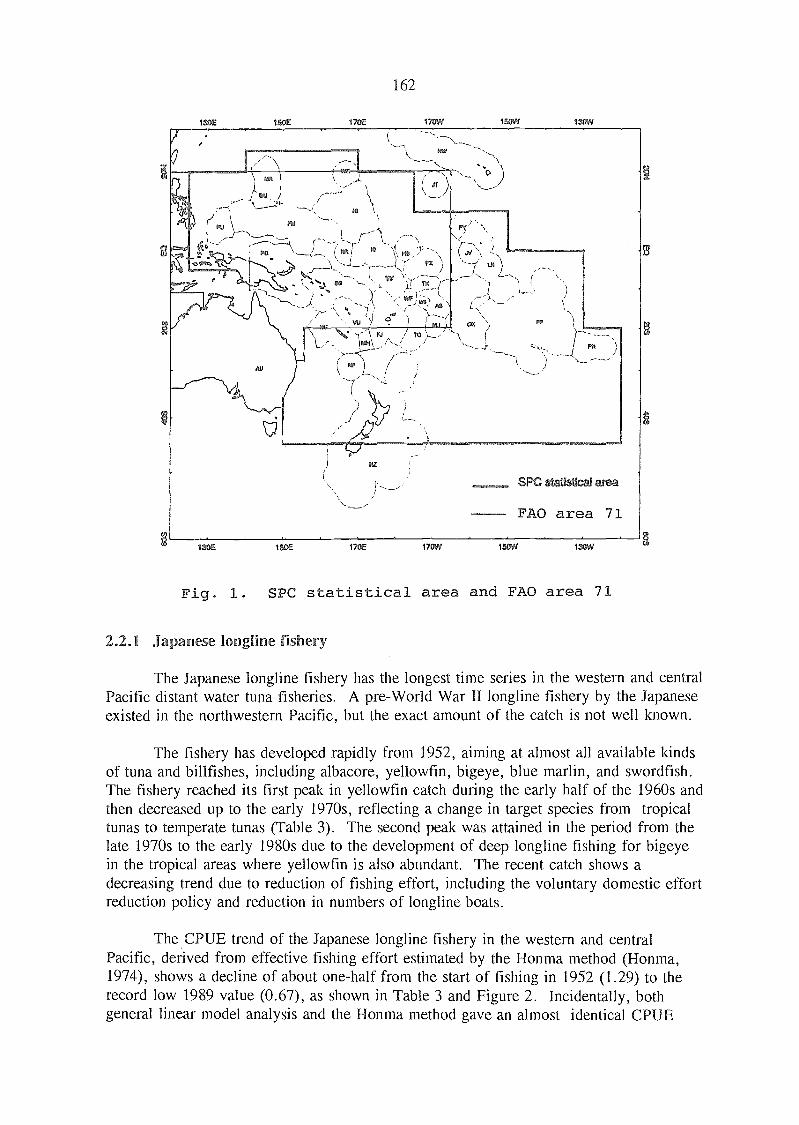
t
Jsea I 14 V,
,,
I/1
162
170W
150E 150E 170E 170W
Fig. 1. SPC statistical area and FAO area 71
2.2.1 Japanese longline fishery
The Japanese longline fishery has the longest time series in the western and centralPacific distant water tuna fisheries. A pre-World War II longline fishery by the Japaneseexisted in the northwestern Pacific, but the exact amount of the catch is not well known.
The fishery has developed rapidly from 1952, aiming at almost all available kindsof tuna and billfishes, including albacore, yellowfin, bigeye, blue marlin, and swordfish.The fishery reached its first peak in yellowfin catch during the early half of the 1960s andthen decreased up to the early 1970s, reflecting a change in target species from tropicaltunas to temperate tunas (Table 3). The second peak was attained in the period from thelate 1970s to the early 1980s due to the development of deep longline fishing for bigeyein the tropical areas where yellowfin is also abundant. The recent catch shows adecreasing trend due to reduction of fishing effort, including the voluntary domestic effortreduction policy and reduction in numbers of longline boats.
The CPUE trend of the Japanese longline fishery in the western and centralPacific, derived from effective fishing effort estimated by the Honma method (Honma,1974), shows a decline of about one-half from the start of fishing in 1952 (1.29) to therecord low 1989 value (0.67), as shown in Table 3 and Figure 2. Incidentally, bothgeneral linear model analysis and the Honma method gave an almost identical CPUE
101
)/ TO
SF a
FAO area 71
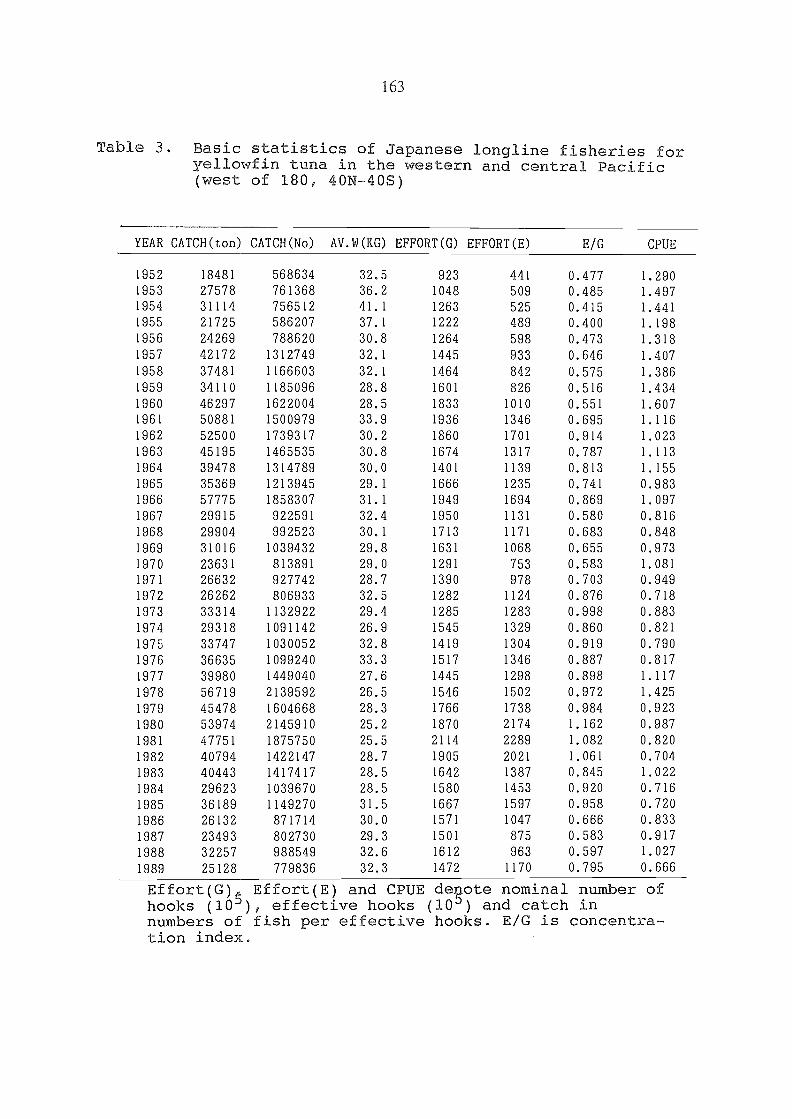
163
Table 3. Basic statistics of Japanese longline fisheries foryellowfin tuna in the western and central Pacific
Effort(G) Effort(E) and CPUE depote nominal number ofhooks (10), effective hooks (10J) and catch innumbers of fish per effective hooks. E/G is concentra-tion index.
(west of 180, 40N-40S)
YEAR CATCH(ton) CATCH(No) AV.W(KG) EFFORT(G) EFFORT(E) E/G CPUE
1952 18481 568634 32.5 923 441 0.477 1.290
1953 27578 761368 36.2 1048 509 0.485 1.497
1954 31114 756512 41.1 1263 525 0.415 1.441
1955 21725 586207 37.1 1222 489 0.400 1.198
1956 24269 788620 30.8 1264 598 0.473 1.318
1957 42172 1312749 32.1 1445 933 0.646 1.407
1958 37481 1166603 32.1 1464 842 0.575 1.386
1959 34110 1185096 28.8 1601 826 0.516 1.434
1960 46297 1622004 28.5 1833 1010 0.551 1.607
1961 50881 1500979 33.9 1936 1346 0.695 1.116
1962 52500 1739317 30.2 1860 1701 0.914 1.023
1963 45195 1465535 30.8 1674 1317 0.787 1.113
1964 39478 1314789 30.0 1401 1139 0.813 1.155
1965 35369 1213945 29.1 1666 1235 0.741 0.983
1966 57775 1858307 31.1 1949 1694 0.869 1.097
1967 29915 922591 32.4 1950 1131 0.580 0.816
1968 29904 992523 30.1 1713 1171 0.683 0.848
1969 31016 1039432 29.8 1631 1068 0.655 0.973
1970 23631 813891 29.0 1291 753 0.583 1.081
1971 26632 927742 28.7 1390 978 0.703 0.949
1972 26262 806933 32.5 1282 1124 0.876 0.718
1973 33314 1132922 29.4 1285 1283 0.998 0.883
1974 29318 1091142 26.9 1545 1329 0.860 0.821
1975 33747 1030052 32.8 1419 1304 0.919 0.790
1976 36635 1099240 33.3 1517 1346 0.887 0.817
1977 39980 1449040 27.6 1445 1298 0.898 1.117
1978 56719 2139592 26.5 1546 1502 0.972 1.425
1979 45478 1604668 28.3 1766 1738 0.984 0.923
1980 53974 2145910 25.2 1870 2174 1.162 0.987
1981 47751 1875750 25.5 2114 2289 1.082 0.820
1982 40794 1422147 28.7 1905 2021 1.061 0.704
1983 40443 1417417 28.5 1642 1387 0.845 1.022
1984 29623 1039670 28.5 1580 1453 0.920 0.716
1985 36189 1149270 31.5 1667 1597 0.958 0.720
1986 26132 871714 30.0 1571 1047 0.666 0.833
1987 23493 802730 29.3 1501 875 0.583 0.917
1988 32257 988549 32.6 1612 963 0.597 1.027
1989 25128 779836 32.3 1472 1170 0.795 0.666
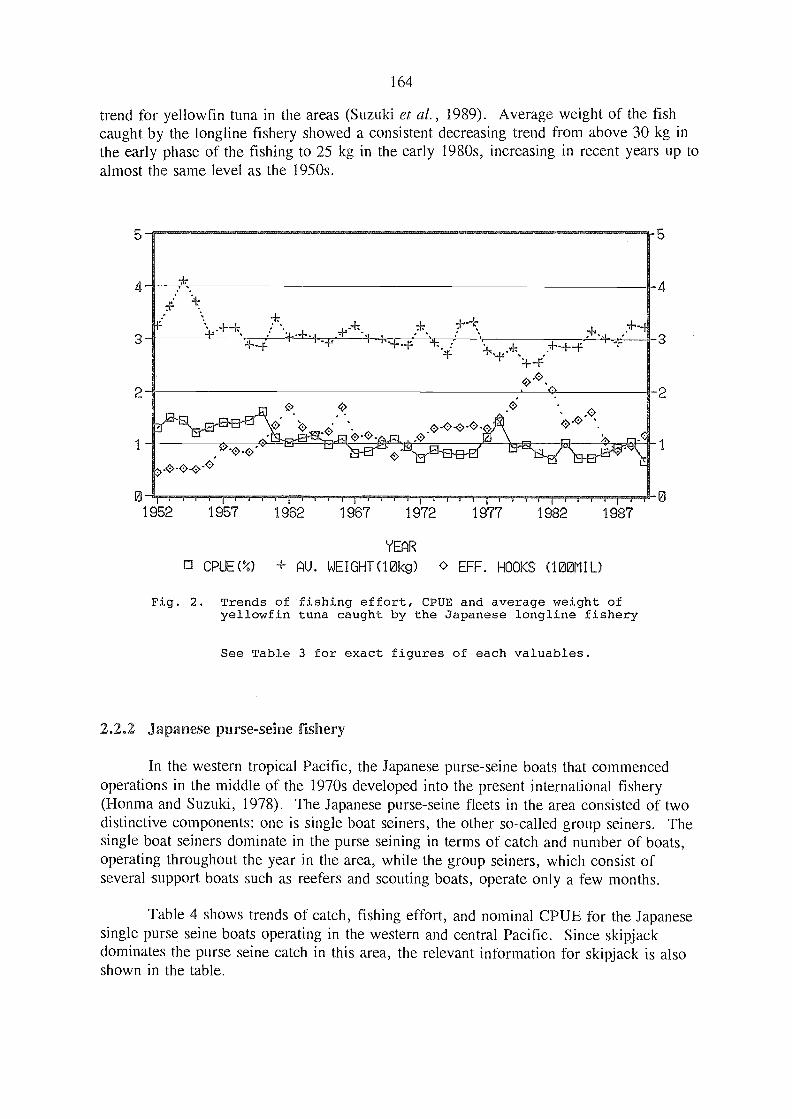
164
trend for yellowfin tuna in the areas (Suzuki et al., 1989). Average weight of the fishcaught by the longline fishery showed a consistent decreasing trend from above 30 kg inthe early phase of the fishing to 25 kg in the early 1980s, increasing in recent years up toalmost the same level as the 1950s.
1952 1957 1962 1967 1972 1977 1982 1987
YEAR
0 CPUE (%) + AU. WEI GHT (101<g) EFF. HOOKS (100M I L)
Fig. 2. Trends of fishing effort, CPUE and average weight ofyellowfin tuna caught by the Japanese longline fishery
See Table 3 for exact figures of each valuables.
2.2.2 Japanese purse-seine fishery
In the western tropical Pacific, the Japanese purse-seine boats that commencedoperations in the middle of the 1970s developed into the present international fishery(Honma and Suzuki, 1978). The Japanese purse-seine fleets in the area consisted of twodistinctive components: one is single boat seiners, the other so-called group seiners. Thesingle boat seiners dominate in the purse seining in terms of catch and number of boats,operating throughout the year in the area, while the group seiners, which consist ofseveral support boats such as reefers and scouting boats, operate only a few months.
Table 4 shows trends of catch, fishing effort, and nominal CPUE for the Japanesesingle purse seine boats operating in the western and central Pacific. Since skipjackdominates the purse seine catch in this area, the relevant information for skipjack is alsoshown in the table.
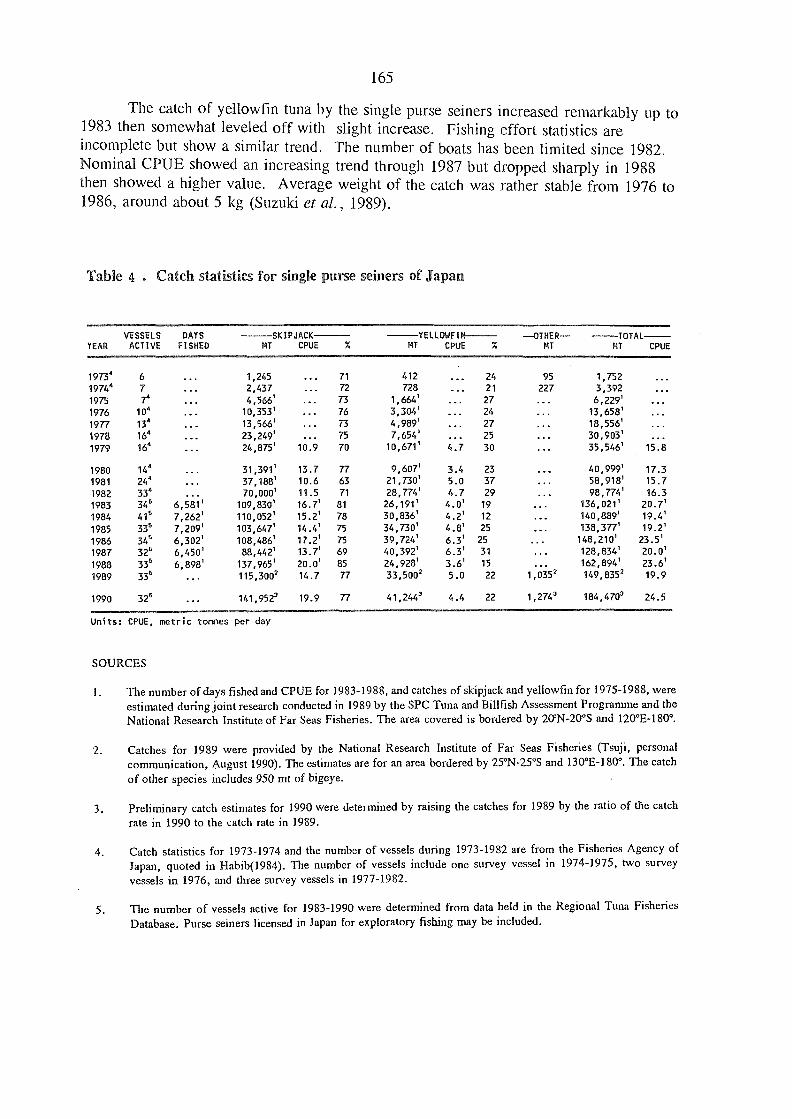
Units: CPUE, metric tonnes per day
SOURCES
The number of days fished and CPUE for 1983-1988, and catches of skipjack and yellowfin for 1975-1988, wereestimated during joint research conducted in 1989 by the SPC Tuna and Billfish Assessment Programme and theNational Research Institute of Far Seas Fisheries. The area covered is bordered by 20'N-20°S and 120°E-180°.
Catches for 1989 were provided by the National Research Institute of Far Seas Fisheries (Tsuji, personalcommunication, August 1990). The estimates are for an area bordered by 25°N-25°S and 130°E-180°. The catchof other species includes 950 rnt of bigeye.
Preliminary catch estimates for 1990 were determined by raising the catches for 1989 by the ratio of the catchrate in 1990 to the catch rate in 1989.
Catch statistics for 1973-1974 and the number of vessels during 1973-1982 are from the Fisheries Agency ofJapan, quoted in Habib(1984). The number of vessels include one survey vessel in 1974-1975, two surveyvessels in 1976, and three survey vessels in 1977-1982.
165
The catch of yellowfin tuna by the single purse seiners increased remarkably up to1983 then somewhat leveled off with slight increase. Fishing effort statistics areincomplete but show a similar trend. The number of boats has been limited since 1982.Nominal CPUE showed an increasing trend through 1987 but dropped sharply in 1988then showed a higher value. Average weight of the catch was rather stable from 1976 to1986, around about 5 kg (Suzuki et al., 1989).
Table 4 . Catch statistics for single purse seiners of Japan
5. The number of vessels active for 1983-1990 were determined from data held in the Regional Tuna FisheriesDatabase. Purse seiners licensed in Japan for exploratory fishing may be include,d.
YEAR ACTIVE FISHED MT CPUE MT CPUE MT MT CPUE
1973° 6 1,245 71 412 24 95 1,752
19744 7 2,437 72 728 21 227 3,392
1975 4,566' 73 1,664' 27 6,229'
1976 10° 10,353' 76 3,304' 24 13,658'
1977 134 13,566' 73 4,989' 27 18,556'
1978 164 23,249' ... 75 7,654' ... 25 30,903'
1979 164 24,875' 10.9 70 10,671' 4.7 30 35,546' 15.8
1980 144 31,391' 13.7 77 9,607' 3.4 23 40,999' 17.3
1981 244 ... 37,188' 10.6 63 21,730' 5.0 37 58,918' 15.7
1982 334 ... 70,000' 11.5 71 28,774' 4.7 29 98,774' 16.3
1983 346 6,581' 109,830' 16.7' 81 26,191' 4.0' 19 136,021' 20.7'
1984 416 7,262' 110,052' 15.2' 78 30,836' 4.2' 12 140,889' 19.4'
1985 336 7,209' 103,647' 14.4' 75 34,730' 4.8' 25 138,377' 19.2'
1986 346 6,302' 108,486' 17.2' 75 39,724' 6.3' 25 148,210' 23.5'
1987 326 6,450' 88,442' 13.7' 69 40,392' 6.3' 31 ... 128,834' 20.0'
1988 336 6,898' 137,965' 20.0' 85 24,928' 3.6' 15 ... 162,894' 23.6'
1989 335 ... 115,3002 14.7 77 33,5002 5.0 22 1,0352 149,8352 19.9
1990 326 141,9523 19.9 77 41,2443 4.4 22 1,2743 184,4703 24.5
VESSELS DAYS SK1PJACK YELLOWFIN OTHER TOTAL
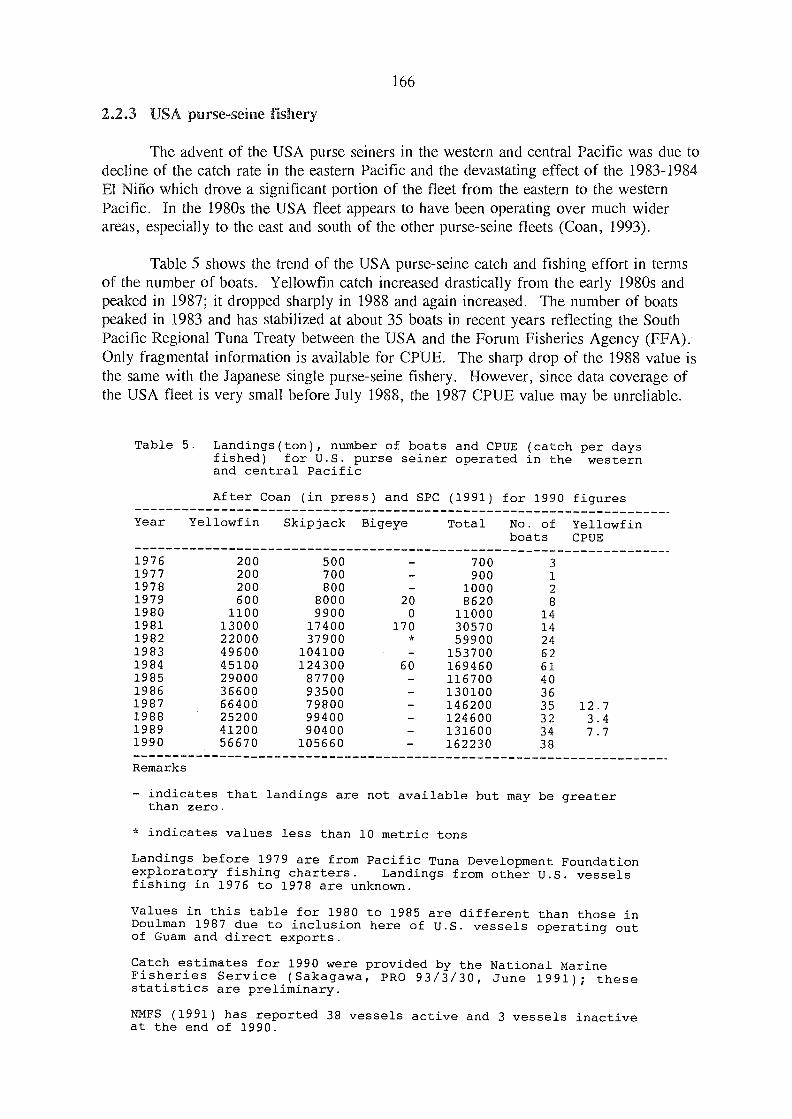
2.2.3 USA purse-seine fishery
The advent of the USA purse seiners in the western and central Pacific was due todecline of the catch rate in the eastern Pacific and the devastating effect of the 1983-1984El Niño which drove a significant portion of the fleet from the eastern to the westernPacific. In the 1980s the USA fleet appears to have been operating over much widerareas, especially to the east and south of the other purse-seine fleets (Coan, 1993).
Table 5 shows the trend of the USA purse-seine catch and fishing effort in termsof the number of boats. Yellowfin catch increased drastically from the early 1980s andpeaked in 1987; it dropped sharply in 1988 and again increased. The number of boatspeaked in 1983 and has stabilized at about 35 boats in recent years reflecting the SouthPacific Regional Tuna Treaty between the USA and the Forum Fisheries Agency (FFA).Only fragmental information is available for CPUE. The sharp drop of the 1988 value isthe same with the Japanese single purse-seine fishery. However, since data coverage ofthe USA fleet is very small before July 1988, the 1987 CPUE value may be unreliable.
Table 5. Landings(ton), number of boats and CPUE (catch per daysfished) for U.S. purse seiner operated in the western
166
Remarks
- indicates that landings are not available but may be greaterthan zero.
* indicates values less than 10 metric tons
Landings before 1979 are from Pacific Tuna Development Foundationexploratory fishing charters. Landings from other U.S. vesselsfishing in 1976 to 1978 are unknown.
Values in this table for 1980 to 1985 are different than those inDoulman 1987 due to inclusion here of U.S. vessels operating outof Guam and direct exports.
Catch estimates for 1990 were provided by the National MarineFisheries Service (Sakagawa, PRO 93/3/30, June 1991); thesestatistics are preliminary.
NMFS (1991) has reported 38 vessels active and 3 vessels inactiveat the end of 1990.
Year
and central Pacific
After Coan (in press) and SPC
Yellowfin Skipjack Bigeye
(1991)
Total
for 1990
No. ofboats
figures
YellowfinCPUE
1976 200 500 - 700 3
1977 200 700 900 1
1978 200 800 - 1000 2
1979 600 8000 20 8620 81980 1100 9900 0 11000 141981 13000 17400 170 30570 141982 22000 37900 * 59900 241983 49600 104100 - 153700 621984 45100 124300 60 169460 611985 29000 87700 - 116700 401986 36600 93500 - 130100 361987 66400 79800 - 146200 35 12.71988 25200 99400 - 124600 32 3.41989 41200 90400 131600 34 7.71990 56670 105660 - 162230 38

167
2.2.4 Philippines and Indonesian fisheries
For the Philippines and Indonesia, the yellowfin catch statistics include other tunassuch as bigeye. In addition, swordfish and billfishes are included in the Indonesianyellowfin statistics. Table 6 shows recent catches of yellowfin tuna by major fishinggear. However, a substantial part of the catch is taken by unclassified gears. Fishaggregating devices (FADs) are commonly used by both the Philippines and Indonesia tocatch tunas and large pelagic fishes.
The Philippine catches of yellowfin tuna appear to be stable during the pastdecade, while there is a sign of recent increase of yellowfin catches in the Indonesianfishery, especially increased catch by longline gear. While not shown separately in Table6, the handline is one of the major fishing gear used in the Philippines and Indonesia; thehandline gear catches small and large yellowfin tunas.
2.3 Size of Fish in the Catch by Major Fishery
Examples of length composition of yellowfin tuna taken by the major fishing gearsmentioned in the previous section are shown in Figure 3 for the Japanese purse-seinefishery, in Figure 4 for the USA purse-seine fishery, in Figure 5 for the Japanese longlinefishery (in comparison with that of the Japanese purse-seine catch within major purse-seine fishing grounds), and in Figure 6 for the Philippine fisheries. In each figure, linesindicating 30 cm and 120 cm in fork length are shown for comparison. The relevantfigures for the Indonesian fisheries were not available.
The length composition of yellowfin tuna caught by the Japanese and USA purseseiners is similar but there are some important differences. Percentage of the small fish(less than about 70 cm) relative to the larger fish (over 90 cm) is much higher in theJapanese catches than USA catches (Figures 3 and 4). For the small fish group, which isa major component of the purse-seine catch, the peak size of the Japanese catch is muchsmaller than that in the USA catch. This difference may be due to difference in fishingareas, school types, or degree of discard of the smaller fish.
In Figure 5, length composition of yellowfin tuna caught by the Japanese longlinefishery is compared with that taken by the Japanese purse-seine fishery. The major sizeof longline-caught yellowfin tuna in the western Pacific covers from about 90 to 140 cm.
Major fishing gears of the Philippines for catching yellowfin tuna are purse seine,ringnet (small purse seiners), and handline. The catch by size of yellowfin tuna for thesefisheries was calculated from the data collected by the Indo-Pacific Tuna Developmentand Management Programme (IPTP) tuna sampling project which started in the ea.rly1980s (Suzuki, 1989). One of the unique characteristics of the size of yellowfin taken bythe purse-seine and ringnet fisheries of the Philippines is very small fish of less than 30cm often found in the catches (Figure 6). The other important observation comes fromthe size composition of yellowfin tuna taken by the handline fishery, which indicates asignificant catch of probably the largest yellowfin tuna, over 140 cm, caught in a sizableamount in the western equatorial region. It should be noted that middle sized fishbetween 60 and 100 cm are very few in the handline catches. The lack of this size classof fish in the catch appears to be a common feature for all major fisheries in the western
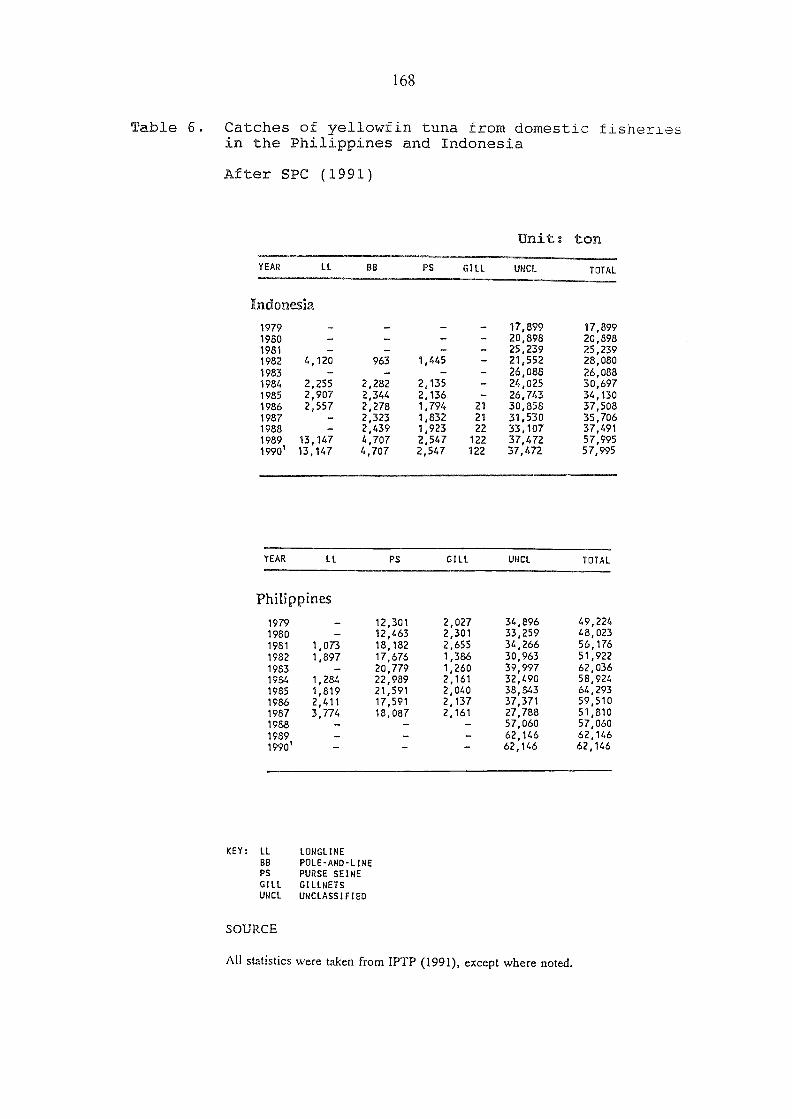
KEY: LL LONGLINEBO POLE-AND-LINEPS PURSE SEINEGILL GILLNETSUNCL UNCLASSIFIED
SOURCE
All statistics were taken from IPTP (1991), except where noted.
168
Table 6. Catches of yellowfin tuna from domestic fisheriesin the Philippines and Indonesia
After SPC (1991)
Unit: ton
YEAR LL BB PS GILL UNCL TOTAL
Indonesia
1979 - - 17,899 17,8991980 - - - 20,898 20,8981981 - - - 25,239 25,2391982 4,120 963 1,445 21,552 28,080
1983 - - - - 26,088 26,0881984 2,255 2,282 2,135 - 24,025 30,6971985 2,907 2,344 2,136 - 26,743 34,1301986 2,557 2,278 1,794 21 30,858 37,508
1987 - 2,323 1,832 21 31,530 35,7061988 - 2,439 1,923 22 33,107 37,4911989 13,147 4,707 2,547 122 37,472 57,9951990' 13,147 4,707 2,547 122 37,472 57,795
YEAR LL PS GILL UNCL TOTAL
Philippines
1979 - 12,301 2,027 34,896 49,224
1980 - 12,463 2,301 33,259 48,023
1981 1,073 18,182 2,655 34,266 56,176
1982 1,897 17,676 1,386 30,963 51,922
1983 - 20,779 1,260 39,997 62,036
1984 1,284 22,989 2,161 32,490 58,924
1985 1,819 21,591 2,040 38,843 64,293
1986 2,411 17,591 2,137 37,371 59,510
1987 3,774 18,087 2,161 27,788 51,810
1988 - - - 57,060 57,060
1989 - - 62,146 62,146
MO' - 62,146 62,146
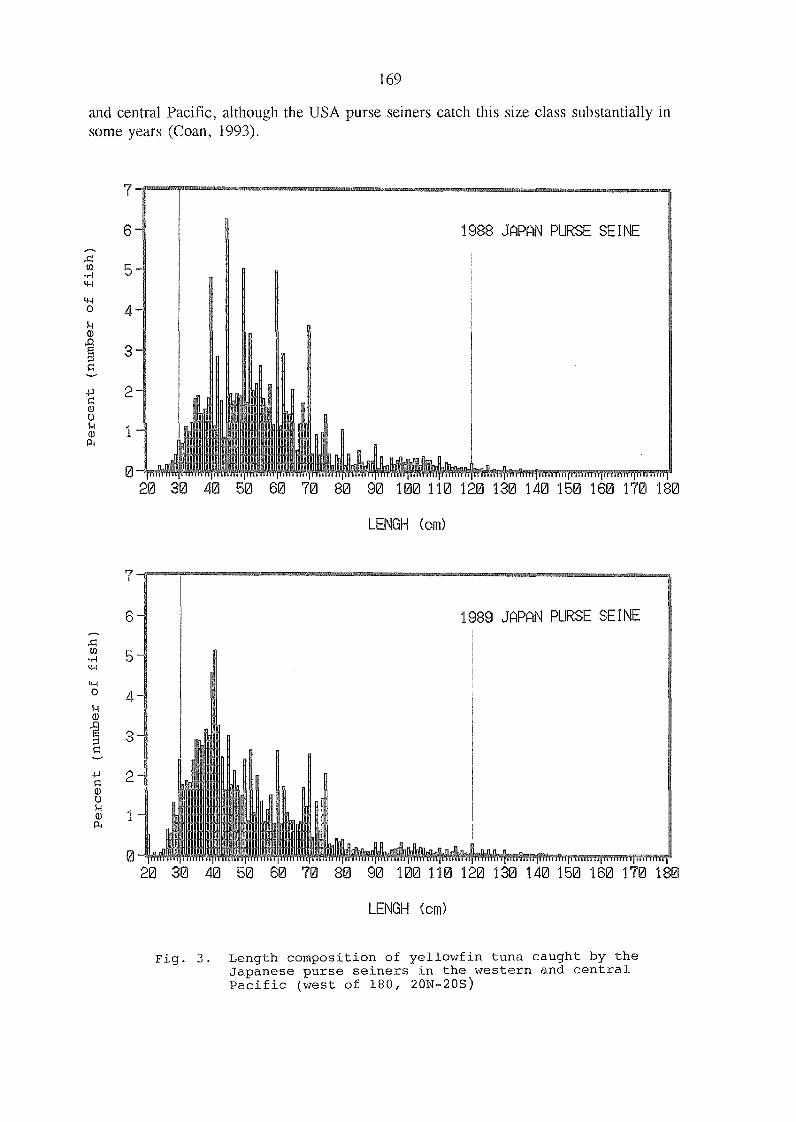
and central Pacific, although the USA purse seiners catch this size class substzntially insome years (Coan, 1993).
169
LENGH (cm)
LENGH (cm)
Fig. 3. Length composition of yellowfin tuna caught by theJapanese purse seiners in the western and centralPacific (west of 180, 20N-20S)
1988 JAPAN PURSE SEINE
1989 JAPAN PURSE SEINE
0 nftip20 30 40 50 60 70 80 90 100 110 120 130 140 150 160 170 18
30 140 150 16 70 18060 70 80 90 100 110 120
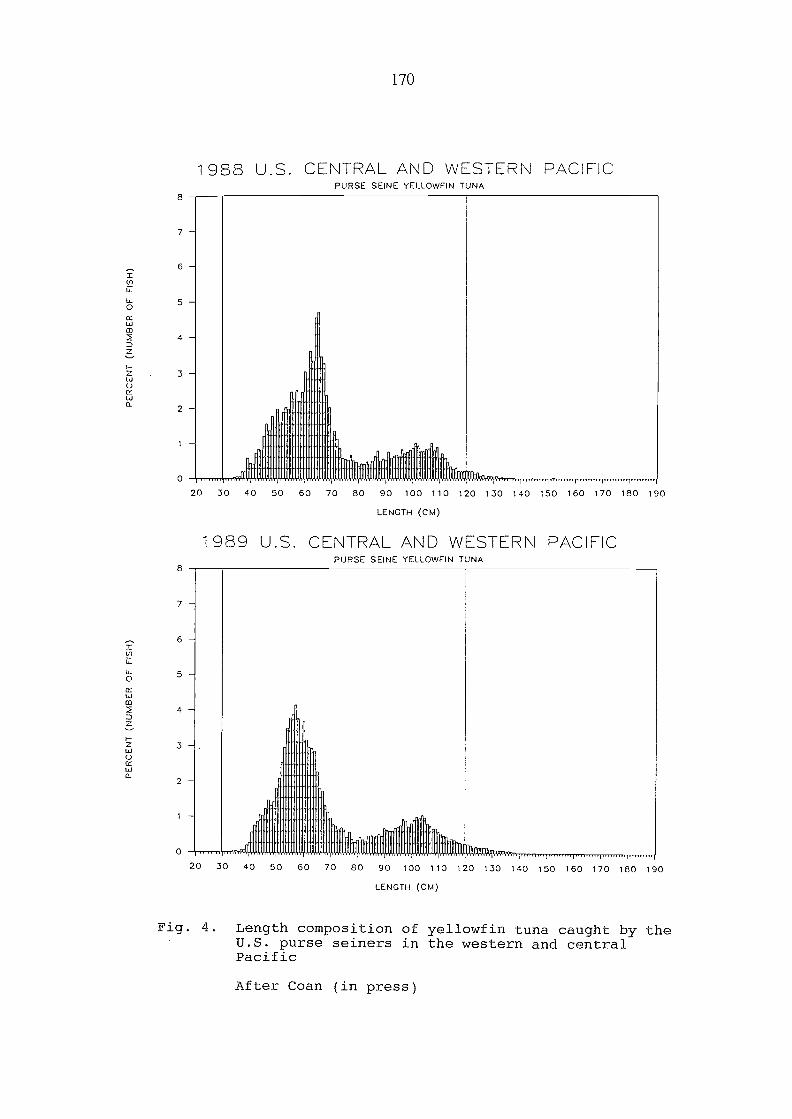
8
7
6
5 -
170
1988 U.S. CENTRAL AND WESTERN PACIFICPURSE SEINE YELLOWFIN TUNA
20 30 40 50 60 70 80 90 100 110 120 130 140 150 160 170 180 190
LENGTH (CM
1989 U.S. CENTRAL AND WESTERN PACIFICPURSE SEINE YELLOWFIN TUNA
11111111111111111111111111111
20 30 40 50 60 70 80 90 100 110 120 130 140 150 160 170 180 190
LENGTH (CM)
Fig. 4. Length composition of yellowfin tuna caught by theU.S. purse seiners in the western and centralPacific
After Coan (in press)
tu
4
3
2 -
o
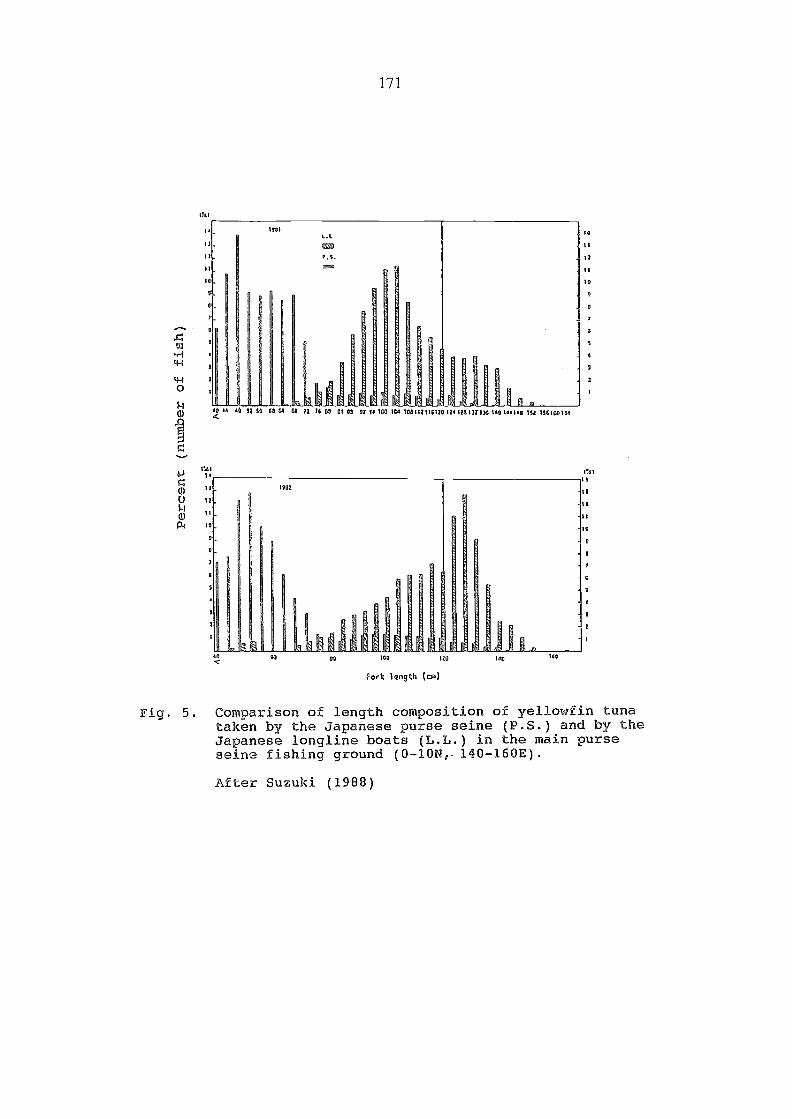
a
00 10
171
Fork length (co)
Fig. 5. Comparison of length composition of yellowfin tunataken by the Japanese purse seine (P.S.) and by theJapanese longline boats (L.L.) in the main purseseine fishing ground (0-10N, 140-160E).
After Suzuki (1988)
100
14
IS
IIIt
u 12
0 11
pl 10
9
mo IGS Into Mrh 11
1 1 11531G 1191133173 1 1191 S1 00 64 71 70 040 02 49 WO 104 1
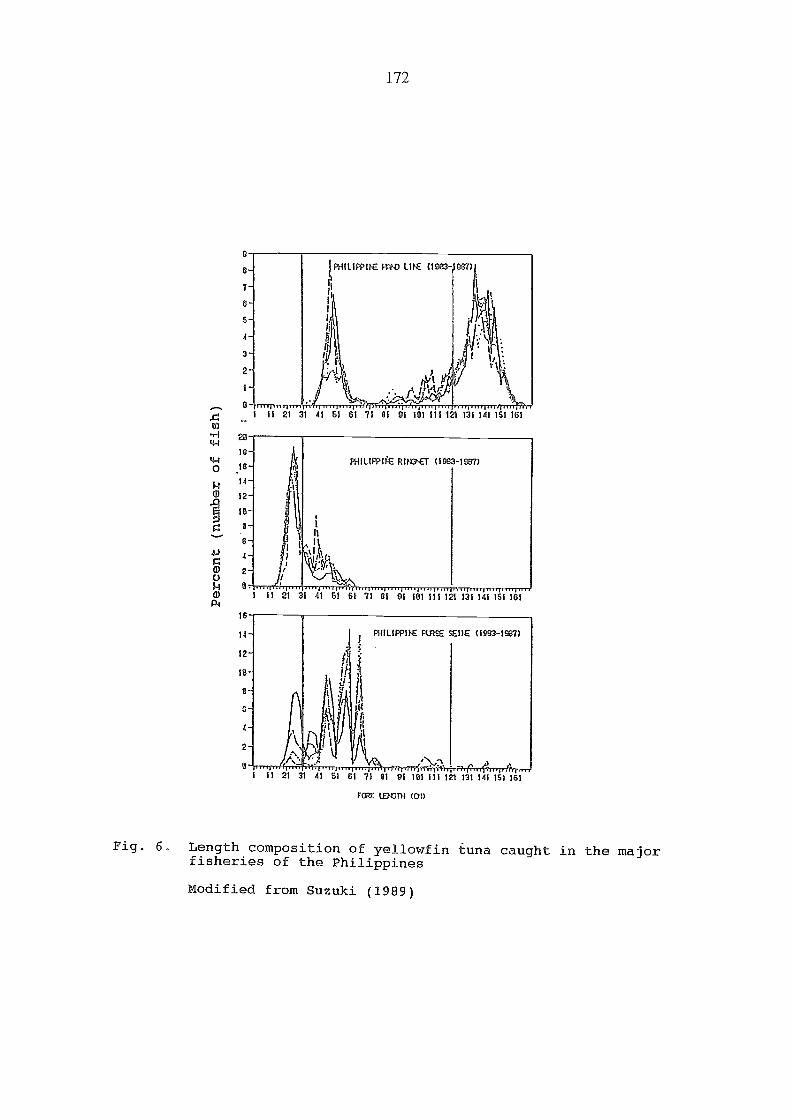
9.."1"-.9"4 I 11 21314161 Cl 7
A-
3- 1. 1,
2-
413 2
1-
o-rrrn, 1199-71rrie RITITTTI rg, to 1
61 61 71 81 9111 21 31 41
172
F09% LaGni (01)
01 91 101 Ill 121 131 141 151 161
PHILIPP11E Ft1/43,E7 (08:3-193.7)
101 Ill 121 131 141 151 161
11 2 31 41 51 71 01 91 101 111 121 131 141 151)
Fig. 6. Length composition of yellowfin funa caught in the majorfisheries of the Philippines
Modified from Suzuki (1989)
o
IB
14
12
10
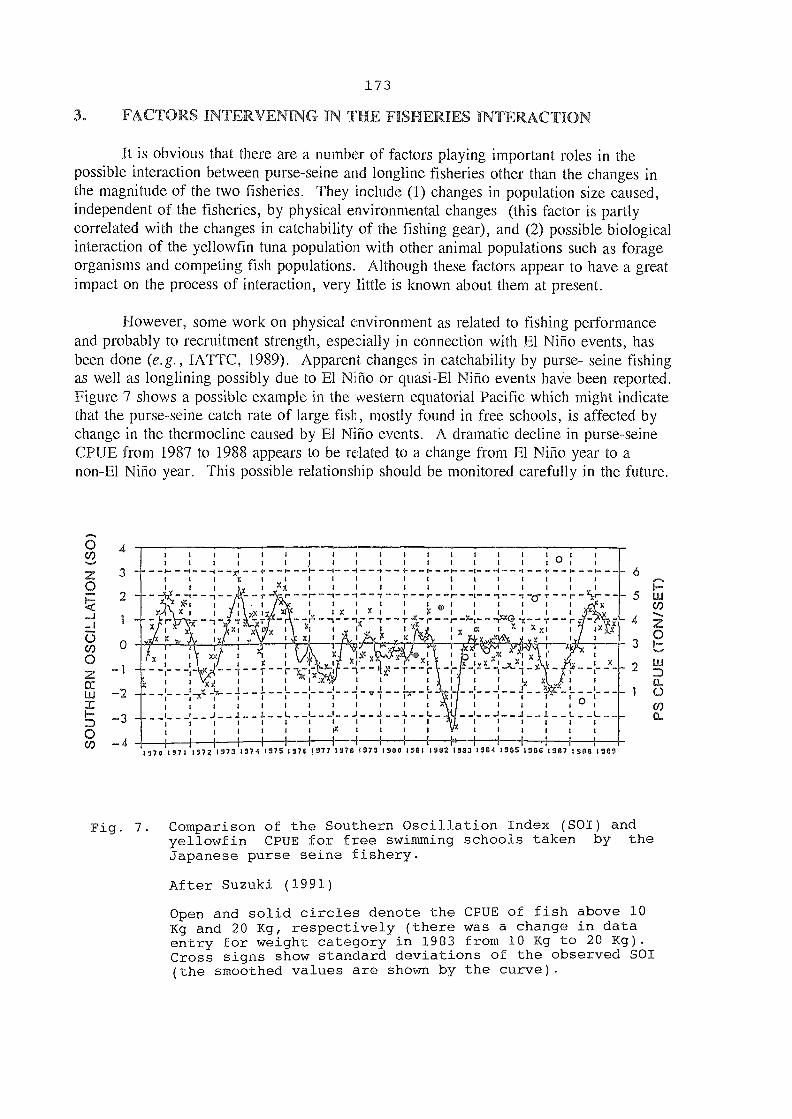
4
3
2
173
3. FACTO S INTERVENING IN THE FISHERIES INTERACTION
It is obvious that there are a number of factors playing important roles in thepossible interaction between purse-seine and longline fisheries other than the changes inthe magnitude of the two fisheries. They include (1) changes in population size caused,independent of the fisheries, by physical environmental changes (this factor is partlycorrelated with the changes in catchability of the fishing gear), and (2) possible biologicalinteraction of the yellowfin tuna population with other animal populations such as forageorganisms and competing fish populations. Although these factors appear to have a greatimpact on the process of interaction, very little is known about them at present.
However, some work on physical environment as related to fishing performanceand probably to recruitment strength, espe:.ially in connection with El Niño events, hasbeen done (e.g., IA'TTC, 1989). Apparent changes in catchability by purse- seine fishingas well as longlining possibly due to El Niño or quasi-El Niño events have been reported.Figure 7 shows a possible example in the western equatorial Pacific which might indicatethat the purse-seine catch rate of large fish, mostly found in free schools, is affected bychange in the thermocline caused by El Niño events. A dramatic decline in purse-seineCPUE from 1987 to 1988 appears to be related to a change from El Niño year to anon-El Niño year. This possible relationship should be monitored carefully in the future.
:-.......1-1 I 1 I 1 I 1 1 1 1 1 I I 11i I1 1 I 1 1 1 1 1 I 1 1"1,
1 1 1 1 I I 1 1
X1 I XxI IX I XI I 1 1
1 XI I1 I 1 1a I Xi X xi
x
4-- 4 -1:
T--xi I
1
1
I
I
1 X
I -X1-'1. - i 1 I I 1 7 I I
I I I I I I I I I I I : 0J_-.1__L__L ____ _I_ - J_-_1__1.--4 _
1 I I I IIIX I I I I
I I 1
11 1 1 1 1 I
1570 1571 1 72 1173 1374 IS I7 !77 1379 1373 1,90 1391 1,92 19013 II54 190S I9QX I7 19110 19X9
6
5
4
3
2
Fig. 7. Comparison of the Southern Oscillation Index (SOI) andyellowfin CPUE for free swimming schools taken by theJapanese purse seine fishery.
After Suzuki (1991)
Open and solid circles denote the CPUE of fish above 10Kg and 20 Kg, respectively (there was a change in dataentry for weight category in 1983 from 10 Kg to 20 Kg).Cross signs show standard deviations of the observed SOI(the smoothed values are shown by the curve).
174
Another aspect which hinders the interaction studies is lack of fundamentalknowledge on biology and fisheries of yellowfin tuna. This lack of data, prohibitsquantitative investigations of this subject to a satisfactory degree. They include (1) stockstructure, (2) natural and fishing mortality rates, (3) rate of mixing (migration) in bothvertical and horizontal direction, (4) growth and aging, (5) possible behavioural changerelated to spawning, (6) catch/effort and size measurement statistics, and (7) developmentof reliable CPUE series. These aspects are summarized in the review paper of biologyand fisheries of yellowfin tuna in the western and central Pacific (Suzuki, 1993).
One thing which appears often overlooked in the fisheries interaction studies onyellowfin and other tropical tunas is the role of payao or the FADs. They must play animportant role in the process of the interactions (e.g., SPC, 1990).
4. INFERENCE ON INTERACTION BETWEEN P SE SEINE ALONGLINE
4.1 Status of Stock
Although the status of yellowfin in the western and central Pacific is not known,Suzuki et al. (1989) suggested, on the basis of fisheries data through 1986, that the totalcatch of about 210 thousand tons was sustainable. Pieces of circumstantial evidencesupported this inference, including (1) low but relatively stable longline CPUE despite asubstantial increase in the purse-seine catches and no consistent trend in catches by thePhilippines and Indonesia fisheries during the recent years, and (2) average sizes ofyellowfin taken by the Japanese longliners and the Japanese purse seiners were stable.Suzuki et al. (1989) concluded that the adverse effect of the increased purse-seine catchwas not evident up to 1986 although there might be more dominant factors other than thepurse-seine fishery which mask an otherwise-manifested adverse effect on the longlinefishery.
The total catches from the areas appear to have attained a higher level since 1987,of around 300-350 thousand tons. The exception was 1988 when there was a decline ofthe purse-seine catch, probably environmentally induced. The recent further increase inyellowfin tuna catch by the purse-seine and Indonesian fisheries, mostly composed ofsmall yellowfin tuna, may have negative effects on the large-fish longline fishery.
4.2 Inference on the Interaction
As previously mentioned in the section on the Japanese longline trends, there wasa somewhat big drop in CPUE in 1989. Figures 3, 4, and 5 indicate that the differencein dominant ages of the purse-seine catch (about 1 year old) and the longline catch (2 and3 years old) is approximately 2 years. This might be an indication of the effect of higherexploitation of the surface fisheries since 1987. A correlation analysis between longlineCPUE and purse-seine catch should be done with a longer time series accounting for atime lag.
Another way to detect the effect of increased purse-seine and Indonesian fisheriescatches on longlining is to see the areal differences before and after the increase ofcatches by these fisheries. Polacheck (1988) compared spatially the percentage change in
175
the yellowfin tuna catch rate by the Japanese longliners for 1984-1985 relative to1979-1981 but could not find large declines in longline catch rates in the areas of majorJapanese purse-seine catches. A similar comparison, not the percentage change, but theabsolute differences of the average CPUE based on recent data between 1979-1981 and1987-1989, were calculated by 5 x 5 degree squares. The 1979-1981 period roughlycovers the period when full scale purse-seine operations had not yet started.
The results are shown in Figure 8 and Table 7. All differences in average CPUEbetween the two periods are listed in Table 7 and shown in Figure 8. It is clear that thelargest decrease roughly corresponds to the areas of the major purse-seine catches (Figure9) whereas in the areas north of the major purse-seine fishing grounds, there are noconsistent patterns (Table 7). In the areas to the south of the major purse-seine fishinggrounds, there appears to be an increase in catch rates. A large decline in a somewhatisolated area between the 170°E-180° and 0°-10°S is observed. Although more detailedanalyses with additional new data are required to give a conclusion, if this result isinterpreted as an indication of the adverse effect of purse seining on longline fishing,there might be some indication that the mixture of yellowfin is not homogeneous spatiallythroughout the western and central Pacific.
It is noteworthy that the overall decline of the longline CPUE in the western andcentral Pacific is remarkably small, about one-half that of the early exploitation periodcompared to a several-fold decline in all other stocks of yellowfin. This may suggest thatthe western and central Pacific yellowfin stock is significantly larger than other stocks.However, it remains an open question whether the recent higher harvest of this stock issustainable or not in the long term.
5. RECOMMENDATION FOR IMPROVEMENT OF THE INTERACTIONST1UDIES
5.1 Statistics
Establishment of a centralized data collecting body is urgently needed. The SPCTuna and Billfish Assessment Programme (TBAP) could be a promising body for thispurpose if the membership is broadened to cover all the distant water fishing nations(DWFN). There is no time to waste, at this critical time of ever increasing fishing efforton tropical tunas in the western and central Pacific, in formulating such a data collectingsystem, preferably with binding powers for data submission. Both coastal countries andthe distant water fishing nations (DWFN) must abandon selfish speculative ideas about thecommon fisheries resources of this region and should cooperatively strive to establishbetter databases.
Data collection from the southeast Asian countries should be continued andimproved since the IPTP terminates its activity at the end of 1991. Effort should be madeto have catch statistics by species, especially the separation of bigeye and yellowfin tunas.Size measurements by species/fishing gears should also be improved.
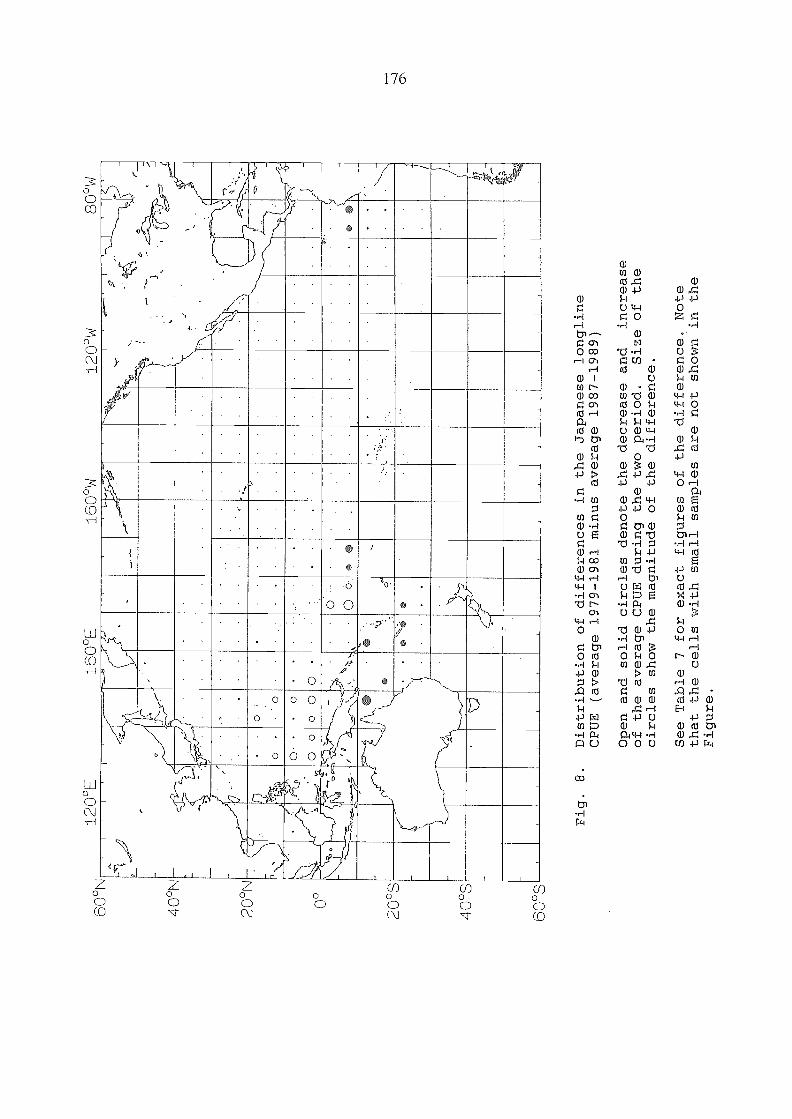
60°S
1113
11M
fg11
11
161
ER
1111
1111
1111
111
1111
1111
11VI
1111
1111
1111
111
11E
MI 1
1111
111
1
0 00
Mt
TIM
1111
1111
1111
1
MIL
1)1
ME
NIC
4111
111
11.1
111
E11
111
Fig. 8.
Distribution of differences in the Japanese longline
CPUE (average 1979-1981 minus average 1987-1989)
Open and solid circles denote the decrease and
increase
of the average CPUE during the two period.
Size of the
circles show the magnitude of the difference.
See Table 7 for exact figures of the difference. Note
that the cells with small samples are not shown in the
Figure.
60°N
40°N
20 N
120°
E16
0°E
160°
W12
0°W
80°W
20 S
40 S
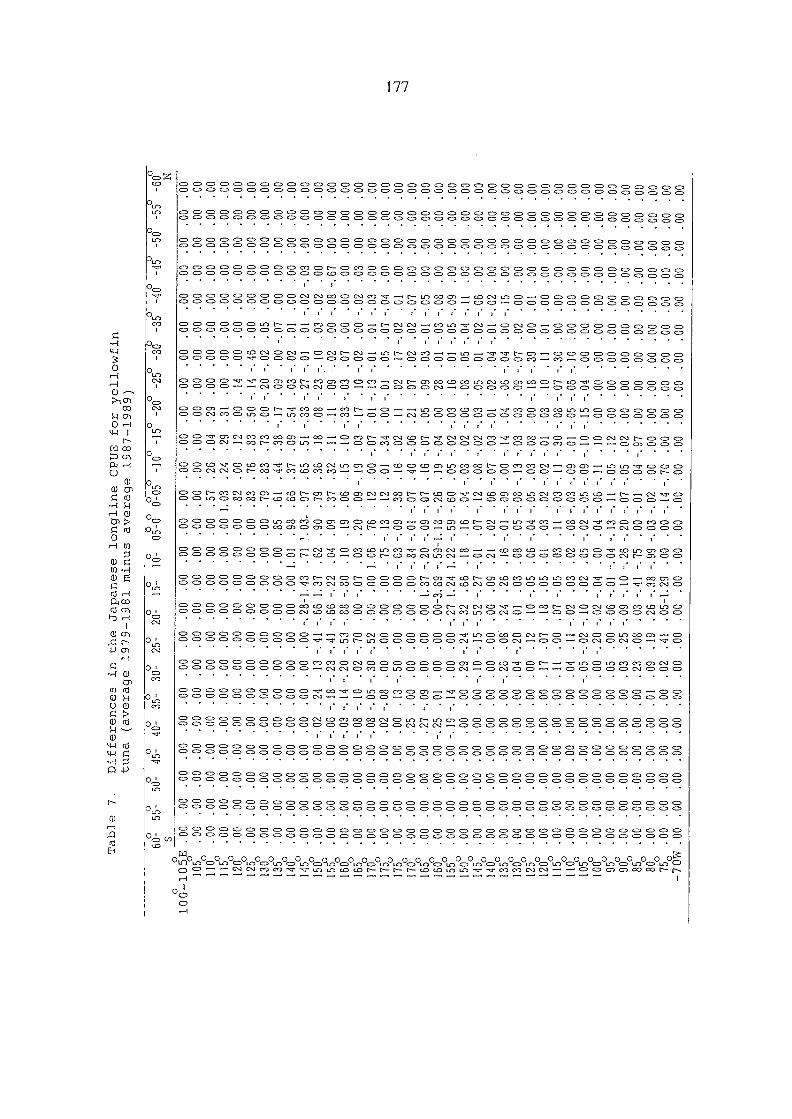
Table 7.
Differences in the Japanese longline CPUE for yellowfin
tuna (average 1979-1981 minus average 1987-1989)
60°-
55°-
50-
45-
40-
35-
30-
25-
20-
15-
10-
05-00
o 0-05° -100 -150 -200 -250 -300 -350 -400 -45 0500550600 N
100°-10?E .00
.00
.00
.00
.00
.00
.00
.00
.00
.00
.00
.00
.00
.00
.00
.00
.00
.00
.00
.00
.00
.00
.00
.00
105
.00
.00
.00
.00
.00
.00
.00
.00
.00
.00
.00
.00
.00
.00
.00
.00
.00
.00
.00
.00
.00
.00
.00
.00
1100
.00
.00
.00
.00
.00
.00
.00
.00
.00
.00
.00
.00
.57
.26
.04
.29
.00
.00
.00
.00
.00
.00
.00
.00
115°
.00
.00
.00
. 00
. 00
.00
.00
.00
.00
.00
.00
.00 1.03
.24
.29
.31
.00
.00
.00
.00
.00
.00
.00
.00
120,°
.00
.00
.00
.00
.00
.00
.00
.00
.00
.00
.00
.00
.82
.00
.12
.00
.14
.00
.00
.00
.00
.00
.00
.00
125-
.00
.00
.00
.00
.00
.00
.00
.00
.00
.00
.00
.00
.83
.76
.83
.50 -.14 -.46
.00
.00
.00
.00
.00
.00
130°
.00
.00
.00
.00
.00
.00
.00
.00
.00
.00
.00
.00
.79
.83
.73
.00 -.20 -.02
.05
.00
.00
.00
.00
.00
135°
.00
.00
.00
.00
.00
.00
.00
.00
.00
.00
.00
.85
.61
.44
.38 -.17
.09
.00 -.07
.00
.00
.00
.00
.00
140°
.00
.00
.00
.00
.00
.00
.00
.00
.00
.00 1.01
.98
.66
.37
.09
.54
.03 -.02
.01
.00
.00
.00
.00
.00
1450
.00
.00
.00
.00
.00
.00
.00
.00 -. 28-1. 43
.71 I.03
.97
.65
.51 -.33 -.27 -.01
.01 -.02 -.03
.00
.00
.00
150°
.00
.00
.00
.00 -.02
.24
.13 -.41 -.66 1.37
.62
.90
.79
.36
.18
.08 -.23 -.10
.03 -.02
.00
.00
.00
.00
155°
.00
.00
.00
.00 -.06 -.18 -.23 -.41 -.66 -.22
.04
.09
.37
.32
.11
.11
.09
.02
.00 -.08 -.67
.00
.00
.00
160°,
.00
.00
.00
.00 -.03 -.14 -.20 -.53 -.88 -.80
.10
.19
.06
.15
.10 -.33 -.03
.07
.00
.00
.00
.00
.00
.00
165-
.00
.00
.00
.00 -.08 -.10
.02 -.70
.00 -.07
.03
.20
.09 -.19
.03 -.17
.10 -.02
.00 -.02
.03
.00
.00
.00
170:
.00
.00
.00
.00 -.08 -.05 -.30 -.52
.00
.00 1.06
.76
.12
.00 -.07
.01 -.13 -.01
.01 -.03
.00
.00
.00
.00
1750-
.00
.00
.00
.00
.02 -.08
.00
.00
.00
.00
.75 -.13
.12
.01
.34
.00 -.01
.05
.07 -.04
.00
.00
.00
.00
175
.00
.00
.00
.00
.00
.13 -.50
.00
.00
.00 -.63 -.09
.38
.16
.02
.11
.02
.17 -.02
.01
.00
.00
.00
.00
170°
.00
.00
.00
.00
.25
.00
.00
.00
.00
.00 -.84 -.01 -.07
.40 -.06
.21
.07
.02
.02 -.07
.00
.00
.00
.00
165°
.00
.00
.00
.00
.27 -.09
.00
.00
.00 1.37 -.20 -.09 -.07
.16 -.07
.05
.09
.03 -.01 -.05
.00
.00
.00
.00
160°
.00
.00
.00
.00 -.25
.01
.00
.00
. 00-3. 89 -.59-1. 18 -.26
.19 -.04
.00
.28
.01 -.03 -.08
.00
.00
.00
.00
155°
.00
.00
.00
.00 -.19 -.14
.00
.00 -.27 1.24 1.22 -.59 -.60
.05 -.02 -.03
.16
.01 -.05 -.09
.00
.00
.00
.00
150,°
.00
.00
.00
.00
.00
.00
.29 -.24 -.32
.66
.18
.16
.04 -.03
.02 -.06
.08
.05 -.04 -.11
.00
.00
.00
.00
145,-
.00
.00
.00
.00
.00
.00 -.10 -.15 -.52 -.27 -.01
.07 -.12
.08 -.02 -.03
.05
.01 -.02 -.06
.00
.00
.00
.00
140-
.00
.00
.00
.00
.00
.00
.00
.00
.00
.09
.21
.02
.06 -.07
.03 -.01
.02
.04 -.01 -.02
.00
.00
.00
.00
135°
.00
.00
.00
.00
.00
.00 -.26
.08
.24
.26
.16 -.01 -.09
.00 -.14
.04
.06 -.04
.00 -.15
.00
.00
.00
.00
130°
.00
.00
.00
.00
.00
.00
.04 -.20
.01
.03
.08
.05 -.08 -.13 -.03
.03
.09 -.07
.02
.00
.00
.00
.00
.00
125°
.00
.00
.00
.00
.00
.00
.00
.12
.10 -.05
.06 -.04 -.05
.03 -.08
.00 -.18 -.39
.00
.01
.00
.00
.00
.00
120°
.00
.00
.00
.00
.00
.00
.17
.07
.18
.05
.01
.03
.02 -.02 -.01
.03
.10
.11
.01
.00
.00
.00
.00
.00
115°
.00
.00
.00
.00
.00
.00
.11
.00
.07 -.05
.03
.11 -.03 -.11 -.30 -.08 -.07 -.30
.00
.00
.00
.00
.00
.00
110,°
.00
.00
.00
.00
.00
.00
.04
.11 -.02
.03
.02
.08 -.03 -.09
.01 -.05 -.06 -.10
.00
.00
.00
.00
.00
.00
105-
.00
.00
.00
.00
.00
.00 -.05 -.02 -.10
.02
.05 -.02 -.05 -.09 -.10 -.15 -.04
.00
.00
.00
.00
.00
.00
.00
100°
.00
.00
.00
.00
.00
.00
.00
-.20 -.02 -.04
.00
.04 -.06
-.11
.10
.00
.00
.00
.00
.00
.00
.00
.00
.00
950
.00
.00
.00
.00
.00
.00
.05
.00
-.06
-.01
-.04 -.13
-.11
-.05
.12
.00
.00
.00
.00
.00
.00
.00
.00
.00
90
.00
.00
.00
.00
.00
.03
.25 -.09
-.10
-.26 -.20 -.07 -.05
.02
.00
.00
.00
.00
.00
.00
.00
.00
.00
85
.00
.00
.00
.00
.00
.00
.23
.08
.03 -.41 -.75
.00
-.01
.04-.97
.00
.00
.00
.00
.00
.00
.00
.00
.00
80:
.00
.00
.00
.00
.00
.01
.09
.19
.26 -.38 -.99 -.03 -.02
.00
.00
.00
.00
.00
.00
.00
.00
.00
.00
.00
750
.00
.00
.00
.00
.00
.00
.02
.41
.05-1.29
.00
.00
-.14 -.70
.00
.00
.00
.00
.00
.00
.00
.00
.00
.00
-70w
.00
.00
.00
.00
.00
.00
.00
.00
.00
.00
.00
.00
.00
.00
.00
.00
.00
.00
.00
.00
.00
.00
.00
.00
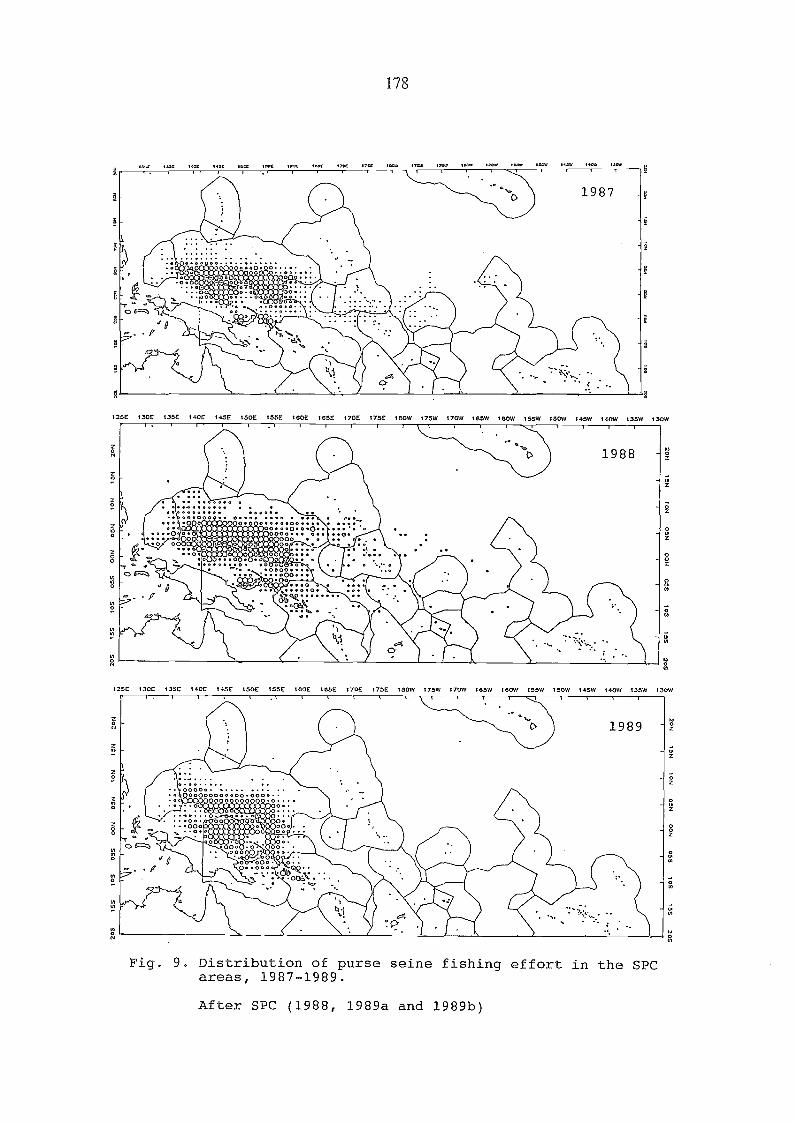
178
105E ME 175E lem 175W 170W lem 100W ism 150W 145W 140W 135W 1
111111
. .... ****** ..00000. ..... .... ...00000000000.0000...meoeso .. . .. . .. ......Aeim...........
00114 oleeleselO>o0.P.s.
KA.00.1:04.rWalmpmAilmowtko00004110 O...... I'm
o
Fig. 9. Distribution of purse seine fishing effort in the SPCareas, 1987-1989.
After SPC (1988, 1989a and 1989b)
2
o
o
125E 130E 135E 140E 145E 150E 155E 100E /OSE 170E 175E 1110W 175W 170W 105W 100W 155W 15 135W 130W
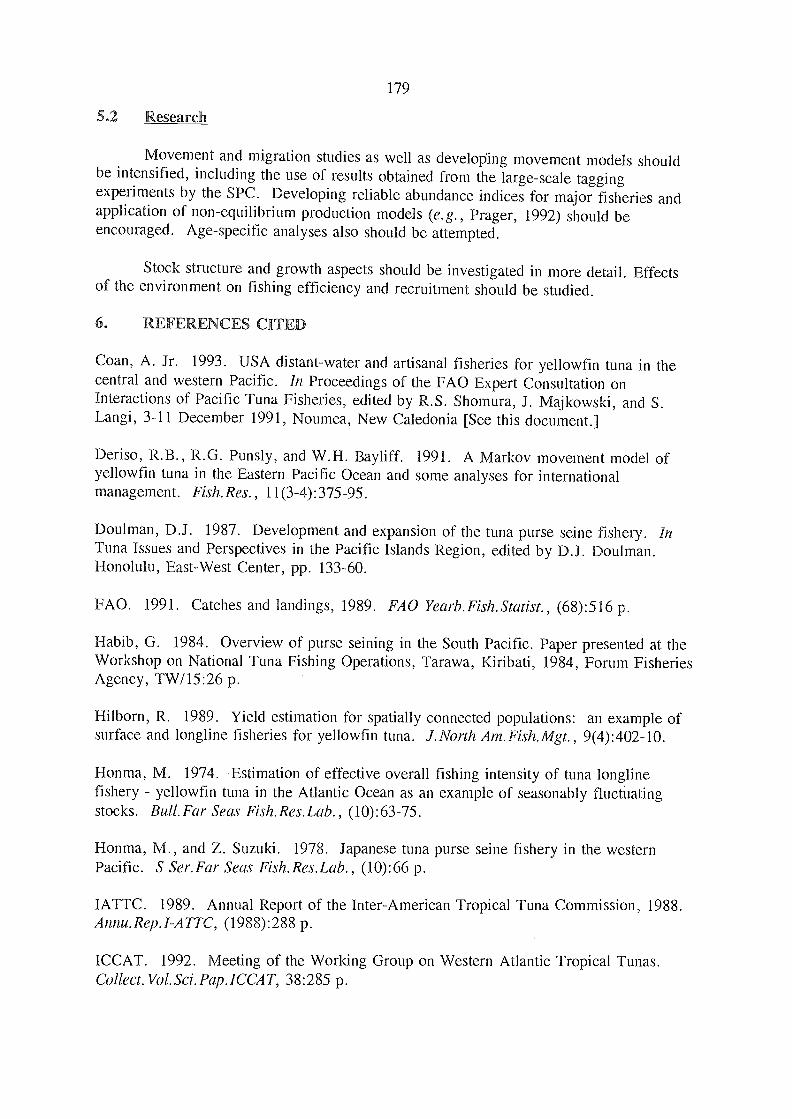
5.2 Research
Movement and migration studies as well as develoijing movement models shouldbe intensified, including the use of results obtained from the large-scale taggingexperiments by the SPC. Developing reliable abundance indices for major fisheries andapplication of non-equilibrium production models (e.g., Prager, 1992) should beencouraged. Age-specific analyses also should be attempted.
Stock structure and growth aspects should be investigated in more detail. Effectsof the environment on fishing efficiency and recruitment should be studied.
6. REFERENCES CITED
Coan, A. Jr. 1993. USA distant-water and artisanal fisheries for yellowfin tuna in thecentral and western Pacific. In Proceedings of the FAO Expert Consultation onInteractions of Pacific Tuna Fisheries, edited by R.S. Shomura, J. Majkowski, and S.Langi, 3-11 December 1991, Noumea, New Caledonia [See this document.]
Deriso, R.B., R.G. Punsly, and W.H. Bayliff. 1991. A Markov movement model ofyellowfin tuna in the Eastern Pacific Ocean and some analyses for internationalmanagement. Fish.Res., 11(3-4): 375-95.
Doulman, D.J. 1987. Development and expansion of the tuna purse seine fishery. InTuna Issues and Perspectives in the Pacific Islands Region, edited by D.J. Doulman.Honolulu, East-West Center, pp. 133-60.
FAO. 1991. Catches and landings, 1989. FAO Yearb.Fish.Statist., (68):516 p.
Habib, G. 1984. Overview of purse seining in the South Pacific. Paper presented at theWorkshop on National Tuna Fishing Operations, Tarawa, Kiribati, 1984, Forum FisheriesAgency, TW/15:26 p.
Hilborn, R. 1989. Yield estimation for spatially connected populations: an example ofsurface and longline fisheries for yellowfin tuna. J.North Am.Fish.Mgt., 9(4):402-10.
Honma, M. 1974. Estimation of effective overall fishing intensity of tuna longlinefishery - yellowfin tuna in the Atlantic Ocean as an example of seasonably fluctuatingstocks. Bull.Far Seas Fi.sh.Res.Lab., (10):63-75.
Honma, M., and Z. Suzuki. 1978. Japanese tuna purse seine fishery in the westernPacific. S Ser.Far Seas Fish.Res.Lab., (10):66 p.
IA'l l'C. 1989. Annual Report of the Inter-American Tropical Tuna Commission, 1988.Annu.Rep.I-A1TC, (1988):288 p.
ICCAT. 1992. Meeting of the Working Group on Western Atlantic Tropical Tunas.Collect.Vol.Sci.Pap.ICCAT, 38:285 p.
179

180
IPTP. 1991. Indian Ocean and Southeast Asian tuna fisheries data summary for 1989.Data Summ.Inflo-Pac.Tuna Dev.Mgt.Programme, Colombo, Sri Lanka, 11:96 p.
Lenarz, W., and J.R. Zweifel. 1979. A theoretical examination of some aspects of theinteractions between longline and surface fisheries for yellowfin tuna, Thunnus albacares.Fish.Bull.NOAA-NMFS, 76(4):807-25.
NMFS. 1991. U.S. Tuna Fleet Quarterly Report- First Quarter 1991. Quart.Rep.Southwest Reg., NOAA-NMFS, 8 p.
Polacheck, T. 1988. YeBowfin tuna, Thunnus albacares, catch rates in the westernPacific. Fish.Bull.NOAA-NMFS, 87(1):123-44.
Prager, M. 1992. ASPIC- A surplus-production model incorporating covariates.Collect.Vol.Sci.Pap.ICCAT, 38:218-29.
SPC. 1988. Regional Tuna Bulletin, First Quarter 1988. Reg.Tuna Bull.Tuna BillfishAssess.Programme, S.Pac.Comm., 28 p.
SPC. 1989a. Regional Tuna Bulletin, Fourth Quarter 1988. Reg. Tuna Bull. TunaAssess.Programme, S.Pac.Comin., 38 p.
SPC. 1989b. Regional Tuna Bulletin, Fourth Quarter 1989. Reg.Tuna Bull.TunaBiifish Assess.Programme, S.Pac.Comm., 34 p.
SPC. 1990. Preliminary analysis of Solomon Islands in-country tagging project data.Paper presented at the SPC Third Meeting of the Standing Committee on Tuna andBillfish, 6-8 June 1990, Noumea, New Caledonia, SCTB/WP4:10 p.
SPC. 1991. Status of tuna fisheries in the SPC area during 1990, with annual catchessince 1952. Paper presented at the SPC Fourth Meeting of the Standing Committee onTuna and Billfish, 17-19 June 1991, Port Vila, Vanuatu, SCTB/WP:75 p.
Suzuki, Z. 1988. Study of interaction between longline and purse seine fisheries onyellowfin tuna, Thunnus albacares (Bonnaterre). Bull.Far Seas Fish.Res.Lab.,(25):73-143.
Suzuki, Z. 1989. A consideration on stock structure of yellowfin tuna in the westernpacific Ocean. Summ.Rep.Jap.Soc.Fish.Oceanogr., A2:7-8.
Suzulci, Z., N. Miyabe, and S. Tsuji. 1989. Preliminary analysis of fisheries and someinferenee on stock status for yellowfin tuna in the western Pacific. Report submitted toSPC Second Meeting of the Standing Committee on Tuna and Billfish, 19-21 June 1989,Suya, Fiji, SCTB/WP9.
Suzuki, Z. 1991. Status of world yellowfin tuna fisheries and stock. Tuna Newsl., Issue101:5-8.

181
Suzuki, Z. 1993. A review of the biology and fisheries for yellowfin tuna (Thunnusalbacares) in the western and central Pacific Ocean. In Proceedings of the FAO ExpertConsultation on Interactions of Pacific Tuna Fisheries, edited by R.S. Shomura, J.Majkowski, and S. Langi, 3-11 December 1991, Noumea, New Caledonia [See thisdocument.]
182
ESTIMATING THE IMPACT OF PURSE-SEINE CATCHES ON LONGL
Paul A.H. MedleyMarine Resources Assessment Group
8 Prince's GardensLondon, UK
ABSTRACT
The longline monthly catch per unit effort time series of the southwest Pacificyellowfin tuna stock (1980-1990) is analysed using a generalise,d linear model of the stockdynamics. The model accounts for changes in the catch rate which may be attributable tooceanographic effects, fishing location, and previous purse-seine catches. A simpleexample is given of how the parameter describing the impact of purse seine on longlinemight be used in the analysis of a decision to allocate the stock between two conflictinggears taking into account the uncertainty in the parameter estimation.
1. INTRODUCTION
The status of yellowfin tuna (Thunnus albacares) continues to be an importantissue to the southwest Pacific tuna fishery. Although yellowfin tuna is the second largestsingle fishery resource in the region, there is still uncertainty regarding the potentialsustainable yield. Concern over this problem has been increased by the experiences ofother fisheries where yellowfin have proved vulnerable to overexploitation by purseseiners (IATTC, 1979, 1980, 1981, 1982; Fonteneau and Diouf, 1983; Au, 1983).
While longline effort has remained relatively constant, there has been a markedincrease since 1979 in purse seine effort in the southwest Pacific. Purse seiners captureyellowfin, most tending to be small, young fish in association with skipjack and logs.Longliners take larger yellowfin (Cole, 1980), which form the biggest component of theircatch. If purse seiners and longliners are fishing the same stock, which seems likely, andlongline catch per unit effort (CPUE) data reflect changes in stock size, the longlineCPUE should decrease as the purse-seine catch increases, after allowing for a time delaybased on their different selectivities.
Several papers have covered the potential interaction between purse seine andlongline. Polacheck (1988) and Suzuki (1985) found no significant interaction betweenthe surface fishery and longline using data available for a region of the southwest Pacific.Suzuki (1988) found a significant interaction, however, between the surface and longlinefisheries in the eastern Pacific and eastern Atlantic oceans, and surmised that aninteraction would in time become apparent in the southwest Pacific even though none wasdete,ctable at that time. In addition, the South Pacific Commission (SPC, 1988) reportedlongline CPUE falling in areas where longline operations coincided with purse seine.
The aim of this study is to derive a method whereby the potential interaction canbe included in economic models of the fishery. By reducing the problem to a singlemeasurable variable, it should become much easier to include this potential interaction in
FAO LIBRARY AN: 346127
183
the decision-making process. The final section gives a simple example of how such anestimate might be used even where significant doubt exists that it is accurate.
2. THE CPUE TIME SERIES
For there to be a significant economic interaction between longline and purseseine, two assumptions need to be satisfied. Firstly, the longline yellowfin catch ratemust reflect the abundance of fish. While there may be reservations about the exact formof this relationship, it seems reasonable to assume this is the case on theoretical grounds(Medley, 1990). Secondly, longline and purse seine must be fishing the same yellowfinstock. To claim this is not the case requires that stocks occupying the same geographicalarea are separated by depth, which has no accepted theoretical basis, or that the gears arefishing stocks in different geographical areas. In the latter case longline effort isdistributed more widely than purse seine, so that longline catch rates might be expected tobe falling more rapidly in those areas also used by purse seiners.
The main argument regarding the interaction is over the degree rather thanwhether or not it exists. The interaction might be insignificant for a number of reasons, ahigh natural mortality or large stock size and relatively low fishing mortality being themost likely. However if yellowfin catches are already close to their maximum sustainableyield (MSY), further increases in catch should lead to interactions becoming much moresignificant.
Figure 1 shows the monthly average catch per hook of longline from publishedJapanese Yellow Book data (1962-1980) and logsheet data from the SPC data base(1978-1989) combined for a sub-region 10°N-20°S, 125°E-175°E. This subset of thedata set was chosen to avoid noise generated by different fishing practices further south,most notably for albacore, as well as to reduce the data set to manageable size. Althoughfrom different sources, the logsheet and Japanese Yellow Book data show a similar timeseries and combine reasonably well.
The important pattern in the data is the decline in longline catch per hook since1980, coinciding with the increasing catches of purse seine. This does not constituteproof that one causes the other. All the trends can be explained by a number ofhypotheses including changes in gear, targeting, and external oceanographic effects. Inparticular there is a similar negative trend during the period 1962-1975, before purseseine came into operation. It has been suggested that these trends coincide with the riseand decline of the pole and line fleets (Wright, pers. commun.), and the interactionbetween these two fleets is certainly worth investigating. In the meantime it should beassumed that declines in longline catch per hook have been observed before, but notnecessarily related to activities in the surface fisheries.
There is no Box-Jenkins time series model which provides a very good fit to thedata. The data are clearly nonstationary with changes in variance and trends throughoutthe series. Standard methods, which require transforming and differencing the data,produce models that fit the data poorly. In fact the behaviour of the series 1962-1990 isclose to a random walk, with positive and negative trends even in the absence of purseseine fishing. In order to proceed with estimating the interaction, the simplest hypothesisis to assume that there would have been no trend without purse seiners, so the best
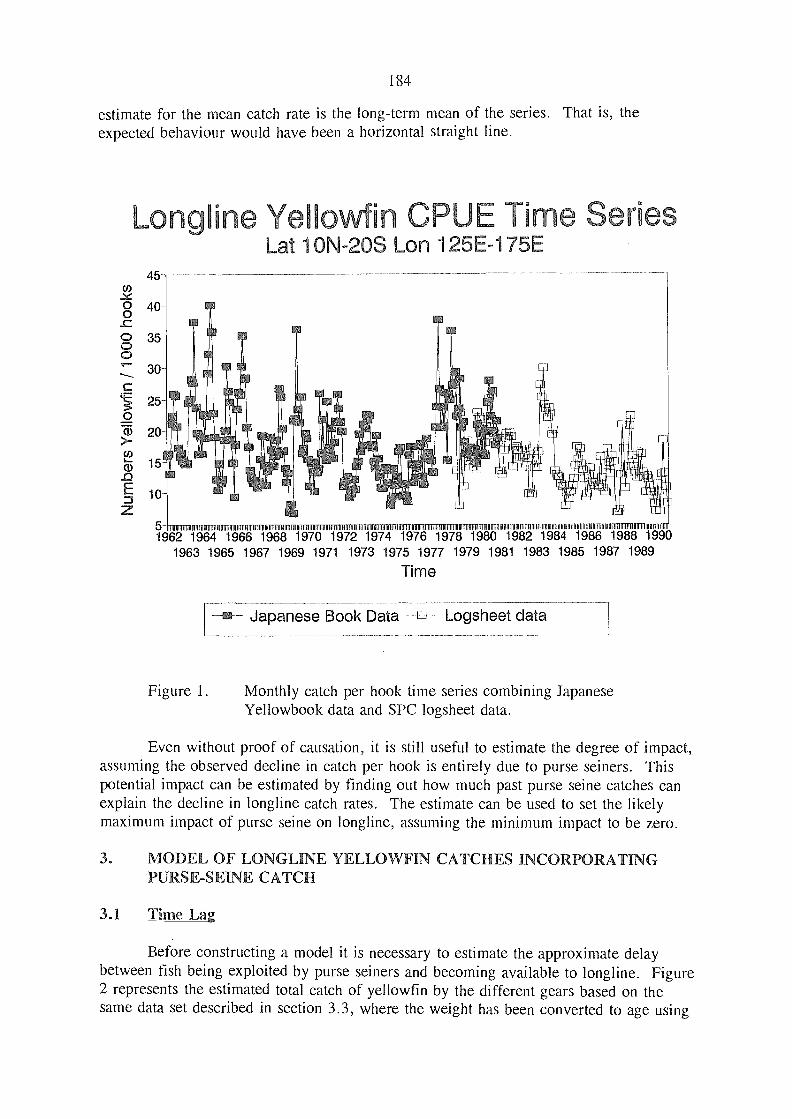
184
estimate for the mean catch rate is the long-term mean of the series. That is, theexpected behaviour would have been a horizontal straight line.
nVine eDllo n C UELatION-20S Lon 125E-175E
0 35oo30-
25o
Ta') 20-
Japanese Book Data -E3 Logsheet data
Figure 1. Monthly catch per hook time series combining JapaneseYellowbook data and SPC logsheet data.
Even without proof of causation, it is still useful to estimate the degree of impact,assuming the observed decline in catch per hook is entirely due to purse seiners. Thispotential impact can be estimated by finding out how much past purse seine catches canexplain the decline in longline catch rates. The estimate can be used to set the likelymaximum impact of purse seine on longline, assuming the minimum impact to be zero.
3. MODEL OF LONGLINE YELLOWFIN CATCHES INCORPORATINGPlURSE-SEINE CATCH
3.1 Time Lag
Before constructing a model it is necessary to estimate the approximate delaybetwe,en fish being exploited by purse seiners and becoming available to longline. Figure2 represents the estimated total catch of yellowfin by the different gears based on thesame data set described in section 3.3, where the weight has been converted to age using
76167747`74716681970 1972 II74 1976 T97III80 I982 1984 1986 r1988 1I9901963 1965 1967 1969 1971 1973 1975 1977 1979 1981 1983 1985 1987 1989
Time
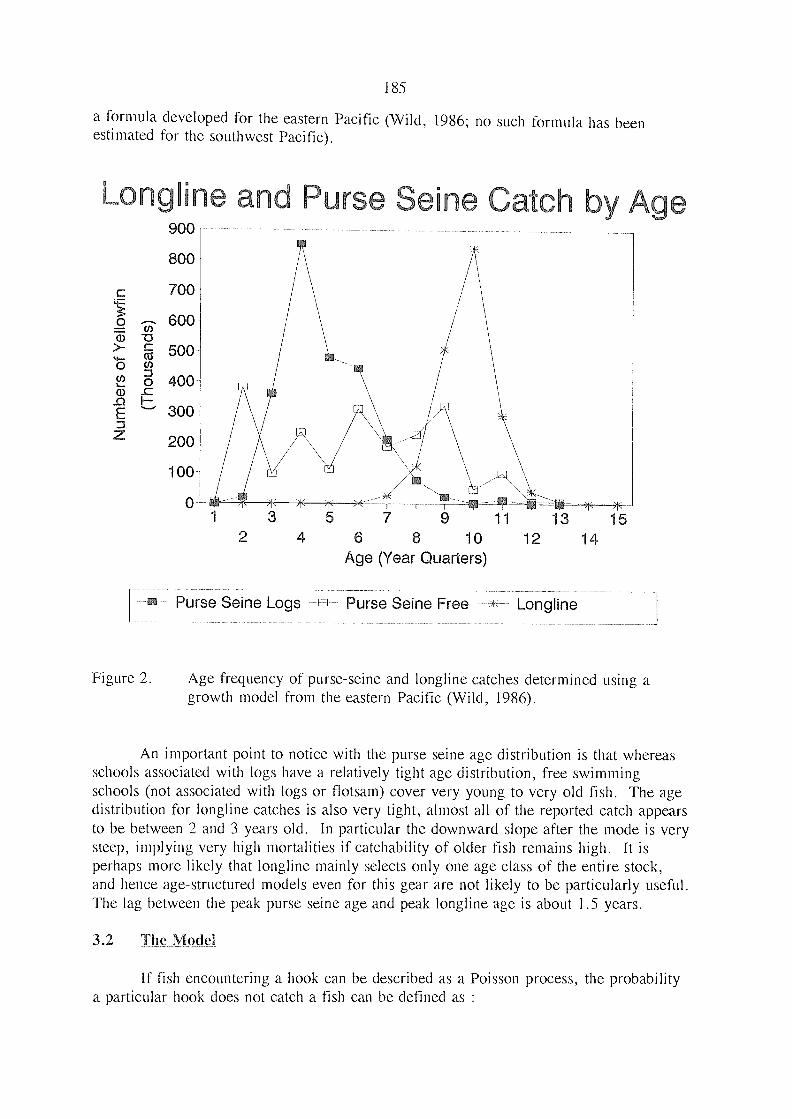
900
800
700
600'Fr')-o
500
J400-
300 -
200
100
o
185
a formula developed for the eastern Pacific (Wild, 1986; no such formula has beenestimated for the southwest Pacific).
/ ,14/ -
-#i - II l >t
7 9 11 13 152 4 6 8 10 12
Age (Year Quarters)
Purse Seine Logs id Purse Seine Free Longline
Figure 2. Age frequency of purse-seine and longline catches determined using agrowth model from the eastern Pacific (Wild, 1986).
An important point to notice with the purse seine age distribution is that whereasschools associated with logs have a relatively tight age distribution, free swimmingschools (not associated with logs or flotsam) cover very young to very old fish. The agedistribution for longline catches is also very tight, almost all of the reported catch appearsto be between 2 and 3 years old. In particular the downward slope after the mode is verysteep, implying very high mortalities if catchability of older fish remains high. It isperhaps more likely that longline mainly selects only one age class of the entire stock,and hence age-structured models even for this gear are not likely to be particularly useful.The lag between the peak purse seine age and peak longline age is about 1.5 years.
3.2 The Model
14
If fish encountering a hook can be described as a Poisson process, the probabilitya particular hook (loes not catch a fish can be defined as :
Longli e ano rse Seine Catch by Ag
186
-aDt)
whereP = Probability a hook has NO fish ( 1 )
a = coD = density of fisht = time hook is immersed
If the probability of catching a fish is independent between hooks, the catch on aparticular longline set will follow the binomial distribution with mean:
C = 11 (1 - P)
h in numbers of fish( 2 )
H = Nu (ofP = ility a
Two assumptions in this simple model are clearly violated. Firstly, all hooks arenot immersed for the same period. The immersion time has been modelled (Medley,1990) and it was found that the binomial still provided a good approximation to the catchdistribution. Secondly, the catch probabilities are not independent. This is mainlybecause tuna are not distributed randomly, but aggregate into schools and to areas wheretheir food is most abundant. In this case it is possible to show that where the number ofhooks is large, equation 2 is correct and the variance of the distribution is proportional tothe mean (Medley, 1990). Equation 1 need not be correct but will probably be areasonable approximation. Although the probability a hook catches a fish increases as theabundance of fish increases, the functional shape of that relationship may be differentfrom equation 1.
The model can be further developed to include the effect of bait loss and a multi-species catch. However, much data on by-catch and bait loss are not available, so it ismore sensible to propose an approximation based on the above model.
z In(ll) is)
wherec h (Poisson ( 3 )
z = hook iigteraction tenn= ii predictor of othcr
Equation 3 should provide a reasonably good description of the data if the longlinegear is not being saturated by fish. With an average catch of only 15 yellowfin per 1,000hooks, this would seem to be a reasonable assumption. Since we are dealing withnumbers of fish, which cannot fall below zero, the obvious error distribution to use is thePoisson, which has the additional feature of fixing the variance equal to the mean. This
- In
187
can be relaxed without difficulty to the more realistic quasi-likelihood assumption that thevariance is proportional to the mean (McCullagh and Nelder, 1983).
A simple yellowfin population model can be used to describe the effect of purseseine catches on longline catch per hook. Fish available to purse seine, after a delayperiod, become available to longline. For simplicity it is assumed that during the delayperiod they are not available to any gear. Hence to calculate how many of the purseseine-caught fish would have been recruited to the longline fishery, the purse-seine catchmust be discounted by the attrition rate over the appropriate delay period. This delayperiod, according to the catch size distribution, should be around 18 months.
Equation 1 can be expande,d to refer to numbers of fish rather than density, and soinclude numbers of fish removed by purse seiners.
P = Etp(-I-7(N - Soe-nt)
whereN = Pc47-sladon siw(anesiew)V = VoLnelcf w5cr koki theSo = S.13i626cI
= hJtOt raL(C= time lag i 002,5
t = hook iThIETZPSiOld thin
The basic population, N, might be modelled as a stationary stochastic process,with longliners sampling the population. This leads to a non-linear model and a greatincrease in the complexity of the fitting procedure. A simpler alternative approach, andthat adopted here, is to treat the catch itself as a stochastic process. Althoughtheoretically less appealing, such a model does take account of the high autocorrelationsin the time series while keeping the model simple. A linear model can be used to accountfor changes in the basic population size and in catchability.
zln(1-11)- e St
whereqA = jise seine impact CO
O = c -regressive paroneter (5)i = ti 3 in moralas
IIn(H1)
+ Ili -q,.51-x
yi
yi = dnFa values
N(4)
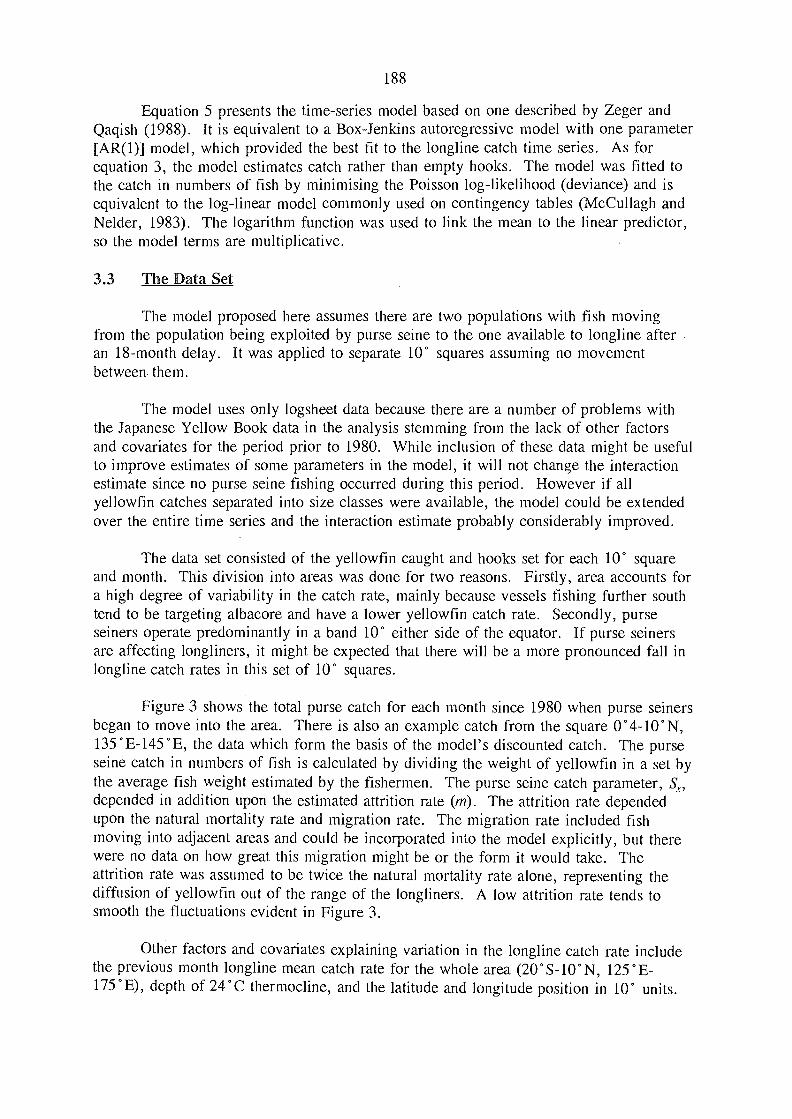
188
Equation 5 presents the time-series model based on one described by Zeger andQaqish (1988). It is equivalent to a Box-Jenkins autoregressive model with one parameter[AR(1)] model, which provided the best fit to the longline catch time series. As forequation 3, the model estimates catch rather than empty hooks. The model was fitted tothe catch in numbers of fish by minimising the Poisson log-likelihood (deviance) and isequivalent to the log-linear model commonly used on contingency tables (McCullagh andNelder, 1983). The logarithm function was used to link the mean to the linear predictor,so the model terms are multiplicative.
3.3 The Data Set
The model proposed here assumes there are two populations with fish movingfrom the population being exploited by purse seine to the one available to longline afteran 18-month delay. It was applied to separate 100 squares assuming no movementbetween them.
The model uses only logsheet data because there are a number of problems withthe Japanese Yellow Book data in the analysis stemming from the lack of other factorsand covariates for the period prior to 1980. While inclusion of these data might be usefulto improve estimates of some parameters in the model, it will not change the interactionestimate since no purse seine fishing occurred during this period. However if allyellowfin catches separated into size classes were available, the model could be extendedover the entire time series and the interaction estimate probably considerably improved.
The data set consisted of the yellowfin caught and hooks set for each 100 squareand month. This division into areas was done for two reasons. Firstly, area accounts fora high degree of variability in the catch rate, mainly because vessels fishing further southtend to be targeting albacore and have a lower yellowfin catch rate. Secondly, purseseiners operate predominantly in a band 10° either side of the equator. If purse seinersare affecting longliners, it might be expected that there will be a more pronounced fall inlongline catch rates in this set of 10° squares.
Figure 3 shows the total purse catch for each month since 1980 when purse seinersbegan to move into the area. There is also an example catch from the square 0°4-10°N,135°E-145°E, the data which form the basis of the model's discounted catch. The purseseine catch in numbers of fish is calculated by dividing the weight of yellowfin in a set bythe average fish weight estimated by the fishermen. The purse seine catch parameter, Sx,depended in addition upon the estimated attrition rate (m). The attrition rate dependedupon the natural mortality rate and migration rate. The migration rate included fishmoving into adjacent areas and could be incorporated into the model explicitly, but therewere no data on how great this migration might be or the form it would take. Theattrition rate was assumed to be twice the natural mortality rate alone, representing thediffusion of yellowfin out of the range of the longliners. A low attrition rate tends tosmooth the fluctuations evident in Figure 3.
Other factors and covariates explaining variation in the longline catch rate includethe previous month longline mean catch rate for the whole area (20°S-10°N, 125°E-175°E), depth of 24°C thermocline, and the latitude and longitude position in 10° units.
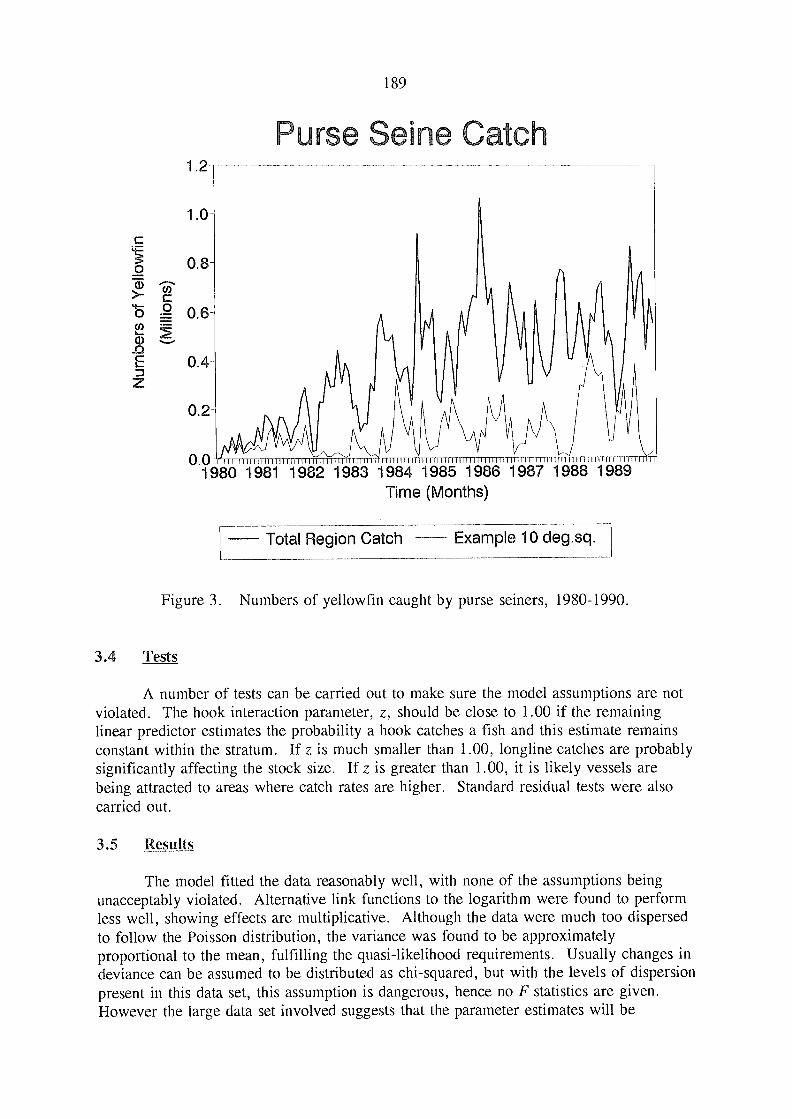
o
1.2
1.0-
0.8-
0.6
0.4-
0.2-
189
ursc Seine Ca c
0,0 111111111111111111111111111I I lili II IIIIIITTI111 HMI nm11111111 II flT
1980 1981 1982 1983 1984 1985 1986 1987 1988 1989Time (Months)
Total Region Catch Example 10 deg.sq.
Figure 3. Numbers of yellowfin caught by purse seiners, 1980-1990.
3.4 Tests
A number of tests can be carried out to make sure the model assumptions are notviolated. The hook interaction parameter, z, should be close to 1.00 if the remaininglinear predictor estimates the probability a hook catches a fish and this estimate remainsconstant within the stratum. If z is much smaller than 1.00, longline catches are probablysignificantly affecting the stock size. If z is greater than 1.00, it is likely vessels arebeing attracted to areas where catch rates are higher. Standard residual tests were alsocarried out.
3.5 Results
The model fitted the data reasonably well, with none of the assumptions beingunacceptably violated. Alternative link functions to the logarithm were found to performless well, showing effects are multiplicative. Although the data were much too dispersedto follow the Poisson distribution, the variance was found to be approximatelyproportional to the mean, fulfilling the quasi-likelihood requirements. Usually changes indeviance can be assumed to be distributed as chi-squared, but with the levels of dispersionpresent in this data set, this assumption is dangerous, hence no F statistics are given.However the large data set involved suggests that the parameter estimates will be
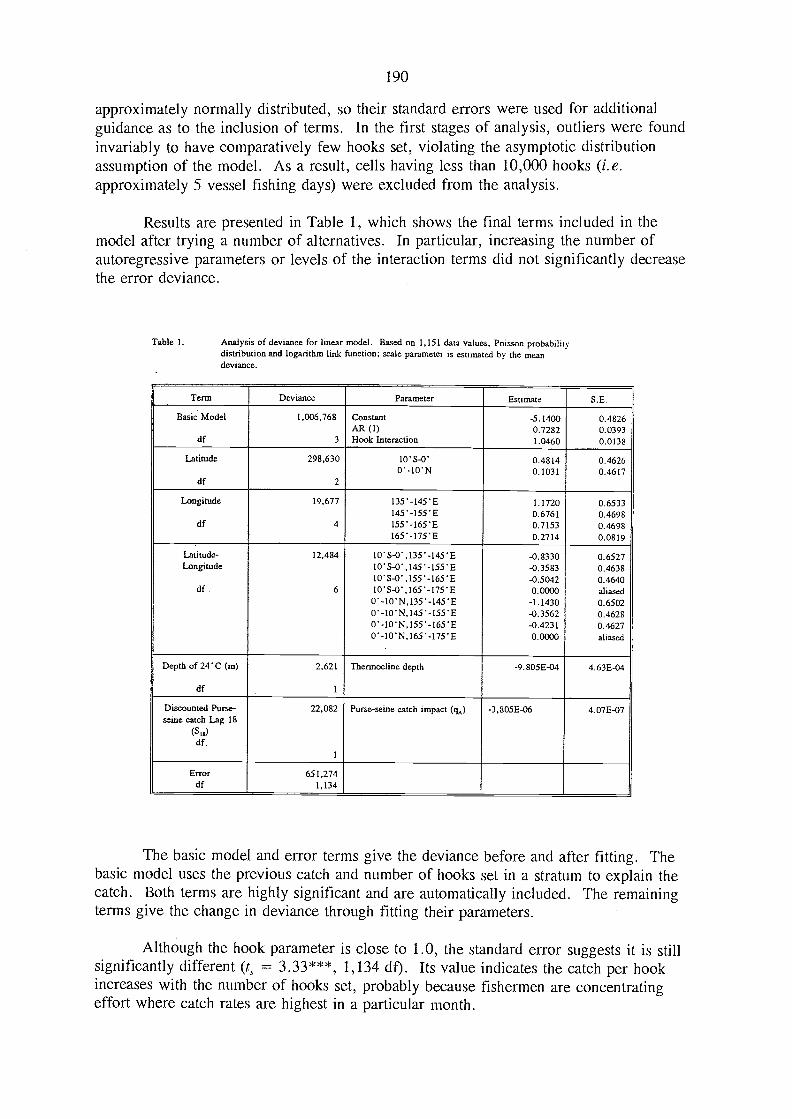
190
approximately normally distributed, so their standard errors were used for additionalguidance as to the inclusion of terms. In the first stages of analysis, outliers were foundinvariably to have comparatively few hooks set, violating the asymptotic distributionassumption of the model. As a result, cells having less than 10,000 hooks (i.e.approximately 5 vessel fishing days) were excluded from the analysis.
Results are presented in Table 1, which shows the final terms included in themodel after trying a number of alternatives. In particular, increasing the number ofautoregressive parameters or levels of the interaction terms did not significantly decreasethe error deviance.
Table 1. Analysis of deviance for linear model. Based on 1,151 data values, Poisson probabilitydistribution and logarithm link function; scale parameter is estimated by the meandeviance.
The basic model and error terms give the deviance before and after fitting. Thebasic model uses the previous catch and number of hooks set in a stratum to explain thecatch. Both terms are highly significant and are automatically included. The remainingterms give the change in deviance through fitting their parameters.
Although the hook parameter is close to 1.0, the standard error suggests it is stillsignificantly different (t, 3.33***, 1,134 df). Its value indicates the catch per hookincreases with the number of hooks set, probably because fishermen are concentratingeffort where catch rates are highest in a particular rnonth.
Term Deviance Parameter Estimate S.E.
Basic Model 1,006,768 Constsust -5.1400 0.4826AR (1) 0.7282 0.0393
df 3 Hook Interaction 1.0460 0.0138
Latitude 298,630 10'S-0' 0.4814 0.46260'-10'N 0.1031 0.4617
df 2
Longitude 19,677 135'-145'E 1.1720 0.6533145'-155"E 0.6761 0.4698
df 4 155*-165E 0.7153 0.4698165*-175E 0.2714 0.0819
Latitude- 12,484 10S-0,135.-145E -0.8330 0.6527Longitude 10'S-0 ,145*-155 'E -0.3583 0.4638
10'S-0 ,155*-165 'E -0.5042 0.4640df. . 6 10*S-0,165-175E 0.0300 aliased
0*-10N,135*-145E -1.1430 0.65020-10N,145'-155E -0.3562 0.46280'-10N,155.-165E -0.4231 0.46270'-10N,165.-175"E 0.0000 aliased
Depth of 24'C (m) 2.621 Thermocline depth -9.805E-04 4.63E-04
df 1
Discounted Purse-seine catch Lag 18
(SIOdf,
22,082
1
Purse-seine catch impact (q) -3,805E-06 4.07E-07
Error 651,274df 1,134
191
Latitude (referencing each 10° band) is clearly the most important factor after thebasic model. For all discrete factors, the estimate indicates the difference from the firstfactor class. So for latitude the estimate measures the difference from the 20°S-10°Sband, for longitude the 125°E-135°E band. The longitude and latitude-longitudeinteraction terms are much less important. These three factors together estimate the meancatch for each 10° square.
The depth of the 24°C thermocline, estimate,d for each 10° square month fromdata held at SPC, explaine,d little of the total deviance. Other oceanographic variablessuch as depth of alternative thermoclines and sea surface temperature were looked at.These variables were all heavily correlated, so only the depth of the 24°C thermocline,which gave the largest change in deviance when fit, was used.
When free-swimming schools were used in the analysis, the model did not fit thedata very well, perhaps because the impact delay is spread out much more between 24and 0 months. Catches from free-swimming schools are excluded from the analysis.Probably the only way to include data on free-swimming school catches is to split up thecatches explicitly into size classes.
The purse seine log-associated catches from 18 months previously are clearlycorrelated with the longline CPUE. Importantly, these catches explain significantly moreof the longline catch rate variation than a simple linear decline. This is because thisdecline is greatest in the region 10°N-10°S, where purse seiners operate. There is a slightincrease in catch rate outside this region. This result adds some weight to the argumentof causation.
The estimate indicates that for every 10,000 log-associated yellowfin that purseseiners catch in a 100 square, longline catch per hook will fall by between 0.3 and 0.4%18 months later. The longline catch rate will continue to be affected, but by a decreasingamount, in all months subsequent to the 18-month period.
The lag between fish being available to purse seine and then longline was tested bylooking at the change in deviance using purse seine catches at different lags. The peaksat lags 3, 18 and 32, shown in Figure 4, may relate to different sizes of fish beingexploited by purse seine. The first peak at 3 months would relate to the catch of olderfish, which has a more immediate impact on longline, the larger peak at 18 months theimpact from younger fish caught in association with logs. The final peak at 32/33months, however, is not easy to explain in this way, since the sizes caught, assuming thegrowth curve is correct, indicate this lag is too great to be explained by an exploite,dcohort passing from the surface fishery to longline. The only other explanation withinthis framework is that a stock-recruitment relationship is increasing the impact at a laterdate. Purse seine catches at different lags were highly correlated, and it was not possibleto fit them simultaneously with any confidence. There is little real evidence that thispattern is the result of the stock dynamics and not just spurious correlations in the timeseries, which makes interpretation of Figure 4 with any certainty impossible.
The results are more robust to the choice of the attrition rate than might firstappear. The attrition rate has two effects. As it increases, it reduces the number of fishwhich finally move into the population vulnerable to longline. This part is closely related

5-
o
192
to the purse-seine catch parameter (q4), hence in this respect the result is not sensitive tosize of the attrition rate. The attrition rate also controls how any month's purse seinecatch continues to affect longline catch rates. If the attrition rate is zero, any onemonth's catch would have an undiminishing effect and the purse-seine catch would simplyaccumulate in S. Effectively, this induces a trend in purse-seine catch rates and dampensfluctuations. A high attrition rate causes purse-seine catches to have an impact which diesout quickly.
o e-Purse eie moact °dellLag Deviance
0 5 10 15 20 25 30 35 40 45 50Lag (months)
Figure 4. Poisson deviance at different lags for the time series model.
4. USING THE IMPACT ESTIMATE
The model has a variety of theoretical and empirical evidence supporting it as areasonable description of longline catches. The model provides an estimate of the impactof purse seine catches based on the catch-and-effort time series for both gears. Thequestion still remains whether the measurement being made is the correct one.
The conclusion is entirely dependent on the null hypothesis. The assumption thatlongline CPUE would have been constant since 1980 if purse seine operations had notstarted has little support from the time series analysis. The main argument that thedecline is at least partly due to purse seine is based on the assumption that these gears are
30
25-
20-
3o
15-
_C
10-
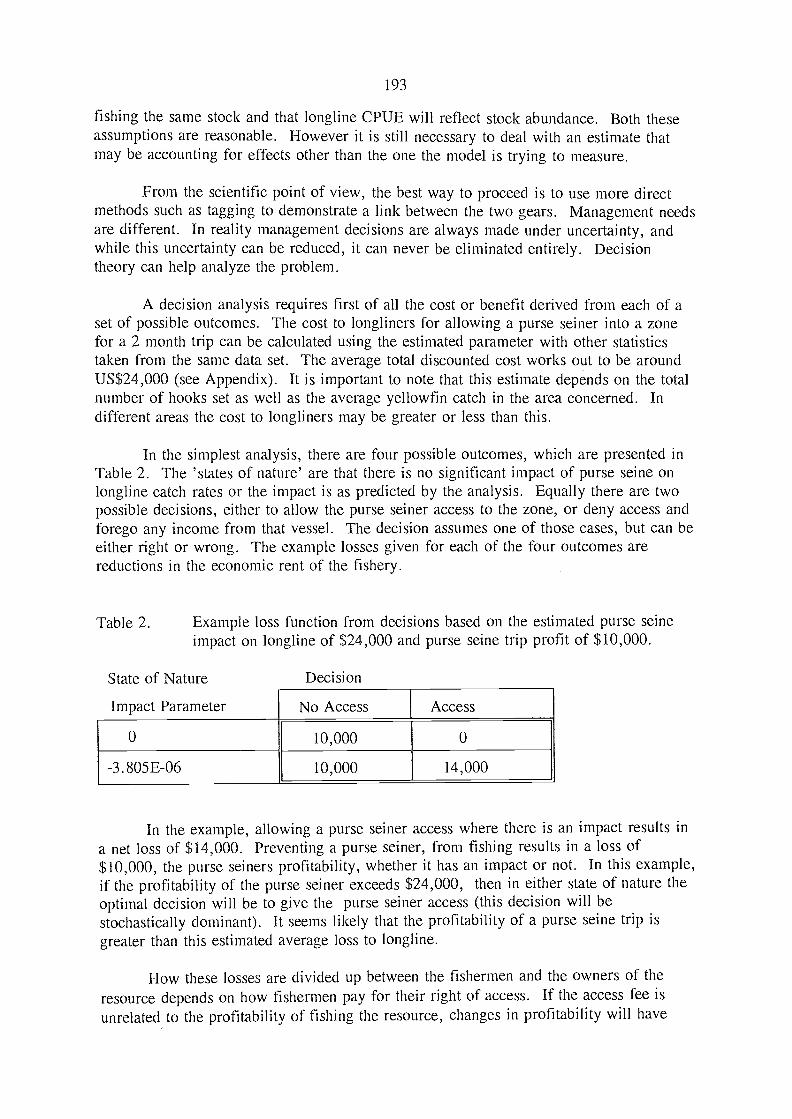
193
fishing the same stock and that longline CPUE will reflect stock abundance. Both theseassumptions are reasonable. However it is still necessary to deal with an estimate thatmay be accounting for effects other than the one the model is trying to mea.sure.
From the scientific point of view, the best way to proceed is to use more directmethods such as tagging to demonstrate a link between the two gears. Management needsare different. In reality management decisions are always made under uncertainty, andwhile this uncertainty can be reduce,d, it can never be eliminated entirely. Decisiontheory can help analyze the problem.
A decision analysis requires first of all the cost or benefit derived from each of aset of possible outcomes. The cost to longliners for allowing a purse seiner into a zonefor a 2 month trip can be calculated using the estimated parameter with other statisticstaken from the same data set. The average total discounted cost works out to be aroundUS$24,000 (see Appendix). It is important to note that this estimate depends on the totalnumber of hooks set as well as the average yellowfin catch in the area concerned. Indifferent areas the cost to longliners may be greater or less than this.
In the simplest analysis, there are four possible outcomes, which are presented inTable 2. The 'states of nature' are that there is no significant impact of purse seine onlongline catch rates or the impact is as predicted by the analysis. Equally there are twopossible decisions, either to allow the purse seiner access to the zone, or deny access andforego any income from that vessel. The decision assumes one of those cases, but can beeither right or wrong. The example losses given for each of the four outcomes arereductions in the economic rent of the fishery.
Table 2. Example loss function from decisions based on the estimated purse seineimpact on longline of $24,000 and purse seine trip profit of $10,000.
State of Nature Decision
In the example, allowing a purse seiner access where there is an impact results ina net loss of $14,000. Preventing a purse seiner, from fishing results in a loss of$10,000, the purse seiners profitability, whether it has an impact or not. In this example,if the profitability of the purse seiner exceeds $24,000, then in either state of nature theoptimal decision will be to give the purse seiner access (this decision will bestochastically dominant). It seems likely that the profitability of a purse seine trip isgreater than this estimated average loss to longline.
How these losses are divided up between the fishermen and the owners of theresource depends on how fishermen pay for their right of access. If the access fee isunrelated to the profitability of fishing the resource, changes in profitability will have
0 10,000 0
-3.805E-06 10,000 14,000
Impact Parameter No Access Access
194
little impact on the fee, decreasing any incentive to minimise the interaction. Hence alow longliner access fee will not be eroded by decreasing catch rates, and the perceivedloss in economic rent from allowing a purse seiner access by those charging the fee willbe zero even where an interaction is occurring.
Although the example presents the basic decision to be made, it is grosslyoversimplified. The method is used to demonstrate the approach and indicate howinformation might be used even where significant uncertainty exists as to its accuracy. Amore realistic analysis would make greater use of the available data.
The likelihood of the different states of nature needs to be estimated. In somecases uncertainty can be estimated, for instance the impact estimate could be assumed tofollow a normal distribution. For some uncertainty there is no a priori model, forinstance in the case whether the downward trend in longline CPUE is caused by purseseine. In these cases the value of this type of analysis is in identifying the assumptionsbeing made to derive any particular result.
The variety of states of nature may be very large indeed. In this case they shouldprobably include variability in catches, prices (particularly supply and demand), andcosts. The number of possible actions can also be increased, not only by considering thenumber of purse seiners to be given access, but also the areas in which they can fish.The simplest approach would be to repeat the decision analysis for each 10° square usingthe model estimates.
The simple decision analysis in Table 2 demonstrates the probable results if amore complicated analysis was undertaken. Given an equal chance for either state ofnature, allowing a purse seiner to fish results in a smaller expected loss but greatervariability in income. To maximise profit purse seine would dominate longline as themore profitable gear. If there is an interaction between the gears, longline wouldeventually be driven out of the fishery. However for a risk-aversive decision-maker,longline may be the optimum choice. Since longline exploits a different stock (separatedin time) and uses a different market, longline may have an important role in providinggreater stability in the economics of the fishery.
5. REFERENCES CITED
Au, D. 1983. Production model analysis of the Atlantic yellowfin tuna (Thunnusalbacares) fishery. Collect.Vol.Sci.Pap.ICCAT, 18:177-196.
Cole, J.S. 1980. Synopsis of biological data on the yellowfin tuna, Thunnus albacares(Bonnaterre, 1788), in the Pacific Ocean. In Synopsis of biological data on eight speciesof scombrids, p. 71-150, edited by W.H. Bayliff. Spec.Rep.I-ATIC, 2.
Fonteneau, A. and T. Diouf. 1983. Analyse de l'etat des stocks d'albacore del'Atlantique au September 1982. Coll.Vol.Sci.Pap.ICCAT, 18:197-204.
IA I I C. 1979. Annual report of the Inter-American Tropical Tuna Commission - 1978.Annu.Rep.I-AITC, (1978):163 p.
195
IA1 I C. 1980. Annual report of the Inter-American Tropical Tuna Commission - 1979.Annu.Rep.I-ATTC, (1979):227 p.
IATTC. 1981. Annual report of the Inter-American Tropical Tuna Commission - 1980.Annu.Rep.I-AnC, (1980):234 p.
IAFIC. 1982. Annual report of the Inter-American Tropical Tuna Commission - 1981.Annu.Rep.I-ATTC, (1981):303 p.
McCullagh, P. and J.A. Nelder. 1983. Generalized Linear Models (Monographs onstatistics and applied probability). Chapman and Hall.
Medley, P.A.H. (1990). Interaction between longline and purse seine in the south-westPacific tuna fishery. PhD Thesis, Imperial College, London.
Polacheck, T. 1988. Yellowfin tuna, Thunnus albacares, catch rates in the westernPacific. Fish.Bull.NOAA-NMFS, 87:123-44.
SPC. 1988. Investigations on Western Pacific Yellowfin Fishery Interaction Using Catchand Effort Data. Paper presented at the Twentieth Regional Technical Meeting onFisheries, S.Pac.Comm., New Caledonia, 1-5 August 1988, WP/17.
Suzuki, Z. 1985. Interaction study on yellowfin stock between longline and purse seinefisheries in the western Pacific. Intio-Pac.Tuna Dev.Mgt.Programme, TWS/85126.
Suzuki, Z. 1988. Study of interaction between longline and purse seine fisheries onyellowfin tuna, Thunnus albacares (Bonnaterre). Bull.Far Seas Fish.Res.Lab., 25:73-136.
Wild, A. 1986. Growth of yellowfin tuna, Thunnus albacares, in the Eastern PacificOcean based on otolith increments. Bull.I-ATTC, 18(6).
Wright, A. Research Coordinator, Forum Fisheries Agency.
Zeger, S.L., Qaqish, B. 1988. Markov regression models for time series: A quasi-likelihood approach. Biometrics, 44: 1019-31.

196
Appendix
To calculate statistics useful in assessing the impact of purse seiners on longliners, someparameters must be estimated from the data set or from other sources.
Parameter Estimates
Although a great deal of effort was put into estimating the interaction parameter (qA), allother estimates were derived as approximations to demonstrate the working.
Average number of longline hooks in a 10* square month = H = 388,419
Probability a longline hook catches a yellowfin = X = 0.015
Average number of yellowfin taken on a purse seine (2-month) trip = C 17,877
Average longline yellowfin weight = Wyt- = 26.5 kg
Average longline yellowfin price = Pyf = US$4 /kg
Natural monthly attrition rate = M = 1.6/12 = 0.1333
Monthly discount rate = d = -Ln(0.9)/12 = 0.00878 (10% interest rate)
Impact estimate from the linear model = qA = -3.805*10'
Discounted purse seine catch = S18
Time lag = 18 months
Calculations
a) The first month's impact from the loss of C caught by purse seiners 18months before can be calculate,d. The impact is the decline in the catch per hook oflongline after the time lag (U.
/18 - Exp( -qA * S18)
The reduction in the population size from the purse seine catch (S18) is the original catchdiscounted by the attrition rate.
S18 Cyf* Exp(-18*M)
For example, if purse seiners had caught 10,000 yellowfin, the impact on longline is asfollows.
S18 = 10000 * Exp( -18 * 0.1333) = 907.234
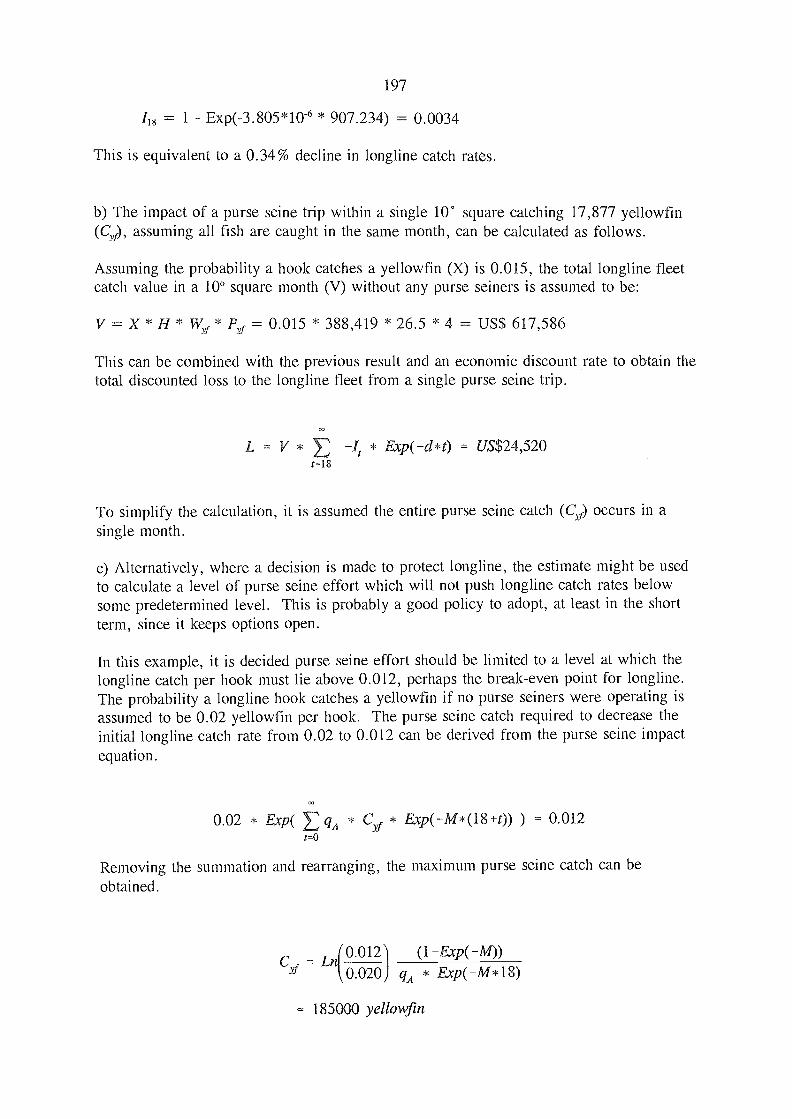
197
118 = 1 - Exp(-3.805*10-° * 907.234) = 0.0034
This is equivalent to a 0.34% decline in longline catch rates.
b) The impact of a purse seine trip within a single 100 square catching 17,877 yellowfin(Ce), assuming all fish are caught in the same month, can be calculated as follows.
Assuming the probability a hook catches a yellowfin (X) is 0.015, the total longline fleetcatch value in a 100 square month (V) without any purse seiners is assumed to be:
V = X * H * Wyf * Pyf = 0.015 * 388,419 * 26.5 * 4 = US$ 617,586
This can be combined with the previous result and an economic discount rate to obtain thetotal discounted loss to the longline fleet from a single purse seine trip.
09
- 185000 yellowfin
* Exp(-d*t) = US$24,520
To simplify the calculation, it is assumed the entire purse seine catch (CO occurs in asingle month.
c) Alternatively, where a decision is made to protect longline, the estimate might be usedto calculate a level of purse seine effort which will not push longline catch rates belowsome predetermined level. This is probably a good policy to adopt, at least in the shortterm, since it keeps options open.
In this example, it is decided purse seine effort should be limited to a level at which thelongline catch per hook must lie above 0.012, perhaps the break-even point for longline.The probability a longline hook catches a yellowfin if no purse seiners were operating isassumed to be 0.02 yellowfin per hook. The purse seine catch required to decrease theinitial longline catch rate from 0.02 to 0.012 can be derived from the purse seine impactequation.
CO
0.02 * Exp( E qA * C Exp(-M*(18+t)) ) = 0.012r=o
Removing the summation and rearranging, the maximum purse seine catch can beobtained.
0.012 \ (1-E.xp(-M))0.020 q A * Exp(-M * 18)

198
Assuming a purse seiner on average catches around 17877 yellowfin every 2 months, thisworks out as a level of effort within a 10° square of approximately 21 vessels per month.Hence no more than 20 vessels should be given access to a 10° square area if thismanagement objective is to be achieved.
3) Notes
It is worth setting the calculations up in a spreadsheet to see how sensitive they are todifferent parameter values. However, neither the delay (18 months) or the attrition rate(0.133) should be altered, since they were involved in the estimation process. It is alsobest to use the purse seine average catch per trip as calculated from the data set used forthe estimation, otherwise the final result may be biased. If these parameters are changed,the impact term would have to be reestimated.
199
INTERACTION IN THE YELLOWFIN TUNA FISHERIESOF THE EASTERN PART OF IONESIAN WATERS
Nurzali Naamin and Sofri BaharResearch Institute for Marine Fisheries
Jakarta, Indonesia
ABSTRACT
Possible interactions in the yellowfin tuna fisheries of the eastern part ofIndonesian waters was examined. There are two groups of interaction occur betweenfisheries: (1) interaction with other species, and (2) interaction among fishing gears. Thedata imply that there is interaction between stock of yellowfin tuna in the western Pacificand the stock in northeastern Indonesian waters, and there is very weak evidence ofpossible interactions between western Pacific and Indian Ocean stocks.
In eastern Indonesian waters yellowfin caught by longlining were frequentlyassociated with bigeye and albacore catches. Based on available data, interactions amongthe four types of fishing gears use,d for catching yellowfin (longline, purse seine,handline, and pole and line) could not significantly be detected.
. INTRODUCTION
Traditionally, the centre of the Indonesian tuna industry is the eastern part ofIndonesian waters (EIW). The region accounts for about 80% of the Indonesian tunacatch, and about 80-95% of the tuna exported from Indonesia comes from this area. Thisdominant position has changed since 1986, at least as far as fresh tuna for sashimi exportfishery is concerned, with the Indian Ocean, particularly south of Java and west ofSumatra, accounting for most of the catch.
The EIW is a vast region of over 3 million km2 making up about 52% of the 5.8million km2 of Indonesia's Exclusive Economic Zone (EEZ). The EIW region can bebroken down into four major fishing areas or fishing bases: the northern part of theLesser Sunda Islands (Bali, West Nusa Tenggara, East Nusa Tenggara, East Timor);Sulawesi; Mollucas; and Irian Jaya. Four types of fishing gears exploit tuna resources inthe EIW: longline, purse seine, pole and line, and handline. Some other fishing gearcategorized as unclassified that also catch tuna incidentally are troll line, payang (danishseine), and gillnet.
There are four species of tuna caught in the EIW: yellowfin (Thunnus albacares),bigeye (T. obesu.v), albacore (T. alalunga), and southern bluefin tuna (T. maccoyii).Among these species, yellowfin dominates the catch. The percentage of yellowfin caughtby the above-mentioned fishing gears ranges from 50 to 95%, 5 to 15%, and 25 to 75%,for the longline, pole-and-line, and purse-seine fisheries, respectively. This paperreviews the resources and fisheries associated with yellowfin tuna in the eastern part ofIndonesian waters and introduces the possibility of interaction among the fisheries.
FAO LIBRARY AN: 346129
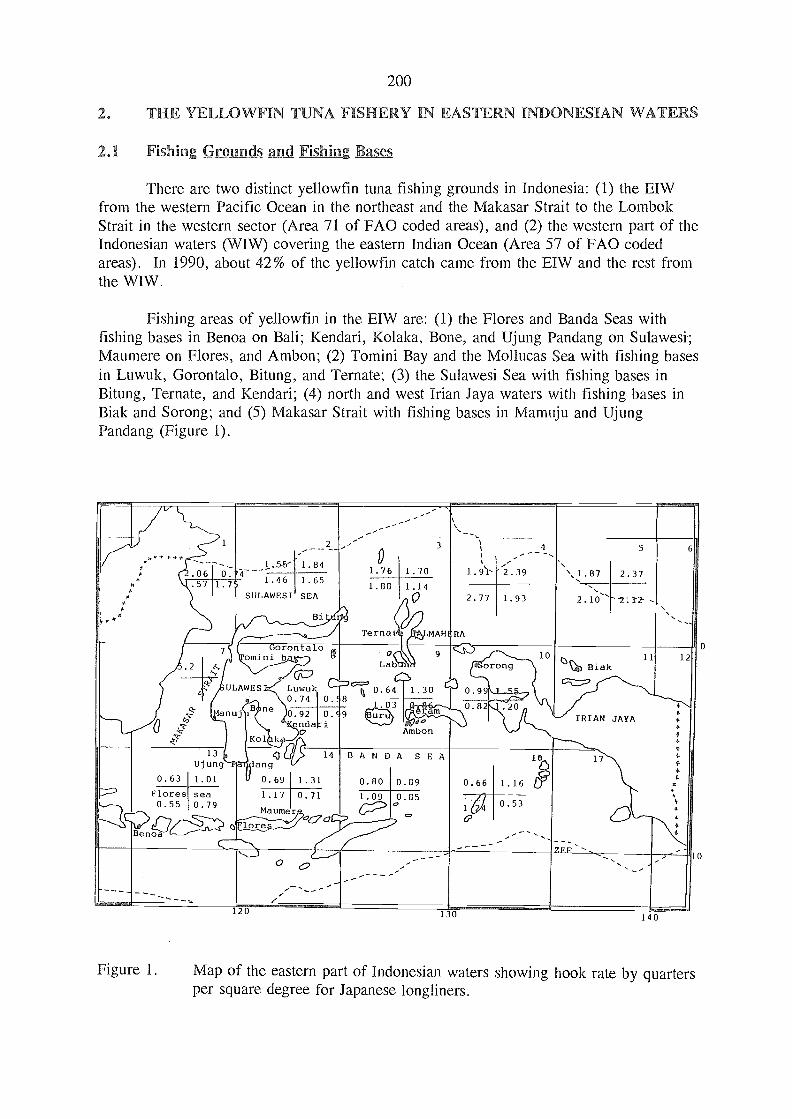
There are two distinct yellowfin tuna fishing grounds in Indonesia: (1) the EIWfrom the western Pacific Ocean in the northea.st and the Makasar Strait to the LombokStrait in the western sector (Area 71 of FAO coded areas), and (2) the western part of theIndonesian waters (WIW) covering the eastern Indian Ocean (Area 57 of FAO codedareas). In 1990, about 42% of the yellowfin catch came from the EIW and the rest fromthe WIW.
Fishing areas of yellowfin in the EIW are: (1) the Flores and Banda Seas withfishing bases in Benoa on Bali; Kendari, Kolaka, Bone, and Ujung Pandang on Sulawesi;Maumere on Flores, and Ambon; (2) Tomini Bay and the Mollucas Sea with fishing basesin Luwuk, Gorontalo, Bitting, and Ternate; (3) the Sulawesi Sea with fishing bases inBitung, Ternate, and Kendari; (4) north and west Irian Jaya waters with fishing bases inBiak and Sorong; and (5) Makasar Strait with fishing bases in Mamuju and UjungPandang (Figure 1).
Flores sea0.55 0.79
BenC)
1.844
.46 1.65
SULAWESI SEA
oron a oomini b
Lab
Maumer
.76 1.70
Terna
0.64I 1.30rULAWES C :::7Luwuk0.74 O. 84t-B n .03
V anu 0.92 0.690) 400V ndari
4c AmbonA7 Ko k
13 4) 14 BANDA SEAUjung ang
0.63 1.01 0.69 1.31 0.80 0.89
orong
0.66 1.16
\ 1.87
Biak
IRIAN JAYA
7
Figure 1. Map of the eastern part of Indonesian waters showing hook rate by quartersper square degree for Japanese longliners.
200
2. THE YELLOWFIN T A FISHERY IN EASTE ONESIAN WATERS
2.1 Fishing Grounds and Fishing Bases
201
2.2. Fishing Methods, Fishing Gears, and Fishing Fleet
There are four types of fishing gears used to catch yellowfin tuna in the EIW:longline, purse seine, pole and line, and hand line.
2.2.1 Longline
The longline fishery for yellowfin in the EIW was started by Japanese fishermenin 1952. Longline fishing was first carried out in the western Pacific Ocean; the fishinggrounds expanded to the Banda Sea and the Indian Ocean during the period 1952-1954.
Indonesian tuna longline fishing in EIW began in 1972. A state enterprise was setup with a 900 mt cold-storage facility in Benoa, Bali. There were 39 longliners in 1982;20 of these longliners were operated by the state fishing company based in Bali while theothers were newly introduced and operated from bases in Ambon and Bitung, fishing inthe Banda Sea. All of the vessels of the state fishing company are the same type; theyrange in size from 110 to 115 GT and have engines of 370 - 400 HP, a 40-ton fish-holdcapacity, and a two tons/day freezing capacity. The tuna longline fishery has developedrapidly since 1985 due to the demand for fresh tuna especially in Japan. This rapidgrowth can be seen from the remarkable increase in the number of longliners from 18 in1975 to 151 in 1990. In addition to the demand for fresh tuna, the government ofIndonesia invites foreign investors to develop tuna fisheries in Indonesia's EEZ. By theend of 1989 there were about 598 foreign vessels operating in Indonesia's EEZ; thevessels consisted of 341 longliners, 16 purse seiners, 79 gillnetters, 155 trawlers, and 7trappers.
The size of boats use,d for large- or deep-longline fishing based in Benoa, UjungPandang, Kendari, Bitung, Ambon, and Biak ranges from 90 to 400 GT. The crew sizeranges from 16 to 30 fishermen and the trip duration ranges from 14 to 140 days. Theconventional or common longline and monofilament longline fishing vessels based inBenoa, Bitting, and Biak are from 30 to 100 GT, operate with 10-16 fishermen, and havetrip durations of around 10 to 15 days. The size of boats used for mini-longline fishingbased in Benoa and Maumere ranges from 3 to 30 GT. They carry ten fishermen andhave a trip duration of around 7 days.
2.2.2 Purse seine
Indonesia began tuna purse-seine fishing in the EIW in 1980. An Indonesian-Japan joint-venture fishing company operated a base in Ternate from 1980 to 1982 usinga 600-GT purse seiner. A joint-venture company formed by Indonesian and Frenchinterests was established in 1983 with Biak as its fishing base. It operated two purseseiners of 600 GT and 750 GT and fished grounds north of Irian Jaya and in the westernPacific Ocean. In 1990 this joint-venture company was sold to an Indonesian privatefishing company, PT Nelayan Bhakti.
Japanese purse seiners commenced operation in tropical areas of the westernPacific Ocean north of Irian Jaya and Papua New Guinea (PNG) in 1970. The purseseiners were mostly 500-GT vessels with a 400-ton fish-hold capacity. The catchconsisted of 70% skipjack, 6% yellowfin, and 4% bigeye. Until 1974, the fishing
202
grounds north of Irian Jaya and PNG were exploited only from December to March, butsince 1976 fishing occurs year-round. The three types of fish schools encountered are (1)those found with drifting logs, (2) those associated with sharks or whales, and (3) schoolsassociated with birds (Marcille et al., 1984).
2.2.3 Pole and line
Although skipjack is the target species of the pole-and-line fishery, yellowfin isalso caught in small amounts, making up 5-15% of the pole-and-line catch. The twopole-and-line fisheries are (1) the artisanal pole-and-line fishery based in Biak, Sorong,Ambon, Ternate, Labuha, Bitung, Gorontalo, Luwuk, Kendari, Kolaka, and Maumere;and (2) the large-scale pole-and-line fishery, run by the state enterprise and a privatefishing company and based in Biak, Sorong, Ambon, Bitung, Kendari, and Maumere.
Due to the problem of availability of livebait, the pole-and-line fisheries have beenusing payaos as fish-aggregating devices (FADs) since 1985. The use of payaos makepole-and-line fishing more efficient, e.g., it reduces the amount of livebait used and alsoreduces fuel consumption (Naamin and Chong, 1987).
2.2.4 Handline
Handline fishing is carried out by artisanal fishermen in Tomini Bay and MakassarStrait around "rompongs." The rompong is a traditional deep-water payao made of abamboo raft and using rattan as line, stone as anchor, and coconut leaves as attractors.Yellowfin is a target species of this fishery. The catch consists of small-size (10-30 kg)yellowfin, which make up 25 to 75% of the total catch (Nasution et al., 1986).
2.3 Catch and Effort
Catch of yellowfin tuna by type of fishing gear in the EIW (FAO statistical Area71) is given in Table 1. Table 1 shows a trend of increasing catch of yellowfin tuna inthe EIW since 1970.
Long time series of catch-and-effort data are available for the Japanese longlinefishery for 1967-1981 (Table 2) and the state enterprise (PT Samodera Besar) operationfor 1980-1990 (Table 3). Annual effort (number of hooks) of the Japanese longlinefishery for all Indonesian waters (Areas 57 and 71) ranged between 5.6 and 24.6 millionhooks; the yellowfin catch ranged from 55.4 to 76.9% or from 40,210 mt (1972) to249,100 mt (1978). Annual effort in the Indonesian longline fishery ranged between62,000 and 2.9 million hooks and the catch between 21 mt and 1,108 mt (Table 3). Thevery low effort in 1986 was due to only five longliners operating for three months.
Catch data for Japanese purse seiners in 1970-1979 are given in Table 4. Thecatch consisted of 26% yellowfin. Besides large-size (20-50 kg) yellowfin the purse seinealso caught small amounts of small-size yellowfin (4-6 kg). Total yellowfin catchesincreased from only 123 mt in 1970 to 10,000 mt in 1979. Data on monthly effort(number of trips, days at sea per trip, number of effective fishing days per trip, andnumber of sets per trip) from May 1979 to April 1980 are given in Table 5.
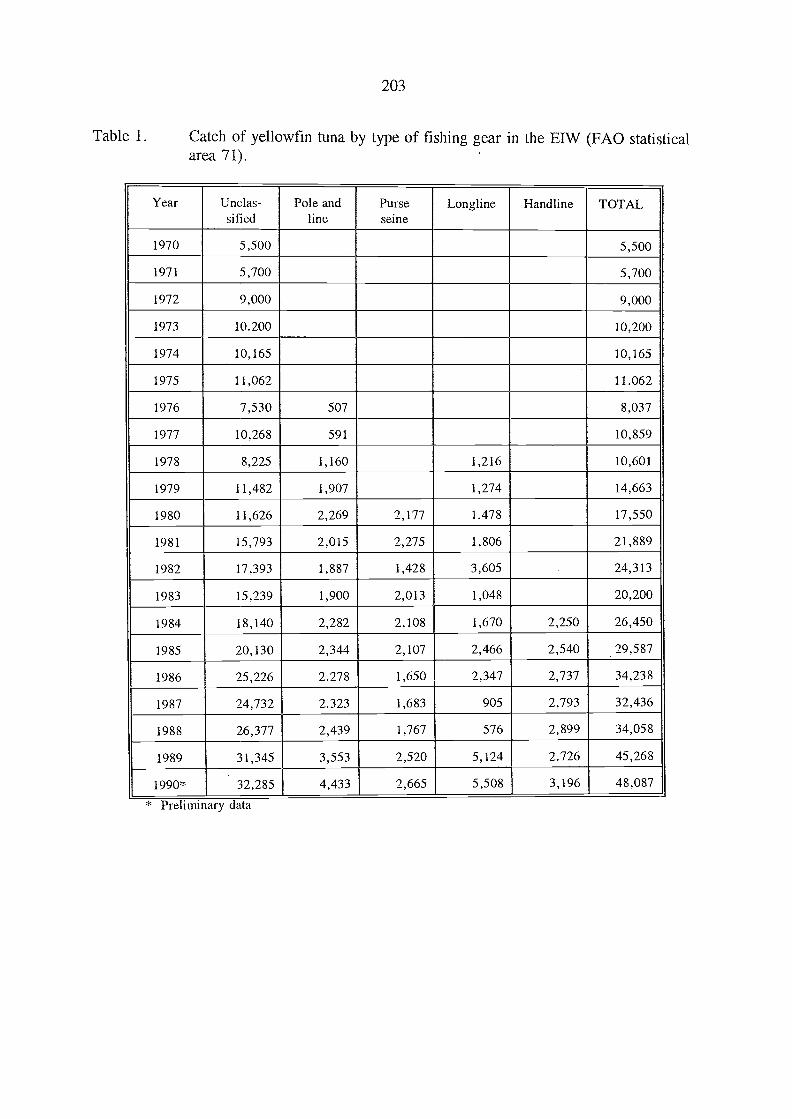
* Preliminary data
203
Table 1. Catch of yellowfin tuna by type of fishing gear in the EIW (FAO statisticalarea 71).
Year Unclas-sified
Pole andline
Purseseine
Longline Handline TOTAL
1970 5,500 5,500
1971 5,700 5,700
1972 9,000 9,000
1973 10.200 10,200
1974 10,165 10,165
1975 11,062 11.062
1976 7,530 507 8,037
1977 10,268 591 10,859
1978 8,225 1,160 1,216 10,601
1979 11,482 1,907 1,274 14,663
1980 11,626 2,269 2,177 1.478 17,550
1981 15,793 2,015 2,275 1,806 21,889
1982 17,393 1,887 1,428 3,605 24,313
1983 15,239 1,900 2,013 1,048 20,200
1984 18,140 2,282 2,108 1,670 2,250 26,450
1985 20,130 2,344 2,107 2,466 2,540 29,587
1986 25,226 2.278 1,650 2,347 2,737 34,238
1987 24,732 2.323 1,683 905 2,793 32,436
1988 26,377 2,439 1,767 576 2,899 34,058
1989 31,345 3,553 2,520 5,124 2.726 45,268
1990* 32,285 4,433 2,665 5,508 3,196 48,087
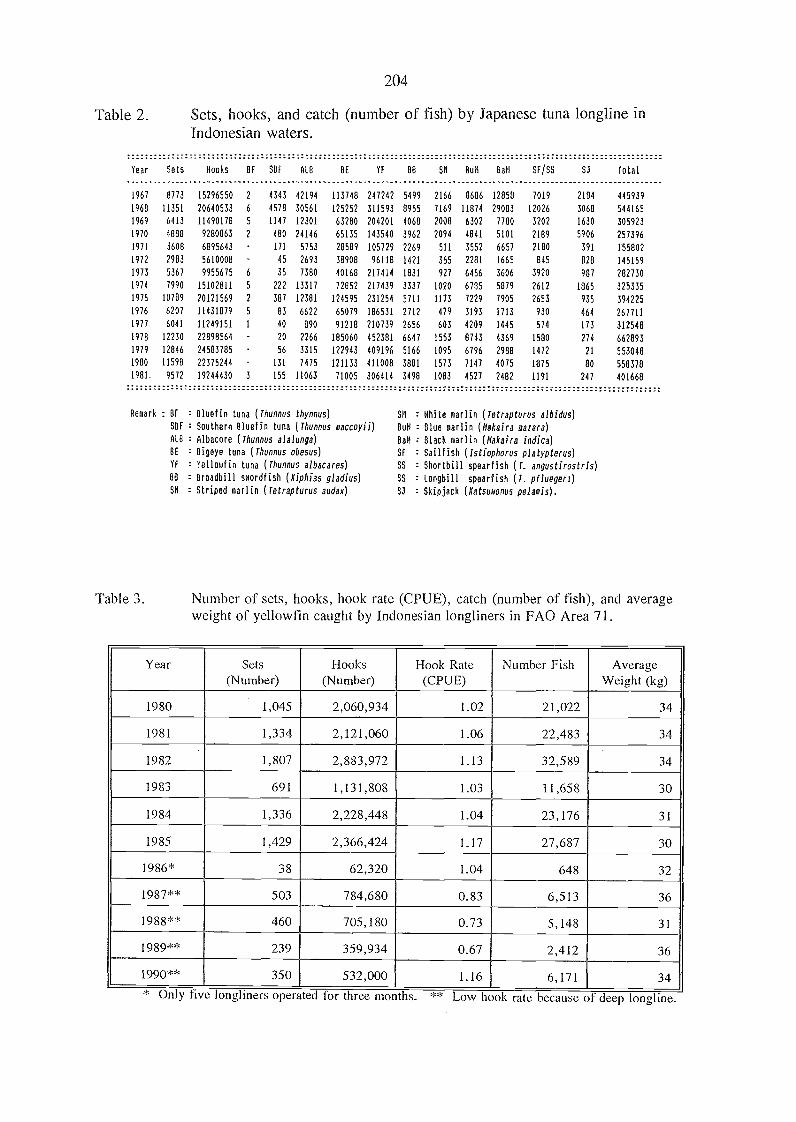
204
Table 2. Sets, hooks, and catch (number of fish) by Japanese tuna longline inIndonesian waters.
Remark : BF : Bluefin tuna (Thunnus thynnus)
SBF : Southern Bluefin tuna (Minos saccoyii)
ALB : Albacore (Thunnus alalunga)
BE : Bigeye tuna (Thunnus obesas)
YF Yellowfin tuna (Thunnus a)bacares)
BO : Broadbill swordfish (Xiphias gladius)
SM : Striped marlin (1etrapturus audax)
SM : White marlin (Tetrapturus albidus)
INN : Blue marlin (Nakaira ¡larva)
: Black marlin (Makaira indica)
SI : Sailfish (1stiophorus platypterus)
SS : Shortbill spearfish (F. angustirostris)
SS : Longbill spearfish (T. pfluegeri)
SI Skipjack (Katsumonus pelalis).
Table 3. Number of sets, hooks, hook rate (CPUE), catch (number of fish), and averageweight of yellowfin caught by Indonesian longliners in FAO Area 71.
n y rive longliners operated tor t ree mont s. * Low h ok rate because of deep longline.
Year Sets(Number)
Hooks(Number)
Hook Rate(CPUE)
Number Fish AverageWeight (kg)
1980 1,045 2,060,934 1.02 21,022 34
1981 1,334 2,121,060 1.06 22,483 34
1982 ' 1,807 2,883,972 1.13 32,589 34
1983 691 1,131,808 1.03 11,658 30
1984 1,336 2,228,448 1.04 23,176 31
1985 1,429 2,366,424 1.17 27,687 30
1986* 38 62,320 1.04 648 32
1987** 503 784,680 0.83 6,513 36
1988** 460 705,180 0.73 5,148 31
1989** 239 359,934 0.67 2,412 36
1990** 350 532,000 1.16 6,171 34
Year Sets Hooks BF SBF ALB BE YF BO SW BuM BaM SI/SS SJ Total
1967 8773 15296550 2 4343 42194 113748 247242 5499 2166 8686 12858 7019 2184 445939
1968 11351 20640533 6 4578 30561 125252 311593 8955 7169 11874 29083 12026 3068 544165
1969 6413 11490178 5 1147 12301 63280 204201 4068 2008 6302 7780 3202 1630 305923
1970 4888 9280863 2 480 24146 65135 143540 3962 2094 4841 5101 2189 5906 257396
1971 3608 6895643 - 171 5753 28589 105729 2269 511 3552 6657 2180 391 155802
1972 2983 5610008 - 45 2693 38908 96118 1421 355 2281 1665 845 828 145159
1973 5367 9955675 6 35 7380 40168 217414 1831 927 6456 3606 3920 987 282730
1974 7990 15102811 5 222 13317 72852 217439 3337 1020 6785 5879 2612 1865 325335
1975 10789 20121569 2 387 12381 124595 231254 5711 1173 7229 7905 2653 935 394225
1976 6207 11431879 5 83 6622 65079 186531 2712 479 3193 1713 930 464 267711
1977 6041 11249151 1 40 890 91218 210739 2656 603 4209 1445 574 113 312548
1978 12230 22898564 - 20 2266 185060 452381 6647 1553 8743 4369 1580 274 662893
1979 12846 24583785 - 56 3315 122943 409196 5166 1095 6796 2988 1472 21 553048
1980 11598 22375244 131 7475 121133 411008 3881 1573 7147 4075 1875 80 558378
1981. 9572 19244430 3 155 11063 71005 306414 3490 1083 4527 2482 1191 247 401668
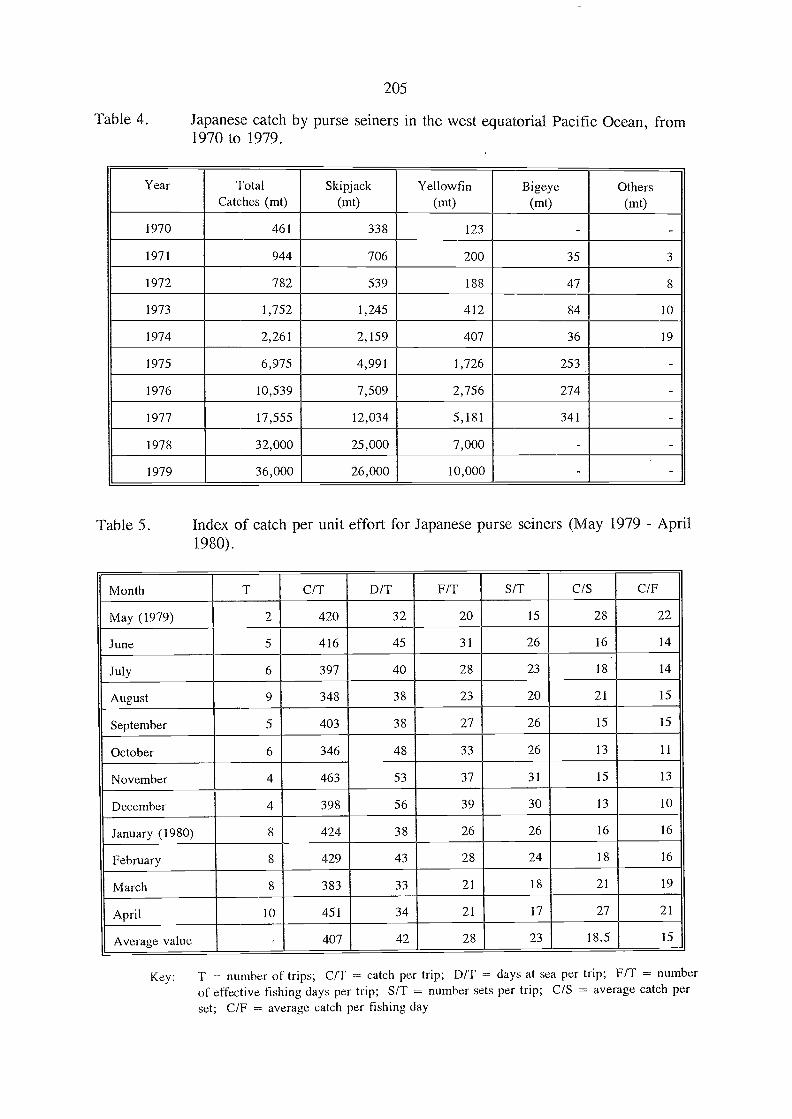
205
Table 4. Japanese catch by purse seiners in the west equatorial Pacific Ocean, from1970 to 1979.
Table 5. Index of catch per unit effort for Japanese purse seiners (May 1979 - April1980).
Key: T = number of trips; C/T = catch per trip; D/T =- days at sea per trip; F/T number
of effective fishing days per trip; S/T = number sets per trip; C/S = average catch perset; C/F = average catch per fishing day
Year TotalCatches (mt)
Skipjack(mt)
Yellowfin(mt)
Bigeye(mt)
Others(mt)
1970 461 338 123 - -
1971 944 706 200 35 3
1972 782 539 188 47 8
1973 1,752 1,245 412 84 10
1974 2,261 2,159 407 36 19
1975 6,975 4,991 1,726 253 -
1976 10,539 7,509 2,756 274 -
1977 17,555 12,034 5,181 341 -
1978 32,000 25,000 7,000 - -
1979 36,000 26,000 10,000 - -
Month T C/T D/T F/T S/T C/S C/F
May (1979) 2 420 32 20 15 28 22
June 5 416 45 31 26 16 14
July 6 397 40 28 23 18 14
August 9 348 38 23 20 21 15
September 5 403 38 27 26 15 15
October 6 346 48 33 26 13 11
November 4 463 53 37 31 15 13
December 4 398 56 39 30 13 10
January (1980) 8 424 38 26 26 16 16
February 8 429 43 28 24 18 16
March 8 383 33 21 18 21 19
April 10 451 34 21 17 27 21
Average value 407 42 28 23 18.5 15
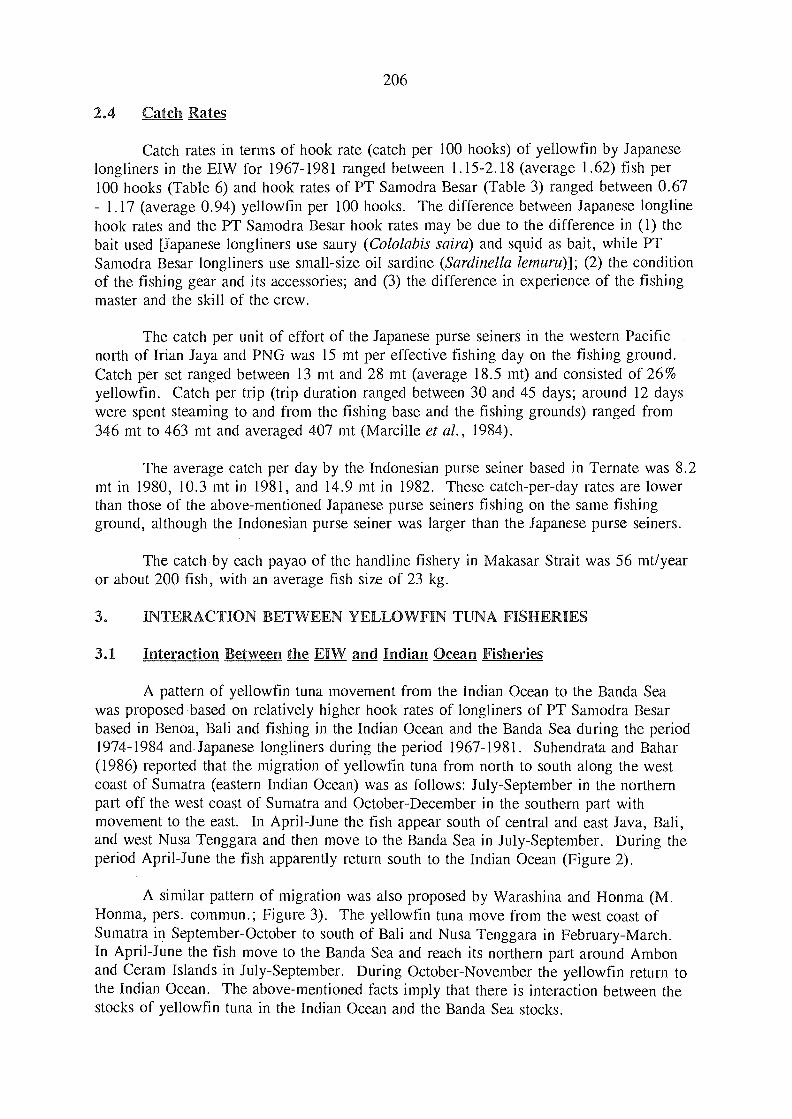
2.4 Catch Rates
Catch rates in terms of hook rate (catch per 100 hooks) of yellowfin by Japaneselongliners in the EIW for 1967-1981 ranged between 1.15-2.18 (average 1.62) fish per100 hooks (Table 6) and hook rates of PT Samodra Besar (Table 3) ranged between 0.67- 1.17 (average 0.94) yellowfin per 100 hooks. The difference between Japanese longlinehook rates and the PT Samodra Besar hook rates may be due to the difference in (1) thebait used [Japanese longliners use saury (Cololabis saira) and squid as bait, while PTSamodra Besar longliners use small-size oil sardine (Sardinella lemuru)]; (2) the conditionof the fishing gear and its accessories; and (3) the difference in experience of the fishingmaster and the slcill of the crew.
The catch per unit of effort of the Japanese purse seiners in the western Pacificnorth of Irian Jaya and PNG was 15 mt per effective fishing day on the fishing ground.Catch per set ranged between 13 mt and 28 mt (average 18.5 mt) and consisted of 26%yellowfin. Catch per trip (trip duration ranged between 30 and 45 days; around 12 dayswere spent steaming to and from the fishing base and the fishing grounds) ranged from346 mt to 463 mt and averaged 407 mt (Marcille et al., 1984).
The average catch per day by the Indonesian purse seiner based in Ternate was 8.2mt in 1980, 10.3 mt in 1981, and 14.9 mt in 1982. These catch-per-day rates are lowerthan those of the above-mentioned Japanese purse seiners fishing on the same fishingground, although the Indonesian purse seiner was larger than the Japanese purse seiners.
The catch by each payao of the handline fishery in Makasar Strait was 56 mt/yearor about 200 fish, with an average fish size of 23 kg.
3. INTERACTION BETWEEN YELLOWFIN TUNA FISHERIES
3.1 Interaction Between the EIW and Indian Ocean Fisheries
206
A pattern of yellowfin tuna movement from the Indian Ocean to the Banda Seawas proposed based on relatively higher hook rates of longliners of PT Samodra Besarbased in Benoa, Bali and fishing in the Indian Ocean and the Banda Sea during the period1974-1984 and.Japanese longliners during the period 1967-1981. Suhendrata and Bahar(1986) reported that the migration of yellowfin tuna from north to south along the westcoast of Sumatra (eastern Indian Ocean) was as follows: July-September in the northernpart off the west coast of Sumatra and October-December in the southern part withmovement to the east. In April-June the fish appear south of central and east Java, Bali,and west Nusa Tenggara and then move to the Banda Sea in July-September. During theperiod April-June the fish apparently return south to the Indian Ocean (Figure 2).
A similar pattern of migration was also proposed by Warashina and Honma (M.Honma, pers. commun.; Figure 3). The yellowfin tuna move from the west coast ofSumatra in September-October to south of Bali and Nusa Tenggara in February-March.In April-June the fish move to the Banda Sea and reach its northern part around Ambonand Ceram Islands in July-September. During October-November the yellowfin return tothe Indian Ocean. The above-mentioned facts imply that there is interaction between thestocks of yellowfin tuna in the Indian Ocean and the Banda Sea stocks.

1967 YF 2.87 2.76 1.30 2.17 1.77 1.47 2.11 1.19 1.64 1.55 1.12 2.07 2.08 2.09 2.18 2.23BE 0.21 0.26 0.20 0.28 0.28 0.32 0,40 0.77 0.46 0.65 0.10 0.12 0.70 0.55 0.55 0.94
1968 YF 3.95 2.98 1.34 2.18 2.12 1.75 2.30 1.52 1.62 1.74 1.32 2.31 1.34 1.60 1.49 1.70
BE 0.21 0.41 0.22 0.46 0.33 0.36 0.07 0.60 0.41 0.44 0.29 0.18 0.52 0.32 0.54 0.46
1969 YF 2.42 2.07 1.69 1.65 1.35 2.78 1.83 2,16 3.12 1.37 0.90 2.41 2.04 1.90 0.62
BE 0.22 0.27 0.18 0.16 0.39 0.39 0.69 0.56 0.63 0.08 0.02 0.66 0.49 0.39 0.45
1970 YF 1.41 1.60 1,86 1.11 2.11 1.95 1.79 1.74 1.84 0.41 1.12 2.19 2.10 1.81 2.36
BE 0.34 0.27 0.21 0.20 0.33 0.21 0.21 0.29 0,45 0.17 0.04 0.82 0.45 0.39 0.27
1971 YF 1.89 0.96 1.80 2.85 2.90 1.82 1.55 1.58 2.34 2.59 1.03 1.34 1.19 1.43
BE - 0.52 0.12 0.34 0.39 0.33 0.36 0.40 0.06 0.09 0.61 0.32 0.35 0.39
1972 YF - 1.74 1.74 1.67 1.56 1.24 1.74 1.34 2.32 3.18 1.75 5.19 2.24 1,33
BE - 0.14 0.30 0.40 0.73 0.49 0.51 0.30 0.26 0.33 0.45 0.98 0.86 0.27
1973 YF - 0.93 2.76 2.22 2.20 0.24 1.19 3.10 3.53 3.98 0.91 0.34 0.45 0.15
BE - 0.23 0.27 0.32 0.30 0.07 0.28 0.55 0.33 0,45 0.19 0.34 0.45 0.15
1974 YF 0.89 1.79 1.90 3.06 2.45 1.56 0.43 1.01 1.25 0.33 2.44 0.93 0.77 1.44 0.88
BE 0.17 0.30 0.18 0.29 0.28 0.38 0.38 0.42 0.39 0.25 0.25 0.53 0.57 0.50 0.52
1975 YF 2.04 2.35 1.34 2.01 1.74 1.60 0.35 0.75 1.31 2.98 0.64 0.46 0.72 0.86
BE 0.41 0,46 0.42 0.26 0.28 0.33 0.72 0.94 0.80 0.13 0.80 0.82 0.98 0.98
1976 YF 1.62 1.28 1.45 2.05 2.33 1.52 1.35 0.91 0.96 1.69 1.74 0.65 0.38 0.40 0.67
BE 0.33 0.47 0.40 0.32 0.41 0.54 0.96 1.37 1.30 0.18 0.20 1.51 1.85 1.10 1.40
1977 YF 2.66 1.79 1.58 1.63 2.01 2.39 0.76 1.22 0.76 1.13 3.73 0.68 0.85 1.02
BE 0.34 0.39 0.59 0.61 0.58 0.54 1.92 1.40 1.91 0.34 0.42 1.33 1.24 1.47
1978 YF 1.15 1.50 1.97 3.34 2.94 2.98 0.76 0.57 1.85 5.48 3.48 0.61 0.71 0.65 0.54
BE 0.65 0.82 0.71 0.37 0.34 0.34 1.61 1.09 1.71 0.12 0.24 2.11 1.86 1.37 1.24
1979 YF 1.95 1.62 2.28 2.19 1,14 1.71 2.52 0.79 1.00 1.82 1.83 3.01 0.98 0.73 0.92 0.82
BE 0.38 0.33 0.35 0.32 0.28 0.36 0.60 0.90 0.99 1.21 0.25 0.18 1.31 1.19 1.00 0.72
1980 YF 2.11 1.65 1.46 2.33 2.11 2.33 - 0.74 1.12 1.16 1.23 2.53 0.40 0.65 1.19
BE 0.40 0.49 0.34 0.31 0.31 0.34 - 1.20 0.86 0.89 0,17 0.28 0.13 1.69 1.22 1.22
1981 YF 1.89 1.77 1.46 1.92 1.54 1.53 - 3.64 2.22
BE 0.33 0.30 0.46 0.25 0.27 0.25 - 0.21 0.25
207
Table 6. Hook rate of yellowfin and bigeye per area by Japanese longline, 1967-1981.
Code AreaYear
1 2 3 4 5 6 7 8 9 10 11 12 13 14 15 16
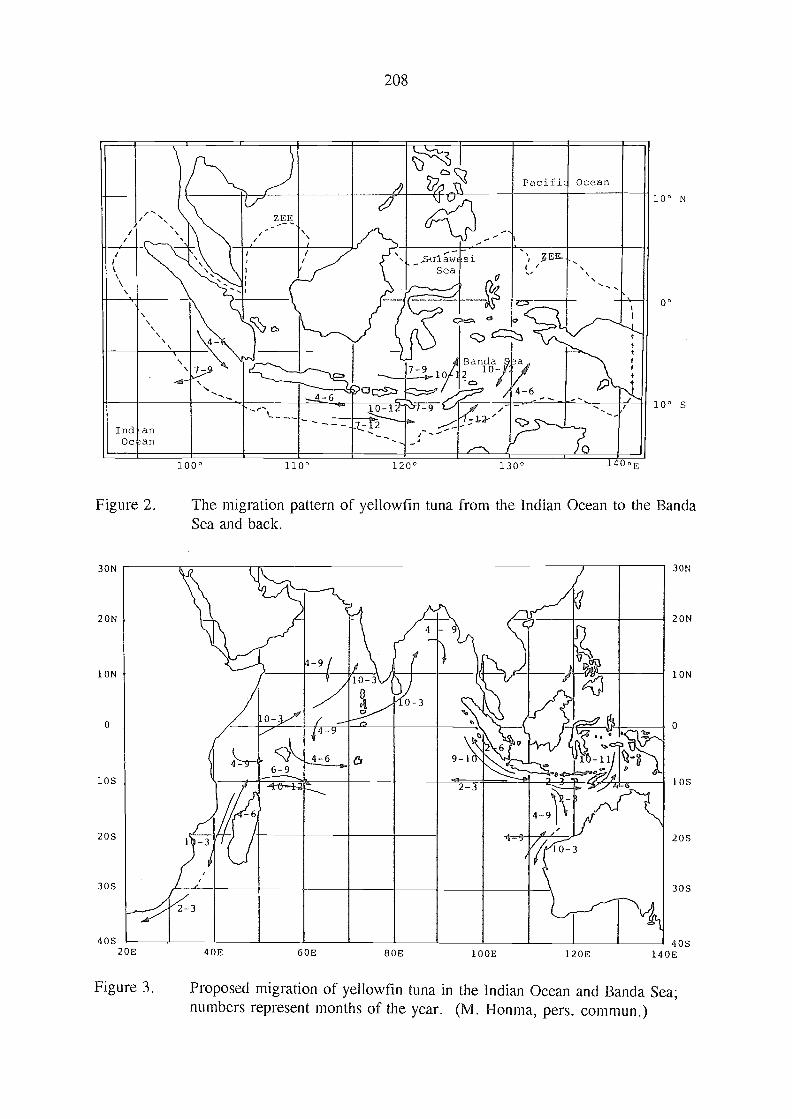
30N
20N
ION
o
10S
20S
30S
40S
208
1000 1100 1200 1300
Figure 2. The migration pattern of yellowfin tuna from the Indian Ocean to the BandaSea and back.
Figure 3. Proposed migration of yellowfin tuna in the Indian Ocean and Banda Sea;numbers represent months of the year. (M. Honma, pers. commun.)
30N
20N
ION
10S
20S
30S
90S20E 40E 60E 80E 100E 120E 140E
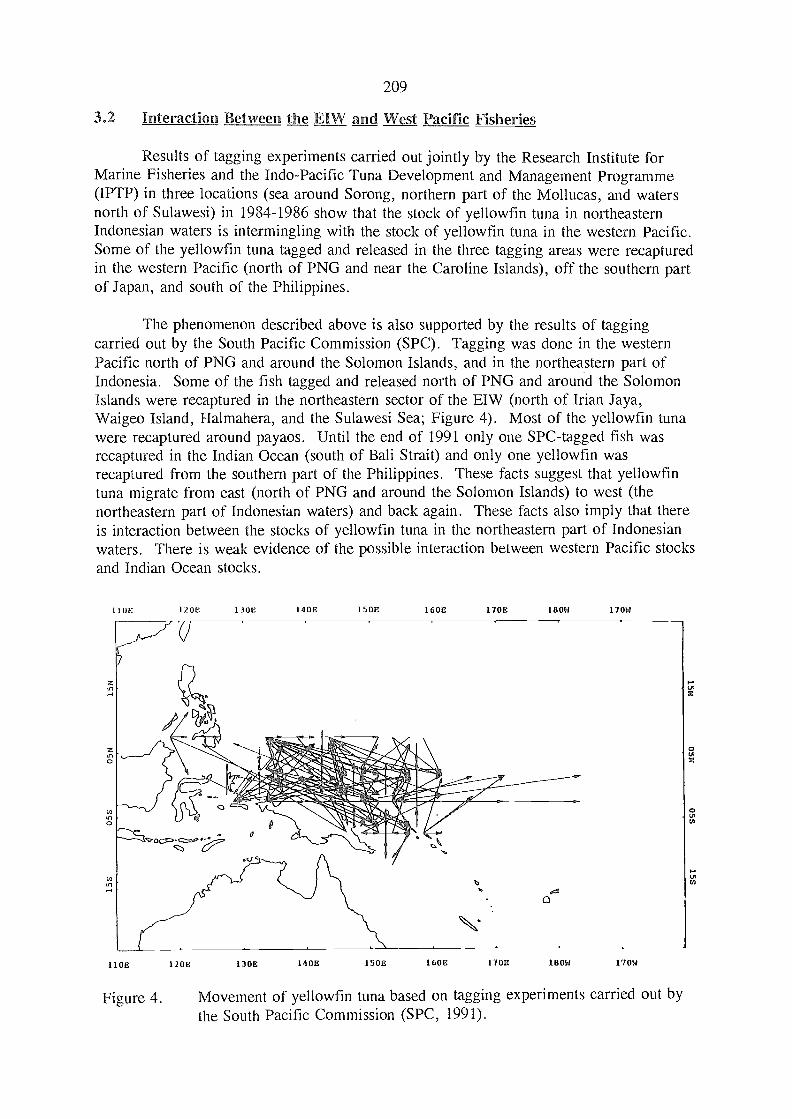
209
3.2 Interaction Between the EIW and West Pacific Fisheries
Results of tagging experiments carried out jointly by the Research Institute forMarine Fisheries and the Indo-Pacific Tuna Development and Management Programme(IPTP) in three locations (sea around Sorong, northern part of the Mollucas, and watersnorth of Sulawesi) in 1984-1986 show that the stock of yellowfin tuna in northeasternIndonesian waters is intermingling with the stock of yellowfin tuna in the western Pacific.Some of the yellowfin tuna tagged and released in the three tagging areas were recapturedin the western Pacific (north of PNG and near the Caroline Islands), off the southern partof Japan, and south of the Philippines.
The phenomenon described above is also supported by the results of taggingcarried out by the South Pacific Commission (SPC). Tagging was done in the westernPacific north of PNG and around the Solomon Islands, and in the northeastern part ofIndonesia. Some of the fish tagged and released north of PNG and around the SolomonIslands were recaptured in the northeastern sector of the EIW (north of Irian Jaya,Waigeo Island, Halmahera, and the Sulawesi Sea; Figure 4). Most of the yellowfin tunawere recaptured around payaos. Until the end of 1991 only one SPC-tagged fish wasrecaptured in the Indian Ocean (south of Bali Strait) and only one yellowfin wasrecaptured from the southern part of the Philippines. These facts suggest that yellowfintuna migrate from east (north of PNG and around the Solomon Islands) to west (thenortheastern part of Indonesian waters) and back again. These facts also imply that thereis interaction between the stocks of yellowfin tuna in the northeastern part of Indonesianwaters. There is weak evidence of the possible interaction between western Pacific stocksand Indian Ocean stocks.
110E 120E 130E 140E 150E 160E 170E 18014 17014
Figure 4. Movement of yellowfin tuna based on tagging experiments carried out by
the South Pacific Commission (SPC, 1991).
110E 120E 130E 140E 150E 160E 170E 18014 170M

4. INTERACTION
The two types of interaction that occur in the region are interaction betweenspecies and interaction between fishing gears.
4.1 Interaction with Other Species
4.1.1 Bigeye
In the EIW a situation exists in which yellowfin caught by longlining arefrequently associated with bigeye catches. Table 7 shows that an average of 19% oflongline catches consisted of bigeye tuna. Table 7 also shows that there was a tendencyfor higher yellowfin catches to be associated with lower bigeye catches.
The hook rates of PT Samodera Besar longliners fishing in the eastern part ofIndonesian waters in 1974-1984 did not show significant interaction between yellowfinand bigeye (Table 6).
4.1.2 Albacore
Besides yellowfin and bigeye, longliners in the eastern part of Indonesian watersalso catch albacore. The catch of Japanese longliners fishing in the eastern part ofIndonesian waters in 1967-1981 consisted of 55.4-76.9% (average 66.7%) yellowfin,14.2-31.6% (average 23.4%) bigeye, and 0.3-9.5% (average 3.4%) albacore. The catchof PT Samodera Besar longliners fishing in the same area in 1975-1984 consisted of 51.4-75.9% (average 64.4%) yellowfin, 10.7-20.2% (average 15.8%) bigeye, and 2.5-15.4%(average 9.6%) albacore (Table 7).
Table 7 shows a tendency for higher yellowfin catches to be associated with loweralbacore catches.
4.2 Interaction Among Fishing Gears
4.2.1 Interaction between purse seine and pole and line
Most of the fishing grounds of the pole-and-line fishery in Indonesia are located inthe northern part of the EIW. These fishing grounds are quite close to the Philippinespurse seine fishing grounds and to the Japanese and Indonesian purse seine fishinggrounds north of Irian Jaya and Papua New Guinea.
Marcille et al. (1984) state that the increasing catches of skipjack by purse seinersin Philippines waters and north of Irian Jaya and Papua New Guinea have not affected theabundance of fish available to the Indonesian pole-and-line fishery north of Sulawesi andIrian Jaya. There is no information available on the effect the purse-seine catch ofyellowfin has on the pole-and-line fishery.
210
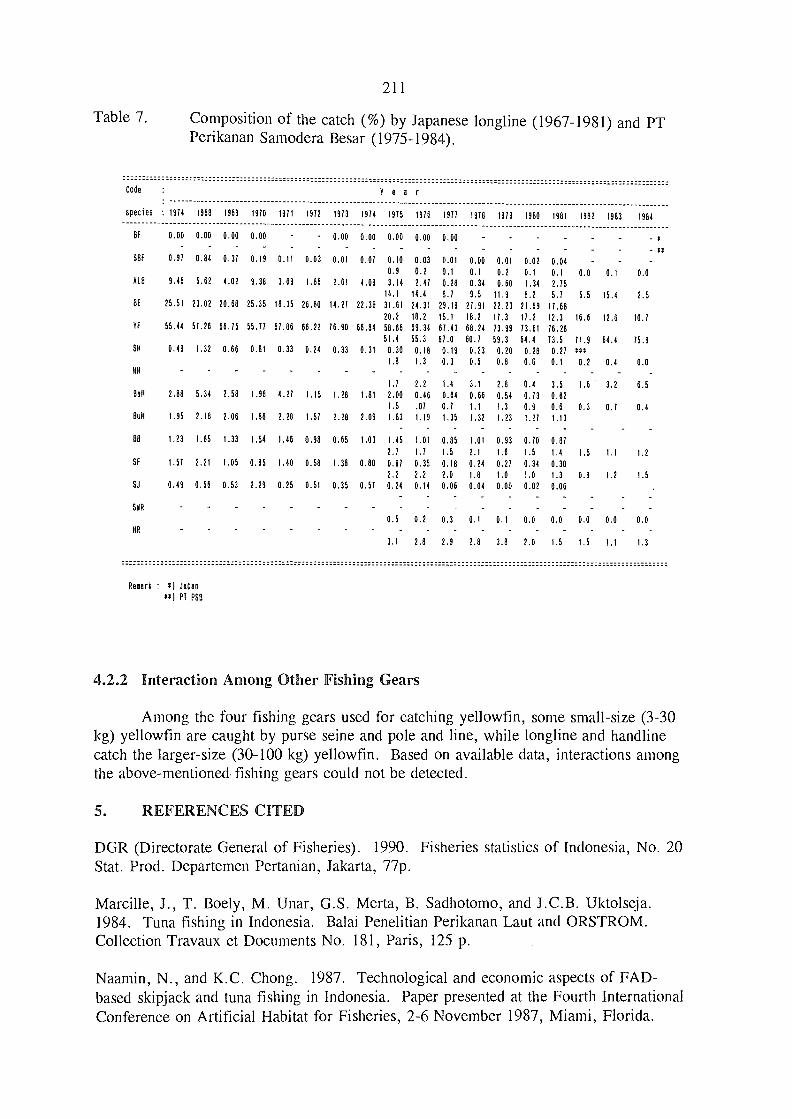
spec es : 1914 1968 1969 1910 1971 1912 1913 1914 1915 1916 1977 1978 1919 1980 1981 1982 1983 1984
BF 0.00 0.00 0.00 0.00 0.00 0.00 0.00 0.00 0.00 -
- esSBF 0.97 0.84 0.37 0.19 0.11 0.03 0.01 0.07 0.10 0.03 0.01 0.00 0.01 0.02 0.04
0.9 0.2 0.1 0.1 0.2 0.1 0.1 0.0 0.1 0.0ALB 9.46 5.62 4.02 9.38 3.69 1.86 2.61 4.09 3,14 2.41 0.28 0.34 0.60 1.34 2.75
14.1 14.4 8.7 9.5 11.9 8.2 5.1 5.5 15.4 2.5BE 25.51 23.02 20.68 25,35 18.35 26.80 14.21 22.39 31.61 24.31 29.19 27.91 22.23 21.69 11.68
20.2 18.2 15.1 18.2 11.3 11.2 12.3 16.6 12.6 10.1YF 55.44 51.26 56.75 5531 61.86 66.22 76.90 66.84 58.66 69.34 67.43 68.24 73.99 13.61 16.28
51.4 55.3 61.0 60.1 59.3 64.4 73.5 71.9 64.4 15.90.49 1.32 0.66 0.81 0.33 0.24 0.33 0.31 0.30 0.18 0.19 0.23 0.20 0.28 0.21 558
1.8 1.3 0.3 0.5 0.8 0.6 0.1 0.2 0.4 0.0_ - -
1.7 2.2 1.4 3.1 2.8 0.4 3.5 1.6 3.2 6.5BaN 2.88 5.34 2.58 1.98 4.27 7.15 1.28 1.81 2.00 0.46 0.64 0.66 0.54 0.73 0.62
1.5 .07 03 1.1 1.3 0.9 0.6 0.3 0.7 0.4BO 1.95 2.18 2.06 1.88 2.28 1.51 2.28 2.09 1.83 1.19 1.35 1.32 1.23 1.27 1.13
- - - - -BB 1.23 1.65 1.33 1.54 1.46 0.98 0.65 1.03 1.45 1.01 0.85 1.01 0.93 0.10 0.87
2.1 1.1 1.5 2.1 1.6 1.5 1.4 1.5 1.1 1.2SF 1.51 2.21 1.05 0.85 1.40 0.58 1.38 0.80 0.61 0.35 0.18 0.24 0.27 0.34 0.30
2.2 2.2 2.0 1.8 1.0 1.0 1.3 0.9 1.2 1.5SJ 0.49 0.56 0.53 2.29 0,25 0.51 0.35 0.57 0.24 0.14 0.06 0.04 0.00 0.02 0.06
- - - -SNR
0.5 0.2 0.3 0.1 0.1 0.0 0.0 0.0 0.0 0.0MR
3.1 2.8 2.9 2.8 3.8 2.0 1.5 1.5 1.1 1.3
Remar 11 Jipense) PT PSB
4.2.2 Interaction Among Other Fishing Gears
Among the four fishing gears used for catching yellowfin, some small-size (3-30kg) yellowfin are caught by purse seine and pole and line, while longline and handlinecatch the larger-size (30-100 kg) yellowfin. Based on available data, interactions amongthe above-mentioned fishing gears could not be detected.
5. REFERENCES CITED
DGR (Directorate General of Fisheries). 1990. Fisheries statistics of Indonesia, No. 20Stat. Prod. Departemen Pertanian, Jakarta, 77p.
Marcille, J., T. Boely, M. Unar, G.S. Merta, B. Sadhotomo, and J.C.B. Uktolseja.1984. Tuna fishing in Indonesia. Balai Penelitian Perikanan Laut and ORSTROM.Collection Travaux et Documents No. 181, Paris, 125 p.
Naamin, N., and K.C. Chong. 1987. Technological and economic aspects of FAD-base,d skipjack and tuna fishing in Indonesia. Paper presented at the Fourth InternationalConference on Artificial Habitat for Fisheries, 2-6 November 1987, Miami, Florida.
211
Table 7. Composition of the catch (%) by Japanese longline (1967-1981) and PTPerikanan Samodera Besar (1975-1984).
Code Year

212
Nasution, C., G.S. Merta, and R. Arifudin. 1986. Study on rompongs (FAD) and theiraspects in Mamuju waters to develop tuna fishery in South Sulawesi. J.Mar.Fish.Res.,Jakarta, 37:31-58.
SPC. 1991. Monthly tagging summary - August 1991. Regional Tuna Tagging Project.Tuna Billfish Assess.Programme, S.Pac.Comm., Noumea, New Caledonia, 11 p.
Suhendrata, T., and S. Bahar. 1986. The tuna longline fishing grounds in Indonesianwaters and the possibility of its industrial development. J.Mar.Fish.Res., Jakarta, 37:79-94.
213
ASSESSMENT OF INTERACTION BETWEEN NORTH PACIFIC ALBACORE,THUNNUS ALALUNGA, FISHERIES BY USE OF A S LATION MODEL'
P. Kleiber and B. BakerSouthwest Fisheries Science Center
National Marine Fisheries Service, NOAALa Jolla, California
ABSTRACT
Using a simulation model of a typical year in the North Pacific albacore fisheriesin the 1970s, we tested for the degree to which the activity of fle,ets affects theperformance of other fleets. The results show that rather drastic (factor of two) changesin the activity of any of the three principal albacore fleets have only a mild effect on thecatch of the other fleets. With the overall exploitation rate in the model close to theexploitation rate determined from tagging results (6%), the maximum degree ofinteraction was a 7.5% drop in longline catch resulting from doubling the baitboat effort.The mild degree of interactions was insensitive to exploitation rate up to approximately10% exploitation, although interaction became more severe at higher levels ofexploitation.
Published: Kleiber, P., and B. Baker. 1987. Assessment of interaction between North Pacificalbacore, Thunnus alalunga, fisheries by use of a simulation model. Fish.Bull., 85(4):
703-11.
214
EVIDENCE OF INTERACTIONS IETWEEN HIGH SEAS DRII, IGILLNET FISHERIES A I THE NORTH AMERICAN TROLL
FISHERY FOR ALBACORE
Norman Bartoo, David Holts, and Cheryl Brown'Southwest Fisheries Science Center
National Marine Fisheries Service, NOAALa Jolla, California 92038
ABSTRACT
Observers aboard USA troll vessels fishing for albacore in the eastern NorthPacific examined approximately 20,000 albacore at the time of capture for marks causedby encounters with high seas drift nets. Results indicate about 13.4% of albacore caughtby USA troll vessels showed evidence of encountering drift nets prior to capture by theUSA fleet. This is interpreted as direct evidence of fisheries interactions.
INTRODUCTION
The Southwest Fisheries Science Center (SWFSC) in cooperation with members ofthe Western Fishboat Owners Association (WFOA) placed fisheries observers on USAtrollers fishing in the North Pacific in 1990. This was part of a comprehensive impactassessment programme on the effects of the high-seas drift gillnet fisheries on the NorthPacific albacore (Thunnus alalunga) stocks and other fisheries. Albacore which escapedrift gillnets bear some external marks that provide direct evidence of interaction.Throughout this report, we refer to these external marks from drift gillnet encounters asdamage. Damage may be minor or severe, and may include marks on the skin, bruising,cuts and broken skin (loss of scales), missing areas of skin, and scars related to any ofthe foregoing. This report describes the results of the 1990 observer project.
2. BACKGROUND
Catches.and catch-per-effort from the USA albacore troll and pole and linefisheries in the North Pacific have declined since the mid-1970s (Coan et al., 1991;Kleiber and Perrin, in press). In addition to the USA fishery, Japan and Taiwan eachhave a surface fleet and a longline fleet catching albacore in the North Pacific. Threehigh-seas drift gillnet fleets also catch albacore in the North Pacific (Anon., 1989).
The small-mesh (90-120 mm stretched mesh) drift gillnet fleets are made up ofvessels from Japan, Taiwan and the Republic of Korea (ROK). The Japanese andTaiwanese fleets fish for flying squid (Ommastrephes bartrami) in the North PacificTransition Zone from about May through December. The ROK fleet operates there theentire year. The incidental catches of albacore by these drift net fisheries are not pre-ciselyknown.
' Current address: Southeast Fisheries Science Center, 75 Virginia Beach Dr., Miami, FL 33149
FAO LIBRARY AN: 346131
215
The large-mesh (160 -180 mm stretched mesh, Bartoo and Holts, 1991) driftgillnet fleet is made up of vessels from Japan and Taiwan. Japan's fleet is currentlyrestricted to areas east of 170°E. Albacore is a major coMponent of that catch. Taiwanhas a developing large mesh fishery for albacore. The impact of these fleets on albacoreis largely unknown. Taiwan and Japan have imposed internal regulations on their driftgillnet fleets to limit fishing effort in the higher latitudes west of 170°E longitude andminimize interceptions of high-seas salmon.
Although drift gillnet catches and landings for North Pacific albacore areincomplete and unreported for some fleets, the aggregate reported annual landings fordrift gillnet fisheries exceeded 20,000 mt in 1988 (Tsuji et al., 1992). In the mid-1980sU. S. albacore fishermen began reporting increasing numbers of albacore injured orscarred by encounters with high-seas drift gillnets. Concerns focussed on the impact ofdrift gillnet fisheries on the North Pacific albacore stock and the direct interaction withthe U.S. albacore troll fleet.
2.1 Troll Observer Project
In 1990, SWFSC biotechnicans observed 6 complete fishing trips aboard 5different troll vessels. Vessels were selected to provide data over the entire season andcover the entire fishing area. The cruise tracks of the observed vessels are shown with theentire catch distribution of the troll fleet in Figure 1. The fishery followed eastward-migrating albacore beginning north of Hawaii in June, moved eastward to 1350 W in Julyand remaine,d east of 135° W in August and September (Coan et al., 1991). Operationsand observations covered a wide area of the north Pacific Ocean. The project goals wereto document and estimate the interaction between high-seas drift gillnet and NorthAmerican troll fisheries, and to provide biological information from which delayedmortality of albacore due to net encounters might be inferred. Specific objectives are as
follows:
Describe the type and severity of drift gillnet damage on troll-caughtalbacore
Estimate the relative frequencies of undamaged albacore and damagedalbacore
Estimate the size-frequency of undamaged albacore and damaged albacore
Determine the relative physiological condition of troll-caught albacore that
show gill net damage
Here, we report results relating to the first 3 objectives.
2.1.1 Methods
Drift gillnet marks are most visible when the fish is boated. Most marks disappear
or are rendered indistinguishable once the fish is frozen or dies on deck. Observersexamined each fish landed and noted net scars or marks using a set of referencephotographs detailing the type and severity of injuries (Figure 2). These were coded as:
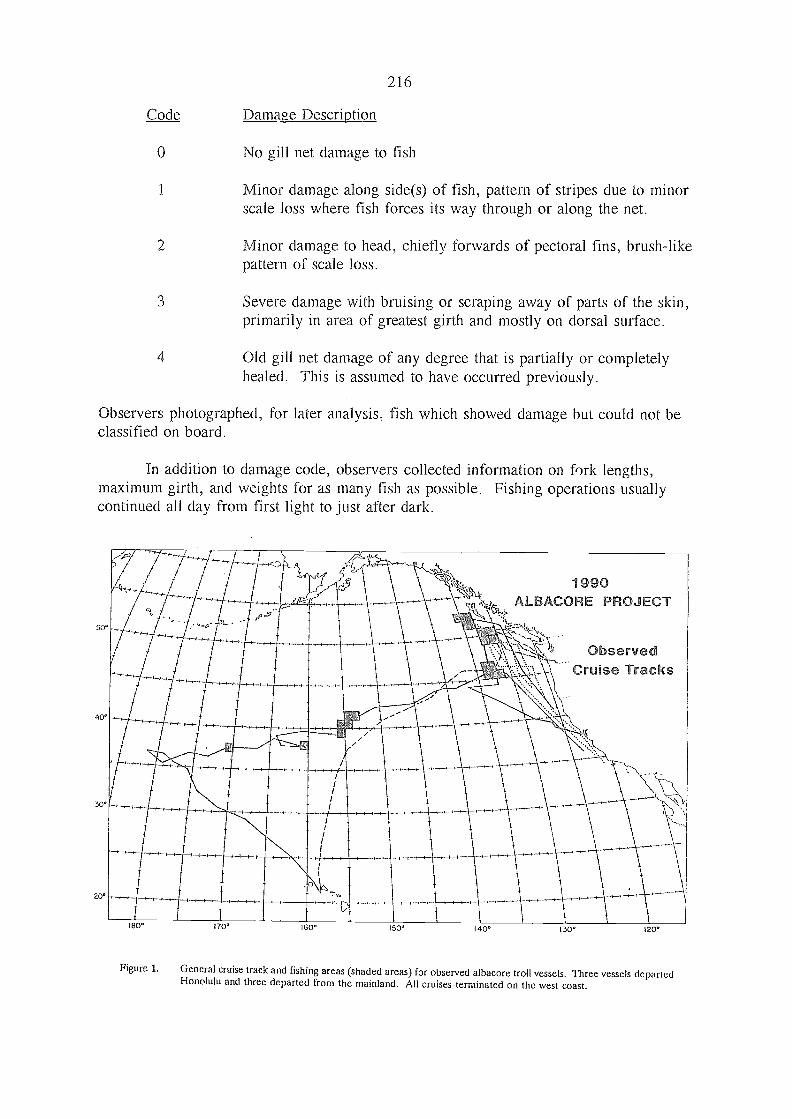
216
Code zna e Description
o No gill net damage to fish
1 Minor damage along side(s) of fish, pattern of stripes due to minorscale loss where fish forces its way through or along the net.
2 Minor damage to head, chiefly forwards of pectoral fins, brush-likepattern of scale loss.
3 Severe damage with bruising or scraping away of parts of the skin,primarily in area of greatest girth and mostly on dorsal surface.
4 Old gill net damage of any degree that is partially or completelyhealed. This is assumed to have occurred previously.
Observers photographed, for later analysis, fish which showed damage but could not beclassified on board.
In addition to damage code, observers collected information on fork lengths,maximum girth, and weights for as many fish as possible. Fishing operations usuallycontinued all day from first light to just after dark.
Figure 1. General cruise track and fishing areas (shaded areas) for observed albacore troll vessels. Three vessels departedHonolulu and three departed from the mainland. All cruises terminated on the west coast.

217
Figure 2. Pacific albacore damaged by high-seas drift nets. Damage code I indicates minor scratchesand scale. loss (A & B) Damaue code 2 shows moderate clamaue on the he,ad (B. C D.
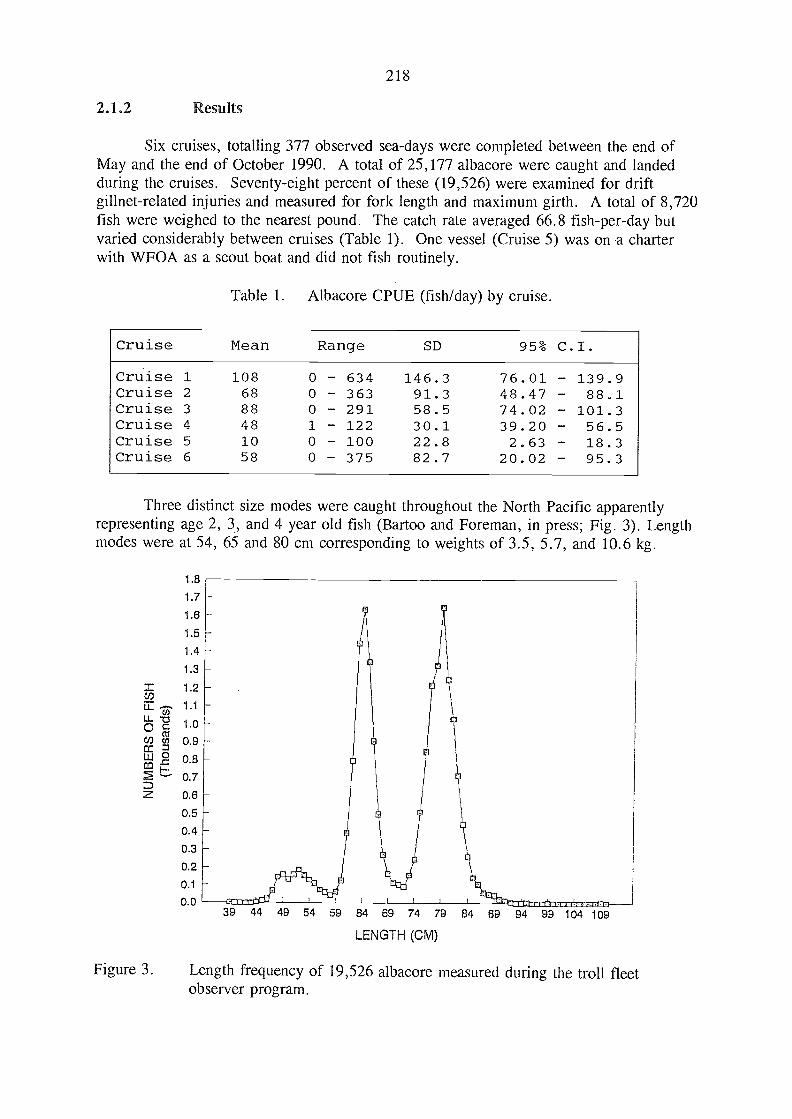
2.1.2 Results
Six cruises, totalling 377 observed sea-days were completed between the end ofMay and the end of October 1990. A total of 25,177 albacore were caught and landedduring the cruises. Seventy-eight percent of these (19,526) were examined for driftgillnet-related injuries and measured for fork length and maximum girth. A total of 8,720fish were weighed to the nearest pound. The catch rate averaged 66.8 fish-per-day butvaried considerably between cruises (Table 1). One vessel (Cruise 5) was on a charterwith WFOA as a scout boat and did not fish routinely.
Three distinct size modes were caught throughout the North Pacific apparentlyrepresenting age 2, 3, and 4 year old fish (Bartoo and Foreman, in press; Fig. 3). Lengthmodes were at 54, 65 and 80 cm corresponding to weights of 3.5, 5.7, and 10.6 kg.
1.8
1.7
i.e1.5
1.4
1.3
= 1.2U)
1.1LL
C 1.0co
U7 co 0.9LU Cl 0.8
2 0.7
Z 0.8
0.5
0.4
0.3
0.2
0.1
0.0
218
' '39 44 49 54 5 84 74 79 84
LENGTH (CM)
89 94 99 104 109
Figure 3. Length frequency of 19,526 albacore measured during the troll fleetobserver program.
Table 1. Albacore CPUE (fish/day) by cruise.
Cruise Mean Range SD 95% C.I.
Cruise 1 108 0 - 634 146.3 76.01 - 139.9Cruise 2 68 0 - 363 91.3 48.47 - 88.1Cruise 3 88 0 - 291 58.5 74.02 - 101.3Cruise 4 48 1 - 122 30.1 39.20 - 56.5Cruise 5 10 0 - 100 22.8 2.63 - 18.3Cruise 6 58 0 - 375 82.7 20.02 - 95.3
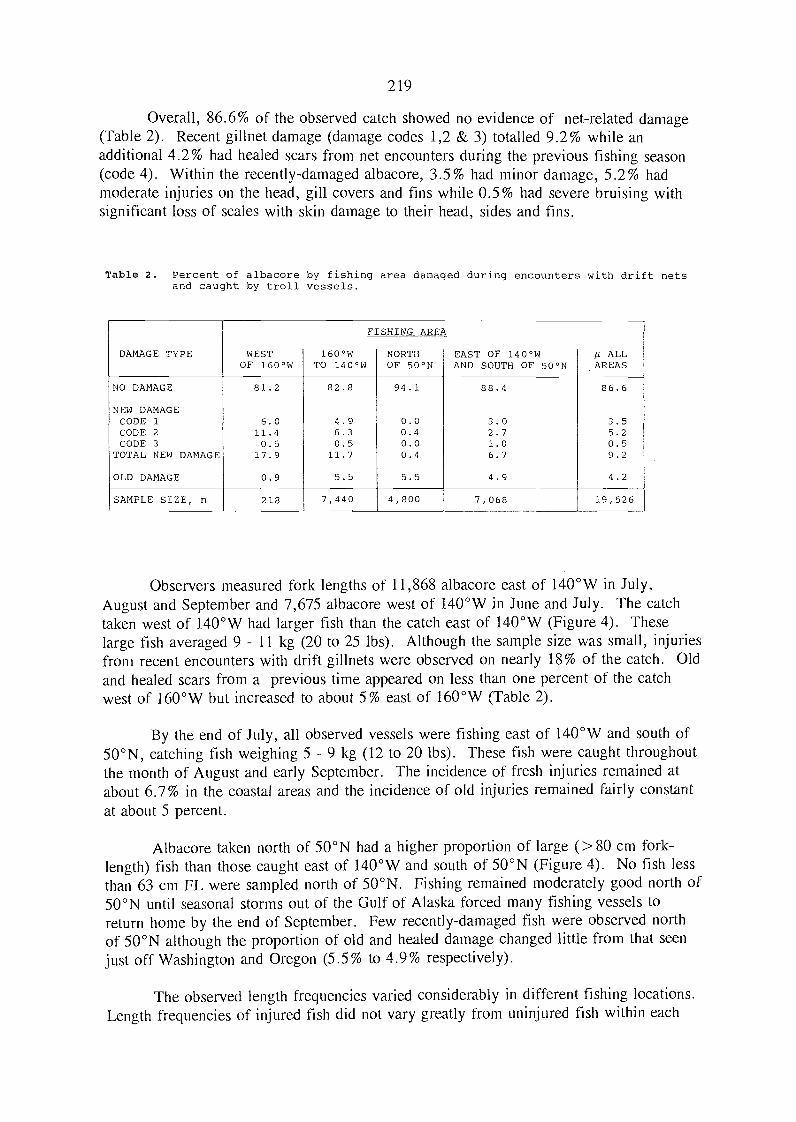
219
Overall, 86.6% of the observed catch showed no evidence of net-related damage(Table 2). Recent gillnet damage (damage codes 1,2 & 3) totalled 9.2% while anadditional 4.2% had healed scars from net encounters during the previous fishing season(code 4). Within the recently-damaged albacore, 3.5% had minor damage, 5.2% hadmoderate injuries on the head, gill covers and fins while 0.5% had severe bruising withsignificant loss of scales with skin damage to their head, sides and fins.
Table 2. Percent of albacore by fishing area damaged during encounters with drift netsand caught by troll vessels.
Observers measured fork lengths of 11,868 albacore east of 140°W in July,August and September and 7,675 albacore west of 140°W in June and July. The catchtaken west of 140°W had larger fish than the catch east of 140°W (Figure 4). Theselarge fish averaged 9 - 11 kg (20 to 25 lbs). Although the sample size was small, injuriesfrom recent encounters with drift gillnets were observed on nearly 18% of the catch. Oldand healed scars from a previous time appeared on less than one percent of the catchwest of 160°W but increased to about 5% east of 160°W (Table 2).
By the end of July, all observed vessels were fishing east of 140°W and south of50°N, catching fish weighing 5 - 9 kg (12 to 20 lbs). These fish were caught throughoutthe month of August and early September. The incidence of fresh injuries remaine,d atabout 6.7% in the coastal area.s and the incidence of old injuries remained fairly constantat about 5 percent.
Albacore taken north of 50°N had a higher proportion of large (>80 cm fork-length) fish than those caught east of 140°W and south of 50°N (Figure 4). No fish lessthan 63 cm FL were sampled north of 50°N. Fishing remained moderately good north of50°N until seasonal storms out of the Gulf of Alaska forced many fishing vessels toreturn home by the end of September. Few recently-damaged fish were observed northof 50°N although the proportion of old and healed damage changed little from that seenjust off Washington and Oregon (5.5% to 4.9% respectively).
The observed length frequencies varied considerably in different fishing locations.Length frequencies of injurekl fish did not vary greatly from uninjured fish within each
DAMAGE TYPE WESTOF 160°W
FISHING AREA
A ALLAREAS
160°WTO 140°W
NORTHOF 50°N
EAST OF 140°WAND SOUTH OF 50°N
NO DAMAGE 81.2 82.8 94.1 88.4 86.6
NEW DAMAGECODE 1 6.0 4.9 0.0 3.0 3.5CODE 2 11.4 6.3 0.4 2.7 5.2CODE 3 0.5 0.5 0.0 1.0 0.5TOTAL NEW DAMAGE 17.9 11.7 0.4 6.7 9.2
OLD DAMAGE 0.9 5.5 5.5 4.9 4.2
SAMPLE SIZE, n 218 7,440 4,800 7,068 19,526
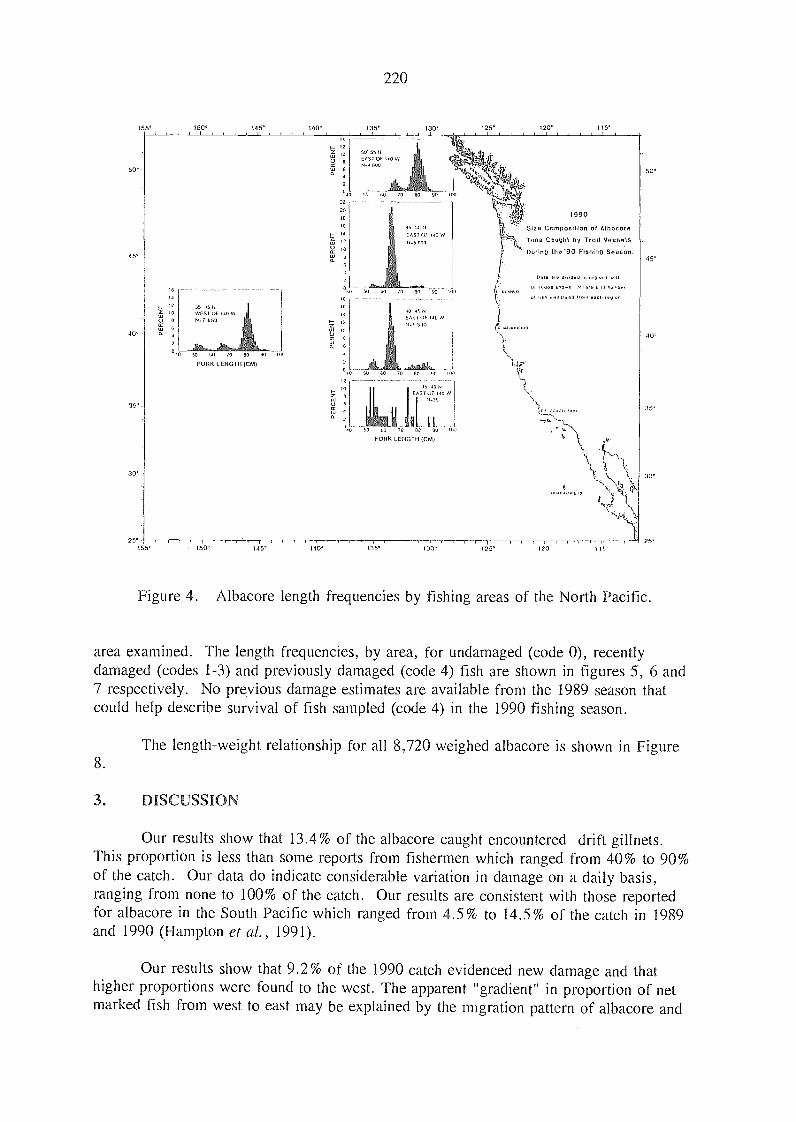
14
220
°40 50 60 70 00 50 I
22 -
20
1,42
$f
...70 0
FORK t ENGT 100M)
Drila ts. dhoistod
islOsolos Show. ti ih rwthhertwooss4
ol hsh from ouch ,aspon
8
145° 140° 035° 130" 125° 120
Figure 4. Albacore length frequencies by fishing areas of the North Pacific.
area examined. The length frequencies, by area, for undamaged (code 0), recentlydamaged (codes 1-3) and previously damaged (code 4) fish are shown in figures 5, 6 and7 respectively. No previous damage estimates are available from the 1989 season thatcould help describe survival of fish sampled (code 4) in the 1990 fishing season.
The length-weight relationship for all 8,720 weighed albacore is shown in Figure8.
3. DISCUSSION
Our results show that 13.4% of the albacore caught encountered drift gillnets.This proportion is less than some reports from fishermen which ranged from 40% to 90%of the catch. Our data do indicate considerable variation in damage on a daily basis,ranging from none to 100% of the catch. Our results are consistent with those reportedfor albacore in the South Pacific which ranged from 4.5% to 14.5% of the catch in 1989and 1990 (Hampton et al., 1991).
Our results show that 9.2% of the 1990 catch evidenced new damage and thathigher proportions were found to the west. The apparent "gradient" in proportion of netmarked fish from west to east may be explained by the migration pattern of albacore and
So.
1990
Size Composition ot Albacore
Tuna Caught by Troll Vestals
During tho '90 Fishing Season.
40°
354 )
204°
35 45 74WEST 02 40W1,7 650
.0414,
16
2
2
12
t;10a
62 6
°241- 00 00
040 00 60
0 60 70 40 40 00FOF1K LENGTH (CM)
GO
155° (60° 145° 140° 165°
IO SO. 5504
[05000E ¡nowtit, 000
130' 125° 120"
30' -
25°10°155°
50° -
45°
45' 50 el
EAST OF 40W14.5 660
loSO 9,7E441 OF 10W14.1 330
70 BO 00
35 4004EAST Or 140
14.30
45.
40°
35°
- 30°
25°

22
20
18
18
14
12
10 -
12
-8 -4 -2
o
22
20 -
8
e
4
2
20 =H 18 -Z 18 -
4 =2 =,
o
22
20
10
4 -2
o
221
hit39 44 49 54 59 64 69 74 79 84 89 94 99 104 109
LENGTH (CM)Figure 5. Length frequencies of un-damaged albacore (Code 0) from the four fishing
areas of the north Pacific.
18
18 -14
35-45 N, WEST OF 140WN = 6337
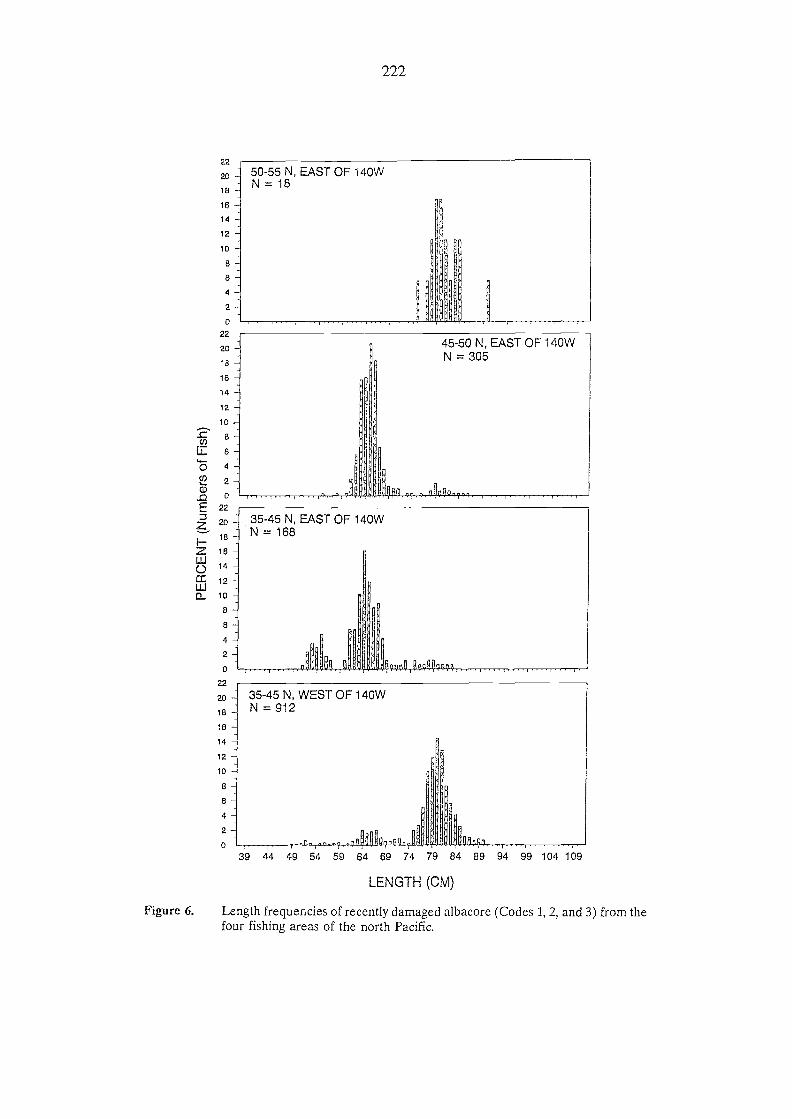
22
20
18
18
14
12
10
E22
cc 12UiQ_ 10
8
4
2
22
8
8
4
--+
50-55 N, EAST OF 140WN = 18
222
Ig'i1V14,111S14171?,79,,
0 , 4401Q7nUqqA d090
2
39 44 49 54 59 64 69 74 79 84 89 94 99 104 109
LENGTH (CM)
Figure 6. Length frequencies of recently damaged albacore (Codes 1, 2, and 3) from thefour fishing areas of the north Pacific.
e
4
2
0
22
20
318
14
12
10
-O g
o 4ct)
_o o i,7-7,7[10
45-50 N, EAST OF 140WN = 305
N,^7,7 4019v797, ,
20 35-45 N, EAST OF 140WN = 168
20
18
18
14
12
10
35-45 N, WEST OF 140WN = 912
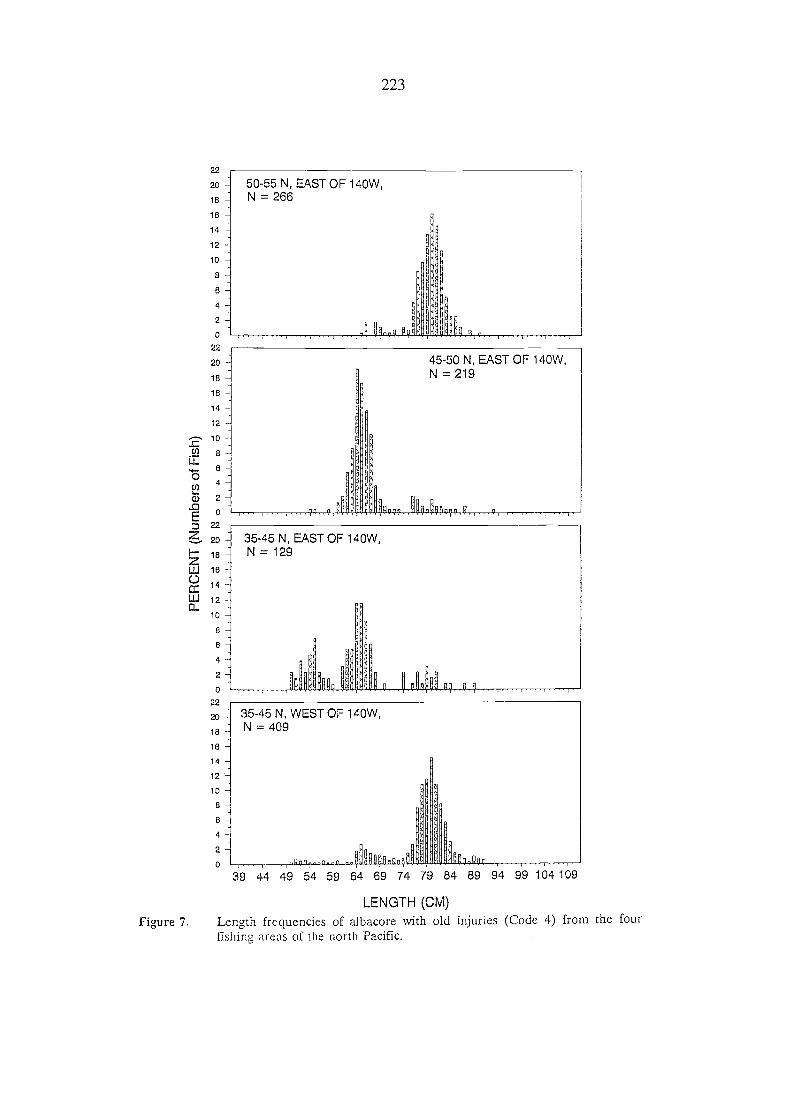
W16CDCL
14
U..1 12o-
22
20
18 ---
1
14
12
10
e
4
22
20
18
18
14
12
10
8
4
2
o
35-45 N, WEST OF 140W,N = 409
45-50 N, EAST OF 140W,N = 219
10
8
4
2
o
22
20
18
18
14
1
10
.2 B
o4
Q) 2
E°z 22Z 20t 18
223
39 44 49 54 59 64 69 74 79 84 89 94 99 104 109
LENGTH (CM)Figure 7. Length frequencies of albacore with old injuries (Code 4) from the four
fishing arcas of the north Pacific.
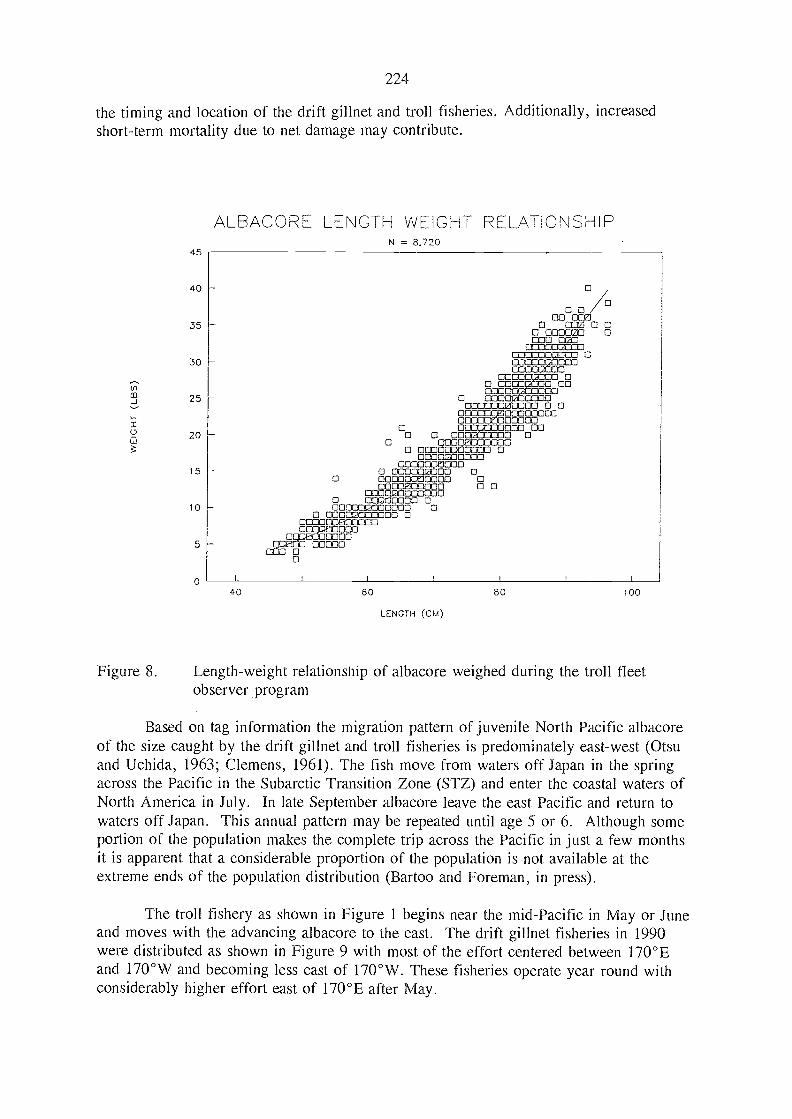
EOM IS11111dUDJMS SU
oo
oo
COCOo
224
the timing and location of the drift gillnet and troll fisheries. Additionally, increasedshort-term mortality due to net damage may contribute.
ALBACORE LENGTH WEIGHT RELATIONSHIPN = 8,720
40
O 0CO a 21
35 O sr 0 CO COO= O000 00CM0000000
COCCOMOCO30 a:0012CCO
CIDECOODOO
O DOCOR 0 COIS II
25 11111121 COCICMIIIMIBINSr4 UNGO 0 0
OCOOD300ousama CCo Oseras CO DC
20 O 0 DOwsrass 0 0o 00011121111111111110 0000=3 oOM asp=
aommeacoo15
oo coommisoo o000000111 CODOE :21111000 0 0
oUS a UUSNIP COOD
10 0011111MAIMB0000 0O 000IMAM* 00 0
40 60 80 100
LENGTH (CM)
Figure 8. Length-weight relationship of albacore weighed during the troll fleetobserver program
Based on tag information the migration pattern of juvenile North Pacific albacoreof the size caught by the drift gillnet and troll fisheries is predominately east-west (Otsuand Uchida, 1963; Clemens, 1961). The fish move from waters off Japan in the springacross the Pacific in the Subarctic Transition Zone (STZ) and enter the coastal waters ofNorth America in July. In late September albacore leave the east Pacific and return towaters off Japan. This annual pattern may be repeated until age 5 or 6. Although someportion of the population makes the complete trip across the Pacific in just a few monthsit is apparent that a considerable proportion of the population is not available at theextreme ends of the population distribution (Bartoo and Foreman, in press).
The troll fishery as shown in Figure 1 begins near the mid-Pacific in May or Juneand moves with the advancing albacore to the east. The drift gillnet fisheries in 1990were distributed as shown in Figure 9 with most of the effort centered between 170°Eand 170°W and becoming less east of 170°W. These fisheries operate year round withconsiderably higher effort east of 170°E after May.
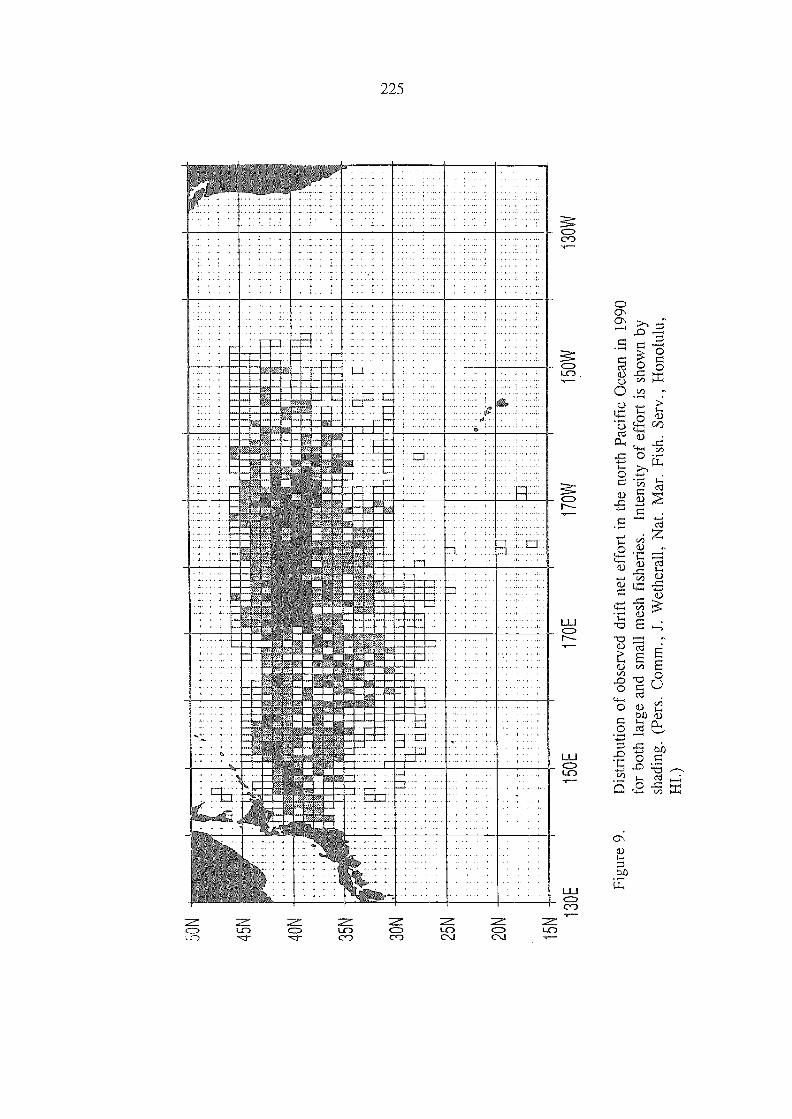
50\1
45N
35 30N
25N
20N
15N
IIum
lIW
IMM
INU
MN
IMI
Fram
inum
illill
amili
n0-
4111
1,11
tk-I
CA
IMIO
NIK
EIP
,M
INIM
ffxs
INII
NX
IIII
N0-
40N
,
-,14
1,,.-!,.NRIBBININBUIANUR
UN
, lite
llaN
ION
INIO
NO
NU
NIN
INN
INIM
UN
INU
NN
INN
IUM
UM
1i U
1111
111
IN N
UI
I T
IM N
MI
IIN
UO
UN
IUI
I 11
111
ilIilU
llilil
1iIi
a u
isor
maa
nain
taal
imm
atat
aN
B I
NN
INII
IIII
N M
UM
IIII
ININ
INN
IUN
NU
NIN
IU L
INU
NII
NU
NI
INN
ININ
NIN
INU
INII
IIM
INN
UN
ION
N/B
INI
aiuu
Iuul
luuu
luui
iIiI
u11
1111
Ilil
illilI
lill
UN
HU
M U
NII
IOU
NIU
MB
UN
III
jiiD
flhuu
uuu
MU
Mon
UN
WIN
MO
NI
NO
NN
ININ
ION
INU
MIN
ININ
NIN
NN
UN
ER
IBIl
l
IBU
IIU
UN
NII
I I
SWU
MM
UN
N I
i N
UN
MU
MI
MU
NN
aU
NI
IIII
INU
NI
I
aM
UM
{11 11
......
7-7-
7"7
7" 7
7"7
7' 7
7' 7
7
`
i iE
EII
IIII
III-
II II
.111
11.
77
.!
;- .....
"!!' ;i
1.1.
1111
..
,11
30E
150E
170E
170W
150W
130W
Figu
re 9
.D
istr
ibut
ion
of o
bser
ved
drif
t net
eff
ort i
n th
e no
rth
Paci
fic
Oce
an in
199
0fo
r bo
th la
rge
and
smal
l mes
h fi
sher
ies.
Inte
nsity
of
effo
rt is
sho
wn
bysh
adin
g. (
Pers
. Com
m.,
J. W
ethe
rall,
Nat
. Mar
. Fis
h. S
erv.
, Hon
olul
u,H
I.)

226
Higher proportions of marked fish are seen west of 140°W where the drift gillnetand troll fisheries overlap in area and time. Lower proportions of marks are seen east of140°W, outside the distribution of the drift gillnet fisheries. Additionally, some albacoremay migrate into the troll fishery from areas south of the drift gillnet-fishery distribution(Laurs and Lynn, 1977) and dilute the marked portion of the population.
Less marked fish appear in the troll fishery in the east. This may be partly due toincreased mortality of fish damaged after encountering a drift gillnet, which would resultin less marked fish being available to be recaptured by the troll fishery. This wouldlogically seem to increase directly with the severity of injury and passage of time (as thealbacore move eastward).
ACKNOWLEDGEMENTS
We wish to thank the Western Fishboat Owners Association for their help inlocating owners of fishing vessels for placement of our observers. We also wish to thankthe owners of those vessels for their support. We are truly indebted to the observers whoexamined and measured the nearly 20,000 albacore. Finally, thanks to the reviewerswhose suggestions greatly improved this manuscript.
REFERENCES CITED
Anonymous. 1989. Report of the Secretary of Commerce to the Congress of the UnitedStates on the nature, extent and effects of driftnet fishing in waters of the north PacificOcean pursuant to section 4005 of public law 100 - 220, the "Driftnet Impact Monitoring,Assessment, and Control Act of 1987". U.S. Department of Commerce, 147 p.
Bartoo, N., and T.J. Foreman. 1993. A synopsis of the biology and fisheries for NorthPacific albacore (Thunnus alalunga). In Proceedings of the FAO Expert Consultation onInteractions of Pacific Tuna Fisheries, edited by R.S. Shomura, J. Majkowski, and S.Langi, 3-11 December 1991, Noumea, New Caledonia [See this document].
Bartoo, N., and D.B. Holts. (in press) Observations on drift gillnet selectivity foralbacore inferred from various surveys. Fish.Bull.NOAA-NMFS [Submitted forpublication].
Clemens, H.B. 1961. The migration, age, and growth of Pacific albacore (TI2unnusgermo), 1951-1958. Fish.Bull.Calif.Dep.Fish Game, (115):128 p.
Coan, A.L., G.M. Rensink and F.R. Miller. 1991. Summary of the 1990 North Pacificalbacore fisheries data. NOAA Admin.Rep.NMFS-SWFC, La Jolla, LJ-91-21:33 p.
Hampton, J., T. Murray, and K. Bailey. 1991. South Pacific albacore observerprogramme on troll vessels, 1989-1990. Tech.Rep.Tuna Bilifish Assess.Programme,S. Pac. Comm. , (25):25 p.
Kleiber, P., and C. Perrin. (in press) Catch per effort and stock status in the UnitedStates north Pacific albacore fishery: Re-appraisal of both. Fish.Bull.NOAA/NMFS,89(3).

227
La.urs, R.M., and R.J. Lynn. 1977. Seasonal migration of north Pacific albacore,Thunnus alalunga, into North American coastal waters: distribution, relative abundance,and association with Transition Zone waters. Fish.Bull.NOAA-NMFS, 75(4):795-822.
Otsu, T., and R.N. Uchida. 1963. Model of the migration of albacore in the northPacific Ocean. Fish.Bull.U.S.Fish Wildl.Serv., 63(1):33-44.
Tsuji, S., H. Nakano, and N. Bartoo. 1992. Report of the Twelfth North PacificAlbacore Workshop, Shimizu, Japan July 23-25, 1991. NOAA Admin.Rep.NMFS-SWFC,La Jolla, 11-92-04:15 p.

228
ALBACORE FISHERIES INTERACTIONS IN THE SOUTH PACIFIC OCEAN
Talbot MurrayResearch Centre, MAFF Fisheries
P.O. Box 287Wellington, New Zealand
ABSTRACT
The potential for interactions among South Pacific albacore fisheries is reviewedbased on CPUE trends, recovery of tagged fish, albacore size composition in differentfleets, and patterns of recovery of fish damage,d by drift gillnets. Comparisons of CPUEfrom drift gillnet and troll fleets operating in the Subtropical Convergence Zone (1985/86-1989/90) and similar fleets operating in the Tasman Sea and off the west coast of NewZealand (1983/84-1989/90) suggest a reciprocal effect betwe,en surface fisheries. This issupported by a linear relationship between CPUE in the two components of the surfacefishery (drift gillnet and troll) that accounts for over 50% of the variation in CPUE inboth the Subtropical Convergence Zone and Tasman Sea. An interaction has also beenpostulated between surface and longline fisheries, albeit with some time lag, but there islittle to support this hypothesis.
INTRODUCTION
Longline fisheries for adult and surface troll fisheries for juvenile albacore haveoperated in the South Pacific for several decades. In the case of longlining, distant waterfleets from Japan, Taiwan, and Korea have caught albacore since the early 1950s, whiletrolling in nearshore New Zealand waters began in the early 1960s. High seas surfacefisheries for juveniles are a recent development, beginning in 1982 for the large-meshpelagic drift gillnet fishery and 1985 for the troll fishery. The drift gill net fisherystopped in June 1991 and has not subsequently operated in the South Pacific Ocean.
The rapid development of high seas surface fisheries and the limited informationavailable for stock assessment of South Pacific albacore raised concerns about thesustainability of harvests and the potential for interactions between fisheries. Concernover the latter, especially between surface and longline fisheries, was first raised in 1986(Anon., 1986). The rapid expansion in drift gillnet fishing between the 1986/87 and1988/89 fishing seasons (from about 900 mt to 25-49,000 mt) heightened these concerns(Anon., 1990, paragraphs 61-63) and extended the potential for interactions. In response,scientists from distant water fishing nations and South Pacific coastal states have workedthrough the South Pacific Commission's Tuna and Billfish Assessment Programme toimprove catch, effort, and size composition data from all South Pacific albacore fisheries.Supplementary studies of age, growth, stock structure, and reproductive biology as wellas estimates of bycatch, discarding practices and escapement have also been initiated.
While little data exists to quantify or even to demonstrate that interactions betweenSouth Pacific albacore fisheries have been strong, a range of observations suggests thatsome interactions occur. These include overlap in size of albacore caught in different
FAO LIBRARY AN: 346133
229
fisheries, overlap in the time and areas fished, recovery of drift gillnet-damaged albacorein troll and in longline fisheries, tag recoveries, reports of troll vessel entanglement indrift gillnets, disruption of troll fishing operations by drift.gillnet vessels, and reports oflower troll fishery catch rates in the proximity of drift gillnet vessels.
While interactions are likely to be strongest between fisheries operating in thesame area, at the same time, and targeting the same stock component (e.g., troll and driftgillnet fisheries), interactions with time lags of one or more season are also possible.Interactions with time lags have been discussed by Wetherall and Yong (1990). Based ontag recoveries in the longline fishery they postulate that interaction effects betweensurface and longline fisheries may be seen in a few months in longline fishing within orin areas immediately north of the Subtropical Convergence Zone (STCZ) or more broadlyin subsequent seasons. Murray (1990) made a similar observation based on the frequencyof recent drift gillnet-damaged albacore caught by longline in New Zealand waters severalmonths after the finish of the summer surface fisheries.
2. FISHERIES
Although the South Pacific albacore stock is broadly distributed (from the equatorto 50°S and from eastern Australia to South America), fisheries do not operate throughoutthis range. Industrial and small scale commercial fisheries operate both in the EEZs ofcoastal states and in high seas areas. Artisanal catches of albacore occur throughout theSouth Pacific in nearshore oceanic waters of island states and small recreational catches ofalbacore are made in Australian and New Zealand waters.
Surface fisheries are restricted to austral summer months, primarily December toApril. Fishing areas are further limited to mid-temperate latitudes where summer seasurface temperatures tend to be 16° to 21°C. In the South Pacific Ocean (including theTasman Sea) surface fisheries operate pfimarily between 39° and 41°S. Within thisnarrow latitudinal band, commercial catches are possible from the Australian coasteastward to at least 140°E. A surface fishery of unknown size is also reported to operateoff South America along the Chilean coast. The main areas of commercial surfacefisheries have been the central Tasman Sea (drift gillnet), west coast of New Zealand(troll), and the STCZ (troll and drift gillnet).
In contrast, the longline fishery operates in all months, moving from north tosouth seasonally. These patterns are described by Wang (1988) for the Taiwanese fleetand Wetherall and Yong (1989) for the Korean fleet; both fleets target albacore. Japaneselongliners catch albacore as a bycatch in fisheries directed toward bigeye, yellowfin andsouthern bluefin tuna. Consequently, the several longline fisheries operating in the SouthPacific exhibit different operational patterns. The general pattern of fleet movement forlongliners targeting albacore is southwards from January to April into subtropical watersnorth of the STCZ (some limited fishing occurs in the STCZ in April-May) and thennorthwards from July to October. Most longline fishing appears to be from 5° to 45°Swest of 120°W with relatively little effort in the Tasman Sea or the waters adjacent toNew Zealand. Developing longline fisheries which either target albacore (e.g., Fiji,French Polynesia, and Tonga) or catch albacore as bycatch (Australia, New Caledonia,and New Zealand) do not exhibit the high mobility of distant water longline fleets andgenerally operate within their EEZ or adjacent waters.

230
Albacore recruit to surface fisheries at about 45 cm fork length (LCF) in theTasman Sea, particularly around New Zealand and at a slightly larger size (50-55 cmLCF) east of New Zealand in the STCZ. Most of the surface fishery catch is comprisedof fish smaller than 80 cm LCF in all areas and years sampled (Labelle and Murray,1992). The size composition of the drift gillnet catch, while different, comprises thesame modes and exhibits an appreciable overlap with the size of fish caught in the trollfishery (Anon., 1991). Albacore recruit to the longline fishery at about 60 cm LCF andoverlap in size with those caught by surface fisheries in the range 60-80 cm LCF. Themajority of the longline catch is, however, comprised of fish larger than 80 cm LCF.
INFO ATION A li DATA AVAILABLE FOR INTERACTION STUDIES
Data on total catches, effort and size composition has been compiled for all SouthPacific albacore fisheries (Anon., 1993), although data quality, completeness, spatial andtemporal resolution varies. Data on catches and effort exist for the Japanese drift gillnetfleet (Watanabe, 1990) while data on the substantial Taiwanese fleet is limited toestimates of total catch and vessel numbers. Estimates of discarding and loss of fishduring landing are available for troll (Labelle and Murray, 1992) and drift gillnet fisheries(Sharpies et al., 1990) and for some components of the longline fishery. Aggregated sizecomposition data are available for Taiwanese and Korean longline vessels landing inAmerican Samoa; data from troll fisheries are available by area and time strata. Driftgillnet size composition is limited to one vessel in one season and one season'stransshipment monitoring.
Growth rate has been estimated from caudal vertebrae by Murray and Bailey(1989) and from length frequency data by Hampton et al. (1990). Labelle (1991) hashelped reduce some of the apparent discrepancy in parameter estimates between thesestudies reanalysing Murray and Bailey's (1989) data in light of tag recoveries since thesestudies. Growth rate varies with fish size and appears to be about 0.5 cm per month forjuveniles. Patterns of albacore movement have also been described by Jones (1991) usingtag recovery information and the spatial pattern in parasite fauna.
INTERACTION ISSUES
In the South Pacific discussion and data collection have focused on the potentialfor interactions between troll and drift gillnet fisheries for juvenile albacore and betweenthe surface fisheries for juveniles and longline fisheries for adults. Interactions betweengeographical areas have also been considered (e.g., the interaction between the high seasdrift gillnet fishery in the western Tasman Sea and the New Zealand troll fishery; surfacefisheries in the STCZ and the more northerly distributed longline fishery).
4.1 Interactions Between Surface Fisheries
The potential for interaction between troll and drift gillnet fisheries arises becausethey operate at the same time and in the same are,as and catches have similar sizecompositions. That the two fisheries compete for the same fish is also evident from thefrequent occurrence of albacore caught by trolling with recent drift gillnet damage(Hampton et al., 1989). Similarly, reports by albacore trollers of reduced catch rateswhen operating in the vicinity of drift gillnet vessels suggest that interactions occur.
231
Comparison of the data provided by Watanabe (1990) for drift gillnet CPUE with trollCPUE from Coan and Rensink (1991) in the years when both fisheries operated in theSTCZ supports this observation.
Figure 1 shows the trends in the two fisheries over the time period when thesefisheries operated in the STCZ. Despite the short CPUE time series (four years), 53% ofthe variation in the troll fishery CPUE can be explained by a linear relationship betweencatch rate in the troll and drift gillnet fisheries. Low troll fishery CPUE correspond withyears of high drift gillnet CPUE in the STCZ, increasing in years when drift gillnetCPUE is lower. The relationship between the performance of the New Zealand nearshorefishery in the eastern Tasman Sea and catch rate in the Tasman Sea drift gillnet fishery isshown in Figure 2. As in the STCZ surface fisheries, 52% of the variation in tonneslanded per trolling trip was explained by a linear relationship with drift gillnet CPUE inthe central and western Tasman Sea over the period 1983/84 through 1989/90. Continualdeclines in the two troll fisheries CPUE in 1990/91 and 1991/92 may indicate that otherfactors also affect troll fishery performance.
4.2 Interactions Between Surface and Longline Fisheries
Several observations suggest the potential for interactions to occur between surfaceand longline fisheries although with some time lag. These include: overlap in albacoresize composition in these fisheries (primarily fish 60-80 cm LCF), the end of the STCZsurface fishery (March-April) in temperate waters coincides with the start of the longlinefishery (April-May) in subtropical waters north of the STCZ and in the STCZ, tagrecovery patterns, and smaller-size,d albacore caught by longline with recent drift gillnetdamage. Wetherall and Yong (1989, 1990) attempted to use Taiwanese and Koreanlongline CPUE stratified by 5° latitudinal band to document an interaction betweensurface and longline fisheries following the historical peak of surface catches in 1988/89.They report that for Taiwanese and Korean longline fleets, CPUE immediately followingthe end of the 1988/89 surface fishery season (April-May) was the lowest of the previous15 years. However, the variability in CPUE data over the history of this fishery, absenceof more data when drift gillnet fle,ets operated, and changes in fishing effort by latitudewere also noted as potential explanations for CPUE declines.
Figure 3 depicts the range of variation represented in albacore-targeted longlinefisheries. While CPUE declines are evident in the latter years in subtropical andtemperate latitudes, they are within the range of variation seen prior to the expansion ofhigh seas surface fisheries. Hampton (1990) provides an indication of the potentialseverity of the interaction between surface and longline fisheries. He uses a sizestructured simulation model to predict the consequences of continuing surface fisherycatches at the historical high 1988/89 level. Using optimistic recruitment levels hepredicted that continued exploitation at the 1988/89 levels would at best, result in parentalstock declines over a 5 year period equivalent to 32% of pre-exploitation levels.
A reciprocal impact of the longline fishery on surface fisheries might also beexpected if surface fishery catches resulted in reduced recruitment to the spawning stockand subsequent reduced recruitment to the surface fishery. The likelihood of thisoccurring seems small since drift gillnet fleets have not operated in South Pacific since

232
Figure 1. Comparison of CPUE trends in South Pacific albacore surface fisheriesoperating in the STCZ, 1985/86-1989/90.
c\i
1984 1985 1986 1987 1988 1989 1990
year
R2= 0.53
drift gillnet CPUE (no. fish per operation)
100 200 300 400
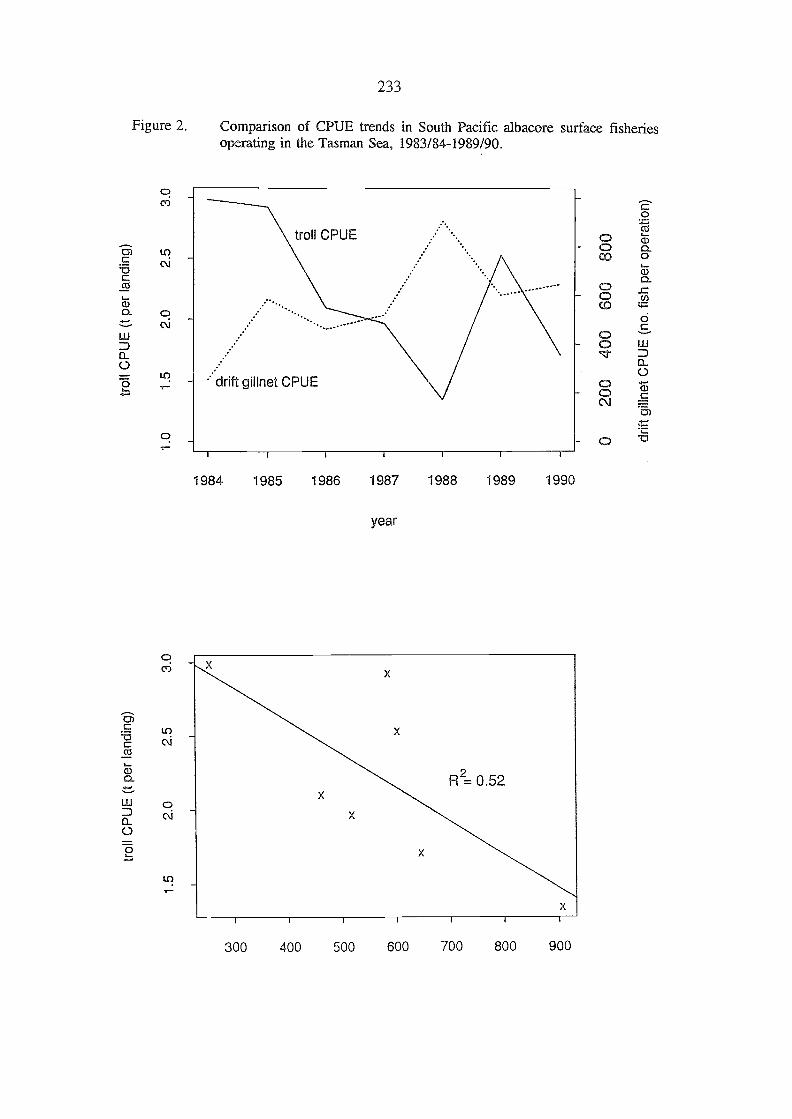
Figure 2. Comparison of CPUE trends in South Pacific albacore surface fisheriesoperating in the Tasman Sea, 1983/84-1989/90.
Q
Lo.
Qc\i
tn.-r-
233
X
2R = 0.52
300 400 500 600 700 800 900
1984 1985 1986 1987 1988 1989 1990
year
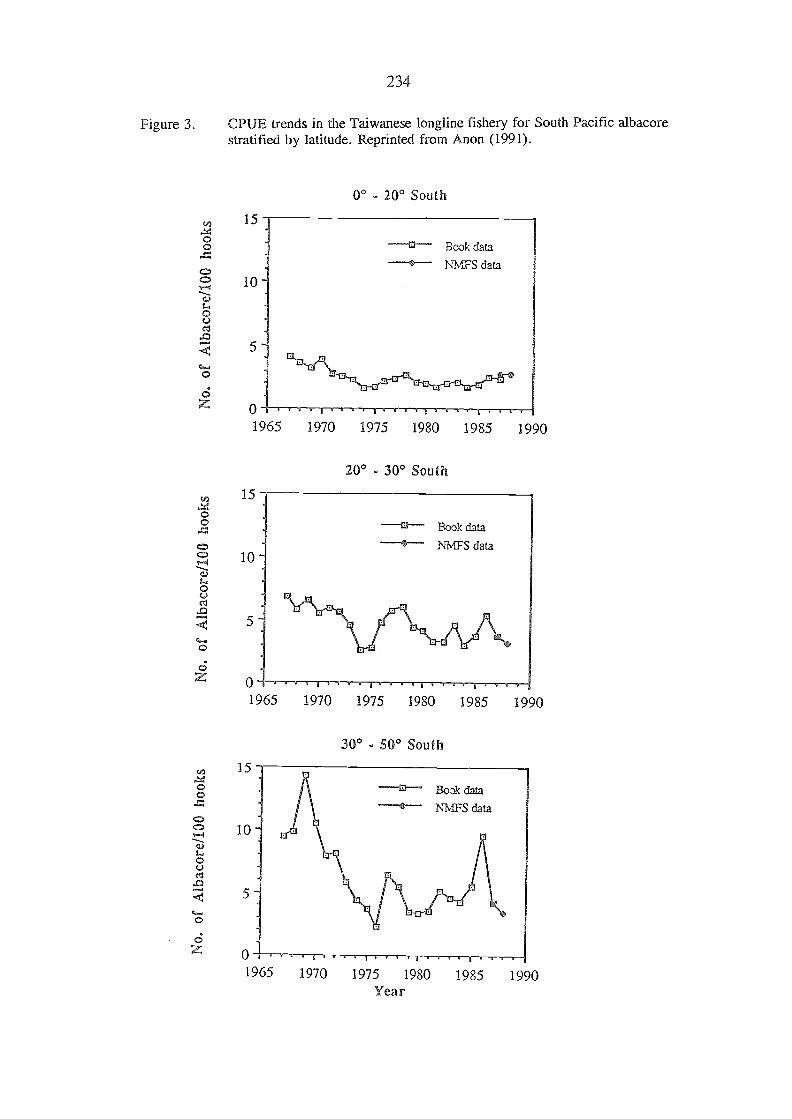
Figure 3. CPUE trends in the Taiwanese longline fishery for South Pacific albacorestratified by latitude. Reprinted from Anon (1991).
0° - 20° South
o6Z
234
1965 1970 1975 1980 1985 1990
200 - 300 South
0 i i I
1965 1970 1975 1980 1985 1990
30° - 50° South
1970 1975 1980 1985 1990Year
235
the 1991/92 season and both distant water longline fleets and troll fleets do not appear tobe increasing (Richards, 1993).
4.3 Interactions Between Fisheries Opera in in Different Areas
Interactions between albacore fisheries may operate over an appreciable distanceand with time lags of one or more years. Exceptions include the drift gillnet and trollfisheries which operated in the STCZ and the small amount of longline fishing in theSTCZ in March-April. The apparent interaction between the Tasman Sea drift gillnetfleet operating near Australia and the New Zealand troll fishery within a season has beendiscussed. The geographical scale over which this interaction was likely to operate isdiscussed by Murray (1990). He used the incidence of recent drift gillnet damage introll-caught albacore to indicate that the probable geographical scale of interactionbetween these fisheries was on the order of 900 km. Evidence of interactions over widerareas have not been observed in South Pacific albacore.
In most cases we might expect the magnitude of an interaction to lessen asdistance (or time) between two fisheries increases simply through mixing of affected andunaffected portions of the stock. The ability to distinguish an interaction given thevariability in availability of a stock or vulnerability to a gear type is also expected todiminish. The possible explanations for CPUE declines, which could not be distinguishedfrom an interaction between fisheries, noted by Wetherall and Yong (1990) highlight thedifficulties in confirming an interaction between fisheries operating on different stockcomponents in different areas.
5. CURRENT ASSESSMENT OF INTERACTIONS
That an interaction existed between drift gillnet and troll fisheries operating in theSTCZ and Tasman Sea (see Figures 1 and 2) is supported by the inverse relationshipbetween CPUE in each fishery. Comparisons of CPUE from these fisheries in theTasman Sea further suggests that interactions between surface fisheries can occur whenfisheries are separated by several hundreds of kilometres. The appearance of recent driftgillnet damage in the New Zealand nearshore troll catch when drift gillnet fishing wasrestricted to the western Tasman Sea adds support to this suggestion. However, the rapidincrease in drift gillnet fishing in the mid-1980s was followed by equally rapid fleetreductions and drift gillnet fleets have not operated in the South Pacific Ocean since July
1991.
Although interactions between drift gillnet and troll fisheries have stopped, there is
no reason to suspect that the potential for interaction between troll fleets or other surfacefisheries (e.g., artisanal, recreational, etc.) operating in different areas separate,d bydistances of hundreds of kilometres would not also interact to some degree. The extent towhich this might occur would likely depend on distance between them and the scale of thetroll fishery operating upstream of the summer migratory pattern. With the exception ofthe indications of a possible interaction provided by Wetherall and Yong (1990), there islittle evidence at present that surface and longline fisheries interact to an appreciable
extent.
236
Interactions between South Pacific albacore fisheries over extensive distances havenot been demonstrated and the potential for interactions between industrial albacorefisheries, small scale commercial, recreational or artisanal fisheries have not beenexamined because of inadequate data on catch and effort in these fisheries.
FUTURE STUDIES
With the cessation of drift gillnet fishing in the South Pacific from June 1991 inaccordance with United Nations resolution 44/225, there is a continuing need in studies offishery interaction to assess the potential interaction effects of the troll fishery on thelongline fishery. To date these studies have been constrained by inadequate data on thesize composition of the longline catch, longline catch and effort statistics for some fleets,and by low tag returns from all fisheries. There is a continuing need to improve datacoverage in longline fisheries, estimate non-reporting of tags in each fishery, and increasethe number of fish tagged and released (Labelle and Sharples, 1991).
Study of the relative changes in ye,ar classes affected by the 1988/89 surfacecatches in the longline fishery may also result in an estimate of an upper limit to thepotential for surface fishery expansion. The monitoring of the longline fishery sizecomposition in relation to the impacts of the 1988/89 surface catch shodld thereforecontinue.
REFERENCES CITED
Anonymous. 1986. Report of the Meeting. First South Pacific Albacore ResearchWorkshop, 4-6 June 1986, Auckland, New Zealand. S.Pac.Comm., 33 p.
Anonymous. 1990. Report of the expert consultation on large-scale pelagic driftnetfishing, 2-6 April 1990, Rome, Italy. FAO Fish.Rep., 434:78 p.
Anonymous. 1991. Report of the Meeting. Third South Pacific Albacore ResearchWorkshop, 9-12 October 1990, Noumea, New Caledonia. S. Pac.Comm. , 41 p.
Anonymous. 1993. Current status of the South Pacific albacore research (SPAR)database. Paper presented at the Fifth Meeting of the South Pacific Albacore Research(SPAR) Workshop, 29 March - 4 April 1993, Papeete, Tahiti, French Polynesia.S.Pac.Comm., WPI.
Coan, A.L., and G.M. Rensink. 1991. U.S. troll fishery for albacore in the SouthPacific. Paper presented at the Fourth Sout Pacific Albacore Research (SPAR)Workshop, 4-8 November 1991, Taipei, Taiwan. S. Pac.Comm. , WP11.
Hampton, J. 1990. Simulations of the South Pacific albacore population: effects of rapiddevelopments in the surface fishery. Paper presented at the Third South Pacific AlbacoreResearch (SPAR) Workshop, 9-12 October 1990. S.Pac.Comm., IP 1.
237
Hampton, J., D.A. Fournier, and J.R. Sibert. 1990. MULTIFAN analysis of SouthPacific albacore length-frequency data collected by observers, 1989-1990. Paperpresented at the Third South Pacific Albacore Research (SPAR) Workshop, 9-12 October1990, Noumea, New Caledonia. S.Pac.Comm., WP1.
Hampton, J., T. Murray, and P. Sharples. 1989. South Pacific albacore observerprogramme 1988-1989. Tech.Rep.Tuna Billfish Assess.Programme, S.Pac.Comm., 22:22 p.
Jones, J.B. 1991. Movements of albacore tuna (Thunnus alalunga) in the South Pacific:evidence from parasites. Mar.Biol., 111:1-9.
Labelle, M. 1991. Estimates of age and growth for South Pacific albacore. Paperpresented at the Fourth South Pacific Albacore Reseach (SPAR) Workshop, 4-8November 1991, Taipei, Taiwan. S.Pac.Comm., WP5.
Labelle, M., and T. Murray. 1992. South Pacific albacore observer programmesummary report, 1988-1991. Tech.Rep.Tuna Bilfish Assess.Programme, S.Pac. Comm.,26:23 p.
Labelle, M., and P. Sharpies. 1991. South Pacific albacore tagging programmesummary report 1990-1991. Paper presented at the Fourth South Pacific AlbacoreResearch (SPAR) Workshop, 4-8 November 1991, Taipei, Taiwan. S.Pac.Comm., WP2.
Murray, T. 1990. Review of research and of recent developments in South Pacificalbacore fisheries with emphasis on large-scale pelagic driftnet fishing. FAO Fish.Rep.,434:52-77.
Murray, T., and K. Bailey. 1989. Preliminary report on age determination of SouthPacific albacore using caudal vertebrae. Paper presented at the Second South PacificAlbacore Research (SPAR) Workshop, 14-16 June 1989, Suya, Fiji. S.Pac.Comm.,WP20.
Richards, A. 1993. Historical perspectives and trends of South Pacific albacore fleets.Paper presented at the Fifth South Pacific Albacore Research (SPAR) Workshop, 29March - 4 April 1993, Papeete, Tahiti, French Polynesia. S.Pac.Comm., WP22.
Sharpies, P., K. Bailey, P. Williams, and A. Allan. 1990. Report of observer activityon board JAMARC driftnet vessel R.V. Shin-hoyo Maru fishing for albacore in the SouthPacific Ocean. 22 November - 23 December 1989 and 10 February - 3 March 1990.Paper presented at the Third South Pacific Albacore Research (SPAR) Workshop, 9-12October 1990, Noumea, New Caledonia. S.Pac.Comm., WP3.
Wang, C.-H. 1988. Seasonal changes of the distribution of South Pacific albacore basedon Taiwan's tuna longline fisheries, 1971-1985. Acta Oceanographica Taiwan/ca, 20:13-40.

238
Watanabe, Y. 1990. Catch trends and length frequency of southern albacore caught byJapanese driftnet fishery. Paper presented at the Third South Pacific Albacore Research(SPAR) Workshop, 9-12 October 1990, Noumea, New Caledonia. S.Pac. Comm. , WP8.
Wetherall, J.A., and M.Y.Y. Yong. 1989. Use of longline catch rate statistics tomonitor the abundance of South Pacific albacore. Paper presented at the Second SouthPacific Albacore Rese,arch (SPAR) Workshop, 14-16 June 1989, Suya, Fiji.S.Pac. Comm. , WP11.
Wetherall, J.A. and M.Y.Y. Yong. 1990. South Pacific albacore longline CPUEmonitoring. Paper presented at the Third South Paific Albacore Research (SPAR)Workshop, 9-12 October 1990, Noumea, New Caledonia. S.Pac. Comm. , WP9.
239
A BRIEF ANALYSIS OF FISHERY INTERACTION FOR BIGEYEIN THE PACIFIC OCEAN
Naozumi MiyabeNational Research Institute of Far Seas Fisheries
Shimizu, Japan
ABS'l RA CT
Fishery interaction involving bigeye tuna in the Pacific Ocean was briefly analyzedin terms of yield per recruit. Since fishing mortality rate on this species is not knownprecisely and catch is not known for all the fishery components, several assumptions ofthe level of fishing mortality and catch by fishery components were made to perform thisstudy. The results indicate that in general, any increase of catch by the surface fisherywill lead to a decrease of yield per recruit except when fishing intensity of the longlinefishery is very small. There are also indications that at the current level of surfacefishing an increa.se in longline catch will cause a significant increase yield per recruit.
1. INTRODUCTION
Major fisheries which harvest tropical tunas are longline, purse-seine and baitboatfisheries. The longline fishery is conducted by three countries (Japan, Korea, andTaiwan) and covers the entire Pacific Ocean. Purse-seine and baitboat fisheries primarilyoccur in the e.astern and western sides of the Pacific. In the western Pacific, the Japanesebaitboat catch is the largest among the surface fisheries in terms of catch in weightprobably followed by the surface fisheries of the Solomon Islands (see Table 10 inMiyabe,1993). The baitboat fishery in the eastern Pacific is relatively small in itsmagnitude compared to the purse-seine fishery. The major purse-seine fleets operating inthe western Pacific include the USA, Japan, Taiwan, Korea, and the Philippines (Table1). Major purse-seine fishing countries in the eastern Pacific include the USA, Mexico,Ecuador and Venezuela (IATTC,1989).
Bigeye tuna, which is one of the tropical tunas, is the main target species for thelongline fishery but in other surface fisheries it forms smaller component of the catchcompared to the other tunas (Miyabe,1993). In this sense, the problem of interactionamong fisheries might be minimal for this species. There, however, do exist someinteractions, although they haven't been previously analyzed. Interactions amongfisheries (including ones within the same fishery) can occur among different areas, amongdifferent sizes of fish, and among the combination of these. It is considered thatinteraction on a geographically small scale, such as interaction among different fisheriesoperating both inside and outside the 200 mile EEZ of some countries, is hard to assesswithout having detailed information on catch, fishing effort, stock structure, migration
and so on.
Keeping these in mind, interactions between two types of fishery, i.e. , the longlineand surface fisheries which catch larger and smaller sizes of fish, respectively, are
FAO LIBRARY AN: 346135
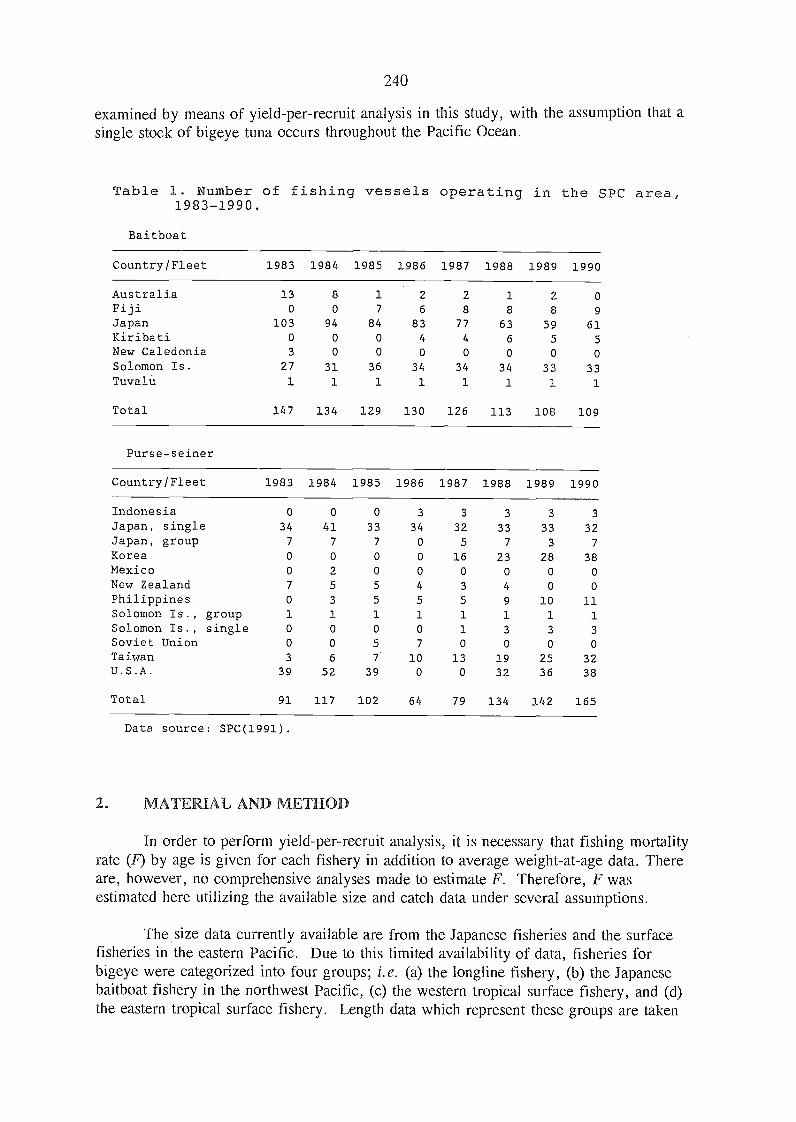
240
examined by means of yield-per-recruit analysis in this study, with the assumption that asingle stock of bigeye tuna occurs throughout the Pacific Ocea.n.
Table 1. Number of fishing vessels operating in the SPC area,
Data source: SPC(1991).
2. MATERIAL AND METHOD
In order to perform yield-per-recruit analysis, it is necessary that fishing mortalityrate (F) by age is given for each fishery in addition to average weight-at-age data. Thereare, however, no comprehensive analyses made to estimate F. Therefore, F wasestimated here utilizing the available size and catch data under several assumptions.
The size data currently available are from the Japanese fisheries and the surfacefisheries in the eastern Pacific. Due to this limited availability of data, fisheries forbigeye were categorized into four groups; i.e. (a) the longline fishery, (b) the Japanesebaitboat fishery in the northwest Pacific, (c) the western tropical surface fishery, and (d)the eastern tropical surface fishery. Length data which represent these groups are taken
1983-1990.
Baitboat
Country/Fleet 1983 1984 1985 1986 1987 1988 1989 1990
Australia 13 8 1 2 2 1 2 0
Fiji 0 0 7 6 8 8 8 9
Japan 103 94 84 83 77 63 59 61Kiribati 0 0 0 4 4 6 5 5
New Caledonia 3 0 0 0 0 0 0 0
Solomon Is. 27 31 36 34 34 34 33 33Tuvalu 1 1 1 1 1 1 1 1
Total 147 134 129 130 126 113 108 109
Purse-seiner
Country/Fleet 1983 1984 1985 1986 1987 1988 1989 1990
Indonesia 0 0 0 3 3 3 3 3
Japan, single 34 41 33 34 32 33 33 32Japan, group 7 7 7 0 5 7 3 7
Korea 0 0 0 0 16 23 28 38Mexico 0 2 0 0 0 0 0 0
New Zealand 7 5 5 4 3 4 0 0
Philippines 0 3 5 5 5 9 10 11Solomon Is., group 1 1 1 1 1 1 1 1
Solomon Is., single 0 0 0 0 1 3 3 3
Soviet Union 0 0 5 7 0 0 0 0
Taiwan 3 6 7 10 13 19 25 32U.S.A. 39 52 39 0 0 32 36 38
Total 91 117 102 64 79 134 142 165
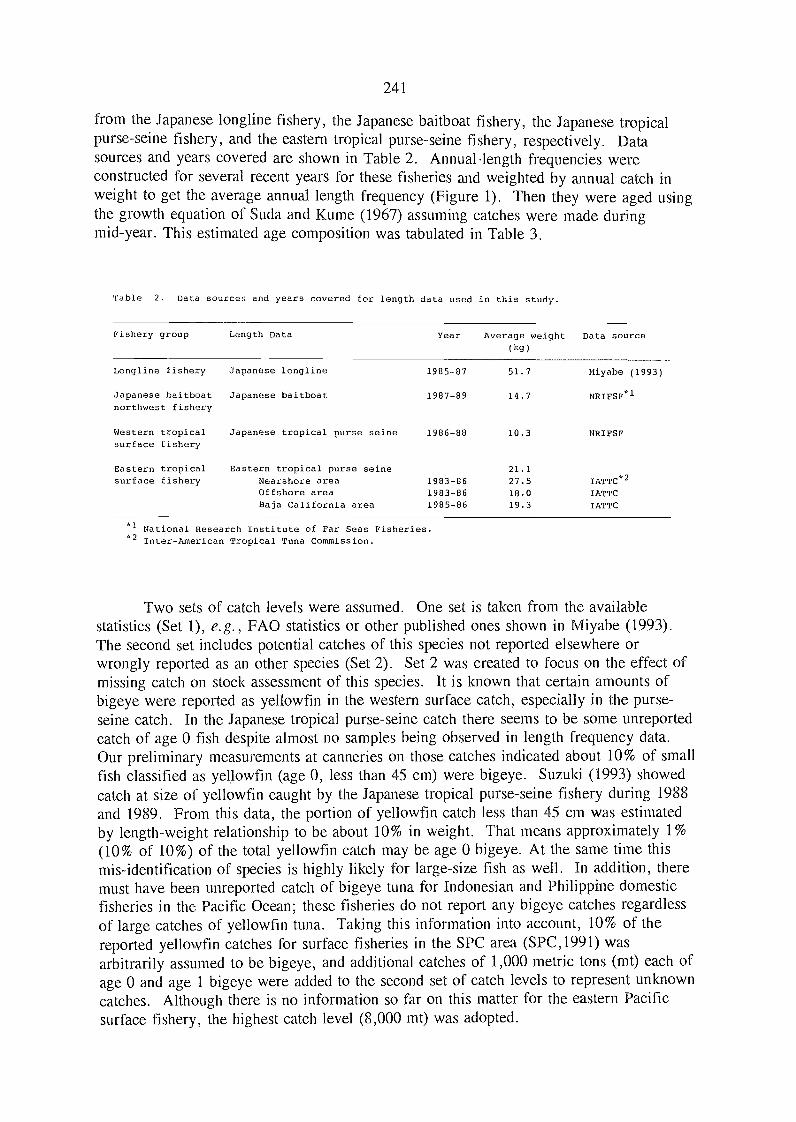
241
from the Japanese longline fishery, the Japanese baitboat fishery, the Japanese tropicalpurse-seine fishery, and the eastern tropical purse-seine fishery, respectively. Datasources and years covered are shown in Table 2. Annual length frequencies wereconstructed for several recent years for these fisheries and weighted by annual catch inweight to get the average annual length frequency (Figure 1). Then they were aged usingthe growth equation of Suda and Kume (1967) assuming catches were made duringmid-year. This estimated age composition was tabulate,d in Table 3.
'jable 2. Data sources and years covered for length data used in this study.
*1National Research Institute of Far Seas Fisheries.
*2 Inter-American Tropical Tuna Commission.
Two sets of catch levels were assumed. One set is taken from the availablestatistics (Set 1), e.g., FAO statistics or other published ones shown in Miyabe (1993).The second set includes potential catches of this species not reported elsewhere orwrongly reported as an other species (Set 2). Set 2 was created to focus on the effect ofmissing catch on stock assessment of this species. It is known that certain amounts ofbigeye were reported as yellowfin in the western surface catch, especially in the purse-seine catch. In the Japanese tropical purse-seine catch there seems to be some unreportedcatch of age 0 fish despite almost no samples being observed in length frequency data.Our preliminary measurements at canneries on those catches indicated about 10% of smallfish classified as yellowfin (age 0, less than 45 cm) were bigeye. Suzuki (1993) showedcatch at size of yellowfin caught by the Japanese tropical purse-seine fishery during 1988and 1989. From this data, the portion of yellowfin catch less than 45 cm was estimatedby length-weight relationship to be about 10% in weight. That means approximately 1%(10% of 10%) of the total yellowfin catch may be age 0 bigeye. At the same time thismis-identification of species is highly likely for large-size fish as well. In addition, theremust have been unreported catch of bigeye tuna for Indonesian and Philippine domesticfisheries in the Pacific Ocean; these fisheries do not report any bigeye catches regardlessof large catches of yellowfin tuna. Taking this information into account, 10% of thereported yellowfin catches for surface fisheries in the SPC area (SPC,1991) wasarbitrarily assumed to be bigeye, and additional catches of 1,000 metric tons (mt) e,ach ofage 0 and age 1 bigeye were added to the second set of catch levels to represent unknowncatches. Although there is no information so far on this matter for the eastern Pacificsurface fishery, the highest catch level (8,000 mt) was adopted.
Fishery group Length Data Year Average weight(kg)
Data source
Longline fishery Japanese longline 1985-87 51.7 Miyabe (1993)
Japanese baitboatnorthwest fishery
Japanese baitboat 1987-89 14.7 NRIFSF*1
Western tropicalsurface fishery
Japanese tropical purse seine 1986-88 10.3 NRIFSF
Eastern tropical Eastern tropical purse seine 21.1surface fishery Nearshore area 1983-86 27.5 IATTC*2
Offshore area 1983-86 18.0 IATTCBaja California area 1985-86 19.3 IATTC
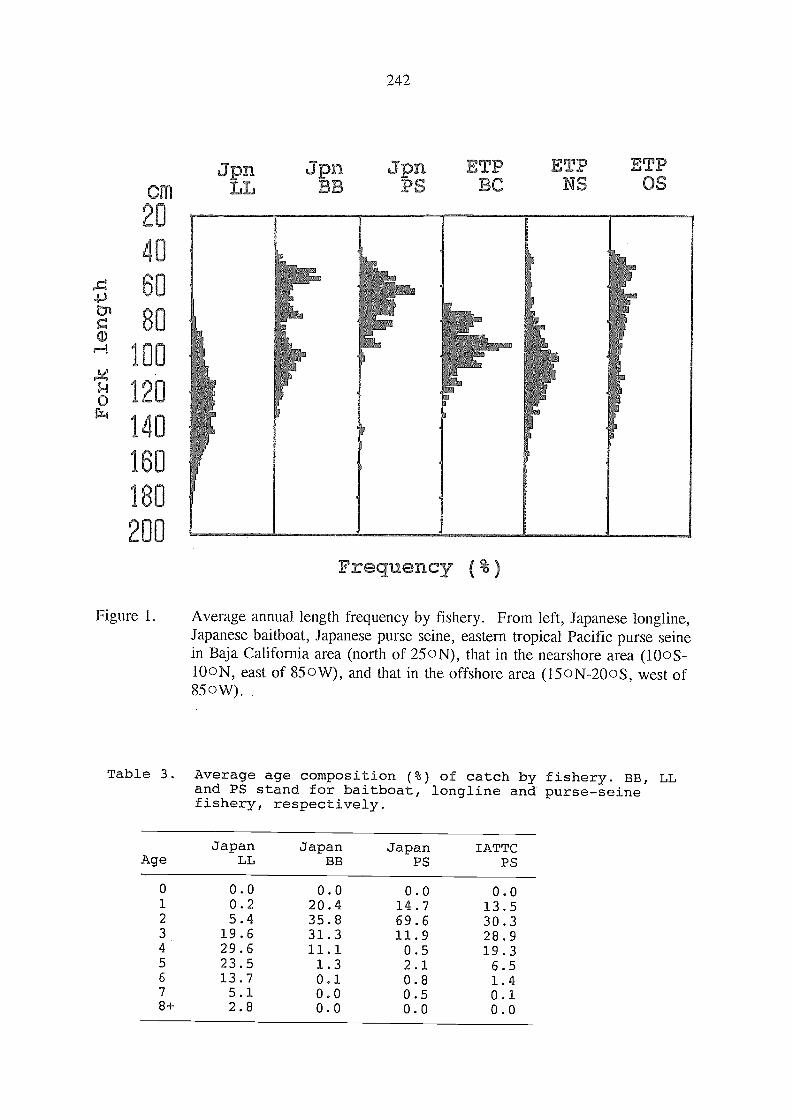
cm
20
40
4 60
tE 80
100
120
140
160
180
200
Figure 1.
JpnLL
242
Jpn Jpn.7D- PS
ETPBC
Frequency ( % )
Average annual length frequency by fishery. From left, Japanese longline,Japanese baitboat, Japanese purse seine, eastern tropical Pacific purse seinein Baja California area (north of 250N), that in the nearshore area (100S-
100N, east of 850w), and that in the offshore area (150N-200S, west of850W).
ETP ETPNS OS
Table 3. Average age composition (%) of catch by fishery. BB, LLand PS stand for baitboat, longline and purse-seinefishery, respectively.
AgeJapan
LLJapan
BBJapan
PSIATTC
PS
0 0.0 0.0 0.0 0.01 0.2 20.4 14.7 13.52 5.4 35.8 69.6 30.33 19.6 31.3 11.9 28.94 29.6 11.1 0.5 19.35 23.5 1.3 2.1 6.56 13.7 0.1 0.8 1.47 5.1 0.0 0.5 0.18+ 2.8 0.0 0.0 0.0
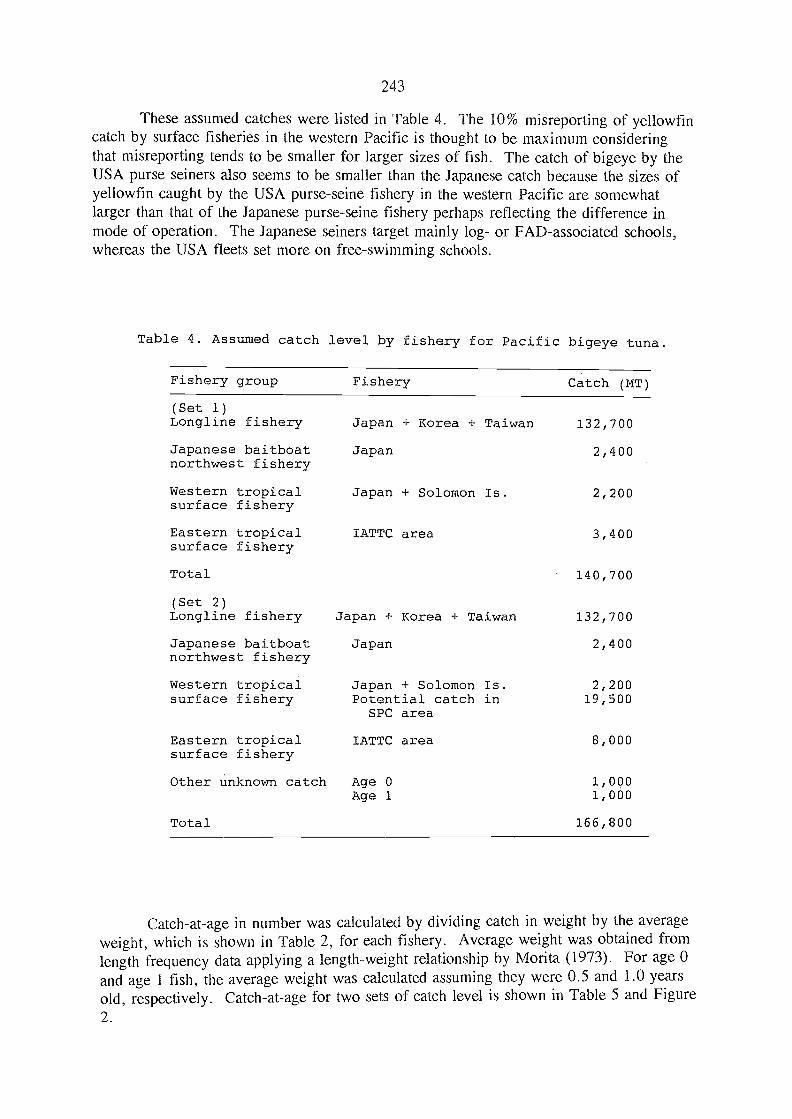
2.
Fishery group
(Set 1)Longline fishery
Japanese baitboatnorthwest fishery
Western tropicalsurface fishery
Eastern tropicalsurface fishery
Total
(Set 2)Longline fishery
Japanese baitboatnorthwest fishery
Western tropicalsurface fishery
Eastern tropicalsurface fishery
Other Unknown catch
Total
243
These assumed catches were listed in Table 4. The 10% misreporting of yellowfincatch by surface fisheries in the western Pacific is thought to be maximum consideringthat misreporting tends to be smaller for larger sizes of fish. The catch of bigeye by theUSA purse seiners also seems to be smaller than the Japanese catch because the sizes ofyellowfin caught by the USA purse-seine fishery in the western Pacific are somewhatlarger than that of the Japanese purse-seine fishery perhaps refle,cting the difference inmode of operation. The Japanese seiners target mainly log- or FAD-associated schools,whereas the USA fleets set more on free-swimming schools.
Table 4. Assumed catch level by fishery for Pacific bigeye tuna.
Catch-at-age in number was calculated by dividing catch in weight by the averageweight, which is shown in Table 2, for each fishery. Average weight was obtained fromlength frequency data applying a length-weight relationship by Monta (1973). For age 0and age 1 fish, the average weight was calculated assuming they were 0.5 and 1.0 yearsold, respectively. Catch-at-age for two sets of catch level is shown in Table 5 and Figure
Fishery Catch (MT)
Japan + Korea + Taiwan 132,700
Japan 2,400
Japan + Solomon Is. 2,200
IATTC area 3,400
140,700
Japan + Korea + Taiwan 132,700
Japan 2,400
Japan + Solomon Is. 2,200Potential catch in 19,500SPC area
IATTC area 8,000
Age 0 1,000Age 1 1,000
166,800
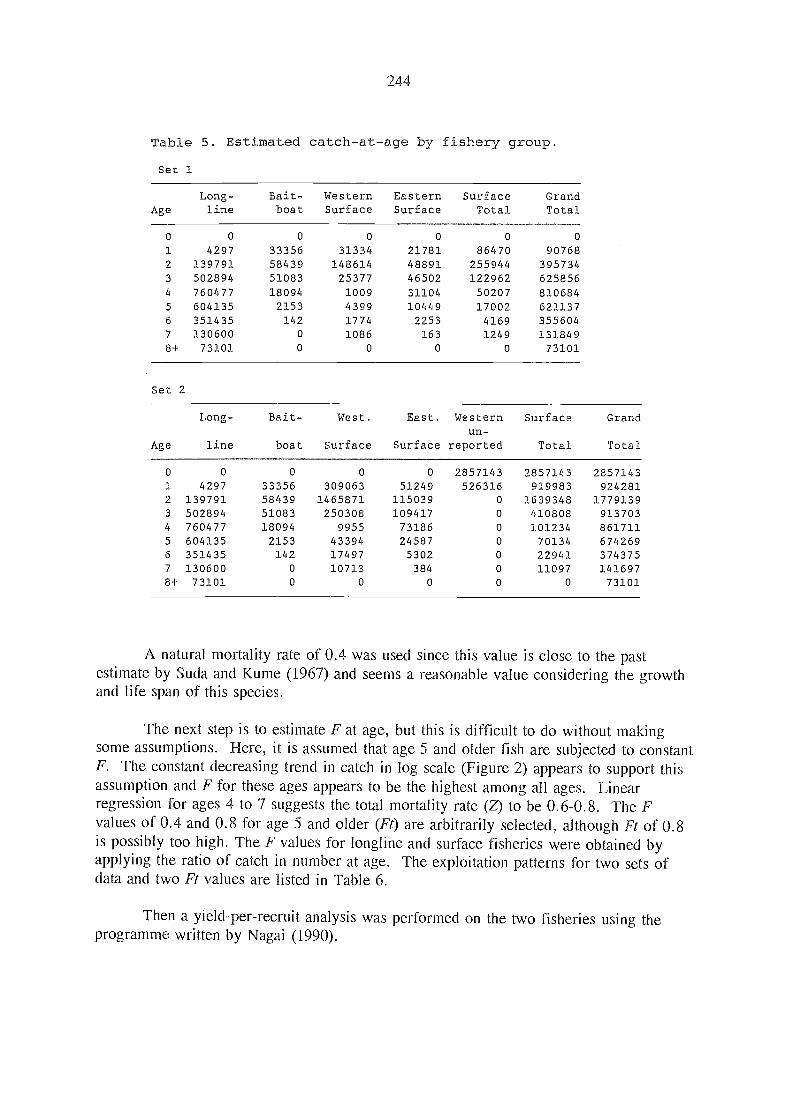
244
Table 5. Estimated catch-at-age by fishery group.
Set 1
Set 2
Long- Bait- West. East. Western Surface Grandun-
Age line boat Surface Surface reported Total Total
A natural mortality rate of 0.4 was used since this value is close to the pastestimate by Suda and Kume (1967) and seems a reasonable value considering the growthand life span of this species.
The next step is to estimate F at age, but this is difficult to do without makingsome assumptions. Here, it is assumed that age 5 and older fish are subjected to constantF. The constant decreasing trend in catch in log scale (Figure 2) appears to support thisassumption and F for these ages appears to be the highest among all ages. Linearregression for ages 4 to 7 suggests the total mortality rate (Z) to be 0.6-0.8. The Fvalues of 0.4 and 0.8 for age 5 and older (Ft) are arbitrarily selected, although Ft of 0.8is possibly too high. The F values for longline and surface fisheries were obtained byapplying the ratio of catch in number at age. The exploitation patterns for two sets ofdata and two Ft values are listed in Table 6.
Then a yield-per-recruit analysis was performed on the two fisheries using theprogramme written by Nagai (1990).
0 0 0 0 0 2857143 2857143 28571431 4297 33356 309063 51249 526316 919983 9242812 139791 58439 1465871 115039 0 1639348 17791393 502894 51083 250308 109417 0 410808 9137034 760477 18094 9955 73186 0 101234 8617115 604135 2153 43394 24587 0 70134 6742696 351435 142 17497 5302 0 22941 3743757 130600 0 10713 384 0 11097 1416978+ 73101 0 0 0 0 0 73101
AgeLong-line
Bait-boat
WesternSurface
EasternSurface
SurfaceTotal
GrandTotal
o o o o o o o
1 4297 33356 31334 21781 86470 907682 139791 58439 148614 48891 255944 395734
3 502894 51083 25377 46502 122962 625856
4 760477 18094 1009 31104 50207 8106845 604135 2153 4399 10449 17002 6211376 351435 142 1774 2253 4169 355604
7 130600 0 1086 163 1249 131849
8+ 73101 0 0 0 0 73101
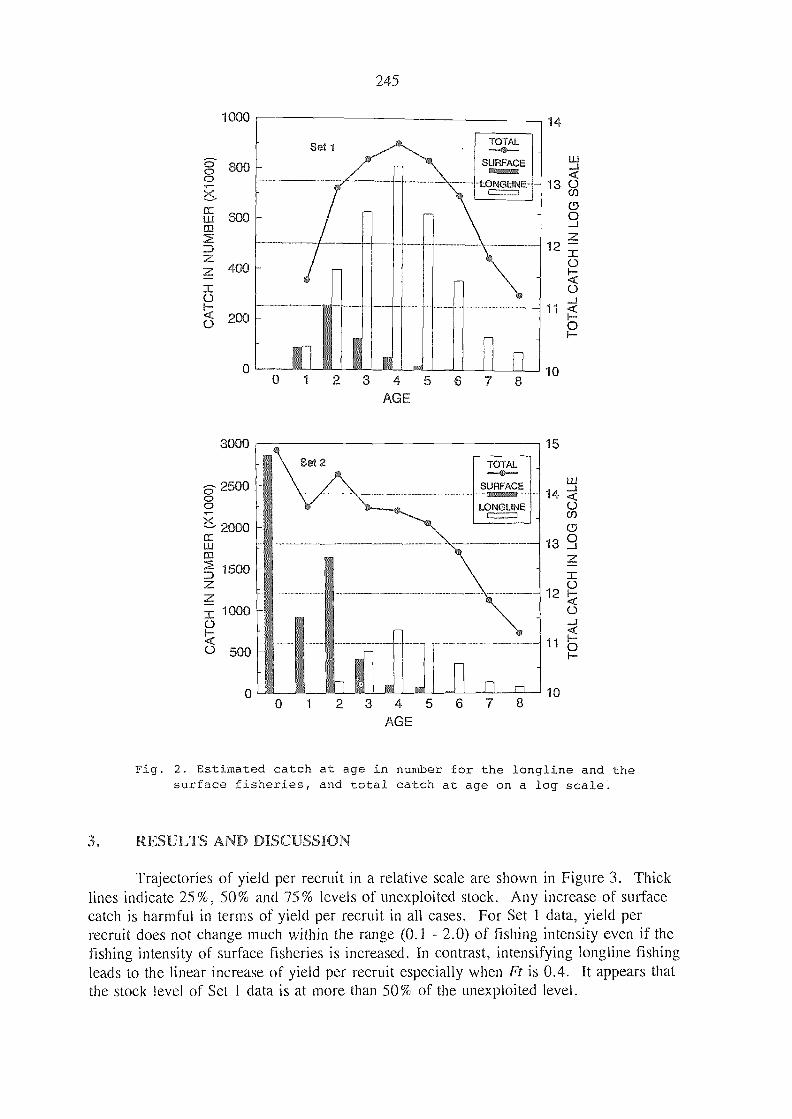
1000
En2
z400
0200
o1 2
245
4AG E
TOTALe
SURFACE
LONGUNE-
6 78
14
10
Fig. 2. Estimated catch at age in number for the longline and thesurface fisheries, and total catch at age on a log scale.
3. RESULTS AND ISCUSSION
Trajectories of yield per recruit in a relative scale are shown in Figure 3. Thicklines indicate 25%, 50% and 75% levels of unexploited stock. Any increase of surfacecatch is harmful in terms of yield per recruit in all cases. For Set 1 data, yield perrecruit does not change much within the range (0.1 - 2.0) of fishing intensity even if thefishing intensity of surface fisheries is increased. In contrast, intensifying longline fishingleads to the linear increase of yield per recruit especially when Ft is 0.4. It appears thatthe stock level of Set 1 data is at more than 50% of the unexploited level.
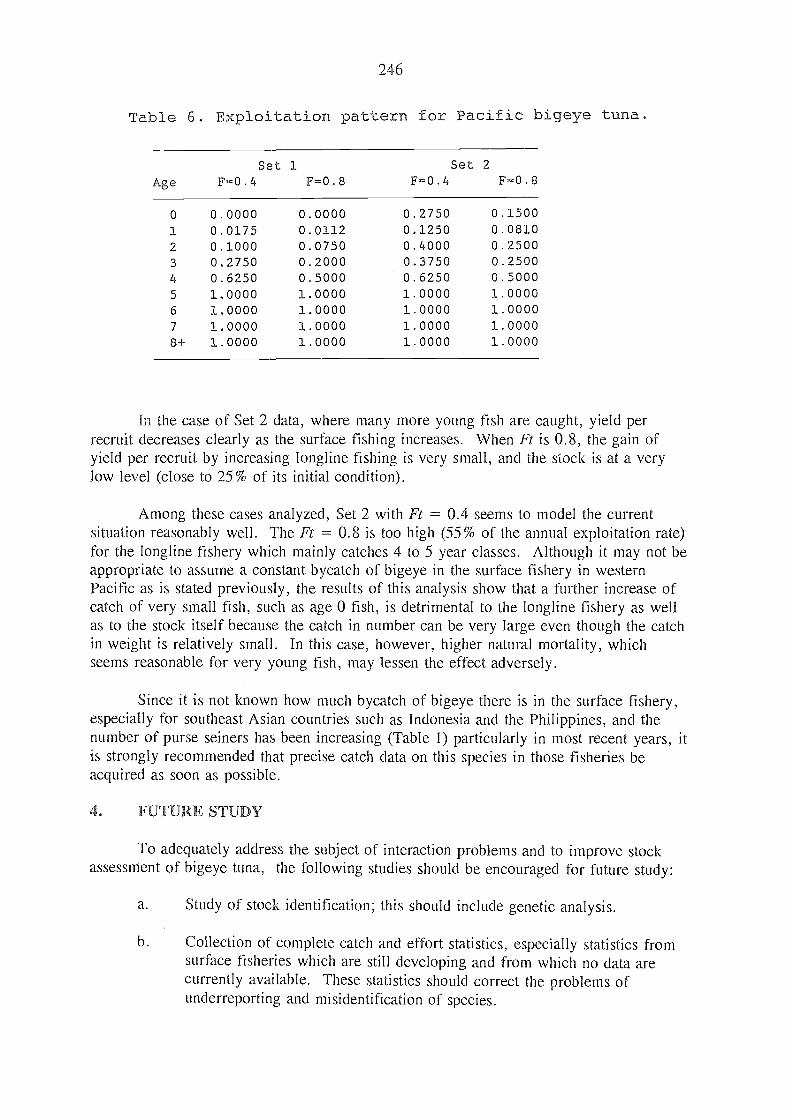
246
Table 6. Exploitation pattern for Pacific bigeye tuna.
In the case of Set 2 data, where many more young fish are caught, yield perrecruit decreases clearly as the surface fishing increases. When Ft is 0.8, the gain ofyield per recruit by increasing longline fishing is very small, and the stock is at a verylow level (close to 25% of its initial condition).
Among these cases analyzed, Set 2 with Ft = 0.4 seems to model the currentsituation reasonably well. The Ft = 0.8 is too high (55% of the annual exploitation rate)for the longline fishery which mainly catches 4 to 5 year classes. Although it may not beappropriate to assume a constant bycatch of bigeye in the surface fishery in westernPacific as is stated previously, the results of this analysis show that a further increase ofcatch of very small fish, such as age 0 fish, is detrimental to the longline fishery as wellas to the stock itself because the catch in number can be very large even though the catchin weight is relatively small. In this case, however, higher natural mortality, whichseems reasonable for very young fish, rnay lessen the effect adversely.
Since it is not known how much bycatch of bigeye there is in the surface fishery,especially for southeast Asian countries such as Indonesia and the Philippines, and thenumber of purse seiners has been increasing (Table 1) particularly in most recent years, itis strongly recommended that precise catch data on this species in those fisheries beacquired as soon as possible.
4. FUTURE STUDY
To adequately address the subject of interaction problems and to improve stockassessment of bigeye tuna, the following studies should be encouraged for future study:
Study of stock identification; this should include genetic analysis.
Collection of complete catch and effort statistics, especially statistics fromsurface fisheries which are still developing and from which no data arecurrently available. These statistics should correct the problems ofunderreporting and misidentification of species.
Set 1 Set 2Age F=0.4 F=0.8 F=0.4 F=0.8
0 0.0000 0.0000 0.2750 0.15001 0.0175 0.0112 0.1250 0.08102 0.1000 0.0750 0.4000 0.25003 0.2750 0.2000 0.3750 0.25004 0.6250 0.5000 0.6250 0.50005 1.0000 1.0000 1.0000 1.00006 1.0000 1.0000 1.0000 1.00007 1.0000 1.0000 1.0000 1.00008+ 1.0000 1.0000 1.0000 1.0000
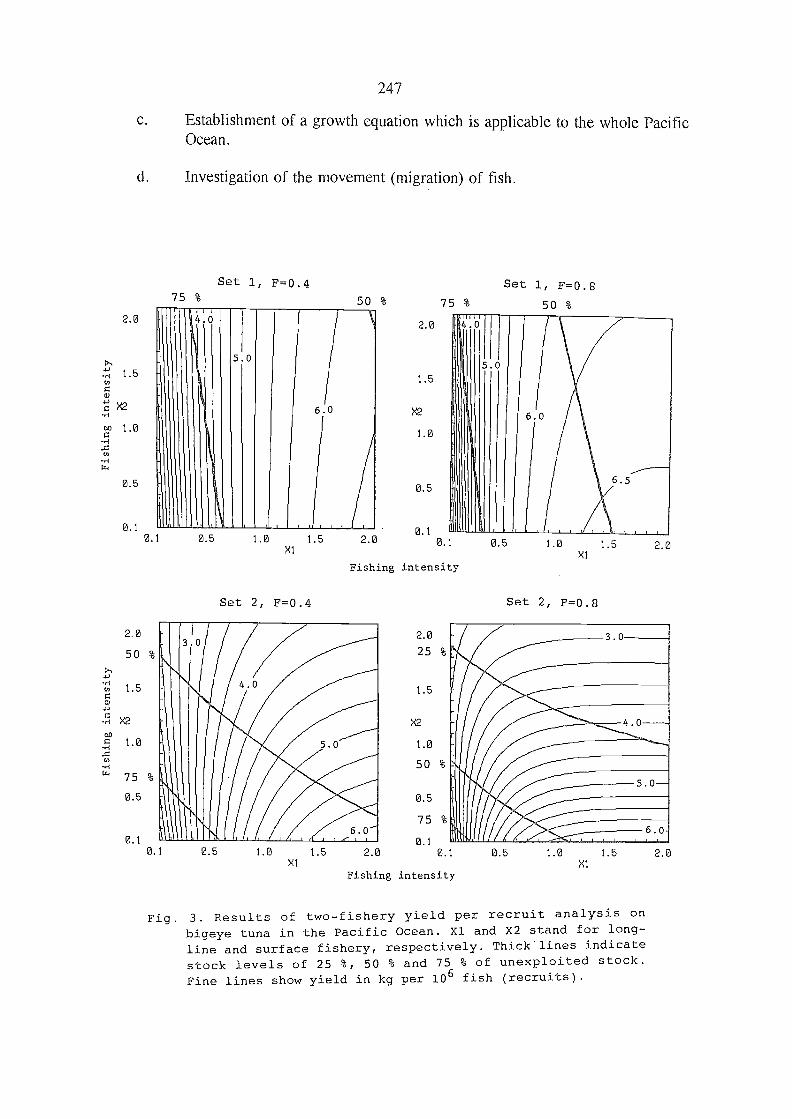
2.0
0.5
0.1
2.0
50 %
0.5
0.1
Establishment of a growth equation which is applicable to the whole PacificOcean.
Investigation of the movement (migration) of fish.
0.1
0.1
75 %Set 1, F=0.4
0.5
0.5 1.0 1.5X1
50 %
247
X2
2.0
1.5
1.0
0.5
0.1
0.
Fishing intensity
2.0
0.5
75
0.1
2.0 0.1
Fishing intensity
75 %
0.5
Set 1, F=0.8
50 %
1.0 1.5X1
Fig. 3. Results of two-fishery yield per recruit analysis on
bigeye tuna in the Pacific Ocean. X1 and X2 stand for long-
line and surface fishery, respectively. Thick lines indicate
stock levels of 25 %, 50 % and 75 % of unexploited stock.
Fine lines show yield in kg per 106 fish (recruits).
2.0
2.0
2..0 1.5X1
Set 2, F=0.4 Set 2, F=0.8
0.5 1.0 1.5X1
5. REFERENCES CITED
IATTC. 1989. Annual report of the Inter-American Tropical Tuna Cornmission, 1988.Annu.Rep.I-ATTC, (1978):288 p.
Miyabe, N. 1993. A review of the biology and fisheries for bigeye tuna, Thunnusobesus, in the Pacific Ocean. In Proceedings of the First FAO Expert Consultation onInteractions of Pacific Tuna Fisheries, edited by R.S. Shomura, J. Majkowski, and S.Langi, 3-11 December 1991, New Caledonia. [See this document.]
Monta, Y. 1973. Conversion factors for estimating live weight from gilled-and-guttedweight of bigeye and yellowfin tunas. Bull.Far Seas Fish.Res.Lab., (9):109-21.
Nagai, T. 1990. Yield per recruit analysis between two fisheries. In Collective Volumeof Programs on Stock Analysis using Personal Computer (II), edited by BiologicalEcology Division. Nat.Res.Inst.Fish.Sci., pp. 204-11.
SPC. 1991. Status of tuna fisheries in the SPC area during 1990, with annual catchessince 1952. Paper presented at the Fourth Standing Committee on Tuna and Billfish,South Pacific Commission, 17-21 June, 1991, Port Vila, Vanuatu, WP/3:75 p.
Suda, A., and S. Kume. 1967. Survival and recruit of bigeye tuna in the Pacific Ocean,estimated by the data of tuna longline catch. Rep.Nankai Reg.Fish.Res.Lab.,(25):91-104.
Suzuki, Z., 1993. A brief review of interactions between the fisheries on yellowfintuna, Thunnus albacares, in the western and central Pacific Ocean. In Procee,dings of theFirst FAO Expert Consultation on Interactions of Pacific Tuna Fisheries, edited by R.S.Shomura, J. Majkowski, and S. Langi, 3-11 December 1991, Noumea, New Caledonia.[See this document.]
248
INTERACT
249
NS AMONG FISHERIES FOR NORTHERN BLUEFIN TUNA,THUNNUS THYNNUS, IN THE PACIFIC OCEAN
William H. BayliffInter-American Tropical Tuna Commission
La Jolla, California, USA
ABSTRACT
The most important interactions which take place among fisheries for northern bluefintuna are those between the fisheries of the western and the eastern Pacific Oceans and thoseamong the various fisheries of the western Pacific Ocean. The yields per recruit for both thewestern and eastern Pacific Ocean would increase if the age at entry for all fisheries wereincreased to about 1 year. The yield per recruit for the western Pacific Ocean would increaseeven more if the age at entry for all fisheries were increased to about 2 1/2 years, but thiswould nearly eliminate the eastern Pacific fishery. Only limited information is available onthe interactions among the fisheries of the western Pacific.
INTRODUCTION
Parts of this report are similar to parts of a section entitled NOR'THERN BLUEFIN inBayliff (1993b).
INTERACTION ISSUES
There are two basic types of interactions among the fisheries which take northernbluefin tuna, interactions between ocean areas (eastern, centrad, and western Pacific) andinteractions within ocean arcas.
2.1 Interactions Between Ocean Areas
Northern bluefin are recruited to the troll fishery for small fish in the western PacificOcean (WPO). Some of them remain in the WPO and others, after exposure to the trollfishery and other fisheries in the WPO, migrate to the eastern Pacific Ocean (EPO). In theEPO they are exploited by the purse-seine fishery and, to a much lesser extent, by other typesof commercial gear and by sport gear. After a sojourn in the EPO, the fish which are notcaught and do not succumb to natural mortality return to the WPO, where they are exposed tofurther exploitation. Accordingly, there is important interaction between the fisheries of theWPO and the EPO.
It is known that bluefin have been caught by the gillnet and baitboat fisheries of thecentral Pacific Ocean (CPO) (Bayliff et al., 1991: Table 6). The data presented by Bayliff(1993c: Table 9) include catches by Japanese vessels in the EPO (longline) and the CPO(longline, gillnet, and baitboat), as well as the WPO, as data in which these catches arestratified by area are not available. Bayliff (1993c) used unstratified data to obtain a roughestimate of 1,000 bluefin caught by the Japanese squid gillnet fishery in the north PacificOcean during 1990. Unless this estimate is greatly in error, it appears that the squid gillnet
FAO LIBRARY AN: 346137

250
fishery has had little effect on the fisheries of the EPO and the WPO.
Substantial amounts of bluefin are caught by longlining (Bayliff, 1993c: Figure 2 andTable 9). Since longline-caught fish are usually larger than fish caught by other gears, thefisheries by other gears presumably have a considerable effect on the longline fishery, but thelongline fishery has a much lesser effect on the other fisheries. The longline fishery, if itreduces the recruitment, could reduce the catches by the other fisheries, but there have be,enno attempts to determine whether this is the case.
2.2 Interactions Within the Eastern Pacific Ocean
Northern bluefin are caught almost exclusively by purse seining in the EPO, so theprincipal interaction is that between Mexican- and U.S.-flag vessels. The fish usually appearfirst off Mexico in about May or June, and are taken in waters off both Mexico and theUnited States during July, August, September, and October (Bayliff, 1993c: Figure 6).
2.3 Interactions Within the Western Pacific Ocean
Northern bluefin are taken by trolling vessels, traps, purse seines, baitboats, gillnets,handlines, and longlines in the WPO (Bayliff, 1993c: Table 9), and the activities of each typeof gear affect the catches of those which take fish of the same size or larger fish.
2.4 Interactions Within the Central Pacific Ocean
Northern bluefin have been taken by longlines, gillnets, and baitboats in the CPO. Thegillnets and baitboats take smaller fish than do the longlines.
EVANT TO STUDIES OF
Data on catches, standardized fishing effort, growth of the fish, fishing and naturalmortality, age composition of the fish in the catches, and their movements and migrations areneeded for studying the interactions of the fisheries which exploit northern bluefin.Information on these is given by Bayliff (1993c).
Good data for the catches by the surface fishery of the EPO are available (Bayliff,1993c: Tables 7 and 8). Fairly good data on the annual catches by the surface fisheries of theWPO and the CPO are available (Bayliff, 1993c: Tables 8 and 9), although the catches ofsmall bluefin are estimated by proration from the reported catches of meji (small bluefin,bigeye, and yellowfin). Also, the data are not stratified by area, month, or size groups.
Bayliff (1993c: Figure 8) gives estimates of the purse-seine effort directed towardbluefin and the catches per unit of effort of bluefin in the EPO during the 1960-1991 period.Because there were insufficient data to compare the catch rates of vessels of different sizes,he made no attempt to standardize the data by size classes of vessels. Except for data on thenumbers of Japanese purse-seine vessels and traps (Skillman and Shingu, 1980), noinformation is available on fishing effort for northern bluefin for the WPO.
The growth of northern bluefin for the first few years of life has been estimated from
3. DATA CURRENTLY AVAILABLE WHICH ARE !INTERACTIONS
251
tagging data (Bayliff et al., 1991: Table 5) and from length-frequency data (Yokota et al.1961: 217; Bayliff, 1993a). The length-frequency data show seasonal variation in thegrowth, but the tagging data do not, probably because the numbers of returns of tagged fishare insufficient for this purpose. The growth of bluefin has also been estimated from hard-part data (Bayliff et al., 1991: Table 3). The estimates of growth from hard-part data for fishup to about 150 cm in length agree fairly well with those from tagging and length-frequencydata, but there is no way to verify the estimates for the larger fish.
No estimates of the rates of fishing mortality of northern bluefin in the Pacific Oceanhave been made. The natural mortality has been estimated only by the method of Pauly(1980), in which estimates of K and L in the von Bertalanffy growth equation and data for
cothe average temperature at which bluefin occur are compared with corresponding data forother stocks for which estimates of the natural mortality are available. The estimate derivedby this method, 0.276 on an annual basis (Bayliff, 1993c), is fairly close to those made byother methods for northern bluefin in the Atlantic Ocean (Clay, 1991) and for southernbluefin (Hearn, 1991).
Estimates of the age compositions of northern bluefin in the catches of both the EPOand the WPO have been made (Bayliff, 1993e: Tables 11 and 12). The estimates areprobably reasonably accurate for the younger fish (0 to about 3 or 4 years old), but they maybe inaccurate for the older fish. (In this report fish in their first year of life are referred to as0-year olds, age-0 fish, or fish 0 years of age, and so on.)
The principal features of the movements and migrations of northern bluefin are known,but the information is not sufficiently quantitative for many purposes It has been established(Bayliff et al., 1991; Bayliff, 1993a) that the proportion of young fish which migrate from theWPO to the EPO varies considerably from year to year and that the timing of this migrationalso varies from year to year. Information on the timing of the migration from the EPO to theWPO is sparse.
4. CURRENT ASSESSMENTS OF INTERACTIONS
4.1 Interactions Between the Western and Eastern Pacific
4.1.1 Migration between the two ocean areas
There has been a decline in the catches of northern bluefin in the EPO in recent years.This decline could be due to (1) a decrease in recruitment, (2) a decrease in the overallabundance of fish greater than about 60 cm in length caused by heavy exploitation of age-0fish in the WPO, (3) reduced fishing effort in the EPO, (4) a decrease in vulnerability tocapture of the fish which have migrated to the EPO, and/or (5) a decrease in the availabilityof bluefin in the EPO (i. e. a decrease in the proportion of the population which has migrated
to the EP() or a shorter average sojourn in the EPO of the fish which have made that
migration).
In regard to Points 1 and 2 above, data for the age composition of the catch of bluefin
during 1966-1986 by :Japanese vessels (Bayliff, 1993c: Table 12) indicate that there has not
been a decline in the catches of age-0 fish, which seems to rule out the first possibility, nor anincrease in the proportion of age-0 to older fish, which seems to rule out the second
possibility.
Proceeding now to Point 3, the numbers of smaller purse seiners, which previous to thelate 1970s had been responsible for most of the bluefin catches in the EPO, declined duringthe late 1970s and the 1980s. Bayliff (1993c: Section 11.1.3) concluded that reduced effort ispartly, but not entirely, responsible for the reduced catches in the EPO.
In regard to Point 4, the distribution of bluefin in the EPO seems to have changedduring this century. Prior to 1930 they were caught only off California, although theyprobably occurred off Baja California as well. During the 1930-1947 period they werecaught off both California and Baja California, but greater catches were made off Californiain most years. From 1948 to the present most of the catch has been made off Baja California.Fishermen based in California seem to direct more of their effort toward bluefin than dothose based in Mexico, so the shift in distribution may have decreased the vulnerability ofbluefin to capture. This shift took place well before the 1980s, however, so it does not appearthat it is the cause of the poor catches during that decade.
The tagging data (Bayliff et al., 1991) and age-composition data (Bayliff, 1993a)provide some useful information in regard to Point 5. It can be seen in Table 1 that only the1981 year class contributed significant numbers of returns to the EPO fishery during Year 1.It can also be seen that for Year 2 nearly half the retums for the 1979 year class and morethan half of those for the 1983 and 1984 year classes were from fish caught in the EPO. Thisinformation suggests that the proportion of age-1 fish which migrated to the EPO wasgreatest for the 1981 year class and that the proportions of age-2 fish which migrated to theEPO were greatest for the 1983 and 1984 year classes, intermediate for the 1979 year class,and least for the 1980, 1981, 1982, and 1985 year classes.
A large proportion of the catch of bluefin in the EPO in 1982 consisted of age-1 fish(Bayliff, 1993c: Table 11). This is consistent with the evidence from tagging (Table 1) that alarge proportion of the fish of the 1981 year class appeared in the EPO as age-1 fish in 1982.The catch of northern bluefin in the EPO was poor in 1983, however, perhaps because thefish of the 1981 year class experienced heavy mortalities in the EPO in 1982 or mostly begantheir return trip to the WPO before the start of the 1983 season.
The greatest catches of northern bluefin in the EPO in recent years were those of 1985and 1986 (Bayliff, 1993c: Table 7), and the catches in those years consisted mostly of age-2fish (Bayliff, 1993c: Table 11), i.e. 1983-year-class fish in 1985 and 1984-year-class fish in1986. This is consistent with the evidence from tagging (Table 1) that large proportions ofthe fish of the 1983 and 1984 year classes appeared in the EPO as age-2 fish in 1985 and1986.
If it were certain that the fish which were tagged in the WPO were selected randomly itwould be concluded that greater proportions of age-2 fish of the 1983 and 1984 year classesmigrated to the EPO, and that this resulted in greater catches of northern bluefin in the EPOin 1985 and 1986. It is possible, however, that there are separate non-migrant and migrantsubpopulations, and that greater proportions of the migrant subpopulation were selected fortagging during the first year of life of the 1979, 1981, 1983, and 1984 year classes. Thus therelatively high proportion of EPO returns for the 1979 year class, even though the catch inthe EPO in 1981 was poor, might be the result of heavy concentration of tagging effort on a
252
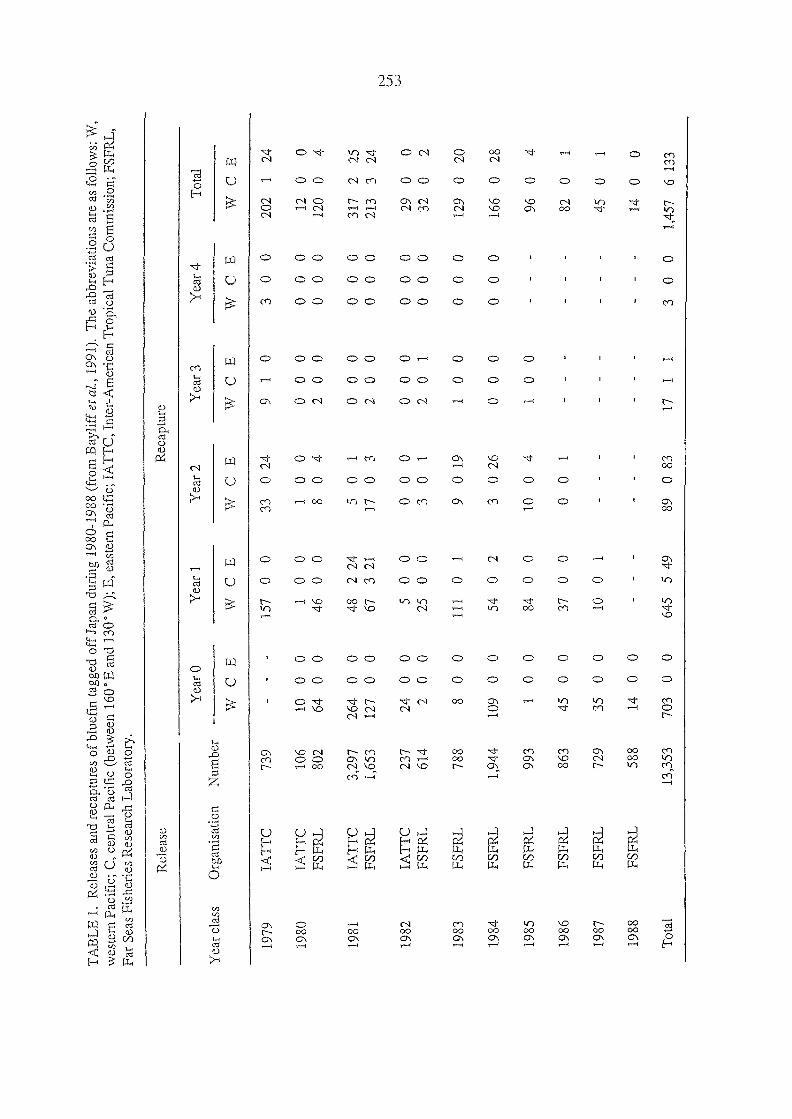
TA
BL
E 1
. Rel
ease
s an
d re
capt
ures
of
blue
fin
tagg
ed o
ff J
apan
dur
ing
1980
-198
8 (f
rom
Bay
liff
et a
l., 1
991)
. The
abb
revi
atio
ns a
re a
s fo
llow
s: W
,w
este
rn P
acif
ic; C
, cen
tral
Pac
ific
(be
twee
n 16
0' E
and
130
° W
); E
, eas
tern
Pac
ific
; IA
1-1C
, Int
er-A
mer
ican
Tro
pica
l Tun
a C
omm
issi
on; F
SFR
L,
Far
Seas
Fis
heri
es R
esea
rch
Lab
orat
ory.
Rel
ease
Rec
aptu
re
Yea
r cl
ass
Org
anis
atio
nN
umbe
rY
ear
0Y
ear
1Y
ear
2Y
ear
3Y
ear
4T
otal
WC
EW
CE
WC
EW
CE
WC
EW
CE
1979
1980
IAT
TC
IAT
TC
739
106
1000
157
00
100
330
24
100
91
0
000
30
0
000
202
124
1200
FSFR
L80
264
0046
0080
420
000
012
00
4
1981
IAT
TC
3,29
726
40
048
2 24
50
10
00
00
031
72
25FS
FRL
1,65
312
70
067
3 21
170
32
00
00
021
33
24
1982
IAT
TC
237
2400
500
000
000
000
2900
FSFR
L61
420
025
0030
120
100
032
0219
83FS
FRL
788
80
011
10
19
0 19
10
00
00
129
020
1984
FSFR
L1,
944
109
00
540
23
0 26
00
00
00
166
028
1985
FSFR
L99
31
00
840
010
04
10
096
04
1986
FSFR
L86
345
00
370
00
01
820
1987
FSFR
L72
935
00
100
1-
450
1988
FSFR
L58
814
00
--
--
140
0
Tot
al13
,353
703
00
645
5 49
890
8317
11
30
01,
457
6 13
3

254
relatively small subpopulation of migrants. This possibility can be evaluated by examiningthe data in Table 2 for both age-1 and age-2 fish. For the age-1 fish it appears that theproportions of migrants were high for the 1981 year class and low for the other year classes,regardless of the areas or months of release of the fish. For the age-2 fish it can be seen thatthe fish of the 1980-1982 and 1985 year classes released during December and Januarytended to be non-migrants and those of the 1983 and 1984 year classes released duringDecember and January tended to be migrants. Fish of all year classes released duringAugust-November tended to be non-migrants, but there are only 10 returns of these from the1983 and 1984 year classes, and all of these fish were released at Shimane in the Sea ofJapan, so these fish would seem to be less likely than any others, because of the physicalbaniers, to migrate to the EPO. These data do not offer much support for the subpopulationhypothesis. They indicate that for the age-1 fish the tendency to migrate to the EPO wasstrong for the 1981 year class and much weaker for all the others, and that for the age-2 fishthe tendency to migrate was strongest for the fish of the 1983 and 1984 year classes,intermediate for those of the, 1979 year class, and weakest for those of the 1980-1982 and1985 year classes.
Age-composition data (Table 3) provide further information pertinent to Point 5.Correlation coefficients were calculated for 12 pairs of data (Table, 4, upper panel) fromTable 3. Five of the 12 tests were significant at the 5-percent level. The numbers of age-2fish in the EPO and the WPO are negatively correlated (Test 6), indicating that the poorcatches in the EPO could be due at least partly to less-than-normal proportions of the totalpopulation migrating from the WPO to the EPO. The catches of age-1 and -2 fish in the EPOare positively correlated (Test 7), indicating that the catch of age-2 fish in the EP() can bepredicted, albeit poorly, from the, catch of age-1 fish in the EPO one year previously. Thecatches of age-0 and -1 fish in the WPO are highly con-elated (Test 8), indicating that thecatch of age-1 fish in the WPO can be predicted from the catch of age-0 fish in the WPO oneyear previously.
Test 11 gave an r value which was significant at the 1-percent level, which is notsurprising in view of the, fact that an even higher r value was obtained from Test 8. An rvalue which was significant at the 5-percent level was obtained for Test 12; this, also, is notsurprising in view of the fact that a nearly-significant value was obtained from Test 2.
The coefficient of correlation for the catches of age-0 fish in the WPO and the catchesof age-2 fish in the EPO two years later is 0.442 (Table 4, Test 2). Although this relationshipis not significant at the 5-percent level, it may indicate that the catch of age-2 fish in the EPOis related to recruitment two ye,ars previously, assuming that the catch of age-0 fish in theWPO is a valid index of recruitment. Since the catch of age-2 fish in the EPO appears to herelated to the recruitment two years previously (Test 2) and the catch of age-2 fish in theWPO in the same year (Test 6), a multiple con-elation coefficient was calculated (Test 13).The resulting coefficient of multiple determination was highly significant, indicating that55.6 percent (0.7462 x 100) of the variation of the catches of age-2 fish in the EPO isexplained by (1) a positive relationship to recruitment in the WPO and (2) a negativerelationship to the catch of age-2 fish in the WPO. Since the catches of age-2 fish make upthe majority of the catch by weight in the EPO in most years, recruitment two yearspreviously and emigration from the WPO appear to have major influences on the totalcatches in the EPO.
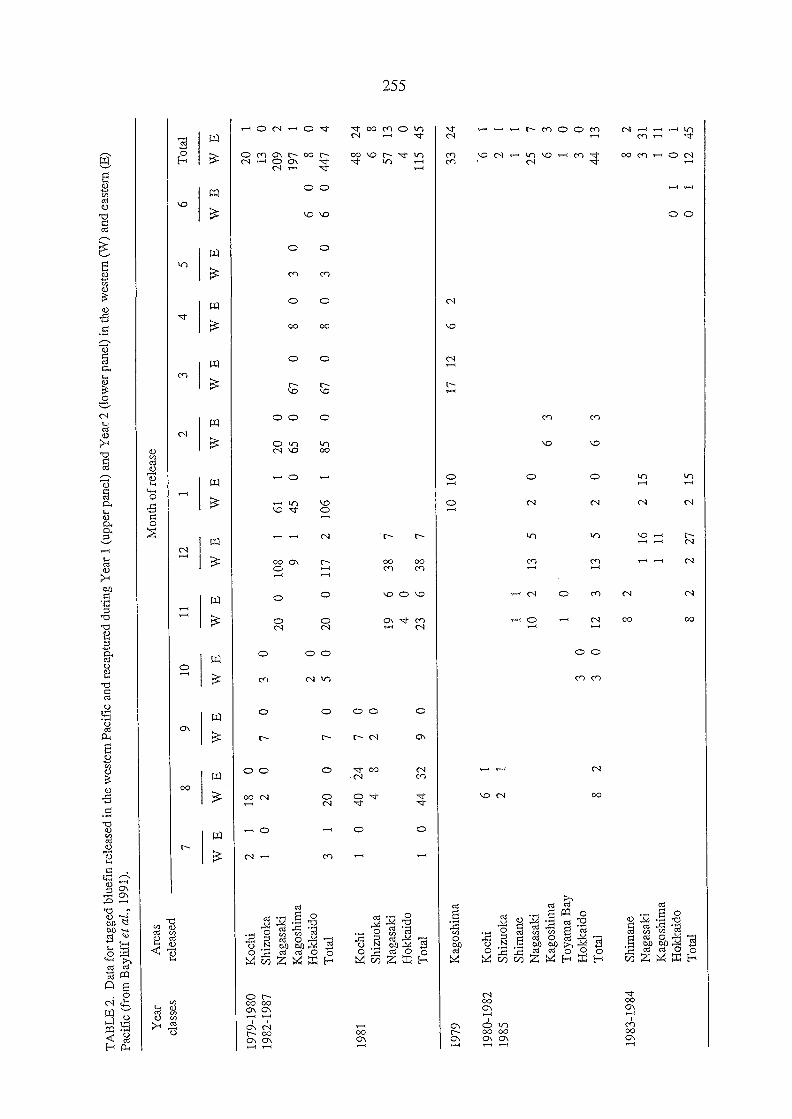
TA
BL
E 2
. Dat
a fo
r ta
gged
blu
efin
rel
ease
d in
the
wes
tern
Paci
fic
and
re,c
aptu
red
duri
ng Y
ear
1 (u
pper
pan
el)
and
Yea
r 2
(low
er p
anel
) in
the
wes
tern
(W
) an
d ea
ster
n (E
)
Paci
fic
(fro
m B
aylif
f et
al.,
199
1).
Yea
rcl
asse
sA
reas
Mon
th o
f re
leas
e
t`-)
LA
LA
rele
ased
78
910
1112
12
34
56
Tot
al
WE
WE
WE
WE
WE
WE
WE
WE
WE
WE
WE
WE
WE
1979
-198
019
82-1
987
1981
Koc
hiSh
izuo
kaN
agas
aki
Kag
oshi
ma
Hok
lcai
doT
otal
Koc
hiSh
izuo
kaN
agas
aki
Hok
kaid
oT
otal
2 1 3 1 1
1 0 1 0 0
18 2 20 40 4 44
0 0 0 24 8 32
7 7 2 970
0 0 0 0
3 2
0 0
20 19 4 23
5020
0117
2106
1850
670
010
81
611
200
91
450
650
670
638
70 6
387
80
80303
06 6
0 0
20 13
209
197 8
447 48 6 57 4
115
1 0 2 1 0 4 24 8
130
45
1979
1980
-198
219
85
1983
-198
4
Kag
oshi
ma
Koc
hiSh
izuo
kaSh
iman
eN
agas
aki
Kag
oshi
ma
Toy
ama
Bay
Hok
kaid
oT
otal
Shim
ane
Nag
asal
dK
agos
him
aH
okka
ido
Tot
al
6 2 82
1 1
3 3
0 0
1
10
1
12
8 8
1010
1712
1 213
52
0
63
0 313
520
63
2
116
215
111
22
272
15
62
0 01 1
33
6 2 1
25 6 1 3 44
8 3 1 0 12
24
1 1 1 7 3 0 0 13
2
31 11
1
45
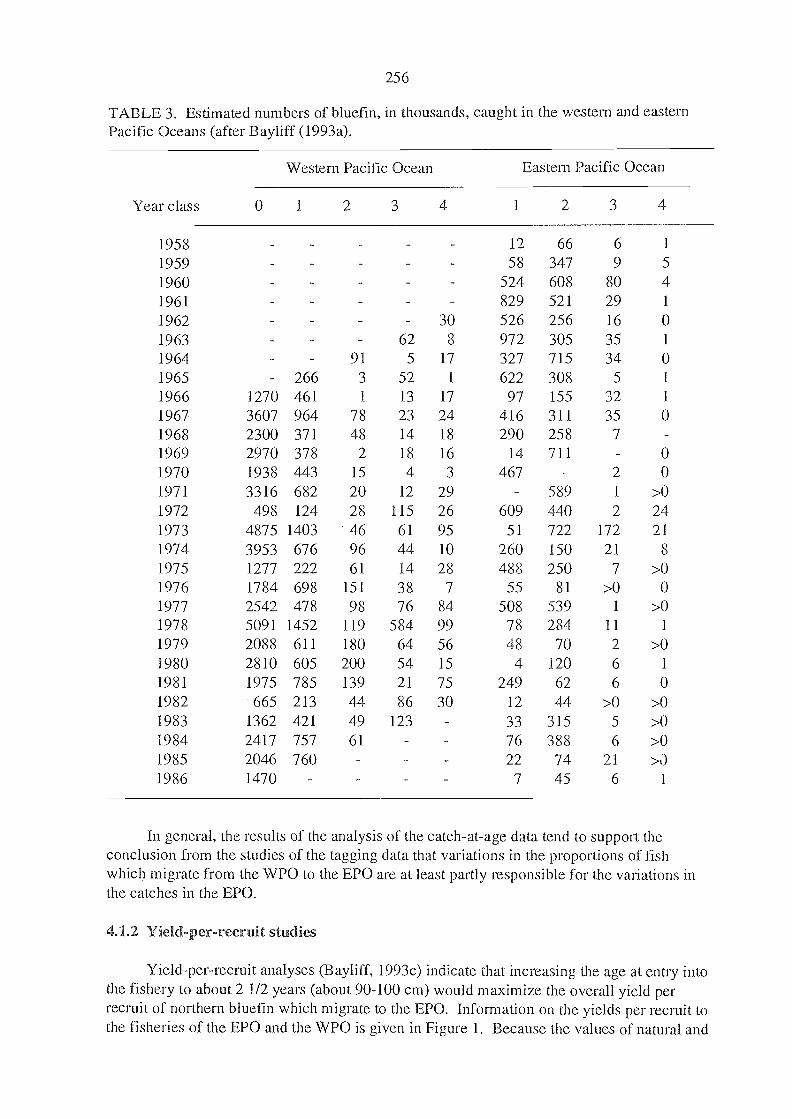
256
TABLE 3. Estimated numbers of bluefin, in thousands, caught in the western and easternPacific Oceans (after Bayliff (1993a).
In general, the results of the analysis of the catch-at-age data tend to support theconclusion from the studies of the tagging data that variations in the proportions of fishwhich migrate from the WPO to the EPO are at least partly responsible for the variations inthe catches in the EPO.
4.1.2 Yield-per-recruit studies
Yield-per-recruit analyses (Bayliff, 1993c) indicate that increasing the age at entry intothe fishery to about 2 1/2 years (about 90-100 cm) would maximize the overall yield perrecruit of northern bluefin which migrate to the EPO. Information on the yields per recruit tothe fisheries of the EPO and the WPO is given in Figure 1. Because the values of natural and
Western Pacific Ocean Eastern Pacific Ocean
Year class 0 1 2 3 4 1 2 3 4
1958 - - - - 12 66 6 1
1959 - - 58 347 9 5
1960 - - - 524 608 80 41961 - - - 829 521 29 1
1962 - - 30 526 256 16 01963 - 62 8 972 305 35 1
1964 - 91 5 17 327 715 34 01965 - 266 3 52 1 622 308 5 1
1966 1270 461 1 13 17 97 155 32 1
1967 3607 964 78 23 24 416 311 35 0
1968 2300 371 48 14 18 290 258 7
1969 2970 378 2 18 16 14 711 0
1970 1938 443 15 4 3 467 2 0
1971 3316 682 20 12 29 589 1 >01972 498 124 28 115 26 609 440 2 241973 4875 1403 46 61 95 51 722 172 21
1974 3953 676 96 44 10 260 150 21 8
1975 1277 222 61 14 28 488 250 7 >01976 1784 698 151 38 7 55 81 >0 01977 2542 478 98 76 84 508 539 1 >01978 5091 1452 119 584 99 78 284 11 1
1979 2088 611 180 64 56 48 70 2 >01980 2810 605 200 54 15 4 120 6 1
1981 1975 785 139 21 75 249 62 6 01982 665 213 44 86 30 12 44 >0 >01983 1362 421 49 123 33 315 5 >01984 2417 757 61 76 388 6 >01985 2046 760 22 74 21 >01986 1470 - - 7 45 6 1
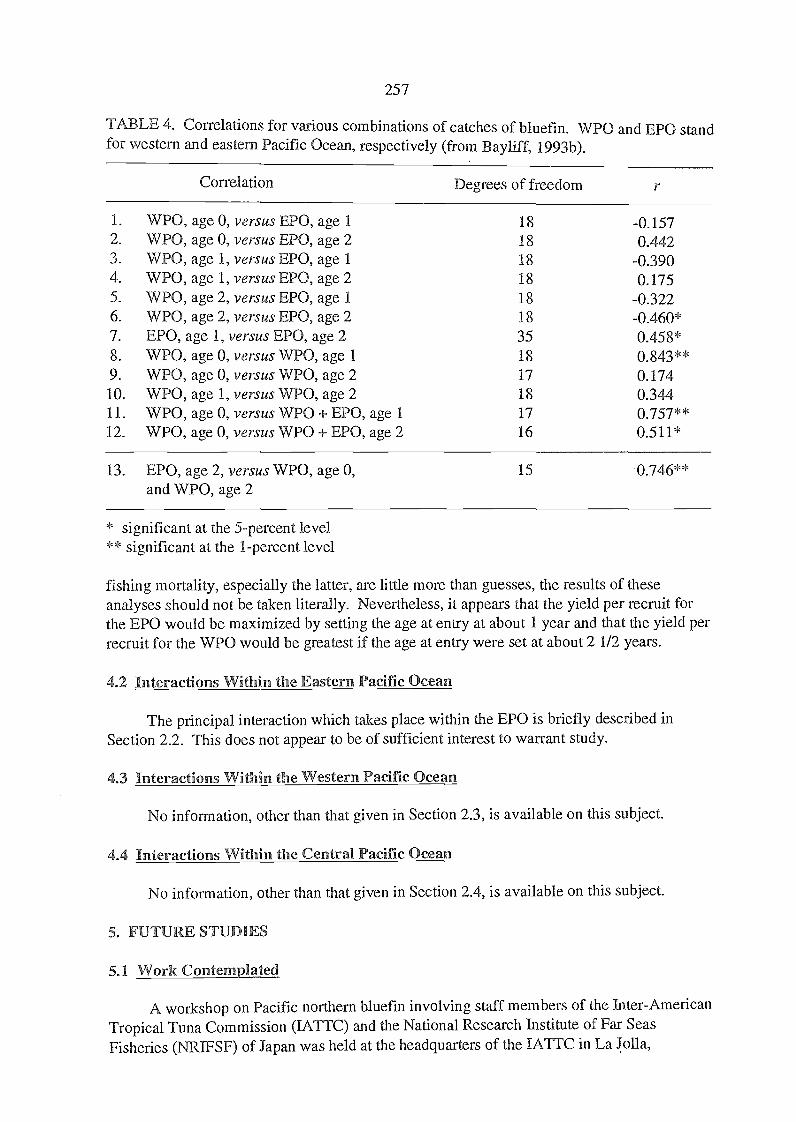
257
TABLE 4. Correlations for various combinations of catches of bluefin. WPO and EPO standfor western and eastern Pacific Ocean, respectively (from Bayliff, 1993b).
* significant at the 5-percent level** significant at the 1-percent level
fishing mortality, especially the latter, are little more than guesses, the results of theseanalyses should not be talcen literally. Nevertheless, it appears that the yield per recruit forthe EPO would be maximized by setting the age at entry at about 1 year and that the yield perrecruit for the WPO would be greatest if the age at entry were set at about 2 1/2 yeaxs.
4.2 Interactions Within the Eastern Pacific Ocean
The principal interaction which takes place within the EPO is briefly described inSection 2.2. This does not appear to be of sufficient interest to warrant study.
4.3 Interactions Within the Western Pacific Ocean
No information, other than that given in Section 2.3, is available on this subject.
4.4 Interactions Within the Central Pacific Ocean
No information, other than that given in Section 2.4, is available on this subject.
5. FUTURE STUDIES
5.1 Work Contemplated
A workshop on Pacific northern bluefin involving staff members of the Inter-AmericanTropical Tuna Commission (IA-FTC) and the National Research Institute of Far SeasFisheries (NRIFSF) of Japan was held at the headquarters of the INITC in La Jolla,
Correlation Degrees of freedom
1. WPO, age 0, versus EPO, age 1 18 -0.1572. WPO, age 0, versus EPO, age 2 18 0.4423. WPO, age 1, versus EPO, age 1 18 -0.3904. WPO, age 1, versus EPO, age 2 18 0.1755. WPO, age 2, versus EPO, age 1 18 -0.3226. WPO, age 2, versus EPO, age 2 18 -0.460*7. EPO, age 1, versus EPO, age 2 35 0.458*8. WPO, age 0, versus WPO, age 1 18 0.843**9. WPO, age 0, versus WPO, age 2 17 0.17410. WPO, age 1, versus WPO, age 2 18 0.34411. WPO, age 0, versus WPO + EPO, age 1 17 0.757**12. WPO, age 0, versus WPO + EPO, age 2 16 0.511*
13. EPO, age 2, versus WPO, age 0,and WPO, age 2
15 0.746**
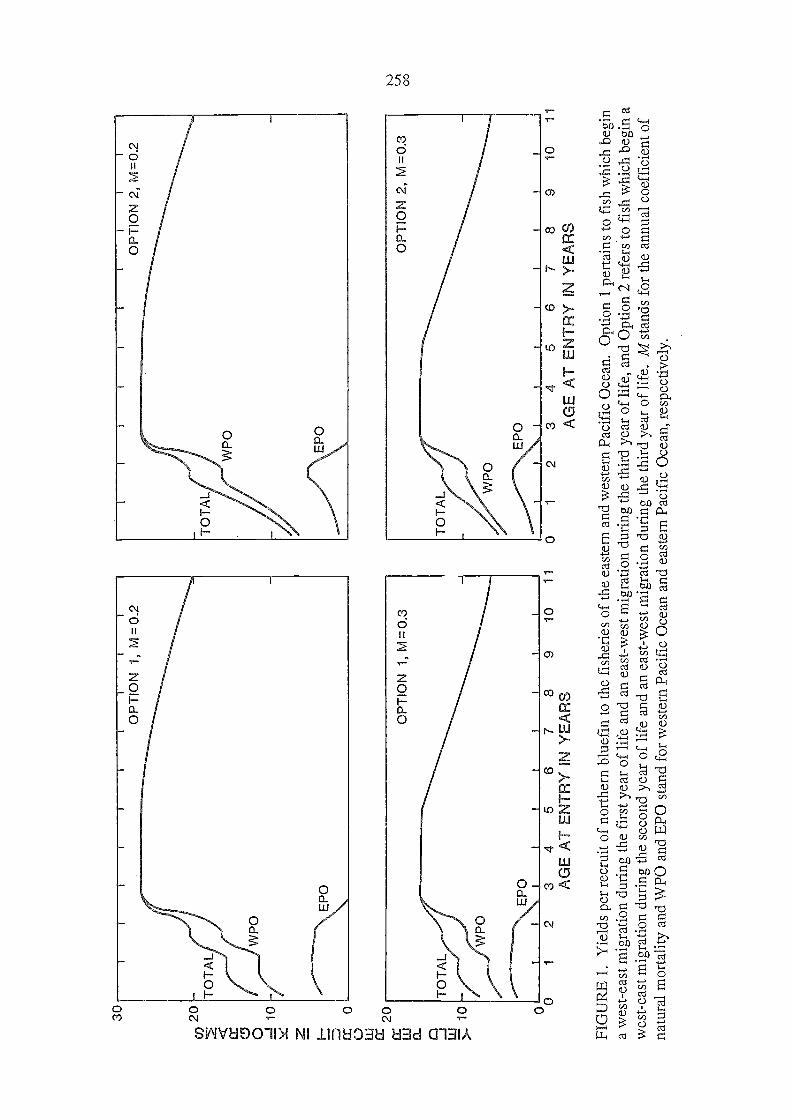
30 20c0 C
C o o_--
-I
CC
0
CC
20cc
a_
0
TO
TA
WP
O
OP
T O
N 1
, M=
0.2
OP
TIO
N 1
,M0.
3
\\E P
0t
tIII
!1
23
45
67
89
1011
o
AGE AT ENTRY IN YEARS
TO
TA
L WP
O
II
I
OP
TIO
N 2
, M=
0.2
OP
TIO
N 2
, M=
0.3
EP
OI
Ia.
tI
tt
II
II
12
34
56
78
910
11
AGE AT ENTRY IN YEARS
FIG
UR
E 1
. Yie
lds
per
recr
uit o
f no
rthe
rn b
luef
in to
the
fish
erie
s of
the
east
ern
and
wes
tern
Pac
ific
Oce
an. O
ptio
n 1
pert
ains
to f
ish
whi
ch b
egin
a w
est-
east
mig
ratio
n du
ring
the
firs
t yea
r of
life
and
an
east
-wes
t mig
ratio
n du
ring
the
thir
d ye
ar o
f lif
e, a
nd O
ptio
n 2
refe
rs to
fis
hw
hich
beg
in a
wes
t-ea
st m
igra
tion
duri
ng th
e se
cond
yea
r of
life
and
an
east
-wes
t mig
ratio
n du
ring
the
thir
d ye
ar o
f lif
e. M
sta
nds
for
the
annu
al c
oeff
icie
nt o
fna
tura
l mor
talit
y an
d W
PO a
nd E
PO s
tand
for
wes
tern
Pac
ific
Oce
an a
nd e
aste
rn P
acif
ic O
cean
, res
pect
ivel
y.
259
on April 12-13, 1993. It was agreed that the following tasks would be completed before thenext workshop, which will be held in 1994:
prepare an inventory of data on bluefin taken by the fisheries of the WPO, includingcatch and effort statistics by area and time period and size frequencies of fish caught,which are filed at regional and prefectural fisheries laboratories and other locationsin Japan;using the above data, if available, and data at the NRIFSF laboratory, preparedescriptions of the fisheties of the WPO which take bluefin, including catch andeffort statistics by area and time period and size frequencies of fish caught;review data on the total catches of bluefin during 1987-1991 by Japanese vessels tocotTect, if necessary, the data published in the FAO yearbooks;update estimates of age composition of bluefin caught by Japanese vessels for theyears subsequent to 1986;prepare a summary of catches of bluefin by gillnets in offshore waters of the PacificOcean, by area and season;prepare a summary of catches of bluefin by Japanese longline vessels in the PacificOcean, by area and season, for 1952-1987 (and subsequent years, if data available);assemble data on the offshore purse-seine fishery of the WPO for the purpose ofcalculating an index of abundance of bluefin in that area;redo the cohort analyses of bluefin in the, Pacific Ocean, using different estimates ofage composition and a wider range of estimates of the rates of natural mortality;redo the yield-per-recruit analyses of bluefin in the Pacific Ocean, using differentestimates of age composition and a wider range of estimates of the rates of naturalmortality;review data on attrition of tagged bluefin in the WPO to attempt to estimate theperiod(s) during which fish bound for the EPO (or the CPO) leave the WPO;assemble data on distribution and abundance of bluefin larvae in the WPO for thepurpose of developing indices of abundance of the larvae;carry out analyses of spawning biomass per recruit for bluefin in the WPO, usingwide ranges of fishing and natural mortalities, fecundities, etc.;carry out further studies of the feasibility of using micro-constituents of otoliths forthe purpose of determining more about the movements of bluefin;investigate ways of funding a study of micro-constituents of otoliths of bluefin forthe purpose of determining more about the movements of bluefin.
5.2 Data Needed
Catch data for vessels of the various countries which catch northern bluefin in theWPO and the CPO, stratified by area, month, and gear, are needed, as are length-frequencydata corresponding to the catch data. Standardized effort data should be available, so thatestimates of the relative abundances of the various sizes of fish can be calculated.
Tagging data do not offer much support for the hypothesis that there are sepasatemigrant and non-migrant subpopulations of northem bluefin in the Pacific Ocean (Section4.1.1), so it is tentatively concluded that there is only one population. This should beinvestigated by other means, however, as lack of knowledge of the stock structure can lead toincorrect conclusions regarding interactions between the fish of the WPO and the EPO. Thebiochemical genetic studies of Smith and Clemens (1973), based upon samples taken offCalifornia and Baja California, indicated that that "fishery is supported by a single
260
population." However, because they did not have any samples from the WPO, this finding isof limited value. If samples for such studies were taken simultaneously in the WPO and theEPO they might answer the question as to whether there are separate migrant and non-migrant subpopulations of bluefin in the Pacific Ocean. Another approach which mightprove useful is analysis of the micro-constituents of the otoliths. Such studies are currentlybeing conducted with skipjack in the Pacific Ocean and with southern bluefin. Becausenorthern bluefin of the same age reside in two distinct areas, the WPO and the EPO, thisspecies is ideal for such a study.
Northern bluefin should be tagged with tags which (1) do not cause immediate ordelayed mortalities of the fish, (2) do not affect their growth, (3) are retained throughout thelife of the fish, and (4) are always detected and returned to the agency which tagged andreleased the fish. The best source of such fish would probably be the troll fishery of Japan.The data from this tagging programme could be used to produce accurate estimates of thegrowth, mortality, and abundance of the fish for various age-structured analyses. In addition,more could be learned about the movements and migrations of the fish. A tag which isinvisible to fishermen, fish buyers, etc., but which can be seen or detected by employees offisheries research organizations, would be ideal, because there would be no errors due tofailure to find tags, failure to report tags that wem found, etc. Thre,e types of tags are listed inTable 5. The visual implant tag (Haw et al., 1990) is an externally-readable tag which isimplanted into living transparent tissue, most commonly on the head. According to themanufacturer, the "expected retention varies with fish size and species but tag loss isgenerally below five percent." A tagging programme with this type of tag would cost aboutthe same as a programme with dart tags, but it is not certain that visual implant tags would besuperior to dart tags. The coded-wire tag (Jefferts et al., 1963) can be detected externally(Morrison, 1990), but it must be removed from the fish to read the code. The detector for thePIT (passive integrated transponder) tag (Prentice et al., 1990) can read its code withoutremoving it from the fish. The costs of a tagging programme with either the coded-wire orPIT tags would be considerable, especially since there are many locations where fish arelanded in Japan. It is more important to obtain tag returns for larger than for smaller fish,however, and if large fish are landed in relatively few locations most of the sampling effortcould be concentrated there. If other species of fish were being tagged with similar tagsduring the same period the costs of the detectors could be shared among the ValiOUSprogrammes. The estimated numbers of tagged fish which would be recaptured and returnedeach year are shown in Table 6.
Archival tags, each of which would record data on temperature, light, and pressure atfrequent intervals (Smith and Goodman, 1986), are likely to become commercially availablewithin the next few years. The kinds of tags discussed in the previous paragraph giveinformation on the locations of the fish at two times, the date of release and the date ofrecapture. Archival tags would give data on where the fish were at all times between thedates of release and mcapture. It is possible that some fish start to cross the ocean, and thenturn back. Data from an archival tagging programme would reveal whether that is the caseand, if so, where and at what time the fish turn back. This information, combined withoceanographic data, might be used to predict the availability of bluefin of various ages to thefisheries of the WPO and the EPO.

TA
BL
E 5
. Inf
orm
atio
n on
inte
rnal
tags
whi
ch m
ight
be
used
for
blu
efin
. The
tag
cost
s ar
e fo
r 5,
000
tags
, and
the
appl
icat
or a
nd d
etec
tor
cost
s ar
e fo
r on
e un
it ea
ch.
Cos
t
TA
BL
E 6
. Est
imat
ed n
umbe
rs o
f ta
gged
fis
h re
capt
ured
and
ret
urne
d fr
om 5
,000
nor
ther
n bl
uefi
n re
leas
ed a
t 3m
onth
s of
age
. M a
nd F
sta
nd f
or th
e an
nual
coe
ffic
ient
s of
nat
ural
and
fis
hing
mor
talit
y, r
espe
ctiv
ely.
MF
Age
01
23
45
67
89
1011
12
0.2
0.5
1,45
91,
064
528
262
130
6532
168
42
1<
10.
21.
02,
473
1,18
435
610
733
103
1<
10.
22.
03,
673
776
8610
1<
1
0.3
0.5
1,41
094
442
419
186
3917
83
21
<1
0.3
1.0
2,39
51,
055
288
7821
62
1<
10.
32.
03,
573
697
707
1<
1
Typ
eSi
zeM
anuf
actu
rer
Tag
sA
pplic
ator
Det
ecto
r
visu
al2.
5 x
1.0
x 0.
1 m
m$1
,250
$1,5
00no
t nee
ded
Nor
thw
est M
arin
e T
echn
olog
yim
plan
t3.
5 x
1.5
x 0.
1 m
m$3
,500
Shaw
Isl
and,
Was
hing
ton,
USA
code
d w
ire
0.53
x 0
.25
mm
$365
$7,7
00-1
2,00
0$2
,700
-9,0
00N
orth
wes
t Mar
ine
Tec
hnol
ogy
1.07
x 0
.25
mm
$365
Shaw
Isl
and,
Was
hing
ton,
USA
1.60
x 0
.36
mm
$402
2.13
x 0
.36
mm
$402
PIT
10.0
x 2
.1 m
m$2
3,75
0$2
4-$4
1$1
,666
Bio
soni
cs36
70 S
tone
Way
Nor
thSe
attle
, Was
hing
ton,
USA

Jefferts, K.B., P.K. Bergman, and H.F. Fiscus. 1963. A coded wire identification system formacro-organisms. Nature, Lond., 198(4879):460-2.
262
5.3 Institutions Involved
The principal institutions involved would be the IA I-1C and the NRIFSF. In addition,catch statistics and size data should be obtained from the Taiwan Fisheries Bureau, Republicof China. Analyses of micro-constituents of the otoliths of bluefin would probably involvescientists or technicians from the University of California at San Diego.
5.4 Assistance Required
The IAI IC and the NRIFSF would need considerably more money if the researchdescribed above, especially the tagging, were to be performed. In addition, catch statisticsand size data for fish caught by vessels of the Republic of China would be required.
ACKNOWLEDGEMENTS
Suggestions for improvement of drafts of this report were received from Drs. RichardB. Deriso, Ziro Suzuki, and Alexander Wild, and Messrs. Doyle A. Hanan and Richard S.Shomura.
FERENCES CITED
Bayliff, W.H. 1993a. Growth and age composition of northern bluefin tuna, Thunnusthynnus, caught in the eastern Pacific Ocean, as estimated from length-frequency data, withcomments on trans-Pacific migrations. Bull.1-ATTC, 20(9):501-40.
Bayliff, W.H. (ed.) 1993b. Annual report of the Inter-American Tropical Tuna Commission,1992. Annu.Rep.I-A11C, (1992):(in press).
Bayliff, W.H. 1993c. A review of the biology and fisheries for northern bluefin tuna,Thunnus thynnus, in the Pacific Ocean. In Proceedings of the FAO Expert Consultation onInteractions of Pacific Tuna Fisheries, edited by R.S. Shomura, J. Majkowski, and S. Langi,3-11 December 1991, Noumea, New Caledonia. [See this document.]
Bayliff, W.H.., Y. Ishizuka, and R.B. Deriso. 1991. Growth, movements, and attrition ofnorthern bluefin, Thunnus thynnus, in the Pacific Ocean, as determined from taggingexperiments. Bull.I-ATIC, 20(1):1-94.
Clay, D. (ed.) 1991. Atlantic bluefin tuna (Thunnus thynnus thynnus (L.)): a review.Spec.Rep.I-ATIC, (7):89-179.
Haw, F., P.K. Bergman, R.D. Fralick, R.B. Buckley, and H.L. Blankenship. 1990. Visibleimplanted fish tag. In Fish-marking Techniques, edited by N. Parker, A.E. Giorgi, R.C.Heidinger, D.B. Jester, Jr., E.D. Prince, and G.A. Winans, Symp.Ser.Am.Fish.Soc., (7):311-5.
Hearn, W. 1991. Natural mortality. In Review of aspe,cts of southern bluefin tuna biology,population and fisheries, edited by A.E. Caton. Spec.Rep.I-ATIC, (7):243-6.

263
Morrison, J.A. 1990. Insertion and detection of magnetic micro-wire tags in Atlanticherring. In Fish-marking Techniques, edited by N. Parker, A.E. Giorgi, R.C. Heidinger, D.B.Jester, Jr., E.D. Prince, and G.A. Winans, Symp.Ser.Am.Fish.Soc., (7):272-80.
Pauly, D. 1980. On the interrelationships between natural mortality, growth parameters, andmean environmental temperatures in 175 fish. J.Cons.CIEM, 39(2):175-92.
Prentice, E.F., T.A. Flagg, C.S. McCutcheon, D.F. Brastow, and D.C. Cross. 1990.Equipment, methods, and an automated data-entry station for PU' tagging. In Fish-markingTechniques, edited by N. Parker, A.E. Giorgi, R.C. Heidinger, D.B. Jester, Jr., E.D. Prince,and G.A. Winans, Symp.Ser.Am.Fish.Soc., (7):335-40.
Skillman, R.A., and C. Shingu (rapporteurs) 1980. Pacific northern bluefin tuna. FAOFish.Tech.Pap., (200):24-30.
Smith, A.C., and H.B. Clemens. 1973. A population study by proteins from the nucleus ofbluefin tuna eye lens. Trans.Am.Fish.Soc., 102(3):578-83.
Smith, P., and D. Goodman. 1986. Determining fish movements from an "archival" tag:precision of geographical positions made from a time series of swimming temperature anddepth. NOAA Tech.Mem.NMFS-SWFC, La Jolla, (60):13 p.
Yokota, T., M. Toriyama, F. Kanai, and S. Nomura. 1961. Studies on the feeding habit offishes. Rep.Nankai Reg.Fish.Res.Lab., (14):1-234.
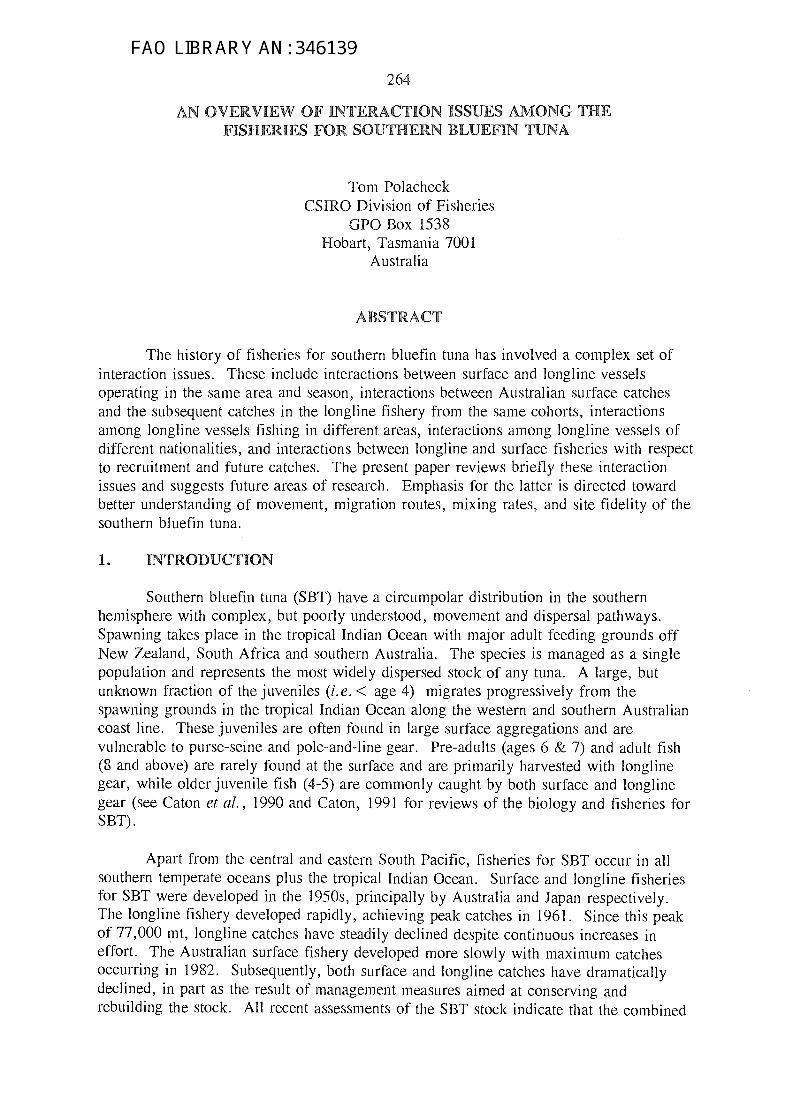
264
AN OVERVIEW OF INTERACTION ISSUES AMONG THEFISHERIES FOR SOUTHERN BLUEFIN TUNA
Tom PolacheckCSIRO Division of Fisheries
GPO Box 1538Hobart, Tasmania 7001
Australia
ABSTRACT
The history of fisheries for southern bluefin tuna has involved a complex set ofinteraction issues. These include interactions between surface and longline vesselsoperating in the same area and season, interactions between Australian surface catchesand the subsequent catches in the longline fishery from the same cohorts, interactionsamong longline vessels fishing in different areas, interactions among longline vessels ofdifferent nationalities, and interactions between longline and surface fisheries with respectto recruitment and future catches. The present paper reviews briefly these interactionissues and suggests future areas of research. Emphasis for the latter is directed towardbetter understanding of movement, migration routes, mixing rates, and site fidelity of thesouthern bluefin tuna.
1. INTRODUCTION
Southern bluefin tuna (SBT) have a circumpolar distribution in the southernhemisphere with complex, but poorly understood, movement and dispersal pathways.Spawning takes place in the tropical Indian Ocean with major adult feeding grounds offNew Zealand, South Africa and southern Australia. The species is managed as a singlepopulation and represents the most widely dispersed stock of any tuna. A large, butunknown fraction of the juveniles (i.e.< age 4) migrates progressively from thespawning grounds in the tropical Indian Ocean along the western and southern Australiancoast line. These juveniles are often found in large surface aggregations and arevulnerable to purse-seine and pole-and-line gear. Pre-adults (ages 6 & 7) and adult fish(8 and above) are rarely found at the surface and are primarily harvested with longlinegear, while older juvenile fish (4-5) are commonly caught by both surface and longlinegear (see Caton et al., 1990 and Caton, 1991 for reviews of the biology and fisheries forSBT).
Apart from the central and eastern South Pacific, fisheries for SBT occur in allsouthern temperate oceans plus the tropical Indian Ocean. Surface and longline fisheriesfor SBT were developed in the 1950s, principally by Australia and Japan respectively.The longline fishery developed rapidly, achieving peak catches in 1961. Since this peakof 77,000 mt, longline catches have steadily declined despite continuous increases ineffort. The Australian surface fishery developed more slowly with maximum catchesoccurring in 1982. Subsequently, both surface and longline catches have dramaticallydeclined, in part as the result of management measures aimed at conserving andrebuilding the stock. All recent assessments of the SBT stock indicate that the combined
FAO LIBRARY AN: 346139
265
catches from the surface and longline fisheries have resulted in a continuous decline inspawning stock biomass since 1960. Current (1989) levels are estimated to have declinedto at least 16 to 25% of pre-exploitation levels (Anon., 1991).
In addition to the Australian and Japanese fisheries, a locally important troll andhandline fishery for SBT has existed in New Zealand since 1980 and domestic longlinefisheries have been initiated in New Zealand and Australia. Significant SBT by-catchesare thought to be taken by Taiwanese gillnetters and Indonesian and Taiwanese longlinevessels, and were previously taken by Korean longliners. Furthermore, the Australiansurface and the Japanese longline fisheries are made up of numerous spatially andseasonally distinct components which harvest different size ranges of fish (see Caton,1991, for a comprehensive review of the different SBT fishery components).
The large area, the complex spatial and movement patterns and the numerouscomponents comprising the global fishery provide the potential for a wide range ofinteractions at different spatial and temporal scales which need to be considered in themanagement of this stock. In addition, the importance of different interactions haschanged in response to changes in population size and to developments in the fishery. Inthis paper, the major interaction issues relevant to SBT fisheries are described, previousanalyses of interactions are reviewed, sources of relevant data are identified and futureresearch needs are discussed.
2. INTERACTION ISSUES
Significant interaction issues among fisheries develop when the operations in oneor more fisheries has an effect on the catch rate or yield (biological and/or economic) inone or more other fisheries. A fishery in this case is defined as a set of vessels whichcan be classified as distinct by common characteristics affecting their operations (e.g.gear, size, area, season, target species, nationality, etc.). Among the vessels that harvestSBT, the potential number of different fisheries which can be defined is large and theclassification of vessels into the various major fisheries components does not result in asmall number of mutually exclusive subsets. This paper will focus only on majorinteractions among SBT fisheries.
Six main interaction issues can be identified among the SBT fisheries:
Interactions among the three main components of the surface fisheryoperating within Australia's exclusive economic zone (AFZ)1.
Interaction between surface and longline vessels operating in the samegeographic area and season of the year.
Interaction between Australian surface catches and the subsequent catchesin the longline fishery from the same cohorts.
One major component of the Australian surface fishery (i.e. that which occurred off New SouthWales) collapsed in the 1980s and more recently a new trolling component has been developing off easternTasmania.
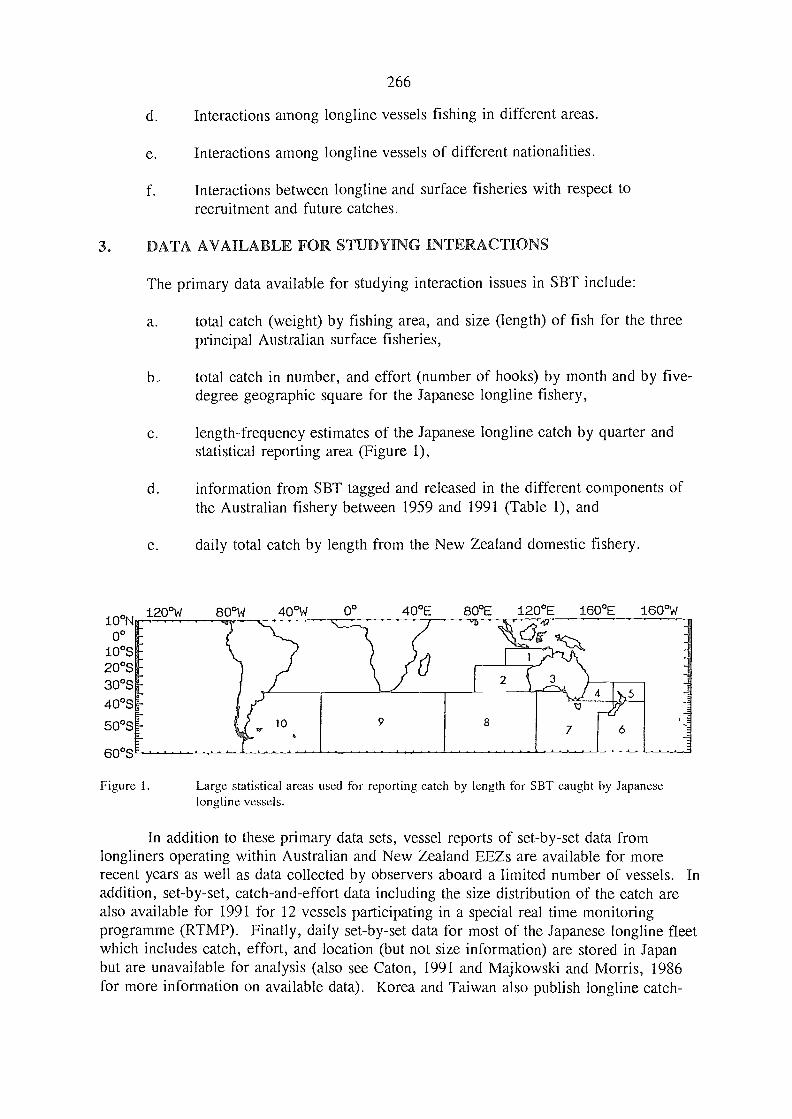
266
Interactions among longline vessels fishing in different areas.
Interactions among longline vessels of different nationalities.
Interactions between longline and surface fisheries with respect torecruitment and future catches.
3. DATA AVAILABLE FOR STUDYING INTERACTIONS
The primary data available for studying interaction issues in SBT include:
total catch (weight) by fishing area, and size (length) of fish for the threeprincipal Australian surface fisheries,
total catch in number, and effort (number of hooks) by month and by five-degree geographic square for the Japanese longline fishery,
length-frequency estimates of the Japanese longline catch by quarter andstatistical reporting area (Figure 1),
information from SBT tagged and released in the different components ofthe Australian fishery between 1959 and 1991 (Table 1), and
daily total catch by length from the New Zealand domestic fishery.
10°N0°
10°S20°S30°S
40°S
50°S
60°S
Figure 1. Large statistical areas use,d for reporting catch by length for SBT caught by Japaneselongline vessels.
In addition to these primary data sets, vessel reports of set-by-set data fromlongliners operating within Australian and New Zealand EEZs are available for morerecent years as well as data collected by observers aboard a limited number of vessels. Inaddition, set-by-set, catch-and-effort data including the size distribution of the catch arealso available for 1991 for 12 vessels participating in a special real time monitoringprogramme (RTMP). Finally, daily set-by-set data for most of the Japanese longline fleetwhich includes catch, effort, and location (but not size information) are stored in Japanbut are unavailable for analysis (also see Caton, 1991 and Majkowski and Morris, 1986for more information on available data). Korea and Taiwan also publish longline catch-
o 40°E 80°E 20°E 160°E 160°W20°W 80°W 40°W
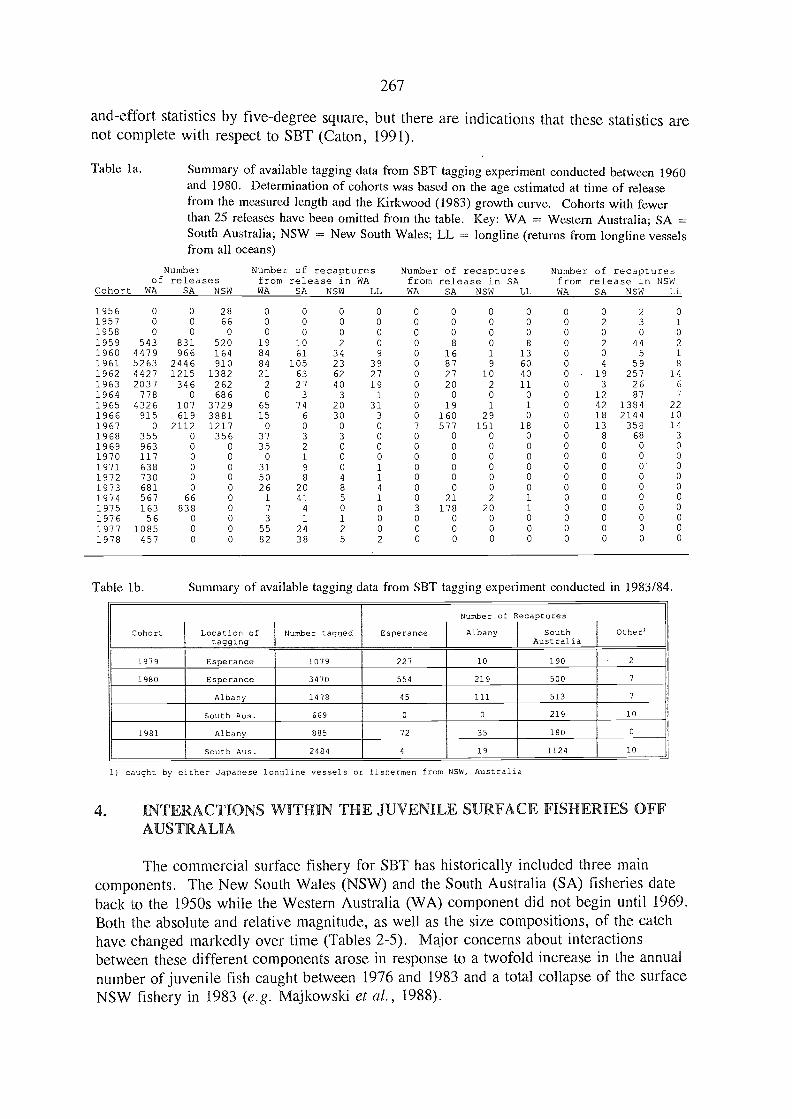
and-effort statistics by five-degree square, but there are indications that these statistics arenot complete with respect to SBT (Caton, 1991).
Table la.
267
Summary of available tagging data from SBT tagging experiment conducted betwe,en 1960and 1980. Determination of cohorts was based on the age estimated at time of releasefrom the measured length and the Kirkwood (1983) growth curve. Cohorts with fewerthan 25 releases have been omitted from the table. Key: WA = Western Australia; SA =South Australia; NSW = New South Wales; LL longline (returns from longline vesselsfrom all oceans)
Number Number of recaptures Number of recaptures Number of recaptures
1) caught by either Japanese longline vessels or fishermen from NSW, Australia
4. INTERACTIONS WITHIN THE JUVENILE SURFACE FISHERIES OFFAUSTRALIA
The commercial surface fishery for SBT has historically included three maincomponents. The New South Wales (NSW) and the South Australia (SA) fisheries dateback to the 1950s while the Western Australia (WA) component did not begin until 1969.Both the absolute and relative magnitude, as well as the size compositions, of the catchhave changed markedly over time (Tables 2-5). Major concerns about interactionsbetween these different components arose in response to a twofold increase in the annualnumber of juvenile fish caught between 1976 and 1983 and a total collapse of the surfaceNSW fishery in 1983 (e.g. Majkowski et al., 1988).
Cohort Location oftagging
Number tagged Esperance
Number of Recaptures
Albany SouthAustralia
Other'
1979 Esperance 1079 227 10 190 2
1980 Esperance 3470 554 219 500 7
Albany 1478 45 111 513 7
South Aus. 669 0 0 219 10
1981 Albany 885 72 35 180 0
South Aus. 2484 4 19 1124 10
Cohort WA SA NSWfromWA
release in WASA NSW LL
fromWA
release in SASA NSW LL
fromWA
release in NSWSA NSW
1956 0 0 28 0 0 0 0 0 0 0 0 0 0 2 0
1957 0 0 66 0 0 0 0 0 0 0 0 0 2 3 1
1958 0 0 0 0 0 0 0 0 0 0 0 0 0 0 0
1959 543 831 520 19 10 2 0 0 8 0 8 0 2 44 21960 4479 966 164 84 61 34 9 0 16 1 13 0 0 5 1
1961 5263 2446 910 84 105 23 39 0 87 9 60 0 4 59 8
1962 4427 1215 1382 21 63 62 27 0 27 10 40 0 19 257 11
1963 2037 346 262 2 27 40 19 0 20 2 11 0 3 26 6
1964 778 0 686 0 3 3 1 0 0 0 0 0 12 87 7
1965 4326 107 3729 65 74 20 31 0 19 1 1 0 42 1384 221966 915 619 3881 15 6 30 3 0 160 29 0 0 18 2144 10
1967 0 2112 1217 0 0 0 0 7 577 151 18 0 13 358 14
1968 355 0 356 37 3 3 0 0 0 0 0 o 8 68 3
1969 963 0 0 35 2 0 0 0 0 0 0 0 0 0 0
1970 117 0 0 0 1 0 0 0 0 0 0 0 0 0 0
1971 638 0 0 31 9 0 1 0 0 0 0 0 0 0 0
1972 730 0 0 50 8 4 1 o o o o o o o o
1973 681 0 0 26 20 8 4 0 0 0 0 0 0 0 0
1974 567 66 0 1 41 5 1 0 21 2 1 0 0 0 0
1975 163 838 0 7 4 0 0 3 178 20 1 0 0 0 0
1976 56 0 0 3 1 1 0 0 0 0 0 0 0 0 0
1977 1085 0 0 55 24 2 0 0 0 0 0 0 0 0 0
1978 457 0 0 82 38 5 2 0 0 0 0 0 0 0 0
Table lb. Summary of available tagging data from SBT tagging experiment conducted in 1983/84.
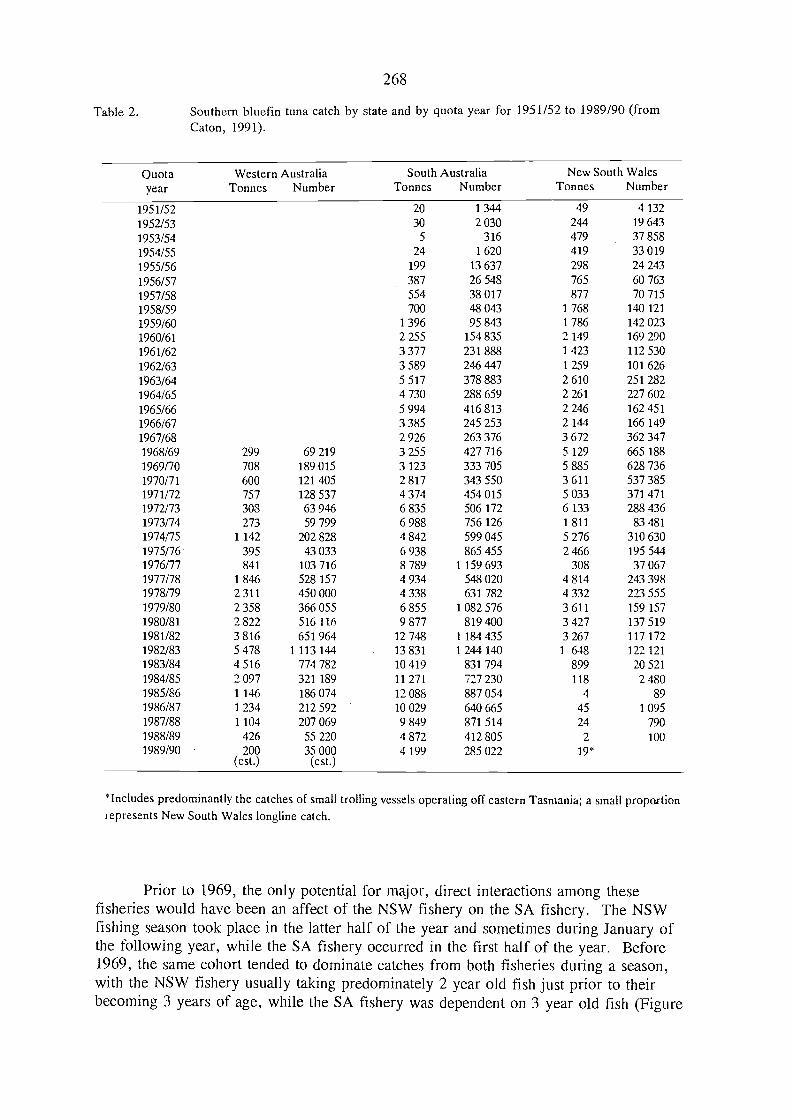
268
Table 2. Southern bluefin tuna catch by state and by quota year for 1951/52 to 1989/90 (fromCaton, 1991).
*Includes predominantly the catches of small trolling vessels operating off eastern Tasmania; a small proportionrepresents New South Wales longline catch.
Prior to 1969, the only potential for major, direct interactions among thesefisheries would have been an affect of the NSW fishery on the SA fishery. The NSWfishing season took place in the latter half of the year and sometimes during January ofthe following year, while the SA fishery occurred in the first half of the year. Before1969, the same cohort tended to dominate catches from both fisheries during a season,with the NSW fishery usually taking predominately 2 year old fish just prior to theirbecoming 3 years of age, while the SA fishery was dependent on 3 year old fish (Figure
Quotayear
Western AustraliaTonnes Number
South AustraliaTonnes Number
New South WalesTonnes Number
1951/52 20 1 344 49 4 132
1952/53 30 2 030 244 19 643
1953/54 5 316 479 37 858
1954/55 24 1 620 419 33 019
1955/56 199 13 637 298 24 243
1956/57 387 26 548 765 60 7631957/58 554 38 017 877 70 7151958/59 700 48 043 1 768 140 121
1959/60 1 396 95 843 1 786 142 0231960/61 2 255 154 835 2 149 169 290
1961/62 3 377 231 888 1 423 112 530
1962/63 3 589 246 447 1 259 101 626
1963/64 5 517 378 883 2 610 251 2821964/65 4 730 288 659 2 261 227 602
1965/66 5 994 416 813 2 246 162 451
1966/67 3 385 245 253 2 144 166 1491967/68 2 926 263 376 3 672 362 3471968/69 299 69 219 3 255 427 716 5 129 665 1881969/70 708 189 015 3 123 333 705 5 885 628 7361970/71 600 121 405 2 817 343 550 3 611 537 3851971/72 757 128 537 4 374 454 015 5 033 371 4711972/73 308 63 946 6 835 506 172 6 133 288 4361973/74 273 59 799 6 988 756 126 1 811 83 4811974/75 1 142 202 828 4 842 599 045 5 276 310 6301975/76 395 43 033 6 938 865 455 2 466 195 5441976/77 841 103 716 8 789 1 159 693 308 37 0671977/78 1 846 528 157 4 934 548 020 4 814 243 3981978/79 2 311 450 000 4 338 631 782 4 332 223 5551979/80 2 358 366 055 6 855 1 082 576 3 611 159 1571980/81 2 822 516 116 9 877 819 400 3 427 137 5191981/82 3 816 651 964 12748 1 184 435 3 267 117 1721982/83 5 478 1 113 144 13 831 1 244 140 1 648 122 1211983/84 4 516 774 782 10 419 831 794 899 20 5211984/85 2 097 321 189 11 271 727 230 118 2 4801985/86 1 146 186 074 12 088 887 054 4 891986/87 1 234 212 592 10 029 640 665 45 1 0951987/88 1 104 207 069 9 849 871 514 24 7901988/89 426 55 220 4 872 412 805 2 1001989/90 200 35 000 4 199 285 022 19*
(est.) (cst.)

269
2 and Tables 3-4). In both the NSW and SA fisheries, the fish became unavailable duringthe off-season, which suggests the possibility of significant interchange given the timingand their close proximity. However, the total catches in the years prior to 1969 weresmall (relative to subsequent removals - Table 2) and the two fisheries were likely to havehad only minimal effects on each other. Results from tagging studies (discussed below)indicate little direct interaction during this period.
Table 3. Estimates of the catch by age in numbers (thousands of fish) for New South Wales surfacefishery by calendar year. (Based on data held by CSIRO; from various sources.)
Age
Beginning in 1969, the SA fishery began to change. The fishery expanded to thewest and began to take significant numbers of 2 year old fish (Figure 3, Table 4).During the same period, the WA fishery developed (Table 5) and its catch was initiallydominated by 2 year old fish (in some years 1 year old fish dominated the catch in thelast quarter of the year and 2 year old fish in the rest of the year). As such, all threefisheries were sequentially harvesting the same cohort of fish. However, the NSWfishery was no longer the first fishery harvesting a recruiting cohort. The SA fishery alsocontinued to take significant numbers of 3 year old fish. These changes meant that thepotential interactions between the SA and NSW fisheries had shifted and significant two-
way as well as one-way interactions were possible.
Year 1 2 3 4 >4
1952 0.3 8.1 5.2 1.6 0.41953 0.5 15.8 11.0 4.1 1.91954 0.5 13.9 11.0 5.5 3.51955 0.3 9.9 8.3 4.5 3.01956 0.8 25.3 17.0 5.9 2.31957 0.9 29.0 21.8 9.9 5.61958 1.9 58.4 40.4 15.1 6.71959 1.9 59.1 45.6 21.7 12.91960 2.3 71.1 53.0 23.6 13.11961 1.5 47.1 40.3 22.6 15.41962 1.4 41.7 33.1 16.6 10.31963 2.8 86.3 59.5 22.1 9.61964 1.3 230.7 40.6 23.0 18.81965 5.4 19.6 100.2 26.1 8.01966 11.9 56.0 71.0 24.5 7.71967 0.0 262.6 26.4 9.6 2.21968 23.5 465.7 118.2 36.0 10.61969 5.8 545.7 73.1 17.0 2.01970 13.6 319.4 64.4 23.9 22.41971 0.7 249.6 124.8 5.6 0.01972 0.0 106.1 115.7 143.6 32.41973 0.1 5.5 1.5 75.3 29.21974 5.0 122.6 34.5 42.1 81.21975 9.9 163.9 17.9 11.8 13.81976 0.0 16.0 6.4 5.1 9.51977 1.5 31.0 55.7 61.5 32.31978 2.6 66.2 32.5 66.0 106.01979 0.2 8.8 35.7 76.8 48.31980 0.3 12.9 44.7 46.8 46.21981 0.8 36.4 9.4 8.7 68.91982 4.7 59.2 30.2 14.9 13.11983 0.0 0.2 0.3 1.3 18.81984 0.0 0.0 0.0 0.1 2.31985 0.0 0.0 0.0 0.0 0.01986 0.0 0.0 0.0 0.0 1.01987 0.0 0.0 0.4 0.2 0.21988 0.0 0.0 0.0 0.0 0.01989 0.0 0.0 0.0 0.0 0.0
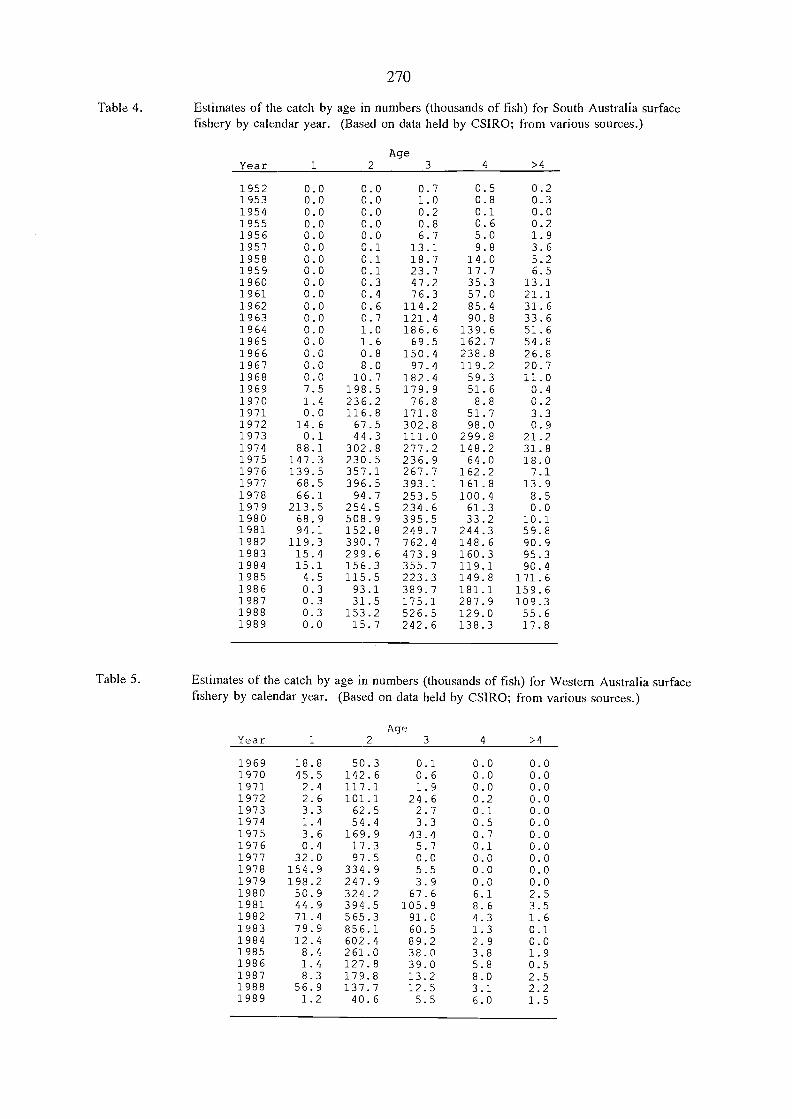
270
Table 4. Estimates of the catch by age in numbers (thousands of fish) for South Australia surfacefishery by calendar year. (Based on data held by CSIRO; from various sources.)
AgeYear 1 2 3 4 >4
1952 0.0 0.0 0.7 0.5 0.21953 0.0 0.0 1.0 0.8 0.31954 0.0 0.0 0.2 0.1 0.01955 0.0 0.0 0.8 0.6 0.21956 0.0 0.0 6.7 5.0 1.91957 0.0 0.1 13.1 9.8 3.61958 0.0 0.1 18.7 14.0 5.21959 0.0 0.1 23.7 17.7 6.51960 0.0 0.3 47.2 35.3 13.11961 0.0 0.4 76.3 57.0 21.11962 0.0 0.6 114.2 85.4 31.61963 0.0 0.7 121.4 90.8 33.61964 0.0 1.0 186.6 139.6 51.61965 0.0 1.6 69.5 162.7 54.81966 0.0 0.8 150.4 238.8 26.81967 0.0 8.0 97.4 119.2 20.71968 0.0 10.7 182.4 59.3 11.01969 7.5 198.5 179.9 51.6 0.41970 1.4 236.2 76.8 8.8 0.21971 0.0 116.8 171.8 51.7 3.31972 14.6 67.5 302.8 98.0 0.91973 0.1 44.3 111.0 299.8 21.21974 88.1 302.8 277.2 148.2 31.81975 147.3 230.5 236.9 64.0 18.01976 139.5 357.1 267.7 162.2 7.11977 68.5 396.5 393.1 161.8 13.91978 66.1 94.7 253.5 100.4 8.51979 213.5 254.5 234.6 61.3 0.01980 68.9 508.9 395.5 33.2 10.11981 94.1 152.8 249.7 244.3 59.81982 119.3 390.7 762.4 148.6 90.91983 15.4 299.6 473.9 160.3 95.31984 15.1 156.3 355.7 119.1 90.41985 4.5 115.5 223.3 149.8 171.61986 0.3 93.1 389.7 181.1 159.61987 0.3 31.5 175.1 287.9 109.31988 0.3 153.2 526.5 129.0 55.61989 0.0 15.7 242.6 138.3 17.8
Table 5. Estimates of the catch by age in numbers (thousands of fish) for Western Australia surfacefishery by calendar year. (Based on data held by CSIRO; from various sources.)
AgeYear 1 2 3 4 >4
1969 18.8 50.3 0.1 0.0 0.01970 45.5 142.6 0.6 0.0 0.01971 2.4 117.1 1.9 0.0 0.01972 2.6 101.1 24.6 0.2 0.01973 3.3 62.5 2.7 0.1 0.01974 1.4 54.4 3.3 0.5 0.01975 3.6 169.9 43.4 0.7 0.01976 0.4 17.3 5.7 0.1 0.01977 32.0 97.5 0.0 0.0 0.01978 154.9 334.9 5.5 0.0 0.01979 198.2 247.9 3.9 0.0 0.01980 50.9 324.2 67.6 6.1 2.51981 44.9 394.5 105.9 8.6 3.51982 71.4 565.3 91.0 4.3 1.61983 79.9 856.1 60.5 1.3 0.11984 12.4 602.4 89.2 2.9 0.01985 8.4 261.0 38.0 3.8 1.91986 1.4 127.8 39.0 5.8 0.51987 8.3 179.8 13.2 8.0 2.51988 56.9 137.7 12.5 3.1 2.21989 1.2 40.6 5.5 6.0 1.5
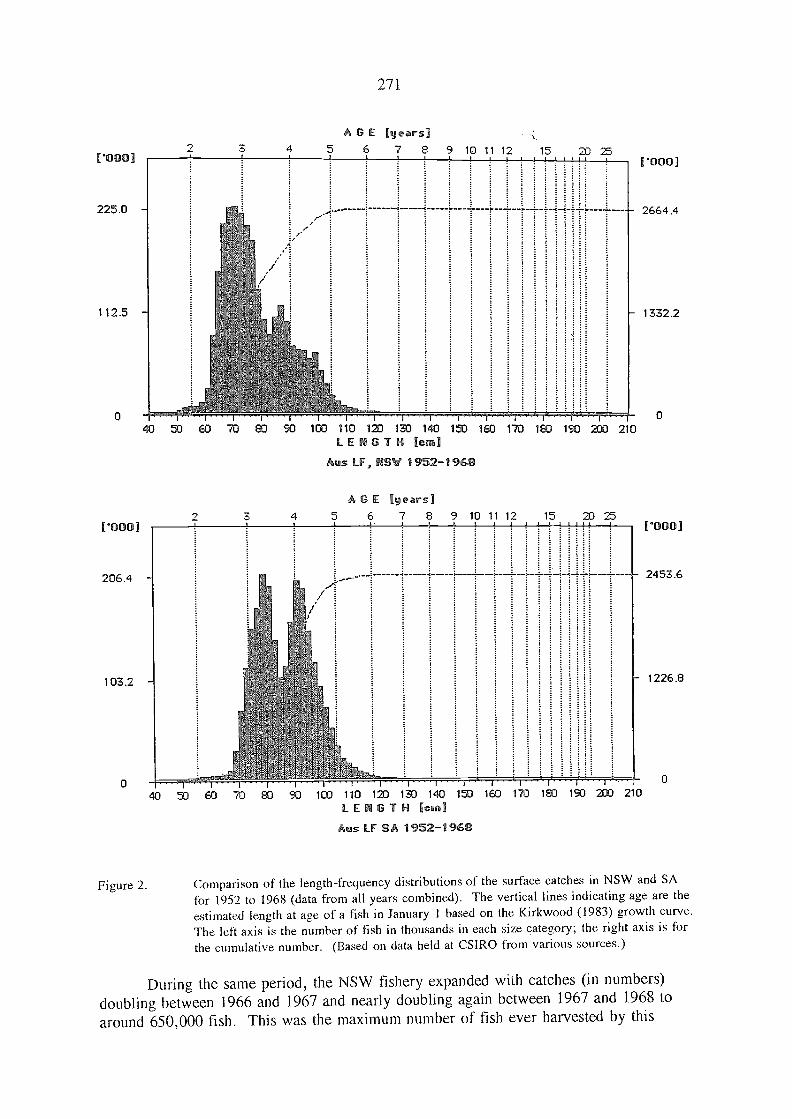
row
225.0 -
1 12.5
o
[0001
206.4
103.2
0
Figure 2.
.<
271
A G E [years]7 8
1 1 1 1 1 1 1 1 1
A G E [gears]8 9 10 11 12
1 1 I 'I "1 I 1 I
40 60 70 E0 CO 110 1213 133 140 153LENGTH [cm]Aus LF SA 1952-1968
2664.4
- 1332.2
o
[000]
2 4 5 3.6
Comparison of the length-frequency distributions of the surface catches in NSW and SA
for 1952 to 1968 (data from all years combined). The vertical lines indicating age are the
estimated length at age of a fish in January 1 based on the Kirkwood (1983) growth curve.
The left axis is the number of fish in thousands in each size category; the right axis is forthe cumulative number. (Based on data held at CSIRO from various sources.)
During the same period, the NSW fishery expanded with catches (in numbers)
doubling between 1966 and 1967 and nearly doubling again between 1967 and 1968 to
around 650,000 fish. This was the maximum number of fish ever harvested by this
60 70 SO 100 110 120 130 140 153 160 170 183 190 203 210LENGTH [cm]
Mis LF, NSV 1952-1968
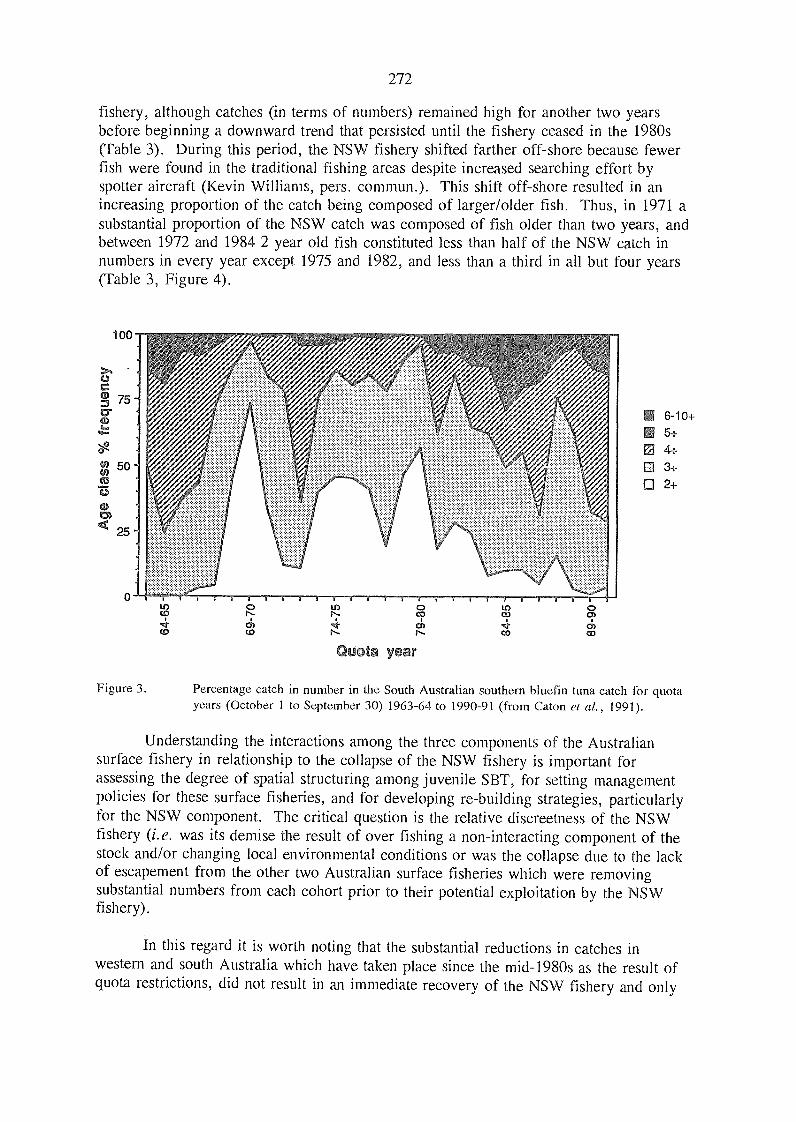
fishery, although catches (in terms of numbers) remained high for another two yearsbefore beginning a downward trend that persisted until the fishery ceased in the 1980s(Table 3). During this period, the NSW fishery shifted farther off-shore because fewerfish were found in the traditional fishing areas despite increased searching effort byspotter aircraft (Kevin Williams, pers. commun.). This shift off-shore resulted in anincreasing proportion of the catch being composed of larger/older fish. Thus, in 1971 asubstantial proportion of the NSW catch was composed of fish older than two years, andbetween 1972 and 1984 2 year old fish constituted less than half of the NSW catch innumbers in every year except 1975 and 1982, and less than a third in all but four years(Table 3, Figure 4).
100 "
272
Otiot year
Figure 3. Percentage catch in number in the South Australian southern bluetin tuna catch for quotayears (October 1 to September 30) 1963-64 to 1990-91 (from Caton et al., 1991).
Understanding the interactions among the three components of the Australiansurface fishery in relationship to the collapse of the NSW fishery is important forassessing the degree of spatial structuring among juvenile SBT, for setting managementpolicies for these surface fisheries, and for developing re-building strategies, particularlyfor the NSW component. The critical question is the relative discreetness of the NSWfishery (i.e. was its demise the result of over fishing a non-interacting component of thestock and/or changing local environmental conditions or was the collapse due to the lackof escapement from the other two Australian surface fisheries which were removingsubstantial numbers from each cohort prior to their potential exploitation by the NSWfishery).
In this regard it is worth noting that the substantial reductions in catches inwestern and south Australia which have taken place since the mid-1980s as the result ofquota restrictions, did not result in an immediate recovery of the NSW fishery and only
O
CD
6-10+
5+
4+
3+
2+
oco
1 1111111111LO 0 U) 0W is, 1,- OD
"4ch 4 6
(.0 CO 1", N.
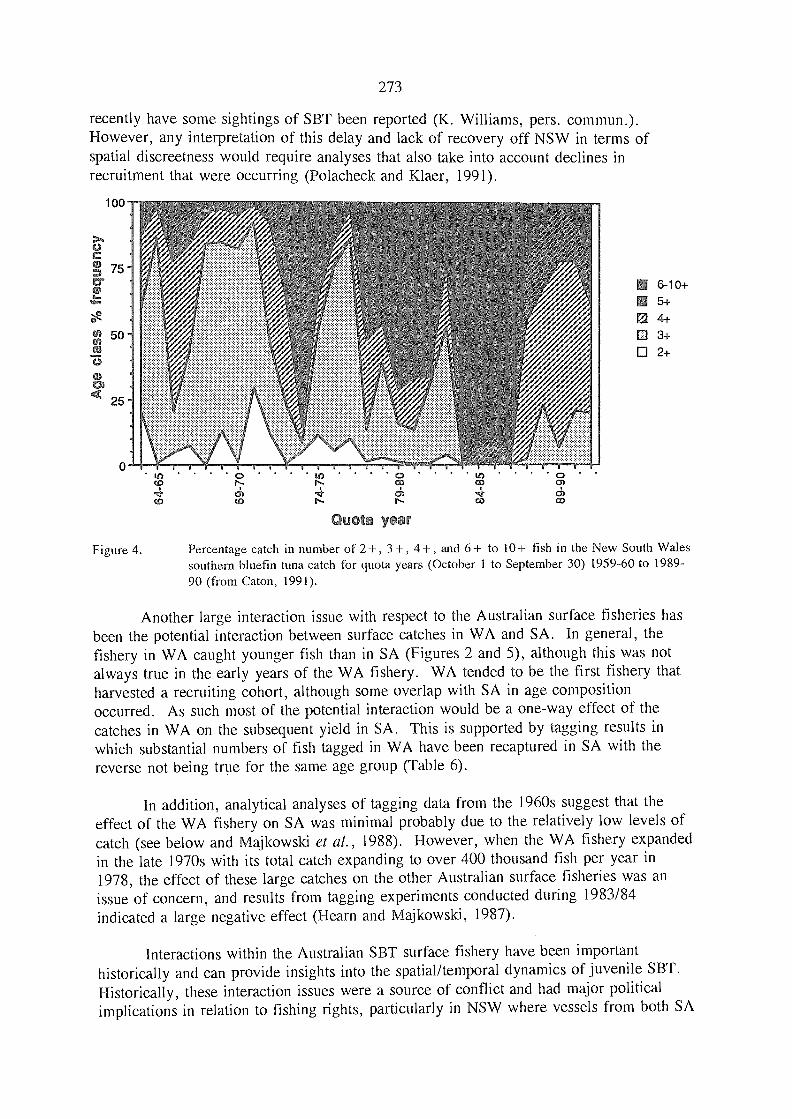
recently have some sightings of SBT been reported (K. Williams, pers. commun.).However, any interpretation of this delay and lack of recovery off NSW in terms ofspatial discreetness would require analyses that also take irito account declines inrecruitment that were occurring (Polacheck and Klaer, 1991).
1 00
25 -
' in
r--
Quota y
273
co coth 4
ca
Figure 4. Percentage catch in number of 2+, 3+, 4+, and 6+ to 10+ fish in the New South Walessouthern bluefin tuna catch for quota years (October 1 to September 30) 1959-60 to 1989-90 (from Caton, 1991).
Another large interaction issue with respect to the Australian surface fisheries hasbeen the potential interaction between surface catches in WA and SA. In general, thefishery in WA caught younger fish than in SA (Figures 2 and 5), although this was notalways true in the early years of the WA fishery. WA tended to be the first fishery thatharvested a recruiting cohort, although some overlap with SA in age compositionoccurred. As such most of the potential interaction would be a one-way effect of thecatches in WA on the subsequent yield in SA. This is supported by tagging results inwhich substantial numbers of fish tagged in WA have been recaptured in SA with thereverse not being true for the same age group (Table 6).
In addition, analytical analyses of tagging data from the 1960s suggest that theeffect of the WA fishery on SA was minimal probably due to the relatively low levels ofcatch (see below and Majkowski et al., 1988). However, when the WA fishery expandedin the late 1970s with its total catch expanding to over 400 thousand fish per year in1978, the effect of these large catches on the other Australian surface fisheries was anissue of concern, and results from tagging experiments conducted during 1983/84indicated a large negative effect (Hearn and Majkowski, 1987).
Interactions within the Australian SBT surface fishery have been importanthistorically and can provide insights into the spatial/temporal dynamics of juvenile SBT.Historically, these interaction issues were a source of conflict and had major politicalimplications in relation to fishing rights, particularly in NSW where vessels from both SA
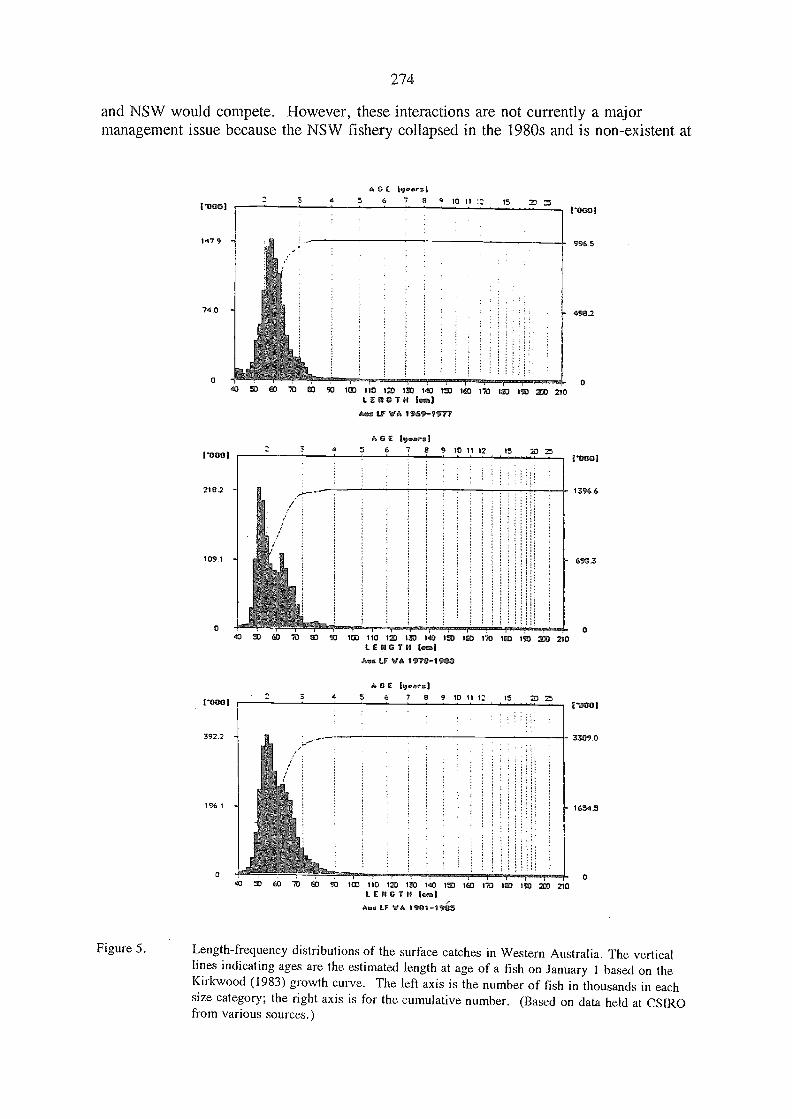
Figure 5.
18801
147 9
74.0
o
0001
2182
109.1
o
170001
392.2
196 1 -
o
40 W 60 70 60
274
and NSW would compete. However, these interactions are not currently a majormanagement issue because the NSW fishery collapsed in the 1980s and is non-existent at
AGE 19 64,s15 6 7 0 9 lO 11 :2 t5 22
1132 110 12D 1W 140 1W IGO 170 ICO 1113 2133 210LECIGTH icsal
Aes LF WA 1959-1977
AGE Nears'5 6 7 8 9 10 11 12 15 W25
107 110 12) 130 140 1n) 160 1X1 103 IW 233 210LE6GTH lema
Aata ti WA 1979-1
AGE 19rs6 7 8 9 10 11 12 15 20 25
40 52 60 71) 40 90 100 110 120 183 140 151) 10) IM 150 200 210LE F16111 icral
Aas LF WA 1991-1995
yowl
4982
o
1396.6
69E1.3
o
o
5
yowl
3309.0
1654.5
Length-frequency distributions of the surface catches in Western Australia. The verticallines indicating ages are the estimated length at age of a fish on January 1 based on theKirkwood (1983) growth curve. The left axis is the number of fish in thousands in eachsize category; the right axis is for the cumulative number. (Based on data held at CSIROfrom various sources.)
so40 W 60W

20
30
40
275
the present time. Also the WA fishery has been reduced to a very low level (due to quotarestrictions and economic factors). In the foreseeable future, economic considerations,combined with low stock levels are likely to prevent the re-development of a major WAfishery. However, if SBT re-appear off NSW in substantial numbers then interactionsbetwe,en fisheries in NSW and SA may again be an issue. Because the Australian SBTfishery has been restructured with the introduction of individual transferrable quotas,management issues are not likely to be concerned with access rights but with questions ofthe optimal strategies for recovery and utilization.
Figure 6. Areas and seasons of voluntary closures for SBT adopted by Japanese longline vessels
(from Caton, 1991).
TaggingExperiment
Location ofTagging
Number ofReleases
Number of Recaptures
WesternAustralia
SouthAustralia
1960-1980 Western Aus. 36,127 1,904 1,899
South Aus. 12,941 34 2,505
1983/1984 Western Aus. 6,913 1,273 1,383
South Aus, 3,153 23 1,342
Table 6. Summary of tag returns in Western Australia and South Australia surface fishery fromreleases in each fishery. (Based on data collected and stored at CSIRO, Division ofFisheries, Hobart, Tasmania.)
5. OVERLAPPING SURFACE AND LONGLINE FISHERIES INTERACTIONS
Longline and surface fisheries overlap in their operations within the AFZ and to alesser extent within the EEZ of New Zealand. Within AFZ, the potential for overlap hasbeen reduced by voluntary seasonal closures adopted by the Japanese longline fle,et since1971 within the Great Australian Bight and Victoria/NSW coast (Figures 6-7) andrestrictions placed on the longline vessels under access arrangements.
100 110 120 130 140 15010 20 30 40
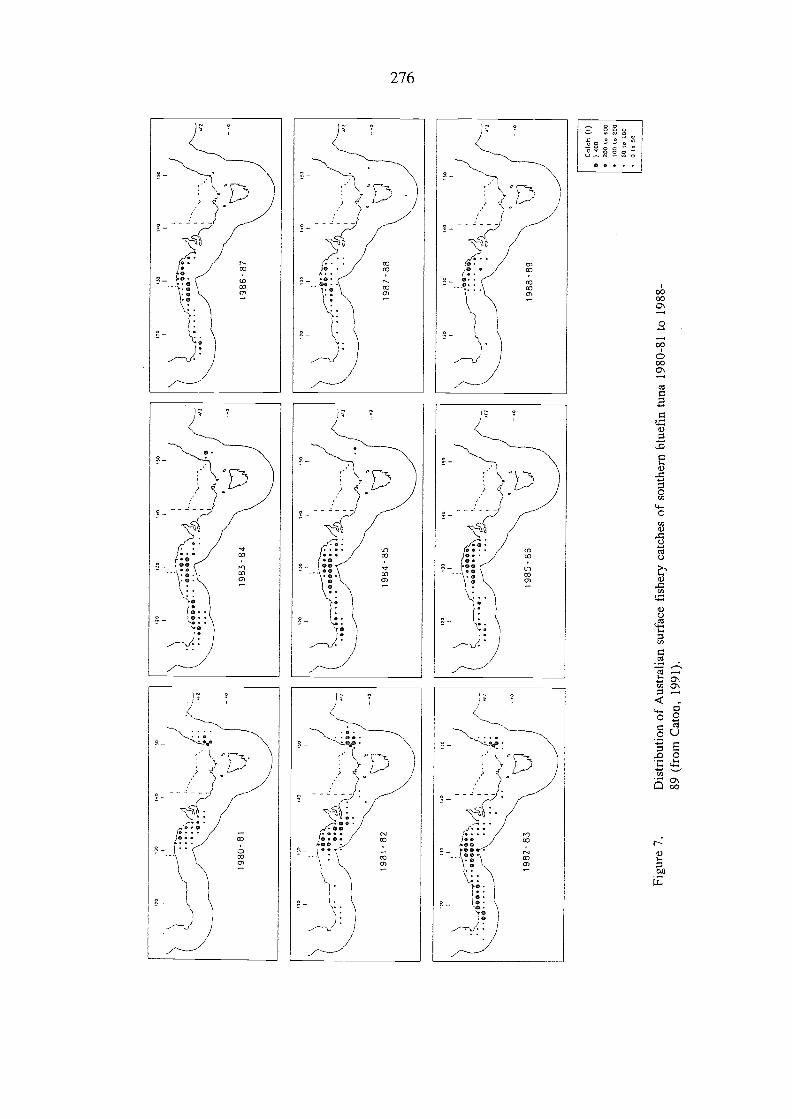
1980
-81
j
Figu
re 7
.D
istr
ibut
ion
of A
ustr
alia
n su
rfac
e fi
sher
y ca
tche
s of
sou
ther
n bl
uefi
n tu
na 1
980-
81 to
198
8-89
(fr
om C
aton
, 199
1).
Cat
ch (
I))
400
200
to 4
00/G
O to
200
50 to
100
O lo
50
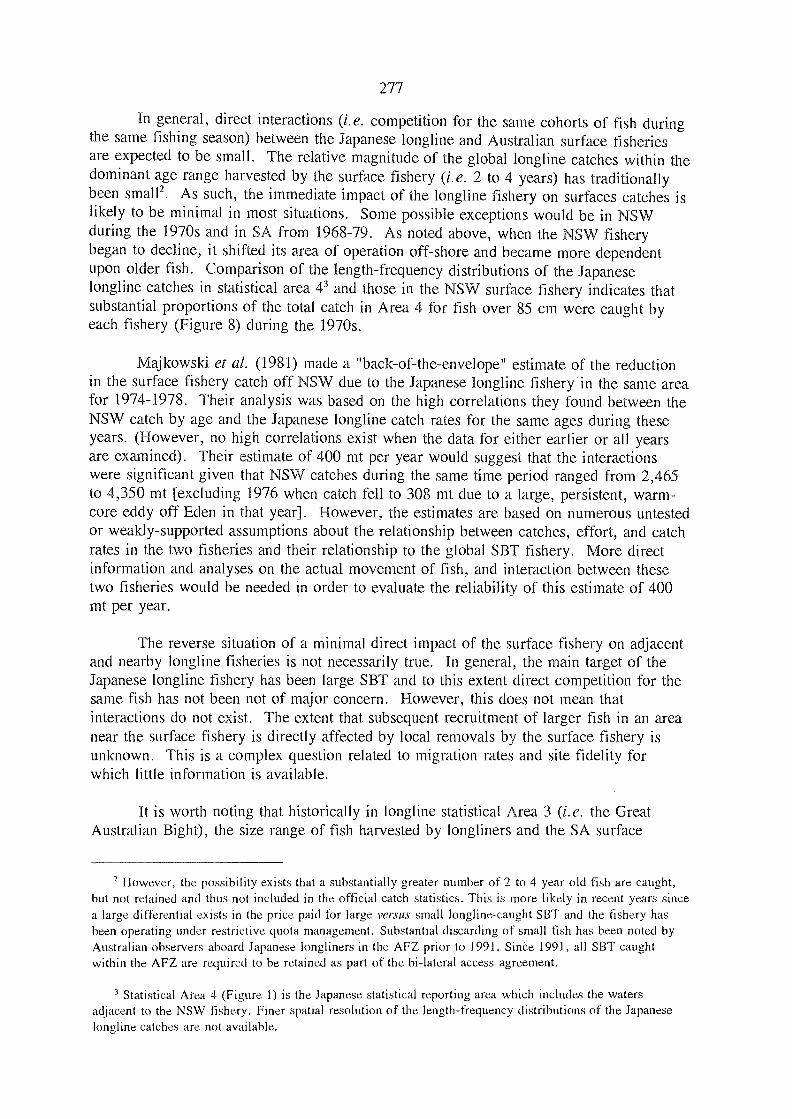
277
In general, direct interactions (i.e. competition for the same cohorts of fish duringthe same fishing season) between the Japanese longline and Australian surface fisheriesare expected to be small. The relative magnitude of the global longline catches within thedominant age range harvested by the surface fishery (i.e. 2 to 4 years) has traditionallybeen sma112. As such, the immediate impact of the longline fishery on surfaces catches islikely to be minimal in most situations. Some possible exceptions would be in NSWduring the 1970s and in SA from 1968-79. As nole-d above, when the NSW fisherybegan to decline, it shifted its area of operation off-shore and became more dependentupon older fish. Comparison of the length-frequency distributions of the Japaneselongline catches in statistical area 43 and those in the NSW surface fishery indicates thatsubstantial proportions of the total catch in Area 4 for fish over 85 cm were caught byeach fishery (Figure 8) during the 1970s.
Majkowski et al. (1981) made a "back-of-the-envelope" estimate of the retluctionin the surface fishery catch off NSW due to the Japanese longline fishery in the same areafor 1974-1978. Their analysis was based on the high correlations they found between theNSW catch by age and the Japanese longline catch rates for the same ages during theseyears. (However, no high correlations exist when the data for either earlier or all yearsare examined). Their estimate of 400 mt per year would suggest that the interactionswere significant given that NSW catches during the same time period ranged from 2,465to 4,350 mt [excluding 1976 when catch fell to 308 mt due to a large, persistent, warm-core eddy off Eden in that year]. However, the estimates are based on numerous untestedor weakly-supported assumptions about the relationship between catches, effort, and catchrates in the two fisheries and their relationship to the global SBT fishery. More directinformation and analyses on the actual movement of fish, and interaction between thesetwo fisheries would be needed in order to evaluate the reliability of this estimate of 400mt per year.
The reverse situation of a minimal direct impact of the surface fishery on adjacentand nearby longline fisheries is not necessarily true. In general, the main target of theJapanese longline fishery has been large SBT and to this extent direct competition for thesame fish has not been not of major concern. However, this does not mean thatinteractions do not exist. The extent that subsequent recruitment of larger fish in an areanear the surface fishery is directly affected by local removals by the surface fishery isunknown. This is a complex question related to migration rates and site fidelity forwhich little information is available.
It is worth noting that historically in longline statistical Area 3 (i.e. the GreatAustralian Bight), the size range of fish harvested by longliners and the SA surface
2 However, the possibility exists that a substantially greater number of 2 to 4 year old fish are caught,but not retained and thus not included in the official catch statistics. This is more likely in re,cent years sincea large differential exists in the price paid for large versus small longline-caught SBT and the fishery hasbeen operating under restrictive quota management. Substantial discarding of small fish has be,en note,d byAustralian observers aboard Japanese longliners in the AFZ prior to 1991. Sine.e 1991, all SBT caughtwithin the AFZ are required to be retained as part of the bilateral access agreement.
3 Statistical Area 4 (Figure 1) is the japanese statistical reporting area which includes the watersadjacent to the NSW fishery. Finer spatial resolution of the length-frequency distributions of the Japaneselongline catches are not available.
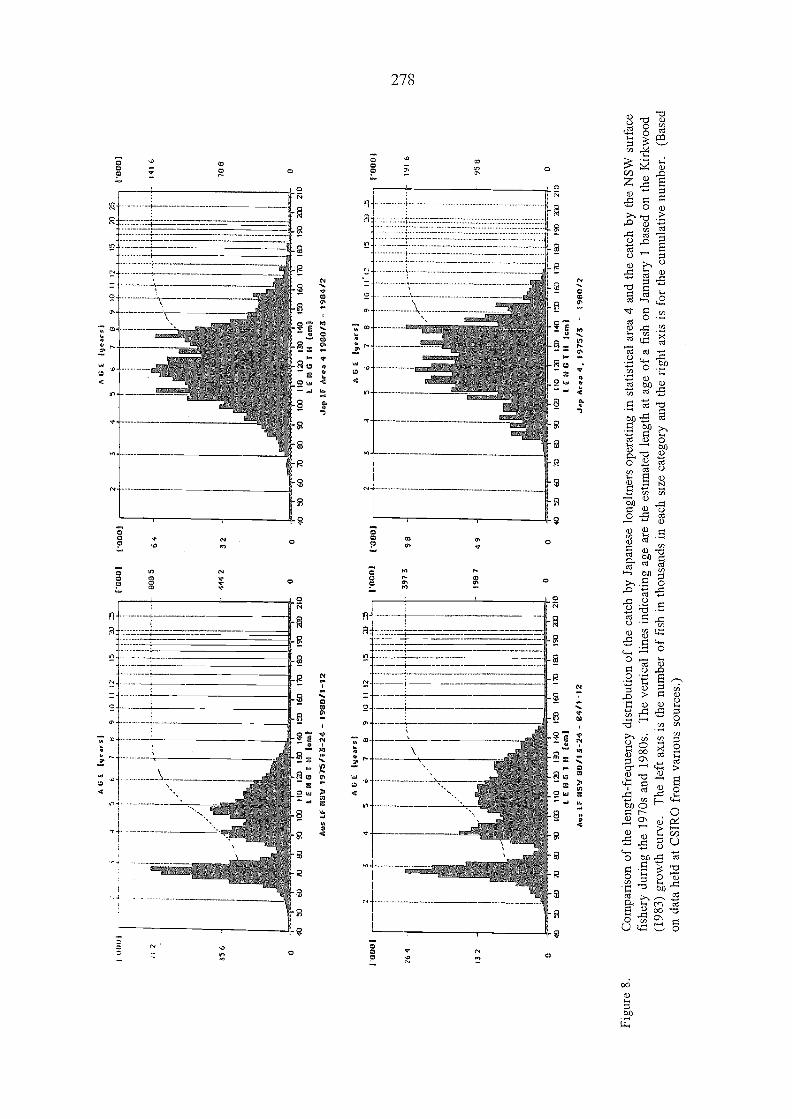
/1 2
55 6 0
132 o
4
A G
1E
lyer
si6
76
910
II1Z
A G
E N
ears
!
15
4053
6070
6090
100
110
123
130
ILO
150
160
170
160
193
zoo
210
LEN
GT
H Ic
cal
Aes
LF
NO
V 0
0/13
-24
- 64
/1-1
2
1000
11'
0001
888
5
444.
2
o
397
3
64 32 o
1000
11.
0001
2
A G
Ely
eare
l
A G
E N
ears
'6
78
910
I
ff
!
i
7383
9311
3311
012
319
314
019
316
017
019
390
zeo
210
LEN
GT
H le
rai
Jap
Are
a 4,
197
5/3
-19
0012
l'000
I
141
6
70 8 o
1000
1
191
6
o
i
...._
T
111
11
1i
11
,
1I
I ,
4-,-
r-g,
----
-7-,
,,,1
i
+--
./--
-""
1-
7 -1.-
-7
IVI
I<
al/
....-
.t
!
I
I
/.-
..., -
...-
- -
- -
--
[ i
'
4093
6070
8093
103
110
2319
314
015
016
017
01E
019
3 Z
O 2
1060
7083
9)1C
O11
012
019
314
019
316
017
018
019
020
0 21
0LE
NG
TH
lesa
lLE
NG
TH
lem
1A
s LF
NO
V 1
975/
13-2
4 -
1960
/1-1
2Je
ff, L
F A
rea
4 19
90/3
- 1
9134
/2
Figu
re 8
.C
ompa
riso
n of
the
leng
th-f
re,q
uenc
y di
stri
butio
n of
the
catc
h by
Jap
anes
e lo
nglin
ers
oper
atin
g in
sta
tistic
al a
rea
4 an
d th
e ca
tch
by th
e N
SW s
urfa
cefi
sher
y du
ring
the
1970
s an
d 19
80s.
The
ver
tical
line
s in
dica
ting
age
are
the
estim
ated
leng
th a
t age
of
a fi
shon
Jan
uary
1 b
ase,
d on
the
Kir
kwoo
d(1
983)
gro
wth
cur
ve. T
he le
ft a
xis
is th
e nu
mbe
r of
fis
h in
thou
sand
s in
eac
h si
ze c
ateg
ory
and
the
righ
t axi
s is
for
the
cum
ulat
ive
num
ber.
(B
ased
on d
ata
held
at C
SIR
O f
rom
var
ious
sou
rces
.)
198.
749
1004
31
26 4
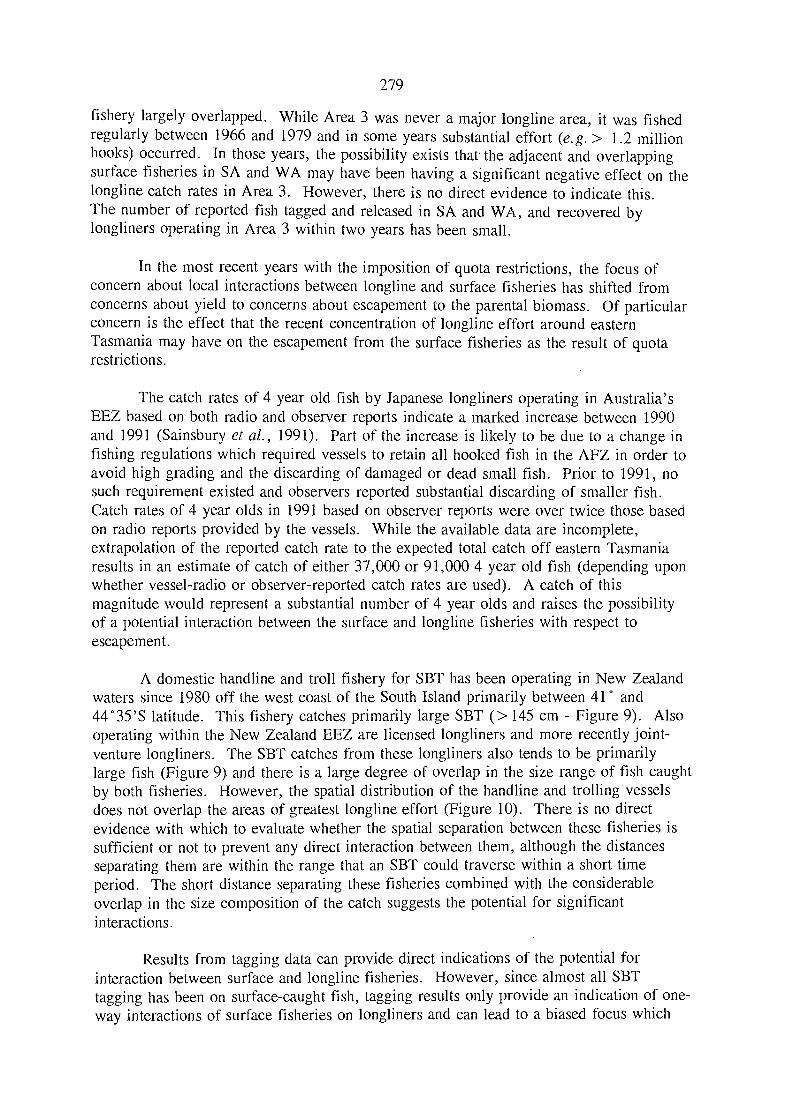
279
fishery largely overlapped. While Area 3 was never a major longline area, it was fishedregularly between 1966 and 1979 and in some years substantial effort (e.g.> 1.2 millionhooks) occurred. In those years, the possibility exists that the adjacent and overlappingsurface fisheries in SA and WA may have been having a significant negative effect on thelongline catch rates in Area 3. However, there is no direct evidence to indicate this.The number of reported fish tagged and released in SA and WA, and recovered bylongliners operating in Area 3 within two years has been small.
In the most recent years with the imposition of quota restrictions, the focus ofconcern about local interactions between longline and surface fisheries has shifted fromconcerns about yield to concerns about escapement to the parental biomass. Of particularconcern is the effect that the recent concentration of longline effort around easternTasmania may have on the escapement from the surface fisheries as the result of quotarestrictions.
The catch rates of 4 year old fish by Japanese longliners operating in Australia'sEEZ based on both radio and observer reports indicate a marked increase between 1990and 1991 (Sainsbury et al., 1991). Part of the increase is likely to be due to a change infishing regulations which required vessels to retain all hooked fish in the AFZ in order toavoid high grading and the discarding of damaged or dead small fish. Prior to 1991, nosuch requirement existed and observers reported substantial discarding of smaller fish.Catch rates of 4 year olds in 1991 based on observer reports were over twice those basedon radio reports provided by the vessels. While the available data are incomplete,extrapolation of the reported catch rate to the expected total catch off eastern Tasmaniaresults in an estimate of catch of either 37,000 or 91,000 4 year old fish (depending uponwhether vessel-radio or observer-reported catch rates are used). A catch of thismagnitude would represent a substantial number of 4 year olds and raises the possibilityof a potential interaction between the surface and longline fisheries with respect toescapement.
A domestic handline and troll fishery for SBT has been operating in New Zealandwaters since 1980 off the west coast of the South Island primarily between 41° and44°35S latitude. This fishery catches primarily large SBT (>145 cm - Figure 9). Alsooperating within the New Zealand EEZ are license,d longliners and more recently joint-venture longliners. The SBT catches from these longliners also tends to be primarilylarge fish (Figure 9) and there is a large degree of overlap in the size range of fish caughtby both fisheries. However, the spatial distribution of the handline and trolling vesselsdoes not overlap the areas of greatest longline effort (Figure 10). There is no directevidence with which to evaluate whether the spatial separation between these fisheries issufficient or not to prevent any direct interaction between them, although the distancesseparating them are within the range that an SBT could traverse within a short timeperiod. The short distance separating these fisheries combined with the considerableoverlap in the size composition of the catch suggests the potential for significantinteractions.
Results from tagging data can provide direct indications of the potential forinteraction between surface and longline fisheries. However, since almost all SBTtagging has been on surface-caught fish, tagging results only provide an indication of one-way interactions of surface fisheries on longliners and can lead to a biase,d focus which
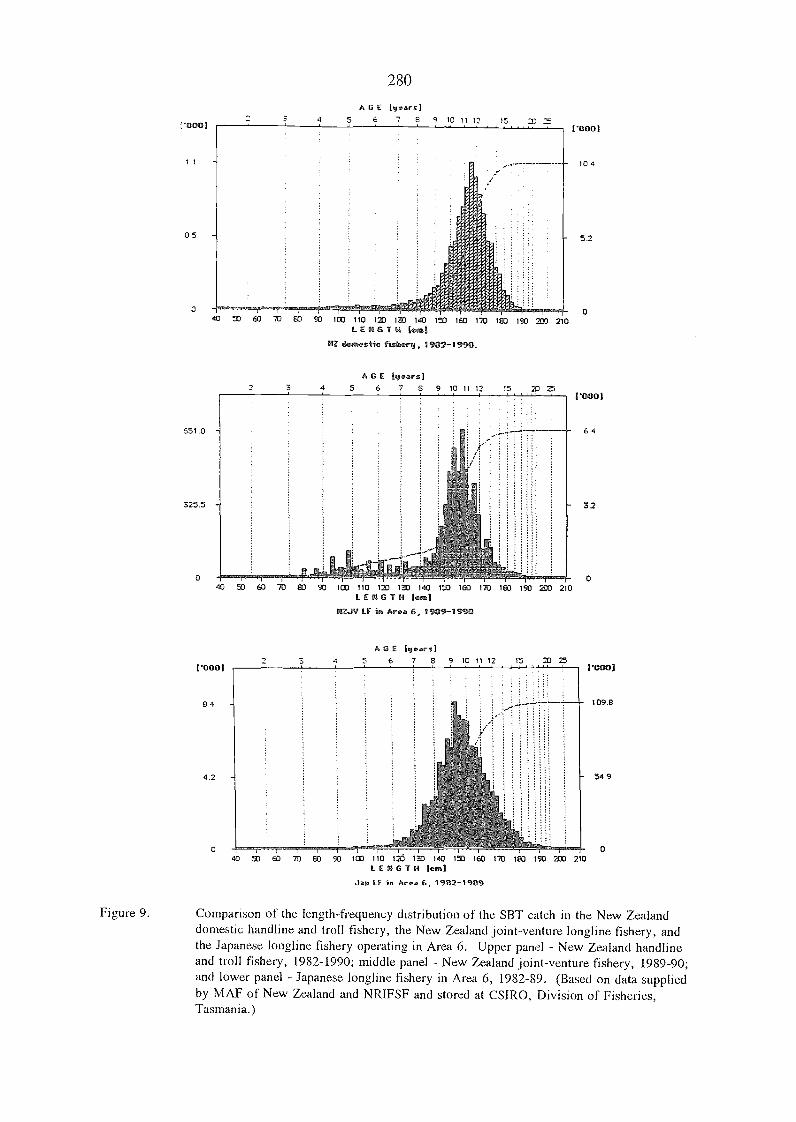
651 0
325.5
o
e4
4.2
280
A G E Wears]8 9 10 11 12
40 50 60 70 60 93 100 110 123 1 140 150 160 170 90 190 2:0 210LENGTH,
o
laic fishery, 1982-1990.
A G E Nears]8 7 8 9 10 11 12 15 20
100 110 120 133 140 150 160 170 1E0 1
LENGTH IcraiPI2JV LF Area 6, 1989-19J
0 11 12 15 2020
40 5) 60 71) SO 93 103 110 it 133 140 15) 160 170 co 190 210LEPdGTH lern1
Jay LF in Are 6, 1982-1989
109.8
54.9
o
Figure 9. Comparison of the length-frequency distribution of the SBT catch in the New Zealanddomestic handline and troll fishery, the New Zealand joint-venture longline fishery, andthe Japanese longline fishery operating in Area 6. Upper panel - New Zealand handlineand troll fishery, 1982-1990; middle panel - New Zealand joint-venture fishery, 1989-90;and lower panel - Japanese longline fishery in Area 6, 1982-89. (Based on data suppliedby MAF of New Zealand and NRIFSF and stored at CSIRO, Division of Fisheries,Tasmania.)
A c6
gears]74
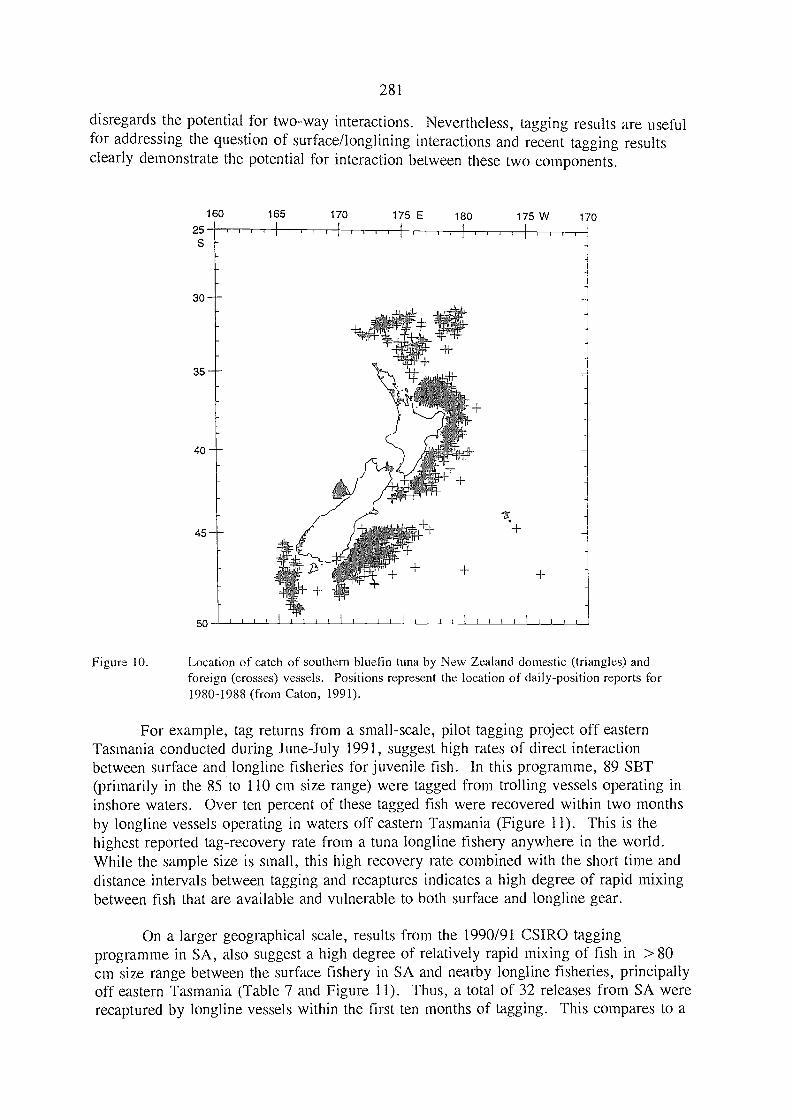
disregards the potential for two-way interactions. Nevertheless, tagging results are usefulfor addressing the question of surface/longlining interactions and recent tagging resultsclearly demonstrate the potential for interaction betwe,en these two components.
281
Figure 10. Location of catch of southern bluefin tuna by New Zealand domestic (triangles) andforeign (crosses) vessels. Positions represent the location of daily-position reports for1980-1988 (from Caton, 1991).
For example, tag returns from a small-scale, pilot tagging project off easternTasmania conducted during June-July 1991, suggest high rates of direct interactionbetwe,en surface and longline fisheries for juvenile fish. In this programme, 89 SBT(primarily in the 85 to 110 cm size range) were tagged from trolling vessels operating ininshore waters. Over ten percent of these tagged fish were recovered within two monthsby longline vessels operating in waters off eastern Tasmania (Figure 11). This is thehighest reported tag-recovery rate from a tuna longline fishery anywhere in the world.While the sample size is small, this high recovery rate combined with the short time anddistance intervals between tagging and recaptures indicates a high degree of rapid mixingbetween fish that are available and vulnerable to both surface and longline gear.
On a larger geographical scale, results from the 1990/91 CSIRO taggingprogramme in SA, also suggest a high degre,e of relatively rapid mixing of fish in >80cm size range between the surface fishery in SA and nearby longline fisheries, principallyoff eastern Tasmania (Table 7 and Figure 11). Thus, a total of 32 releases from SA wererecaptured by longline vessels within the first ten months of tagging. This compares to a
160 165 170 175 E 180 175 W 17025 i i r r T I FI
Is-
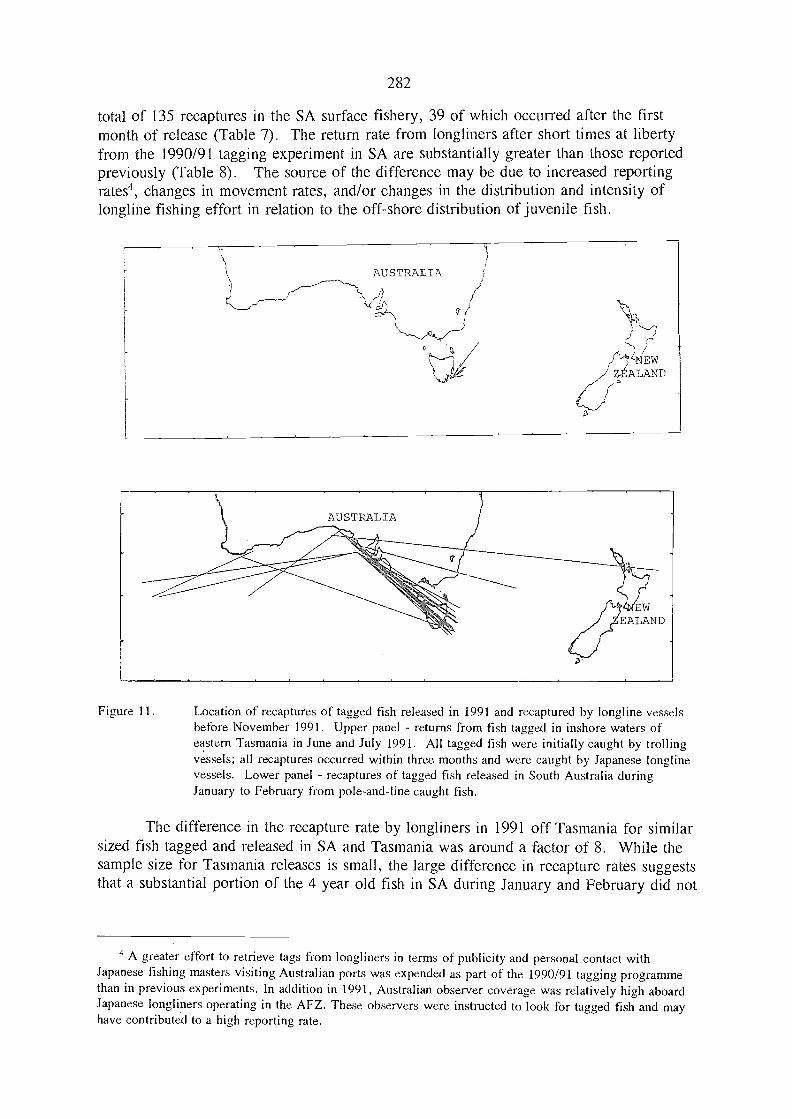
282
total of 135 recaptures in the SA surface fishery, 39 of which occurred after the firstmonth of release (Table 7). The return rate from longliners after short times at libertyfrom the 1990/91 tagging experiment in SA are substantially greater than those reportedpreviously (Table 8). The source of the difference may be due to increase,d reportingrates', changes in movement rates, and/or changes in the distribution and intensity oflongline fishing effort in relation to the off-shore distribution of juvenile fish.
Figure 11.
AUSTRALIA
À
<
ALAND
Location of recaptures of tagged fish released in 1991 and recaptured by longline vesselsbefore November 1991. Upper panel - returns from fish tagged in inshore waters ofeastern Tasmania in June and July 1991. All tagged fish were initially caught by trollingvessels; all recaptures occurred within thre,e months and were caught by Japanese longlinevessels. Lower panel - recaptures of tagged fish released in South Australia duringJanuary to February from pole-and-line caught fish.
The difference in the recapture rate by longliners in 1991 off Tasmania for similarsized fish tagged and released in SA and Tasmania was around a factor of 8. While thesample size for Tasmania releases is small, the large difference in recapture rates suggeststhat a substantial portion of the 4 year old fish in SA during January and February did not
A greater effort to retrieve tags from longliners in terms of publicity and personal contact withJapanese fishing masters visiting Australian ports was expended as part of the 1990/91 tagging progranunethan in previous experiments. In addition in 1991, Australian observer coverage was relatively high aboardJapanese longliners operating in the AFZ. These observers were instructexl to look for tagged fish and mayhave contributed to a high reporting rate.
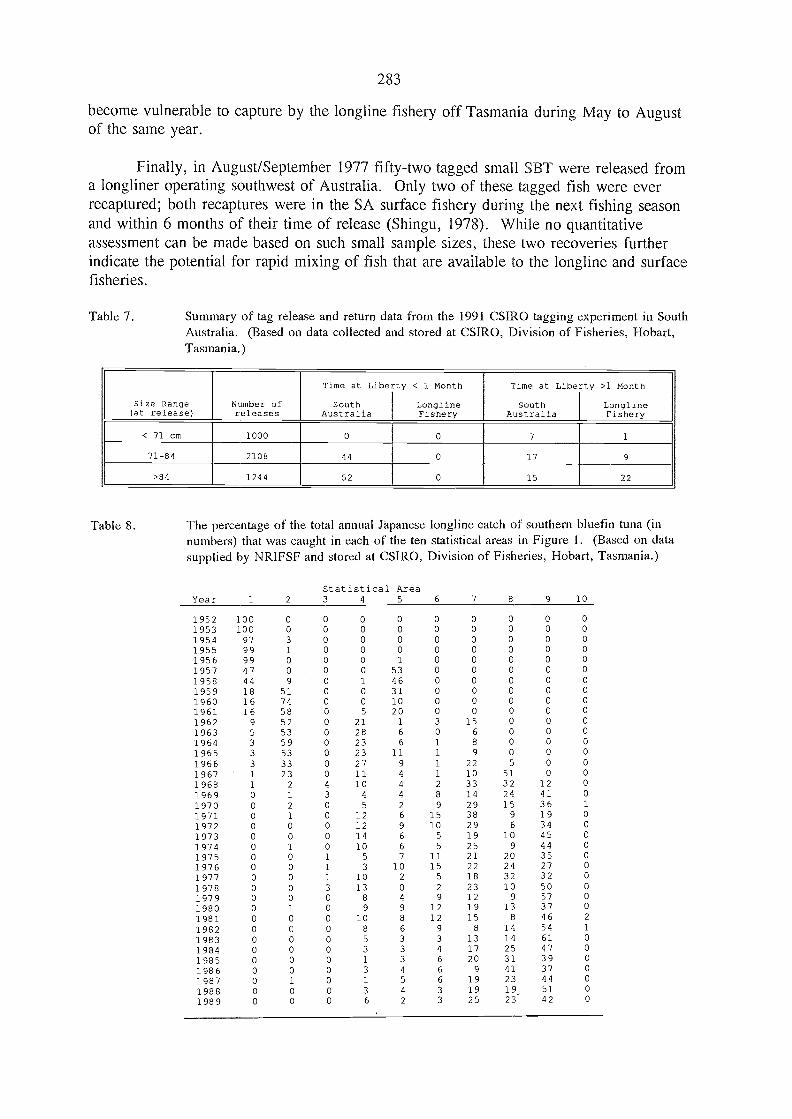
283
become vulnerable to capture by the longline fishery off Tasmania during May to Augustof the same year.
Finally, in August/September 1977 fifty-two tagged small SBT were releaset1 froma longliner operating southwest of Australia. Only two of these tagged fish were everrecaptured; both recaptures were in the SA surface fishery during the next fishing seasonand within 6 months of their time of release (Shingu, 1978). While no quantitativeassessment can be made based on such small sample sizes, these two recoveries furtherindicate the potential for rapid mixing of fish that are available to the longline and surfacefisheries.
Table 7. Summary of tag release and return data from the 1991 CSIRO tagging experiment in SouthAustralia. (Based oil data collecte,d and stored at CSIRO, Division of Fisheries, Hobart,Tasmania.)
Table 8. The percentage of the total annual Japanese longline catch of southern bluefin tuna (innumbers) that was caught in each of the ten statistical areas in Figure 1. (Based on datasupplied by NRIFSF and stored at CSIRO, Division of Fisheries, Hobart, Tasmania.)
Statistical Area
Size Range(at release)
Number ofreleases
Time at Liber
SouthAustralia
y < i Month
LonglineFishery
Time at Liber
SouthAustralia
y >1 Month
LonglineFishery
< 71 cm 1000 0 0 7
71-84 2108 44 0 17 9
>84 1244 52 0 15 22
Year 1 2 3 4 5 6 7 8 9 10
1952 100 0 0 0 0 0 0 0 o o1953 100 0 0 0 0 0 0 0 0 0
1954 97 3 0 0 0 0 0 0 o o1955 99 1 o o o o o o o o
1956 99 0 0 0 1 o o o o o
1957 47 0 0 0 53 0 0 0 0 0
1958 44 9 0 1 46 0 0 0 0 0
1959 18 51 0 0 31 0 0 0 0 0
1960 16 74 0 0 10 0 0 0 0 0
1961 16 58 0 5 20 0 0 0 0 0
1962 9 52 0 21 1 3 15 0 0 0
1963 5 53 0 28 6 0 6 0 0 0
1964 3 59 0 23 6 1 8 o o o1965 3 53 0 23 11 1 9 0 0 0
1966 3 33 0 27 9 1 22 5 0 0
1967 1 23 0 11 4 1 10 51 0 o
1968 1 2 4 10 4 2 33 32 12 0
1969 0 1 3 4 4 8 14 24 41 0
1970 0 2 0 5 2 9 29 15 36 1
1971 0 1 0 12 6 15 38 9 19 0
1972 0 0 0 12 9 10 29 6 34 0
1973 0 0 0 14 6 5 19 10 45 0
1974 0 1 0 10 6 5 25 9 44 0
1975 0 0 1 5 7 11 21 20 35 0
1976 0 0 1 3 10 15 22 24 27 0
1977 0 0 1 10 2 5 18 32 32 0
1978 0 0 3 13 0 2 23 10 50 0
1979 0 0 o 8 4 9 12 9 57 0
1980 0 1 o 9 9 12 19 13 37 0
1981 0 0 0 10 8 12 15 8 46 2
1982 0 0 o 8 6 9 8 14 54 1
1983 0 0 0 s 3 3 13 11 61 0
1984 0 0 0 3 3 4 17 25 47 0
1985 0 0 0 1 3 6 20 31 39 0
1986 0 0 0 3 4 6 9 41 37 0
1987 0 1 o 1 5 6 19 23 44 0
1988 0 0 0 3 4 3 19 19 51 0
1989 0 0 0 6 2 3 25 23- 42 0
284
6. INTERACTION AMONG AUSTRALIAN SURFACE CATCHES ANIP T ESUBSEQUENT CATCHES UN THE LONGLINE FIS ERY FROIVI THESAME COHO TS
The effects of the large increase in surface catches that occurred in the late 1970sand early 1980s raised concerns about the effect these catches may have had on futurelongline catches. Prior to this time, the effect of Australian surface fisheries on theglobal SBT longline catches was thought to be small, if not negligible (Murphy, 1977).Japanese longline catch rates declined from the 1960s through the 1980s. The VPAestimates of stock size and age-one recruitment also exhibit declining trends since 1960(Polacheck and Klaer, 1991; Ishizuka and Tsuji, 1991), with the declines in stock sizegenerally being steeper than the decline in recruitment. The extent to which these long-term declines in catch rates are due to reduced escapement from surface fisheries or dueto decreased recruitment at age one (as the result of reduced spawning biomass) is notclear.
Hampton (1989) constructed yield-per-recruit surfaces for the SBT fisheries whichprovide an indication of the effects on the yield from a cohort for different relativeamounts of effort in the Australian surface and Japanese longline fisheries (Figure 12).The results suggest that the yield per recruit in the longline fishery declines rather steeplyas a function of increasing effort in the Australian surface fishery (Figure 13). The finerdetailed shapes of these surfaces are dependent upon assumptions about the age-specificselectivity estimates used for each gear. In a stock like SBT which exhibits a high degreeof spatial structure, age-specific selectivities are likely to vary considerably with changesin the spatial distribution of effort, targeting and retention practices. However, thesechanges in selectivity are only likely to effect the steepness of the relationship. Thegeneral shape of the yield surfaces is likely to be relatively robust as long as the age ofmost of the surface fishery catches is less than the age being caught in the longlinefishery.
Hampton's yield-per-recruit surfaces assume that all recruiting juvenile SBT passthrough the Australian surface fishery. To the extent that a proportion of the juvenilesare not vulnerable to the Australian surface fisheries, then the actual yield surface wouldtend to flatten out and approach a non-zero constant as a function of an increasing fishingmortality rate in the Australian surface fishery. The migration and dispersal of juvenilesis not well understood. In the traditional model of juvenile migration, young fish migratedown the west coast of Australia from the spawning grounds and first appear in the WAsurface fishery at age one and two. They then remain off SA and NSW for two to threeyears with dispersal into the longline fishery occurring throughout this period.
However, some juveniles appear in the longline fishery off South Africa at anearly age (as young as age 2) indicating that not all portions of the juvenile stock areequally vulnerable to the Australian surface fishery. Murphy (1977) suggested that alarge portion of the juveniles moving down the west coast of Australia turn westward andnever enter the Australian fishery and Harden-Jones (1984) suggested that some SBTlarvae may be carried westward in the South Equatorial Current to African waters directlyfrom the spawning ground. Analyses of tagging data suggests incomplete mixing of 2year old fish from WA and SA in SA at ages 3 and 4. In contrast, 3 year old fish appearmore evenly mixed between the two areas. This suggest that not all of the 2 year old fish

which occur in WA pass through SA. In addition, a higher proportion of longline tagreturns from fish released off WA have been from the waters around South Africa thanaround either SA or NSW (e.g. Murphy 1977; Ishizuka, 1987; Hearn and Polacheck,1991).
A
285
LÀLH effort multiplier
0.0 0.5 1.0 1.5 2.0
ort NntiplierJa e
Southern bluefin tuna yield-per-re,cruit contours for different levels of Australian andJapanese relative fishing power (from Hainpton, 1989).
Figure 12.
0.0 0.5 1.0 1.5 2.0 2.5 3.0
The relationship between Japanese fishery yield-per-recruit and Australian fishing effort forvarious age-at-entry to the surface fishery (from Hampton, 1989).
Figure 13.
286
Thus, longline catch-and-effort statistics and the tagging data suggest a significantproportion of 2 year old fish may not enter the SA and NSW fishery'. Such movement ordispersal of young fish away from the Australian coast means that a refuge from thesurface fisheries exists for part of the juvenile stock which will eventually becomerecruited into the longline fishery. Consequently, Hampton's yield-per-recruit surfaces(and the implicit interactions between surface and longline fisheries for fish from the samecohort) are likely to be too large with respect to the effects of increasing fishing-mortalityrates in the Australian surface fishery on subsequent longline yield. This is likely to beeven more so in recent years, given the shift in the Australian surface fishery away fromWA and increased targeting on larger/older fish and the increase concentration of longlineeffort in areas of small fish (e.g. off Eastern Tasmania in Area 7).
7. INTERACTIONS AMONG LONGLINE VESSELS FISHING IN DIFFERENTAREAS
The interaction among longline fisheries in different area.s is possibly one of themore critical interactions for current SBT management. Distinct longline fishing groundsfor SBT off South Africa, Southern Australia, Tasmania, New South Wales, Brazil, andNew Zealand are recognized by Japanese vessels. These fishing grounds are generallyconsidered to be feeding areas for SBT. Historically, fishing grounds for SBT alsooccurred in the spawning, and pre- and post- spawning areas in the tropical and sub-tropical Indian Ocean (i.e. Areas 1 and 2 in Figure 1). Japanese fishermen voluntarilyclosed these latter areas as a conservation measure and because the quality of fish caughtwas generally poor. However, a significant and increasing by-catch of SBT is beingtaken in these two areas by Japanese, Taiwanese and Indonesian longliners targeting othertuna species (Caton, 1991).
Relative catch rates among different age classes have varied among the feedingareas, with extremely low catch rates for some areas and age classes in recent years.Longline fishing effort has also tended to become spatially concentrated and concernsexist about "the possibility of serial depletion (to commercial extinction)" of one areaafter another (Anon., 1991). The possibility of serial depletion and the importance ofconsidering the areas fished as well as total SBT catches in the management of the stockdepend upon the amount of spatial structuring (i.e. the degree of mixing and interchangeversus site fidelity) within the global SBT population.
There is no direct information which allows quantification of the spatial structuringamong post juvenile SBT. However, a number of factors suggests a complex spatialstructure. The relative importance of different grounds in terms of the global catch hasbeen variable (Tables 8-10). Catch rates in different areas are not highly correlatedalthough all exhibit a downward temporal trend (Figure 14). For example, in area 5around northern New Zealand, catch rates for intermediate size fish in the 1964-81 period
5 The CSIRO and JAMARC conducted a joint tagging experiment in WA in 1990/91 and CSIROconducte,d a tagging experiment in SA during the same fishing season. A set of similar tagging experimentsfor the 1991/92 season is currently underway. Part of the objective of these tagging experiments is to tagthe same cohort in multiple years and areas. Results from these tagging experiments should provide furtherinformation on the proportion of recruits in WA that enter different fisheries.

were among the highest of any statistical area, but since that time catch rates for theseintermediate sizes have been the lowest of any area and in fact declined to near zero.
Table 9.
287
The percentage of the annual Japanese longline catch of 8 to 12 year old southern bluefintuna (in numbers) that were caught in each of the ten statistical areas in Figure 1.Estimates of the catch-at-age in each area were based on quarterly length-fre,quencydistributions of the catch suppliexl by the National Research Institute of Japan and a knife-edge partition into age classes basad on the Kirkwood (1983) growth curve. (Based ondata supplied by NRIFSF and stored at CSIRO, Division of Fisheries, Hobart, Tasmania.)
Statistical Area
In addition, there has been a differential in the location of tagged fish recapturedby longliners depending upon the initial location of tagging. For example, about equalnumbers of all longline recaptures in the 1960-70 tagging experiments from fish tagge,d inWA come from east and west of 70°E, while for releases from SA about one third ofrecaptures occurred west of 70°E and only a small percentage of recaptures this far westoccurred for the releases from NSW. However, interpretation of these differentialrecapture rates is confounded by the differences in age and year of tagging. A moredetailed analysis which considers both the temporal, spatial and size/age distribution ofthe longline catch and effort is needed. Finally, genetic studies from samples of SBTcollected around New Zealand suggest heterogeneity both between localities and seasons(Smith et al., 1990; Dr. P. J. Smith, pers. commun.), but the amount of information ongenetic variability among SBT is very limited. The tagging and limited geneticinformation both suggest complex spatial structuring with correspondingly complexinteractions among longline fisheries in different areas.
Year 1 2 3 4 5 6 7 e 9 10
1952 100 0 0 0 0 0 o o o o1953 100 0 0 0 0 0 o o o o1954 96 4 0 0 0 0 o o o o1955 99 1 o o o o o o o o1956 69 0 0 0 31 0 0 0 0 01957 3 0 0 0 97 0 0 0 0 01958 6 7 0 1 86 0 0 0 0 01959 4 30 0 0 66 0 0 0 0 01960 2 65 0 0 32 0 0 0 0 01961 4 17 0 17 62 0 0 0 0 01962 2 18 0 50 2 8 21 0 0 01963 1 13 0 61 14 1 9 0 0 01964 1 20 0 50 12 2 14 0 0 01965 2 21 0 45 22 1 9 0 0 01966 0 6 0 56 14 1 17 5 0 01967 0 6 0 30 e 1 12 43 0 01968 0 0 9 20 4 2 24 23 16 01969 0 0 6 7 3 6 e 7 61 01970 0 0 0 9 3 6 21 10 49 11971 0 0 1 21 7 12 27 5 28 01972 0 0 0 19 s 8 22 4 38 0
1973 0 0 0 19 7 3 11 6 54 01974 0 0 0 15 7 4 16 7 51 0
1975 0 0 1 10 7 7 20 18 37 0
1976 0 0 1 4 10 10 14 18 44 0
1977 0 0 2 18 3 4 14 27 31 0
1978 0 0 4 22 0 1 15 6 51 0
1979 0 0 0 13 4 e 7 4 63 0
1980 0 0 0 18 2 6 14 11 49 01981 0 0 0 20 4 6 16 7 48 0
1982 0 0 0 17 3 6 5 6 63 0
1983 0 0 0 9 1 1 4 5 80 01984 0 0 0 3 0 0 15 18 64 01985 0 0 0 1 o 1 10 27 60 01986 0 0 0 3 0 1 3 30 63 01987 0 0 0 2 0 1 12 11 74 0
1988 0 0 0 2 0 0 29 13 56 0
1989 0 0 o 8 o o 26 17 49 0
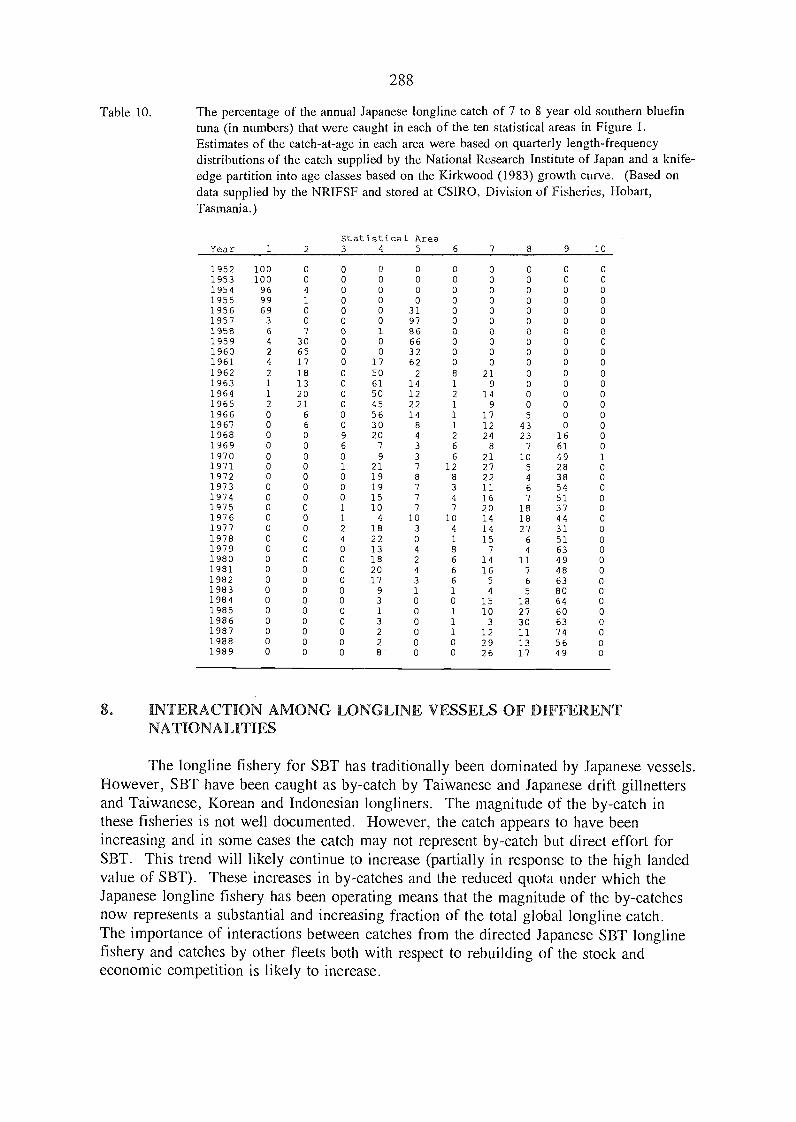
Table 10.
288
The percentage of the annual Japanese longline catch of 7 to 8 year old southern bluefintuna (in numbers) that were caught in each of the ten statistical areas in Figure 1.Estimates of the catch-at-age in each area were based on quarterly length-frequencydistributions of the catch supplied by the National Research Institute of Japan and a knife-edge partition into age classes basetl on the Kirkwood (1983) growth curve. (Basecl ondata supplied by the NRIFSF and stored at CSIRO, Division of Fisheries, Hobart,Tasmania.)
Statistical Area
8. INTERACTION AMONG LONGLINE VESSELS OF DIFFERENTNATIONALITIES
The longline fishery for SBT has traditionally been dominated by Japanese vessels.However, SBT have been caught as by-catch by Taiwanese and Japanese drift gillnettersand Taiwanese, Korean and Indonesian longliners. The magnitude of the by-catch inthese fisheries is not well documented. However, the catch appears to have beenincreasing and in some cases the catch may not represent by-catch but direct effort forSBT. This trend will likely continue to increase (partially in response to the high landedvalue of SBT). These increases in by-catches and the reduced quota under which theJapanese longline fishery has been operating means that the magnitude of the by-catchesnow represents a substantial and increasing fraction of the total global longline catch.The importance of interactions between catches from the directed Japanese SBT longlinefishery and catches by other fleets both with respect to rebuilding of the stock andeconomic competition is likely to increase.
Year 1 2 3 4 5 6 7 8 9 10
1952 100 0 0 0 0 0 0 0 0 01953 100 0 0 0 0 0 0 0 0 01954 96 4 0 0 0 0 0 0 0 01955 99 1 0 0 0 0 0 0 0 01956 69 0 0 0 31 0 0 0 0 01957 3 0 0 0 97 0 0 0 0 01958 6 7 0 1 86 0 0 0 0 01959 4 30 0 0 66 0 0 0 0 01960 2 65 0 0 32 0 0 0 0 01961 4 17 0 17 62 0 0 0 0 01962 2 18 0 50 2 8 21 0 0 01963 1 13 0 61 14 1 9 0 0 01964 1 20 0 50 12 2 14 0 0 01965 2 21 0 45 22 1 9 0 0 01966 0 6 0 56 14 1 17 5 0 01967 0 6 0 30 a 1 12 43 0 01968 0 0 9 20 4 2 24 23 16 01969 0 0 6 7 3 6 8 7 61 01970 0 0 0 9 3 6 21 10 49 11971 0 0 1 21 7 12 27 5 28 01972 0 0 0 19 8 8 22 4 38 01973 0 0 0 19 7 3 11 6 54 01974 0 0 0 15 7 4 16 7 51 01975 0 0 1 10 7 7 20 18 37 01976 0 0 1 4 10 10 14 18 44 01977 0 0 2 18 3 4 14 27 31 01978 0 0 4 22 0 1 15 6 51 01979 0 0 0 13 4 8 7 4 63 01980 0 0 0 18 2 6 14 11 49 01981 0 0 0 20 4 6 16 7 48 01982 0 0 0 17 3 6 5 6 63 01983 0 0 0 9 1 1 4 5 80 01984 0 0 0 3 0 0 15 18 64 01985 0 0 0 1 0 1 10 27 60 01986 0 0 0 3 0 1 3 30 63 01987 0 0 0 2 0 1 12 11 74 01988 0 0 0 2 0 0 29 13 56 01989 0 0 0 8 0 0 26 17 49 0
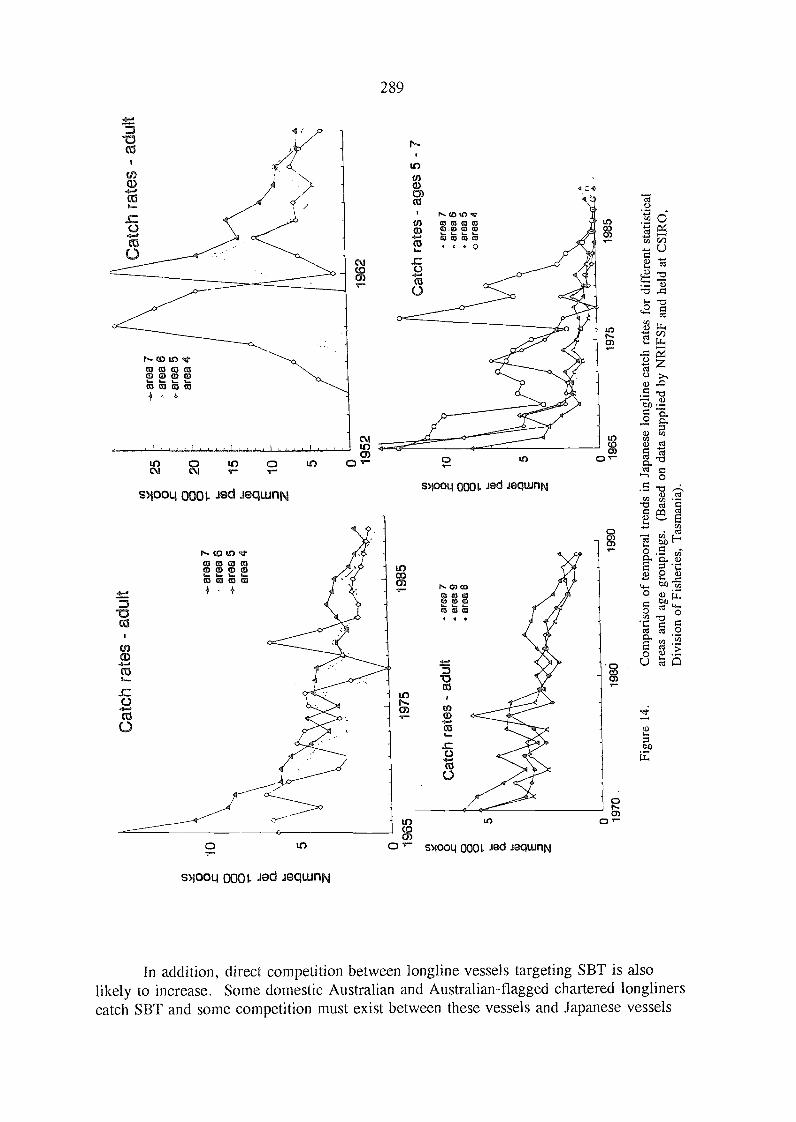
P '6C
D
C/)
°H
5. T.
" CD
051
)°
CD
CID
0.
CD
;' 0CD
CD
(") c,
cp 6'C
D'1
0
CD
"6 > 0 o- o g
cr. o
Ctc
?e- cl
5)
CD
CD
"<
CD
CD c4
< CD
i(1
)
cr%
cra a -c
--6
C)
cmP "
P a -I
3a)
2.C
D'c
ip
<E
.,C
D C4
çqc4
2,
Con
(1)
C/)
Figu
re 1
4.
Cat
ch r
ates
- a
dult
1975
Cat
ch r
ates
- a
du/t
-ar
ea 7
arse
9ar
ea 8ar
ea 7
er::
6-0
- ar
ea 5
area
4
1985
1990
U3
area
7.x o o
25
§20
, are
a 6
z-,
are
a 5
area
4
... a15
.8 E D10
U)
5 o 1952
1962
Cat
ch r
ates
- a
dult
Cat
ch r
ates
- a
ges
5 -
7
area
7. a
rea
6ar
ea 5
o ar
ea 4
Com
pari
son
of te
mpo
ral t
rend
s in
Jap
anes
e lo
nglin
e ca
tch
rate
s fo
r di
ffer
ent s
tatis
tical
area
s an
d ag
e gr
oupi
ngs.
(B
ased
on
data
sup
plie
d by
NR
IFSF
and
hel
d at
CSI
RO
,D
ivis
ion
of F
ishe
ries
, Tas
man
ia).
290
licensed to fish in the AFZ. Similarly, four to five longline vessels on charter to NewZealand companies have participate,d in New Zealand's domestic SBT fishery since 1989(Murray and Burgess, 1991). In addition, an increasingly larger proportion of theAustralian SBT quota which was traditionally caught by pole-and-line and purse-seinevessels is now being caught by longliners under joint-venture operations with theJapanese. These joint-venture operations are seen as a transition stage in the developmentof a domestic Australian SBT longline fishery. To the extent that this transition occurs,interaction between Japanese and Australian longline vessels could be,come a significantissue. Similarly, the potential exists for expansion of the domestic or charter longlinefishery in New Zealand with corresponding significant interactions with foreign vessels.
In addition, targeting shifts to SBT by non-Japanese (e.g. Taiwanese, Korean orIndonesian) longliners would not be unexpected given the landed value of this species,particularly if significant stock recovery occurs. Since Japanese longline effort is oftenconcentrated with several vessels setting longlines within a few miles of each other, localas well global concerns are likely to develop. Thus, an Australian observer who justrecently (November, 1991) completed a three-month trip aboard a Japanese longlineoperating in the high-sea area of the southeastern Indian Ocean reported instances of aTaiwanese longliner operating in the same immediate area as Japanese vessels.
9. INTERACTIONS AMONG LONGLINE AND SURFACE FIRM tIES WITHRESPECT TO RECRUITMENT AND FUTURE CATCHES
The effect of current catches on spawning biomass and future recruitment iscurrently the most critical issue facing SBT management. Joint management policies byAustralia, Japan and New Zealand have been directed at setting catch levels that wouldprevent any further decline in the spawning biomass and rebuild the stock. Indetermining appropriate catch levels, interaction clearly exists between the total globalcatch and its distribution among different fisheries.
Initially, uni-lateral quota levels were set by Australia on the surface fishery forthe 1983/84 fishing season while Japan agreed to a quota on the longline fisherybeginning with the 1986/87 fishing season. The quota levels did not constrain theAustralian fisheries during the first year nor the Japanese longline fishery prior to the1988/89 fishing season. However, in the last few years as quotas were reduced, thequotas have constrained both the longline and surface fisheries. These constraints haveresulted in operational shifts. Concerns now exist about the interactions between thedistribution of catches among the different fisheries and their effects on current and futurespawning biomass.
The relative value of high-quality sashimi fish compared to other products hasbeen and continues to result in a shift in targeting to large fish and in a shift in geartowards longlining. Thus, the WA SBT fishery is almost non-existent (e.g. the 1990/91season's catch was around 200 mt); the SA surface fishery has been attempting to targetlarger fish with only partial success (Caton et al., 1991); and an increasing proportion ofthe Australian quota is being caught by Japanese longline vessels under joint-venturearrangements. These shifts towards targeting larger fish llave increased the necessity ofunderstanding the interaction between current spawning biomass, future recruitment andthe distribution of the catch among different fisheries.
291
From a yield-per-recruit perspective, a shift in selectivity towards larger/older fish willresult in an increased contribution to the spawning stock over a wide range of size/ageclasses for a given quota. This is because the estimated annual gain in weight due togrowth is greater than estimates of the loss in numbers due to natural mortality. Thus,from an equilibrium perspective, maximum gain in spawning biomass from a cohort isachieved when removals are taken out at later ages. However, during a transition phase,this will not necessarily be the case since the shifts in targeting may result in the samecohorts being tracked as they pass through the different fisheries. Tracking of a cohort isof particular concern if these shifts are occurring during a period of decliningrecruitment.
More critical, perhaps, in the case of SBT is the fact that increasing the proportionof the total catch by longliners could result in further reductions in the spawning biomass.Stock projections based on the results from virtual population analyses suggest that suchshifts towards older fish would enhance the long term recovery rate of the stock butwould decrease the recovery in the short term (Klaer and Kirkwood, 1990; Klaer et al.,1991). The estimated effects of shifting the size selectivity in the global fishery tend tobe small if recent recruitment has been sufficient to allow enough escapement from thesurface fishery for the spawning stock to have begun to recover. However, greatuncertainty exists about the most recent recruitment levels. If recent recruitment has beendeclining and is insufficient to allow for recovery given current catch levels, then shiftingthe catch to longlining and older ages could not only retard short-term recovery, but couldreduce the chances of it occurring. However, the general conclusions from theseprojection analyses suggest that the total magnitude of the catch appears to be a morecritical factor for recovery than the distributions of the catch among the various fisheries.
10. INTERACTION, MOVEMENT, A MIXING RATES BASED ONTAGGING STUDIES
A quantitative understanding of movements, mixing and migration rates is neededto fully assess and model the interactions among different fisheries, particularly ones thatare spatially dispersed. Tagging data in combination with catch-and-effort data potentiallyprovide the best source of information on interactions and movement. As noted above,extensive tagging programmes for SBT have been conducted using surface-caught fish inAustralia (Table 1).
An examination of recapture by fishery and time of release from the threecomponents of the Australian surface fishery demonstrate the potential for extensive andrapid movement (Figures 11 and 15). These recaptures confirm the general movement ofyoung fish away from the WA surface fishery within the year of tagging (i.e. only asmall fraction of the recaptures of WA releases recaptured within WA had times ofliberty greater than one year) and suggest that a substantial number of these fish recruitedinto the NSW and SA fishery. The recapture data also indicate movement between theNSW and SA surface fisheries but tend to suggest unequal mixing with a greaterproportion of recaptures from the area of release in the second year after tagging.
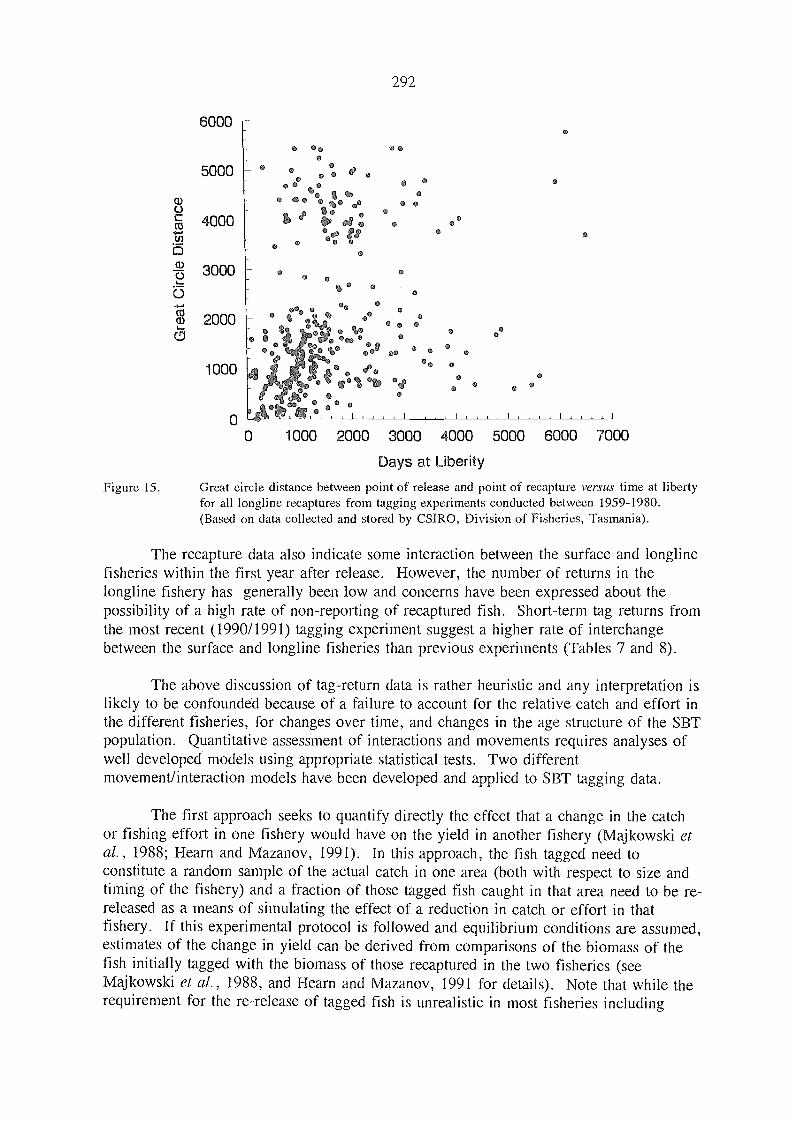
Figure 15.
6000
292
e
e
e 0 z0 o q,0 00
0 eCP
0c : (6'0o
3000 0
eoa) 2000 0 Co °
eeO Q, 00 ° o1-6
o 02\90 9. %0 °Oco
,,,O+ovo ° ° eco°
1000'ir c)
e
-
o° 0o ots, O
c 'e°o
o °, o
1 000 2000 3000 4000 5000 6000 7000
Days at Liberity
Great circle distance between point of release and point of recapture versus time at libertyfor all longline recaptures from tagging experiments conducted between 1959-1980.(Based on data collected and stored by CSIRO, Division of Fisheries, Tasmania).
The recapture data also indicate some interaction between the surface and longlinefisheries within the first year after release. However, the number of returns in thelongline fishery has generally been low and concerns have been expressed about thepossibility of a high rate of non-reporting of recaptured fish. Short-term tag returns fromthe most recent (1990/1991) tagging experiment suggest a higher rate of interchangebetween the surface and longline fisheries than previous experiments (Tables 7 and 8).
The above discussion of tag-return data is rather heuristic and any interpretation islikely to be confounded because of a failure to account for the relative catch and effort inthe different fisheries, for changes over time, and changes in the age structure of the SBTpopulation. Quantitative assessment of interactions and movements requires analyses ofwell developed' models using appropriate statistical tests. Two differentmovement/interaction models have been developed and applied to SBT tagging data.
The first approach seeks to quantify directly the effect that a change in the catchor fishing effort in one fishery would have on the yield in another fishery (Majkowski etal., 1988; Hearn and Mazanov, 1991). In this approach, the fish tagged need toconstitute a random sample of the actual catch in one area (both with respect to size andtiming of the fishery) and a fraction of those tagged fish caught in that area need to be re-released as a mea.ns of simulating the effect of a reduction in catch or effort in thatfishery. If this experimental protocol is followed and e,quilibrium conditions are assumed,estimates of the change in yield can be derived from comparisons of the biomass of thefish initially tagged with the biomass of those recaptured in the two fisheries (seeMajkowski et al., 1988, and Hearn and Mazanov, 1991 for details). Note that while therequirement for the re-release of tagged fish is unrealistic in most fisheries including
5000
4000
Uo
e e
293
those for SBT, alternative field and analytical approaches can be used, at least partially,to overcome this requirement.
Majkowski et al. (1988) applied this method to poole,d tagging data from the 1960sand Hearn and Majkowski (1987) applied this method to data from a tagging experimentconducted during the 1983/84 fishing se,ason. Results based on the 1960s tagging returnsindicate that changing the catch of any component of the Australian SBT fishery (i.e.WA, SA or NSW) would have little effect on the catches in any other of the surfacecomponents'. The maximum estimated effect of increarsing the catch in any onecomponent by one unit on the catches in other components would have been a decrease of0.06 units. The results from the 1983/84 tagging experiment suggest larger interactionsbetwe,en the WA and SA fisheries (note that the NSW fishery had collapsed by this time).Thus, an increase by 1 unit of catch in WA was estimated to result in a decrease in theyield in the SA fishery of between 0.64 and 0.83 units'. However, the effect ofincreasing catches in the SA fishery on the catches in WA was still estimated to beminimal, reflecting the fact that the amount of movement from SA to WA must be lowsince the fishing-mortality intensity in both fisheries was high.
The second analytical approach based on tagging data used to investigate interactionsamong SBT fisheries is a parametric model that estimates transfer rates between fisheries,natural mortality rates and fishery-specific catchability coefficients (Hampton, 1989;1991). These parameters are estimated using the rates of tag returns for tags released andrecovered in the different fisheries. In contrast to the first approach, this secondapproach assumes that a random sample of the population has been tagged. Models ofthese types have been developed by Beverton and Holt (1957) and Sibert (1984) and theone used with the SBT data is an extension of these previous models to a three-fisherysituation (Hampton, 1989; 1991).
Hampton applied his model to two sub-sets of the SBT tagging data from the1960-1970 period and derived estimates for the Japanese longline fishery and the NSWand SA/WA combined surface fisheries. The resulting estimates of the transfer ratesbetween the different components suggested relatively high rates of mixing andmovement. The estimates of the transfer rate between the NSW and SA/WA fisheriesand vice-versa were of the order of 0.1 to 0.2 per year while transfer rates into thelongline fishery ranged from 0.6 to 1.8 (only one-directional movement from the surfacefisheries into the longline fishery was allowed in the model). The model as developedand applied assumes that both transfer rates and catchability coefficients are independentof age. The one-directional transfer rate from the surface fishery to the longline fisheryseems unrealistically high for juveniles and is a likely consequence of the assumption of aconstant rate over all ages and the drop off to zero recaptures in the surface fishery forolder fish.
High incide,nce of undetected tag shedding or under-reporting of recaptureS could mask the true levelof interaction (e.g. Hearn et al., 1991).
These estimates did not account for differences in the size distributions of the fish when tagged and theactual size distribution of the catch in the fishery. If these differences were taken into account, the estimated
effects would he slightly greater (Dr. W. Hearn, pers. commun.).
294
Both analytical approaches required assumptions in their development andapplication to the SBT tagging data. Some of these assumptions appear unrealistic andthe robustness of the results to deviation from these assumptions has not been wellexplored. Thus, the tag/re-release approach of Majkowski et al. (1988) entailsassumptions about equilibrium conditions and requires a linear relationship between catchand effort in the surface fishery (see Hearn and Mazanov, 1991 for additional discussion).For the 1960s period, the validity of pooling data from a number of different taggingprogrammes over several years is of concern during a period in which both the surfacefishery was expanding (Table 2) and stock sizes were variable'. Nevertheless, theapproach appears to provide a reasonable measure of the level of interaction betweenfisheries at the time of the tagging programme, but appears to have limited predictive usewhen either the magnitude of the fishery and/or stock sizes change markedly. Thus, thelarge difference in the degree of interaction between the 1960s and early 1980s asestimated by the two different sets of tagging experiments is not predictable based soleyon the results from one of the experiments.
The results from Hampton's parametric approach provide a direct framework forpredicting interaction as fisheries change. However, Hampton's analysis needed to pooltagging data from different years (and thus ignore cohort and year effects both withrespect to the stock and the fishery). The analysis also discounts the possibility that oncefish become vulnerable to longliners that they remain vulnerable to surface fisheries.Finally, Hampton's model assumes age-independent catchability coefficient and transferrates. All of these factors are important with respect to SBT. Consequently, using thederived parameter estimates for assessment and predictive purposes could be misleading.The problems in this case are not a limitation of the approach, but limitations in thecatch, effort and tagging data which would allow construction and estimation of asufficiently detailed parametric model. However, overcoming these problems is difficultbecause of the need to simultaneously tag in all of the fisheries combine,d with the needfor large sample sizes and replication in order to get meaningful parameter estimates (i.e.low coefficients of variation and low correlations among the parameter estimates).
11. RESEARCH A DATA NEEDS
The most important interaction issues for SBT differ from those for most othertuna due to the current low stock levels and the potential for over-exploitation. Given thecurrent low biomass, the stock/recruitment dynamics for SBT are the most criticalmanagement and assessment issue. While traditional approaches for examining thestock/recruitment dynamics do not directly involve interaction issues, concerns aboutspatial structure and serial depletion mean that an understanding of the interaction amongthe spatially-dispersed SBT fisheries is of fundamental importance for understanding therecruitment dynamics. As such the most important research and data needs with respectto interactions for SBT continue to centre around questions of movement, migrationroutes, mixing rates and site fidelity. Two areas of future research can be identified -those which can be done with already existing data and those requiring new datacollection schemes.
VPA estimates vary by about a factor of two in the number of either 1, 2 ,3 or 4 year old fish duringthe period 1960-1970 (Polacheck and Klaer, 1991).
295
There is a need for improved models and analyses of existing tagging data thataccount for both the age-specific and temporal dynamics of the stock, changes in thefishery and environmental factors. There is also a need for assessment models which takeinto account not only the temporal dynamics of the catch-and-effort data but their spatialdynamics. These types of modelling activities are likely to ne,ed fine scale catch, effortand size-composition data from the longline fishery. Historically, sufficient fine-scaleresolution catch-and-effort data have been collected but have not been available forresearch. The fine-scale information on the size distribution of the catch that has beencollected is also unavailable. The overall level of data coverage also nee,ds to beimproved.
Improvement to the analyses of existing catch, effort, and tagging data (includingthe fine-scale catch-and-effort data when available) may provide further insights into thespatial structure and movements of SBT. However, by themselves, the existing data arenot likely to be sufficient for addressing the most fundamental interaction questions. Thefundamental shortcoming of the present data is that all tagging experiments (with theexception of 50 longline-caught fish - see above) have been done on juvenile fish capturedin the Australian surface fishery. This precludes any direct information on movement andmixture rates of juvenile and adult fish, and on juvenile fish in areas outside theAustralian surface fishery. Consequently, in terms of the current interaction issues in thefisheries for SBT, there is a need for additional data. There are several complementaryapproaches that could be undertaken to overcome the fundamental shortcoming in thepresent data. These include:
tagging in fisheries and areas other than the Australian surface fishery;
developing methods for tracking the real-time movements of fish over longdistances and time periods (e.g. "archival tags", see Hunter et al., 1986);
genetic analyses of different age classes of fish caught over a range ofgeographic locations;
micro-analyses of the isotope ratios of hard parts from fish that have beentagged and released in various locations; and
collection of behavioural data on feeding, temperature preference, etc. in thecontext of developing models to explain why SBT move.
There are problems and difficulties with all of these approaches. Significantprogress is most likely to be made through a multi-faceted strategy involving acombination of at least several, if not all, of these approaches.
12. REFEREPICES CITED
Anonymous. 1991. Report of the tenth meeting of Australian, Japanese and NewZealand Scientists on Southern Bluefin Tuna. Wellington, New Zealand, 23-27September 1991.
Beverton, R.J.H. and S.J. Holt. 1957. On the dynamics of exploited fish populations.Fishery Investigations (Series II) 19:1-533.
Caton, A.E. 1993. Commercial and recreational components of the Southern Bluefin tuna(Thunnus maccoyii) fishery. In Interactions of Pacific Tuna Fisheries: Proceedings of theFirst FAO Expert Consultation on Interactions of Pacific Tuna Fisheries, edited by R.S.Shomura, J. Majkowski, and S. Langi, 3-11 December 1991, Noumea, New Caledonia.[See this document].
Caton, A.E. (editor). 1991. Review of aspects of southern bluefin tuna biology,population and fisheries. Spec.Rep.I-AT7'C, (7):181-350.
Caton, A., K. Williams, P. Ward, and C. Ramirez. 1991. The 1990-91 Australiansouthern bluefin tuna season. Tenth Scientific Meeting on Southern Bluefin TunaSBFWS/91/1.
Caton, A., K. McLoughlin, and M.J. Williams. 1990. Southern bluefin tuna: scientificbackground to the debate. Bull.Au.vt.Bur. Rural Resources, (3):41 p.
Hampton, W.J. 1989. Population Dynamics, Stock Assessment and FisheryManagement of the Southern Bluefin Tuna (Thunnus maccoyii). Ph.D. Thesis. Universityof New South Wales, Kensington, Australia, 273 p.
Hampton, W.J. 1991. Estimation of southern bluefin tuna (Thunnus maccoyii) naturalmortality and movement rates from tagging experiments. Fish.Bull.NOAA-NMFS,(89):591-610.
Harden-Jones, F.R. 1984. A view from the ocean. In Mechanisms of migration infishes, edited by J.D. McCleave, G.P.Arnold, J.J. Dodson, and W.H. Neil. New York.Plenum Press, pp. 1-26.
Hearn, W.S., G.M. Leigh, and R.J.H. Beverton. 1991. An examination of a tag-shedding assumption, with application to southern bluefin tuna. ICES J.Mar.Sci., 48:41-51.
Hearn, W.S. and J. Majkowski. 1987. Interactions among the Australian southernbluefin tuna fisheries: a preliminary analysis based on tag release-recapture experiment.Paper presented at Expert Consultation on Stock Assessment of Tunas in the IndianOcean, 4-8 December 1986, Colombo, Sri Lanka.
296

297
Hearn, W.S. and A. Mazanov. 1991. Interaction between two fisheries: Tag-recapturemethods for estimating the effect on catches of changing fishing intensity. Paperpresented at FAO Expert Consultation on Interactions of 'Pacific Ocean Tuna Fisheries, 3-11 December 1991, Noumea, New Caledonia, 21 p.
Hearn, W. and T. Polacheck. 1991. Estimation of the average total mortality rate ofsouthern bluefin tuna from tagging data. Tenth Scientific Meeting on Southern BluefinTuna SBFWS/91/5.
Hunter, J.R., A.W. Argue, W.H. Bayliff, A.E. Dizon, A. Fonteneau, D. Goodman, andG.R. Seckel. 1986. The dynamics of tuna movements: an evaluation of past and futureresearch. FAO Fish.Tech.Pap., (227):78 p.
Ishizuka, Y. 1987. Migration and growth of southern bluefin tuna based on Australiantagging data. Ninth Trilateral Scientific Meeting on Southern Bluefin Tuna, Hobart,Australia.
Ishizukua, Y. and S. Tsuji. 1991. Assessment of the southern bluefin tuna stock. TenthScientific Meeting on Southern Bluefin Tuna SBFWS/91/8.
Klaer, N. and G.P. Kirkwood. 1990. Future projections of southern bluefin tunabiomass incorporating stochastic variation in the stock-recruitment relationship. NinthScientific Meeting on Southern Bluefin Tuna SBFWS/90/7.
Klaer, N., T. Polacheck and K. Sainsbury. 1991. Future projections of southern bluefintuna biomass incorporating stochastic variation in the stock-recruitment relationship.Tenth Scientific Meeting on Southern Bluefin Tuna SBFWS/91/7.
Kirkwood, G.P. 1983. Estimation of von Bertalanffy growth curve parameters usingboth length-increment and length-at-age data. Can.J.Fish.Aquat.Sci., 40:1405-11.
Majkowski, J., W.S. Hearn, and R.L. Sandland. 1988. A tag-release/recovery methodfor predicting the effect of changing the catch of one component of a fishery upon theremaining components. Can.J.Fish.Aquat.Sci., 45:675-84.
Majkowski, J, and G. Morris (editors). 1986. Data on southern bluefin tuna (Thunnusmaccoyii (Castlenau)). Rep.CSIRO Mar.Lab., 179: 95 p.
Majkowski, J.K. Williams, and G.I. Murphy. 1981. Research identifies changingpatterns in Australian tuna fishery. Aust.Fish., 40(2):5-10.
Murray, T. and D. Burgess. 1991. Trends in southern bluefin tuna fisheries operating inNew Zealand waters, 1980-1990. Tenth Scientific Meeting on Southern Bluefin TunaSBFWS/91/3.
Murphy, G.1. 1977. New understanding of southern bluefin tuna. Aust.Fish., 36(1):2-6.
298
Polacheck,T. and N. Klaer. 1991. Assessment of the status of the southern bluefin tunastock using virtual population analysis - 1991. Tenth Scientific Meeting on SouthernBluefin Tuna SBFWS/91/6.
Sainsbury, K., T. Polacheck, and N. Klaer. 1991. Interpretation of recent changes inthe longline catch rate of 4+ southern bluefin tuna. Tenth Scientific Meeting on SouthernBluefin Tuna SBFWS/91/4.
Shingu, C. 1978. Ecology and stock of southern bluefin tuna. Fish.StudyJap.Assoc.Fish.Resources Protection, No. 31. [English translation available by M.A.Hintze as Rep. CSIRO Div . Fish. Ocean° gr , ( 1981), 131:79 p.]
Sibert, J.R. 1984. A two-fishery tag attrition model for the analysis of mortality,recruitment and fishery interaction. Tech.Rep.Tuna Billfish Assess.Programme,S.Pac.Comm., (13):27 p.
Smith, P.J., A. Jamieson and A.J. Birley. 1990. Electrophoretic studies and the stockconcept in marine teleosts. J.Cons.CIEM, 47:231-41.

300
INTERACTIONS BETWEEN FISHERIES FOR SMALL TUNASOFF THE SOUTH CHINA SEA COAST OF THAILAND A MALAYSIA
Mitsuo YesakiIndo-Pacific Tuna Development and Management Programme
Colombo, Sri Lanka
ABSTRACT
Data of small tunas caught by Thai and Malaysian pelagic fisheries in the SouthChina Sea are examined for possible interactions between and among fisheries. Thereport provides brief descriptions of the several fisheries and changes in speciescomposition. Although direct evidence, e.g., tagging data are not available, the markedlyincreased exploitation of small tunas by the Thai purse-seine fishery since the early1980s, accompanied by declines in catches of small tunas by the Thai gillnet fishery andthe Malaysian troll, gillnet, and purse-seine fisheries during the same period, suggestspossible interactions.
. INTRODUCTION
Landings of small tunas from the South China Sea coast of Thailand and Malaysiaincreased from about 7,000 mt in 1970 to 141,000 mt in 1989, with much of this increaseoccurring since 1982. The species comprising this group are the longtail tuna (Thunnustonggol), kawakawa (Euthynnus affinis) and frigate tuna (Auxis thazard). Longtail tuna isthe most abundant and largest of these three species in this area.
2. FISHERIES
The rapid increase in landings of small tunas was primarily a result from thedevelopment of the Thai tuna purse-seine fishery, but also of increased landings by thetraditional fisheries of Thailand and Malaysia. These include fisheries that aimspecifically for small tunas as well as fisheries that capture small tunas only incidentallywhile fishing for other species. The objective of this analysis is to examine availableinformation in order to determine interactions between these fisheries.
2.1 Thailand
Small tunas were captured only incidentally in the drift gillnet and purse seinefisheries prior to the eighties. The gillnet fishery traditionally focused on narrow-barredSpanish mackerel (Scomberomorus commerson) and the purse-seine fisheries sought avariety of small pelagic species. In the late seventies, a processing plant in Bangkokstarted canning small tunas for export, thereby creating a ready market for these species.To meet this demand, the gillnet fishery started seeking small tunas in the Gulf ofThailand in about 1981, followed about a year later by the purse-seine fisheries. Thegillnets used for small tunas are virtually the same as those for narrow-barred Spanishmackerel, and have essentially not changed since the introduction of nylon webbing,except that the length has increased with adoption of mechanical haulers.
FAO LIBRARY AN: 346141
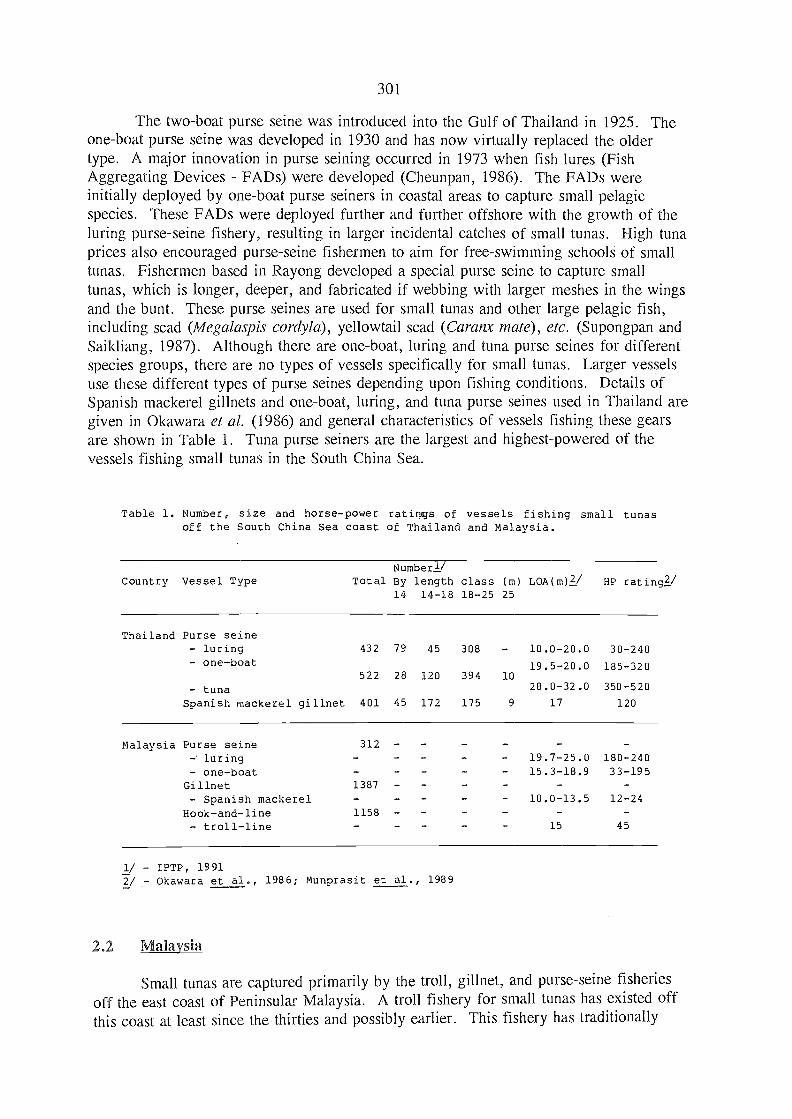
301
The two-boat purse seine was introduced into the Gulf of Thailand in 1925. Theone-boat purse seine was develope,d in 1930 and has now virtually replaced the oldertype. A major innovation in purse seining occurred in 1973 when fish lures (FishAggregating Devices - FADs) were developed (Cheunpan, 1986). The FADs wereinitially deployed by one-boat purse seiners in coastal areas to capture small pelagicspecies. These FADs were deployed further and further offshore with the growth of theluring purse-seine fishery, resulting in larger incidental catches of small tunas. High tunaprices also encouraged purse-seine fishermen to aim for free-swimming schools of smalltunas. Fishermen based in Rayong developed a special purse seine to capture smalltunas, which is longer, deeper, and fabricated if webbing with larger meshes in the wingsand the bunt. These purse seines are use,c1 for small tunas and other large pelagic fish,including scad (Megalaspis cordyla), yellowtail scad (Caranx mate), etc. (Supongpan andSaikliang, 1987). Although there are one-boat, luring and tuna purse seines for differentspecies groups, there are no types of vessels specifically for small tunas. Larger vesselsuse these different types of purse seines depending upon fishing conditions. Details ofSpanish mackerel gillnets and one-boat, luring, and tuna purse seines used in Thailand aregiven in Okawara et al. (1986) and general characteristics of vessels fishing these gearsare shown in Table 1. Tuna purse seiners are the largest and highest-powered of thevessels fishing small tunas in the South China Sea.
Table 1. Number, size and horse-power ratings of vessels fishing small tunas
1/ - IPTP, 19912/ - Okawara et al., 1986; Munprasit et al., 1989
2.2 Malaysia
Small tunas are captured primarily by the troll, gillnet, and purse-seine fisheriesoff the east coast of Peninsular Malaysia. A troll fishery for small tunas has existed offthis coast at least since the thirties and possibly earlier. This fishery has traditionally
off the South China Sea coast of Thailand and Malaysia.
Country Vessel TypeNumberl/
Total By length class (m) LOA(m)2/14 14-18 18-25 25
HP rating2/
Thailand Purse seine- luring 432 79 45 308 10.0-20.0 30-240- one-boat 19.5-20.0 185-320
522 28 120 394 10
- tuna 28.0-32.0 350-520
Spanish mackerel gillnet 401 45 172 175 9 17 120
Malaysia Purse seine 312 - - - -
- luring - - 19.7-25.0 180-240
- one-boat - 15.3-18.9 33-195Gillnet 1387 - - -
- Spanish mackerel - - - 10.0-13.5 12-24
Hook-and-line 1158 - - - - -
- troll-line - - - 15 45

302
aimed at small tunas for local fresh markets and katsuobushi factories. Small tunas arecaptured incidentally by the gillnet fishery and one-boat and luring purse-seine fisheries.Details of troll lines, gillnets, and purse seines used off the. east coast of PeninsularMalaysia are given in Munprasit et al. (1989). Spanish mackerel gillnetters and tunatrollers are the smallest and lowest-powered of the vessels fishing small tunas in the SouthChina Sea (Table 1).
There are at present two fisheries in the South China Sea that aim for small tunas;Thai tuna purse seine and Malaysian troll fisheries. The Thai gillnet, one-boat, andluring purse seine and the Malaysian gillnet, one-boat, and luring purse-seine fisheriescapture small tunas only incidentally while fishing for other species.
3, DATA CI IRENTLY AVAILABLE WHICH ARE RELEVANT TO STUDIESOF INTERACTIONS
3.1 Sources of Data
3.1.1 Thailand
Four sources of information were utilized in reconstructing the small tuna fisheriesof Thailand. The first source was the catch statistics compiled by the Statistics Divisionof the Department of Fisheries (IPTP, 1991). The second was the catch and effortstatistics collected by the Statistics Division from logbooks completed for selected vessels(IPTP database). Catch and effort of small tunas (not separated by species) are availablefrom 1972 for drift gillnetters and from 1973 for purse seiners. Catches have be,enseparated into longtail and other tunas (kawakawa and frigate) since 1982. This is thelongest time-series of catch and effort statistics available. Unfortunately, these statisticsdo not provide good indices of the relative abundance of small tunas because in the caseof the gillnet fishery different species and/or species groups were sought during this timeinterval and the different types of purse seines have been grouped together in .the case ofthis fishery. The third source of information was the tuna sampling programme initiatedin May 1987 by the Marine Fisheries Department with assistance from the Indo-PacificTuna Development and Management Programme (IPTP). Data collected from May 1987to December 1989 have been published in "Tuna sampling programme in Thailand"(IPTP, 1990b). The fourth source was a collection of papers on small tunas published bythe Marine Fisheries Department by Klinmuang (1978; 1981) and Supongpan andSaikliang (1987).
3.1.2 Malaysia
Catch statistics of small tunas from 1977 to 1983 were obtained from the FisheryStatistical Bulletin (SEAFDEC, 1979; 1980; 1981; 1982; 1983; 1984; 1985) andthere,after from the Statistics Division, Department of Fisheries (1PTP database). Thesecond source of information for Malaysia was the tuna sampling programme initiated bythe Marine Fisheries Resources Rese,arch Center, Terengganu in 1982. This programmewas continued through 1986; unfortunately, some data collected during this programmehave been lost. Catch and effort statistics are available from 1982 through 1985 andlength-frequency distributions for some months of 1983, 1985, and 1986 in the 1PTPdatabase. A more intensive tuna sampling programme initiated by the Center in January
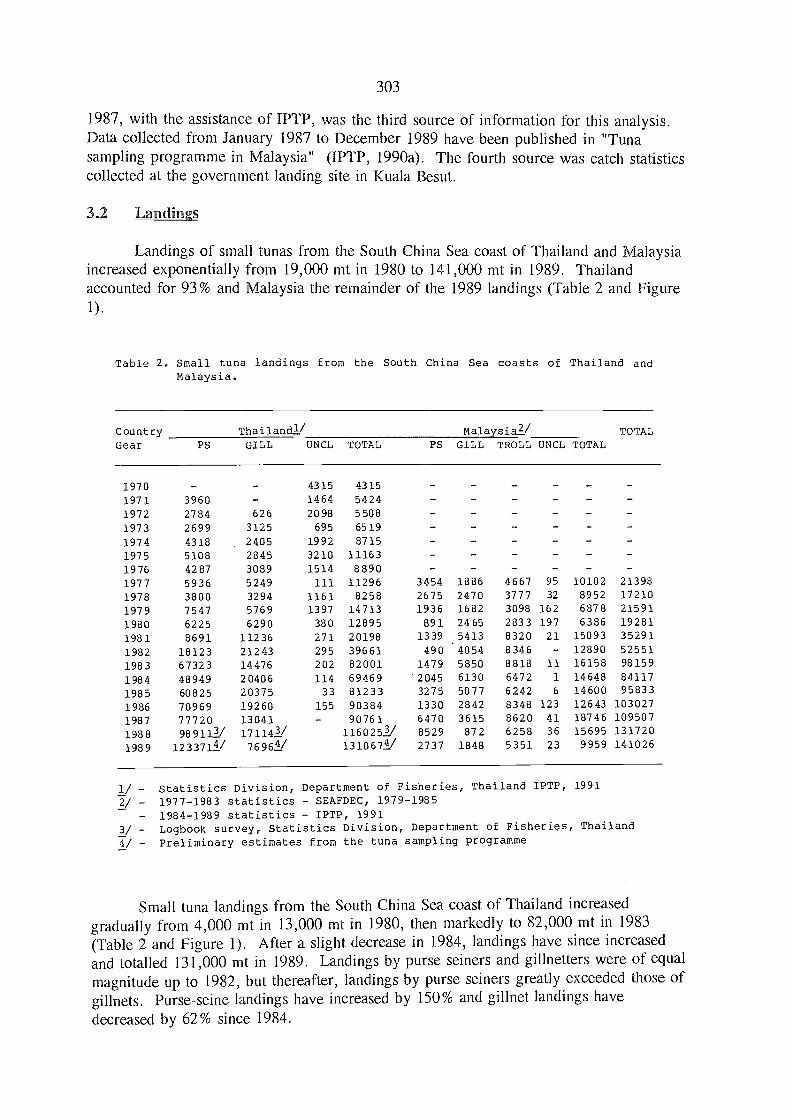
1987, with the assistance of IPTP, was the third source of information for this analysis.Data collected from January 1987 to December 1989 have been published in "Tunasampling programme in Malaysia" (IPTP, 1990a). The fourth source was catch statisticscollected at the government landing site in Kuala Besut.
3.2 Landings
Landings of small tunas from the South China Sea coast of Thailand and Malaysiaincreased exponentially from 19,000 mt in 1980 to 141,000 mt in 1989. Thailandaccounted for 93% and Malaysia the remainder of the 1989 landings (Table 2 and Figure1).
Table 2. Small tuna landings from the South China Sea coasts of Thailand andMalaysia.
1/ - Statistics Division,- 1977-1983 statistics
1984-1989 statistics3/ - Logbook survey, Stati
71:"/ - Preliminary estimates
303
Department of Fisheries, Thailand IPTP, 1991SEAFDEC, 1979-1985IPTP, 1991
stics Division, Department of Fisheries, Thailandfrom the tuna sampling programme
Small tuna landings from the South China Sea coast of Thailand increasedgradually from 4,000 mt in 13,000 mt in 1980, then markedly to 82,000 mt in 1983(Table 2 and Figure 1). After a slight decrease in 1984, landings have since increasedand totalled 131,000 mt in 1989. Landings by purse seiners and gillnetters were of equal
magnitude up to 1982, but thereafter, landings by purse seiners greatly exceeded those of
gillnets. Purse-seine landings have increased by 150% and gillnet landings havedecreased by 62% since 1984.
CountryGear
Thailandl/ Malaysia/ TOTALPS GILL UNCL TOTAL PS GILL TROLL UNCL TOTAL
1970 - 4315 4315 -
1971 3960 - 1464 5424 - -
1972 2784 626 2098 5508 -
1973 2699 3125 695 6519 - - - -
1974 4318 2405 1992 8715 - - - - -
1975 5108 2845 3210 11163 - - - - -
1976 4287 3089 1514 8890 - - - - - -
1977 5936 5249 111 11296 3454 1886 4667 95 10102 21398
1978 3800 3294 1161 8258 2675 2470 3777 32 8952 17210
1979 7547 5769 1397 14713 1936 1682 3098 162 6878 21591
1980 6225 6290 380 12895 891 2465 2833 197 6386 19281
1981 8691 11236 271 20198 1339 5413 8320 21 15093 35291
1982 18123 21243 295 39661 490 4054 8346 - 12890 52551
1983 67323 14476 202 82001 1479 5850 8818 11 16158 98159
1984 48949 20406 114 69469 2045 6130 6472 1 14648 84117
1985 60825 20375 33 81233 3275 5077 6242 6 14600 95833
1986 70969 19260 155 90384 1330 2842 8348 123 12643 103027
1987 77720 13041 - 90761 6470 3615 8620 41 18746 109507
1988 989112/ 171143/ 1160253/ 8529 872 6258 36 15695 131720
1989 1233714/ 76964/ 1310674/ 2737 1848 5351 23 9959 141026
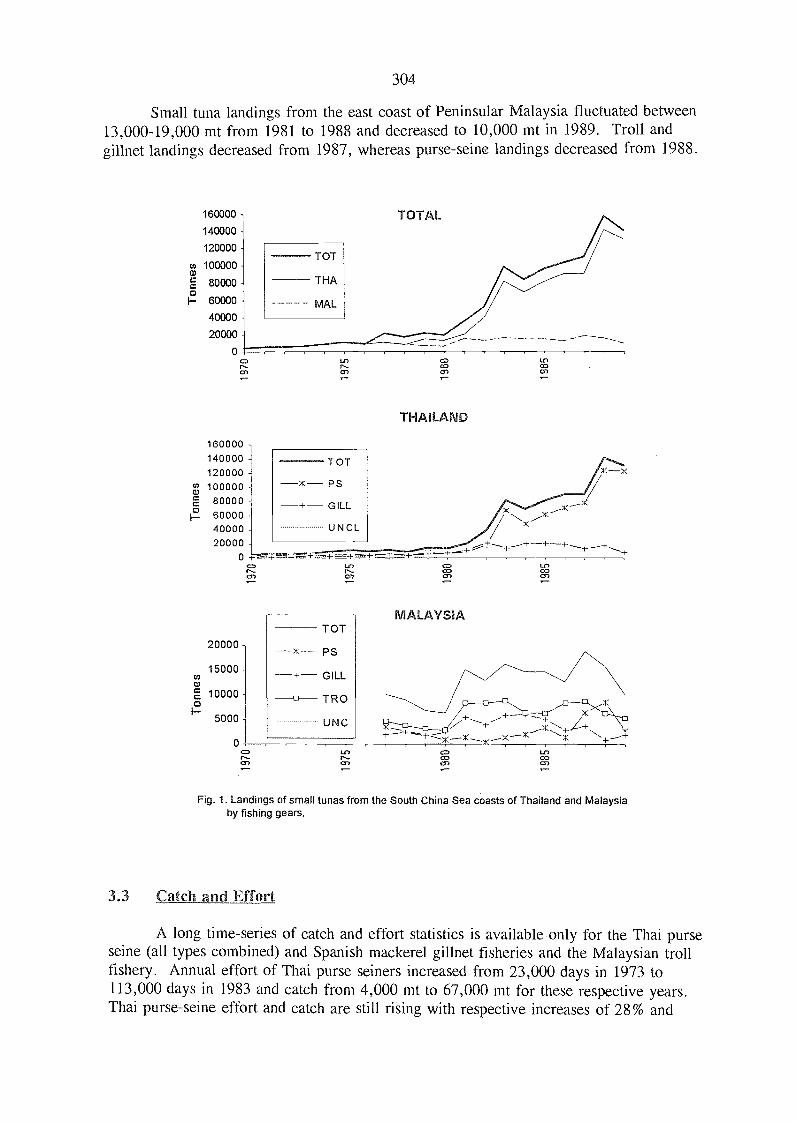
Small tuna landings from the east coast of Peninsular Malaysia fluctuate,d between13,000-19,000 mt from 1981 to 1988 and decreased to 10,000 mt in 1989. Troll andgillnet landings decreased from 1987, whereas purse-seine landings decreased from 1988.
160000
140000
120000
co 100000
80000
I 6000040000
20000
O
0-)
o
TOT
THA
MAL
304
ococs)
THAILAND
MALAYSIA
LOCOal
ca LC)CO CO0, 0")
Fig. 1. Landings of small tunas from the South China Sea coasts of Thailand and Malaysiaby fishing gears.
3.3 Catch and Effort
A long time-series of catch and effort statistics is available only for the Thai purseseine (all types combined) and Spanish mackerel gillnet fisheries and the Malaysian trollfishery. Annual effort of Thai purse seiners increased from 23,000 days in 1973 to113,000 clays in 1983 and catch from 4,000 mt to 67,000 mt for these respective years.Thai purse-seine effort and catch are still rising with respective increases of 28% and
o")
TOT20000 p s
15000GILL
a)
g 10000 T R 0
5000 U N C
r-- co
160000140000120000
co 10000080000600004000020000
o
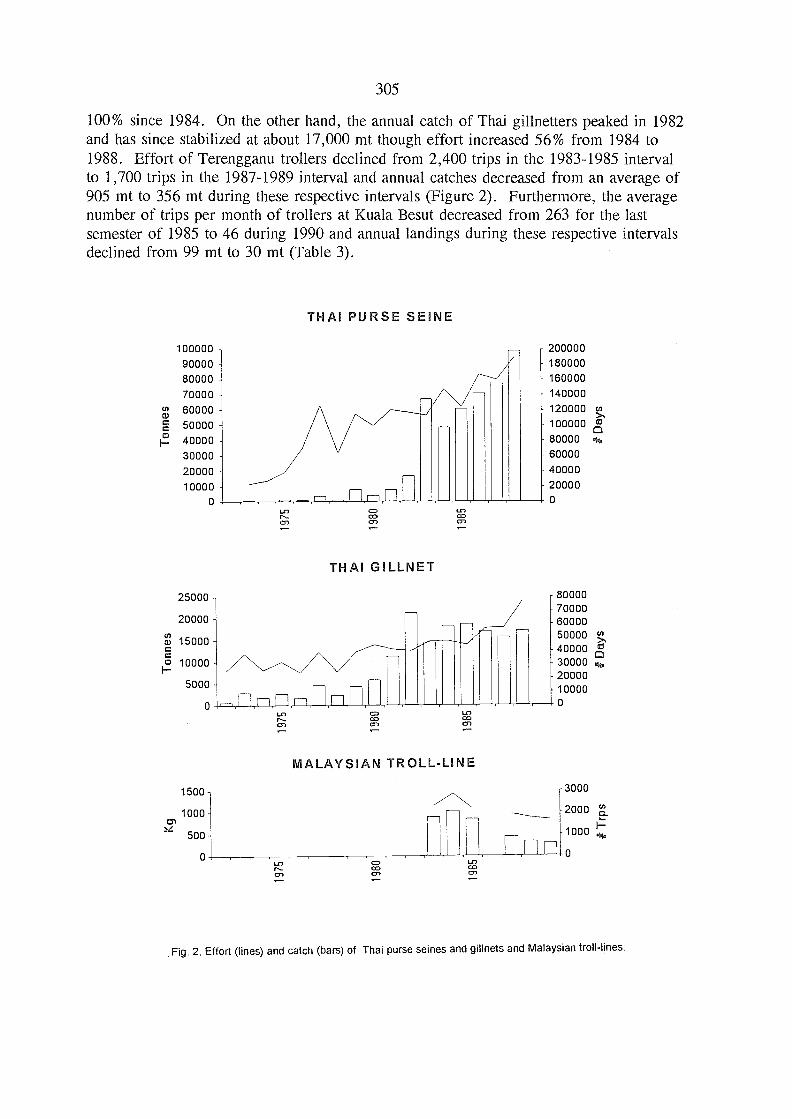
100% since 1984. On the other hand, the annual catch of Thai gillnetters peaked in 1982and has since stabilized at about 17,000 mt though effort increased 56% from 1984 to1988. Effort of Terengganu trollers declined from 2,400 trips in the 1983-1985 intervalto 1,700 trips in the 1987-1989 interval and annual catches decreased from an average of905 mt to 356 mt during these respective intervals (Figure 2). Furthermore, the averagenumber of trips per month of trollers at Kuala Besut decreased from 263 for the lastsemester of 1985 to 46 during 1990 and annual landings during these respective intervalsdeclined from 99 rnt to 30 mt (Table 3).
THAI PURSE SEINE
10000090000800007000060000
a)c 50000
FE 40000300002000010000
o
25000 -
20000 -cr)a) 15000 -co 10000-
5000
o
1500 -
1000-
500 -
o
LO
CS,
LO
f-0-1
THAI GILLNET
c:,cocs,
305
LOCO01
MALAYSIAN TROLL-LINE
LOco
200000- 180000- 160000
140000120000 cl)
10000080000600004000020000o
800007000060000
- 5000040000 co
30000 .1,- 20000
10000o
3000
2000
1000
n 0
Fig. 2. Effort (lines) and catch (bars) of Thai purse seines and gillnets and Malaysian troll-lines.
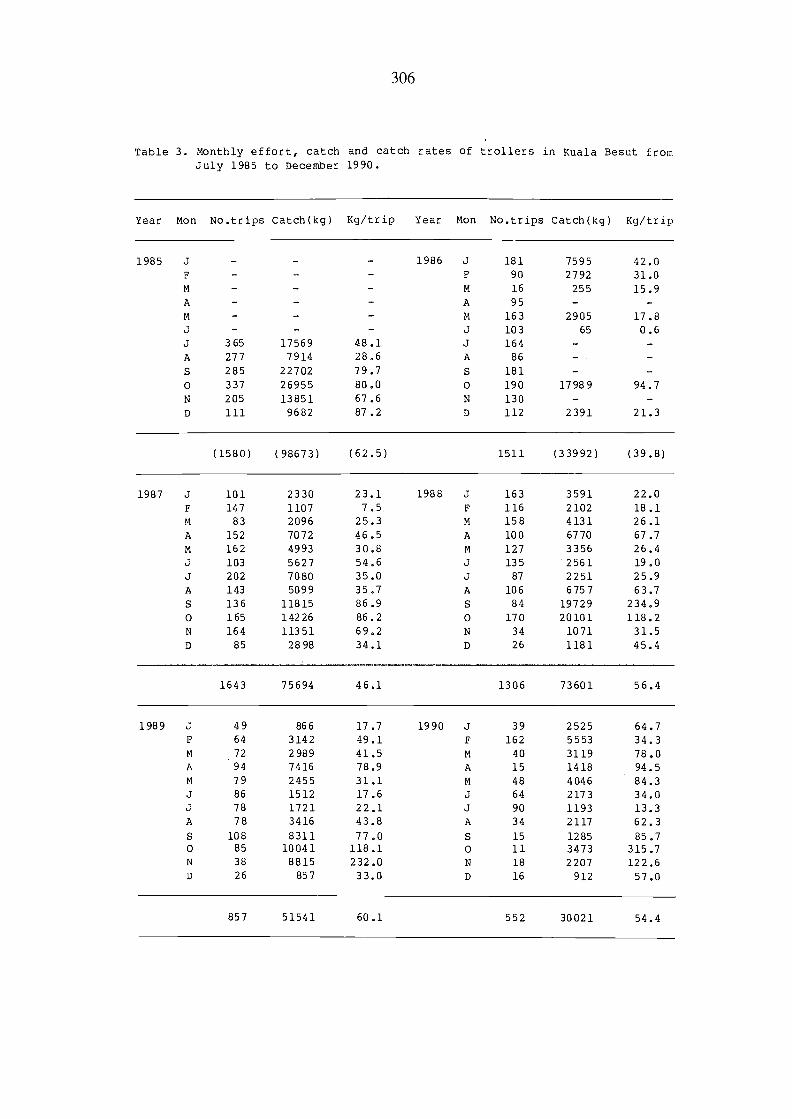
306
catch and catch rates of trollers in BesutKualaTable 3. Monthly effort, fromJuly 1985 to December 1990.
Year Mon No.trips Catch(kg) Kg/trip Year Mon No.trips Catch(kg) Kg/trip
1985 J - 1986 J 181 7595 42.0
F - F 90 2792 31.0
M - - M 16 255 15.9A A 95 - -
M - - M 163 2905 17.8J - - - J 103 65 0.6J 365 17569 48.1 J 164 - -
A 277 7914 28.6 A 86
S 285 22702 79.7 S 181 - -
0 337 26955 80.0 0 190 17989 94.7
N 205 13851 67.6 N 130 - -
D 111 9682 87.2 D 112 2391 21.3
(1580) (98673) (62.5) 1511 (33992) (39.8)
1987 J 101 2330 23.1 1988 J 163 3591 22.0
F 147 1107 7.5 F 116 2102 18.1M 83 2096 25.3 M 158 4131 26.1
A 152 7072 46.5 A 100 6770 67.7
M 162 4993 30.8 M 127 3356 26.4
J 103 5627 54.6 J 135 2561 19.0
J 202 7080 35.0 J 87 2251 25.9
A 143 5099 35.7 A 106 6757 63.7
S 136 11815 86.9 S 84 19729 234.9
0 165 14226 86.2 0 170 20101 118.2
N 164 11351 69.2 N 34 1071 31.5
D 85 2898 34.1 D 26 1181 45.4
1643 75694 46.1 1306 73601 56.4
1989 J 49 866 17.7 1990 J 39 2525 64.7F 64 3142 49.1 F 162 5553 34.3M 72 2989 41.5 M 40 3119 78.0A 94 7416 78.9 A 15 1418 94.5M 79 2455 31.1 M 48 4046 84.3J 86 1512 17.6 J 64 2173 34.0J 78 1721 22.1 J 90 1193 13.3A 78 3416 43.8 A 34 2117 62.3
S 108 8311 77.0 S 15 1285 85.70 85 10041 118.1 0 11 3473 315.7N 38 8815 232.0 N 18 2207 122.6D 26 857 33.0 D 16 912 57.0
857 51541 60.1 552 30021 54.4
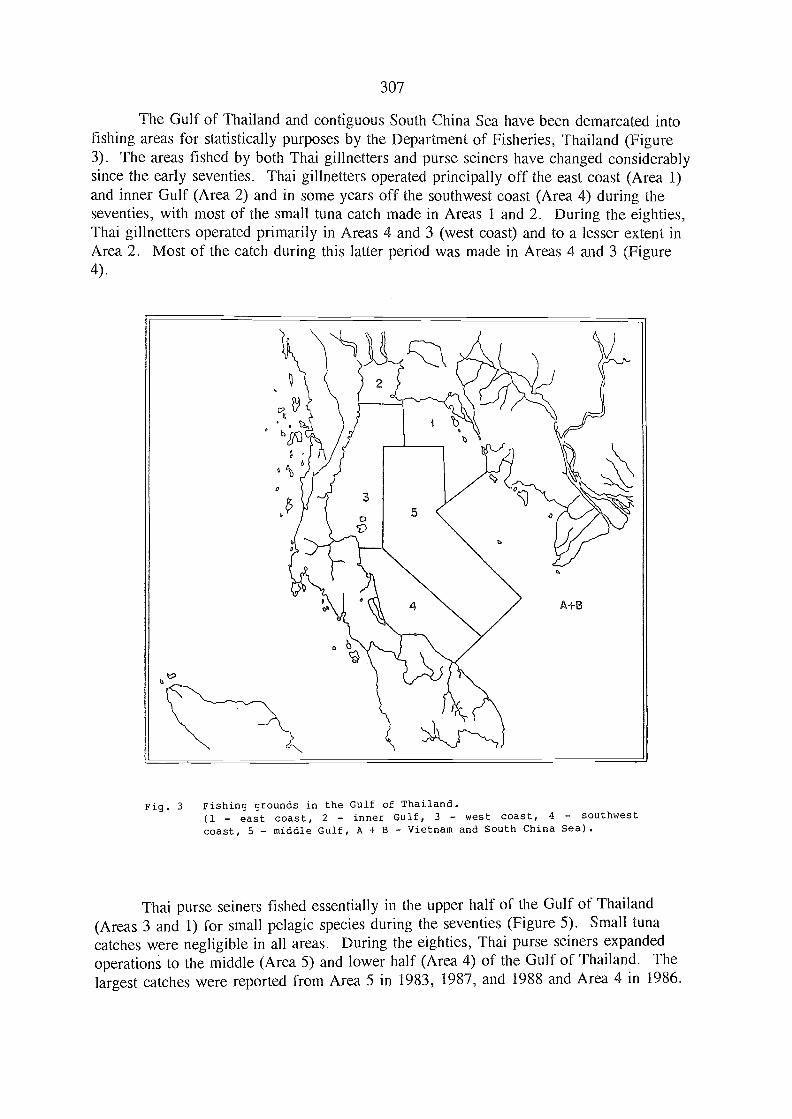
307
The Gulf of Thailand and contiguous South China Sea have be,en demarcated intofishing areas for statistically purposes by the Department of Fisheries, Thailand (Figure
The areas fished by both Thai gillnetters and purse seiners have changed considerablysince the early seventies. Thai gillnetters operated principally off the east coast (Area 1)and inner Gulf (Area 2) and in some years off the southwest coast (Area 4) during theseventies, with most of the small tuna catch made in Areas 1 and 2. During the eighties,Thai gillnetters operated primarily in Areas 4 and 3 (west coast) and to a lesser extent inArea 2. Most of the catch during this latter period was made in Areas 4 and 3 (Figure
Fig. 3 Fishing grounds in the Gulf of Thailand.
(1 - east coast, 2 - inner Gulf, 3 - west coast, 4 - southwest
coast, 5 - middle Gulf, A + B - Vietnam and South China Sea).
Thai purse seiners fished essentially in the upper half of the Gulf of Thailand(Areas 3 and 1) for small pelagic species during the seventies (Figure 5). Small tunacatches were negligible in all areas. During the eighties, Thai purse seiners expandedoperations to the middle (Area. 5) and lower half (Area 4) of the Gulf of Thailand. Thelargest catches were reported from Area 5 in 1983, 1987, and 1988 and Area 4 in 1986.
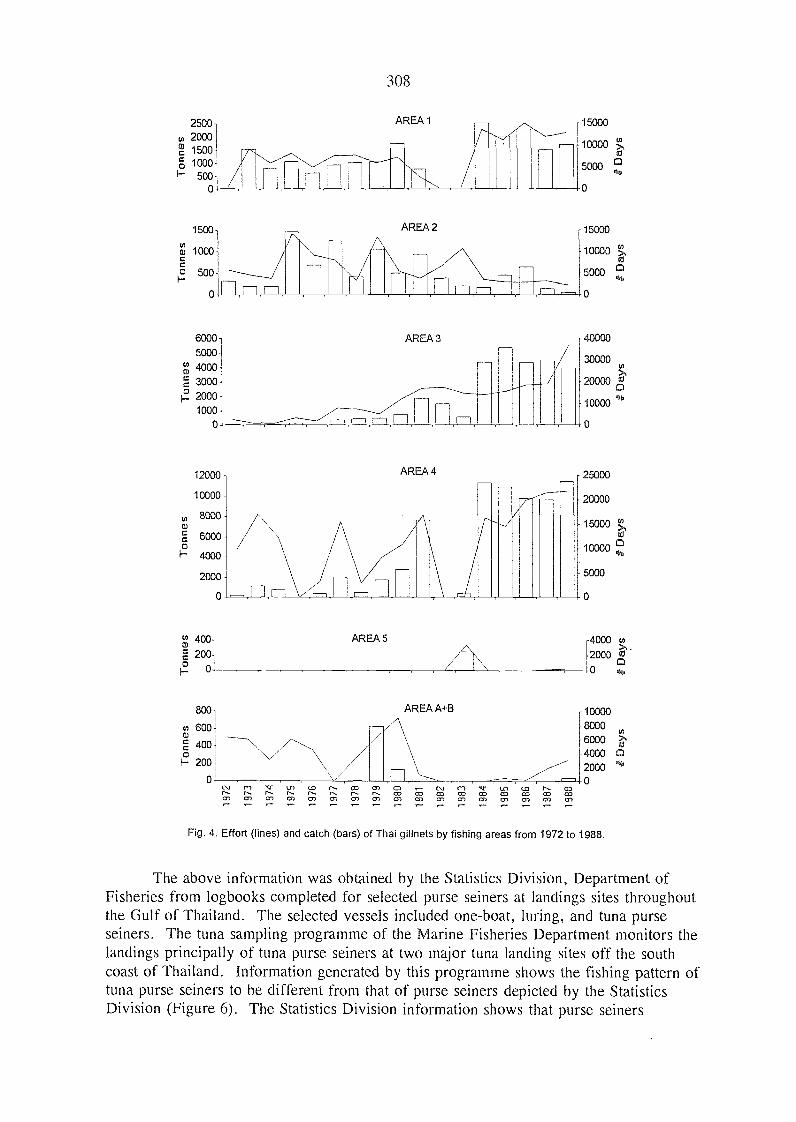
250020001500
rf, 1000
5C0
1500
(al 1000
500
6000 -
5000 -
',7y) 4000 -
3000 -cu 2000 -
1000 -
CA
o
400-
g 200o
0
800
CA 603cu
4CO-oH 200-
o
AREAS
308
fl
c in a) coI, COCr) CY) co 1:7) co a) COr-- r- r-
AREA 1
AREA 2
AREA 3 -40000
AREA A+B
N (T.) °Z. LO COCO co co CO CO CO coa) co co co co CO co co
15000
15000
-10000 j,
-5000 CI
o
-30000
_20000
-10000
o
10000
8000
60004030
2000
o
Fig. 4. Effort (lines) and catch (bars) of Thai gillnets by fishing areas from 1972 to 1988.
The above information was obtained by the Statistics Division, Department ofFisheries from logbooks completed for selected purse seiners at landings sites throughoutthe Gulf of Thailand. The selected vessels included one-boat, luring, and tuna purseseiners. The tuna sampling programme of the Marine Fisheries Department monitors thelandings principally of tuna purse seiners at two major tuna landing sites off the southcoast of Thailand. Information generated by this programme shows the fishing pattern oftuna purse seiners to be different from that of purse seiners depicted by the StatisticsDivision (Figure 6). The Statistics Division information shows that purse seiners
4000 u).
-2000 o0 44,
o4c.
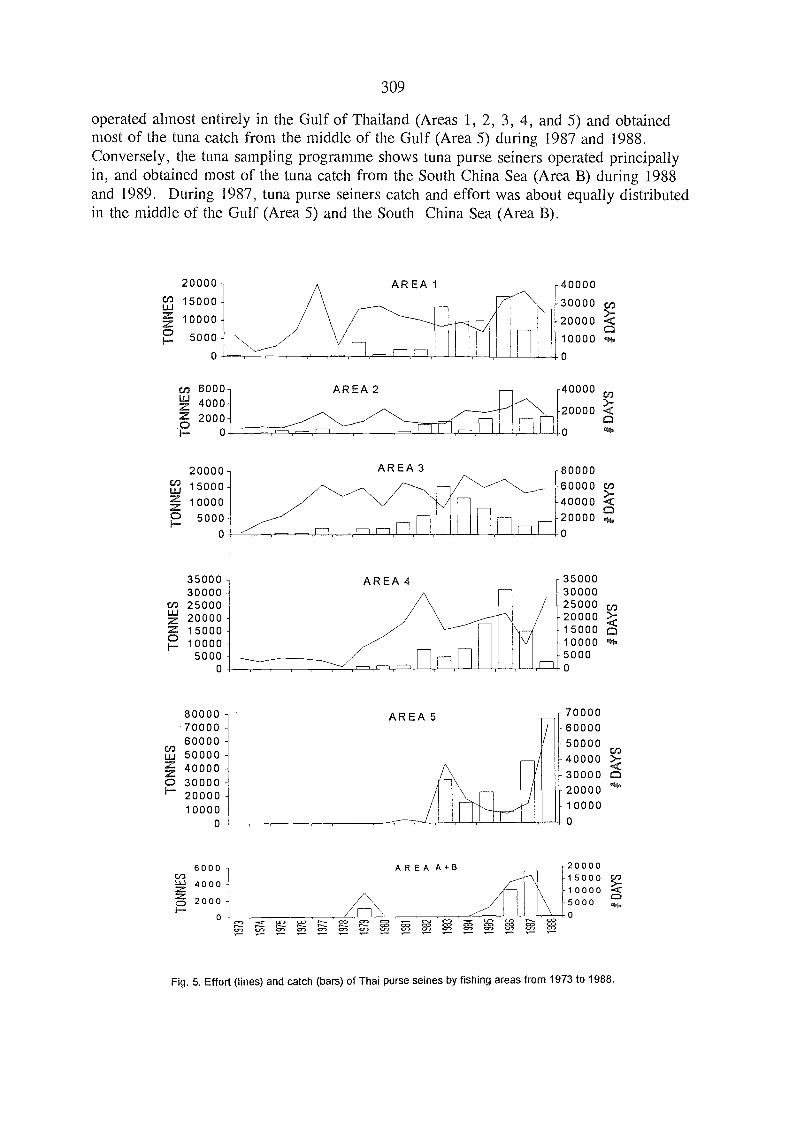
operated almost entirely in the Gulf of Thailand (Area.s 1, 2, 3, 4, and 5) and obtainedmost of the tuna catch from the middle of the Gulf (Area 5) during 1987 and 1988.Conversely, the tuna sampling programme shows tuna purse seiners operated principallyin, and obtained most of the tuna catch from the South China Sea (Area B) during 1988and 1989. During 1987, tuna purse seiners catch and effort was about e,qually distributedin the middle of the Gulf (Area 5) and the South China Sea (Area B).
20000
15000
zZ 10000° 5000
o
cr) 6000-wz 4000-Z 2000-0I o
20000 -E3 15000 -zZ 10000 -0 5000 -
oI-
3500030000
cn 25000z 20000Z 15000
100005000
o
80000 -70000 -60000 -
cnuj 50000 -Zz 400000 30000 -
20000 -10000 -
o
6000 -CrJ
4000 -Zc, 2000 -I-
309
AREA 2
AREA 3
AREA 4
40000
30000 cf)>-20000 <
10000o
40000>-20000 <
o
[80000160000 co40000 <
-20000O
3500030000250002000015000100005000o
700006000050000
co40000 >-30000 o2000010000o
2000015000100005000o
>-
Fig. 5. Effort (lines) and catch (bars) of Thai purse seines by fishing areas from 1973 to 1988.
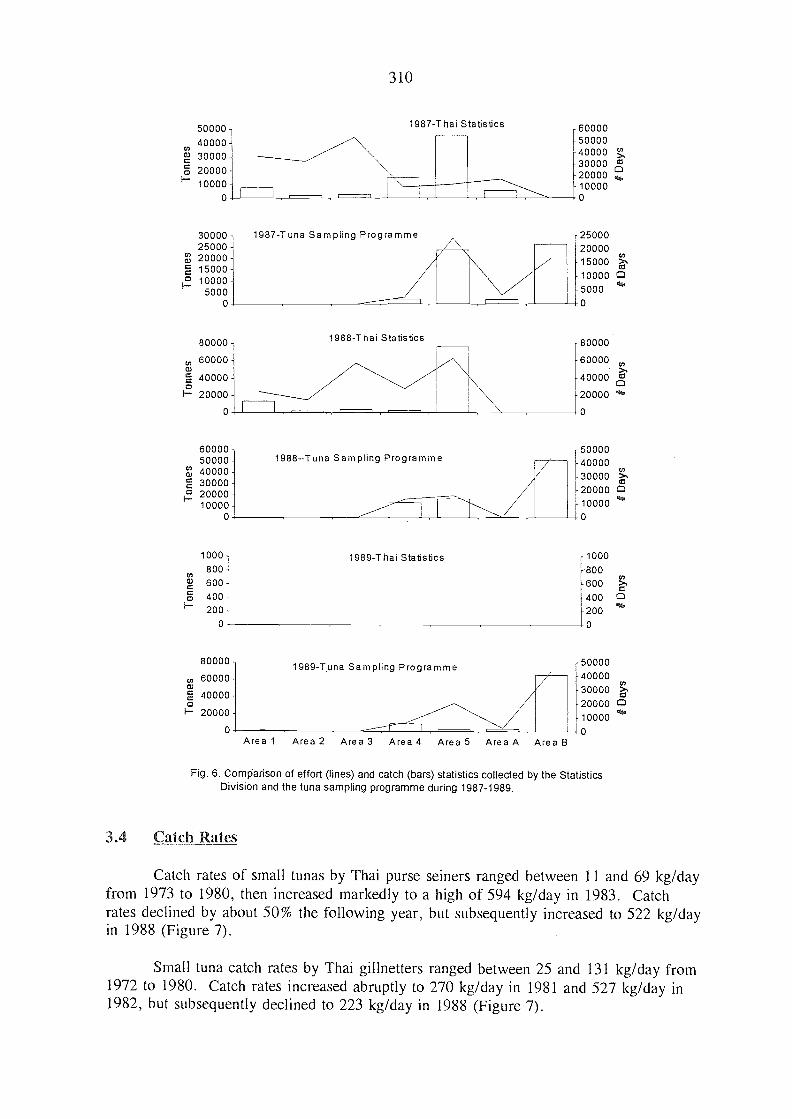
50000 -40000 -
.430000 -20000-
F10000-0
30000 -25000
-0,120000-g 15000-
10000-F-5000 -
o
80000 -
c, 60000 -co
g 40000-o
I 20000 -0
60000 -50000 -
`67) 40000-g 30000-
2000010000 -
o
o
80000
60000
g 40000o
20000-
o
310
1987-Tuna Sampling Programme
1988-Thai Statistics
1988--Tuna Sampling Programme
1987-Thai Statistics
1989-Tuna Sampling Programme
60000500004000030000 o20000 4,10000o
250002000015000 >,10000 05000o
80000
60000 cn
40000
20000 *"'
o
5000040000
cn30000 >,20000 010000 *.o
o
5000040000
-30000 >.o20000 010000o
1000 -
cn800 -
cu 600-ccu 400 -
200
1989-Thai Statistics 1000800600400
-2000
Area 1 Area 2 Area 3 Area 4 Area 5 Area A Area B
Fig. 6. ComParison of effort (lines) and catch (bars) statistics collected by the StatisticsDivision and the tuna sampling programme during 1987-1989.
3.4 Catch Rates
Catch rates of small tunas by Thai purse seiners ranged betwe,en 11 and 69 kg/dayfrom 1973 to 1980, then increased markedly to a high of 594 kg/day in 1983. Catchrates declined by about 50% the following year, but subsequently increase,d to 522 kg/dayin 1988 (Figure 7).
Small tuna catch rates by Thai gillnetters ranged between 25 and 131 kg/day from1972 to 1980. Catch rates increased abruptly to 270 kg/day in 1981 and 527 kg/day in1982, but subsequently declined to 223 kg/day in 1988 (Figure 7).
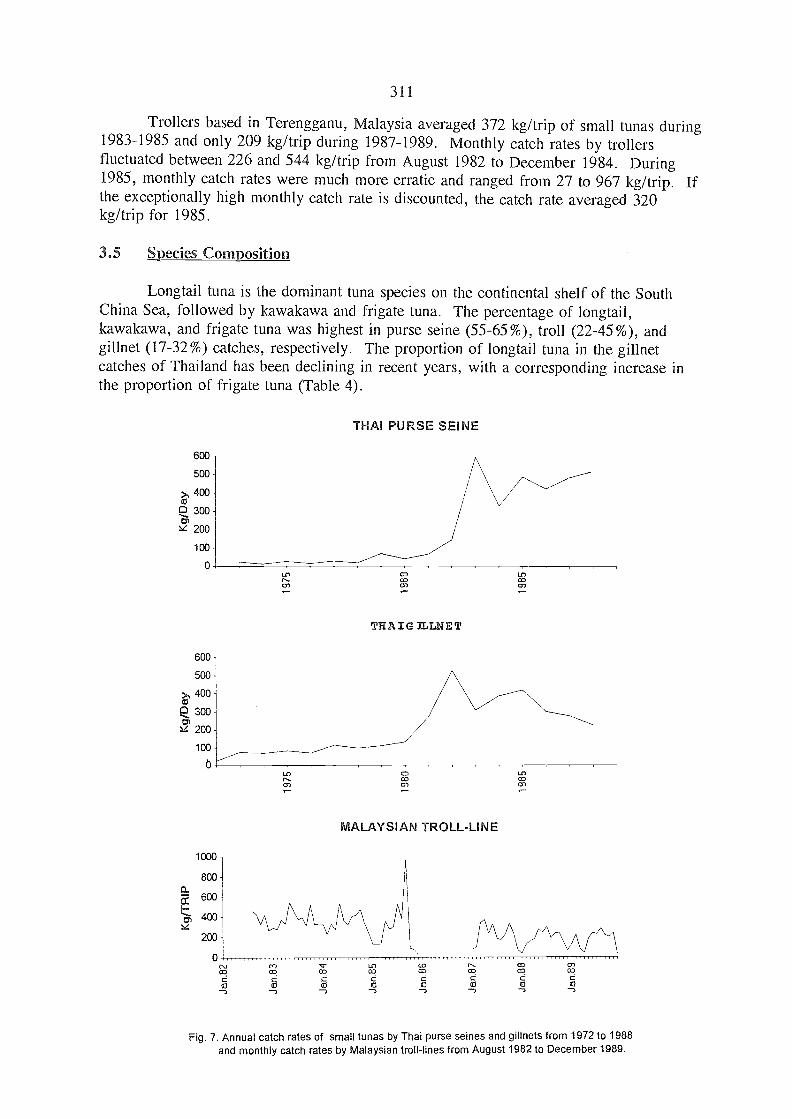
Trollers based in Terengganu, Malaysia averaged 372 kg/trip of small tunas during1983-1985 and only 209 kg/trip during 1987-1989. Monthly catch rates by trollersfluctuate(' between 226 and 544 kg/trip from August 1982 to December 1984. During1985, monthly catch rates were much more erratic and ranged from 27 to 967 kg/trip. Ifthe exceptionally high monthly catch rate is discounted, the catch rate averaged 320kg/trip for 1985.
3.5 Species Composition
Longtail tuna is the dominant tuna species on the continental shelf of the SouthChina Sea, followed by kawakawa and frigate tuna. The percentage of longtail,kawakawa, and frigate tuna was highest in purse seine (55-65%), troll (22-45%), andgillnet (17-32%) catches, respectively. The proportion of longtail tuna in the gillnetcatches of Thailand has been declining in recent years, with a corresponding increase inthe proportion of frigate tuna (Table 4).
THAI PURSE SEINE
600
500
>, 400
300
sz 200
100
o
1000
BOO
E 600400
200
o
co
MALAYSIAN TROLL-LINE
311
(1.7 CO coCO co a) co
Fig. 7. Annual catch rates of small tunas by Thai purse seines and gillnets from 1972 to 1988and monthly catch rates by Malaysian troll-lines from August 1982 to December 1989.
LO 0co
127co
CI O),....
07r-
THAIG ILLNET
6C0 -
SOO
>, 403
300
200
100
0LO
CO CO

312
Table 4. Species composition (percent) of small tuna landings by various gears
in the South China Sea.
Country Thailand Malaysia
gear Purse seine Gillnet Troll line
Species LOT KAW FRI LOT KAW FRI LOT KAW FRI
Source - 1/ - Klinmuang, 19812/ - Supongpan and Saikliang, 1987
- May - Nov 1987
3.6 Changes in Size Composition
3.6.1 Longtail tuna
The mean size of longtail tuna in Thai gillnet catches decreased from 43.3 cm in1977 to 38.7 cm in 1989. Furthermore, the number of fish larger than 48 cm accountedfor 31% of the 1977 catch and only 1-2% of the 1987-1989 catches. The mode decreasedfrom 49 cm in 1977 to 43 cm in 1987 and 35 cm in 1988-1989 (Figure 8).
Mean size of longtail tuna in Thai purse seine catches decreased from 42.3 cm in1983 to 38.8 cm in 1989. In 1983, 77% of the fish were larger than 40 cm, whereas in1988-1989 only 51-53% were larger than this size.
Mean size of longtail tuna captured by trollers from Terengganu increased slightlyfrom 1983 to 1987 then decreased by 4 cm in 1989.
3.6.2 Kawakawa
The mean size of kawakawa captured by Thai gillnetters and purse seiners has notchanged appreciably through the ye,ars for which data are available. However, mean sizeof kawakawa captured by Terengganu trollers has declined by 8.8 cm from 1987 to 1989.The number of kawakawa larger than 30 cm captured by the fishery decrease,d from 90%in 1983 to only 28% in 1989 (Figure 9).
3.6.3 Frigate tuna
Mean size of frigate tuna captured by Thai gillnetters and purse seiners has notchanged significantly through the years. However, the mean size of frigate tuna captured
Year 1977 - - - 571/ 261/ 171/ - - -
1983 642/ 262/ 102/ - - - 61 36 3
1984 - - - 74 22 4
1985 60 30 10
1986 - - - - - -
1987 563/ 242/ 202/ - - - 52 45 3
1988 65 16 19 43 28 29 56 42 2
1989 55 22 23 32 36 32 60 39 1
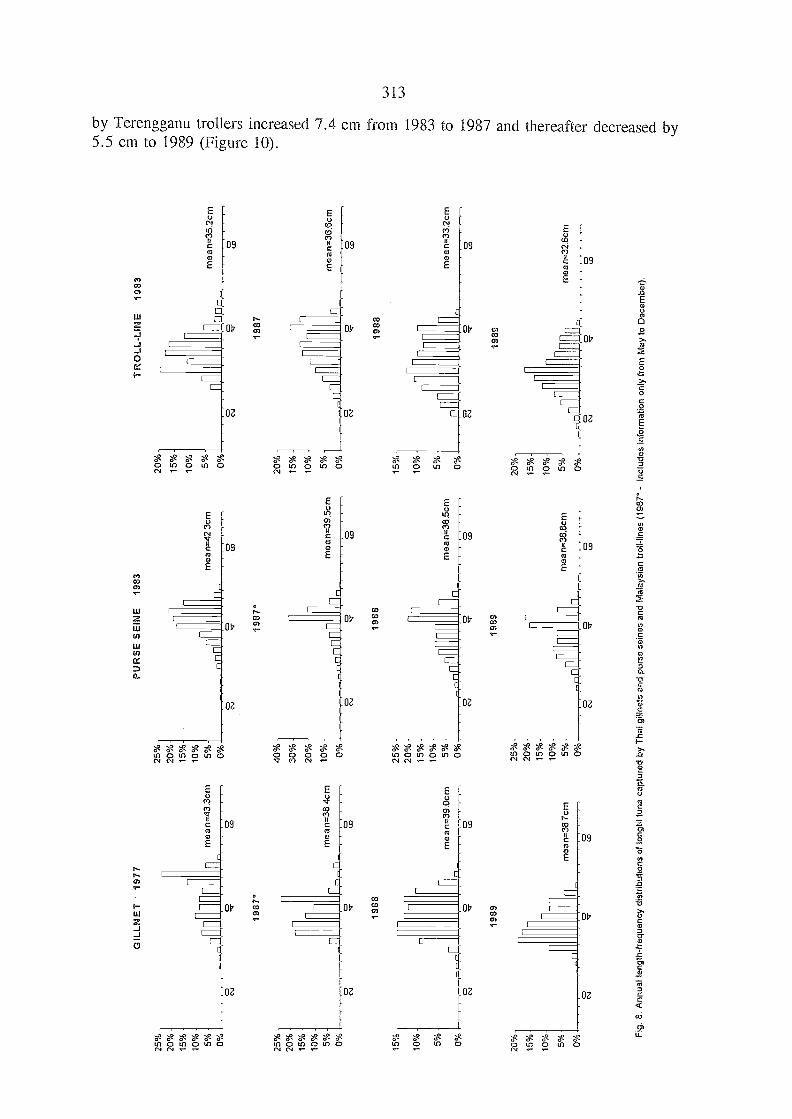
25%
20%
15%
10%
5% 0% 25%
20%
15%
-
10%
5% 0% 15%
10%
5% 0%
20%
15%
10%
5% 0%
r'GIL
LNE
T19
77
me
a n=
43.3
cm
25%
-
20%
-15
%-
10%
-5%
-
VA
,
PU
RS
E
nP
SE
INE
1983
mea
n=
42.3
cm
20%
15%
10%
-
5%-
0%
20%
15%
10% 5% 0%
15%
10%
5% o%
20%
15%
10%
5% 0%
TR
OLL
-LIN
E19
83
mea
n=35
2cm
.C4
CD
E5
A crq
OC
crq
cri"
C)
o CD
CD o o \0 o OC
CD
CD
CD o
1987
*
CM
)
mea
n=38
.4cm
n
40%
30%
20%
10% 0% 25%
20%
15%
10% 5% 0% 25%
20%
15%
10% 5% 0%
npflf
l1987
*
mea
n=39
.5cm
^-,
jifl
1987o
o
mea
n=36
.6cm
1988'T
me
a n=
39.0
cm
1988
LT,
mea
n=38
.5cm
.,
CD Ji
1988
mea
n=33
2cm
o c,
1989
o
mea
n=38
.7cm
.'"^r
1
1989
mea
n=
38.8
cm
,
c-,
1989
oo
mea
n=32
.6cm
o (so
CO
oo
Fig
. 8. A
nnua
l len
gth-
freq
uenc
y di
strib
utio
ns o
f lon
gtil
tuna
cap
ture
d by
Tha
i gill
nets
and
pur
se s
eine
s an
d M
alay
sian
trol
l-lin
es (
1987
* -
incl
udes
info
rmat
ion
only
from
May
to D
ecem
ber)
.a cr
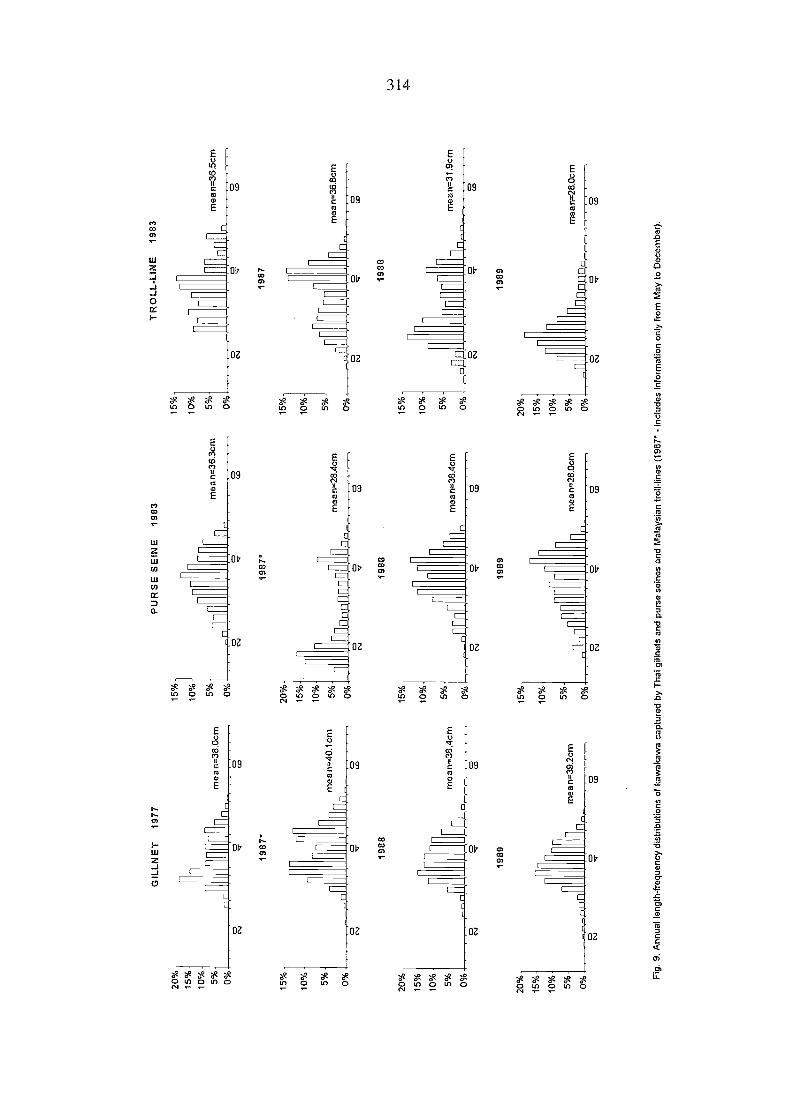
20%
15%
10% 5%
-
GIL
LNE
T19
77
mea
n=38
.0cm
15%
-
10%
-
5%-
PU
RS
E S
EIN
E19
83
mea
n=
36.3
cm
15%
10%
5%
TR
OLL
-LIN
E19
83
mea
n=36
.5cm
0%0%
0%o
o
1987
"19
87'
1987
15%
20%
15%
10%
-15
%-
10%
10%
.5%
-m
ea n
40.1
cm
5%m
ean=
28.4
cm5%
mea
rF36
.8cm
0%T
h0%
0%o C
OS
ro
ro
oo C
O
1988
1988
1988
20%
15%
-15
%
15%
10%
-10
%10
% 5%m
e a
n=38
.4cm
5%m
ean=
38.4
cm5%
mea
n=31
.9cm
0%os
n.0%
r\P
,o
,T3
oo
oC
N.1
41.
CO
1989
1989
1989
20%
15%
20%
15%
10%
15%
10%
10%
5%m
ean=
39.2
cm5%
mea
n-=
28.0
cm5%
mea
rr=
28.0
cm0%
,riP
P0%
0%nf
lT
IP n
no
oC
D
Fig
. 9. A
nnua
l len
gth-
freq
uenc
y di
strib
utio
ns o
f kaw
akaw
a ca
ptur
ed b
y T
hai g
illne
ts a
nd p
urse
sei
nes
and
Mal
aysi
an tr
oll-l
ines
(19
87*
- in
clud
es in
form
atio
n on
ty fr
om M
ay to
Dec
embe
r).
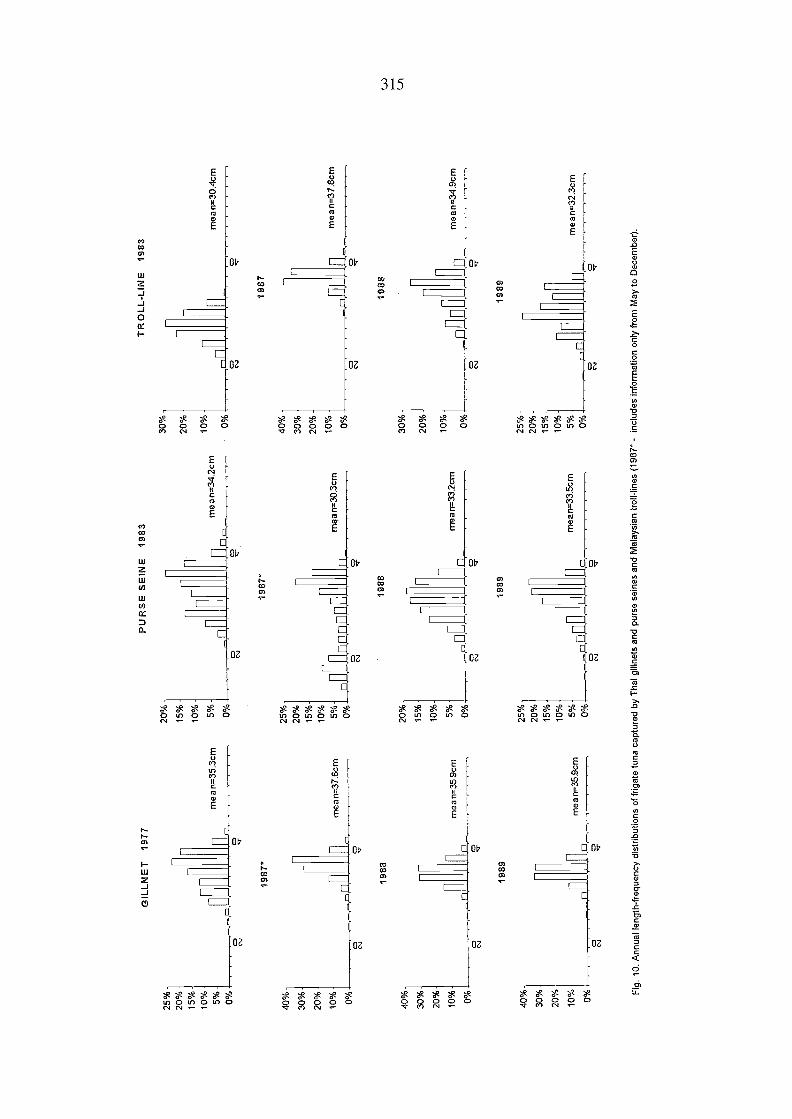
Fig
. 10.
Ann
ual l
engt
h-fr
eque
ncy
dist
ribut
ions
of f
rigat
e tu
na c
aptu
red
by T
hai g
illne
ts a
nd p
urse
sei
nes
and
Mal
aysi
an tr
oll-l
ines
(19
87*
- in
clud
es in
forr
natio
n on
ly fr
om M
ayto
Dec
embe
r).
25%
20%
15%
10%
GIL
LNE
T 1
977
20%
-
15%
-
10%
-
PU
RS
E S
EIN
E 1
983
30%
20%
10%
TR
OLL
-LIN
E19
83
5%m
e a
n=35
.3cm
5% 0%
me
a n=
34.2
cm
0%ni
nm
ean=
30.4
cm
0%r-
6o
1987
*19
87*
1987
40%
25%
40%
30%
20%
30%
20%
15%
10%
20%
10%
mea
n=37
.6cm
5%i-
inn
0%. .
....
maa
n=30
.3cm
10%
0%
mea
n=37
.8cm
0°,6
_o
ocs
,
1988
1988
1988
40%
20%
-30
%
30%
15%
20%
29%
10%
10%
10%
mea
n=3-
5.9c
m5%
mea
rF
332c
mm
ean=
34.9
cm
0%0%
0%o
oo
04
1989
1 98
919
89
40%
25%
25%
30%
-20
%
15%
20%
15%
-20
%-
10%
10%
-
10%
-m
ea n
=35
.9cm
5%m
ean=
33.5
cm5%
mea
n=32
.3cm
0%0%
rrri
0%o
o

316
4, INTERACTIONS BE I WEEN FISHERIES
4.1 Catches and Catch Rates
Of the five basic fisheries exploiting small tunas in the South China Sea offThailand and Malaysia, catches have increased in recent years only in the Thai purse-seine fishery. Catches of small tunas have decreased in the Thai gillnet and theMalaysian troll, gillnet, and purse-seine fisheries. These declines are attributed to loweravailability of small tunas to these fisheries because of increased exploitation by the Thaipurse-seine fishery in recent years. The Thai purse-seine fleet is comprised of the largestvessels of all fleets exploiting small tunas in the South China Sea. This fleet is also thebest equipped, with most tuna purse-seine vessels with satellite navigation systems, radar,and sonar. Because of their size and electronic navigational aids, the Thai tuna purse-seine fleet is able to range farther than other fleets, thereby exploiting small tunas beforethey become available to the other fleets.
The development of the Thai purse-seine fishery for small tunas is postulated tohave evolved as follows, based on information of catch and effort by fishing areas. Thaipurse-seine fishermen started to focus on small tunas in about 1982 off the east coast(Area 1) of the Gulf of Thailand. They soon expanded operations to the west (Area 3)and southwest (Area 4) coasts and middle (Area 5) of the gulf of Thailand and theyprobably confined their operations within the Gulf through 1984. The poor tuna catch ofthat year prompted Thai purse-seine fishermen to expanci their operations into the SouthChina Sea in the following years. This contention is supported by the marked decline inthe number of trips and catches by Kuala Besut trollers during 1986 from that of the lastsemester of 1985. Effort and catches by trollers based in Terengganu have also decreasedsince 1987 from that of the 1983-1985 intervals.
The increases in small tuna catches and catch rates by Thai purse seiners since1984 is a direct result of exploitation of new fishing areas in the South China Sea.Available information indicates that Thai purse seiners are fishing off Malaysia and theNatuna Islands of Indonesia. Thai gillnetters and Malaysian trollers, gillnetters, andpurse seiners operate in more coastal waters off their respective coasts. Small tunacatches have declined for Thai gillnetters since 1986, for Malaysian trollers and gillnetterssince 1987 and Malaysian purse seiners since 1988. In addition, small tuna catch rates ofThai gillnetters and Terengganu trollers have declined appreciably since 1985 and 1987,respectively. The availability of small tunas in coastal waters of Thailand and Malaysiahas been greatly reduced by exploitation of small tunas by Thai purse seiners in offshorewaters.
4.2 Changes in Species Composition
The species composition of the unexploited small tuna stocks of the South ChinaSea is probably 65% longtail tuna, 25% kawakawa, and 10% frigate tuna. Thiscomposition appears to be changing, with the percentage of longtail declining and that offrigate increasing. This change in species composition is attributed to life-historycharacteristics of the species. Longtail tuna is the largest species with longevity ofapproximately five years. This species is essentially neritic in habitat and abundant onlyin areas with broad continental shelves (Yesaki, 1987). Conversely, frigate is the
Size of longtail tuna has decreased in the thre,e fisheries for which there isinformation. On the other hand, sizes of kawakawa and frigate tuna have decreased onlyin the Malaysian troll fishery and not in the Thai purse-seine and gillnet fisheries. Thediminution in size of longtail is again attributed to its life-history characteristics. Thisspecies is the longest-lived of the three tunas considered in this analysis, so would be thefirst to show the effects of exploitation.
The most pronounced changes in size composition have occurred in the Malaysiantroll fishery. Mean size of longtail and frigate increased from 1983 to 1987, whereas thatof kawakawa did not change appreciably. These size increments may have resulted fromtrollers expanding operations to more offshore areas frequented by larger fish. Meansizes of all species have decreased since 1987. A possible explanation for thesediminution may be the use of hooks designed for smaller fish and/or greater effortexpended around FADs to compensate for declining catch rates which started in 1986.Smaller fish were captured around FADs than from free-swimming schools during taggingexperiments conducted during 1990 aboard Terengganu trollers. Annual catch rates forthis fishery decreased from 394 kg/trip in 1983 to 239 kg/trip in 1987 and 182 kg/trip in1989.
5. FUTURE STUDIES
5.1 Work Contemplated
An analysis of the data collected by the tuna sampling programme in Thailand andMalaysia is planned to assess the status of the small tuna stocks of the South China Sea.A detailed examination of these data should provide better information on interactions ofthe various fisheries between and within countries.
5.2 Data Needed
There is an urgent need for the tuna sampling programme for small tunas inThailand and Malaysia to be continue, as four years of data are insufficient to assessadequately the status of stocks. The total landings of small tunas from the South ChinaSea is still increasing, but evidence indicates that some fisheries and some stocks arebeing affected by exploitation. Continued monitoring of the small tuna fisheries of bothcountries is necessary to complete an adequate assessment of the small tuna stocks onwhich to base meaningful management advice.
317
smallest species with longevity of about two years. This species is distribute,d near theouter-continental shelf and contiguous oceanic zone. The longer-lived species would bemost affected by exploitation and would be replaced by a shorter-lived species undercontinued exploitation. Frigate tuna would especially be unaffected by exploitation, inthis instance, because a significant portion of the stock would be in the oceanic zone andnot available to the various fisheries of Thailand and Malaysia. The Thai tuna purse-seine fishery extends the farthest offshore of all these fisheries, but is confined to thecontinental shelf because of the light construction of its nets.
4.3 Cha es in Size Co osition
5.3 Institutions Involved
318
The institutions involved in continuing the tuna sampling programmes would bethe Marine Fisheries Department of Thailand, the Department of Fisheries, Malaysia andIPTP.
5.4 Assistance Required
The IPTP should continue to provide funds and technical assistance to the MarineFisheries Department and the Marine Fisheries Research Center, Department of Fisheries,Malaysia in order to maintain the tuna sampling programme.
6. REFERENCES CITED
Cheunpan, A. 1986. Review of tuna fisheries/resources in the Gulf of Thailand. Paperpresented at the Meeting of Tuna Research Groups in the Southeast Asian Region,Phuket, Thailand, 27-29 August 1986.
IPTP. 1990a. Tuna Sampling Programme in Malaysia. Indo-Pac.Tuna Dev.Mgt.Programme, IPTP/90/MAL/SP:55 p.
IPTP. 1990b. Tuna Sampling Programme in Thailand. Indo-Pac.Tuna Dev.Mgt.Programme, IPTP/90/THA/SP:67 p.
IPTP. 1991. Indian Ocean and Southeast Asian Tuna Fisheries Data Summary for 1989.Data Summ.Indo-Pac.Tuna Dev.Mgt.Programme, 11:96 p.
Klinmuang, H. 1978. Preliminary studies on the biology of tunas in the west of the Gulfof Thailand and off the east coast of Peninsular Malaysia. Pelagic Fish.Rep.Mar.Fish.Div.Dep.Fish., Bangkok, 5:27 p.
Klinmuang, H. 1981. Studies on the size frequency distribution and length-weightrelationship of the tunas in the Gulf of Thailand. Pelagic Fish.Rep.Mar.Fish.Div.Dep.Fish., Bangkok, 24:39 p.
Munprasit, A., Y. Theparoonrat, S. Sae-Ung, S. Soodhom, Y. Matsunaga, B.Chokesanguan, and S. Siriraksophon. 1989. Fishing gear and methods in SoutheastAsia: II. Malaysia Training Dept., Southeast Asian Fish.Dev.Cent., TD/RES/24:338 p.
Okawara, M., A. Munprasit, Y. Theparoonrat, P. Masthawee, and B. Chokesanguan.1986. Fishing gear and methods in Southeast Asia: I. Thailand Training Dept.,Southeast Asian Fish.Dev.Cent., TD/RES/9:329 p.
SEAFDEC. 1979. Fishery Statistical Bulletin for South China Sea Area 1977.Southeast Asian Fish.Dev.Cent., 162 p.
SEAFDEC, 1980. Fishery Statistical Bulletin for South China Sea Area 1978.Southeast Asian Fish.Dev.Cent., 200 p.
319
SEAFDEC. 1981. Fishery Statistical Bulletin for South China Sea Area 1979.Southeast Asian Fish.Dev.Cent., 227 p.
SEAFDEC. 1982. Fishery Statistical Bulletin for South China Sea Area 1980.Southeast Asian Fish.Dev.Cent., 268 p.
SEAFDEC. 1983. Fishery Statistical Bulletin for South China Sea Area 1981.Southeast Asian Fish.Dev.Cent., 275 p.
SEAFDEC. 1984. Fishery Statistical Bulletin for South China Sea Area 1982.Southeast Asian Fish.Dev.Cent., 231 p.
SEAFDEC. 1985. Fishery Statistical Bulletin for South China Sea Area 1983.Southeast Asian Fish.Dev.Cent., 178 p.
Supongpan, S. and P. Saikliang, 1987. Fisheries status of tuna purse seiners (usingsonar) in the Gulf of Thailand. Rep.Mar.Fish.Div.Dep.Fish., Bangkok, 3:78 p.
Yesaki, M. 1987. Synopsis of biological data on longtail tuna, Thunnus tonggol. Indo-Pac.Tuna Dev.Mgt.Programme, IPTP/87/WP/16: 56 p.

320
CURRENT STATE OF THE MEXICAN TUNA FISHERY ANDECOLOGICAL INTEPACTIONS BETWEEN LARGE AND Slki,\ LL TUNAS
IN THE P LAGIC PACIFIC Elk,IVIROINMEI IT
Arturo Muhlia-MeloCentro de Investigaciones Biológicas
de Baja California Sur, A.C.
ABSTRACT
Catches of yellowfin tuna and other tuna species by the Mexican tuna fishery arebriefly described. The Mexican fleet shifts operations seasonally along coastal waters andoffshore as far west as 150°W. A suggestion of species interaction between Auxis spp.and yellowfin is advanced base(' on a prey-predator association.
IN RODUCTION
A historical analysis of the development of the Mexican tuna fishery in the easternPacific Ocean from 1937 to 1985 was presented in Muhlia-Melo (1987). During theperiod of 1987-1991 the number of active purse-seine vessels decreased from 55 in 1987to 50 in 1991; the carrying capacity also decreased from 47,926 mt to 42,126 mt (Table1). The baitboat fleet also declined from 16 vessels in 1988 to 7 in 1991. The carryingcapacity of this fleet decreased from 1,840 mt in 1989 to 691 mt in 1991 (Table 1).
According to an analysis of relative fishing power of the Mexican purse-seine fleetduring 1984-1986, the most efficient purse-seine vessels operating in the eastern Pacificwere those of 1,090 mt of carrying capacity (Ortega-G and Muhlia-M, 1991).
Table 1. Carrying capacity of Mexican tuna fleet in the eastern PacificOcean, 1985-1991.
unit: hit
Data source: Bayliff, 1986; Bayliff, 1987; Bayliff, 1988; Bayliff, 1989; Bayliff, 1991;Bayliff, 1992a; and Bayliff, 1992h.
Year Purse Seiners Baithoats Total
1985 45,935 1,458 47,393
1986 38,980 1,127 40,107
1987 47,926 1,269 49,195
1988 47,539 1,738 49,277
1989 46,087 1,840 47,927
1990 46,033 1,840 47,873
1991 42,126 691 42,817
FAO LIBRARY AN: 346143
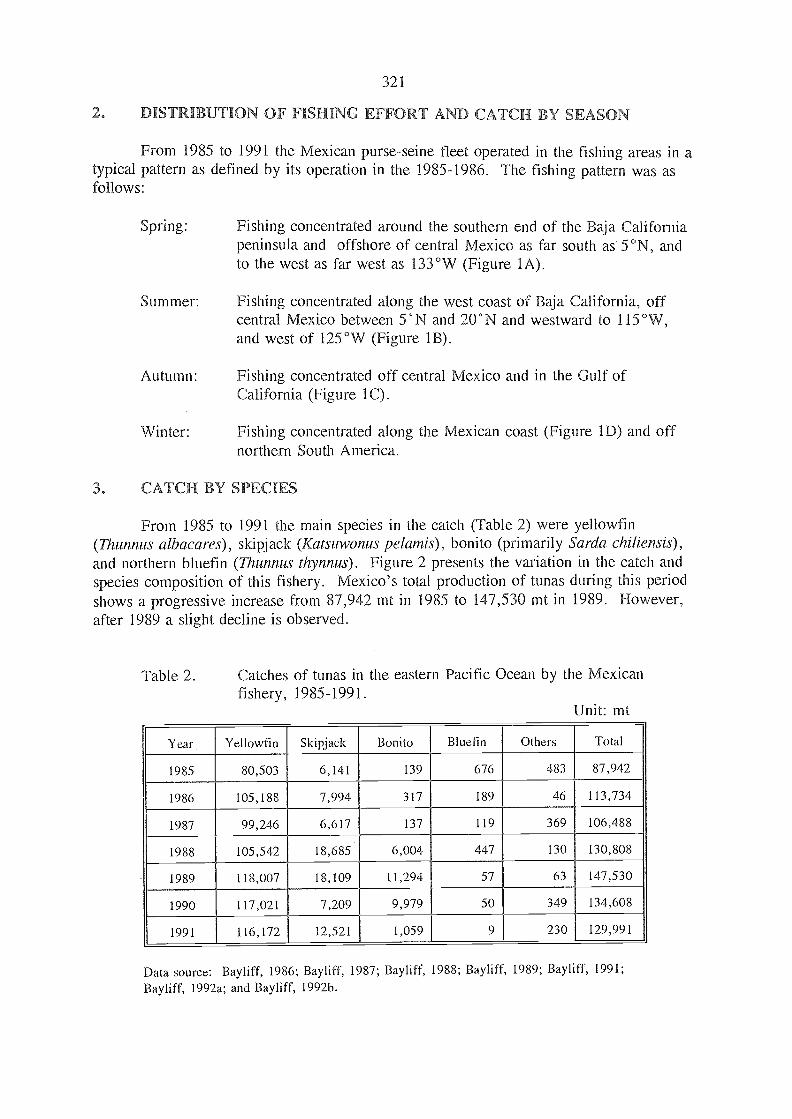
Data source: Bayliff, 1986; Bayliff, 1987; Bayliff, 1988; Bayliff, 1989; Bayliff, 991;
Bayliff, 1992a; and Bayliff, 1992b.
Year Yellowfin Skipjack Bonito Bluefin Others Total
1985 80,503 6,141 139 676 483 87,942
1986 105,188 7,994 317 189 46 113,734
1987 99,246 6,617 137 119 369 106,488
1988 105,542 18,685 6,004 447 130 130,808
1989 118,007 18,109 11,294 57 63 147,530
1990 117,021 7,209 9,979 50 349 134,608
1991 116,172 12,521 1,059 9 230 129,991
321
DISTRI UTION OF FISHING EFFORT AND CATCH Y SEASON
From 1985 to 1991 the Mexican purse-seine fleet operate,d in the fishing areas in atypical pattern as defined by its operation in the 1985-1986. The fishing pattern was asfollows:
Spring: Fishing concentrated around the southern end of the Baja Californiapeninsula and offshore of central Mexico as far south as 5°N, andto the west as far west as 133°W (Figure 1A).
Summer: Fishing concentrated along the west coast of Baja California, offcentral Mexico between 5°N and 20°N and westward to 115°W,and west of 125°W (Figure 1B).
Autumn: Fishing concentrated off central Mexico and in the Gulf ofCalifornia (Figure IC).
Winter: Fishing concentrated along the Mexican coast (Figure ID) and offnorthern South America.
CATCH BY SPECIES
From 1985 to 1991 the main species in the catch (Table 2) were yellowfin(Thunnus albacares), skipjack (Katsuwonus pelamis), bonito (primarily Sarda chiliensis),and northern bluefin (Thunnus thynnus). Figure 2 presents the variation in the catch andspecies composition of this fishery. Mexico's total production of tunas during this periodshows a progressive increase from 87,942 mt in 1985 to 147,530 mt in 1989. However,after 1989 a slight decline is observed.
Table 2. Catches of tunas in the eastern Pacific Ocean by the Mexicanfishery, 1985-1991.
Unit: mt

145
140
135
100
125
120
115
110
105
100
9590
eS
0 150
145
140
135
130
125
120
115
110
105
100
9590
25.
20-
/5-
10.
C: A
utum
n
Avw
145
140
135
100
125
120
11-5
110
165
100
9590
85
Figure 1A. General geographical distribution of fishing
Figure IC. General geographical distribution of fishing
operation of the Mexican purse-seine in spring
operation of the Mexican purse-seine in autumn.
Figure 18. General geographical distribution of fishing
Figure 11). General geographical distribution of fishing
operation of the Mexican purse-seine in ser.
operation of the Mexican purse-seine in winter.
145
140
135
100
125
120
115
110
105
100
9590
85
8580
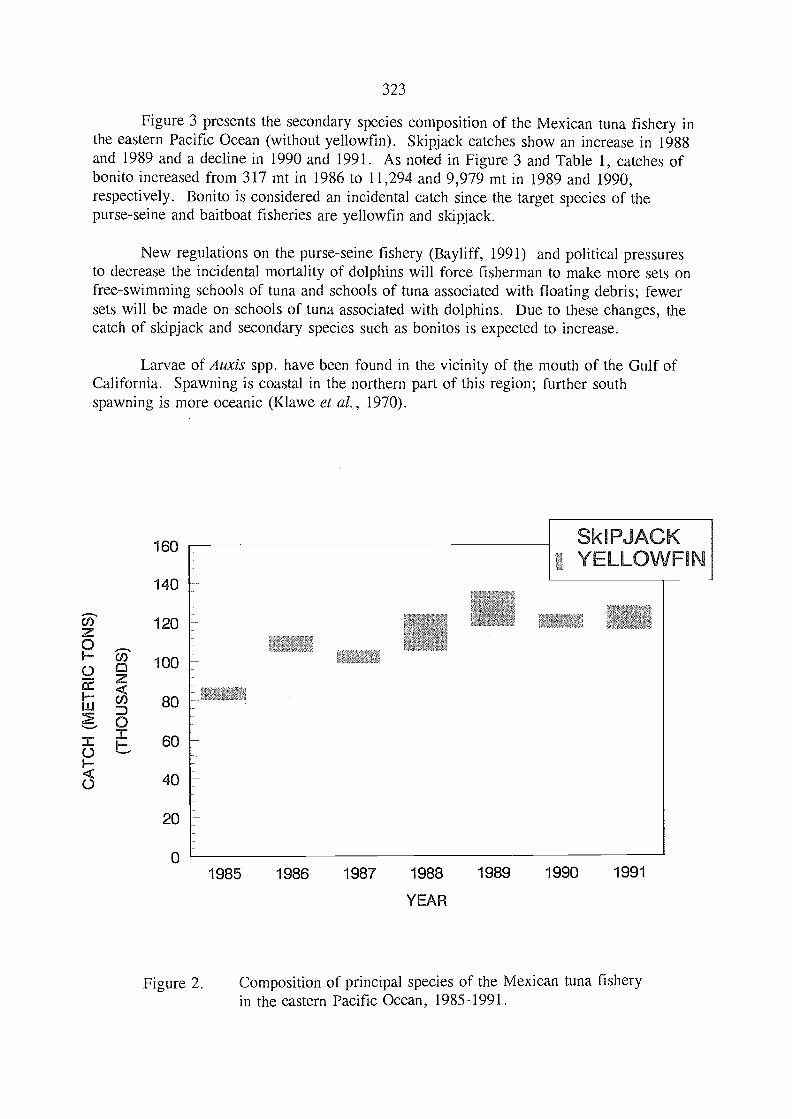
323
Figure 3 presents the secondary species composition of the Mexican tuna fishery inthe eastern Pacific Ocean (without yellowfin). Skipjack catches show an increase in 1988and 1989 and a decline in 1990 and 1991. As noted in Figure 3 and Table 1, catches ofbonito increased from 317 mt in 1986 to 11,294 and 9,979 mt in 1989 and 1990,respectively. Bonito is considered an incidental catch since the target species of thepurse-seine and baitboat fisheries are yellowfin and slcipjack.
New regulations on the purse-seine fishery (Bayliff, 1991) and political pressuresto decrease the incidental mortality of dolphins will force fisherman to make more sets onfree-swimming schools of tuna and schools of tuna associated with floating debris; fewersets will be made on schools of tuna associated with dolphins. Due to these changes, thecatch of skipjack and secondary species such as bonitos is expected to increase.
Larvae of Auxis spp. have been found in the vicinity of the mouth of the Gulf ofCalifornia. Spawning is coastzl in the northern part of this region; further southspawning is more oceanic (Klawe et al., 1970).
160
140
120
100
80
60
40
20
O
1985 1986 1987 1988 1989 1990 1991
YEAR
Figure 2. Composition of principal species of the Mexican tuna fisheryin the eastern Pacific Ocean, 1985-1991.
SkIPJACKYELLOWFIN
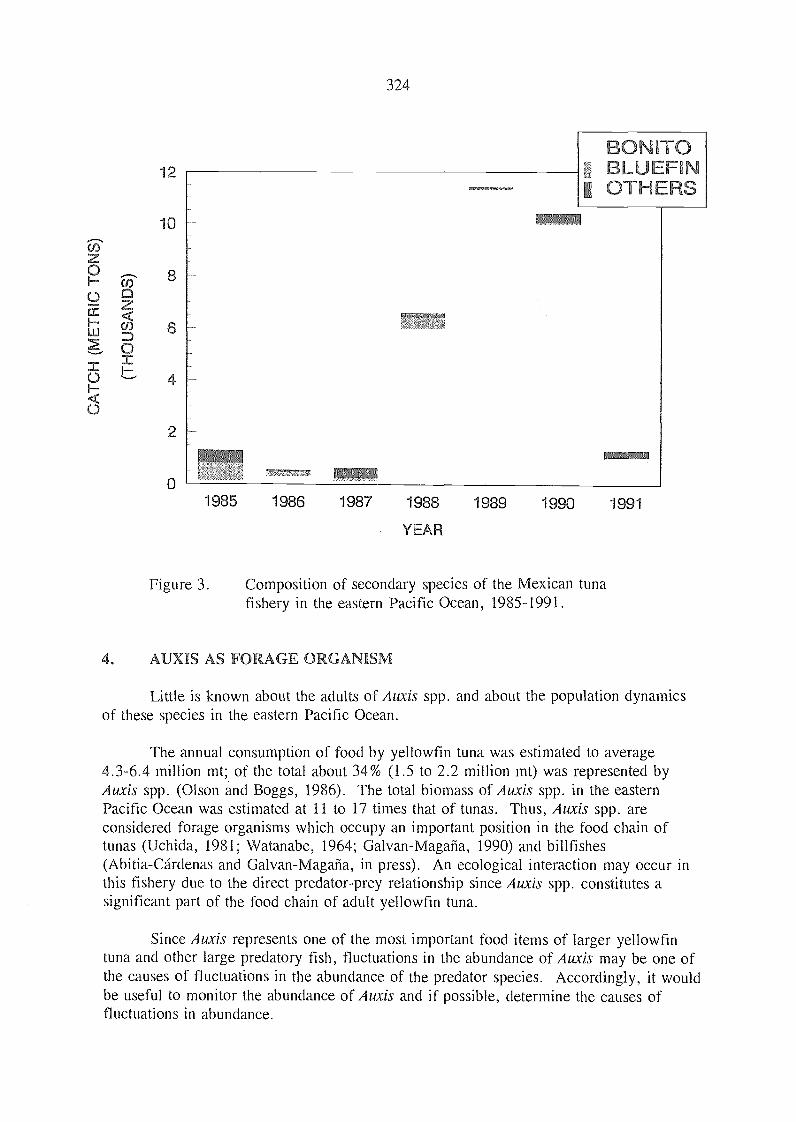
12
10
324
1985 l86 1987 1988 1989 1990 1991
YEAR
Figure 3. Composition of secondary species of the Mexican tunafishery in the eastern Pacific Ocean, 1985-1991.
AUXIS AS FORAGE ORGANISM
Little is known about the adults of Auxis spp. and about the population dynamicsof these species in the eastern Pacific Ocean.
The annual consumption of food by yellowfin tuna was estimated to average4.3-6.4 million mt; of the total about 34% (1.5 to 2.2 million mt) was represented byAuxis spp. (Olson and Boggs, 1986). The total biomass of Auxis spp. in the easternPacific Ocean was estimated at 11 to 17 times that of tunas. Thus, Auxis spp. areconsidered forage organisms which occupy an important position in the food chain oftunas (Uchida, 1981; Watanabe, 1964; Galvan-Magaña, 1990) and billfishes(Abitia-Cárdenas and Galvan-Magaña, in press). An ecological interaction may occur inthis fishery due to the direct predator-prey relationship since Auxis spp. constitutes asignificant part of the food chain of adult yellowfin tuna.
Since Auxis represents one of the most important food items of larger yellowfintuna and other large predatory fish, fluctuations in the abundance of Auxis may be one ofthe causes of fluctuations in the abundance of the predator species. Accordingly, it wouldbe useful to monitor the abundance of Auxis and if possible, determine the causes offluctuations in abundance.
BONITOBLUEFINOTI-ERS
..."77771

5. REFERENCES CITED
Abitia-Cárdenas L. A. and Galván-Magaña F. (in press). Trophic energetic spectrum ofstriped marlin Tetrapturus audax Philippi, 1887) from the area of Cabo San Lucas, BajaCalifornia Sur, Mexico. J.Fish Biol.
Bayliff, W. H. (editor). 1986. Annual report of the Inter-American Tropical TunaCommission, 1985. Annu.Rep.I-ATTC, (1985):248 p. (In English and Spanish).
Bayliff W. H. (editor). 1987. Annual report of the Inter-American Tropical TunaCommission, 1986. Annu.Rep.I-ATIC, (1986):264 p. (In English and Spanish).
Bayliff, W. H. (editor). 1988. Annual report of the Inter-American Tropical TunaCommission, 1987. Annu.Rep.I-AYTC, (1987):222 p. (In English and Spanish).
Bayliff, W. H. (editor). 1989. Annual report of the Inter-American Tropical TunaCommission, 1988. Annu.Rep.I-A1TC, (1988):288 p. (In English and Spanish).
Bayliff, W. H. (editor). 1991. Annual report of the Inter-American Tropical TunaCommission, 1989. Annu.Rep.I-ATIC, (1989):270 p. (In English and Spanish).
Bayliff, W. H. (editor). 1992a. Annual report of the Inter-American Tropical TunaCommission, 1990. Annu.Rep.I-A7TC, (1990):261 p. (In English and Spanish).
Bayliff, W. H. (editor). 1992b. Annual report of the Inter-American ropical TunaCommission, 1991. Annu.Rep.1-A1TC, (1991):271 p. (In English and Spanish).
Galvan-Magaña F. 1990. Composición y análisis de la dieta del atún aleta amarilla(Thunnus albacares) en el Océano Pacífico mexicano durante el periodo 1984-1985.M.S. Thesis. Instituto Politécnico Nacional de México (CICIMAR).
Klawe, W.L., J.J. Pella, and W.S. Le,et. 1970. The distribution, abundance and ecologyof larval tunas from the entrance of the Gulf of California. Bull.1-A 14(4):505-44.
Muhlia-Melo, A. 1987. The Mexican tuna fishery. Rep.CCOFI, (28):37-42.
Olson, R.J., and C.H. Boggs. 1986. Apex predation by yellowfin tuna Thunnusalbacares: independent estimates from gastric evacuation and stomach contents,bionergetics, and cesium concentrations. Can.J.Fish.Aquat.Sci., 43:1760-75.
Ortega-G., and Muhlia-M., A. 1991. Analysis of the relative fishing power of theMexican purse-seine fleet operating in the eastern Pacific. Ciencias Marinas,
18(1):55-78.
Uchida, R,N. 1981. Synopsis of biological data on frigate tuna, Auxis thazard, and
bullet tuna, A. rochei. NOAA Tech.Rep.NMFS Circ., (436): 63 p.
325

326
Watanabe, H. 1964. Frigate mackerels (genus Auxis) from the stomach contents of tunasand marlins. In Proceedings of the Symposium on Scombroid Fishes, Part II.Symp.Ser.Mar.Biol.Assoc. India, 1:631-41.


olume
ud
;