In-Depth Vulnerability and Needs Assessment Report · In-Depth Vulnerability and Needs Assessment...
103
1 ZAMBIA Vulnerability Assessment Committee VAC In-Depth Vulnerability and Needs Assessment Report June 2015 Zambia Vulnerability Assessment Committee
Transcript of In-Depth Vulnerability and Needs Assessment Report · In-Depth Vulnerability and Needs Assessment...

1
ZAMBIA
Vulnerability Assessment Committee
VAC
In-Depth Vulnerability and Needs
Assessment Report
June 2015
Zambia Vulnerability Assessment Committee

2
TABLE OF CONTENTS
Acknowledgements ......................................................................................................................... 7
Executive Summary ......................................................................................................................... 8
CHAPTER ONE: INTRODUCTION ........................................................................................... 14
1.1. Background ......................................................................................................................... 14
1.2. Objectives ............................................................................................................................... 15
1.3 Scope of the In-Depth Vulnerability and Needs Assessment .................................................. 15
1.4. Limitations of the Survey ....................................................................................................... 16
CHAPTER TWO: METHODOLOGY ................................................................................................... 17
2.1. Identifying Areas to be assessed ............................................................................................. 17
2.2. Target Population ................................................................................................................... 18
2.3. Food Needs Computation ....................................................................................................... 21
CHAPTER THREE: CONTEXT .................................................................................................. 22
3.1. The Economy .......................................................................................................................... 22
3.2. Agriculture and Food Security ............................................................................................... 22
3.3 Health ...................................................................................................................................... 27
3.4 Nutrition .................................................................................................................................. 28
3.5. Water and Sanitation .............................................................................................................. 30
CHAPTER FOUR: FINDINGS ................................................................................................... 33
4.1 General Demographics ............................................................................................................ 33
4.2. Vulnerability and Hazards ...................................................................................................... 34
4.3. Early Warning ........................................................................................................................ 34
4.4. Livelihoods ............................................................................................................................. 34
4.5. Agriculture and Food Security ............................................................................................... 38
4.6. Expenditure Share .................................................................................................................. 41
4.7. Food Consumption Scores (FCS) ........................................................................................... 43
4.8. Coping Strategy Index (CSI) .................................................................................................. 44
4.9. Health ..................................................................................................................................... 46

3
4.10. Nutrition ............................................................................................................................... 53
Meal Consumption Pattern ............................................................................................................ 53
Nutritional Status ........................................................................................................................... 55
Child Nutrition ............................................................................................................................... 55
Mothers Nutritional Status ............................................................................................................ 59
4.11. Water, Sanitation and Hygiene ............................................................................................. 61
4.12. Developmental Projects and Safety Net Projects ................................................................. 69
CHAPTER FIVE: CONCLUSIONS AND RECOMMENDATIONS .......................................... 70
5.1. Agriculture and Food Security ............................................................................................... 70
HEALTH ....................................................................................................................................... 71
5.3. Nutrition ................................................................................................................................. 72
5.4. Water, Sanitation and Hygiene ............................................................................................... 73
ANNEXES .................................................................................................................................... 76
Annex 1: Map Showing Districts Visited ...................................................................................... 77
Annex 2: Estimated Population of the Sampled Households per District ..................................... 78
Annex 3: Districts Selected for Provision of Relief Food by Ward .............................................. 80
Annex 4: Assessment Team Composition ..................................................................................... 81
Annex 5: Editorial Team ............................................................................................................... 85

4
Table of Figures
Figure 1: Start of Season Anomaly ................................................................................................ 14
Figure 2: Soil Water Index for Maize in 2014/15 Season as at 20th March, 2015 .......................... 14
Figure 3 : Maize Production by Province for the 2013/14 and 2014/15 Seasons........................... 24
Figure 4 : Livelihood Sources by Gender ....................................................................................... 34
Figure 5: Alternative Livelihood Sources ...................................................................................... 35
Figure 6: Asset Wealth Index - 2014 and 2015 ............................................................................... 36
Figure 7: Asset Wealth Categorization by Gender ......................................................................... 37
Figure 8 : Asset Wealth Categorization by Employment Status .................................................... 38
Figure 9: Type of Livestock Kept by Households ............................................................................ 40
Figure 10: Expenditure Share ......................................................................................................... 41
Figure 11 : Expenditure Share by Gender ...................................................................................... 42
Figure 12: Food Consumption Score by Gender ............................................................................ 43
Figure 13: Food Consumption Score by Marital Status ................................................................. 44
Figure 14: Food Consumption Score by Asset Wealth .................................................................. 44
Figure 15: Diseases that Affected Assessed Households in Q1 of 2015 ........................................ 46
Figure 16: Health Care Seeking Behaviour by Disease ................................................................. 47
Figure 17: Reasons for poor health seeking patterns ...................................................................... 47
Figure 18: Diseases by Water Source ............................................................................................. 48
Figure 19: Diseases by Water Treatment ....................................................................................... 49
Figure 20: Diseases by Distance to Water Source .......................................................................... 51
Figure 21: Diseases that the Under 5 Suffered from ...................................................................... 51
Figure 22: Immunization Rates ...................................................................................................... 52
Figure 23: Meals consumed Preceding Day and Normal Meals .................................................... 54
Figure 24: Children enrolled in Child feeding programme 3 months prior the survey .................. 56
Figure 25: Child Nutritional Status ................................................................................................ 57
Figure 26: Nutrition Status of Women ........................................................................................... 59
Figure 27: Women Nutritional status by Household size ............................................................... 60

5
Figure 28: Women MUAC by Child MUAC ................................................................................. 61
Figure 29: Main Sources of Water ................................................................................................. 61
Figure 30: Secondary Water Sources ............................................................................................. 62
Figure 31: Distance to Water Sources ............................................................................................ 64
Figure 32: Water Treatment Methods ............................................................................................ 65
Figure 33: Distribution of Sanitation Facilities .............................................................................. 66
Figure 34: Scouring Agents for Hand Washing ............................................................................. 68
Figure 35: Districts having on – Going Development Projects and Safety Net Programmes ........ 69

6
Table of Tables
Table 1: Integrated Context Analysis ............................................................................................. 17
Table 2: National Food Balance Sheet for Zambia for the 2015/2016 Agricultural Marketing
Season ............................................................................................................................................. 25
Table 3: Projected funds for investment in WASH infrastructure ................................................. 32
Table 4: Mean CSI by Family Size ................................................................................................ 45
Table 5: CSI by Employment Status .............................................................................................. 45
Table 6: CSI by Education and Gender .......................................................................................... 46
Table 7: Water Source by Diseases ................................................................................................ 49
Table 8: Diseases by Sanitation Facility ........................................................................................ 50
Table 9: Meal consumption in 30 days........................................................................................... 53
Table 10: Child feeding program by Family size ........................................................................... 56
Table 11: Under - Nutrition by Family Size ................................................................................... 58
Table 12: Child MUAC by age of Household head ....................................................................... 58
Table 13: Child illnesses by Child MUAC ..................................................................................... 59
Table 14: Main Water Sources by Province ................................................................................... 63
Table 15: Main Water Sources by Water Sources Drying Up ....................................................... 63
Table 16: Main Water Source by Water Level Change .................................................................. 64
Table 17: Sanitation Facilities Distribution by Asset Wealth Index .............................................. 66
Table 18: Type of Sanitation Facilities by Province ...................................................................... 67
Table 19: Use of Scouring Agent for Hand washing after Using the Toilet by Asset Wealth Index
........................................................................................................................................................ 68

7
Acknowledgements
The Zambia Vulnerability Assessment Committee (ZVAC) wishes to thank the following
organizations for participating in the 2015 In-Depth Vulnerability and Needs Assessment:
Central Statistical Office (CSO)
Department of Water Affairs (DWA)
Department of Resettlement (DoR)
FEWSNET
Ministry of Community Development, Mother and Child Health (MCDMCH)
Ministry of Health (MOH)
Ministry of Agriculture and Livestock (MAL)
National Food and Nutrition Commission(NFNC)
OXFAM
Programme Against Malnutrition (PAM)
United Nations Children and Emergency Fund (UNICEF)
United Nations World Food Programme (WFP)
United Nations Population Fund(UNFPA)
Zambia Red Cross Society (ZRCS)
World Vision International (WVI)
Special gratitude goes to all the institutions that rendered financial and logistical support
for the 2015 assessment. The ZVAC is also indebted to all District Disaster Management
Committees (DDMCs) in the districts where the assessments were conducted. Lastly the
ZVAC wishes to extend its appreciation to the provincial and district officers who
participated in the data collection as well as the communities without whom this exercise
would not have been a success.

8
Executive Summary
The 2015 In – depth Vulnerability and Needs Assessment was triggered by prolonged dry spells
experienced mainly in the southern half of the country between February and March 2015. The
Assessment was designed to understand the impact of these prolonged dry spells on selected
sectors of the economy in forty-eight (48) districts of Central, Copperbelt, Eastern, Luapula,
Muchinga, Northwestern, Southern and Western Provinces.
The results of the assessment showed that the main livelihoods for most people in the assessed
districts was farming where sixty (60) percent of households earned their incomes and food. The
other livelihoods were trading, agriculture wage labour, skilled trade, non-agricultural wage
labour and remiattances.
The Assessment further determined that production of maize in most of the districts reduced by as
much as 38 percent. The western province districts were the most affected indicating a loss of as
much as 41 percent overall. In terms of carry – over stock, only 34.7 percent of households
reported to have had stock from the previous season. When households were asked when cereal
would run out, about 55.2 percent indicated that they would have no cereal by July. By the time
the households start the lean period around November, 86.7 percent of the households would have
run out of cereal.
The assessment results showed that there were variances in food expenditure share across the
districts covered. In this regard, majority of the households spent most of their money on food
items.The results showed that 34.8 percent of the households had an expenditure share on food of
between 51 and 75 percent. A further 34.1 percent of households had food expenditure shares of
more than 75 percent.
The coping strategies index (CSI) showed no major food insecurity stress across the surveyed
districts. This could be attributed to the period of the assessment when even the poor households
are able to access own food production, and also engage in agricultural labour for incomes and
food exchange.
The Assessment showed that most of the people in the assessed districts have acceptable food
consumption scores (52.7 percent) followed by those with borderline food consumption scores
(24.6 percent). The Assessment showed that most of the people in the assessed districts have
acceptable food consumption scores (52.7 percent) followed by those with borderline food
consumption scores (24.6 percent).
Utilizing a composite food security indicator developed by the Consolidated Approach for
Reporting for Security which combined FCS, Expenditure share and coping behaviour, (CSI and
FCS), 31 districts out of the 48 assessed districts, will require humanitarian assistance for part of
the 2015/16 consumption season. Based on this, 798, 948 people in 31 districts will require relief
food amounting to 53, 242 MT of cereal for eight months.
In terms of health, there is need to strengthen Malaria Control Programs especially in the districts
that are currently showing an increase in malaria. There is need to strengthen water quality
monitoring in all the districts to ensure safe water sources of drinking.
For nutrition, the survey results showed that on average 0.3 percent of households in the entire
district slept hungry, 8.9 percent ate once and 46.3 percent ate two times the day preceding the

9
survey. About 2.1 percent of the households in Shangombo, Ikelenge, Sikongo and Sioma had no
meals a day preceding the survey. Sikongo and Sioma recorded the highest proportion of
households (50.7 percent and 34.6 percent respectively) who had one meal the day preceding the
survey. Further, Lukulu and Nyimba showed that over 79 percent of the households ate two meals
the day preceding the survey. The results further showed that in terms of child nutrition, 2.2
percent children were at risk of severe wasting, 3.2 percent were at risk of moderate wasting and
94 percent of the children were not at risk of wasting or death in the entire district.
For water, sanitation and hygiene, the results showed that reported main water sources that were
affected (that is lower water level than in previous years same time) is 2, 585,983 people or
430,997 households. The population that reported main water sources which dried up is 1,082,752
people (180,459 households).
A large number of households in the assessed districts did not have any toilets and practice open
defecation. The population which reported not having sanitation facilities stood at 927,551
people (154,592 households). Districts where households do not have sanitation facilities were
mainly in Western Province.
Conclusions and Recommendations
Agriculture and Food Security
Conclusion
No major productive assets were offloaded and/or sold in response to the prolonged dry
spells.
Livelihood diversity still remains low with majority of the households in the assessed
districts dependent on agricultural based livelihoods (e.g. crop production, livestock
rearing and agriculture wage labour).
The permanent and seasonal cash incomes in the assessed districts are also largely
agricultural based mainly being sale of crops and agricultural wage labour.
Employment of moderate to high cost coping mechanisms was high across most of the
assessed districts (RCSI).
Prolonged dry spells did have an impact on household food production which ultimately
will affect household food security especially as households move towards the lean
period.
Despite a slight increase in dietary diversity, the assessment showed that there is over –
dependency on carbohydrates (mainly maize and sweet potatoes).
Utilizing a composite index of FCS, Expenditure Share on food and coping behaviour, the
results of the survey showed that 31 districts in six provinces would require assistance.
Recommendations
Short Term
A total of 798, 948 people (133, 158 households) from thirty one (31)districts will require
food relief amounting to 53, 242 MT of maize equivalent for a period of eight (8) months
(August 2015 – March 2016).These include: Serenje and Chitambo (Central); Chadiza,
Chipata, Katete, Lundazi, Mambwe, Nyimba, Petauke, Sinda, Vubwi (Eastern); Samfya
(Luapula) Chikankata, Gwembe, Kazungula, Pemba, Sinazongwe (Southern); Ikelenge

10
(North Western) and Kalabo, Kaoma, Mulobezi, Senanga, Sesheke, Shangombo, Nalolo,
Limulunga, Nkeyema, Sikongo, Sioma, Mwandi and Luampa (Western).
There is need to monitor the evolvement of the food security situation in the seventeen
(17) districts as most of them fall within the moderately food secure district with a
possibility of graduating into food insecurity as we approach the lean period.
There is need to strengthen the extension delivery system.
Input provision for 45,079 households in twenty-seven (27) districts.
Medium to Long Term
Livelihood diversification programmes be scaled up in order to contribute to alternative
livelihoods.
Strengthen the support on conservation farming implementation.
There is need to introduce appropriate technologies for small – scale farmers which could
enhance household food security such as water harvesting and small scale irrigation
systems.
There is need to enhance the monitoring of nutrition and food security through the
establishment of sentinel sites.
Child headed Households should be targeted for food security pack programs
Promote asset building projects among the child headed households through Youth
empowerment funds.
Health
Conclusion
Malaria was the most common disease suffered by household members especially those in rural
areas. The most affected districts were: Nkeyema, Luampa, Kaoma, Ngabwe, Mpika,
Mwinilunga, Chama and Masaiti. The percentages of infection for diarrhoea, respiratory infection
and other diseases were too low as a result they had no significant consequence on household’s
livelihood.
On health care seeking behavior, a bigger percentage of respondents who didn’t seek medication
at all and those who took their own medication where those who suffered from malaria. There is
need to increase the deployment of Community Health Assistants (CHAs) to communities so as to
sensitize communities on the importance of making use of health facilities.
Fever and ARI/cough were the top two diseases that affected the under five children in the
districts were the assessment took place. ARI/cough had 29 percent and fever had 27.2 percent.
Recommendations
Short term
Increase the coverage of indoor-residual spraying and effective use of RDTs.for the
following districts; Nkeyema, Luampa, Kaoma, Ngabwe, Mpika, Mwinilunga, Chama,
and Masaiti and
There is need to develop a Statutory Instrument on the use of ITNs.
Medium to Long term
Extending malaria surveillance to community level using an active case detection system
for community level surveillance.
There is need to improve on the supply of drugs and logistics for treatment of
respiratory infections (non-pneumonia).

11
Recruit more Community Health Assistants (CHAs).
There is need to promote community based disease prevention mechanisms.
Nutrition
Conclusion
The study showed that most of the households ate two meals a day preceding the survey. Most
households that ate twice had normal meals and a reduction was seen among those that ate three
meals compared to their normal meals. This situation could be explained by the fact that most
households reported having run out of food in 30 days preceding the survey and a reduction was
observed among those who normally eat three meals.
The results indicate that the overall wasting was less than 6 percent, however, specific districts
data show high proportion of child wasting. The results showed that children from large families
and families headed by the young and the elderly had a higher chance of becoming wasted. Hence
children in these households had a higher chance of dying. The family size contributed to child
wasting due to the intra household’s food distribution in households. Therefore, children between
6 to 24 months in larger families and households headed by the elderly are at risk of being wasted
in all the 48 districts.
The survey established that about three quarters of the children who were severely wasted had
fever, cough and diarrhea while all the children who were moderately wasted had all the three
illnesses. This shows that these illness might have contributed to the wasting state of the children.
Studies have shown that illnesses such as diarrhea increases the nutrient loss from the body and
reduces appetite hence reducing the food intake and increasing the likelihood of wasting.
Further, the survey revealed that interventions such as supplementary and therapeutic feeding
were only available in few districts with limited coverage in each of the districts. Therefore,
vulnerable children would have been missed at targeting stage of the intervention.
Recommendations
Short term
Children in the moderate and severe wasted should be considered for
supplementary and therapeutic feeding. The feeds should provide adequate
nutrient requirement for the children. The targeting should consider Child headed
households, households headed by the elderly and children from larger families.
The child rations should be large enough to support the food needs of the women.
This will take care of the intra household’s food distribution in the households
since most wasted children normally come from the poorest segments of the
population.
There is need to intensify the monitoring of nutritional status of children and
mothers to detect under - nutrition early and target support towards the vulnerable
households in the communities.
Scale up the supplementary feeding programs and therapeutic programs to cover
vulnerable districts where wasting is high among children and women.

12
Medium term
Promote food diversification to help in promoting diet diversity among the
households
Promote food storage for consumption and advocate for less sale on food assets
from communities who depend on own production for livelihood.
Promote infant feeding programs in the community.
Improve the service delivery to reduce childhood illnesses such as diarrhoea and
malaria.
Water, Sanitation and Hygiene
Conclusion
The population which reported main water sources that were affected (that is lower water
level than in previous years same time) is 2, 585,983 people or 430,997 households. The
population that reported main water sources which dried up is 1,082,752 people or
180,459 households.
The worst affected districts were Kaoma, Kalabo, Mitete, Sikongo, Sioma and Luampa
(Western Province); Mwinilunga and Ikelenge (North-Western Province); Vubwi, Sinda,
Chipta, Chadiza, Petauke and Lundazi (Eastern Province); Zimba, Namwala, Gwembe,
Kazungula, Choma, Kalomo (Southern Province); Lufwanyama (Copperbelt Province);
and Mafinga and Mpika (Muchinga Province).
Majority of households in the surveyed districts did not treat their drinking water.
A large number of households in the assessed districts did not have any toilets and
practice open defeacation. The population which reported not having sanitation facilities
stood at 927,551 people (154,592 households). Districts where households do not have
sanitation facilities were mainly in Western Province.
Most of the households washed their hands with the commonest scouring agents used
being soap and ash.
Recommendations
Short – term (WASH)
In terms of water sources (working in liaison with MMEWD, MLGH, MOCTA, D-WASHE,
DDMC and Satellite Disaster Management Committees):
Assess and search for new water sources in needy areas;
Drill boreholes in areas where water points (21 percent) have dried and where the
distance from household to water point is more than 500m; and
Continuous monitoring the situation in case of more water points drying out and
determining alternative water sources.
Plan for operation and maintenance of existing water infrastructure.
In terms of sanitation facilities and Hygiene (working with MLGH, MOCTA, MOH, MCDMCH,
D-WASHE, DDMC and Satellite Disaster Management Committees):

13
Construct demonstration latrines at the schools, health centres, rural community centres
(markets, faith centers, and traditional chiefs’ palaces) as well as latrines for vulnerable
households. Work with households to build robust and appropriate latrine versions from
the start, even though the latrines may be basic.
The government at national, provincial and districts levels should encourage the
formation of a practical WASH Chiefdom and Community Action Plans for improving
WASH access generally;
Promoting CLTS, monitoring and maintaining ODF status, maintaining a clean
environment generally, and Make use of traditional leaders, local religious leaders and the
influence and opportunities they have in bringing messages of personal cleanliness and
well-being to their community.
There is need to increase availability of chlorine at rural health centers level in all the
affected districts
o Create WASH awareness programme.
Medium and long term (WASH)
In terms of sanitation facilities and Hygiene (working with MLGH, MOCTA, MOH, MCDMCH,
D-WASHE, DDMC and Satellite Disaster Management Committees):
Community involvement in planning, design and construction of water infrastructure
(e.g., small dams and ancillary works) and in watershed management
Piloting and promoting of water supply and sanitation technology options that are climate
resilient.
In terms of sanitation facilities and Hygiene (working with MLGH, MOCTA, MOH, MCDMCH,
D-WASHE, DDMC and Satellite Disaster Management Committees):
Provide external technical advice in challenging environments while ensuring full
consultation with beneficiaries regarding technical challenges and solutions. Some
“Smart” subsidies could be targeted to particularly vulnerable groups (including cash
transfers), or to households facing significant technical and physical challenges to latrine
building (mason/ artisan technical support).
Build sanitation shops at District/Chiefdom level to sell sanitation facilities and give
advice on improved sanitation facility construction, operation and maintenance

14
CHAPTER ONE: INTRODUCTION
1.1. Background
According to the Zambia Rainfall forecast issued in September 2014 for the 2014/2015
rainfall season, most parts of the country had a likelihood of receiving normal rainfall
during the period October to December 2014 with isolated pockets expected to receive
normal to below normal rainfall. The forecast further indicated that normal to above
normal rainfall was likely to be received during the period January to March 2015.
Figure 1: Start of Season Anomaly
Contrary to the forecast issued, the country experienced mixed rainfall performance with
an early on-set confined to the Northern, Luapula, some parts of North Western and
Western Provinces.
Figure 2: Soil Water Index for Maize in 2014/15 Season as at 20th March, 2015
Figure 2
15
The rest of the country (Central, Copperbelt, Eastern, Lusaka and Muchinga Provinces)
experienced a late onset (figure 1) with much of the rains received during the 3rd dekad
(21-31) of December 2014. It is worth noting that January 2015 had normal rainfall. Dry
spells set in at the beginning of February 2015 and continued into March 2015 affecting
Western (all districts), Southern (all districts), Eastern Province (all districts), some parts
of Central, Luapula, Muchinga, North-western and Lusaka Provinces being severely
affected. The prolonged dry spells coupled with poor rainfall distribution shortened the
growing season (figure 2). This scenario is likely to compromise the food security
situation in the country at both national and household levels. Hydrological indicators
showed that provinces such as Central, Eastern, Western, Southern and Lusaka Provinces
are likely to have challenges of accessing water for domestic and other uses. Furthermore,
the lack of adequate water in the water bodies is likely to negatively impact power
generation in the country which might result into longer load – shedding hours.
The 2015 In-depth and Needs Assessment therefore sought to understand the impact of
the dry spells experienced in Zambia on selected sectors of the economy. This was done
through the capture of information relating to the causative agents, vulnerability drivers,
numbers of elements at risk, coping strategies being utilized and the possible solutions to
the shock (both short and long term). This assessment covered forty-eight (48) districts in
Central, Copperbelt, Eastern, Luapula, Muchinga, Northwestern, Southern and Western
Provinces. (Refer to Annex 1 for Assessed districts).
1.2. Objectives
1.2.1 Overall Objective
To assess the impact of prolonged dry spells experienced during the 2014/2015 rainfall
season on agriculture and food security (availability, WATSAN, health, access, stability
and utilization) and recommend appropriate interventions.
1.2.2 Specific Objectives
The following were the specific objectives:
i. Determine the severity of food insecurity;
ii. Determine the number and areas affected; and
iii. Determine food and non – food needs, if any.
1.3 Scope of the In-Depth Vulnerability and Needs Assessment
The broader themes covered in the Assessment included the following:
Household Questionnaire themes covered were as follows:
Household Demographics
Productive Asset Ownership
Agriculture Production (Crop and Livestock Production)

16
Livelihoods and Expenditure Patterns
Household Coping Strategies
Food Sources and Consumption
Water, Sanitation and Hygiene
Health
Nutrition
Community and district Questionnaires themes covered were as follows:
Description on the rainfall performance
Review the impact of rainfall (2014/15 rainfall season)
Community Income Sources (Livelihoods)
Agriculture Production (Crops and Livestock)
Prices for staple foods
Access and Livelihoods
Health and Nutrition
Water , Sanitation and Hygiene
Safety Nets programmes
Development Projects
1.4. Limitations of the Survey
The following were the limitations of the survey:
Most of the maps were not well detailed as they missing land mark features for
identifying enumeration areas;
Non- enumeration of Ngabwe district due to prevailing land disputes; and
Challenges with population and boundaries for the newly created districts leading
to over or underestimations of the district estimates.

17
CHAPTER TWO: METHODOLOGY
2.1. Identifying Areas to be assessed
An Integrated Context Analysis (ICA) was done to determine the districts to assess. The
key indicators used for the selection of hotspots district included rainfall performance and
anticipated crop losses with food insecurity frequency, poverty incidences and field
reports from the District Disaster Management Committees (DMMCs) used as trailing
indicators. The following parameters shown in the table below were used:
Table 1: Integrated Context Analysis
Indicator Criteria variable description
Rainfall performance COMPRISED OF A COUNT OF DEKADS FOR BELOW NORMAL,
NORMAL AND ABOVE NORMAL WEIGHTED TO GIVE RISK
LEVELS FOR DISTRICTS. ALL DISTRICTS ABOVE THE
CALCULATED MEAN.
RISK LEVEL
3 = SEVERE
2 = MODERATE
1 = ALRIGHT
Anticipated crop loss ALL DISTRICTS SUFFERING FROM 30% CROP LOSS. ANTICIPATED CROP
LOSS
Extreme poverty
incidence
extreme poverty incidence is either category 5
(75% or greater) or Category 4 (61% to 70%)
EXTREME POVERTY
1=<=20%
2=21% TO 40%
3=41% TO 60%
4=61% TO 70%
5=>=70%
MODERATE POVERTY
1=<=10%
2=11% TO 16%
3=17% TO 20%
4=21% TO 25%
5=>=26%
Food insecurity
frequency
category 4 (5 or more times appearing as food
insecure) or category 3 (3 to 4 times)
FOOD INSECURITY
1= DISTRICT NEVER
APPEARED
2=DISTRICT APPEARED TWO
TO THREE TIMES
3= DISTRICT APPEARED
THREE TO FOUR TIMES
4= DISTRICT APPEARED FIVE
OR TIMES
18
2.2. Target Population
2.2.1. Target Population
The target population is the number of people living in the districts identified to have
been affected by prolonged dry spells that occurred during the 2014/2015 rainfall season.
A total of forty-eight (48) districts were targeted.
2.2.2. Sampling Frame
Sampling frames are lists or enumeration procedures that allow identifying every
individual of the target population (Kish, 1965; Kalton, 1983).The simplest form of a
sample frame is a target population list or database in which each individual of the target
population is uniquely identified.
Zambia is administratively divided into ten (10) provinces. Each province is in turn sub-
divided into districts. Each district is further sub-divided into constituencies and wards.
For statistical purposes, each ward is subdivided into Census Supervisory Areas (CSAs)
which, in turn, are sub-divided into Standard Enumeration Areas (SEAs). The SEAs are
geographical areas, classified as either rural or urban, have information on number of
households and the population size. This demarcation is done through a mapping
exercise.
Prior to the 2010 Census of Population and Housing, the Central Statistical Office (CSO)-
Zambia conducted a mapping exercise. Based on the Census results, data collected during
the mapping exercise was updated.
The national frame has an updated list of Standard Enumeration Areas (SEAs). The frame
has 25,631 SEAs and 2,815, 897 households. A listing of SEAs in all the forty-eight (48)
districts was the sampling main frame for the 2015 In-Depth Vulnerability and
Assessment Survey. The SEAs were the primary sampling units for the survey.
2.2.3. Sample allocation
The survey targeted forty-eight (48) districts in eight (8) provinces. Provision of precise
survey estimates for each district required that samples of adequate sizes be allocated to
each district. Since it was desired that estimates from each district have the same level of
precision, an equal allocation was the most efficient strategy.
Therefore, an equal sample of 15 clusters or 150 households was allocated to each of the
forty-eight (48) districts.
2.2.4. Sampling Method
The 2015 In-Depth Vulnerability and Assessment Survey employed probability sampling
procedures. A two-stage stratified cluster sample design was used. In the first stage, 15
SEAs were selected using the Probability Proportional to Estimated Size (PPES)
procedure. During the second stage, 10 households were randomly selected from each
enumeration area. Random does not in any way imply haphazard; rather it means that
each possible household had an equal chance of being selected.

19
2.2.5. Sample Size
A total of 6, 906 households in 609 SEAs were covered in the 48 districts with an
estimated population of 5,140,795 people.
2.2.6. Weighting Procedure
Sampling weights are needed to compensate for unequal selection probabilities, non-
coverage, non-response, and for known differences between the sample and the reference
population. Thus sample weights act as boosting factors to represent the number of units
in the survey population that are accounted for by the sample unit to which the weight is
assigned.
2.2.7. Base Weights
The first type of weight that is normally calculated is the design weight, also known as
base weight. Construction of the base weights for the sampled units corrects for their
unequal probabilities of selection. The base weight of a sampled unit is the number of
units in the population that are represented by the sampled unit for purposes of estimation
(UNSTATS, 2005). It is derived as a reciprocal of the probability of selection for
inclusion in the sample.
Since a two-stage sample design was used for the 2015 In-Depth Vulnerability and
Assessment Survey, the base weights were constructed to reflect the probabilities of
selection at each stage.
a) Probability of selecting a primary sampling unit (1st Stage).
The primary sampling unit for the survey was a SEA. Its probability of selection is
given by;
Where:
Ph= probability of selection for the i-th sampled EA in district h
mh= number of sample EAs selected in district h.
Nhi= total number of households for the i-th sampled EA in district h.
Nh= total number of households in district h.
b) Probability of selecting a household (2nd Stage)
The probability of selecting a household was given by;
Where:

20
Phi= probability of selection for the i-th sampled household in SEA h
mh= number of households selected in SEA h.
Nhi= total number of households for the SEA h.
c) Overall probability of selecting a household
The overall probability of selecting a household is given as the product of the
probabilities of selection at the first and second stages of selection. The formula is
given below;
Therefore, the base weight was calculated as below;
2.2.8. Reliability of Estimates
Reliability of estimates in the 2015 In-Depth Vulnerability and Assessment Survey was
affected by both sampling and non-sampling errors.
To reduce sampling errors, a sufficient sample size was determined for this survey.
Sampling errors were further minimized by using a stratified sample design. The sample
was explicitly stratified into 48 strata and implicit stratification was provided ordering or
sorting the list of SEAs for each strata.
Non-sampling errors may have arisen from many factors at all stages of data collection
and processing. These include errors resulting from;
Respondents misunderstanding the questions
Incorrect presentation of the questions
Question specific non-response;
Errors in data entry, and
Errors during coding.
Sampling error is the part of the difference between a population value and an estimate thereof, derived from a random sample, which is due to the fact that only a sample of values is observed. Sampling errors arise from the fact that not all units of the targeted population are enumerated, but only a sample of them. Therefore, the information collected on the units in the sample may not perfectly reflect the information which could have been collected on the whole population. The difference is the sampling error. EUROSTAT
Non-Sampling error is an error in sample estimates which cannot be attributed to sampling fluctuations. Non-sampling errors may arise from many different sources such as defects in the frame, faulty demarcation of sample units, defects in the selection of sample units, mistakes in the collection of data due to personal variations or misunderstanding or bias or negligence or dishonesty on the part of the investigator or of the interviewer, mistakes at the stage of the processing of the data, etc. OECD

21
The report therefore contains no quantitative assessments of these errors. Although it was
not possible to eliminate all sources of error, a high level of control on all known sources
of error was done efficiently and effectively in planning and conducting the survey.
Below are the key steps that were taken to minimize or control non-sampling errors
during the survey:
The most recent sampling frame, based on the 2010 Census of Population and
Housing was used.
Thoroughly testing questionnaires before being used in the field.
Non-responding households were followed up to achieve high response rates.
High quality editing and cleaning procedures were employed in processing the
data.
International standard procedures and processes were employed at all stages of the
survey process.
2.3. Food Needs Computation
Determining the Food Insecure Districts and Number of persons in Need
In determining the food insecure districts, a composite indicator combining Food
Consumption Score (FCS), Expenditure Share on food and coping behaviour was utilized.
The cut – offs used are in line with the Consolidated Approach for Reporting Food
Security Indicators (CARI).
To determine the amount of maize equivalent required by affected persons largely, the
formula below was used;
Where:
F = Total Maize Equivalent required in Metric Tonnes
N = Total number of the affected persons
R = Individual ration size per Kilogram per month (250 grammes per person per day)
M = Recommended number of months for the food

22
CHAPTER THREE: CONTEXT
3.1. The Economy
The country's economy in 2014 remained stable with real GDP growth rate of 6 percent.
This growth is consistent with the vision 2030 of becoming a middle income prosperous
nation. Investment in the mining sector continued to drive other sectors especially
construction, transport and energy. According to the 2013 Economic report, the economy
is expected to grow by 5.8 percent in 2015 and while 6.4 percent in 2016. Despite robust
economic performance, poverty remained high at over 60 percent with some
improvements in urban areas.
Zambia amended its corporate tax rates for mining firms in 2015 from 20 percent to 9
percent. This means that a roll-back in tax rates is expected to cost US$310 million and
government expects to offset this income reduction by cutting expenditure and external
borrowing.
The country's monetary policy focused on sustaining stability by maintaining single digit
inflation while ensuring adequate liquidity for the growing economy. The country's
inflation rate experienced a decline from last year with 7.9 percent in May, 2014 to 6.9
percent in May, 2015. The decline is due to the decreases in non-food items mainly
purchase motor vehicles and air fares. Annual food inflation decreased from 8.0 percent
in May 2014 to 7.2 percent in May, 2015. The increase was due to increases in the prices
of vegetables.
In terms of the exchange rate, the country experienced a rapid depreciation of the Kwacha
against major currencies, reaching a high of K7 per US dollar in May, 2014. This has not
changed much during May, 2015 with the exchange rate being at K7.1 per dollar. The
unemployment rate has reduced from 19 percent in 2012 to 15 percent in 2015.
3.2. Agriculture and Food Security
The Zambian government has placed agriculture as one of the key priority sectors that can
make significant contribution to sustainable economic growth and poverty reduction. In
this regard, a number of initiatives are being implemented. The sector is given this pre-
eminence because 60 percent of the population derives its livelihood from agriculture. In
addition, the country is endowed with abundant natural resources such as arable land and
adequate water bodies, forming a basis for a viable sector.
In order to fully exploit this agricultural potential, Zambia has developed well articulated
agricultural policies and strategies which emphasize on objectives such as attainment of
food security, maximizing farmers’ incomes, promoting sustainable agriculture, and
enhancing private sector roles in input and output markets. The National Agriculture
Investment Plan (NAIP, 2013) emphasizes liberalization, commercialization, and
promotion of public – private partnerships and provision of effective agricultural services
that ensures sustainable agricultural growth. To strengthen agricultural policy further, the

23
National Agricultural Policy has been reviewed to support the implementation of the
National Agricultural Investment Plan (NAIP).
However, past and present agricultural policies have tended to promote maize production
at the expense of other crops and agricultural related enterprises. This has led to majority
of small – scale farmers venturing in mainly only one enterprise thereby increasing their
exposure to the risk of crop failure due to negative impacts of climate change. Further, the
small – scale farmers rely heavily on rain-fed agriculture and cultivate mostly less than
two hectares which heightens their exposure to crop failure.
Despite the agricultural sector recording increased investments exceeding the ten (10)
percent CAADP threshold, sixty (60) percent of the investments in the sector goes to
support two programs namely; the Farmers Input Support Program and Food Reserve
Agency. This leaves a paltry forty (40) percent to support other programs such as
Research, Extension, Crop production and diversification, Irrigation, Livestock and
Fisheries which are the key drivers of the sector. This has led to low output from
Research and Development, expensive and limited uptake of appropriate technologies for
small – scale farmers leading to low production and productivity as well as utilization of
inappropriate and expensive breeding stock. The area under irrigation still remains low
with majority of smallholders not able to afford irrigation technologies. Investment in
value addition especially at the farm household level has also eluded the sector. This has
had a negative impact on household incomes, food security and nutrition. The situation is
worsened by the lack of essential infrastructure leading to post harvest losses and failure
to connect to main markets.
The Government has however put in place a number of initiatives to counteract this
situation and build resilience at the household level. The Government intends to redesign
the Farmer Input Support Programme (FISP), strengthen research, invest in irrigation,
rehabilitate and develop rural infrastructure, reform the agricultural marketing system,
promote crop diversification and value addition. In an effort to improve smallholder
productivity and production, Government has continued to support farmers through the
Farmer Input Support Programme (FISP). During the 2014/2015 farming season, a total
number of 900,000 farmers was targeted with each beneficiary getting four (4) bags of
fertilizer and 10kg of maize seed. In addition 12,700 farmers were targeted for the rice
pack, 23,820 for sorghum and 67,855 farmers were targeted for the groundnut packs.
To improve livestock and fisheries governance, the Government is developing the two
policy documents for livestock and fisheries policies respectively. To combat micro-
nutrient deficiency particularly in children and women of the child bearing age,
government has developed nutrient- dense crops (such as Orange Maize, Orange Fleshed
Sweet potatoes, and iron/zinc beans) through bio-fortification.
Furthermore, Government realizes that hazards such as prolonged dry spells will be
worsened by climate change and thus to counter its effects, adaptation programmes such
as promotion of conservation agriculture, livelihoods diversification and provision of
water harvesting infrastructure have been put in place.

24
In tackling these hindrances to increased agricultural contribution to the country’s growth,
the Government hopes to ensure that benefits of improved agricultural output reach the
poorest rural households and consequently the country at large will begin to register
reductions in the current poverty levels.
Government through the Food Reserve Agency (FRA) maintains the Strategic Food
Reserve to cover for three months of national consumption. In addition to this role, the
FRA is a major player in maize marketing. In the current marketing year, FRA has
targeted to purchase 500,000 MT of maize from small scale farmers residing mainly in
outlying areas.
Crop Production, Food Supply and Access
Maize continued to rank very high in the country’s crop performance with area put under
the crop increasing by 5.3 percent during the 2014/2015 production season. The
production levels of other crops have remained comparatively low. During the 2014/2015
season, production was mixed with some crops recording significant increases while
others experienced notable drops. Due to the extended dry spells experienced in the
southern half of the country during the growing season, official production estimates from
the Ministry of Agriculture and Livestock show a significant drop (22 percent) in maize
production. This has been partly attributed to poor productivity levels among small –
scale farmers and also due to wilting of the crop due to the prolonged dry spells
experienced during the season. According to official government estimates, maize
production for the 2014/2015 production season has been pegged at 2.62 million MT.
The erratic rainfall experienced in the country resulted in a reduction in the area harvested
for maize in almost all the provinces. Although the impact on crops was severe in the
southern half, the effects of the deficit will be masked by the good levels of carry – over
stocks. Similar to maize, rice output for the 2014/2015 production season has been
estimated to decline by as much as 48.6 percent with respect to the previous season.
Figure 3 : Maize Production by Province for the 2013/14 and 2014/15 Seasons
-
100,000
200,000
300,000
400,000
500,000
600,000
700,000
800,000
Maize Production by Province for the 2013/14 and 2014/15 Season
2013/ 2014 Production (MT) 2014/ 2015 Production (MT)

25
A quick analysis of production for the last two production seasons (figure 3) shows that
Central, Copperbelt, Eastern, Lusaka, Southern and Western Provinces are likely to have
localized food insecurity.
National Food Supply for the 2014/2015 Season
The National Food Balance sheet for the 2015/2016 marketing season released by the
Ministry of Agriculture and Livestock (MAL) shows that the country has produced more
than sufficient maize to meet the total national requirement. National maize production
has been estimated at 2, 618, 401MT, while the unusually large carryover stock stands at
1, 345, 401 MT giving a total maize availability of 3,963,622MT. The country’s total
requirement stands at 3, 086, 854 MT implying that Zambia has a maize surplus of 876,
768 MT which will be available for export. Table 2: National Food Balance Sheet for Zambia for the 2015/2016 Agricultural Marketing Season
Maize
Paddy
rice
Wheat
(Preli
minar
y)
Sorghu
m &
Millet
Sweet and
Irish
potatoes
Cassava
flour
Total
(maize
equivalent)
A. Availability:
(i) Opening stocks (1st May
2015)
1,345,401 2,239 56,690 6,625 0 12 1,409,887
(ii) Total production (2014/15)
2,618,221 25,514 N/A 65,000 164,232 952,847 3,853,399
Total availability 3,963,622 27,753 N/A 71,625 164,232 952,859 5,263,286
B. Requirements:
(i) Staple food requirements:
Human consumption
1,501,896 58,477 65,911 156,020 793,392 2,727,913
Strategic Reserve Stocks (net)
500,000 0 0 0 0 500,000
(ii) Industrial requirements:
Stockfeed
245,630 0 0 0 0 245,630
Breweries
110,000 0 0 0 0 110,000
Grain retained for other uses
40,000 3,000 2,464 0 0 45,306
(iii) Losses
130,911 1,276 3,250 8,212 47,642 192,670
(iv) Structural cross-border
trade
200,000 200,000
(v) Existing FRA Export
Commitments 358,417
Total requirements 3,086,854 62,753 71,625 164,232 841,034 4,021,518
C. Surplus/deficit (A-B)
876,768
-
35,000 0 0 111,825 883,351
D. Potential Commercial exports
-876,768 35,000 0 0 0 0
E. Food aid import requirements
0 0 0 0 0 0 0
Source: MAL
Similar to past years, sorghum, millet and cassava are expected to be adequately available
to meet domestic requirements this year while an estimated 12,583MT of rice imports
will be needed to meet the national shortfall.

26
Food Access
The food security situation during the 2015/ 2016 marketing and consumption period for
the country is projected to remain stable due to previous successive years of surplus
production. However, decline in rice, soya beans, sweet potatoes and groundnuts
production coupled with high demand for maize in the region may affect access of these
food stuffs at household level. At national level, there are adequate food supplies to meet
the dietary needs of the majority of the people though this may be a challenge for
household food security. This phenomenon will however, be cushioned by surplus food
production from the Northern half of the country. The prices for staple food have
remained stable in the last twelve months guaranteeing accessibility by all people at all
times. Even if food will be relatively accessible on the market, people will have to walk
long distances to purchase the staple food due to decreased crop production. This will
eventually lead to high demand for cereals in areas that experienced prolonged dry spells
during the 2014/ 2015 season. Government through the Food Reserve Agency and private
sector will be expected to play a critical role in purchasing and selling cereals closer to
the affected communities. Further, food access may be affected by increased prices in
food commodities as majority of the rural households will have inadequate income to
meet their daily food requirements.
Livestock Situation
Livestock production continues to be a major livelihood among small scale farmers in
many parts of the country. The production of major livestock such as cattle, goats and
pigs is concentrated in three provinces, namely Central, Southern and Western Provinces.
Based on the Ministry of Agriculture and Livestock statistics, cattle have the largest share
of the major livestock population at 55%, with goats at 35% while pigs make up only
10%. In the past number of years, cattle production has severely been disrupted by
recurring disease outbreaks, with the common ones being Foot and Mouth Disease
(FMD), East Coast Fever, Contagious Bovine Pleuro-pneumonia (CBPP) and Anthrax.
The FMD is endemic in Sesheke (Western Province), Kazungula (Southern Province),
Mbala and Nakonde (Northern Province), but in 2004 spread to parts of Central and other
districts in Southern Province. CBPP is endemic in some areas of Western Province,
North- western, Southern (Kazungula) and extreme Northern Province Districts. East
Coast Fever areas include Eastern, Southern, Central, Lusaka and Northern Provinces
while outbreaks of Anthrax are mostly confined to Western Province. Last year, the
country also experienced sporadic outbreaks of African Swine fever in Copperbelt,
Eastern, Lusaka, North Western and Southern provinces. Under normal circumstances, in
these farming systems, livestock acts as some form of insurance against poor weather and
subsequent crop failure while also providing the farmers with income during difficult
times.

27
3.3 Health
Zambia recognizes health as one of the priority sectors that contribute to the well-being of
the nation and, therefore, remains committed to providing quality health services to all its
citizens. Recognizing that a healthy population is critical to improved production and
productivity, Zambia will continue investing in the health sector, in order to ensure
sustainability of the nation’s human capital base, required for sustainable economic
growth.
The Zambian government is implementing wide-ranging health sector reforms, aimed at
attaining equity of access to assured cost-effective quality health services, as close to the
family as possible. These reforms are based on a system of health sector plans.
The health sector plans and documents seek to provide the strategic framework for the
efficient and effective organization, coordination and management of the health sector in
Zambia. This is aimed at improving the health status of the Zambian population, in line
with the national, regional and global health objectives and targets, particularly the Vision
2030 for Zambia and the health related Millennium Development Goals (MDGs).
Zambia has a high burden of disease, which is mainly characterized by high prevalence
and impact of communicable diseases, particularly, malaria, HIV and AIDS, STIs, and
TB, and high maternal, neonatal and child morbidities and mortalities. The country is
also faced with a rapidly rising burden of non-communicable diseases, including mental
health, diabetes, cardio-vesicular diseases and violence.
The country is also faced with a high burden of Maternal, Neonatal and Child Health
(MNCH) problems, and a growing problem of Non-Communicable Diseases (NCDs),
including mental health, cancers, sickle cell anaemia, diabetes mellitus, hypertension and
heart diseases, chronic respiratory disease, blindness and eye refractive defects, and moral
health problems. Currently, the top 10 causes of morbidity and mortality in Zambia
include malaria, respiratory infections (non-pneumonia), diarrhoea (non-blood), trauma
(accidents, injuries, wounds and burns), eye infections, skin infections, respiratory
infections (pneumonia), ear, nose and throat infections, intestinal worms and anaemia.
The country is also faced with the high burden of the HIV&AIDS epidemic, which has
significantly impacted on the morbidity and mortality levels across the country.
The health of individuals and communities is, to a large extent, determined by the
environments and circumstances in which they live and operate. These factors are
commonly referred to as the determinants of health and include: the social and economic
environment; the physical environment; and the person’s individual characteristics,
behaviour and circumstances. Even though most of these factors are beyond the normal
scope of the health sector, it is the responsibility of the health sector to ensure that such
factors are considered and included in the health sector and national development agenda,
in order to promote good health and quality of life of the population. In Zambia, the key
determinants of health manifest differently and contribute to the high burden of disease.
Water and Sanitation which is poor access to safe water and good sanitation, poor
housing and unsafe food has continued to drive various diseases. Limited access to water
and sanitation facilities accompanied by poor hygiene is associated with skin diseases,

28
acute respiratory infections (ARIs), and diarrhoeal diseases, the leading preventable
diseases. ARI and diarrhoeal diseases are among the leading causes of child deaths in
Zambia (MoH, 2012).The Zambia Demographic and Health Survey 2013-14 (ZDHS
2013-14) indicates that only 64.5percent of the households in Zambia have access to
improved sources of water. Households in urban areas are more likely to have access to
improved sources of water than those in rural areas (89.5percent compared with
46.6percent). Overall, 54 percent of households in Zambia have no toilet facilities. This
problem is more common in rural areas (74.2percent) than in urban areas (27percent).
Climate change is also another major global threat to health, and is becoming a major
problem for Zambia. Therefore, the Zambia government recognises the need to harmonise
the different sectoral development strategies, through a National Climate Change
Response Strategy.
This plan for mitigating the impacts of several climatic and variable conditions will take
the preventive, promotive and treatment approach to address both anticipated conditions
when water is scarce and treat conditions existing in the population, including health
promotion to address life style/behaviour which facilitates disease transmission.
Therefore it’s a three tier plan to reduce further vulnerability of the populations already
affected by weather events in the 2014/2015 rainy season and beyond.
As a general rule, the risk of epidemic after a disaster is related to the endemic levels of
diseases in the population. These include diarrhea and dysentery, cholera, measles,
whooping cough, meningococcal meningitis, tuberculosis, malaria, intestinal parasites,
scabies and other skin diseases, louse borne typhus and relapsing fever. Broadly these are
water washed, water borne and water related diseases.
3.4 Nutrition
Adequate nutrition is the pillar of any economic developmental programme for a country.
Under malnutrition is an intense global problem that has been made worse by high levels
of poverty which has depleted poor’s ability to access resources that can help them access
adequate diets. As a result, under nutrition has become evident in most countries though
over nutrition has currently become a measure of public health problems. High levels of
malnutrition, particularly under-nutrition which includes stunting, wasting, underweight
and micronutrient deficiencies among children under five years and women of child
bearing age hold back the country's socio-economic development and potential to reduce
poverty.
Stunting
Stunting prevalence of 40 percent among children under -five years of age in Zambia is
closer to the African average level of 42percent1. Stunting among Zambian children starts
in early months, rapidly increases after six months of age and reaches the pick of 59
percent at 18 to 23 months of age, then declines to 40percent among 24 to 59 months old
1 National Food and Nutrition Commission (NFNC). (2011). Food and Nutrition Strategic Plan 2013-2016. NFNC, Lusaka

29
children. This trend is due to poor quality of complementary feeds provided to the
children after 6 months of age2.
Under weight
The ZDHS 2013-2014 shows that the prevalence of underweight among children under
five years of age in Zambia has decreased from 25 percent in 1992 to 15 percent in 2014.
The proportion of underweight children reaches its highest peak among children aged 18-
23 months (18 percent) then reduces after 23 months.
Wasting
According to the ZHDS 2013-2014, Zambia has consistently maintained the wasting
levels among children under five between 5 and 6 percent from1992 to 2014 period which
shows a peak at 9 to 11 months of age. Wasting prevalence in Zambia varies slightly
between urban (4 percent) and rural children (6 percent) DHS.
Under nutrition among women
Wasting among women of child bearing age in Zambia has been evident among 10
percent of the women in the country from 2007 to 2014, however ZDHS (2013-2014)
shows that overweight among the women has increased from 12 percent in 1992 to 23
percent in 2014.
Maternal and child under nutrition are caused by multiple factors, and addressing the
problems therefore requires the collaboration between a wide range of actors from
different sectors, working at all levels from community to national level3.
Micronutrient malnutrition
In Zambia, micronutrient deficiencies are highly prevalent among infants and young
children aged 6-24 months and pregnant and lactating women. The most common
micronutrient deficiencies’ includes Vitamin A, iron, and zinc. The 2003 survey on
micronutrient malnutrition showed that 53.3 percent of children and 13.4 percent of
women were deficient. In terms of iron deficiency anemia, this remains a major public
health concern. Prevalence of anemia was 53 percent among under-five children. The
recent survey done in Nyimba and Mkushi consistently showed 57 percent of the children
24 to 59 months were Vitamin A deficient4.
Causes of poor nutritional status in Zambia
The causes of malnutrition are multifaceted and affect all the sectors of the economy as
explained in the UNICEF conceptual frame work. The framework shows that causes of
malnutrition are grouped in immediate, underlying and basic causes. The immediate
causes include inadequate dietary intake and disease, the underlying include household
2Central Statistical Office (CSO) [Zambia], Ministry of Health (MOH) [Zambia], and ICF International.
2014.
Zambia Demographic and Health Survey 2013-14. Rockville, Maryland, USA: Central Statistical Office,
Ministry of Health, and ICF International. 3 National Food and Nutrition Commission (NFNC). (2011). National Food and Nutrition strategic plan for
Zambia 2011-2015. NFNC, Zambia. 4 NFNC, TDRC &Harvest plus. (2011). Nutrition Survey in Central and Eastern Province, Zambia 2009.
Focus on Vitamin A and Maize intake & Vitamin A status among Children and Women.

30
food insecurity, inadequate care for women and children, unhealthy household
environments and lack of health services. The root causes mainly apply to political issues,
infrastructures and social and political norms and traditions that the populations adhere to.
The Zambian diet has an over-reliance on maize which is not only insufficient to fulfill
energy needs and diversity but also not able to meet adequate quantity and quality of
protein and micronutrient. A study by NFNC5showed that rural areas could only consume
4 out of the 13 food groups depicting poor diet diversity. In addition, the Zambian diet is
mainly vegetarian. Study results show that 27 percent to 65 percent of the population
cannot afford a minimum cost of a nutritionally adequate diet. Further, the increased
disease burden in the community affects the consumption and causes the loss of essential
micronutrient in the body contributing to under nutrition.
Current interventions to address under nutrition
The Zambian government has prioritized addressing malnutrition through its food and
nutrition policy of 2006 and the subsequent policy implementation plan and the food and
nutrition strategic plan of 2011 to 2015. The NFNC in collaboration with partners
developed a three year multi-sectoral programme, focused on the First 1000 Most Critical
Days Program (MCDP), for all funding and implementing partners. Some of the strategies
in this document include reduction of stunting among children under the age of three
years through the 1000 MCDP. The programme contains a package of interventions that
has scientific proof of reducing malnutrition in other countries. Therefore, partners have
come together to mobilize resources for the implementation of these interventions across
all the key sectors dealing with food and nutrition6.
3.5. Water and Sanitation
At the beginning of the 21st century, almost two billion people – a third of the world’s
population – were affected by natural disasters, and 86 percent of these disasters were
floods and droughts. Those affected by emergencies often suffer from malnutrition,
injuries, stress and other ailments. Having inadequate water and/or sanitation can lead to
increased instances of diseases and death, and a lack of hygiene can contribute to
diarrhea, dysentery, typhoid, cholera, measles, scurvy, and other hygiene-related disease
outbreaks in emergencies – all preventable with the right resources and awareness. In
addition, lack of WASH facilities can prevent learners from attending school, impose a
burden on women and children, and diminish productivity. For this reason, water,
sanitation and hygiene are often among the most important elements not only in
humanitarian disasters but also in development implementation.
Water, Sanitation and Hygiene (WASH) are key components in all aspects of sustainable
development. The country’s vision for water as reflected in the Revised Sixth National
Development Plan (R-SNDP, 2013-2016) is to ensure that all Zambians access safe water
and sanitation as well as efficient and sustainable water utilization for wealth creation and
betterment of livelihoods by 2030. Access to WASH is a key public health and
socioeconomic issue, especially in many rural districts and peri-urban areas in the
5NFNC. (2009) National Nutrition Surveillance System. NFNC, Lusaka Zambia 6NFNC (2012). The first 1000 Most Critical Days Programme, three Year Programme 2013 to 2015, Based
on the strategic Direction one: Prevention of stunting in Children less than Two years of age in the National
Food and Nutrition strategic Plan (NFNSP 2011 to 2015).

31
country. The Revised Sixth National Development Plan has identified WASH as an area
with great potential to improve health, life-expectancy, student learning, gender equality,
and many other key issues of development. Access to safe water, adequate sanitation, and
proper hygiene education can reduce illness and death, and also enhance poverty
reduction and socioeconomic development.
The Current Situation and Challenges
Currently, the water resources development and management is implemented through the
Ministry of Mines, Energy and Water Development based on the National Water Policy
of 2010 and the Water Resources Management Act of 2010. Water supply and sanitation
provision is implemented by the Ministry of Local Government and Housing (MLGH)
through commercial utilities in the urban and peri-urban areas and through the Local
Authorities in rural areas guided by the national water policy and the Water Supply and
Sanitation Act No. 28 of 1997. The sector has prioritized infrastructure development in
rural areas in order to improve the livelihood of the rural population where the majority of
the poor live. The sector is also developing the National Water Supply and Sanitation
Policy that will facilitate effective development and management of the water supply,
sanitation and solid waste subsector in Zambia. The Water Supply and Sanitation Act No.
28 of 1997 will also be reviewed.
The 2013-2014 ZDHS states that the Percentage of population using an improved
drinking water source at national level is at 89.2 percent for rural is 46.9 percent and
urban is 63.1 percent. The Percentage of population with access to improved sanitation at
national level is at 39.2 percent for rural is 19.7 percent and urban is 27.3 percent. Though
there have been improvement in the WASH coverage. it has not been sufficient progress
to meet the MDGs by 2015. The current deficiencies in WASH services provision result
from inadequate investment in the water sector; limited institutional and human capacity;
and natural hazards such as flood and prolonged dry spells (or drought) which occur
yearly either combined or individually with varying severity. The sector is also faced with
the challenge of climate change and variability resulting in increased atmospheric
temperature and difficulty in predicting rainfall and related events such as flood and
drought. For instance, during the 2013/2014 rainy season, flood was the prominent hazard
affecting 33 districts while in the 2014/2015 rainy season, prolonged dry spell was the
main hazard affecting 48 districts.
The WASH solutions
From 2013 to 2016, the sector is progressively implementing WASH infrastructural
development and management programmes outlined in the Revised SNDP and the
Integrated Water Resources Management and Water Efficiency (IWRM/WE)
Implementation Plan (2007 to 2030) in order to realise the 2030 vision of clean and safe
water supply and sanitation for all (target 100 percent for water and 90 percent for
sanitation). Thus the various infrastructural and management projects and programmes in
the water sector embarked on by GRZ and stakeholders are inherently targeted at
addressing the above mentioned challenges and others including inadequate water

32
supplies to meet various needs, pollution, inadequate information for decision making,
inefficient use of the water resource and limited stakeholder awareness and participation.
In order to achieve the set targets both in water resources development and management
and in water supply and sanitation, the government through the revised SNDP has
projected investment in Water and Sanitation Infrastructure development for the period
2013 to 2016 as shown in the table below:
Table 3: Projected funds for investment in WASH infrastructure
2013 2014 2015 2016
Sub-sector Cost
K’millions
Cost
K’millions
Cost
K’millions
Cost
K’millions
Water Resources
Development and
Management
587.0 712.0 698.6 692.7
Water Supply and
Sanitation
810.1 1,731.1 1,892.0 1,408.5
Source: Revised SNDP, 2013
Diarrhoea diseases are endemic in 26 districts mainly in Luapula, Northern, Southern,
Lusaka, Central and Copperbelt Provinces; outbreaks start just before the rainy season
(water scarcity obliging some communities to use alternative unsafe water sources) and
spreads with the rains; interestingly, health authorities report less cases (or no more cases)
in endemic areas where CLTS has been rolled out (i.e. Chiengi and other districts in
Luapula).
The top priorities for WASH elements in
emergency response is providing sufficient
quantities of safe water, arrangement of basic
sanitation, and promoting good hygiene
behaviour. Responses range from rapid and
limited interventions in short-term emergencies to
comprehensive long-term interventions including
dam building and borehole (provision to
development). Urgent WASH services include providing hygienic sanitation facilities,
protecting water supplies from contamination, repairing broken down water supply
systems, water tracking, providing water that is safe for cooking and other essential
hygiene purposes, ensuring that people have containers to obtain and store water cleanly,
and distributing soap, water purification tablets and family water kits, and education and
awareness surrounding proper hygienic habits in emergencies.

33
CHAPTER FOUR: FINDINGS
4.1 General Demographics
This section covers aspects relating to gender status, age and marital status of the
household heads. Further this section brings out relating to education level and
employment status. Household size and dependence ratio are also discussed.
The 2015 In-depth Vulnerability and Needs Assessment was mainly rural based with 92
percent of the households residing there. The assessment has also shown that the majority
of those assessed are male headed households (74 percent) while the rest were female
headed. The age of the majority (30 percent) of the household heads assessed ranged
between 29 - 39 years age bracket followed by those in the range of 40 - 50 page at 22
percent and those in the range of 51 - 61 were 15 percent. The households headed by
elderly people of 61 years and above made up 16 percent of the assessed households. The
assessment found that child headed households were insignificant (0.3 percent).
In terms of marital status, the majority (78 percent) of the household heads in the
surveyed districts were married, 11 percent widowed, 5 percent single while the rest were
either divorced or separated.
On Educational level of the household head, the majority of the heads (53 percent) in the
assessed areas had at least primary education. Furthermore, 25 percent of the household
heads indicated having reached up to secondary with only 5 percent indicating they
attained tertiary. The rest of the household heads indicated not have been to any formal
education.
The assessment indicated that the majority (32 percent) of the households had 5-6
household members followed by 30 percent indicated having 3-4 household members.
Further, 19 percent of households indicating 7 - 8 household members. Household size
ranges of 1-2 and 9-10 accounted for 8 percent. Only 4 percent indicated household size
of over 10 household members. The survey further indicated that most of the households
are keeping orphans with the majority being single orphans (27 percent). Double orphans
only accounted for 1 percent.
Most of the household interviewed were informally employed (50 percent) followed by
those who were unemployed (38 percent). The rest were formally employed. The
employment status given indicates that most of these households were involved in some
form of income generating activity which is a good indicator for withstanding shocks.
In terms of household head having chronic illness and disability, the percentages were not
significant (2.5 percent and 1.4 percent, respectively).

34
4.2. Vulnerability and Hazards
The 2014/ 2015 In-depth Vulnerability and Needs Assessment indicated that most of the
households in the rural areas were affected by prolonged dry spells coupled with poor
rainfall distribution in different parts of the country. The hazard that affected these rural
households differed from district to district and household to household. The survey
revealed that 87.6 percent of the communities interviewed indicated that they were
severely affected by the prolonged dry spells while 11.4 percent were moderately affected
by the same hazard. The Survey further shows that the districts that were highly impacted
included Sesheke, Kaoma, Kalabo, Gwembe, Katete and Chadiza while the rest were
moderately affected. In terms of the mitigation measures that were put in place to
minimize the impact of the dry spells, the majority (18. 5 percent) of the households did
nothing, 14.5 percent engaged in trading, 10. 6 percent were engaged in piece work, while
9.8 percent diversified their crops and the rest employed other mitigation measures.
4.3. Early Warning
The assessment established that 46 percent of the households in the assessed districts
were warned about the impending prolonged dry spell. This was an improvement
compared to previous assessments that have been done. The assessment also established
that 23 percent of the household received these messages through radio. Other modes
used included flyers (15 percent) and television (8 percent) .The main source of
information was Zambia Meteorological Department (30 percent), the District Disaster
Management Committees (17 percent) and ZESCO (13percent).
4.4. Livelihoods
The main livelihoods for most people in the assessed districts has remained farming,
trading, agriculture wage labour, skilled trade, non-agricultural wage labour and
remiattances. A few households had pension and money lending of of their main
livelihood activities.
A comparative analysis between 2014 and 2015 has shown that there is a slight reduction
Figure 4 : Livelihood Sources by Gender

35
in the proportion of households whose livelihood sources are farming (from 58.5 percent
to 55.8 percent), agriculture wage labour (8.9 percent to 8.8 percent) and formal
employment (from 6.1 percent to 5.7 percent) .
The reduction in the first two livelihood sources can be attributed to the negative impact
the prolonged dry spells had on agriculture in general. Slight improvements were equally
observed in Non-agriculture wage labour, skilled artisan, brewing and irregular daily
employee.
Figure 5: Alternative Livelihood Sources
This increase was also attributed to affected households having increased the focus of
their well-being on alternative livelihood sources mentioned above.Further, analysis on
the main livelihoods across the gender status of the household heads showed that majority
of the female headed households depended on money lending (58.6 percent), brewing
(52.2 percent), remittance (52 percent), agriculture wage labour and formal employment
(50.3 percent) as the main livelihood sources. On the contrary, the the male headed
households depended more on artisan/skilled trade (52.6 percent), pension (52.1 percent),
irregular daily employee (50.9 percent), non-agriculture wage labour (50.8 percent) and
farming (50.8 percent).(Figure 5)
The assessment findings showed that family size did play a role on the diversity of main
livelihood sources households had, a phenomenon which is consistent with previous
vulnerability needs assessments and the 2010 Living Conditions Monitoring Survey. In
view of this, households that had family size of 1 to 2 persons depended more on
livelihood sources which were not that sustainable such as remittances (8.9 percent),
pension (5.6 percent) and irregular daily employee (3.3 percent). Consequently those that
had family size of 2 to 3 equally depended on similar livelihood sources but also included
brewing (25.9 percent), agriculture wage labour (24.3 percent) and pension (21.4
percent). It is worth noting that the majority of households with smaller family sizes that

36
Figure 6: Asset Wealth Index – 2014 and 2015
Figure 6: Asset Wealth Index - 2014 and 2015
: Asset Wealth Index: 2014 and 2015
depended on these unviable livelihood sources were female headed and had family sizes
of 1 to 2 and 3 to 4 persons, which accounted for 51.1 percent and 50.6 percent that
respectively.
Detailed discussion of the results of the livelihood components (asset ownership,
expenditure share, coping strategies and food consumption) has been provided below:
Asset Ownership
Asset ownership does form part of the the wealth determinants in any given context. This
is key in understanding the general welfare of households. The prolonged dry spells of
2014-2015 rainfall season did affect the utilization of the broader range of assets such as
Natural – Water Resources, Grazingland and Fish, Physical - farm equipment, tools,
sewing machines, vehicles, livestock, houses, Human - labor power availability within a
household, education and to some extent skills, Financial -wages, access to credit and
savingsandSocial -,
neighborhood associations and
networks. It is worth noting that
for the 2014-2015 impact
assessment report, the analysis on
assets focused only on physical
assets excluding livestock and
housing.
Majority (54 percent) of the
households assessed were Asset
Medium, 42 percent were Asset
Poor while the rest were Asset Rich.
The mean number of assets owned by a household in the forty eight (48) districts assessed
was five (5) and this number remained consistence for 2014 and 2015 respectively. The
analysis results showed marked variances in the number of assets owned across gender
status, education level and marital status of the head of households. In this regard, the
results showed that the mean number of assets owned by male headed households was six
(6) compared to 4 for the female headed households. Further, from the education level
perspective for the head of household, the results showed those that attained high
education level had more assets owned comapred to those that had never been to school
(4) or only attained primary school level (5 ). For the ones that attained either secondary
and tertiary education level, the mean number of assets they owned was 6. Suffice to
mention despite the small differences in the mean numbers of assets across the education
level strata, they were statistically signifincant (P<0.05).
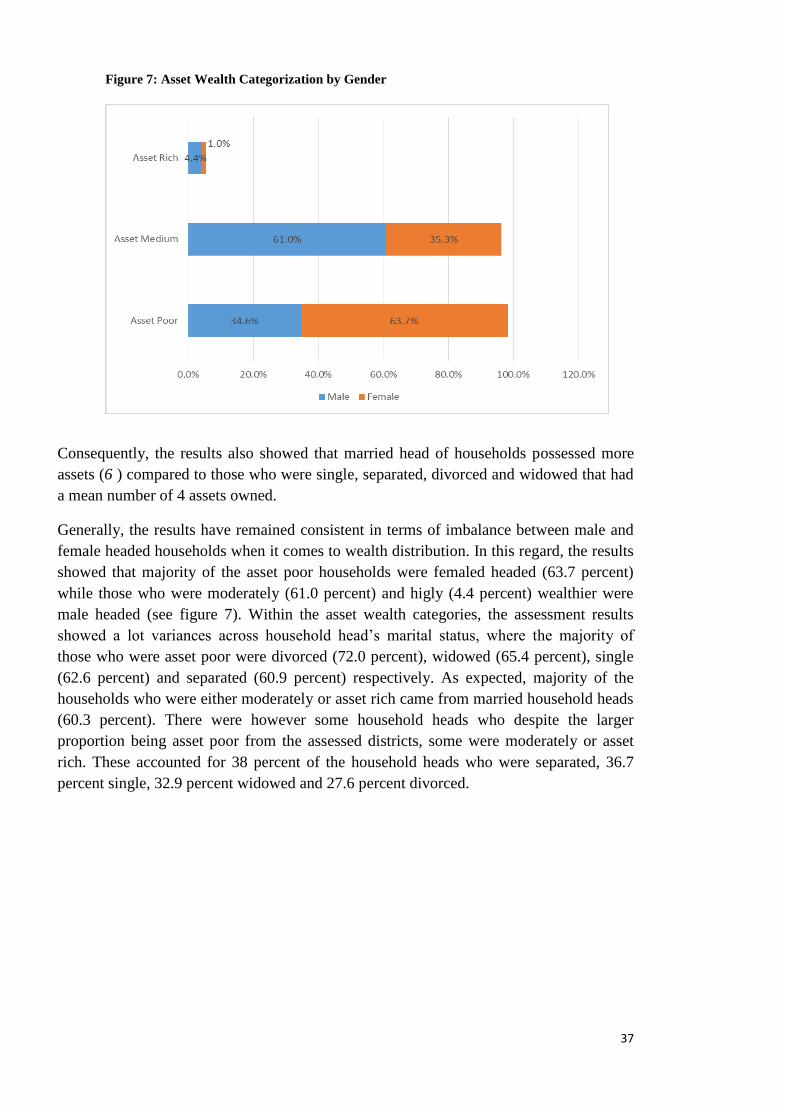
37
Figure 7: Asset Wealth Categorization by Gender
Consequently, the results also showed that married head of households possessed more
assets (6 ) compared to those who were single, separated, divorced and widowed that had
a mean number of 4 assets owned.
Generally, the results have remained consistent in terms of imbalance between male and
female headed households when it comes to wealth distribution. In this regard, the results
showed that majority of the asset poor households were femaled headed (63.7 percent)
while those who were moderately (61.0 percent) and higly (4.4 percent) wealthier were
male headed (see figure 7). Within the asset wealth categories, the assessment results
showed a lot variances across household head’s marital status, where the majority of
those who were asset poor were divorced (72.0 percent), widowed (65.4 percent), single
(62.6 percent) and separated (60.9 percent) respectively. As expected, majority of the
households who were either moderately or asset rich came from married household heads
(60.3 percent). There were however some household heads who despite the larger
proportion being asset poor from the assessed districts, some were moderately or asset
rich. These accounted for 38 percent of the household heads who were separated, 36.7
percent single, 32.9 percent widowed and 27.6 percent divorced.

38
Figure 8 : Asset Wealth Categorization by Employment Status
Further, analysis showed that wealth distribution across different types of employment the
household heads engaged in favoured more of the maled headed unlike the female
headed. Figure 8 showed that majority of the asset poor household heads, whose
employment status was unemployed and informally employed , were female headed
accounting for 48 percent and 33.2 percent respectively. Consequently, the results also
showed that female headed households that fell under asset medium and asset rich
category were unemployed and informally employed (farmers). In view of the 2014-2015
prolonged dry spells that affected most of the parts of the country, an attempt was made
to ascertain to what extent assessed households had their assets affected in one way or the
other. In this regard, the results showed that generally no change in numbers of assets
owned was observed with a few notable exceptions on hoes, cellphones, axes and radios.
The main reason for the changes in the numbers of hoes, cellphones, axes and radios
owned by some households in the assessed districts were either additional purchases
made, assets damaged or sold. These casual factors that led to the change in number of
assets owned despite being minimal,could not have been triggered by negative impacts of
prolonged dry spells. Generally, the results of the assessment showed that asset
ownership at household level did not change.
4.5. Agriculture and Food Security
The analysis of agriculture and food security in this report is in line with the FAO
definition, utilizing the pillars to interrogate the issue of agriculture and food security in
the country. The discussion in this chapter focuses on agricultural production issues, food
availability, access and stability.
4.5.1. Land Availability and Cultivation
The average land holding of the households in the assessed districts stood at 5.04
hectares. When asked how much of it was owned by the household itself, the assessment
results showed that an average of 4.56 hectares was actually self – owned. Districts in
39
Southern and Central provinces had the largest landholding amongst the assessed areas
with Choma and Kalomo having 14.5 and 13.1 hectares respectively while the average for
Kapiri Mposhi was 8 hectares. Households in districts in Western province showed the
smallest landholdings with Sikongo reporting an average landholding size of 1.3 hectares.
An interrogation of landholding by gender showed that male headed households owned
2hectares more than the females. The average land holding for male headed households
stood at 4.4 hectares while that for females was at 2.4 hectares.
The assessment also showed that an average of 1.8 hectares of arable land was cultivated
by the households in the assessed districts. Further, results showed that majority of
households are not utilizing their arable land fully.
4.5.2. Food Availability
Results from the assessment showed that production of the 2014/2015 season stood at 1.3
million MT. The assessment showed that the households in the assessed districts
anticipate selling about 595, 989 MT of maize. It was also determined that the amount to
be given away stood at 597 MT. The total balance of the cereal likely to be held at the
household level therefore stood at 695, 500 MT.
The other crops grown in the assessed districts included cotton, tobacco, sun flower, soya
beans, sorghum, millet, sweet potatoes, rice, groundnuts and cassava. The cash crops of
cotton, tobacco and sun flower were mainly grown in eastern, southern and central
provinces.
4.5.3. Food Access
Food access at the household level is attained through a combination of their own
production, fishing or gathering wild foods; exchange or purchases from the market and
gifts obtained from the household’s social networks. Food purchases depend on prices
and cash income and are closely linked to livelihood strategies. Therefore, this section
discusses access in terms of physical availability, financial, social access as well as how
markets impact food access.
4.5.4. Access to Own Production
The results of the assessment showed that production of maize in most of the districts
reduced by as much as 38 percent. The western province districts were the most affected
indicating a loss of as much as 41 percent overall. In terms of carry – over stock, only
34.7 percent of households reported to have had stock from the previous season. When
households were asked when cereal would run out, about 55.2 percent indicated that they
would have no cereal by July. By the time the households start the lean period around
November, 86.7 percent of the households would have run out of cereal.
Physical Access
Results from the community focus group discussions showed that communities in the
assessed districts would be impeded physical access to the staple mainly because of bad
roads. This further weakens household resilience in the sense that such households may
not be connected to main markets where the price of the commodity they are selling may
be better than their local community.

40
Financial Access
When households were asked whether they would purchase cereal/Millie meal during the
2015/2016 marketing season, only 25.9 percent indicated that they would not purchase
these commodities. From the community focused groups, it was indicated that the
commodity is currently readily available in the market.
The survey showed that maize prices at community markets on average were 19.7 percent
higher than in May 2014. The communities indicated that the main reason for the rise in
prices was increase in demand coupled with reduced supplies to markets.
The survey further showed that about 30 percent of households earned cereal from casual
labour while about 45 percent purchased maize/maize meal between January and May
2015. This signifies that casual labour continues to be an important source of cereal.
4.5.5. Livestock Condition and Major Crops Grown
The study revealed that 70 percent of the households interviewed owned different species
of livestock. Majority of households in the assessed district owned chickens. In terms of
numbers of livestock owned, the largest type of livestock in the assessed districts was
chicken (58 percent), followed by pigs (14 percent). Others owned were goats (11
percent), cattle (9 percent) and sheep (8 percent), see figure 9 below.
Figure 9: Type of Livestock Kept by Households
58%
11%
8%
14%
9%
Chicken Goat Sheep Pig Cattle

41
Results of the assessment showed that in terms of livestock prices, there was no change
between November 2014 and the time of Assessment.
Results of the In – depth Vulnerability and Needs Assessment showed that 93 percent
indicated having grown some crops during the 2014/15 agricultural season. Of these, 86.3
percent indicated having grown maize while only about 6 percent of the households
indicated having grown other cereal such as rice, sorghum and millet. When asked
whether households in the assessed districts grew cassava, only 18 percent of the
households responded in the affirmative.
In terms of cash crops, majority of the households indicated having grown sunflower
(19.8 percent) while a few households in the assessed districts indicated having grown
tobacco (11.9 percent) and cotton (10.9 percent).
4.6. Expenditure Share
Expenditure share is key in determining the economic vulnerability of households and
population in general. Under this section, the discussion will be limited to expenditure
share on food to ascertain to what extent people in the assessed districts created a balance
between food and non-food items in view of the negative impacts brought about by the
2014-2015 dry spells. The expenditure share analysis in this Impact Assessment Report is
based on both purchases and own production estimates with a standard recall period of
thirty (30) days.
Figure 10: Expenditure Share
The assessment results showed that there were variances in food expenditure share across
the districts covered under the 2015 Assessment. In this regard, majority of the
households spent more money on food at expense of the non food.The results have

42
showed that 34.8 percent of the households had an expenditure share on food between 51
and 75 percent. Furthermore, a total of 34.1 percent of households had expenditure share
on food more that 75 percent.
Figure 11 : Expenditure Share by Gender
As expected, asset ownership did to some extent determine how much of expenditure
balancing households had between food and non-food items. In this regard, the
assessment results showed that households that had an expenditure share on food of 51
to75 percent were mainly asset poor (34.9 percent), followed by asset medium (34.6
percent) and asset rich (35.9 percent). Coincidentally, the results also showed that most of
female headed households had a higher food expenditure share compared to the male
headed across all three asset wealth categories. Suffice to mention that the proportion of
households that had a food expenditure share of between 51 to 75 percent was not only
from the female headed households but also fell under the asset wealth category “Rich”.
Similar trend was also observed for the asset categories “Medium” and “Poor” where
female headed households had higher food expenditure share of upto 75 percent (see
figure 11).
Further, the results showed that majority of households that had food expenditure share
between 51 and 75 percent had their main livelihood sources as Money lending (56.9
percent), skilled trade/artisan (41.0 percent), trading (38.3 percent), irregular daily
employee (38.2 percent), agriculture wage labour (37 percent) and non- agriculture wage
labour. Generally, all the households that depended on farming (crop and livestock) as
their main livelihood had fewer proportion of households that had high expenditure share
on food.

43
4.7. Food Consumption Scores (FCS)
The Food Consumption Score is a composite score based on dietary diversity, food
frequency and relative nutrition importance of different food groups consumed by
individuals, households and people in general. The discussion under this section of the
2015 Assessment Report will tease out to what extent the prolonged dry spells affected
consumption patterns of households and people in the assessed districts.
The Assessment showed that most of the people in the assessed districts have acceptable
food consumption scores (52.7 percent) followed by those with borderline food
consumption scores (24.6 percent). Although the survey showed that majority of the
households had good dietary diversity in the form of consumption scores, there were still
22.7 percent of households which had poor dietary diversity.
In terms of the gender perspective, the findings showed that majority of those that had a
poor consumption score were actually male (14.4 percent) compared to only 8.2 percent
of their female counterparts (see figure 12 ).
Figure 12: Food Consumption Score by Gender
14.4% 17.7%
41.8%8.2%
7.0%
10.9%
Poor Borderline Acceptable
Male Female
When education levels is crossed with the food consumption score, the assessment
indicated that the highest proportion of the households with poor food consumption
scores had household heads that had either never been to school (7.2 percent) or had only
attained primary education (11.9 percent). Those households that had heads with an
education level of secondary or higher had high consumption scores.
In terms of marital status, evidence gathered showed that of those that had poor
consumption scores, the divorced or widowed had more people in this category (see
figure 12). In terms of age of head of household, 11.9 percent of the child headed
households had poor consumption scores. Those in the 18 – 28 years age bracket had
about 5.1 percent of people who had poor scores. When analysed from the employment
perspective, majority of those that had poor consumption scores were actually in informal
employment (21.4 percent).

44
Figure 13: Food Consumption Score by Marital Status
There is certainly a correlation between asset ownership with diversity of food consumed
which to a larger extent is determined by the viability of the income sources. Majority of
those that had poor consumption scores were either asset poor or asset medium (see figure
14).
Figure 14: Food Consumption Score by Asset Wealth
4.8. Coping Strategy Index (CSI)
Coping strategies are things that households and people in general do to try to increase
their food and cash income after a shock or hazard. In this section, the coping strategy
index has been used to determine those households that were already using a high number
of coping strategies to access food. Thus, a high CSI score generally means that a
household is unable to access enough food, and therefore has to rely on a number of
coping strategies; conversely, the lower the CSI score, the fewer the coping strategies
harnessed (Maxwell & Caldwell, 2008:2) leading to the assumption that the household is
more food secure.

45
The fact that the majority of households (58.8 percent) had a CSI below the mean (23.4)
implies that about half of households were better equipped regarding the use of coping
strategies relative to the average of the assessed districts. Furthermore, a standard
deviation of 9 is indicative of the limited range of coping strategies employed by
households.
The households with 5 – 6 members had the highest mean CSI, with a value of 24.3,
followed by the households with 3 – 4 members and the smaller households with 1 -2
members, with a mean CSI of 18. The higher number of coping strategies used by
households with 9 – 10 members might have arisen from the fact that there were more
children per household who required adequate and nutritious food for their continued
growth. When these households anticipated problems relating to food consumption, they
tended to use more coping strategies in an effort to avoid these anticipated problems.
Table 4: Mean CSI by Family Size
Family Size Mean CSI SD
1 to 2 18 6.9
3 to 4 24.1 9.3
5 to 6 24.3 9.2
7 to 8 22.9 10.1
9 to 10 22.5 10.4
above 10 22.4 7.3
The Spearman’s correlation coefficient between the number of household members and
CSI showed a strong negative monotonic relationship (r = - 0.72 at p < 0,001). This
strong negative correlation coefficient indicates that when the number of household
members increased, the coping strategies used by the households generally decreased,
hence a reduction in the food insecurity with the increase in the number of people in a
household. The fact that households with large household members had a fairly low CSI
may be attributed to larger labour force available for the household and hence greater
food security.
Table 5: CSI by Employment Status
Employment Status
Mean CSI of the
subgroup Standard Deviation
Formal 23.6 9.3
Informal 23.8 9.83
Unemployed 25.6 7.75
CSI = Coping Strategy Index, SD = 9.75, Mean = 39
In terms of employment status of the household head, the assessment revealed that
households with heads in formal or in informal employment had a lower CSI of 23.6 and
23.8 respectively while those households with unemployed heads had a CSI of 25.6. It
has also been found through research that households with more employed members are
better able to purchase adequate food supplies; employment plays an important role in
food security and in decreasing the need to change behaviours to access food (Food and
Agriculture Organization, 2012:10).
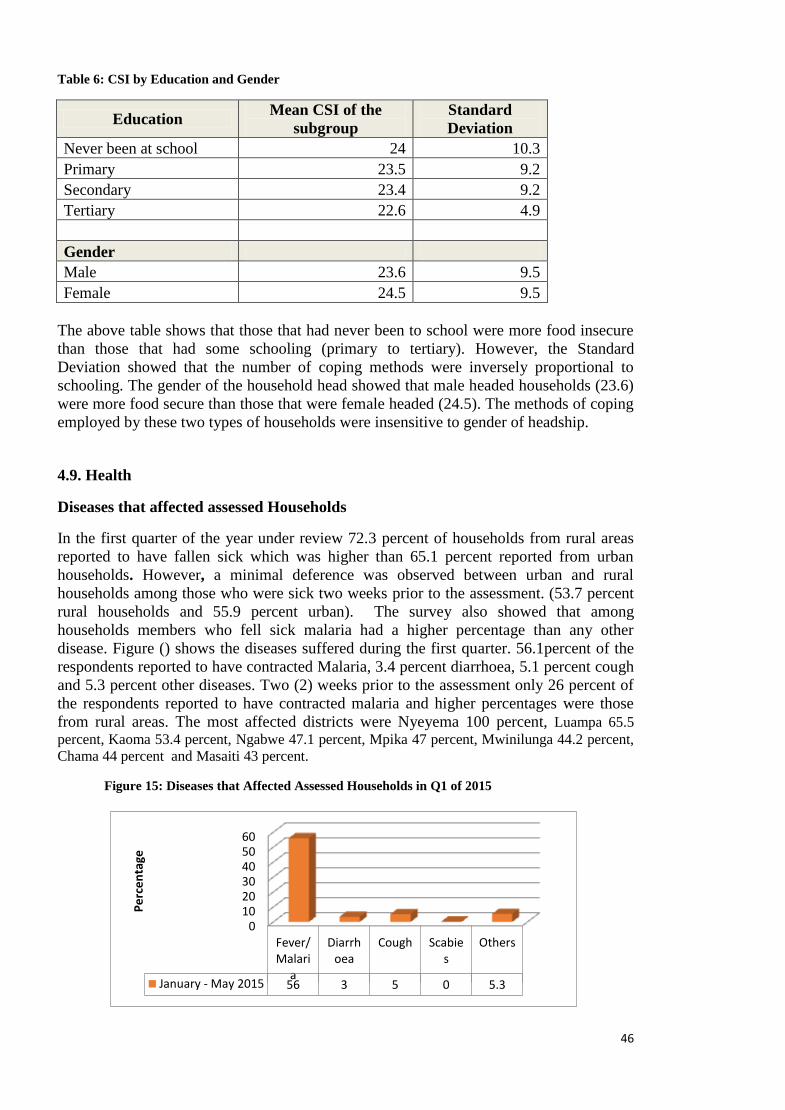
46
Table 6: CSI by Education and Gender
Education Mean CSI of the
subgroup
Standard
Deviation
Never been at school 24 10.3
Primary 23.5 9.2
Secondary 23.4 9.2
Tertiary 22.6 4.9
Gender
Male 23.6 9.5
Female 24.5 9.5
The above table shows that those that had never been to school were more food insecure
than those that had some schooling (primary to tertiary). However, the Standard
Deviation showed that the number of coping methods were inversely proportional to
schooling. The gender of the household head showed that male headed households (23.6)
were more food secure than those that were female headed (24.5). The methods of coping
employed by these two types of households were insensitive to gender of headship.
4.9. Health
Diseases that affected assessed Households
In the first quarter of the year under review 72.3 percent of households from rural areas
reported to have fallen sick which was higher than 65.1 percent reported from urban
households. However, a minimal deference was observed between urban and rural
households among those who were sick two weeks prior to the assessment. (53.7 percent
rural households and 55.9 percent urban). The survey also showed that among
households members who fell sick malaria had a higher percentage than any other
disease. Figure () shows the diseases suffered during the first quarter. 56.1percent of the
respondents reported to have contracted Malaria, 3.4 percent diarrhoea, 5.1 percent cough
and 5.3 percent other diseases. Two (2) weeks prior to the assessment only 26 percent of
the respondents reported to have contracted malaria and higher percentages were those
from rural areas. The most affected districts were Nyeyema 100 percent, Luampa 65.5
percent, Kaoma 53.4 percent, Ngabwe 47.1 percent, Mpika 47 percent, Mwinilunga 44.2 percent,
Chama 44 percent and Masaiti 43 percent.
Figure 15: Diseases that Affected Assessed Households in Q1 of 2015
0102030405060
Fever/Malari
a
Diarrhoea
Cough Scabies
Others
January - May 2015 56 3 5 0 5.3
Pe
rce
nta
ge

47
Health Care Seeking Behaviour
The survey indicates that health care seeking behaviour depend on the disease the
household member is suffering from. Figure 17 shows that 80.3 percent of the
respondents who contracted fever/malaria opted for formal care services while 66.2
percent opted not to seek any medication and 64.2 percent preferred their own
medication. 53.3 percent opted to visit the pharmacy/dispensary. On the other hand about
27 percent of household members who had diarrhea opted to visit traditional healers and
about 29 percent went for other alternatives. 38.1 percent of those who had a cough opted
for private formal health care while 18.5 percent opted for pharmacy/dispensary with a
few going for traditional healers or not seeking any medication.
Figure 16: Health Care Seeking Behaviour by Disease
0.0%10.0%20.0%30.0%40.0%50.0%60.0%70.0%80.0%
Fever/Malaria
Diarrhoea
Cough
Scabies
Others
According to the above there is still some resistance in some sector of society to change
their health care behavior. There are various reasons, however, as to why some household
members opt not to seek formal health care. The major reason being lack of transport as
indicated in figure 17. Transport accounts for 38 percent, money 24 percent, home based
care 14 percent and 24percent too ill to go to a health facility.
Figure 17: Reasons for poor health seeking patterns
13%
38%
7%3%
1%
14%
24%
No money No Transport Poor quality
Religious/cultural reasons Too ill Home based care
Other

48
Disease suffered by main water source
The assumption is that if households use improved water sources the disease burden
would be less. However, the survey shows otherwise in that the results show that most of
the disease incidences were reported by household that used improved water sources. For
instance Figure 18 indicates that 57.3percent households using improved water sources
reported that they had Fever/Malaria while the households that used unimproved sources
had 47.2 percent. Households that reported having contracted diarrhoea who used
improved water sources were 67percent and those that used unimproved water sources
were 33 percent. Scabies on the other hand is the only disease that reported a higher
percentage of 73.8 for the households that use unimproved water source. The reasons for
the difference in disease incidences by water source could be due to the fact that the
assessment was based on the type of water source rather than the quality of water at
source. In addition, the households that were assessed used more improved water sources
than unimproved.
Figure 18: Diseases by Water Source
The analysis results show that 72.2 percent of the households that accessed water from
the river or lake reported to have contracted Fever/ Malaria while 72.4 percent that
accessed water from protected wells reported to have contracted Malaria. 11.1 percent of
the members that accessed water from the borehole and 11.1 percent that accessed piped
water reported to that they suffered from diarrhea. Reasons for these observed
percentages could be that the improved water source was not checked for quality or
confirmed safe for drinking.

49
Table 7: Water Source by Diseases
Water Source Fever/Malaria Diarrhoea Cough Scabies Others Total
River or lake 72.2Percent 9.0Percent 9.4Percent .4Percent 9.0Percent
100.0Percent
Unprotected well 69.4Percent 5.6Percent 11.8Percent .8Percent 12.3Percent
100.0Percent
Protected well 72.4Percent 4.0Percent 14.8Percent .6Percent 8.2Percent
100.0Percent
Borehole 66.7Percent 11.1Percent 13.2Percent .1Percent 8.9Percent
100.0Percent
Piped water 53.8Percent 11.0Percent 17.8Percent .4Percent 17.0Percent
100.0Percent
Other 45.9Percent 10.7Percent 27.2Percent 4.8Percent
11.4Percent 100.0Percent
Disease burden by water treatment
Treatment of water is one of the attributes to the waterborne disease burden. The
assessment indicates that the percentage of households that didn’t treat water reported
higher percentages of incidence in terms of the water related diseases. For example, the
households that didn’t treat water reported sickness due to diarrhoea (3.6 percent);
malaria (55.1 percent), cough (5.3 percent) while the households that used water that was
treated reported sickness due to diarrhoea ( 3.0 percent),0.6 percent lower than those who
did not treat their water, and malaria (58.5 percent).
Figure 19: Diseases by Water Treatment

50
Disease by type of Sanitation Facility
The type of sanitation facility used by the household does to some extent contribute to the
type of diseases suffered by household. The assessment shows that most of the
households that suffered from diarrhea were those using traditional pit latrines (63.7
percent) as their main sanitation facility. The disease burden for Households that had no
sanitation facility was 29.7 percent.
Table 8: Diseases by Sanitation Facility
Flash Toilet VIP
Sanplat
(Improved
Traditional)
Traditional
Latrine Bucket
No facility (i.e.
Bush, river, CAT
Method) Total
Fever/Malaria 1.5% 1.2% 2.5% 78.8% .0% 15.9% 100.0%
Diarrhoea 3.5% 1.1% 1.9% 63.7% 0.0% 29.7% 100.0%
Cough 3.1% 2.4% 2.1% 74.2% 0.0% 18.3% 100.0%
Scabies 0.0% 0.0% 5.8% 52.8% 0.0% 41.4% 100.0%
Others 3.6% 0.0% 1.6% 74.4% 0.0% 20.4% 100.0%
Asthma 0.0% 0.0% 0.0% 81.6% 0.0% 18.4% 100.0%
Back ache 0.0% 0.0% 0.0% 79.0% 0.0% 21.0% 100.0%
Body pains 0.0% 5.2% 0.0% 62.4% 0.0% 32.4% 100.0%
Eye problems 0.0% 0.0% 3.9% 78.6% 0.0% 17.5% 100.0%
Stroke 0.0% 0.0% 2.4% 95.3% 0.0% 2.3% 100.0%
Toothache 0.0% 0.0% 0.0% 64.2% 0.0% 35.8% 100.0%
BP 30.2% 6.7% 0.0% 55.0% 0.0% 8.2% 100.0%
The analysis results have further shown that majority of the households that had a
member sick from diarrhea in the last two weeks prior to the assessment and their main
sanitary disposal was traditional latrine or no facility, reside in the rural strata of the
surveyed districts. On the other hand only 3.5 percent of the households that use
improved sanitary facilities such as flash toilets reported cases of diarhoea and only 1.1
percent was reported from those who used VIP toilets.
Disease suffered by distance from water source
There is moderate proof from the data that distance to water source was a factor to disease
burden in that the further away the household is from the water source the more prone
they are to contracting a disease. People staying far from water sources tend to ration their
use of water to the extent that some safe practices such as washing hands after using
toilets are perceived to be a waste of water. In some cases even bathing is avoided in an
effort of preserving water for other perceived important activities.
Figure 21 shows that households covering a distance between 100 to 500m to fetch water
has a higher risk of contracting diseases as compared to other households. The data shows
that scabies has the lowest percentage with 40.1 and the highest being Cough with
49.8.Surprisingly enough households covering distances more than 500m indicated a
lower risk of contracting most of the diseases as compared to those covering distances
between 100 – 500m.

51
Figure 20: Diseases by Distance to Water Source
Under Five Immunizations
Diseases
Fever, ARI/cough, and Diarrhea were the top three diseases that affected the under five
children during the period under review. The highest prevalent was ARI/cough with 29
percent followed by Fever and diarrhoea with 27.2 percent and 10.1percent respectively
as shown in figure 22 below.
Figure 21: Diseases that the Under 5 Suffered from
The highly affected provinces with Diarrhoea were Central, Southern and Muchinga with
12.6percent, 10.6percent and 10percent respectively. Whereas, those affected with fever
were N/Western (39.3percent), Western (33.4percent), and Central (32.6percent). For
ARI/ Cough the most affected provinces were Western (42percent), Muchinga
(37.3percent) and Luapula (35.9percent).

52
Immunization
The table below shows the percentage of children who were immunized for each dose. Figure 22: Immunization Rates
Almost all the parents interviewed indicated that they had their children immunized as
showed in the figure above. The lowest percentage was OPV 4 with 9.3% because it is
only given to children who did not have OPV 0.

53
4.10. Nutrition
Meal Consumption Pattern
The assessment of food consumption is essential in understanding the immediate causes
of under nutrition in the population. Disturbances in the dietary consumption within a
short period of time have a direct influence on the nutrition status of the population. The
survey results on consumption in 30 days preceding the survey indicate that about 32.9
percent of the households ran out of food, 28 percent slept hungry and 21.4 percent spent
the whole day without food at any one time in 30 days.
Frequency of occurrence of the problem
The results show that majority (18.4 percent ) of those who had no food had experienced
this 1 to 2 times in 30 days and 12.2 percent experienced this between 3 to 10 times in
the 30 day preceding the survey. In addition, of the 28.8 percent of the households who
slept with hunger, 17.6 percent rarely experienced this and 9.5 percent experienced it 3 to
10 times in 30 days. Further, among those who went without food, 13.3 percent
experienced it rarely and 7 percent experienced it 3 to 10 times in 30 days. Less than 3
percent of the households frequently experienced this.
This shows that there was a general disturbance in food intake among the households in
30 days preceding the survey.
Table 9: Meal consumption in 30 days
No food in the house
Frequency Percent
Rarely(1-2 times) 174391 18.7
Sometimes (3-10 times) 113934 12.2
Often (more than 10 times) 19765 2.1
No 623895 66.9
Total 931985 100.0
Slept hungry
Frequency Percent
Rarely(1-2 times) 164867 17.7
Sometimes (3-10 times) 88535 9.5
Often (more than 10 times) 16220 1.7
n/a 661735 71.1
Total 931357 100.0
Spent whole day without eating
Frequency Percent
Rarely(1-2 times) 123530 13.3
Sometimes (3-10 times) 64824 7.0
Often (more than 10 times) 12294 1.3
n/a 730568 78.5
Total 931217 100.0

54
Meal frequency
The frequency of meal consumption at household level is important in assessing the
adequacy of nutrient intake of the household members. The assessment of meal
frequency the day preceding the survey in the household, among adults and children
showed that majority of the households (46.6 percent) had three meals, 43.4 percent had
two meals, 9.3 percent had one meal and the rest had no meal a day preceding the survey.
In addition, 0.2 percent of households slept hungry the day preceding the survey. It
therefore evident that the households were not having the usual meals as seen in figure 23
below.
Figure 23: Meals consumed Preceding Day and Normal Meals
0.8%
53.0%
42.5%
3.6%0.0%1.4%
46.6%43.4%
9.3% 0.2%0.0%
10.0%
20.0%
30.0%
40.0%
50.0%
60.0%
More than Three Three Two One None
Usual Meals Meals previous Day
The data showed that on average 0.3 percent of households in the entire district slept
hungry, 8.9 percent ate once and 46.3 percent ate two times the day preceding the survey.
About 2.1 percent of the households in Shangombo, Ikelenge, Sikongo and Sioma had no
meals a day preceding the survey. Sikongo and Sioma recorded the highest proportion of
households (50.7 percent and 34.6 percent respectively) who had one meal the day
preceding the survey. Further, Lukulu and Nyimba showed that over 79 percent of the
households ate two meals the day preceding the survey.
The results indicated that 53 percent of the households reported that they usually ate 3
meals per day while 42 percent usually ate twice per day. This implies that those who had
2 meals consumed normally while there was a slight reduction among those who ate 3
meals. Therefore, there were no major disturbances in their meal consumption pattern
among the households. Further, the data showed that over 50 percent of the households
in Southern province and 2 districts in eastern province had normal meals a day preceding
the survey.

55
Nutritional Status
Child Nutrition
The survey assessed a total of 452 595children in all the forty-eight (48) districts of which
51.6 percent were males and 48.4 percent were females.
Breast feeding
Continued breast feeding among children 6 to 59 months of age is essential for continued
growth and development of the child. Breast milk contributes greatly to the nutrient
requirement of the child after 6 months though it is not sufficient to provide all the
nutrients required at this age. The survey showed that about 28.3 percent of children
between 6 to 24 months of age were still breast feeding in all the forty-eight (48) districts.
Mambwe districts showed the lowest proportion (2.3 percent) of children not breast fed
followed by Sesheke, Mwandi, Serenje, Samfya and Lundazi which were below 10
percent. On the other hand, Senanga had the highest proportion (40 percent) of children
breast feeding followed by Mongu, Zimba, Kaoma and Namwala which had around 30
percent of the children.
Micronutrient Supplementation
Consistent vitamin A supplementation among children under-five above 80 percent has
the potential to reduce child Mortality. In addition, de-worming programme plays a
critical role in reduction of under nutrition among children and pregnant women. The
survey showed that 81.5 percent of the children in the survey areas received Vitamin A
supplementation and 56.3 percent were de-wormed in the 6 months preceding the survey
(Table).The data further shows that districts such as Nkeyema, Senanga, Ngabwe, Pemba,
and Chikankata recorded 90 percent to 100 percent Vitamin A Supplementation, de-
worming coverage was 100 percent in Ngabwe and Nkeyema while Senanga , Sesheke,
Nalolo Mwinilunga recorded over 90 percent coverage.
Child feeding Programme
Supplementation and therapeutic feeding programs have been designed to help in the
rehabilitation of the undernourished children. Enrollment of children in three feeding
programs in the 3 months preceding the survey showed that 4.2 percent of children in
the survey were enrolled in supplementary feeding programs, 3.3 percent were enrolled in
therapeutic feeding and 2.8 percent were currently enrolled in the therapeutic feeding
programs. Analysis at district level showed that 5.5 percent of children in Luampa, 5.6
percent in Mpika, 5.1 percent in Mwinilunga were enrolled in supplementary feeding.
Therapeutic feeding was reported among 39.2 percent of the children in Petauke, 26.8
percentin Nyimba, 15.5 percent in Nyimba and 4.7 percent in Mambwe.

56
Figure 24: Children enrolled in Child feeding programme 3 months prior the survey
Child feeding programme
Child feeding at household level is influenced by a number of factors. Family size has a
significant impact on household food distribution and subsequent child feeding. The
results found an association between family size and enrollment to child supplementary
feeding programme (p=0.000). The results show that most children from the family size
of 5 to 6 people were enrolled in supplementary feeding 3 months prior to the survey
and children about 5 percent of the children from the family size of between 3 to 6 were
enrolled in therapeutic feeding programs three months prior to the survey (Table …….).
Table 10: Child feeding program by Family size
Child Feeding Programme by Family Size
Family Size Supplementary Therapeutic Currently on
Therapeutic feeding
Yes No Yes No Yes No
1-2 People 0.00% 100.00% 0.00% 100.00% 0.00% 100.00%
3-4 People 7.00% 88.30% 5.40% 88.30% 5.50% 88.80%
5-6 People 5.70% 90.30% 5.10% 90.50% 4.60% 91.30%
7-8 People 1.30% 96.60% 0.40% 97.30% 0.20% 97.30%
9-10 People 2.50% 95.50% 1.90% 95.90% 1.00% 96.40%
Over 10 People 2.60% 94.10% 1.60% 95.40% 0.50% 96.80%
Total 4.20% 92.40% 3.30% 92.80% 2.80% 93.40%

57
Child Nutritional status
The MUAC measurement for children is used as a proxy for wasting and assesses the risk
of death among 6 to 24 months of age. Oedema was also used in the assessment to assess
the level of severe under nutrition among the children. The results shows that 2.2 percent
children were at risk of severe wasting, 3.2 percent were at risk of moderate wasting and
94 percent of the children were not at risk of wasting or death in the entire district. More
girls (2.3 percent) were at risk of sever wasting than boys (2.1 percent) while the same
proportion of boys and girls were at risk of moderate wasting(3.2 percent) (Figure below).
The result further shows that Sioma (18.9 percent), Sikongo (15.7 percent) and Lundazi
(11.4 percent) districts had highest proportion of children with severe wasting. The
moderate wasting was highest in Mwinilunga (10.5 percent) and Sinda (9.5 percent) while
other districts had less than 7 percent of the children in the moderate range (Annex….).
Further, the data shows that 1 percent of the children had Oedema across the districts and
more boys (1.2 percent) had Oedema than girls (0.7 percent). This is consistent with other
surveys that have been done in the country though districts specific survey data may not
be available.
Figure 25: Child Nutritional Status
Child MUAC and family size
The number of people in the household influences the consumption of the household
members especially the children. The results established a strong association between
family size and wasting among children (p=0.000). The results show that 3.2 percent of
children in households with 7 to 8 people were severely wasted and 4.4 percent were
moderately wasted. In addition, 3, 4 percent of the children with Oedema were found in
households with 9 to 10 people.

58
Table 11: Under - Nutrition by Family Size
Household Size child's MUAC Oedema
Presence
Severe Moderate Above
normal Yes
1-2 People 0.00% 0.00% 100.00% 0.00%
3-4 People 2.60% 2.70% 94.70% 1.00%
5-6 People 1.80% 2.90% 95.20% 0.60%
7-8 People 3.20% 4.10% 92.70% 0.50%
9-10 People 1.90% 4.00% 94.10% 3.40%
Over 10 People 0.60% 2.40% 97.10% 0.40%
Total 2.20% 3.20% 94.50% 1.00%
Child MUAC with Age of Household Head
The age of the household head influences the nutrition decision at household level hence
influences the extent to which resources are used to access to provide food for the
household. The survey assessed associations between wasting and age of the households
head. A strong association was found between wasting based on MUAC and age of
household head (p=0.001). The results show that 10.6 percent of moderately wasted
children were found in houses with household heads less than 18 years old. In addition,
about 5.5 percent to 5.1 percent of moderately wasted children were found in households
with heads aged 51 to 61 years old and above 61 years old respectively.
Table 12: Child MUAC by age of Household head
Child MUAC
Age of household head Severe Moderate Above normal
Less 18 years 0.00% 10.60% 89.40%
18-28 years 1.70% 2.70% 95.60%
29-39 years 2.20% 2.50% 95.30%
40-50 years 1.50% 4.10% 94.40%
51-61 years 3.40% 5.50% 91.20%
61+ years 1.20% 5.10% 93.70%
Total 2.00% 3.40% 94.70%
Child MUAC by Illness in Past two weeks
A childhood illness is one of the immediate causes of under nutrition according to the
Conceptual framework of under nutrition. Childhood illness suffered with 2 weeks prior
to assessment can influence the wasting levels among children. The survey assessed the
childhood illnesses 2 week prior to the survey. The results indicate that 1.5 percent of the
children who were severely wasted had a fever, 0.9 percent had a cough and 1.2 percent
had diarrhea. In addition, among those with moderate wasting, 4.1 percent had a fever and
a cough and 3.9 percent had diarrhea (Table 13).

59
Table 13: Child illnesses by Child MUAC
child's MUAC
Illnesses Severe Moderate
Above
normal
Fever
Yes 1.50% 4.10% 94.40%
No 2.20% 3.10% 94.80%
Cough
Yes 0.90% 4.10% 94.90%
No 2.40% 3.00% 94.60%
Diarrhea
Yes 1.20% 3.90% 94.90%
No 0.00% 6.40% 93.60%
2.00% 3.40% 94.70%
Mothers Nutritional Status
MUAC among adults is used to assess the nutritional status and determine the eligibility
for nutrition support in low resource setting and in emergencies. The MUAC
measurement show that 6.2 percent of women were severely undernourished while 5.9
percent were moderately malnourished (Figure below). The results further shows that
majority of the severely wasted women were found in Sioma (20 percent) and Masaiti
(19.3 percent) districts. Other districts such as Kapiri, Katete, Ikelenge, Chama and
Namwala had between 9 percent and 10 percent of the severely wasted women.
Moderately under wasting was highest in Mwinilunga (20.9 percent) and Petauke (19
percent)). Other districts with less than 14 percent of moderately wasted women included
Sikongo (13.7 percent), Chama (12.0 percent), Kapiri Mposhi (11.8 percent), Lukulu
(10.6 percent) and Senanga (12.5 percent).
Figure 26: Nutrition Status of Women
Severe under nutrition
Moderate under nutrion
Normal
Percent 6.2 5.9 87.8
undernutrition
Women Nutritional status with Household Size
Women contribute greatly towards the acquisition of food in the households. Family size
is key in the intra household food distribution and is especially important in
understanding the nutritional status of women in the household. The results show that
high proportion of severely wasted women were found in households with 3 to 10
members and moderate wasting was common among households with 1 to 6 members of
the household(Figure).

60
The results imply that thought women are the primary distributors of food in the
household, they do not consume enough and most times they are overwhelmed by
ensuring everybody has food at the expense of their own nutrition.
Figure 27: Women Nutritional status by Household size
1.70%
5.00%
5.90%
7.60%
5.50%
8.10%
6.60%
10.20%
6.10%
4.00%
4.30%
1.90%
91.60%
84.90%
88.00%
88.40%
90.20%
90.00%
1-2 People
3-4 People
5-6 People
7-8 People
9-10 People
Over 10 People
Ho
use
ho
ld s
ize
Family size by Women nutritional status
Normal % Moderate % Severe %
Women Nutritional Status and Child Wasting
Women are primary care providers for children and their nutritional status plays a key
role in the nutritional status of the children and in the provision of child care. The results
of the survey shows that 58.4 percent of the severely undernourished women had severely
wasted children and only 35.3 percent of women with normal nutritional status had
severely wasted children.
This implies that women nutritional status is important if under nutrition among children
is to be eradicated. Therefore, women need to be targeted with interventions that reduce
under nutrition if child nutrition has to be addressed.

61
Figure 28: Women MUAC by Child MUAC
58
.40
%
6.4
0%
35
.30
%
4.7
0%
23
.50
%
71
.80
%
5.1
0%
5.3
0%
89
.70
%
S E V E R E M O D E R A T E N O R M A L
M O T H E R ' S M U A C
W O M E N M U A C B Y C H I L D M U A C
Child's Wasting severe Child's Wasting Moderate Child's Wasting Normal
4.11. Water, Sanitation and Hygiene
Main Water Sources
The assessment revealed that the access to total improved water supply by main source
was 56.2 percent (of which 39.8 percent was borehole, 8.6 percent protected well and 7.8
percent piped water,). The access to total unimproved water supply by main source of
drinking water was 43.8 percent (of which 26.8 percent was unprotected well, 15.6
percent river or lake and 1.4 percent other unimproved source). For the purpose of this
report, improved water sources were grouped as borehole, piped and protected wells
while unimproved water sources were grouped as unprotected wells, streams, rivers or
lakes and other.
Figure 29: Main Sources of Water
Borehole39%
Protected Well8%
Unprotected well28%
River/Lake16%
Piped Water8%
Other1%

62
Alternative or Secondary Water Sources
The assessment also revealed that the access to total improved water supply by alternative
or secondary sources of drinking water was 30.9 percent (of which 21.9 percent was
borehole, 3.3 percent piped water and 5.7 percent protected well). The access to total
unimproved water supply by alternative or secondary source of drinking water was 38
percent (of which 18.7 percent was unprotected well, 16.3 percent river or lake,
and3percent other unimproved source).The assessment further revealed that another31.1
percent of the households did not have any alternative or secondary water source because
normally their main sources do not dry.
Figure 30: Secondary Water Sources
Borehole22%
Protected Well6%
Unprotected well19%
River/Lake16%
Piped Water3%
No Other Source34%
Main Water Sources by Region
The rural population accounted for 40 percent portion of unimproved water with only 15
percent unimproved water sources reporting for the urban population. The rural
households accounted for 91.8 percent of the responses for main water sources while the
urban area accounted for 8.2 percent. In the rural areas, the most common main water
source was borehole (47.6 percent), followed by unprotected well (24.0 percent). In the
urban areas, the most common main water sources were piped water (59.2 percent) and
borehole (15.3 percent).
The provincial distribution of the main water sources indicates that Luapula, Muchinga
and Central had the highest unimproved water sources with 71 percent, 68 percent and 57
percent, respectively. The provinces with the highest improved main water sources were
Eastern (82 percent), North-Western (68 percent) and Southern (67 percent).

63
Table 14: Main Water Sources by Province
Sources of Water Affected by Prolonged Dry Spell
The study revealed that 51.2 percent of the households said their main water sources were
affected by the prolonged dry spells while 48.8 percent were not affected.
Water Availability at Source
The study revealed that of the households that responded, 21 percent reported that their
main water sources dried up and 79 percent did not dry up. The most affected main water
sources which were reported to have dried up were others (50.4 percent), unprotected
wells (33.4 percent) and rivers or lakes (25.1 percent). “Other” water sources included
streams, scoop holes and springs. The households reporting water sources that did not dry
up mostly include piped water (94.1 percent), borehole (84.9 percent) and protected well
(79.7 percent).
Table 15: Main Water Sources by Water Sources Drying Up
Main Water Source Did Water Source Dry Up?
Yes No Total
River Or Lake 25.10% 74.90% 100.00%
Unprotected Well 33.40% 66.60% 100.00%
Protected Well 20.30% 79.70% 100.00%
Borehole 15.10% 84.90% 100.00%
Piped Water 5.90% 94.10% 100.00%
Other 50.40% 49.60% 100.00%
Total 21.00% 79.00% 100.00%
The study also revealed that the water level at the main source compared to the same time
last year was reported by households to be lower (44.5 percent), the same (52.3 percent)
and higher (3.2 percent). The study revealed that the main water sources whose water
level dropped compared to the previous year (2014) were unprotected wells (70.2
percent) and the river or lake (59.1 percent). However, the main water sources whose
water level remained the same include piped water (78.7 percent), borehole (65.1
Province Main Water Source
Total River Or
Lake
Unprotected
Well
Protected
Well Borehole
Piped
Water Other
Central 12.6% 44.1% 7.0% 26.5% 9.3% .5% 100.0%
Copperbelt 22.4% 28.7% 29.5% 11.5% 7.8% .1% 100.0%
Eastern 7.4% 7.3% 6.3% 74.0% 1.7% 3.2% 100.0%
Luapula 26.9% 44.1% 5.7% 20.9% 2.4% 100.0%
Muchinga 26.4% 38.2% 9.3% 14.0% 9.0% 3.0% 100.0%
Southern 10.7% 20.7% 7.9% 45.5% 13.7% 1.5% 100.0%
Northwestern 19.4% 12.9% 28.9% 36.7% 2.2% 100.0%
Western 27.8% 12.9% 22.0% 24.6% 10.9% 1.8% 100.0%
Total 13.0% 22.9% 9.6% 44.9% 7.8% 1.7% 100.0%

64
percent), protected well (50.7 percent) and others including streams, scoop holes and
springs (51.8 percent). Each main water source type was reported to have had between
2.3 and 5.3 percent of households whose water source level increased compared to the
previous year.
Table 16: Main Water Source by Water Level Change
Main Water Source Water Level Change
Total Lower Same Higher
River Or Lake 59.1% 37.5% 3.4% 100.0%
Unprotected Well 70.2% 27.4% 2.3% 100.0%
Protected Well 44.0% 50.7% 5.3% 100.0%
Borehole 31.6% 65.1% 3.2% 100.0%
Piped Water 19.1% 78.7% 2.3% 100.0%
Other 45.7% 51.8% 2.5% 100.0%
Total 44.5% 52.3% 3.2% 100.0%
Distance to Water Source
The assessment revealed that while only 8.9 percent have access to a water source within
their household premises, 29.3 percent of the respondents had access to a water source
below 100m from their household, 46.2 percent had access to a water source between
100m and 500m from their household and 15.6 percent had access to a water source
above 500m from their household.
Figure 31: Distance to Water Sources
On Premises9%
Less than 100m29%
100 - 500m46%
Above 500m16%
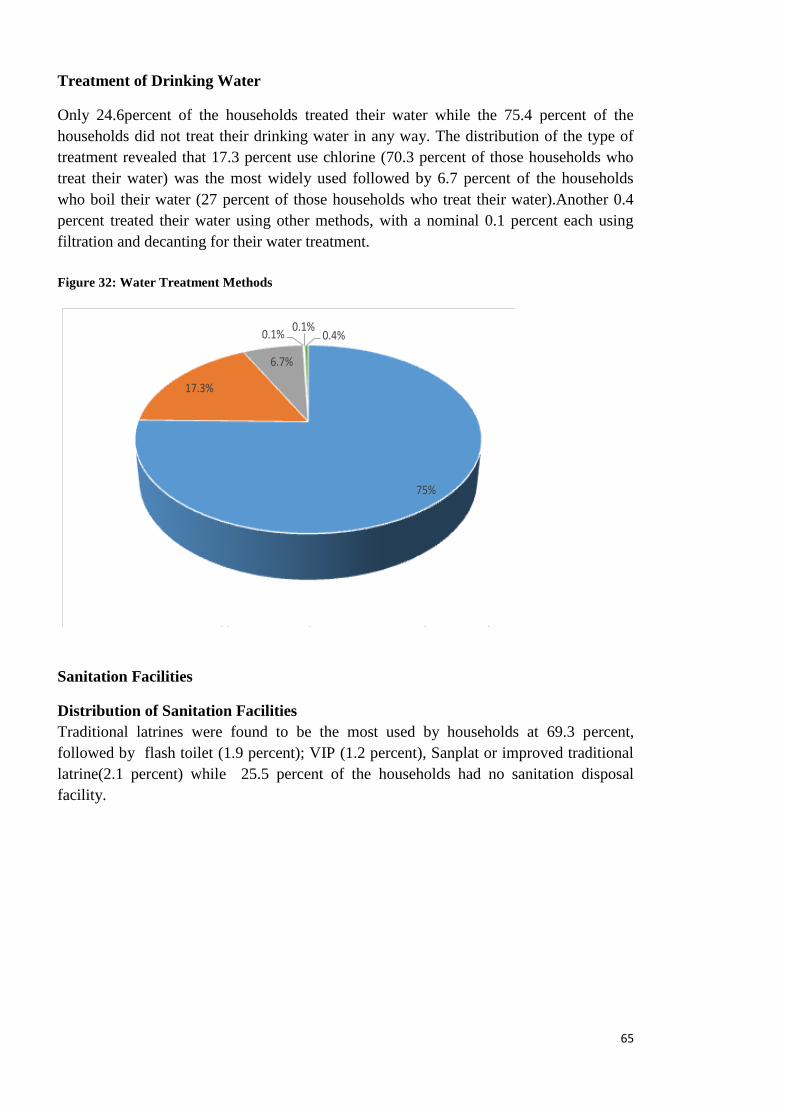
65
Treatment of Drinking Water
Only 24.6percent of the households treated their water while the 75.4 percent of the
households did not treat their drinking water in any way. The distribution of the type of
treatment revealed that 17.3 percent use chlorine (70.3 percent of those households who
treat their water) was the most widely used followed by 6.7 percent of the households
who boil their water (27 percent of those households who treat their water).Another 0.4
percent treated their water using other methods, with a nominal 0.1 percent each using
filtration and decanting for their water treatment.
Figure 32: Water Treatment Methods
75%
17.3%
6.7%
0.1%0.1%
0.4%
No Treatment Chlorination Boiling Decanting Filtering Other
Sanitation Facilities
Distribution of Sanitation Facilities
Traditional latrines were found to be the most used by households at 69.3 percent,
followed by flash toilet (1.9 percent); VIP (1.2 percent), Sanplat or improved traditional
latrine(2.1 percent) while 25.5 percent of the households had no sanitation disposal
facility.

66
Figure 33: Distribution of Sanitation Facilities
25.5%
1.9% 2.1%
69.3%
1.2%
0.0%
10.0%
20.0%
30.0%
40.0%
50.0%
60.0%
70.0%
80.0%
No facility (i.e bush, river and CAT method)
Flash Toilet Sanplat Traditional Latrine
VIP
Sanitation Facilities
Sanitation Facilities Distribution by Asset Wealth Index
The study revealed that when sanitation facilities are distributed among the three asset
wealth indices, access to traditional latrines was the highest along each of the wealth
indices: 71.4 percent (Asset Poor), 78.4 percent (Asset Medium) and 80.9 percent (Asset
Rich).
Table 17: Sanitation Facilities Distribution by Asset Wealth Index
Sanitation Facilities by Region
In the rural areas, the most common sanitation facility was the traditional latrine at 76.8
percent followed by ‘no facility at 19.5 percent while in the urban areas it was the
traditional latrines at 66.7 percent followed by flash toilet at 15.9 percent.
The provincial distribution of the sanitation facilities indicates that Central, Southern and
Muchinga had the highest households without sanitation facilities at38.9 percent, 21.8
percent and 14.2 percent, respectively. All the eight provinces had at least 57 percent
Asset Wealth
Index
Sanitation Facilities
Total Flash
Toilet VIP
Sanplat (Improved
Traditional)
Traditional
Latrine
No facility (i.e. Bush,
river, CAT Method)
Asset Poor 1.3% .7% 2.0% 71.4% 24.6% 100.0%
Asset Medium 2.6% 1.3% 2.3% 78.4% 15.3% 100.0%
Asset Rich 1.0% 5.7% 6.3% 80.9% 6.2% 100.0%
Total 2.1% 1.3% 2.4% 76.0% 18.2% 100.0%

67
coverage of traditional latrines, with the highest being North-Western with 96percent and
least being Central with 57.1percent.
Table 18: Type of Sanitation Facilities by Province
Province
Sanitation Facilities Total
Flash
Toilet VIP
Sanplat (Improved
Traditional)
Traditional
Latrine
No Facility (I.E. Bush,
River, Cat Method)
Central 1.7% 1.8% .5% 57.1% 38.9% 100.0%
Copperbelt 6.3% 1.3% 4.1% 81.4% 6.9% 100.0%
Eastern .1% .0% .6% 90.4% 8.8% 100.0%
Luapula 2.3% 1.1% 87.9% 8.8% 100.0%
Muchinga 85.8% 14.2% 100.0%
Northern 4.1% 2.5% 5.6% 65.9% 21.8% 100.0%
Northwestern .5% 1.3% 96.3% 1.9% 100.0%
Western 2.1% .6% 2.3% 93.2% 1.9% 100.0%
Total 2.1% 1.3% 2.4% 76.0% 18.2% 100.0%
Hygiene Practices
Hand washing practices before cooking and after using the toilet
The study revealed that out of the households that responded, 82.8 percent washed their
hands before preparing food and 17.2 percent did not. After using the toilet, 84 percent of
households washed their hands and 16 percent did not.
Scouring agents used for hand washing
Regarding hand washing after use of the toilet, 49.2 percent said they use soap to wash
their hands; 2.7 percent use ash and 31.9 percent only use water to wash their hands (of
those who said they washed their hands after using the toilet, 58 percent used soap; 3
percent used ash; and 1 percent used other means while 38 percent used nothing but
water).
Sanitation Facilities Distribution by Asset Wealth Index
The study revealed that the use of soap as a scouring agent in hand washing was highest
in each of the three asset wealth indices. The table below shows that among the Asset
Poor the use of soap was reported by 39.3 percent respondents; for the Asset Medium it
was 56.9 percent; and among the Asset Rich it was 77.0 percent. The use of no scouring
agent was also significantly high (38.4 percent among the Asset Poor; 28.9 percent for the
Asset Medium and only 12.3 percent among the Asset Rich).

68
Figure 34: Scouring Agents for Hand Washing
15.7%
31.9%49.2%
2.7% 0.5%
No Hand washing No Scouring agent Soap Ash Agent
Table 19: Use of Scouring Agent for Hand washing after Using the Toilet by Asset Wealth Index
Asset Wealth
Index Use of Scouring Agent for Hand washing After Using The Toilet
Total
No Scouring Agent
used Soap Ash Other
Do not wash
hands
Asset Poor 38.4% 39.3% 3.5% .6% 18.2% 100.0%
Asset Medium 28.9% 56.9% 3.0% .3% 10.9% 100.0%
Asset Rich 12.3% 77.0% 2.4% .7% 7.6% 100.0%
Total 31.4% 51.6% 3.2% .4% 13.4% 100.0%
WASH Related Diseases
The assessment showed that 69.3 percent of respondents reported to have fallen sick since
January 2015 of which 64.9 percent were due to WASH related diseases, namely, malaria
(56.1 percent), diarrhea (3.4 percent), cough (5.2 percent) and scabies (0.2 percent).

69
4.12. Developmental Projects and Safety Net Projects
Development projects and safety nets programmes are critical for reducing poverty and
boosting inclusive growth and shared prosperity as well as stimulating local economies.
This in turn helps households to better manage risks and cope with shocks in district
where they are done.
The assessment found that about 96 percent of the districts indicated that there were
development projects and safety net programmes in their districts going on at the time of
the survey. These were Home Based Care programmes (24 percent) which formed the
majority followed by Social Cash transfer (21 percent), Storage Shed (17) and General
Food Distribution (14) as shown in Figure.....
Figure 35: Districts having on – Going Development Projects and Safety Net Programmes

70
CHAPTER FIVE: CONCLUSIONS AND RECOMMENDATIONS
5.1. Agriculture and Food Security
Conclusion
No major productive assets were offloaded and/or sold in response to the
prolonged dry spells.
Livelihood diversity still remains low with majority of the households in the
assessed districts dependent on agricultural based livelihoods (e.g. crop
production, livestock rearing and agriculture wage labour).
The permanent and seasonal cash incomes in the assessed districts are also largely
agricultural based mainly being sale of crops and agricultural wage labour.
Employment of moderate to high cost coping mechanisms was high across most
of the assessed districts (RCSI).
Prolonged dry spells did have an impact on household food production which
ultimately will affect household food security especially as households move
towards the lean period.
Despite a slight increase in dietary diversity, the assessment showed that there is
over – dependency on carbohydrates (mainly maize and sweet potatoes).
Need to strengthen the extension delivery system.
Utilizing a composite index of FCS, Expenditure Share on food and coping
behaviour, the results of the survey showed that 31 districts in six provinces would
require assistance.
Recommendations
Short Term
A total of 798, 948 people (133, 158 households) from thirty one (31)districts will
require food relief amounting to 53, 242 MT of maize equivalent for a period of
eight (8) months (August,2015 – March,2016).These include: Serenje and
Chitambo (Central); Chadiza, Chipata, Katete, Lundazi, Mambwe, Nyimba,
Petauke, Sinda, Vubwi (Eastern); Samfya (Luapula) Chikankata, Gwembe,
Kazungula, Pemba, Sinazongwe (Southern); Ikelenge (North Western) and
Kalabo, Kaoma, Mulobezi, Senanga, Sesheke, Shangombo, Nalolo, Limulunga,
Nkeyema, Sikongo, Sioma, Mwandi, Luampa (Western).
There is need to monitor the evolvement of the food security situation in the
seventeen (17) districts as most of them fall within the moderately food secure
district with a possibility of graduating into food insecurity as we approach the
lean period.
There is need to strengthen the extension delivery system.
Input provision for 45,079 households in twenty-seven districts (27) districts.
71
Medium to Long Term
Livelihood diversification programmes be scaled up in order to contribute to
alternative livelihoods.
Strengthen the support on conservation farming implementation.
There is need to introduce appropriate technologies for small – scale farmers
which could enhance household food security such as water harvesting and small
scale irrigation systems.
There is need to enhance the monitoring of nutrition and food security through the
establishment of sentinel sites.
Child headed Households should be targeted for food security pack programs
Promote asset building projects among the child headed households through
Youth empowerment funds.
5.2. Health
Conclusion
Malaria was the most common disease suffered by household members especially those
in rural areas. The most affected districts were: NKeyema 100 percent, Luampa 65.5
percent, Kaoma 53.4 percent, Ngabwe 47.1 percent, Mpika 47 percent, Mwinilunga 44.2
percent, Chama 44 percent and Masaiti 43 percent. The percentages of infection for
diarrhoea, respiratory infection and other diseases were too low as a result they had no
significant consequence on household’s livelihood.
On health care seeking behavior, a bigger percentage of respondents who didn’t seek
medication at all and those who took their own medication where those who suffered
from malaria. There is need to increase the deployment of Community Health Assistants
(CHAs) to communities so as to sensitize communities on the importance of making use
of health facilities.
Fever and ARI/cough were the top two diseases that affected the under five children in
the districts were the assessment took place. ARI/cough had 29 percent and fever had
27.2 percent.
Recommendations
Short term
Increase the coverage of indoor-residual spraying and effective use of RDTs.for the
following districts; Nkeyema, Luampa, Kaoma, Ngabwe, Mpika, Mwinilunga,
Chama, and Masaiti and
There is need to develop a Statutory Instrument on the use of ITNs.
Medium to Long term
Extending malaria surveillance to community level using an active case detection
system for community level surveillance.
There is need to improve on the supply of drugs and logistics for treatment of
respiratory infections (non-pneumonia).

72
Recruit more Community Health Assistants (CHAs).
There is need to promote community based disease prevention mechanisms.
5.3. Nutrition
Conclusion
The study showed that most of the households ate two meals a day preceding the survey.
Most households that ate twice had normal meals and a reduction was seen among those
that ate three meals compared to their normal meals. This situation could be explained by
the fact that most households reported having run out of food in 30 days preceding the
survey and a reduction was observed among those who normally eat three meals.
The results indicate that the overall wasting was less than 6 percent, however, specific
districts data show high proportion of child wasting. The results showed that children
from large families and families headed by the young and the elderly had a higher chance
of becoming wasted. Hence children in these households had a higher chance of dying.
The family size contributed to child wasting due to the intra household’s food distribution
in households. Therefore, children between 6 to 24 months in larger families and
households headed by the elderly are at risk of being wasted in all the 48 districts.
The survey established that about three quarters of the children who were severely wasted
had fever, cough and diarrhea while all the children who were moderately wasted had all
the three illnesses. This shows that these illness might have contributed to the wasting
state of the children. Studies have shown that illnesses such as diarrhea increases the
nutrient loss from the body and reduces appetite hence reducing the food intake and
increasing the likelihood of wasting.
Further, the survey revealed that interventions such as supplementary and therapeutic
feeding were only available in few districts with limited coverage in each of the districts.
Therefore, vulnerable children would have been missed at targeting stage of the
intervention.
Recommendations
Short term
Children in the moderate and severe wasted should be considered for
supplementary and therapeutic feeding. The feeds should provide
adequate nutrient requirement for the children. The targeting should
consider Child headed households, households headed by the elderly and
children from larger families.
The child rations should be large enough to support the food needs of the
women. This will take care of the intra household’s food distribution in the
households since most wasted children normally come from the poorest
segments of the population.

73
There is need to intensify the monitoring of nutritional status of children
and mothers to detect under - nutrition early and target support towards the
vulnerable households in the communities.
Scale up the supplementary feeding programs and therapeutic programs to
cover vulnerable districts where wasting is high among children and
women. The districts where supplementary feeding needs to be scaled up
include Kalabo, Lukulu, Shangombo, Nalolo, Chipata, Nyimba, Petauke,
Sinda, Mwinilunga, Choma, Gwembe, Namwala, Masaiti, Limulunga,
Sioma, Samfya and Zimba. For therapeutic programmes, the districts
include Kalabo, Mulobezi, Mongu, Senanga, Shangombo, Kapiri Mposhi,
Chadiza, Lundazi, Sinda, Ikelenge, Masaiti, Chama, Mafinga, Mpika,
Limulunga, Sikongo Sioma and Siavonga.
Medium term
Promote food diversification to help in promoting diet diversity among the
households
Promote food storage for consumption and advocate for less sale on food
assets from communities who depend on own production for livelihood.
Promote infant feeding programs in the community.
Improve the service delivery to reduce childhood illnesses such as
diarrhoea and malaria.
5.4. Water, Sanitation and Hygiene
Conclusion
The population which reported main water sources that were affected (that is
lower water level than in previous years same time) is 2, 585,983 people or
430,997 households. The population that reported main water sources which dried
up is 1,082,752 people or 180,459 households.
The worst affected districts were Kaoma, Kalabo, Mitete, Sikongo, Sioma and
Luampa (Western Province); Mwinilunga and Ikelenge (North-Western
Province); Vubwi, Sinda, Chipta, Chadiza, Petauke and Lundazi (Eastern
Province); Zimba, Namwala, Gwembe, Kazungula, Choma, Kalomo (Southern
Province); Lufwanyama (Copperbelt Province); and Mafinga and Mpika
(Muchinga Province).
Majority of households in the surveyed districts did not treat their drinking water.
A large number of households in the assessed districts did not have any toilets and
practice open defeacation. The population which reported not having sanitation
facilities stood at 927,551 people (154,592 households). Districts where
households do not have sanitation facilities were mainly in Western Province.
Most of the households washed their hands with the commonest scouring agents
used being soap and ash.

74
Recommendations
Short – term (WASH)
In terms of water sources (working in liaison with MMEWD, MLGH, MOCTA, D-
WASHE, DDMC and Satellite Disaster Management Committees):
Assess and search for new water sources in needy areas;
Drill boreholes in areas where water points (21 percent) have dried and where the
distance from household to water point is more than 500m; and
Continuous monitoring the situation in case of more water points drying out and
determining alternative water sources.
Plan for operation and maintenance of existing water infrastructure.
In terms of sanitation facilities and Hygiene (working with MLGH, MOCTA, MOH,
MCDMCH, D-WASHE, DDMC and Satellite Disaster Management Committees):
Construct demonstration latrines at the schools, health centres, rural community
centres (markets, faith centers, and traditional chiefs’ palaces) as well as latrines
for vulnerable households. Work with households to build robust and appropriate
latrine versions from the start, even though the latrines may be basic.
The government at national, provincial and districts levels should encourage the
formation of a practical WASH Chiefdom and Community Action Plans for
improving WASH access generally;
Promoting CLTS, monitoring and maintaining ODF status, maintaining a clean
environment generally, and Make use of traditional leaders, local religious leaders
and the influence and opportunities they have in bringing messages of personal
cleanliness and well-being to their community.
There is need to increase availability of chlorine at rural health centers level in all
the affected districts
o Create WASH awareness programme
Medium and long term (WASH)
In terms of sanitation facilities and Hygiene (working with MLGH, MOCTA, MOH,
MCDMCH, D-WASHE, DDMC and Satellite Disaster Management Committees):
Community involvement in planning, design and construction of water
infrastructure (e.g., small dams and ancillary works) and in watershed
management
Piloting and promoting of water supply and sanitation technology options that are
climate resilient.
In terms of sanitation facilities and Hygiene (working with MLGH, MOCTA, MOH,
MCDMCH, D-WASHE, DDMC and Satellite Disaster Management Committees):
Provide external technical advice in challenging environments while ensuring full
consultation with beneficiaries regarding technical challenges and solutions. Some
“Smart” subsidies could be targeted to particularly vulnerable groups (including

75
cash transfers), or to households facing significant technical and physical
challenges to latrine building (mason/ artisan technical support).
Build sanitation shops at District/Chiefdom level to sell sanitation facilities and
give advice on improved sanitation facility construction, operation and
maintenance

76
ANNEXES

77
Annex 1: Map Showing Districts Visited

78
Annex 2: Estimated Population of the Sampled Households per District
PROVINCE DISTRICT TARGETED POPULATION VISITED AREAS
Total
Population
Total
Households SEAs Households SEAs Households
Central Kapiri
Mposhi 232 548 41 918 15 150 15 155
Ngabwe 21 548 4 059 15 150 5 17
Serenje 64 432 11 477 15 150 15 151
Subtotal 318 528 57 454 45 450 35 323
Copperbelt Lufwanyma 78 503 15 597 15 150 15 152
Masaiti 103 857 20 511 15 150 15 152
Subtotal 182 360 36 108 30 300 30 304
Eastern Chadiza 62 742 11 218 15 150 15 149
Chipata 455 783 88 065 15 150 15 149
Katete 160 985 30 686 15 150 15 152
Lundazi 323 870 62 069 15 150 15 149
Mambwe 68 918 13 196 15 150 15 147
Nyimba 85 025 16 040 15 150 15 131
Petauke 307 889 59 154 15 150 15 141
Sinda 82 864 16 166 15 150 15 152
Vubwi 44 585 8 604 15 150 15 152
Subtotal 1 592 661 305 198 135 1 350 135 1 322
Luapula Samfya 198 911 39 979 15 150 15 149
Subtotal 198 911 39 979 15 150 15 149
Muchinga Chama 103 894 19 420 15 150 11 110
Mafinga 65 969 12 648 15 150 15 150
Mpika 203 379 39 956 15 150 15 153
Subtotal 373 242 72 024 45 450 41 413
NorthWestern Ikelenge 11 970 69 608 15 150 15 141
Mwinilunga 92 321 16 836 15 150 15 150
Subtotal 104 291 86 444 30 300 30 291
Southern Chikankata 59 909 11 070 15 150 15 149
Choma 180 673 33 069 15 150 15 150
Gwembe 53 117 9 846 15 150 15 150
Kalomo 188 693 31 838 15 150 15 122
Kazungula 104 731 20 024 15 150 15 150
Mazabuka 171 063 32 341 15 150 15 149
Monze 191 872 32 849 15 150 15 149
Namwala 102 866 16 662 15 150 15 150
Pemba 67 187 11 414 15 150 15 150
Siavonga 90 213 17 757 15 150 15 151
Sinazongwe 101 617 19 721 15 150 15 150
Zimba 69 877 12 890 15 150 15 152
Subtotal 1 381 818 249 481 180 1 800 180 1 772
Western Kalabo 83 442 16 942 15 150 15 119
Kaoma 189 290 36 068 15 150 15 151
Limulunga 50 741 10 180 15 150 15 150
Luampa 43 840 8 422 15 150 15 122
Lukulu 58 534 16 676 15 150 15 149
Mitete 27 468 5 446 15 150 15 138
Mongu 128 844 26 425 15 150 15 156
Mulobezi 30 482 6 075 15 150 15 143
Mwandi 25 054 5 065 15 150 15 151
Nalolo 55 569 10 841 15 150 15 150

79
PROVINCE DISTRICT TARGETED POPULATION VISITED AREAS
Total
Population
Total
Households SEAs Households SEAs Households
Nkeyema 42 170 10 841 15 150 15 150
Senanga 70 937 14 321 15 150 15 150
Sesheke 43 848 9 019 15 150 15 151
Shang'ombo 54 903 11 503 15 150 15 150
Sikongo 45 462 9 538 15 150 15 150
Sioma 38 400 7 526 15 150 15 152
Subtotal 988 984 204 888 240 2 400 240 2 332
Grand Total 5 140 795 1 051 576 720 7 200 706 6 906

80
Annex 3: Districts Selected for Provision of Relief Food by Ward
Province District
FOOD SECURITY STATUS
Percentage Affected
Households Requiring Support
Affected Population
Cereal Requirement-Full Ration (8.33
kg/P/M) August 15 to March 16 Food Secure
Marginally Food Secure
Moderately Food Insecure
Severely Food Insecure
Hhlds Proportion Hhlds Proportion Hhlds Proportion Hhlds Proportion
Central
Chitambo 1222 7,329
488
Serenje 2,089 31.0% 2,074 30.7% 2,219 32.9% 367 5.4% 38.3% 2,586 15,517 1,034
3,808 22,846 1,522
Eastern Chadiza 1,092 16.0% 2,034 29.8% 3,246 47.5% 456 6.7% 54.2% 3,702 22,211 1,480
Chipata 1,656 12.0% 4,667 33.9% 6,288 45.7% 1,162 8.4% 54.1% 7,450 44,702 2,979
Katete 2,844 17.3% 5,278 32.1% 6,771 41.2% 1,555 9.5% 50.6% 8,326 49,957 3,329
Lundazi 7,448 23.0% 14,400 44.4% 8,193 25.3% 2,400 7.4% 32.7% 10,593 63,559 4,236
Mambwe 1,408 22.1% 2,630 41.2% 1,997 31.3% 343 5.4% 36.7% 2,340 14,041 936
Nyimba 791 11.5% 1,957 28.5% 3,625 52.8% 492 7.2% 60.0% 4,117 24,701 1,646
Petauke 1,696 6.5% 6,704 25.7% 14,039 53.9% 3,628 13.9% 67.8% 17,667 106,004 7,064
Sinda 722 9.0% 1,563 19.5% 3,158 39.4% 2,565 32.0% 71.5% 5,723 34,337 2,288
Vubwi 425 9.8% 1,279 29.6% 2,117 49.0% 499 11.6% 60.6% 2,616 15,694 1,046
62,534 375,205 25,004
Luapula Samfya 4,424 17.8% 9,568 38.6% 8,289 33.4% 2,532 10.2% 43.6% 10,821 64,926 4,327
North Western
Ikelenge 645 18.2% 1,267 35.7% 1,263 35.6% 373 10.5% 46.1% 1,636 9,818 654
Southern
Chikankata 1,653 25.0% 2,546 38.5% 2,303 34.8% 111 1.7% 36.5% 2,413 14,480 965
Gwembe 630 11.0% 2,744 47.8% 1,996 34.8% 368 6.4% 41.2% 2,363 14,179 945
Kazungula 3,257 24.6% 5,727 43.2% 3,898 29.4% 374 2.8% 32.2% 4,272 25,631 1,708
Pemba 1,339 20.0% 2,823 42.3% 2,252 33.7% 266 4.0% 37.7% 2,519 15,112 1,007

81
Province District
FOOD SECURITY STATUS
Percentage Affected
Households Requiring Support
Affected Population
Cereal Requirement-Full Ration (8.33
kg/P/M) August 15 to March 16 Food Secure
Marginally Food Secure
Moderately Food Insecure
Severely Food Insecure
Hhlds Proportion Hhlds Proportion Hhlds Proportion Hhlds Proportion
Sinazongwe 2,722 26.8% 3,905 38.5% 2,695 26.6% 815 8.0% 34.6% 3,510 21,062 1,404
25,898 155,389 10,355
Western
Kalabo 576 7.3% 2,824 35.9% 2,869 36.4% 1,604 20.4% 56.8% 4,473 26,836 1,788
Kaoma 8,081 27.2% 11,559 38.9% 8,322 28.0% 1,779 6.0% 34.0% 10,101 60,605 4,039
Mulobezi 822 22.7% 1,179 32.5% 1,373 37.8% 255 7.0% 44.9% 1,628 9,769 651
Senanga 726 10.0% 2,979 41.1% 2,578 35.5% 974 13.4% 48.9% 3,552 21,310 1,420
Sesheke 1,431 30.4% 1,822 38.7% 1,251 26.6% 204 4.3% 30.9% 1,455 8,730 582
Shangombo 673 12.7% 2,255 42.4% 1,793 33.7% 598 11.2% 45.0% 2,391 14,347 956
Nalolo 867 15.9% 1,503 27.5% 2,241 41.0% 860 15.7% 56.7% 3,101 18,604 1,240
Limulunga 1,466 28.5% 1,032 20.1% 1,955 38.0% 692 13.5% 51.5% 2,647 15,881 1,058
Western
Nkeyema - .0% 25 100.0% - .0% - .0% .0% 1,757 10,543 703
Sikongo 83 1.5% 897 16.7% 2,811 52.5% 1,564 29.2% 81.7% 4,375 26,248 1,749
Sioma 440 9.8% 1,490 33.2% 1,720 38.4% 835 18.6% 57.0% 2,555 15,328 1,021
Mwandi 878 31.1% 1,097 38.9% 675 24.0% 169 6.0% 29.9% 844 5,065 338
Luampa 202 17.7% 533 46.8% 236 20.7% 168 14.8% 35.5% 404 2,425 162
40,918 245,507 16,361
TOTAL
133,158 798,948 53,241.90

82
Annex 4: Districts Requiring Support broken into Wards
Province District Affected Wards
Food Security Situation Cereal Requirement-
Full Ration (8.33 kg/P/M) August 15 to
March 16
Cereal Requirement (August - October
2015)
Cereal Requirement (Nov 2015 - March 2016) Moderately Food
Insecure Severely Food
Insecure
Hhlds Propn Hhlds Propn Ration (Mt) Ration (Mt)
Central Chitambo 488 Mpelembe 44
16 27
Luombwa 48
18
30
Chalilo 171 64
107
Chitambo 225 84
141
Sub - total 488 183 305
Serenje 2,219 32.90% 367 5.40% 1,034 Chisomo 109 18
7 44
Mailo 312 52 21
125
Kanona 269 45 18
108
Serenje 223 37 15
89
Kabansa 34 6 2
14
Lukasashi 151 25 10
60
Sancha 225 37 15
90
Chibale 325 54 22
130
Masaninga 570 94 38
228
Sub - total 2,219 367 1,034 147
887

83
Province District Affected Wards
Food Security Situation Cereal Requirement-
Full Ration (8.33 kg/P/M) August 15 to
March 16
Cereal Requirement (August - October
2015)
Cereal Requirement (Nov 2015 - March 2016) Moderately Food
Insecure Severely Food
Insecure
Hhlds Propn Hhlds Propn Ration (Mt) Ration (Mt)
Eastern Chadiza 3,246 47.50% 456 6.70% 1,480
Chamandala 1,074 151
60 429
Kampini 1,134 159
64 453
Taferansoni 1,039 146
58 415
Sub - total 3,246 456
182 1,298
Vubwi 2,117 49.00% 499 11.60% 1,046
Mbozi 326
77
31 130
Zozwe 718
169
68 287
Mlawe 386
91
36 154
Vubwi 687
162
65 275
Sub - total 2,117
499
200 846
Chipata 6,288 45.70% 1,162 8.40% 2,979
Nsingo 2,365 437
175 946
Khova 1,128 208
83 451
Chikando 2,795 516
207 1,117
Sub - total 6,288 1,162
465 2,514

84
Province District Affected Wards
Food Security Situation Cereal Requirement-
Full Ration (8.33 kg/P/M) August 15 to
March 16
Cereal Requirement (August - October
2015)
Cereal Requirement (Nov 2015 - March 2016) Moderately Food
Insecure Severely Food
Insecure
Hhlds Propn Hhlds Propn Ration (Mt) Ration (Mt)
Katete 6,771 41.20% 1,555 9.50% 3,329
Chimwa 280 64
26 112
Dole 1,480 340
136 592
Kafumbwe 1,190 273
109 476
Katiula 1,572 361
144 629
Kazala 1,378 317
127 551
Milanzi 871 200
80 348
Sub - total 6,771 1,555
622 2,707
Lundazi 8,193 25.30% 2,400 7.40% 4,236
Chimaliro 978 287
115 391
Chilola 992 290
116 397
Kapirisanga 1,011 296
118 404
Lumimba 802 235
94 321
Lunevwa 1,443 423
169 577
Luwelezi 450 132
53 180
Magodi 1,637 479
192 654
Ndonda 880 258
103 352
Sub - total 8,193 2,400
960 3,276

85
Province District Affected Wards
Food Security Situation Cereal Requirement-
Full Ration (8.33 kg/P/M) August 15 to
March 16
Cereal Requirement (August - October
2015)
Cereal Requirement (Nov 2015 - March 2016) Moderately Food
Insecure Severely Food
Insecure
Hhlds Propn Hhlds Propn Ration (Mt) Ration (Mt)
Mambwe 1,997 31.30% 343 5.40% 936
Chipapa 246 42 17 98
Jumbe 255 44 17 102
Kakumbi 731 126 50 292
Malama 25 4 2 10
Mkanya 343 59 24 137
Nsemfu 397 68 27 159
Sub - total 1,997 343 137 799
Nyimba 3,625 52.80% 492 7.20% 1,646
Chinsimbwe 153 21
8 61
Katipa 182 25
10 73
Ng'ombe 822 112
45 328
Chamilala 661 90
36 264
Chinambi 1,442 196
78 576
Luangwa 365 50
20 146
Sub - total 3,625 492
197 1,449

86
Province District Affected Wards
Food Security Situation Cereal Requirement-
Full Ration (8.33 kg/P/M) August 15 to
March 16
Cereal Requirement (August - October
2015)
Cereal Requirement (Nov 2015 - March 2016) Moderately Food
Insecure Severely Food
Insecure
Hhlds Propn Hhlds Propn Ration (Mt) Ration (Mt)
Petauke 14,039 53.90% 3,628 13.90% 7,064
Lusangazi 756 195
78 302
Ukwimi 3,108 803
321 1,243
Chisangu 2,704 699
279 1,081
Mawanda 4,087 1,056
422 1,634
Mateyo Mzeka 3,384 875
350
1,353
Sub - total 14,039 3,628
1,451 5,613
Sinda 3,158 39.40% 2,565 32.00% 2,288
Kamwaza 280 228
91 112
Nchingilizya 195 158
63 78
Lwandazi 311 253
101 124
Chiwuyu 340 276
110 136
Sinda 527 428
171 211
Mnyamanzi 207 168
67 83
Nyamasonkho 383 311
124
153
Mungomba 399 324
129
159
Kasandazi 365 296
118
146
Chitawe 151 123
49
60
Sub - total 3,158 2,565 1,025 1,263

87
Province District Affected Wards
Food Security Situation Cereal Requirement-
Full Ration (8.33 kg/P/M) August 15 to
March 16
Cereal Requirement (August - October
2015)
Cereal Requirement (Nov 2015 - March 2016) Moderately Food
Insecure Severely Food
Insecure
Hhlds Propn Hhlds Propn Ration (Mt) Ration (Mt)
Luapula Samfya 8,289 33.40% 2,532 10.20% 4,327
Chinkutila 943 288 115
377
Chishi 443 135 54
177
Isamba 773 236 94
309
Kapata 1,504 459 184
601
Kapilibila 321 98 39
128
Kasaba 1,028 314 125
411
Kasongole 606 185 74
242
Katanshya 953 291 116
381
Lumamya 480 147 59
192
Mbabala 458 140
56 183
Musaba 780 238
95 312
Sub - total 8,289 2,532
1,012 3,315
North Western
Ikelenge 1,263 35.60% 373 10.50% 654
Ikelenge 336 99
40
134
Jimbe 163 48
19
65
Mukangala 189 56
22
76
Mwininyilamba 220 65
26 88
Nyakaseya 354 105
42
142
Sub - total 1,263 373 149 505

88
Province District Affected Wards
Food Security Situation Cereal Requirement-
Full Ration (8.33 kg/P/M) August 15 to
March 16
Cereal Requirement (August - October
2015)
Cereal Requirement (Nov 2015 - March 2016) Moderately Food
Insecure Severely Food
Insecure
Hhlds Propn Hhlds Propn Ration (Mt) Ration (Mt)
Southern Chikankata 2,303 34.80% 111 1.70% 965
921
Chitete 483 23
9 193
Kasengo
301 14 6
120
Mabwe Atuba
582 28 11
233
Musaya
55 3 1
22
Namalundu
370 18 7
148
Upper Kaleya
512 25 10
205
Sub - total 2,303 111 44
921
Gwembe 1,996 34.80% 368 6.40% 945
Bbondo
611 113 45 244
Chibuwe
406 75 30 162
Kkoma
394 73 29 158
Kota Kota
75 14 6 30
Luumbo
271 50 20 109
Sinafala
140 26 10 56
Siampande
99 18 7 40
Sub - total 1,996 368 147 798
Kazungula
3,898 29.40% 374 2.80% 1,708 150
Chooma
270 26
10
108
Katapazi
291 11

89
Province District Affected Wards
Food Security Situation Cereal Requirement-
Full Ration (8.33 kg/P/M) August 15 to
March 16
Cereal Requirement (August - October
2015)
Cereal Requirement (Nov 2015 - March 2016) Moderately Food
Insecure Severely Food
Insecure
Hhlds Propn Hhlds Propn Ration (Mt) Ration (Mt)
28 116
Kauwe
257 25
10
103
Mandia
475 46
18
190
Mukuni
447 43
17
179
Moomba
113 11
4
45
Musokotwane
227 22
9
91
Nguba
413 40
16
165
Ngwezi
453 43
17
181
Nyawa
450 43
17
180
Sekute
150 14
6
60
Sikauzwe
352 34
14
141
Sub - total 3,898 374
150
1,558
Pemba 2,252 33.70% 266 4.00% 1,007
Habunkululu
159 19
7
64
Hamaundu
653 77
31
261
Kasiya
435 51
20
174
Kauba
253 30
12
101
Maambo
437 52
21
175
Nachibanga
316 37
15
126
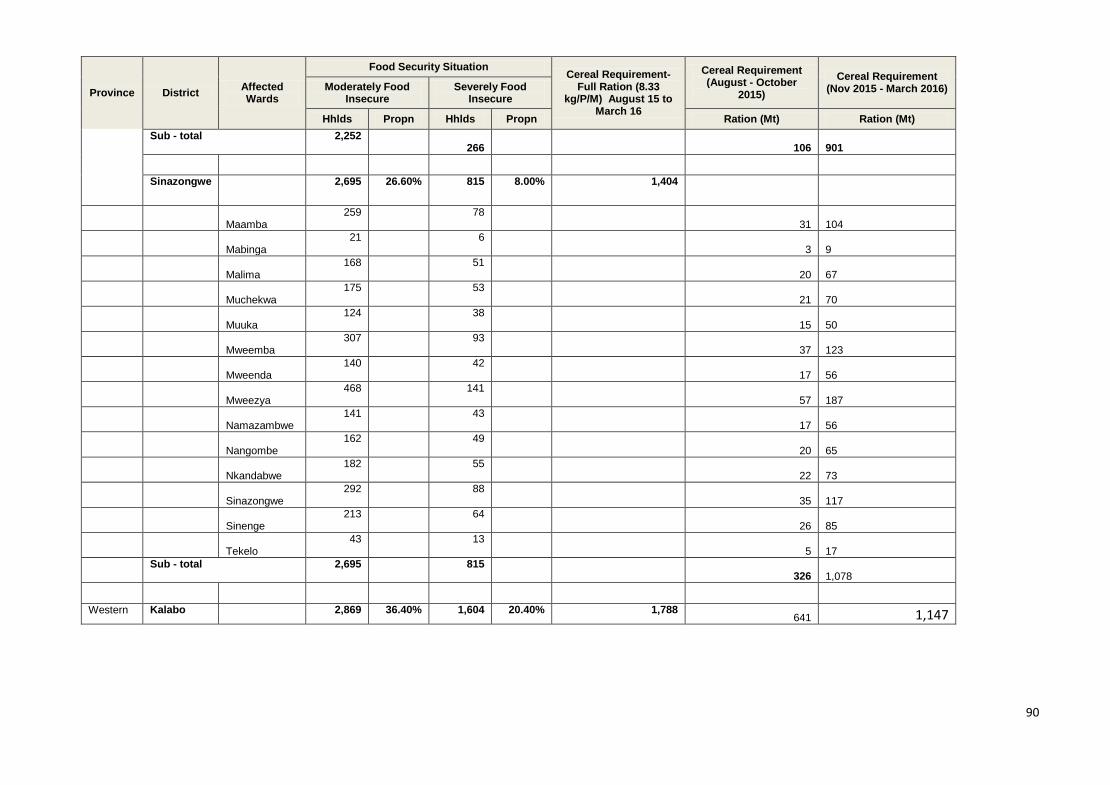
90
Province District Affected Wards
Food Security Situation Cereal Requirement-
Full Ration (8.33 kg/P/M) August 15 to
March 16
Cereal Requirement (August - October
2015)
Cereal Requirement (Nov 2015 - March 2016) Moderately Food
Insecure Severely Food
Insecure
Hhlds Propn Hhlds Propn Ration (Mt) Ration (Mt)
Sub - total 2,252 266
106
901
Sinazongwe 2,695 26.60% 815 8.00% 1,404
Maamba 259
78 31
104
Mabinga
21 6 3
9
Malima
168 51 20
67
Muchekwa
175 53 21
70
Muuka
124 38 15
50
Mweemba
307 93 37
123
Mweenda
140 42 17
56
Mweezya
468 141 57
187
Namazambwe
141 43 17
56
Nangombe
162 49 20
65
Nkandabwe
182 55 22
73
Sinazongwe
292 88 35
117
Sinenge
213 64 26
85
Tekelo
43 13 5
17
Sub - total 2,695 815 326
1,078
Western Kalabo 2,869 36.40% 1,604 20.40% 1,788 641 1,147

91
Province District Affected Wards
Food Security Situation Cereal Requirement-
Full Ration (8.33 kg/P/M) August 15 to
March 16
Cereal Requirement (August - October
2015)
Cereal Requirement (Nov 2015 - March 2016) Moderately Food
Insecure Severely Food
Insecure
Hhlds Propn Hhlds Propn Ration (Mt) Ration (Mt)
Luanginga
304 170 68
122
Buleya
158 88 35
63
Ndoka
296 166 66
119
Namulilo
274 153 61
110
Nguma
151 84 34
60
Lutwi
215 120 48
86
Kandambo
129 72 29
52
Yuka
276 155 62
111
Liumba
124 69 28
50
Mapungu
134 75 30
54
Likulundundu
78 43 17
31
Salunda
114 64 26
46
Sishekanu
203 114 45
81
Luola
65 36 14
26
Libonda
265 148 59
106
Siluwe
82 46 18
33
Sub - total 2,869 1,604 641
1,147
Kaoma 8,322 28.00% 1,779 6.00% 4,039
Kanabilumbu
240 51 20
96

92
Province District Affected Wards
Food Security Situation Cereal Requirement-
Full Ration (8.33 kg/P/M) August 15 to
March 16
Cereal Requirement (August - October
2015)
Cereal Requirement (Nov 2015 - March 2016) Moderately Food
Insecure Severely Food
Insecure
Hhlds Propn Hhlds Propn Ration (Mt) Ration (Mt)
Kapili
172 37 15
69
Lalafuta
507 108 43
203
Longe
577 123 49
231
Luambuwa
557 119 48
223
Mangango
391 84 33
156
Mulamatila
1,692 362 145
677
Mushwala
1,282 274 110
513
Naliele
530 113 45
212
Namafulo
1,269 271 108
507
Shikombwe
506 108 43
202
Shitwa
601 128 51
240
Sub - total 8,322 1,779 711
3,328
Mulobezi 1,373 37.80% 255 7.00% 651
Kamanga
150 28
11 60
Luamuloba
177 33
13 71
Mulobezi
199 37
15 80
Machile
161 30
12 65
Nawinda
228 42
17 91
Sichili
458 85
34 183

93
Province District Affected Wards
Food Security Situation Cereal Requirement-
Full Ration (8.33 kg/P/M) August 15 to
March 16
Cereal Requirement (August - October
2015)
Cereal Requirement (Nov 2015 - March 2016) Moderately Food
Insecure Severely Food
Insecure
Hhlds Propn Hhlds Propn Ration (Mt) Ration (Mt)
Sub - total 1,373 255
102 549
Senanga 2,578 35.50% 974 13.40% 1,420
Imatanda
808 305
122
323
Imatongo
352 133
53
141
Lumbe
186 70
28
74
Mwanambuyu
510 193
77
204
Naluywa
274 104
41
110
Sibukali
224 85
34
90
Wanyau
224 85
34
90
Sub - total 2,578 974
389
1,031
Sesheke 1,251 26.60% 204 4.30% 582
Imusho
65 11
4
26
Kalobolelwa
145 24
10
58
Luampungu
138 22
9
55
Lusu
90 15
6
36
Maondo
241 39
16
96
Mulimambango
572 93
38
229
Sub - total 1,251 204
82
500

94
Province District Affected Wards
Food Security Situation Cereal Requirement-
Full Ration (8.33 kg/P/M) August 15 to
March 16
Cereal Requirement (August - October
2015)
Cereal Requirement (Nov 2015 - March 2016) Moderately Food
Insecure Severely Food
Insecure
Hhlds Propn Hhlds Propn Ration (Mt) Ration (Mt)
Shangombo 1,793 33.70% 598 11.20% 956
Kaunga Mashi 154
51
21 62
Kayana
206 69
27 82
Mambolomoka
370 123
49 148
Mulonga
296 99
40 119
Sikabenga
285 95
38 114
Simu
228 76
30 91
Sipuma
253 84
34 101
Sub - total 1,793 598
239 717
Nalolo 2,241 41.00% 860 15.70% 1,240
Lyamakumba 467 179
72 187
Silowana 274 105
42 110
Shekela 293 112
45 117
Makoka 259 99
40 104
Kambai 267 102
41 107
Kataba 187 72
29 75
Muoyo 213 82
33 85
Nanjucha 280 107
43 112

95
Province District Affected Wards
Food Security Situation Cereal Requirement-
Full Ration (8.33 kg/P/M) August 15 to
March 16
Cereal Requirement (August - October
2015)
Cereal Requirement (Nov 2015 - March 2016) Moderately Food
Insecure Severely Food
Insecure
Hhlds Propn Hhlds Propn Ration (Mt) Ration (Mt)
Sub - total 2,241 860
344 896
Limulunga 1,955 38.00% 692 13.50% 1,058
Limulunga 561
199
79 224
Mabili 152 54
21
61
Ikwichi 141 50
20
56
Namboma 211 75
30
84
Nangula 469 166
66
187
Ushaa 190 67
27
76
Simaa 177 63
25
71
Ndanda 55 20
8
22
Sub - total 1,955 692
277
781
Western Nkeyema - 0.00% - 0.00% 703
Litoya 56
94
Namilangi 133
222
Nkeyema 74
123
Sub - total 263
439.07
Sikongo 2,811 52.50% 1,564 29.20% 1,749 625

96
Province District Affected Wards
Food Security Situation Cereal Requirement-
Full Ration (8.33 kg/P/M) August 15 to
March 16
Cereal Requirement (August - October
2015)
Cereal Requirement (Nov 2015 - March 2016) Moderately Food
Insecure Severely Food
Insecure
Hhlds Propn Hhlds Propn Ration (Mt) Ration (Mt)
Licha
529 295 118
212
Liumena
428 238 95
171
Lueti
563 313 125
225
Lulangunyi
161 90 36
64
Lwambi
103 57 23
41
Maala
370 206 82
148
Mutala
103 58 23
41
Mwenyi
233 130 52
93
Tuuwa
320 178 71
128
Sub - total 2,811 1,564 625
1,124
Sioma 1,720 38.40% 835 18.60% 1,021
Beshe
122 59 24
49
Kalongola
132 64 26
53
Mbeta
590 286 115
236
Mutomena
490 238 95
196
Nalwashi
146 71 28
58
Sioma
240 116 47
96
Sub - total 1,720 835 334
687

97
Province District Affected Wards
Food Security Situation Cereal Requirement-
Full Ration (8.33 kg/P/M) August 15 to
March 16
Cereal Requirement (August - October
2015)
Cereal Requirement (Nov 2015 - March 2016) Moderately Food
Insecure Severely Food
Insecure
Hhlds Propn Hhlds Propn Ration (Mt) Ration (Mt)
Mwandi 675 24.00% 169 6.00% 338
Loanja
88
22
9 35
Lwazamba
126
31
13 50
Mabumbu
109
27
10 44
Magumwi
79
20
8 31
Mushukula
96
24
10 38
Mwandi
108
27
11 43
Sankolonga
42
11
4 17
Simungoma
28
7
3 11
Sub - total 675
169
67 270
Luampa 236 20.70% 168 14.80% 162 67 95
Luampa
54
39
15
22
Mbanyutu
16
11
4
6
Mulwa
34
24
10
14
Namando
10
7
3
4
Nkenga
74
52
21
30
Nyambi
49
35
13
20
Sub - total 236
168
66
95

98
Province District Affected Wards
Food Security Situation Cereal Requirement-
Full Ration (8.33 kg/P/M) August 15 to
March 16
Cereal Requirement (August - October
2015)
Cereal Requirement (Nov 2015 - March 2016) Moderately Food
Insecure Severely Food
Insecure
Hhlds Propn Hhlds Propn Ration (Mt) Ration (Mt)
TOTAL 53,241.90 11,643.96
41,597.98

Annex 4: Assessment Team Composition
Team Province Districts Names
1 Central and Luapula
Samfya , Serenje and Ngabwe
Team Leader: Duncan Musama
Team Members:
Oliver Malupande
Batesheba Musonda
Orbrie Chewe
2 Central and Copperbelt Kapiri Mposhi, Lufwanyama and Masaiti
Team Leader: Elijah Sanga
Team Members
Daisy Namuyemba
Constance Ngwane
Brian Bwalya
3 Eastern Vubwi,Chipata and Chadiza
Team Leader: Adrian Phiri
Team Members:
Mercy Mbewe
Lawrence Phiri
Albert Sichivula
4 Eastern Lundazi, Mambwe and Katete
Team Leader: Bisa Bwalya
Team Members
Emma Nyirenda
Muunga T. Maunga
Felix Mwale

100
Team Province Districts Names
5 Eastern Petauke ,Nyimba ,Sinda
Team Leader: Francis Zulu
Team Members:
Allan Siwakwi
Mark Denga
Siyabonga Phiri
6 Muchinga Chama,Mafinga,Mpika
Team Leader: Boniface Kanjere
Team Members:
Emmanuel Chibwe
Lloyd Chiyana
Chibwe Kabaso
7 North-Western Ikelenge and Mwinilunga
Team Leader: Patricia Sakala
Team Members:
Humphrey Luwaya
Martin Nsakanya
Quine Chiti
8 Southern Kazungula,Kalomo,Zimba
Team Leader: Erwin Miyoba
Team Members:
Martin Mwanza
Cyrus Mwape
Cathrine Mumba
9 Southern Namwala,Choma and Gwembe
Team Leader: Claudius Hakapya
Team Members:
Rachael Banda

101
Team Province Districts Names
Moono Mutambwa
Mwanida Mugala
10 Southern Pemba,Monze and Sinazongwe
Team Leader: Robert Mwanza
Team Members:
James Kamocha
Angela Bwalya
Muka Mutale
11 Southern Siavonga, Mazabuka and Chikankata
Team Leader: Steven Kateshi
Team Members:
Gift Himuhya
Rhoda Sichone
Temwani Nyasulu
12 Western Kalabo and Sikongo
Team Leader: Joseph Pupe
Team Members:
Earnest Lilengo
Romeo Muchelemba Musonda Chibwe
13 Western Sesheke, Mulobezi and Mwandi
Team Leader: Victor Sinyangwe
Team Members:
Mulele Namasiku
Prudence Ng’oma
Chileshe Musonda

102
Team Province Districts Names
14 Western Sioma and Shangombo
Team Leader: Cuthbert Kapumpe
Team Members:
Nchimunya Chiiya
Benjamin Shawa
Charity Mwewa
15 Western Senanga, Nalolo and Limulunga
Team Leader: Robinson Mtonga
Team Members:
Charity Siyanga
Diana Hambote
Paphild Munachonga
16 Western Mitete, Lukulu and Mongu
Team Leader: Christopher Chitembo
Team Members:
Mwauluka Lubinda
Fredrick Nyirenda
Cathrine Musonda Mwape
17 Western Kaoma, Luampa and Nkeyema
Team Leader: Quintine Hamonga
Team Members
Fabian Mubuyaeta
Caroline Malambo
Edgars Kaheha

103
Annex 5: Editorial Team
Name Institution
YandeMwape DMMU
Allan Mulando UNWFP
LenganjiSikaona DMMU
Evans Kapekele DMMU
Lusajo Ambukege DMMU