Improving our Ability to Nowcast Winter Weather in Complex ...
30
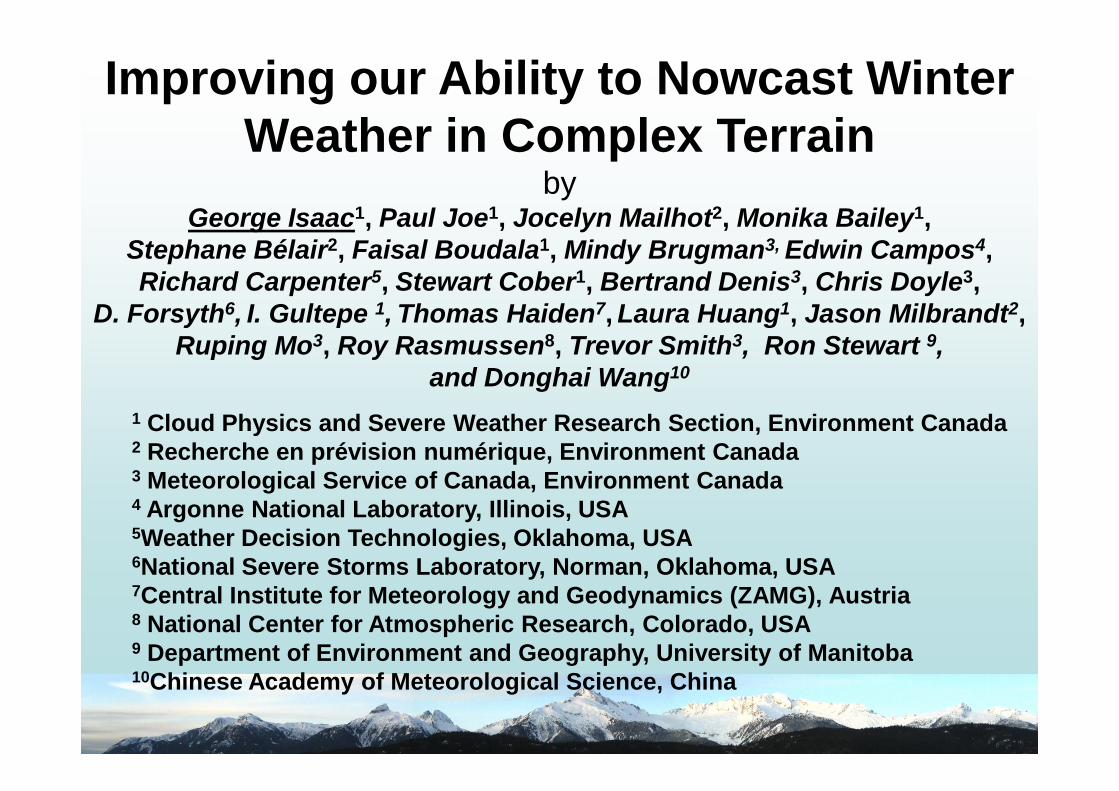
Improving our Ability to Nowcast Winter Weather in Complex Terrain by George Isaac 1 , Paul Joe 1 , Jocelyn Mailhot 2 , Monika Bailey 1 , Stephane Bélair 2 , Faisal Boudala 1 , Mindy Brugman 3, Edwin Campos 4 , Richard Carpenter 5 , Stewart Cober 1 , Bertrand Denis 3 , Chris Doyle 3 , D. Forsyth 6 , I. Gultepe 1 , Thomas Haiden 7 , Laura Huang 1 , Jason Milbrandt 2 , Ruping Mo 3 , Roy Rasmussen 8 , Trevor Smith 3 , Ron Stewart 9 , and Donghai Wang 10 1 Cloud Physics and Severe Weather Research Section, Environment Canada 2 Recherche en prévision numérique, Environment Canada 3 Meteorological Service of Canada, Environment Canada 4 Argonne National Laboratory, Illinois, USA 5 Weather Decision Technologies, Oklahoma, USA 6 National Severe Storms Laboratory, Norman, Oklahoma, USA 7 Central Institute for Meteorology and Geodynamics (ZAMG), Austria 8 National Center for Atmospheric Research, Colorado, USA 9 Department of Environment and Geography, University of Manitoba 10 Chinese Academy of Meteorological Science, China
Transcript of Improving our Ability to Nowcast Winter Weather in Complex ...
Improving our Ability to Nowcast WinterWeather in Complex Terrain
byGeorge Isaac1, Paul Joe1, Jocelyn Mailhot2, Monika Bailey1,
Stephane Bélair2, Faisal Boudala1, Mindy Brugman3, Edwin Campos4,Richard Carpenter5, Stewart Cober1, Bertrand Denis3, Chris Doyle3,
D. Forsyth6, I. Gultepe 1, Thomas Haiden7, Laura Huang1, Jason Milbrandt2,Ruping Mo3, Roy Rasmussen8, Trevor Smith3, Ron Stewart 9,
and Donghai Wang10
1 Cloud Physics and Severe Weather Research Section, Environment Canada2 Recherche en prévision numérique, Environment Canada3 Meteorological Service of Canada, Environment Canada4 Argonne National Laboratory, Illinois, USA5Weather Decision Technologies, Oklahoma, USA6National Severe Storms Laboratory, Norman, Oklahoma, USA7Central Institute for Meteorology and Geodynamics (ZAMG), Austria8 National Center for Atmospheric Research, Colorado, USA9 Department of Environment and Geography, University of Manitoba10Chinese Academy of Meteorological Science, China

Main Goals ofScience of Nowcasting Olympic Weather
for Vancouver 2010 (SNOW-V10)
• To improve our understanding and ability toforecast/nowcast low cloud, and visibility;
• To improve our understanding and ability toforecast precipitation amount and type;
• To improve forecasts of wind speed, gusts anddirection;
• To develop better forecast system productionsystem(s).
• Assess and evaluate value to end users;• To increase the capacity of WMO member
states (Training component).
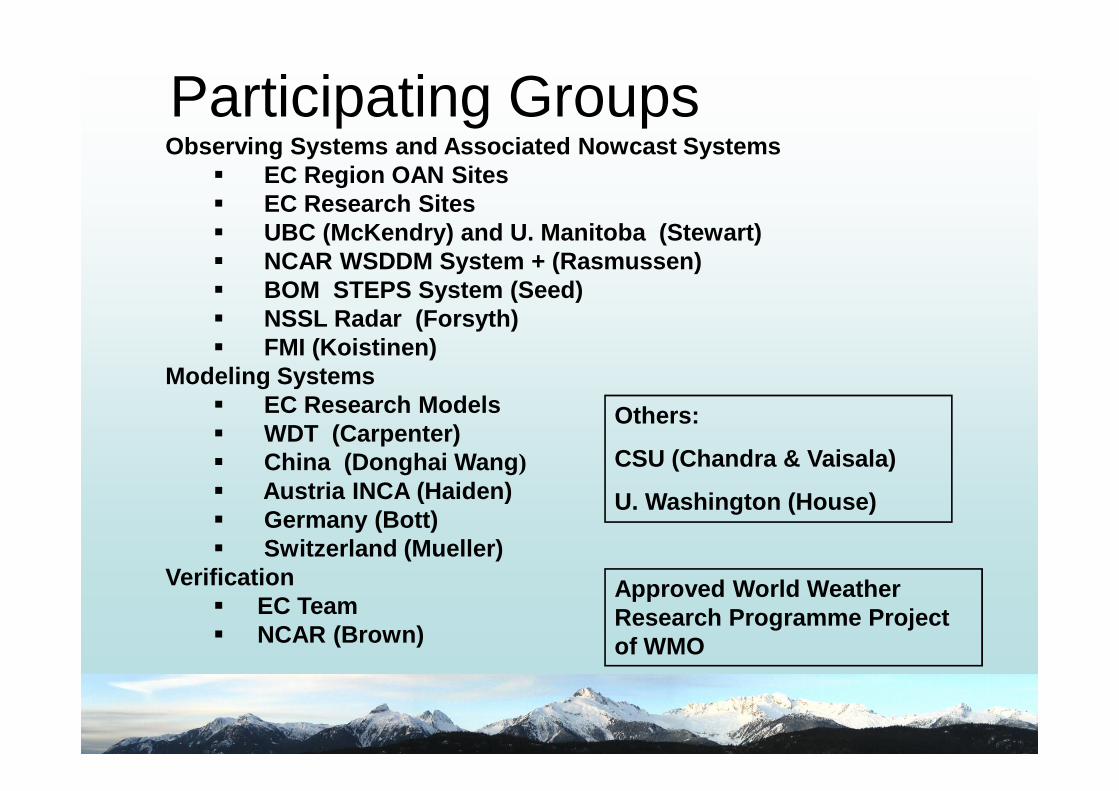
Participating GroupsObserving Systems and Associated Nowcast Systems
EC Region OAN Sites EC Research Sites UBC (McKendry) and U. Manitoba (Stewart) NCAR WSDDM System + (Rasmussen) BOM STEPS System (Seed) NSSL Radar (Forsyth) FMI (Koistinen)
Modeling Systems EC Research Models WDT (Carpenter) China (Donghai Wang) Austria INCA (Haiden) Germany (Bott) Switzerland (Mueller)
Verification EC Team NCAR (Brown)
Others:
CSU (Chandra & Vaisala)
U. Washington (House)
Approved World WeatherResearch Programme Projectof WMO

The Winter Olympic Challenge
Steep topography, highly variable weather elements in space and time
5 km
Village Creekside

Summary of Instruments• Callaghan scanning C-Band Radar located near Whistler.
• NOAA/OU X-Band Dual- Polarization Radar located at Canada/U.S. Border south of Vancouver.
• Vertically Pointing X-Band Radars were located at TFT, RND and WWA.
• A 915 MHz Boundary Layer Wind Profiler located at Squamish Airport (WSK).
• A profiling microwave radiometer located at Timing Flats (TFT)
• A rawindsonde system located at Nesters (VOC).
• Ceilometers (6) located at YVR, WWA, TFT, WSK, WGP, and VOG,
• Recording visibility meters (6) located at VOA, VOL, RND, VOT, VOG and YVR.
• Hot Plates located at (6) YVR, VOG, RND, VOA, VOL and TFT
• Present weather sensors,(10) either the Vaisala FD12P, Parsivel or POSS located at VOA, VOL,VOD, WWA, WSK, YVR, TFT, VOT, RND, and VOG,
• A 3D anemometer located at the ski jump (VOW).
• Temperature, relative humidity and GPS sensors were installed on the Whistler Village toRoundhouse Gondola, and the Whistler to Blackcomb gondola.
• The Roundhouse site, near the helipad, was instrumented with a significant list of equipment.as an extension of the Fog Remote Sensing and Modeling Project (FRAM) (Gultepe et al., 2009).
• Special surface sites measuring temperature and humidity were installed by UBC up WhistlerMountain
• Snow Density measurements were made at some selected sites, mainly VOA, VOL RND andVOC after significant snowstorms.
• Snow Photographs were made continuously at RND as a special project during some intensiveperiods and then irregularly outside those periods.
•

Model Name Organization CountrySpatial
Resolution
TemporalResolutionAvailable
Times of DayRun (UTC)
Length ofForecst(hours)
General Description
ABOMLAM1kmEnvironment
CanadaCanada 1 Km 15 min Every 15 min Max 6 h
Adaptive Blending ofObservation and Models
using GEM LAM1k
ABOMREGEnvironment
CanadaCanada 15 km 15 min Every 15 min Max 6 h
Adaptive Blending ofObservation and Models
using GEM Regional
INTWEnvironment
CanadaCanada
1 and 15km
15 min Every 15 min Max 6 hINTegrated Weighted
Model using LAM1k, GEMRegional and Observations
LAM1kEnvironment
CanadaCanada 1 km
30 s (Model),15 min(Tables)
11 and 20 UTC 19 hLimited-Area version of
GEM model
LAM2.5kEnvironment
CanadaCanada 2.5 km
1 min(Model), 15min (Tables)
06 and 15 UTC 33 hLimited-Area version of
GEM model
REGEnvironment
CanadaCanada 15 km
7.5 min(Model), 15min (Tables)
00, 06, 12, 18UTC
48 hRegional version of GEM(Global Environmental
Multiscale) model
Canadian Models Used in SNOW-V10

Model Name Organization CountrySpatial
Resolution
TemporalResolutionAvailable
Times of Day Run(UTC)
Length ofForecst (hours)
General Description
CMAChinese
MeteorologicalAdministration
China15 km & 3
km1 hour 00 and 12 UTC 48 h & 24 h CMA GRAPES-Meso NWP model
WDTUSL
WeatherDecision
Technologiesand
NanoWeather
USApointwise or100 m grid
02, 08, 14, 20 UTC 48 hSurface layer model nested in
NAM. Works particularly well inquiescent condistions..
WSDDMNational Centerfor AtmosphericResearch (NCAR)
USARadar
Resolution
10 min(based on
radarupdate)
Every 10 min 2 hours
Nowcast based on storm trackingof radar echo using crosscorrelation and real-timecalibration with surface
precipitation gauges.
ZAMGINCA
Central Institutefor Meteorology
andGeodynamics
(ZAMG)
Austria 1 km 1 hour Every hour 18 hours
The Integrated NowcastingThrough Comprehensive Analysis(INCA) system uses downscaledECMWF forecasts as a first guess
and applies corrections accordingto the latest observation.
ZAMGINCARR
Central Institutefor Meteorology
andGeodynamics
(ZAMG)
Austria 1 km 15 min Every 15 min 18 hours
The precipitation module of INCAcombines raingauge and radar
data, taking into account intensity-dependant elevation effects. The
forecasting mode is based ondisplacement by INCA motion
vectors, merging into the ECMWFmodel through prescribed
weighting.
Other Countries Models Used in SNOW-V10


Products During Olympics• Each group produced a Table showing 24 hour
forecast of significant variables for main venuesites (hourly intervals and 10 to 15 min intervals infirst two hours). Similar to what forecastersproduce
• A Research Support Desk was run duringOlympics and Paralympics (virtual and on-site)providing real time support to forecasters.
• A SNOW-V10 Web site was created with many ofthe products (time series for sites, remote sensingproducts, area displays, soundings (gondola andothers), and a very successful Blog.

VANOCChris Doyle
Central Forecast OfficeTrevor Smith et al.
Venue ForecastersCypress FreestyleCallaghan Nordic
Callaghan Ski JumpWhistler AlpineWhistler Sliding
SNOW-V10Research Support Desk (RSD)
On-Site (3 scientists)WebEx (at least once per day)
SNOW-V10 Web SiteSNOW-V10 Blog
1 min Data from Research SitesWhistler Radar
Microwave RadarMRR
Wind ProfilerGondola Profiles
Model and Data ChartsForecast Tables
Nowcastsetc
Pacfic Weather Centre Data15 Min DataSoundings
MeteogramsSatellite Data
Other Model Data

Harvey’sCloud
Equipment onWhistler mountainprovided good datafor forecasters andhelp inunderstandingweather processes
Most of SNOW-V10 data from instrumentsare now being displayed on Web site(http://www.snow-v10.ca). Model data isalso being shown.
RemoteSensors

Roy Rasmussen et al (NCAR)Weather Support to Deicing Decision Making (WSDDM)
2 km

GEM LAM forpoints along Sea toSky Highwayshowing flowreversal with daytime heating. Note23 Z is 15 LocalTime.

Aerials’jump
Spectatorgrandstand
Preparation of field-of-play 2 hours before training…

Freestyle Skiing Ladies Aerials FinalFebruary 24, 2010
Notes by Mindy Brugman as posted onSNOW-V10 Blog
The event….Last night at the Cypress aerial site itbegan with drizzle and was quite foggy… Wewalked to the bright lights of the venue. There wasno precipitation at the venue the entirecompetition. The competition started at 1930PST. The first pictures (not shown here) are takenat the start of the competition and you can see thatthe fog was much worse at the start. I stoppedtaking pictures since I could not seeanything. Then it began to clear just near the endof the competiton – and I clicked a few pictures.You can detect a flying bug above the lights. Thatsreally the gold medal winner, Lydia Lassila, ofAustralia!Based on the event last night – I suspect ladiesaerials may qualify as a new paralympic sport forthe visually impaired.


Forecast < -25 -25 ≤ x < -20 -20 ≤ x < -4 -4 ≤ x < -2 -2 ≤ x < 0 0 ≤ x < 2 2 ≤ x < 4 > 4 Total
< -25 0 0 0 0 0 0 0 0 0
-25 ≤ x < -20 0 0 0 0 0 0 0 0 0
-20 ≤ x < -4 0 0 590 220 214 37 12 0 1073
-4 ≤ x < -2 0 0 78 348 359 259 65 1 1110
-2 ≤ x < 0 0 0 0 121 828 321 92 2 1364
0 ≤ x < 2 0 0 0 4 397 742 186 76 1405
2 ≤ x < 4 0 0 0 0 10 57 218 118 403
> 4 0 0 0 0 0 0 55 134 189
Total 0 0 668 693 1808 1416 628 331 5544
lam1k Temperature (°) at VOL HSS=0.392
Observed
Forecast < 30 30 ≤ x < 65 65 ≤ x < 90 90 ≤ x < 94 94 ≤ x < 98 > 98 Total
< 30 3 12 0 0 0 0 15
30 ≤ x < 65 21 854 227 19 14 5 1140
65 ≤ x < 90 0 525 729 143 253 752 2402
90 ≤ x < 94 0 1 85 53 72 253 464
94 ≤ x < 98 0 12 51 44 181 539 827
> 98 0 2 23 26 131 514 696
Total 24 1406 1115 285 651 2063 5544
lam1k Relative Humidity (%) at VOL HSS=0.269
Observed

Adaptive Blending of Observationsand Models (ABOM)
ABOM reduces to:• Observation persistence when r = s = 0, w = 1• Pure observation trend when r = 0, s = 1, w = 0• Model + obs trend + persistence for all other r, sand w
Change predictedby model
Forecast atlead time p
CurrentObservation
Change predictedby obs trend
• Coefficients s and r are proportional to the performance overrecent history, relative to obs persistence (w) and to
• Local tuning parameters (not yet optimized at all SNOWV10 sites)
• Updated using new obs data every 15 minutes

Temperature Mean Absolute Error:Averaged by Nowcast Lead Time to 6 Hours
0 1 2 3 4 5 60
0.5
1
1.5
2
2.5
3
3.5
4
Forecast Lead Time (Hours)
Me
an
Ab
so
lute
Err
ors
VOC TEMPERATURE MAE
ABOM REG
REG
Obs Pers
LAM 2.5
ABOM LAM 2.5
LAM 1
ABOM LAM1
0 1 2 3 4 5 60.2
0.4
0.6
0.8
1
1.2
1.4
1.6
1.8
2
2.2
Forecast Lead Time (Hours)M
ea
nA
bso
lute
Err
ors
RND TEMPERATURE MAE
ABOM REG
REG
Obs Pers
LAM 1
ABOM LAM1
LAM 2.5
ABOM LAM2.5
1) Nowcast - Model crossover lead-time2) Improvement over persistence

Background of INTW•• INTW refers to integrated weighted modelINTW refers to integrated weighted model
• LAM 1k, LAM 2.5k and REG 15k were
selected to generate INTW
•• Major steps of INTW generationMajor steps of INTW generation– Data pre-checking - defining the available NWP models and
observations
– Extracting the available data for specific variable and location
– Calculating statistics from NWP model data, e.g. MAE, RMSE
– Deriving weights from model variables based on modelperformance
– Defining and performing dynamic and variational biascorrection
– Generating Integrated Model forecasts (INTW)

NWP Model with Minimum MAELAM 1k – red, LAM 2.5k – dark yellow, REG - blue
Site Temp RH WS Gust
Vancouver (YVR) 1.15 6.85 1.44 2.09
Whistler Creek side (VOB) 1.19 8.62 0.6 1.84
Timing Flats (VOT) 1.39 8.2 0.6 1.75
Whistler Mt. Mid Lvl. (VOL) 1.5 8.61 0.67 1.64
West Vancouver (WWA) 1.32 10.13 0.71 1.29
Squamish Airport (WSK) 1.53 10.19 0.7 1.19
Cypress Bowl North (VOE) 1.17 6.7 0.5 1.43
Callaghan SJ Bottom (VOX) 1.31 9.09 0.74 1.62
Callaghan Ski Jump (VOW) 1.66 9.56 0.57 1.62
Callaghan Valley (VOD) 1.31 8.92 0.54 1.45
Nesters (VOC) 1.39 7.83 0.67 1.45
Blackcomb (VOI) 1.13 8.24 0.52 1.32
Cypress Bowl (VOG) 1.57 0.69 1.43
Whistler (VOA) 1.19 7.73 1.46 1.93
Pemberton Airport (WGP) 2.05 10.75 0.56 0.75

Model with Minimum MAE for INTW and NWP modelsINTW – green, LAM 1k – red, LAM 2.5k – dark yellow, REG - blue
Site Temp RH WS Gust
Vancouver (YVR) 0.82 5.2 1.3 1.6
Whistler Creek side 0.81 5.19 0.39 0.83
Timing Flats (VOT) 0.97 5.84 0.48 0.94
Whistler Mt. Mid Lvl. 0.84 5.37 0.58 0.99
West Vancouver 0.9 6.95 0.67 1.02
Squamish Airport 1.02 6.23 0.66 1
Cypress Bowl North 0.89 4.74 0.5 1.04
Callaghan SJ Bottom 1.02 6.71 0.47 1.01
Callaghan Ski Jump 0.9 5.67 0.49 0.98
Callaghan Valley 1.07 7.09 0.48 0.91
Nesters (VOC) 1.03 5.82 0.51 1.04
Blackcomb (VOI) 0.85 5.36 0.47 0.95
Cypress Bowl (VOG) 0.96 0.69 1.16
Whistler (VOA) 0.9 5.55 1.19 1.61
Pemberton Airport 1.15 6.8 0.56 0.72

Preliminary Comparison of SportForecast with Canadian Modelsfor Top of Downhill (VOL), Mid-Station (VOL) and Timing Flats(VOT)
Relative Humidity
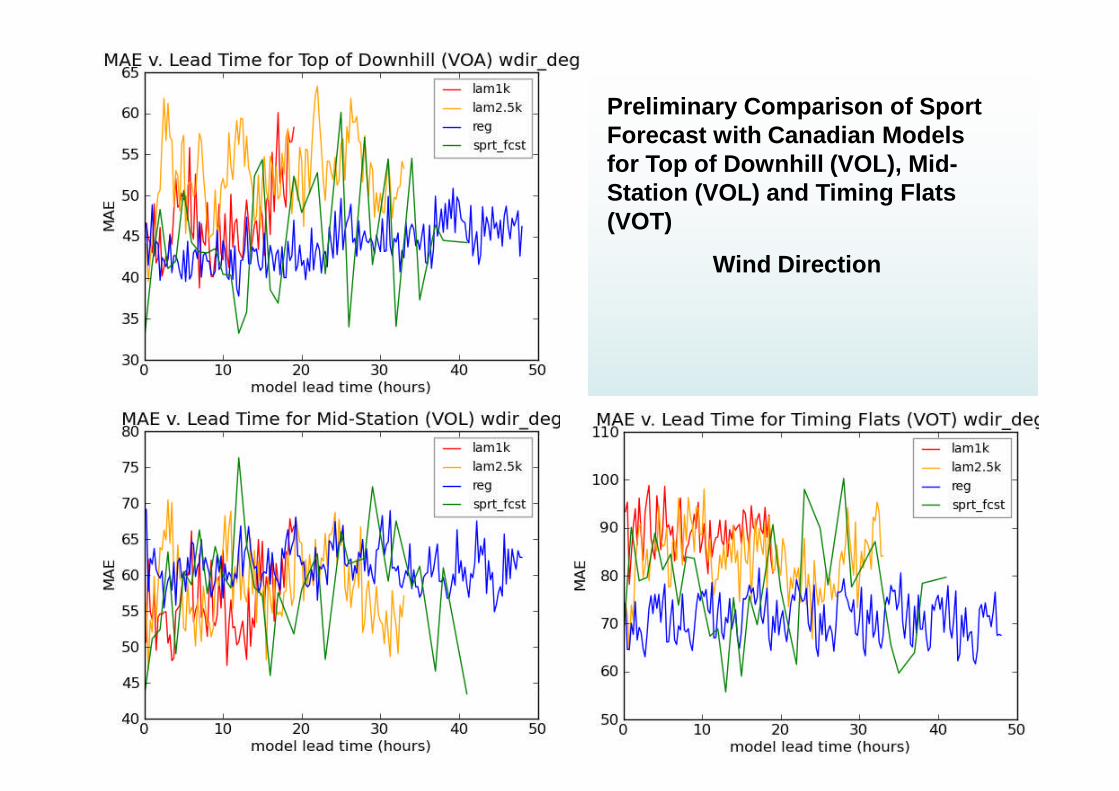
Preliminary Comparison of SportForecast with Canadian Modelsfor Top of Downhill (VOL), Mid-Station (VOL) and Timing Flats(VOT)
Wind Direction

Discussion of Areas NeedingImprovements
• RH predictions are poor, barely beating climatology.(Impacts visibility forecasts)
• Visibility forecasts are poor from statistical point of view.(also require snow and rain rates)
• Cloud base forecasts, although showing some skill, couldeasily be improved with better model resolution in boundarylayer.
• Wind direction either poorly forecast or measured.• Model (Cdn) has a bias against high wind speeds.• Overall statistical scores do not show complete story. Need
emphasis on high impact events.• Model graupel not observed and not well defined.• Snow Rate and Precipitation Type measurements over short
time scales need improvement.

Summary• Many physical processes were well documented during
SNOW-V10 such as: diabatic effects due to melting snow,wind flow around and over terrain, diurnal flow reversal invalleys associated with daytime heating, precipitationreductions and increases due to local terrain influences, etc
• Weather changes rapidly in complex terrain and it isnecessary to get good measurements at time resolutions ofat least 1 -15 min. SNOW-V10 attempted to getmeasurements at 1 min resolution where possible.
• Because of the rapidly changing nature of the weather,weather forecasts also must be given at high time resolution.
• There are many difficulties in measuring parameters,especially precipitation amount and type in this environment.Special scanning strategies were necessary for the scanningradar placed at Whistler and significant differences wereobserved with many different types of surface precipitationsensors placed at several locations.

Summary• SNOW-V10 has made progress in forecasting “non traditional”
variables like ceiling, visibility, wind gusts, etc.• Nowcast schemes are showing skill.• There is value in presenting real-time obs and several models
to forecasters doing Nowcasting.• The techniques tested are not yet good enough to issue
standalone nowcasts. Significant errors (or conflicts) exist inhigh impact events that require forecaster intervention.
• Weather Forecasts, both long and short term, were critical inthe conduct of these games.
.

Forecast and Research in theOlympic Sochi Testbed 2014
FROST-2014

Questions?