Evaluation of the ability of the Weather Research and ...
17
Hydrol. Earth Syst. Sci., 22, 3391–3407, 2018 https://doi.org/10.5194/hess-22-3391-2018 © Author(s) 2018. This work is distributed under the Creative Commons Attribution 4.0 License. Evaluation of the ability of the Weather Research and Forecasting model to reproduce a sub-daily extreme rainfall event in Beijing, China using different domain configurations and spin-up times Qi Chu 1,2,3 , Zongxue Xu 1,2 , Yiheng Chen 3 , and Dawei Han 3 1 College of Water Sciences, Beijing Normal University, Beijing, 100875, China 2 Beijing Key Laboratory of Urban Hydrological Cycle and Sponge City, Beijing, 100875, China 3 Department of Civil Engineering, University of Bristol, Bristol, BS8 1TR, UK Correspondence: Zongxue Xu ([email protected]) Received: 26 June 2017 – Discussion started: 7 August 2017 Revised: 13 May 2018 – Accepted: 2 June 2018 – Published: 21 June 2018 Abstract. The rainfall outputs from the latest convection- scale Weather Research and Forecasting (WRF) model are shown to provide an effective means of extending predic- tion lead times in flood forecasting. In this study, the perfor- mance of the WRF model in simulating a regional sub-daily extreme rainfall event centred over Beijing, China is eval- uated at high temporal (sub-daily) and spatial (convective- resolving) scales using different domain configurations and spin-up times. Seven objective verification metrics that are calculated against the gridded ground observations and the ERA-Interim reanalysis are analysed jointly using subjective verification methods to identify the likely best WRF config- urations. The rainfall simulations are found to be highly sen- sitive to the choice of domain size and spin-up time at the convective scale. A model run covering northern China with a 1 : 5 : 5 horizontal downscaling ratio (1.62 km), 57 vertical layers (less than 0.5 km), and a 60 h spin-up time exhibits the best performance in terms of the accuracy of rainfall intensity and the spatial correlation coefficient (R 0 ). A comparison of the optimal run and the initial run performed using the most common settings reveals clear improvements in the verifica- tion metrics. Specifically, R 0 increases from 0.226 to 0.67, the relative error of the maximum precipitation at a point rises from -56 to -11.7 %, and the root mean squared error decreases by 33.65%. In summary, re-evaluation of the do- main configuration options and spin-up times used in WRF is crucial for improving the accuracy and reliability of rain- fall outputs used in applications related to regional sub-daily heavy rainfall (SDHR). 1 Introduction The possibility that sub-daily heavy rainfall (SDHR) will increase with climate change is of significant societal con- cern. SDHR-driven flash floods (FFs) are among the most destructive natural hazards that threaten many urban areas in northern and central China and many other parts of the world. In these regions, SDHR is mainly triggered by re- gional mesoscale circulation systems (MCSs) and occurs with increased intensity and frequency in warm seasons (Yu et al., 2007; Chen et al., 2012). Records from the Emergency Events Database (EM-DAT) indicate that the damages and losses caused by FF events in China have increased signifi- cantly over the past several decades. The risks are expected to continue to grow, given the increase in the magnitude of SDHR predicted by most general circulation models (Chen et al., 2012; Willems et al., 2012; Westra et al., 2014). The accelerating pace of urbanization also contributes to the in- crease in risk; urbanization has already changed the hydro- logic characteristics of the land surface considerably, result- ing in higher peak flows and shorter flow concentration times (Xu and Zhao, 2016; Gao et al., 2017). In such cases, very short-term (< 6 h) rainfall predictions are not sufficient to provide adequate warning and mobilize emergency response activities. Recently developed statistically based rainfall gen- eration methods and remote sensing data have been shown to enable the extension of the lead time to 24 h (Yu et al., 2016). However, this lead time is still insufficient to provide effec- tive flood mitigation for medium or large urban areas with very short hydrologic response times (Shih et al., 2014; Li et Published by Copernicus Publications on behalf of the European Geosciences Union.
Transcript of Evaluation of the ability of the Weather Research and ...
Hydrol. Earth Syst. Sci., 22, 3391–3407, 2018https://doi.org/10.5194/hess-22-3391-2018© Author(s) 2018. This work is distributed underthe Creative Commons Attribution 4.0 License.
Evaluation of the ability of the Weather Research and Forecastingmodel to reproduce a sub-daily extreme rainfall event in Beijing,China using different domain configurations and spin-up timesQi Chu1,2,3, Zongxue Xu1,2, Yiheng Chen3, and Dawei Han3
1College of Water Sciences, Beijing Normal University, Beijing, 100875, China2Beijing Key Laboratory of Urban Hydrological Cycle and Sponge City, Beijing, 100875, China3Department of Civil Engineering, University of Bristol, Bristol, BS8 1TR, UK
Correspondence: Zongxue Xu ([email protected])
Received: 26 June 2017 – Discussion started: 7 August 2017Revised: 13 May 2018 – Accepted: 2 June 2018 – Published: 21 June 2018
Abstract. The rainfall outputs from the latest convection-scale Weather Research and Forecasting (WRF) model areshown to provide an effective means of extending predic-tion lead times in flood forecasting. In this study, the perfor-mance of the WRF model in simulating a regional sub-dailyextreme rainfall event centred over Beijing, China is eval-uated at high temporal (sub-daily) and spatial (convective-resolving) scales using different domain configurations andspin-up times. Seven objective verification metrics that arecalculated against the gridded ground observations and theERA-Interim reanalysis are analysed jointly using subjectiveverification methods to identify the likely best WRF config-urations. The rainfall simulations are found to be highly sen-sitive to the choice of domain size and spin-up time at theconvective scale. A model run covering northern China witha 1 : 5 : 5 horizontal downscaling ratio (1.62 km), 57 verticallayers (less than 0.5 km), and a 60 h spin-up time exhibits thebest performance in terms of the accuracy of rainfall intensityand the spatial correlation coefficient (R′). A comparison ofthe optimal run and the initial run performed using the mostcommon settings reveals clear improvements in the verifica-tion metrics. Specifically, R′ increases from 0.226 to 0.67,the relative error of the maximum precipitation at a pointrises from −56 to −11.7 %, and the root mean squared errordecreases by 33.65 %. In summary, re-evaluation of the do-main configuration options and spin-up times used in WRFis crucial for improving the accuracy and reliability of rain-fall outputs used in applications related to regional sub-dailyheavy rainfall (SDHR).
1 Introduction
The possibility that sub-daily heavy rainfall (SDHR) willincrease with climate change is of significant societal con-cern. SDHR-driven flash floods (FFs) are among the mostdestructive natural hazards that threaten many urban areasin northern and central China and many other parts of theworld. In these regions, SDHR is mainly triggered by re-gional mesoscale circulation systems (MCSs) and occurswith increased intensity and frequency in warm seasons (Yuet al., 2007; Chen et al., 2012). Records from the EmergencyEvents Database (EM-DAT) indicate that the damages andlosses caused by FF events in China have increased signifi-cantly over the past several decades. The risks are expectedto continue to grow, given the increase in the magnitude ofSDHR predicted by most general circulation models (Chenet al., 2012; Willems et al., 2012; Westra et al., 2014). Theaccelerating pace of urbanization also contributes to the in-crease in risk; urbanization has already changed the hydro-logic characteristics of the land surface considerably, result-ing in higher peak flows and shorter flow concentration times(Xu and Zhao, 2016; Gao et al., 2017). In such cases, veryshort-term (< 6 h) rainfall predictions are not sufficient toprovide adequate warning and mobilize emergency responseactivities. Recently developed statistically based rainfall gen-eration methods and remote sensing data have been shown toenable the extension of the lead time to 24 h (Yu et al., 2016).However, this lead time is still insufficient to provide effec-tive flood mitigation for medium or large urban areas withvery short hydrologic response times (Shih et al., 2014; Li et
Published by Copernicus Publications on behalf of the European Geosciences Union.

3392 Q. Chu et al.: Evaluation of the ability of the Weather Research and Forecasting model
al., 2017). Therefore, numerical weather prediction (NWP),which represents a means of forecasting heavy rainfall withlead times exceeding 24 h, has come into wide use in flood-related studies and applications (Cuo et al., 2011).
Precipitation uncertainty accounts for a large proportion ofthe uncertainty in flood forecasts. Hence, given the large un-certainties in NWP, its use in flood forecasting has long beenquestioned (Castelli, 1995; Bartholmes and Todini, 2005). Itsusefulness was not realized until the end of the 20th cen-tury; substantial improvements in the predictive skill of NWPwere made that resulted from the increases in computationalpower and storage capacity, which enable parallel process-ing of high-resolution forcing data and the resolution ofconvective-scale physical processes (Done et al., 2004; Clarket al., 2016). The NWP models developed during and afterthis period can perform regional and convective-scale mod-elling and display good performance in simulating heavyrainfall. Experimental studies have shown that NWP mod-els of this kind, such as the WRF model (Skamarock et al.,2008), tend to capture greater numbers of small-scale pro-cesses and the triggers of convective storms (Klemp, 2006;Prein et al., 2015). Increasing numbers of meteorologicaloperational centres and research groups are adopting thesenew NWP models to carry out simulations of heavy rainfallevents or real-time forecasting. The resolutions of the rain-fall products have improved from tens of kilometres to lessthan a kilometre, and the lead times have increased from lessthan a day to more than a week (WMO, 2013). Meanwhile,case studies have been carried out using regional convective-resolving models to evaluate the local rainfall predictionsgenerated by sophisticated regional nesting techniques or theglobal smooth grid transition approach on unstructured grids(Swinbank and James Purser, 2006; Hong and Lee, 2009;Soares et al., 2012; Sikder and Hossain, 2016; Heinzeller etal., 2016). The results of these studies demonstrate that, overrelatively short periods of time, regional modelling is oftensuperior to large-scale modelling because it better resolvessurface heterogeneities, topography, and small-scale featuresin air flow such as growing instabilities (Miguez-Macho etal., 2004; Yu et al., 2010; Prein et al., 2015; Brömmel et al.,2018).
Despite the great potential of NWP models to predictheavy rainfall, a number of uncertainties remain that must beconsidered. The errors induced by the initial and boundaryconditions represent one source of these uncertainties; othersstem from cognitive errors and the scale effect in the solutionof physical models, both of which may be exacerbated by thechaotic nature of NWP. In regional simulations, these uncer-tainties are expected to be further magnified by downscal-ing or the use of mesh transition procedures, so re-evaluationand calibration of the related model configurations are com-monly required (Warner, 2011; Vrac et al., 2012; Liu et al.,2012). As an example, running the WRF model at convec-tive scales means that convective processes are more likelyto be resolved by explicit physical schemes than when sub-
grid parameterizations are used, which may incorporate newstructural uncertainties related to the model physics (Doneet al., 2004; Ruiz et al., 2010; Crétat et al., 2012). In addi-tion to model physics, several other aspects of model config-uration, such as the domain size, the spatial resolution, andthe spin-up time, may also have a substantial impact on theuncertainty in rainfall forecasts through their effects on theinitial and boundary conditions (Aligo et al., 2009; Fierro etal., 2009; Cuo et al., 2011). However, these aspects of modelconfiguration have received less attention in regional casestudies because of their insignificant effects on rainfall fore-casts in coarse-resolution and long-term model simulationswhen compared to the physics of the WRF model. Generally,these model configuration aspects are left at the common set-tings recommended by the official website of the WRF modeland by some experimental regional heavy rainfall studies.
Precipitation is one of the most sensitive variables to NWPmodel uncertainties. In this study, a re-evaluation of WRFis performed to explore whether the recommended configu-ration of WRF represents the best choice in reproducing aregional SDHR event that happened in Beijing. The WRFmodel is assessed here because of its superior scalabilityand computational efficiency; these traits are valued in inter-disciplinary studies (Klemp, 2006; Foley et al., 2012; Coenet al., 2013; Yucel et al., 2015). As the latest NWP com-munity model, WRF incorporates up-to-date developmentsin physics, numerical methods, and data assimilation and isthus widely used in theoretical studies and practical appli-cations (Powers et al., 2017). The selected regional SDHRevent occurred on 21 July 2012 and was centred over Beijing,China. Beijing is among the most vulnerable cities to SDHR-induced floods in central China (Yu et al., 2007). The pre-cipitation in this area is caused mainly by monsoon weathersystems and enhanced by local orographic effects, and 60–80 % of the total annual precipitation occurs during just afew SDHR events (Xu and Chu, 2015). The SDHR eventthat occurred on 21 July 2012 caused the most disastrousurban flood in Beijing since 1950. The national operationalNWP system failed to predict this event, which resulted in79 deaths and more than USD 1.6 billion in damage (Bröm-mel et al., 2018; Wang et al., 2013; Zhou et al., 2014). Thus,several convective-scale studies have been carried out to re-evaluate the optimal combination of the physics options usedin the WRF model, such as Di et al. (2015) and Wang etal. (2015). These studies represent the background informa-tion that stimulates this research.
The second question we attempt to explore is to what ex-tent rainfall simulations could be improved through the useof the likely best set of settings if the recommended modelconfigurations are not the best choices. The aspects of themodel configuration that are evaluated in this study are thedomain size, vertical resolution, horizontal resolution, andspin-up time. These options have been found to have substan-tial impacts on daily-scale extreme rainfall outputs (Leducand Laprise, 2009; Aligo et al., 2009; Goswami et al., 2012).
Hydrol. Earth Syst. Sci., 22, 3391–3407, 2018 www.hydrol-earth-syst-sci.net/22/3391/2018/

Q. Chu et al.: Evaluation of the ability of the Weather Research and Forecasting model 3393
A comparative test with four scenarios is designed. Each sce-nario evaluates one model configuration option to ensure thatthe simulated disparities can be attributed solely to a sin-gle factor each time. In addition, the test is conceived as aprogressive process: the optimal setting identified in eachscenario will be adopted as the primary choice for the nextscenario to help quantify the overall improvement in the ac-curacy of rainfall outputs. The “ground truth” datasets aregridded observations obtained from Beijing Normal Univer-sity and the China Meteorological Administration. A coarser-resolution reanalysis called ERA-Interim (Dee et al., 2011) isalso employed in identifying departures of the WRF simula-tions from the driving weather fields as the model setup isvaried. Seven objective verification metrics that reflect dif-ferent features of the model performance are adopted andconsidered jointly as part of a subjective verification processbecause no single verification approach has been shown toprovide comprehensive information about the quality of rain-fall simulations (Sikder and Hossain, 2016). Most of the met-rics adopted here are those used to assess the performance ofWRF over daily or longer time periods (Liu et al., 2012; Tianet al., 2017). In this research, these metrics are calculated onan hourly basis and averaged over different sub-daily timespans to evaluate the performance of the WRF model us-ing different configurations from a sub-daily and convective-scale perspective.
2 Numerical model used to forecast heavy rainfall
The advanced WRF (ARW-WRF) model, version 3.7.1, isused as the dynamical downscaling tool. ARW-WRF is acompressible non-hydrostatic and convection-permitting re-gional NWP model that employs the conservative form of thedynamic Euler equations. As the latest regional NWP com-munity system, WRF is composed of two dynamic cores,a data assimilation system and a platform that facilitatesparallel computation and function portability. Observations,model output or assimilated reanalysis output can be usedto initialize WRF. In terms of discretization, WRF uses athird-order Runge–Kutta method for temporal separation andan Arakawa C-grid staggering scheme for spatial discretiza-tion. The model is capable of conducting either one-way ortwo-way nested runs for regional downscaling. A detailed in-troduction to the physics and numerical properties of ARW-WRF can be found in Skamarock et al. (2008). Given its em-phasis on efficiency, portability, and updates to reflect thestate of the art, WRF has been employed in settings rang-ing from research to applications and has been incorporatedinto various operational systems, such as the Hurricane-WRFsystem for hurricane forecasting and the WRF-Hydro systemfor hydrologic prediction.
In WRF, the domain size implicitly determines the large-scale dynamics and terrain effects, whereas the vertical andhorizontal grid spacings determine the smallest resolvable
scale (Goswami et al., 2012). Together, these domain config-uration options affect the spectrum of the resolved scales andthe nature of scale interactions in the model dynamics (Leducand Laprise, 2009). Thus, they are responsible for the genera-tion and distribution of precipitation. In regional simulations,small domain sizes are commonly preferred for computa-tional efficiency. Seth and Rojas (2003) demonstrated thatsimulations with small domain sizes are more likely to ben-efit from the lateral boundary conditions (LBCs) by damp-ening the feedback from local perturbations on the large-scale general circulation. However, insufficiently large do-mains have been shown to prevent the full development ofsmall-scale features over areas of interest. To solve this is-sue, the official website of WRF provides general guidance(Warner, 2011). This guidance recommends that the rangesof domains should include the major features of the lead-ing MCSs and local surface perturbations, and more than fivegrid points should exist between adjacent nested domains toallow for sufficient relaxation.
As for grid spacing, it appears plausible that WRF modelruns performed with relatively small grid spacings wouldprovide more accurate outputs because such runs would re-solve more small-scale phenomena of interest that are notpresent in the LBCs. This statement is generally accepted astrue when a relatively coarse-resolution run (> 10 km hori-zontally or > 1 km vertically) is compared with a relativelyfinely resolved run at the convective scale (1–5 km horizon-tally or < 1 km vertically) in representing a convective storm.However, this conclusion is controversial when the compar-ison is conducted among convective-scale model runs. Tak-ing the horizontal resolution as an example, although thereis evidence to show that WRF runs performed at relativelyhigh resolution capture more convective-scale features, theaccuracy of rainfall outputs either shows considerable or nostatistical improvement (Roberts and Lean, 2008; Kain et al.,2008; Schwartz et al., 2009). In one study, Fierro et al. (2009)suggested that some features detected in convective-scaleruns with too small horizontal grid spacings tend to weakenthe kinetic structures that favour torrential rainfall. A similarconclusion was drawn by Aligo et al. (2009) in evaluating theimpact of the vertical grid spacing on simulations of summerrainfall performed using WRF. Thus, horizontal and verticalgrid spacings of approximately 4 and 1 km, respectively, havebeen employed as a reasonable compromise between accu-racy and computational efficiency in several regional studies.
In regional modelling, a spin-up period is often requiredto balance the inconsistencies between the results simulatedby the model physics and the initial and boundary conditionsprovided by the forcing data (Luna et al., 2013). The properspin-up time depends on the time needed for initialization,which can be affected by the size of the domain and the localboundary perturbations (Warner et al., 1997; Kleczek et al.,2014). Moreover, the presence of chaotic behaviour, whichcauses reductions in the predictive skill of models over time,imposes an upper bound on the spin-up time. Therefore, in
www.hydrol-earth-syst-sci.net/22/3391/2018/ Hydrol. Earth Syst. Sci., 22, 3391–3407, 2018

3394 Q. Chu et al.: Evaluation of the ability of the Weather Research and Forecasting model
Figure 1. Relative location of the study area. (a) Shows the three nested domains adopted in most of the experiments, of which domainthree (D03) covers the entire Beijing area; (b) depicts the geographic features of the Beijing area.
cases where short forecast lead times are expected, e.g. real-time rainfall forecasting, the spin-up time is mainly deter-mined by the domain size and the regional initial and bound-ary conditions. However, in cases where long forecast leadtimes are needed, e.g. warnings of extreme rainfall, the ef-fects of chaotic behaviour should be relatively evident. Inpractice, this issue is commonly addressed by regularly up-dating the lateral boundary information derived from the lat-est forecasts or analyses to maintain consistency between theregional model solutions and the atmospheric forcing condi-tions. In such cases, the best-fit performance may occur formodel runs with long spin-up times. Based on most previ-ous studies, a spin-up time of 12 h is recommended to obtainan initial state; however, this spin-up time is often regardedas the suitable choice in many regional case studies withoutfurther verification.
3 Studied event and experimental design
As mentioned above, one aim of this study is to re-evaluatewhether the recommended WRF domain configuration op-tions and spin-up time represent the optimal model config-uration for reproducing a regional SDHR event when evalu-ated at a sub-daily timescale. Here, the SDHR event that oc-curred on 21 July 2012 and was centred on Beijing, Chinais selected as a case study. The reasons why this event isselected, the synoptic and physical features that drove thisevent, and the model physics adopted in this study are pre-sented before the entire procedure of the experimental designis introduced.
3.1 Study event selection and WRF physical schemes
Beijing is selected as the study area because it is one ofthe most vulnerable cities to SDHR-induced FF hazards inChina. Beijing is located in central China. It has an area of16 411 km2, and its weather is mainly affected by the semi-humid warm continental monsoon climate. The flows of airthat favour local precipitation are cold, dry flows of air fromhigh-latitude areas to the north and hot, wet flows of air fromthe ocean to the south. The interactions between these twoflows of air lead to clear divergence in the temporal distri-bution of rainfall amount; 60–80 % of the annual precipi-tation occurs during just a few heavy rainfall events duringthe warm season. Of all of the heavy rainfall events, the in-tensity and frequency of SDHR events have been shown todisplay the greatest increasing tendencies over the past sev-eral decades. Meanwhile, Beijing, as the capital of China,has experienced a significant expansion of its urban area andrapid increases in its population and economic development.The negative effects of this expansion, such as losses of nat-ural water bodies, increases in land cover with low perme-ability, and increases in urban drainage pipe networks, haveled to continuous decreases in the hydrologic response time.In addition, most of the population lives in the southwesternplain area. This region is downstream of mountainous areaswith steep terrain that varies in elevation from 60 to 2300 m(Fig. 1). All of these factors contribute to the continuing in-crease in the exposure of this city to the high risks of flood-ing and waterlogging caused by SDHR events (Xu and Chu,2015).
The case study examines the largest heavy rainfall eventthat has occurred in Beijing in the past 65 years. The
Hydrol. Earth Syst. Sci., 22, 3391–3407, 2018 www.hydrol-earth-syst-sci.net/22/3391/2018/
Q. Chu et al.: Evaluation of the ability of the Weather Research and Forecasting model 3395
rainfall event lasted for 16 h (from 02:00 to 18:00 UTC)on 21 July 2012, and the highest hourly rainfall intensity(100 mm h−1) was experienced in the southwestern part ofthe plain area. The associated FF hazard led to 79 deaths anddamages totalling USD 1.6 billion, and more than 1.6 mil-lion people were affected. In addition to Beijing, the adjacentprovinces, including Hubei and Liaoning, were all signifi-cantly affected by this event and experienced severe FF haz-ards. The synoptic features that triggered the rainfall were aneastward-moving vortex in the middle to high troposphere,a northward-moving zone of subtropical high pressure, andsharp vertical wind shear (Sun et al., 2013). The rainfall eventas a whole can be divided into two phases. From 02:00 to14:00 UTC, the convective rain was dominated and enhancedby the orographic effect. The frontal rain was then followedby the arrival of a cold front moving from the northwest un-til 18:00 UTC (Guo et al., 2015). The rainfall intensity in thesecond phase was relatively low compared to that in the firstphase, due to the lack of strong kinetic forcing to maintainthe occurrence of precipitation.
The ERA-Interim reanalysis and 30-second static geo-graphical data are employed to initialize the surface and me-teorological fields of the WRF. ERA-Interim is produced byan integrated forecasting system (IFS) used by the EuropeanCentre for Medium-Range Weather Forecasts (ECMWF).The IFS is an Earth system model that incorporates a dataassimilation system and an atmospheric model that is fullycoupled with land-surface and oceanic processes. The at-mospheric model provides output every 30 min at a spec-tral resolution of T255 (approximately 81 km over Beijing).This output is then employed as prior information and com-bined with available observations twice a day to produce thereanalysis output using the four-dimensional variation (4D-Var) assimilation system. The final reanalysis product, ERA-Interim, is a global gridded dataset that is available at a spec-tral resolution of T255 and at both the 60 levels used in themodel and 38 interpolated pressure levels for all dates be-ginning on 1 January 1979 (Berrisford et al., 2009; Dee etal., 2011). Here, the ERA-Interim pressure-level data are se-lected as the initial forcing. One reason is that, as is nec-essary, the vertical grid spacing between the adjacent pres-sure layers is less than 1 km in the free troposphere, wherethe convective processes mainly occurred during the Bei-jing SDHR event. In addition, the NWP models used by theChina Meteorological Administration mainly employ 31 ver-tical levels in regional forecasting (WMO, 2013).
As shown in Fig. 2, ERA-Interim captures the vortex andthe subtropical high pressure well that occurred at the be-ginning of the rainfall event. In addition, the patterns of theleading MCSs and the primary synoptic features shown inthis figure also correspond well to those described in pre-vious studies (Zhou et al., 2014). The setup of the modelphysics is based mainly on the results of sensitive, high-resolution studies on the physics of the WRF model in sim-ulating the same event (Wang et al., 2015; Di et al., 2015).
The “resolved rain” is driven by the single-moment 6-classmicrophysics scheme (Hong and Lim, 2006), whereas the“convective rain” is resolved using the Grell–Dévényi cumu-lus parameterization scheme (Grell and Dévényi, 2002). TheNoah land-surface model (Chen and Dudhia, 2001) is usedand coupled with the Monin–Obukhov surface layer model(Ek et al., 2003). The radiation processes are represented bythe RRTMG shortwave radiation and the RRTMG longwaveradiation schemes (Iacono et al., 2008). For the planetaryboundary layer scheme, the Yonsei University method (Honget al., 2006) is adopted.
3.2 Experimental design: domain configuration optionsand spin-up time
The comparative test is designed as a progressive process tohelp quantify the overall improvement in the performance ofWRF after re-evaluating the WRF experiments performedusing different domain configuration options and spin-uptimes. The test is classified into four successive scenarios.The first three scenarios investigate the domain configurationoptions, including the domain size, vertical resolution, andhorizontal resolution; the fourth scenario concerns the spin-up time. During the entire procedure, the optimum configura-tion identified in each scenario is then adopted as the primarychoice for the corresponding configuration in the followingscenario. The initial datasets and the model physics are thesame for all of the domains throughout the entire comparativeprocedure. Because the area of interest is located in the mid-dle latitudes, the Lambert conformal projection is employedin all of the experiments, which is centred on the same lat-itude (42.25◦ N) and longitude (114.0◦ E). Moreover, sigmavertical coordinates with a top level of 50 hPa are used in allof the experiments.
Initially, the WRF domain configuration options and thespin-up time are set to the recommended values described inSect. 2. Three levels of two-way nested domains are adoptedso that the horizontal resolution in the smallest domain is suf-ficiently high to explicitly resolve convective-scale processes(Fig. 1). An odd downscaling ratio (1 : 3 : 3) is selected to re-duce the initial error introduced by interpolating the initialfields to the assigned Arakawa grid. For the same reason, theboundaries of each domain are set along specific grid linesof the ERA-Interim dataset. Of the three nested domains, theoutermost domain (D01) has the largest horizontal grid spac-ing of 40.5 km over north-central China, where the main per-turbed synoptic features occur. The innermost domain (D03)has the smallest horizontal grid spacing of nearly 4.5 km overthe area of interest, Beijing. The second domain (D02) is thechild of D01 and the parent of D03 and has a horizontal gridspacing of 13.5 km. The distance between D01 and D02 issimilar to that between D02 and D03, both of which exceedfive grid points. The grid numbers of D01, D02, and D03 are40× 40, 72× 72, and 90× 90, respectively. The eta valuesutilized in the initial run are set based on the pressure values
www.hydrol-earth-syst-sci.net/22/3391/2018/ Hydrol. Earth Syst. Sci., 22, 3391–3407, 2018

3396 Q. Chu et al.: Evaluation of the ability of the Weather Research and Forecasting model
Figure 2. Initial wind field and geopotential height field at 00:00 UTC on 20 July 2012 over the Northern Hemisphere obtained from theERA-Interim reanalysis. (a) The fields at 500 hPa; (b) the fields at 700 hPa.
at the 29 vertical layers of the ERA-Interim pressure-leveldata. A spin-up time of 12 hours (12 h) is selected; the out-puts are saved every 3 h in D03 and every hour in D02. TheLBCs are updated every 6 h using ERA-Interim.
As shown in Table 1, the first experiment (C0) adopts themodel configuration options mentioned above. To determinewhether the domain configuration options and the spin-uptime used in C0 are the likely best set, four scenarios are de-signed. The first scenario (S1) focuses on evaluating the ef-fect of the WRF domain size. For computational efficiency,the MCS systems that drive the local synoptic features are notcompletely contained within the outermost domain of C0, theinformation of which is compensated by the updated LBCsfrom ERA-Interim. Two comparative experiments, C1 andC2, are devised to verify that the domain size assigned to C0is large enough to enable the full development of small-scalefeatures. Of the three experiments, C2 has the largest outer-most domain size, which incorporates the leading MCS sys-tems over the entire Northern Hemisphere. The intermediatedomain, which is centred between the outermost and inner-
most domains, is then adopted as the outermost domain ofC1. The purpose of scenario two (S2) is to evaluate whetherthe use of a higher vertical resolution in a WRF model runresults in better performance. In this scenario, the startingexperiment is the optimal experiment identified in S1 (OS1),forced by the ERA-Interim pressure-level data with 29 verti-cal levels. This starting experiment is then followed by twoexperiments, C3 and C4, which incorporate 1 and 2 timesmore vertical levels than OS1 (57 and 85 vertical levels),respectively. In the Beijing SDHR event, the pressure-leveldata meet the requirement of a grid spacing of less than 1 kmin the troposphere; however, this condition is not necessarilysatisfied in other regions. Thus, an experiment forced by theERA-Interim model-level data with 38 vertical levels (C5) isalso designed for comparison. The three experiments (OS2,C6, and C7) in scenario three (S3) differ in terms of theirhorizontal resolutions and nesting ratios, with increased nest-ing ratio of 1 : 3 : 3 (4.5 km grid spacing in D03), 1 : 5 : 5(1.62 km in D03), and 1 : 7 : 7 (0.826 km in D03). The lastscenario (S4) is designed to identify a reasonable optimal
Hydrol. Earth Syst. Sci., 22, 3391–3407, 2018 www.hydrol-earth-syst-sci.net/22/3391/2018/
Q. Chu et al.: Evaluation of the ability of the Weather Research and Forecasting model 3397
Table 1. Categories of experiments with different domain sizes, vertical resolutions, horizontal resolutions and spin-up times.
Scenario Experiment number Domain size Vertical Horizontal resolution Spin-uplevels (nesting ratio) time
Domain Case 0 (C0) D01 40× 40; D02 72× 72; 29 (pressure D01 40.5 km; D02 13.5 km; 12 hsize (S1) D03 90× 90 level) D03 4.5 km
1 : 3 : 3Case 1 (C1) D01 80× 64; D02 120× 120 as C0 as C0 as C0Case 2 (C2) D01 160× 128; D02 240× 192 as C0 as C0 as C0
Vertical Optimal case in S1 as OS1 29 as C0 as C0(OS1)
resolution Case 3 (C3) as OS1 57 as C0 as C0(S2) Case 4 (C4) as OS1 85 as C0 as C0
Case 5 (C5) as OS1 38 (model as C0 as C0level)
Horizontal Optimal case in S2 as OS1 as OS2 1 : 3 : 3 as C0resolution (OS2)(S3) Case 6 (C6) as OS1 as OS2 D01 40.5 km; D02 8.1 km; as C0
D03 1.62 km1 : 5 : 5
Case 7 (C7) as OS1 as OS2 D01 40.5 km; D02 5.785 km; as C0D03 0.826 km1 : 7 : 7
Spin-up Optimal case in S3 as OS1 as OS2 as OS3 12 htime (OS3)(S4) Case 8 (C8) as OS1 as OS2 as OS3 0 h
Case 9–Case 19 as OS1 as OS2 as OS3 24–144 h(C9–C19) per 12 h
model run with the maximum spin-up time after minimizingthe uncertainties introduced by inappropriate domain config-uration options. It contains 1 starting experiment (OS3) and12 comparative experiments (C8–C19). Except for C8, whichincludes no spin-up time, the remaining experiments (C9–C19) include spin-up times that increase from 24 to 144 h byevery 12 h.
4 Verification schemes
Both objective and subjective verification methods areapplied to the innermost domain (D03) at a sub-dailyscale. D03 is selected because it covers the area of interest,Beijing, and the convective processes in this domain can beexplicitly resolved in all of the experiments. The rainfalldata used for comparison in D03 are 3-hourly 0.05◦ datathat were produced by fusing rain gauge observations andthe CMORPH data (Huang et al., 2013). The ERA-Interimreanalysis is utilized as well to monitor the possible de-partures of the model simulations from the driving fields.Because the sub-daily rainfall is not available from thereanalysis, the atmospheric precipitable water vapour (PW),which determines the possible maximum precipitation,is instead compared with the model outputs every 6 h. In
addition, the model outputs that cover a larger domain (D02)are compared with an hourly 0.1◦ gridded dataset ob-tained from the China Meteorological Administration(http://data.cma.cn/data/cdcdetail/dataCode/SEVP_CLI_CHN_MERGE_CMP_PRE_HOUR_GRID_0.10.html, lastaccess: 17 June 2018). The comparison over domain two isused only as an auxiliary method for subjective verification,based on the assumption that an experiment with goodperformance in the inner domain should also capture thelarge-scale features in the outer domain, as the appropriaterepresentation of these large-scale features will result inmore accurate boundary conditions.
Seven error metrics that describe different features of pre-cipitation are selected for use as objective verification met-rics. Five are rainfall-related and compared by bilinear inter-polation of the output of the simulations to the grid of theground truth data. The accumulated areal rainfall is assessedusing the relative error of the total precipitation (RETP). Thepercentage of correct rainfall hits is measured using the prob-ability of detection (POD) with a threshold of 0.1 mm. Theroot mean squared error (RMSE) represents the amount ofcontinuous error in the predicted precipitation. Detailed il-lustrations of these three metrics can be found in Liu etal. (2012) and Tian et al. (2017). The other two rainfall-
www.hydrol-earth-syst-sci.net/22/3391/2018/ Hydrol. Earth Syst. Sci., 22, 3391–3407, 2018

3398 Q. Chu et al.: Evaluation of the ability of the Weather Research and Forecasting model
Table 2. Correlations between the original and rescaled objective verification metrics.
Original Representative meaning Rescaled metrics Thresholdmetrics value
POD probability of detection POD′=POD n/aRMSE root mean squared error RMSE′= 1−RMSE/RMSEmax +62.5 maxR Pearson correlation coefficients R′=R n/aWRMSE RMSE of the precipitable water WRMSE′= 1−WRMSE/WRMSEmax +8.3 maxWR R of the precipitable water WR′=WR n/aREPMAX relative error of the maximum precipitation PMAX′=REPMAX+ 1 n/aRETP relative error of the total precipitation TP′=RETP+ 1 n/a
n/a= not applicable.
related metrics are the relative error of the maximum gridprecipitation (REPMAX) and the Pearson correlation coeffi-cient (R), which describe the spatial association between thesimulations and the ground truth data (Eqs. 1 and 2). Thetwo metrics selected for the verification of PW (PW-relatedmetrics) are the root mean squared error (WRMSE) and thePearson correlation coefficient (WR). For comparison, thePW fields of the reanalysis are remapped to the grids of themodel outputs using the WRF Preprocessing System (WPS).In this study, all of the metrics are calculated between thesimulations and the reference data on the same grid at eachtime step (3 h in D03). The values of these metrics are thenaveraged over four different time periods (6, 12, 18, and 24 h)counted from 00:00 UTC on 21 July 2012. Different time pe-riods are selected with the purpose of determining whetherthe performance of WRF differs when the evaluation is con-ducted using different durations.
RE=1N
N∑i=1
[f − r
r× 100%
], (1)
R =1N
N∑i=1
M∑
j=1
(fj − f
)(rj − r
)√
M∑j=1
(fj − f
)2 M∑j=1
(rj − r
)2 . (2)
Here, R is the empirical spatial correlation coefficient; M isthe total number of grid points within the evaluated domainof the starting experiment; fj is the value of the j th grid pointin the tested field at time step i; rj is the value of the refer-ence field; N is the total number of time steps, dependingon the time period considered; and RE is the relative error.For the maximum precipitation, f is the tested value of themaximum gridded precipitation over the area of interest, andr is the reference value of the maximum gridded precipita-tion over the same area.
To facilitate evaluation, the metrics are further adjusted toensure that the ideal value of all of the metrics is 1. In thisstudy, RMSE and WRMSE are first divided by a rescalingfactor to fall into the range of 0–1 and then subtracted from 1
to provide an indication of good performance. The rescaledmetrics, RMSE′ and WRMSE′, have the value 1 representingthe lowest accumulated error (highest accuracy). The factorused for rescaling is determined by the largest values of eacherror metric in all of the experiments and is kept at the samevalue for all of the evaluated time periods (Sikder and Hos-sain, 2016). REPMAX and RETP are added by 1 to have theideal value of 1. The rescaled metrics are PMAX′ and TP′,respectively. The other metrics are not rescaled because theyalready have ideal values of 1, but they are assigned a new setof symbols to distinguish them from the original metrics usedbefore rescaling. For example, POD is replaced with POD′,and R is replaced with R′. Table 2 shows the correlationsbetween the original metrics and the rescaled metrics. Giventhat the metrics describe different features of the rainfall sim-ulations, the values of these metrics are checked and consid-ered together in subjective verification to determine the likelybest set of domain configuration options and to search for thelongest reasonable spin-up time.
5 Results and analyses
In each scenario, the metrics are compared among the exper-iments that consider different durations and cover the samedomain (D03). The results are presented in four sub-graphs;each sub-graph shows the values of the metrics calculated forindividual evaluated time periods. The spatial distribution ofrainfall is also presented over domain two (D02) when evi-dent discrepancies are noted in the results obtained for theinner domain (D03) and the outer domain (D02). Table 1shows the categories of the scenarios and the model configu-rations adopted in each experiment. In the following section,the domain size scenario (S1) is evaluated first, followed bythe vertical resolution scenario (S2) and the horizontal reso-lution scenario (S3).
5.1 Results of the domain size scenario
Figure 3 shows the spatial values of the verification metricsfor the WRF domain size experiments. The performance of
Hydrol. Earth Syst. Sci., 22, 3391–3407, 2018 www.hydrol-earth-syst-sci.net/22/3391/2018/
Q. Chu et al.: Evaluation of the ability of the Weather Research and Forecasting model 3399
Figure 3. Spatial values of the verification metrics for the WRF domain size experiments, calculated over different temporal durations andover domain three. Case 0 (C0) incorporates the smallest domain, which covers north-central China; Case 1 (C1) incorporates a domainof intermediate size that covers northern China and part of Mongolia; and Case 2 (C2) incorporates the largest domain, which covers theNorthern Hemisphere. The metrics are calculated over time periods of 6, 12, 18, and 24 h that begin at 12:00 UTC on 21 July 2012.
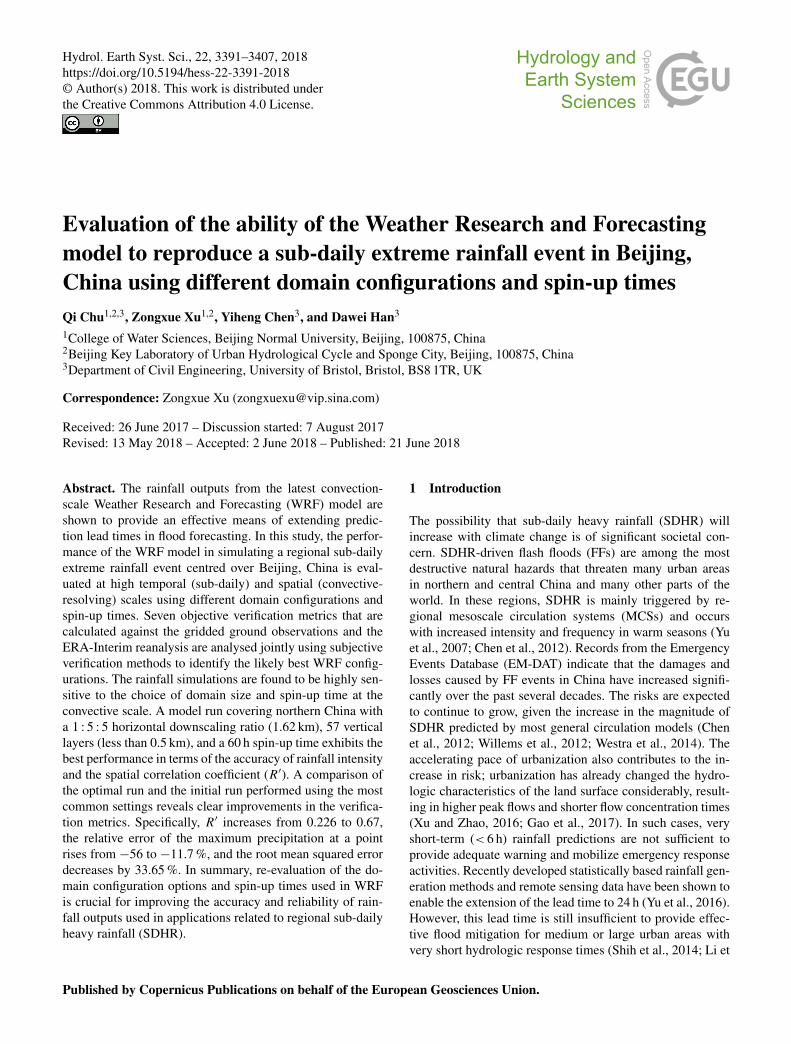
the experiments clearly worsens as the evaluated temporalduration increases from 6 to 24 h. The most evident deterio-rations are detected in the point-to-point accuracy of the rain-fall; the reversed root mean squared error (RMSE′) decreasesby 0.8, which represents a 6-fold increase in the cumula-tive spatial error. The spatial association between the simula-tions and the gridded observations also declines; the Pearsoncorrelation coefficient (R′) decreases by 0.3 on average. Al-though a slight increase is observed in the percentage of cor-rect hits (POD′) during the first 18 h, this increase is followedby a rapid decrease of nearly 14 % during the last stage ofthe rainfall event. The relative bias in the accumulated arealrainfall (TP′) indicates that the total rainfall amount is under-estimated throughout the entire evaluated temporal period.The maximum gridded precipitation (PMAX′) is also under-estimated; the largest negative bias occurs during the heavyconvective rainfall stage. For PW, a slight decrease is foundin the reversed accumulated error (WRMSE′), whereas anincrease of 5–9 % is detected in the spatial correlation coeffi-cient (WR′). Such variations may be attributable to the role ofthe updated boundary conditions in adjusting the local modelsolutions to approach the large-scale atmospheric circulationconditions.
Comparison of the four sub-graphs shows that the valuesof the metrics do not point to a single perfect experiment ina given period, and their ranked predictive skills determinedusing a given metric differ when evaluated over different timeperiods. During the early stage of the rainfall event (6 h), C0yields better performance than C1 and C2 in terms of RMSE′,
R′, and PMAX′; it simultaneously displays the lowest valueof POD′ and the largest bias in estimating the total precipi-tation. Although the superiority of C0 is more evident in thesecond period, a sharp deterioration is then observed in cap-turing the point-to-point accuracy of precipitation for the 18 hduration, where the lowest R′ is obtained. Meanwhile, C1,which employs a domain of moderate size, displays greaterskill than C0 in capturing the correct hits and the spatial pat-tern of the simulated rainfall. C2 employs the largest domain.Although it shows the best fit to the rainfall observations onthe daily scale (24 h), it displays the worst performance overthe three shorter time periods. For the PW fields, the highestsimilarity with the ERA-Interim reanalysis is found for C0,whereas the lowest similarity is found for C2. These resultsdemonstrate indirectly that small domains are more likely tobe influenced by updated boundary conditions.
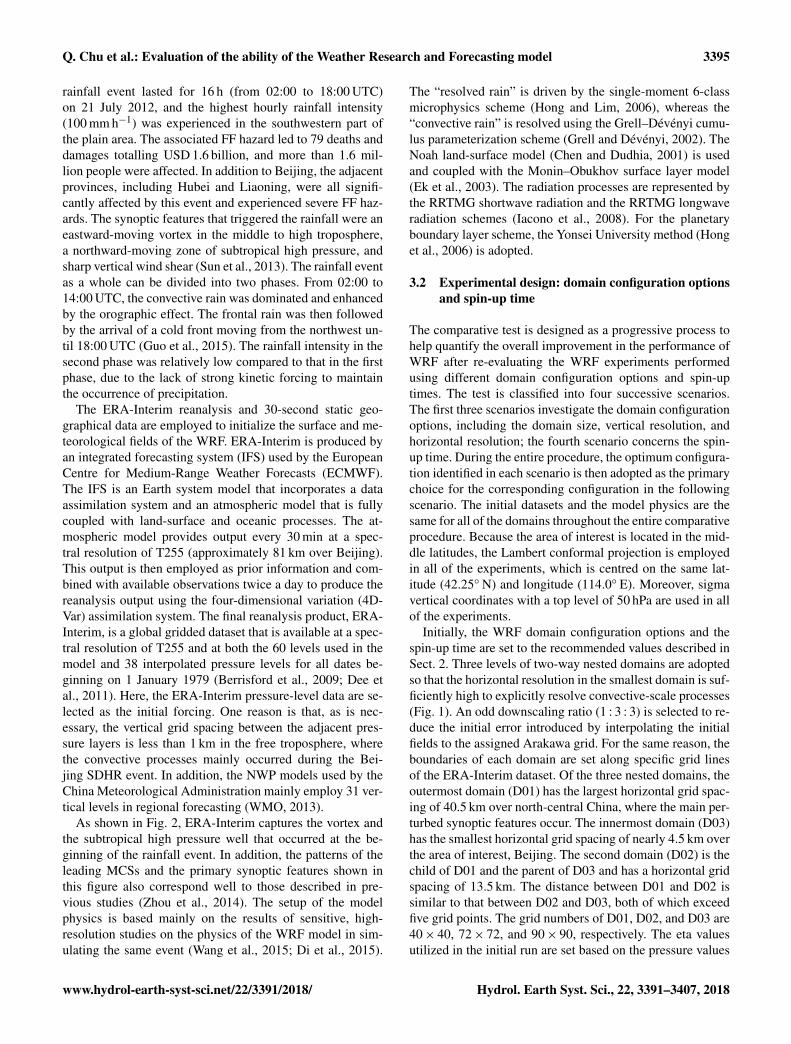
In this scenario, if the experiments are merely evaluated inD03, the conclusion that C0 displays the best performanceduring most of the evaluated time periods may be reached.However, when evaluated in D02, clear differences betweenC0 and the ground truth in both the spatial characteristics ofthe rainfall and the magnitude of the maximum precipitationare detected. Figure 4 shows the spatial distribution of the ac-cumulated 6 h precipitation over the domain two area of C0.Note that the speed of movement of the belt of heavy rainsimulated in C0 is a few kilometres per hour faster than thosein C1 and C2, leading to an early end of the heavy rainfallevent. This difference may explain why the modelling skillof C0 declines significantly as the end of the rainfall event
www.hydrol-earth-syst-sci.net/22/3391/2018/ Hydrol. Earth Syst. Sci., 22, 3391–3407, 2018

3400 Q. Chu et al.: Evaluation of the ability of the Weather Research and Forecasting model
Figure 4. Spatial distribution of 6-h accumulated precipitation for the domain size experiments over the domain two area of C0 duringthe Beijing heavy rainfall event beginning at 12:00 UTC on 21 July 2012. (a) Accumulated precipitation (AP) in C0 during the first 6 hperiod (00:00–06:00 UTC); (b) AP in C0 during the second 6 h period (06:00–12:00 UTC); (c) AP in C0 during the third 6 h period (12:00–18:00 UTC); (d) AP in C0 during the fourth 6 h period (18:00–00:00 UTC); (e) AP in C1 during the first 6 h period; (f) AP in C1 during thesecond 6 h period; (g) AP in C1 during the third 6 h period; (h) AP in C1 during the fourth 6 h period; (i) AP in C2 during the first 6 h period;(j) AP in C2 during the second 6 h period; (k) AP in C2 during the third 6 h period; and (l) AP in C2 during the fourth 6 h period.
approaches. The belt of heavy rain in C0 displays an orien-tation that is shifted nearly 10 degrees northward from thosesimulated in C1 and C2 during the first 6 h, and the stormcentre in C0 displays the smallest range; it is nearly half ofthe area in C2. The results indicate that the domain size of C0is not broad enough to allow the model physics to fully de-velop the small-scale features that favour heavy rainfall. Thespatial characteristics of precipitation are relatively similar inthe other two experiments, but C1 outperforms C2 in both therainfall-related and the PW-related features over domain two.It may be that C2 does not yield better performance than C1because of its inefficient use of boundary conditions to ad-just the false perturbations generated by the local model run.Therefore, C1 is verified as reasonable from both statisticaland physical perspectives and is chosen as the optimal exper-iment in the domain size scenario (OS1).
5.2 Results of the vertical resolution scenario
Based on the analysed results, C1 is selected as the startingexperiment in the vertical resolution scenario. As mentionedabove, C1 is forced with the ERA-Interim pressure-level datawith 29 vertical levels. C3 and C4 are forced with the samepressure-level data with 57 and 85 vertical levels, respec-tively, whereas C5 is forced with the model-level data with38 vertical levels. As shown in Fig. 5, a decline in modelperformance is also obtained for all of the vertical resolu-tion experiments as the evaluated time period increases inlength. Moreover, the largest deterioration in RMSE′ is alsoobserved; it decreases by 0.82 on average. The values of TP′
and PMAX′ derived from the simulations are slightly higherthan those predicted in S1 but are still less than those calcu-lated for the actual precipitation over the entire rainfall event.POD′ displays an evident decrease during the end stage of therainfall event, and its magnitude decreases 50 % less relativeto that shown in C1. The most obvious difference from the
Hydrol. Earth Syst. Sci., 22, 3391–3407, 2018 www.hydrol-earth-syst-sci.net/22/3391/2018/

Q. Chu et al.: Evaluation of the ability of the Weather Research and Forecasting model 3401
Figure 5. As in Fig. 3, but for the experiments in scenario two with different vertical resolutions. Case 1 is forced by the ERA-Interimpressure-level data with 29 vertical levels; cases 3 and 4 are forced by the same data but include double and triple the number of verticallevels, respectively; Case 5 is forced by the ERA-Interim model-level data with 38 vertical levels.
domain size scenario is that the values of R′ calculated be-tween the simulations and the ground truth vary slightly andremain almost the same between the different time periods.In addition, the performance of the vertical resolution exper-iments seems to be less sensitive to the boundary conditionsbecause they result in relatively small variations in WRMSE′
and WR′.Unlike the apparent discrepancies noted in the metrics ob-
tained for the domain size experiments, the differences in therainfall-related metrics among the experiments with differentnumbers of vertical levels are not evident, especially duringthe less rainy period (6 h) and the period when convectiverainfall dominates (12 h). During the first 12 h, C4 displaysbetter agreement with the gridded observations than the otherthree experiments in terms of the accuracy and spatial corre-lation of the rainfall amount. However, over the longer timeperiods, C3 displays the greatest skill, according to most ofthe verification metrics. Comparing C3 and C1 shows that in-creases in the vertical resolution may increase WRF’s abilityto explicitly resolve small-scale physical processes and im-prove the accuracy of the amount and distribution of the sim-ulated rainfall. Comparing C3 and C4 shows that, althoughC4 includes further refinement of the vertical resolution, theC4 performance is worse than that of C3 when the evalu-ated time period increases from 6 h to more than 12 h. Thisresult may occur because progressive reductions in the verti-cal grid spacing magnify the propagation of surface perturba-tions through the vertical grid columns, potentially weaken-ing the kinetic energy that favours precipitation. Examiningthe values of WRMSE′ and WR′ shows that the differences
between the simulations and the reanalysis are more distinctin C3 and C4 than in C1. This discrepancy may occur due tothe exaggeration of the initial errors introduced by the inter-polation process and the incorporation of false surface per-turbations introduced by the limited accuracy and resolutionof the initial forcing data. C5 shows either better or worseperformance than C1 in each period but produces less accu-rate rainfall simulations than C3 over most of the evaluateddurations. As such, C3 is identified as yielding the best per-formance in the vertical resolution scenario.
5.3 Results of the horizontal resolution scenario
Based on the results obtained for scenario S2, C3 is selectedas the starting experiment in the horizontal resolution sce-nario. The modelling skill of the S3 experiments shows sim-ilar temporal trends as that of the S2 experiments (Figs. 5and 6). However, the sensitivity of the metrics to the vari-ation in the horizontal resolution is more evident than thatwith different vertical resolutions. Over most of the evaluatedtime periods, C6, which has a grid spacing of 1.62 km, dis-plays better performance than C3 and C7 having grid spac-ings of 4.5 and 0.826 km, respectively. Comparison of C3and C6 shows that C6 tends to produce more accurate spa-tial patterns of rainfall throughout the heavy rainfall eventin Beijing. Higher values of PMAX′ and TP′ are also de-tected in C6 when compared to C3. This result stems in partfrom the explicit resolution of the convective processes bythe WRF microphysics scheme, which may explain why thePMAX′ of C7 is higher than C6 over most of the testeddurations. Note that the modelling skill of C7 deteriorates
www.hydrol-earth-syst-sci.net/22/3391/2018/ Hydrol. Earth Syst. Sci., 22, 3391–3407, 2018

3402 Q. Chu et al.: Evaluation of the ability of the Weather Research and Forecasting model
Figure 6. As in Fig. 3, but for the experiments in scenario three with different horizontal resolutions. Case 3 has an initial downscaling ratioof 1 : 3 : 3 with horizontal grid spacing of 40.5, 13.5, and 4.5 km, whereas cases 6 and 7 have the same large horizontal grid spacing withnesting ratios of 1 : 5 : 5 and 1 : 7 : 7, respectively. The innermost grid spacing is 1.62 km in Case 6 and 0.826 km in Case 7.
rapidly after the heavy rain begins (12 h); the lowest POD′
and R′ values of the three experiments are obtained for thissimulation and time period. Analysis of the WRMSE′ val-ues suggests that simulation C7 displays significant depar-tures from the coarser-scale PW fields that are used to forcethe model. Thus, model simulations with excessively highhorizontal resolutions may also display poor performance.Theoretically, this deterioration may be attributed to the ac-cumulated errors introduced by the imperfect model physicsor biases in the initial and boundary conditions, which canbe exaggerated by the chaotic nature of NWP systems. Ac-cording to the above analysis, C6 yields the best agreementwith the ground truth data among the horizontal resolutionexperiments.
5.4 Searching for the likely ideal spin-up time
To limit the effects of the chaotic nature of NWP on themodel simulations and extend the lead time, the scenario inwhich the spin-up time used in WRF is varied is placed at theend of the experimental design, after the possible errors in-troduced by inappropriate domain configuration options havebeen reduced. In S4, C6 is adopted as the starting experi-ment (OS3). Unlike the previous scenarios, the ranks of thespin-up time experiments, as sorted by the metrics, are nearlythe same across the different time periods. Hence, Fig. 7presents only the modelling skill of the spin-up time experi-ments over the time period of 18 h. The model performanceof WRF in simulating heavy rainfall clearly varies with thespin-up time. For most of the metrics, an obvious diurnaltendency is found from 0 to 60 h, followed by a short-term
Figure 7. Spatial values of the verification metrics for the WRFspin-up experiments, calculated over 18 h periods and over domainthree. Case 6 employs an initial spin-up time of 12 h; Case 8 em-ploys a spin-up time of 0 h; and from Case 9 to Case 19, the spin-uptime is increased from 24 to 144 h by every 12 h.
decrease until 72 h; random fluctuations occur after 72 h. Be-fore 72 h, the variations in the rainfall and PW metrics arealmost consistent; thus, the good fits of the simulations pro-duced by the model runs with longer spin-up times are alsophysically reasonable within this period. The discrepanciesamong these experiments may be due to differences in theinitial conditions (e.g. the water vapour amounts and thetimes of day when the simulations begin).
From TP′, it is found that all of the spin-up time exper-iments underestimate the total rainfall amount during the
Hydrol. Earth Syst. Sci., 22, 3391–3407, 2018 www.hydrol-earth-syst-sci.net/22/3391/2018/

Q. Chu et al.: Evaluation of the ability of the Weather Research and Forecasting model 3403
Table 3. Comparison of the values of the error metrics in the initial experiment and the optimum experiments identified for each scenario.
Experiment POD′ RMSE′ R′ WRMSE′ WR′ PMAX′ TP′
number
Case 0 (C0) 0.950 0.098 0.226 0.789 0.980 0.440 0.478Case 1 (C1) 0.960 0.064 0.376 0.622 0.967 0.436 0.471Case 3 (C3) 0.969 0.110 0.373 0.610 0.967 0.515 0.496Case 6 (C6) 0.963 0.205 0.375 0.600 0.956 0.582 0.592Case 12 (C12) 0.959 0.402 0.670 0.807 0.977 0.883 0.920
heavy rainfall event. Of all of the rainfall-related metrics,POD′ is found to display the least sensitivity to the spin-up time; however, it displays similar variations over time asPMAX′, R′, and RMSE′ before 72 h, with the highest valuesshown in the experiment with a spin-up time of 48 h (C11).Positive biases are detected in PMAX′ in C9 (which is run24 h ahead) and C11, in which the largest positive biases aredetected in the simulated amount of water vapour across theanalysed periods and earlier (during the initialization period).This result may occur because the atmospheric water vapourcontent determines the maximum possible rainfall amount.C12, which includes a spin-up time of 60 h, is ranked third interms of PMAX′, whereas it displays better performance thanC9 and C11 in terms of TP′, WR′, and WRMSE′. As seen inFig. 8, C9, C11 and C12 also rank in the top three, based onthe values of the rainfall-related metrics calculated over do-main two. However, larger departures from the forcing PWfields are seen in C9 and C11 than in C12. The difference isthat C12 shows the best agreement with the ground truth datain terms of both the rainfall- and PW-related fields. Overall,C12 is regarded as the experiment that best reproduces theBeijing SDHR event with the optimal set of domain configu-ration options and the longest spin-up time.
6 Discussion
The results reveal that the initial experiment with the mostcommonly employed WRF domain settings does not yieldthe best performance in reproducing the temporal and spatialcharacteristics of SDHR on the convective scale. In S1, theassigned domain size of C0 is not sufficiently broad to allowthe model physics to fully develop local small-scale features,resulting in obvious reductions in modelling skill as the eval-uated time duration increases from 12 to 24 h. Further refine-ment of the grid spacing of C0 in S2 and S3 is shown to en-able more explicit resolution of convective processes, leadingto more accurate rainfall simulations. The comparison madein S4 suggests that the proper spin-up time is determined byboth the time needed for model initialization and the accu-racy of the initial conditions fed into the model run. More-over, experiments with too large domains, too high spatialresolutions, or too long spin-up times also yield poor perfor-mance in rainfall simulations. Therefore, the reasonableness
Figure 8. As in Fig. 7, but the metrics are calculated over 18 h peri-ods and over domain two in Case 6.
of these WRF settings should be checked before the model isused in regional NWP systems for flood forecasting or as areference for the design of flood mitigation strategies.
In addition to exploring whether the recommended WRFdomain configuration options and spin-up time are optimalfor application in SDHR-prone urban areas, the performanceof the model is quantified, and its total improvement is eval-uated by comparing the values of the verification metricsyielded by the experiments. Table 3 compares the values ofthe verification metrics obtained for the optimal experimentsin each scenario with the values obtained for the initial ex-periment. Here, the 18 h time duration is selected for eval-uation because it covers most of the heavy rainfall event,and the metrics calculated over this period display a greaterrange and thus greater ability in identifying the simulationwith the best performance. One exception is the domain sizescenario, in which C0 presents the most obvious reduction inperformance during the last stage of the rainfall event (24 h).Therefore, the improvement in C1 relative to C0 is mainlyrepresented by R’ and POD′ across D03 over the 18 h timeperiod. The improvement produced by refining the verticalresolution is indicated by all of the rainfall-related metricsbut is accompanied by a decrease in WRMSE′ that stems inpart from the reduction in kinetic energy, which promotesrainfall. C6 yields higher values of POD′, RMSE′, R′, andPMAX′ when compared with C3, indicating that appropri-
www.hydrol-earth-syst-sci.net/22/3391/2018/ Hydrol. Earth Syst. Sci., 22, 3391–3407, 2018

3404 Q. Chu et al.: Evaluation of the ability of the Weather Research and Forecasting model
ate increases in the horizontal resolution can increase the ac-curacy of rainfall simulations. The largest differences in themetrics between C6 and C12 occurs for PMAX′, which mayrelate to the different initial weather conditions at the differ-ent starting times of the model runs.
Overall, although the magnitudes of the increases in therainfall metrics differ, they all reflect an increase in modelskill after the re-evaluation process has been conducted.Specifically, R′ increases from 0.226 in C0 to 0.67 in C12,RMSE′ increases from 0.098 to 0.402, and PMAX′ increasesfrom 0.44 to 0.883. As the complete assessment is based onobjective verification metrics and checked by subjective veri-fication methods, it can be concluded that the domain config-uration options and the spin-up time have significant effectson regional simulations of SDHR. Therefore, re-evaluatingthe values of those settings used in high-resolution regionalstudies is certainly worthwhile, and the accuracy of predic-tions of heavy rain clearly benefit from these analyses. Forthe evaluated metrics, evaluations based on a single typeof metric or a single time period may clearly result in par-tially accurate conclusions. The use of datasets from multiplesources in verification can help increase the comprehensive-ness of the analyses, such as the use of WRMSE′ and WR′
in this study. The use of different time periods helps to deter-mine the optimal configurations with higher physical ratio-nality, such as the selection of the proper domain size. In ad-dition, the verification results may also depend on the fieldsand temporal–spatial scales of interest. To further understandthe effects of WRF model configuration options on regionalsimulations of sub-daily heavy rainfall, more objective ver-ification metrics for SDHR should be developed, and morecase studies of SDHR events are also needed. Given that theuncertainties in the regional NWP studies result mainly fromthe inaccurate boundary conditions associated with grid nest-ing techniques, methods that can serve as alternate schemesto reduce these uncertainties are also worth studying. One ex-ample includes the mesh transitions approach used on irregu-lar grids. In addition, more accurate simulations are expectedwhen the model is driven with forcing data with higher tem-poral or spatial resolutions than those of the ERA-Interimreanalysis because the uncertainties and errors introduced bythe input data could be further reduced.
7 Conclusions
In this study, a comparative test is designed to evaluate theeffects of WRF domain configuration options and the spin-up time on simulations of the precipitation during the SDHRevent that occurred on 21 July 2012 in Beijing, China. Threenested domains are established: D01 is the largest, has thecoarsest resolution, and covers the leading synoptic features;and D03 is the smallest and covers the area of interest, Bei-jing. The initial conditions of the three domains are providedby the ERA-Interim reanalysis and the 30-second static geo-
graphical datasets. For the LBCs, D01 is forced by the ERA-Interim reanalysis, whereas D02 is forced by D01, and D03 isforced by D02. The reference ground truth data used for veri-fication is 3-hourly 0.05 gridded rainfall observations and thecoarser-scale ERA-Interim reanalysis. Five rainfall-relatederror metrics and two PW-related indices that monitor thedeparture of the model simulations from the driving fieldsare calculated at the convective-resolving scale over differ-ent sub-daily time spans. These metrics are then checked andconsidered together as part of a subjective verification pro-cess that is intended to pinpoint the likely best combinationof the domain configuration options and spin-up time and tohelp quantify the possible improvements in the model per-formance of WRF in reproducing severe SDHR events aftercarrying out the entire re-evaluation process.
Precipitation simulations are sensitive to changes in do-main size, vertical resolution, horizontal resolution, and spin-up time. Of all of the configurations, the most obvious varia-tions are found when adjusting the domain size and the spin-up time. This analysis shows that domains that cover onlythe area of interest may be insufficiently broad to permit fulldevelopment of small-scale features, resulting in poor perfor-mance in capturing the spatial pattern of heavy rainfall, espe-cially in the early stages of rainfall events. Despite the dom-inant role of chaotic processes, it is still possible that modelruns with longer spin-up times may result in better rainfallsimulations, given favourable initial weather conditions. Theeffects of the vertical and horizontal resolutions are smaller,but the accuracy of the rainfall amount and the correct hitsexhibit evident increases in runs with slightly higher spa-tial resolutions. A comparison of C12, which uses the eval-uated optimum configurations, and C0, which uses the rec-ommended settings, shows that the metrics clearly increase.Specifically, R′ increases from 0.226 to 0.67, REPMAX risesfrom −56 to −11.7 %, and RMSE decreases by 33.65 %.Thus, substantial benefits may result from re-evaluating theWRF domain configuration options and spin-up times usedin regional studies of SDHR.
Given the intensification of SDHR and the increased risksposed by SDHR-induced hazards, the demands of the opera-tional flood management community for more accurate rain-fall predictions with longer lead times, especially over highlyaffected areas with very short hydrologic response times, areincreasing. One method that has now been proven to be ef-fective is to dynamically downscale freely available globalNWP products to areas of interest using high-resolution re-gional NWP models (e.g. WRF). Therefore, the uncertain-ties associated with the downscaling process, such as er-rors in boundary conditions and the issues associated withgrid nesting, should be carefully evaluated to ensure thatthe rainfall simulations produced are both statistically accu-rate and physically reasonable before they are employed inflood forecasting systems. This study illustrates the impor-tance of re-evaluating the domain configuration options andspin-up times used in WRF for improving regional rainfall
Hydrol. Earth Syst. Sci., 22, 3391–3407, 2018 www.hydrol-earth-syst-sci.net/22/3391/2018/

Q. Chu et al.: Evaluation of the ability of the Weather Research and Forecasting model 3405
simulations. Comparisons of the metrics indicate that evalu-ations based on just one category of metrics or values of met-rics calculated over only one time period (e.g. 24 h) do notresult in comprehensive comparisons and may lead to par-tially accurate conclusions. The use of PW fields calculatedagainst reanalysis output is verified to be helpful in determin-ing the optimal set of model configurations when analysesof rainfall-related metrics do not yield uniform conclusions.In addition, evaluations conducted over larger-scale domainsare demonstrated to be useful in establishing the reasonable-ness of the evaluated results. Overall, the evaluation processis partly subjective. To simplify the assessment process, ver-ification methods that can replace this subjective verificationprocedure should be developed. More regional case studiesare also needed to further investigate the effects of config-uration options in simulations of regional SDHR and to ex-plore methods of reducing the uncertainties in regional NWPmodelling associated with the scale-variation procedures. Inaddition, the use of more accurate forcing data with highertemporal and spatial resolutions is also expected to reducethe errors in the initial and boundary conditions and couldthus be helpful in further improving the accuracy of rainfallsimulations and extending the lead times of forecasts.
Data availability. The ERA-Interim reanalysis dataset usedas the initial forcing in the text is freely available athttps://www.ecmwf.int/en/forecasts/datasets/archive-datasets/reanalysis-datasets/era-interim (Dee et al., 2011).
Competing interests. The authors declare that they have no conflictof interest.
Acknowledgements. This study is supported by the key researchprojects “Sponge city construction and urban flooding/waterloggingdisaster in the sub-centre of Beijing City” (Z171100002217080),Beijing Municipal Science and Technology Commission, and “Ur-ban storm flooding/waterlogging disasters under changing environ-ment” (2017YFC1502701), national key research and developmentplan, Ministry of Science and Technology, China. Support is alsoreceived from the the Resilient Economy and Society by IntegratedSysTems modelling (RESIST), the Newton Fund via NaturalEnvironment Research Council (NERC) and the Economic andSocial Research Council (ESRC; NE/N012143/1), and the NationalNatural Science Foundation of China (no. 4151101234). The ChinaScholarship Council supports the first author for her academic visitto the University of Bristol, UK.
Edited by: Uwe EhretReviewed by: two anonymous referees
References
Aligo, E. A., Gallus Jr., W. A., and Segal, M.: On the impact ofWRF model vertical grid resolution on Midwest summer rainfallforecasts, Weather Forecast., 24, 575–594, 2009.
Bartholmes and Todini: Coupling meteorological and hydrologicalmodels for flood forecasting, Hydrol. Earth Syst. Sci., 9, 333–346, https://doi.org/10.5194/hess-9-333-2005, 2005.
Berrisford, P., Dee, D. P., Fielding, K., Fuentes, M., Kallberg, P.,Kobayashi, S., and Uppala, S. M.: The ERA-Interim Archive,ERA Report Series, 1, 1–16, 2009.
Brömmel, D., Frings, W., and Wylie, B.: Technical Report JuqueenExtreme Scaling Workshop 2015, Tech. rep., Jülich, Ger-many, available at: http://hdl.handle.net/2128/8435, last access:17 June 2018.
Castelli, F.: Atmosphere modeling and hydrologic-prediction uncer-tainty, U.S. – Italy Research Workshop on the Hydrometeorol-ogy, impacts and management of extreme floods, Perugia, 1995.
Chen, F. and Dudhia, J.: Coupling an advanced land surface-hydrology model with the Penn State-NCAR MM5 modelingsystem. Part I: Model implementation and sensitivity, Mon.Weather Rev., 129, 569–585, 2001.
Chen, H., Sun, J., Chen, X., and Zhou, W.: CGCM projections ofheavy rainfall events in China, Int. J. Climatol., 32, 441–450,2012.
Clark, P., Roberts, N., Lean, H., Ballard, S. P., and Charlton-Perez,C.: Convection-permitting models: a step-change in rainfall fore-casting, Meteorol. Appl., 23, 165–181, 2016.
Coen, J. L., Cameron, M., Michalakes, J., Patton, E. G., Riggan,P. J., and Yedinak, K. M.: WRF-Fire: coupled weather–wildlandfire modeling with the weather research and forecasting model,J. Appl. Meteorol. Clim., 52, 16–38, 2013.
Crétat, J., Pohl, B., Richard, Y., and Drobinski, P.: Uncertaintiesin simulating regional climate of Southern Africa: sensitivity tophysical parameterizations using WRF, Clim. Dynam., 38, 613–634, 2012.
Cuo, L., Pagano, T. C., and Wang, Q. J.: A review of quantitativeprecipitation forecasts and their use in short-to medium-rangestreamflow forecasting, J. Hydrometeorol., 12, 713–728, 2011.
Dee, D. P., Uppala, S. M., Simmons, A. J., Berrisford, P., Poli,P., Kobayashi, S., Andrae, U., Balmaseda, M. A., Balsamo, G.,Bauer, P., Bechtold, P., Beljaars, A. C. M., van de Berg, L., Bid-lot J., Bormann, N., Delsol, C., Dragani, R., Fuentes, M., Geer,A. J., Haimberger, L., Healy, S. B., Hersbach, H., Hólm, E. V.,Isaksen, L., Kållberg, P., Köhler, M., Matricardi, M., McNally,A. P., Monge-Sanz, B. M., Morcrette, J.-J., Park, B.-K., Peubey,C., de Rosnay, P., Tavolato, C., Thépaut, J.-N., and Vitart, F.: TheERA-Interim reanalysis: configuration and performance of thedata assimilation system, Q. J. Roy. Meteorol. Soc., 137, 553–597, https://doi.org/10.1002/qj.828, 2011.
Di, Z. H., Duan, Q. Y., Gong, W., Wang, C., Gan, Y. J., Quan, J. P.,Li, J. D., Miao, C. Y., Ye, A. Z., and Tong, C.: Assessing WRFmodel parameter sensitivity: A case study with five-day summerprecipitation forecasting in the Greater Beijing Area, Geophys.Res. Lett., 42, 579–587, 2015.
Done, J., Davis, C. A., and Weisman, M.: The next generation ofNWP: Explicit forecasts of convection using the Weather Re-search and Forecasting (WRF) model, Atmos. Sci. Lett., 5, 110–117, 2004.
www.hydrol-earth-syst-sci.net/22/3391/2018/ Hydrol. Earth Syst. Sci., 22, 3391–3407, 2018

3406 Q. Chu et al.: Evaluation of the ability of the Weather Research and Forecasting model
Ek, M. B., Mitchell, K. E., Lin, Y., Rogers, E., Grunmann, P., Ko-ren, V., Gayno, G., and Tarpley, J. D.: Implementation of Noahland surface model advances in the National Centers for Environ-mental Prediction operational mesoscale Eta model, J. Geophys.Res.-Atmos., 108, 8851, https://doi.org/10.1029/2002JD003296,2003.
Fierro, A. O., Rogers, R. F., Marks, F. D., and Nolan, D. S.: Theimpact of horizontal grid spacing on the microphysical and kine-matic structures of strong tropical cyclones simulated with theWRF-ARW model, Mon. Weather Rev., 137, 3717–3743, 2009.
Foley, A. M., Leahy, P. G., Marvuglia, A., and McKeogh, E. J.: Cur-rent methods and advances in forecasting of wind power genera-tion, Renewable Energy, 37, 1–8, 2012.
Gao, Y., Yuan, Y., Wang, H., Schmidt, A. R., Wang, K., and Ye, L.:Examining the effects of urban agglomeration polders on floodevents in Qinhuai River basin, China with HEC-HMS model,Water Sci. Technol., 75, 2130–2138, 2017.
Goswami, P., Shivappa, H., and Goud, S.: Comparative analysis ofthe role of domain size, horizontal resolution and initial condi-tions in the simulation of tropical heavy rainfall events, Meteorol.Appl., 19, 170–178, 2012.
Grell, G. A. and Dévényi, D.: A generalized approach toparameterizing convection combining ensemble and dataassimilation techniques, Geophys. Res. Lett., 29, 1693,https://doi.org/10.1029/2002GL015311, 2002.
Guo, C., Xiao, H., Yang, H., and Tang, Q.: Observation and model-ing analyses of the macro-and microphysical characteristics of aheavy rain storm in Beijing, Atmos. Res., 156, 125–141, 2015.
Heinzeller, D., Duda, M. G., and Kunstmann, H.: Towardsconvection-resolving, global atmospheric simulations with theModel for Prediction Across Scales (MPAS) v3.1: an ex-treme scaling experiment, Geosci. Model Dev., 9, 77–110,https://doi.org/10.5194/gmd-9-77-2016, 2016.
Hong, S. Y. and Lee, J. W.: Assessment of the WRF model in re-producing a flash-flood heavy rainfall event over Korea, Atmos.Res., 93, 818–831, 2009.
Hong, S. Y. and Lim, J. O. J.: The WRF single-moment 6-class mi-crophysics scheme (WSM6), J. Korean Meteorol. Soc., 42, 129–151, 2006.
Hong, S. Y., Noh, Y., and Dudhia, J.: A new vertical diffusion pack-age with an explicit treatment of entrainment processes, Mon.Weather Rev., 134, 2318–2341, 2006.
Huang, C., Zheng, X., Tait, A., Dai, Y., Yang, C., Chen, Z., Li, T.,and Wang, Z.: On using smoothing spline and residual correc-tion to fuse rain gauge observations and remote sensing data, J.Hydrol., 508, 410–417, 2013.
Iacono, M. J., Delamere, J. S., Mlawer, E. J., Shephard, M.W., Clough, S. A., and Collins, W. D.: Radiative forcing bylong-lived greenhouse gases: calculations with the AER radia-tive transfer models, J. Geophys. Res.-Atmos., 113, D13103,https://doi.org/10.1029/2008JD009944, 2008.
Kain, J. S., Weiss, S. J., Bright, D. R., Baldwin, M. E., Levit, J. J.,Carbin, G. W., Schwartz, C. S., Weisman, M. L., Droegemeeier,K. K., Weber, D. B., and Thomas, K. W.: Some practical con-siderations regarding horizontal resolution in the first generationof operational convection-allowing NWP, Weather Forecast., 23,931–952, 2008.
Kleczek, M. A., Steeneveld, G. J., and Holtslag, A. A.: Evalua-tion of the weather research and forecasting mesoscale model for
GABLS3: impact of boundary-layer schemes, boundary condi-tions and spin-up, Bound.-Lay. Meteorol., 152, 213–243, 2014.
Klemp, J. B.: Advances in the WRF model for convection-resolving forecasting, Adv. Geosci., 7, 25–29,https://doi.org/10.5194/adgeo-7-25-2006, 2006.
Leduc, M. and Laprise, R.: Regional climate model sensitivity todomain size, Clim. Dynam., 32, 833–854, 2009.
Li, J., Chen, Y., Wang, H., Qin, J., Li, J., and Chiao, S.: Extend-ing flood forecasting lead time in a large watershed by couplingWRF QPF with a distributed hydrological model, Hydrol. EarthSyst. Sci., 21, 1279–1294, https://doi.org/10.5194/hess-21-1279-2017, 2017.
Liu, J., Bray, M., and Han, D.: Sensitivity of the Weather Researchand Forecasting (WRF) model to downscaling ratios and stormtypes in rainfall simulation, Hydrol. Process., 26, 3012–3031,2012.
Luna, T., Castanheira, M., and Rocha, A.: Assessment ofWRF-ARW forecasts using warm initializations, available at:http://climetua.fis.ua.pt/publicacoes/APMG_extended_abstract_2013_Luna_et_al.pdf (last access: 17 June 2018), 2013.
Miguez-Macho, G., Stenchikov, G. L., and Robock, A.: Spectralnudging to eliminate the effects of domain position and geometryin regional climate model simulations, J. Geophys. Res.-Atmos.,109, D13104, https://doi.org/10.1029/2003JD004495, 2004.
Powers, J. G., Klemp, J. B., Skamarock, W. C., Davis, C. A., Dud-hia, J., Gill, D. O., Coen, J. L., and Grell, G. A.: The WeatherResearch and Forecasting Model: Overview, System Efforts,and Future Directions, B. Am. Meteorol. Soc., 98, 1717–1737,https://doi.org/10.1175/BAMS-D-15-00308.1, 2017.
Prein, A. F., Langhans, W., Fosser, G., Ferrone, A., Ban, N., Go-ergen, K., Keller, M., Tölle, M., Gitjahr, O., Feser, F., Brisson,E., Kollet, S., Schmidli, J., van Lipzig, N. P. M., and Leung, R.:A review on regional convection-permitting climate modeling:Demonstrations, prospects, and challenges, Rev. Geophys., 53,323–361, 2015.
Roberts, N. M. and Lean, H. W.: Scale-selective verification of rain-fall accumulations from high-resolution forecasts of convectiveevents, Mon. Weather Rev., 136, 78–97, 2008.
Ruiz, J. J., Saulo, C., and Nogués-Paegle, J.: WRF model sensitiv-ity to choice of parameterization over South America: validationagainst surface variables, Mon. Weather Rev., 138, 3342–3355,2010.
Schwartz, C. S., Kain, J. S., Weiss, S. J., Xue, M., Bright, D. R.,Kong, F. Y., Thomas, K. W., Levit, J. J., and Coniglio, M. C.:Next-day convection-allowing WRF model guidance: A secondlook at 2-km versus 4-km grid spacing, Mon. Weather Rev., 137,3351–3372, 2009.
Seth, A. and Rojas, M.: Simulation and sensitivity in a nested mod-eling system for South America. Part I: Reanalyses boundaryforcing, J. Climate, 16, 2437–2453, 2003.
Shih, D. S., Chen, C. H., and Yeh, G. T.: Improving our understand-ing of flood forecasting using earlier hydro-meteorological intel-ligence, J. Hydrol., 512, 470–481, 2014.
Sikder, S. and Hossain, F.: Assessment of the weather research andforecasting model generalized parameterization schemes for ad-vancement of precipitation forecasting in monsoon-driven riverbasins, J. Adv. Model. Earth Syst., 8, 1210–1228, 2016.
Skamarock, W. C., Klemp, J. B., Dudhia, J., Gill, D. O., Barker, D.M., Duda, M. G., Huang, X. Y., Wang, W., and Powers, J. G.: A
Hydrol. Earth Syst. Sci., 22, 3391–3407, 2018 www.hydrol-earth-syst-sci.net/22/3391/2018/

Q. Chu et al.: Evaluation of the ability of the Weather Research and Forecasting model 3407
Description of the Advanced Research WRF Version 3, NCARNote NCAR/TN-475, NCAR, Boulder, Colorado, USA, 2008.
Soares, P. M., Cardoso, R. M., Miranda, P. M., de Medeiros, J.,Belo-Pereira, M., and Espirito-Santo, F.: WRF high resolutiondynamical downscaling of ERA-Interim for Portugal, Clim. Dy-nam., 39, 2497–2522, 2012.
Sun, M. S., Yang, L. Q., Yin, Q., Niu, Z. Y., and Gao, L. M.:Analysis of the cause of a torrential rain occurring in Beijingon 21 July 2012, Torrent. Rain Disast., 32, 218–223, 2013.
Swinbank, R. and James Purser, R.: Fibonacci grids: A novel ap-proach to global modeling, Q. J. Roy. Meteorol. Soc., 132, 1769–1793, 2006.
Tian, J., Liu, J., Yan, D., Li, C., and Yu, F.: Numerical rainfall sim-ulation with different spatial and temporal evenness by using aWRF multiphysics ensemble, Nat. Hazards Earth Syst. Sci., 17,563–579, https://doi.org/10.5194/nhess-17-563-2017, 2017.
Vrac, M., Drobinski, P., Merlo, A., Herrmann, M., Lavaysse,C., Li, L., and Somot, S.: Dynamical and statistical down-scaling of the French Mediterranean climate: uncertainty as-sessment, Nat. Hazards Earth Syst. Sci., 12, 2769–2784,https://doi.org/10.5194/nhess-12-2769-2012, 2012.
Wang, K., Wang, L., Wei, Y. M., and Ye, M.: Beijing storm ofJuly 21, 2012: observations and reflections, Nat. Hazards, 67,969–974, 2013.
Wang, S. L., Kang, H. W., Gu, X. Q., and Ni, Y. Q.: NumericalSimulation of Mesoscale Convective System in the Warm Sectorof Beijing ‘7.21’ Severe Rainstorm, Meteorol. Mon., 41, 544–553, 2015.
Warner, T. T.: Quality assurance in atmospheric modeling, B. Am.Meteorol. Soc., 92, 1601–1610, 2011.
Warner, T. T., Peterson, R. A., and Treadon, R. E.: A tutorial on lat-eral boundary conditions as a basic and potentially serious limita-tion to regional numerical weather prediction, B. Am. Meteorol.Soc., 78, 2599–2617, 1997.
Westra, S., Fowler, H. J., Evans, J. P., Alexander, L. V., Berg, P.,Johnson, F., Kendon, E. J., Lenderink, G., and Roberts, N. M.:Future changes to the intensity and frequency of short-durationextreme rainfall, Rev. Geophys., 52, 522–555, 2014.
Willems, P., Arnbjerg-Nielsen, K., Olsson, J., and Nguyen, V. T. V.:Climate change impact assessment on urban rainfall extremesand urban drainage: methods and shortcomings, Atmos. Res.,103, 106–118, 2012.
WMO: Anticipated advances in numerical weather prediction,and the growing technology gap in weather forecast, avail-able at: https://www.wmo.int/pages/prog/www/swfdp/Meetings/documents/Advances_NWP.pdf (last access: 17 June 2018),2013.
Xu, Z. X. and Chu, Q.: Climatological features and trends of ex-treme precipitation during 1979–2012 in Beijing, China, P. Int.Assoc. Hydrolog. Sci., 369, 97–102, 2015.
Xu, Z. X. and Zhao, G.: Impact of urbanization on rainfall-runoffprocesses: case study in the Liangshui River Basin in Beijing,China, P. Int. Assoc. Hydrolog. Sci., 373, 7–12, 2016.
Yu, E.-T., Wang, H.-J., and Sun, J.-Q.: A quick report on a dynam-ical downscaling simulation over China using the nested model,Atmos. Ocean. Sc. Lett., 3, 325–329, 2010.
Yu, R., Xu, Y., Zhou, T., and Li, J.: Relation between rainfall du-ration and diurnal variation in the warm season precipitationover central eastern China, Geophys. Res. Lett., 34, L13703,https://doi.org/10.1029/2007GL030315, 2007.
Yu, W., Nakakita, E., Kim, S., and Yamaguchi, K.: Impact Assess-ment of Uncertainty Propagation of Ensemble NWP Rainfall toFlood Forecasting with Catchment Scale, Adv. Meteorol., 4, 1–17, https://doi.org/10.1155/2016/1384302, 2016.
Yucel, I., Onen, A., Yilmaz, K. K., and Gochis, D. J.: Calibrationand evaluation of a flood forecasting system: Utility of numericalweather prediction model, data assimilation and satellite-basedrainfall, J. Hydrol., 523, 49–66, 2015.
Zhou, Y. S., Liu, L., Zhu, K. F., and Li, J. T.: Simulation and evolu-tion characteristics of mesoscale systems occurring in Beijing on21 July 2012, Chinese J. Atmos. Sci., 38, 885–896, 2014.
www.hydrol-earth-syst-sci.net/22/3391/2018/ Hydrol. Earth Syst. Sci., 22, 3391–3407, 2018