CD/lm - Federal Aviation Administration · Web viewNumerical Weather Prediction (NWP)...
15
IPACG/42 IP/09 9/14/16 THE FORTY-SECOND MEETING OF THE INFORMAL PACIFIC ATC CO-ORDINATING GROUP (IPACG/42) (Seattle WA, United States 14 – 15 September 2016) Agenda Item 6: Air Traffic Management (ATM) Issues Benefits Assessment on DARP and Future TBO in Oceanic Arrivals to the Tokyo Metropolitan Area (Presented by Electronic Navigation Research Institute (ENRI), Japan) 1. Introduction 1.1. To address the upcoming challenges facing the national aviation industry, the Japan Civil Aviation Bureau (JCAB) has created the Collaborative Actions for Renovation of Air Traffic Systems (CARATS) long-term ATM system modernization plan. 4D-Trajectory Based Operations (TBO) is one of the key technologies proposed in CARATS, and various research activities have been initiated at ENRI in collaboration with government, industry and academia. Preceding studies have shown that 4D-TBO has the potential to improve fuel reduction, decrease operational delay and enhance air traffic capacity at major airports [1-3]. 1.2. DARP operations is one of the strategies introduced in the User Preferred Routes (UPR) implementations in the Northern and Southern Pacific regions. Since 2012, JCAB began trial operations between Oakland FIR and Fukuoka FIR with the collaboration of FAA and Japanese airline companies. DARP has been proved to be a crucial tool enabling operators to obtain fuel savings [4-6]. However, due to the considerable workload demanded for initiating DARP operations in contrast to the not-so-significant potential savings, operators are not that keen to apply such procedures regularly. Yet, the rapid increase SUMMARY This paper discusses the benefits of conventional Dynamic Airborne Route Procedure (DARP) operations initiated between Fukuoka and Oakland FIRs, and the possibility of enhancing these benefits by applying 1
Transcript of CD/lm - Federal Aviation Administration · Web viewNumerical Weather Prediction (NWP)...
IPACG/42IP/09
9/14/16THE FORTY-SECOND MEETING OF THEINFORMAL PACIFIC ATC CO-ORDINATING GROUP(IPACG/42)
(Seattle WA, United States 14 – 15 September 2016)
Agenda Item 6: Air Traffic Management (ATM) Issues
Benefits Assessment on DARP and Future TBO in Oceanic Arrivals to the Tokyo Metropolitan Area
(Presented by Electronic Navigation Research Institute (ENRI), Japan)
1. Introduction
1.1. To address the upcoming challenges facing the national aviation industry, the Japan Civil Aviation Bureau (JCAB) has created the Collaborative Actions for Renovation of Air Traffic Systems (CARATS) long-term ATM system modernization plan. 4D-Trajectory Based Operations (TBO) is one of the key technologies proposed in CARATS, and various research activities have been initiated at ENRI in collaboration with government, industry and academia. Preceding studies have shown that 4D-TBO has the potential to improve fuel reduction, decrease operational delay and enhance air traffic capacity at major airports [1-3].
1.2. DARP operations is one of the strategies introduced in the User Preferred Routes (UPR) implementations in the Northern and Southern Pacific regions. Since 2012, JCAB began trial operations between Oakland FIR and Fukuoka FIR with the collaboration of FAA and Japanese airline companies. DARP has been proved to be a crucial tool enabling operators to obtain fuel savings [4-6]. However, due to the considerable workload demanded for initiating DARP operations in contrast to the not-so-significant potential savings, operators are not that keen to apply such procedures regularly. Yet, the rapid increase in air traffic in the Pacific region has significantly influenced research activities to seek for possible modifications and improvements in oceanic operations.
1.3. This paper provides a framework to associate with the ongoing TBO-related projects at ENRI by investigating the benefits of DARP operations and possible benefits enhancement through applying 4D-TBO to oceanic arrivals to the Tokyo metropolitan area, based on the assumption that the concept of 4D-TBO is validated for oceanic operations. Information regarding a series of eighteen DARP implemented flights provided by a Japanese airline (referred to as ‘reference data’) are analysed by synthesizing trajectories along the DARP track and the original flight plan track and comparing their performance. A trajectory optimizer tool developed with the collaboration of Kyushu University is used to generate fuel optimal trajectories over the DARP tracks. Results are used to elaborate the benefits obtained through DARP operations and also as reference data to review the further potential benefits of applying 4D-TBO to oceanic operations.
SUMMARYThis paper discusses the benefits of conventional Dynamic Airborne Route Procedure (DARP) operations initiated between Fukuoka and Oakland FIRs, and the possibility of enhancing these benefits by applying the 4D- Trajectory Based Operations (TBO) concept into oceanic operations.
1

IPACG/42IP/09
9/14/161.4. Meteorological data provided by the Japan Meteorological Agency (JMA) and aircraft performance data from the EUROCONTROL Base of Aircraft Data (BADA) aircraft performance model are utilized to estimate performance parameters related to aircraft flight and fuel consumption.
1.5. A trajectory optimizer tool based on the Dynamic Programming (DP) method is used to simulate the application of 4D-TBO in oceanic airspace within a defined state-space grid by allowing an aircraft to select the optimal 3D route and speed to minimize total fuel consumption. The trade-off between fuel consumption and flight time is dealt with by the concept of Cost Index (CI) in the optimizer model. (A detailed description on how the trajectories are optimized is given in the Appendix.)
2. Data preparation and analytical approach
2.1. All eighteen flights in this study originated from Honolulu International Airport (PHNL), and arrived at either Tokyo International Airport (RJTT) or Narita International Airport (RJAA).
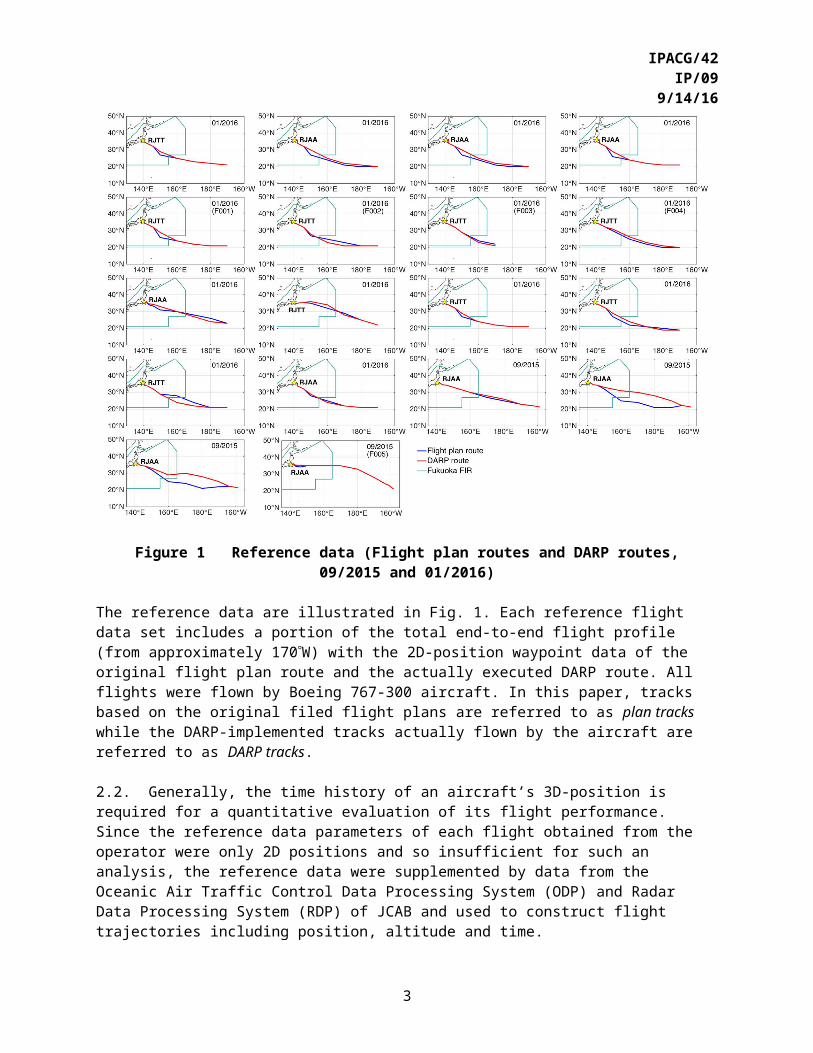
Figure 1 Reference data (Flight plan routes and DARP routes, 09/2015 and 01/2016)
The reference data are illustrated in Fig. 1. Each reference flight data set includes a portion of the total end-to-end flight profile (from approximately 170W) with the 2D-position waypoint data of the original flight plan route and the actually executed DARP route. All flights were flown by Boeing 767-300 aircraft. In this paper, tracks based on the original filed flight plans are referred to as plan tracks while the DARP-implemented tracks actually flown by the aircraft are referred to as DARP tracks.
2.2. Generally, the time history of an aircraft’s 3D-position is required for a quantitative evaluation of its flight performance. Since the reference data parameters of each flight obtained from the operator were
2
IPACG/42IP/09
9/14/16only 2D positions and so insufficient for such an analysis, the reference data were supplemented by data from the Oceanic Air Traffic Control Data Processing System (ODP) and Radar Data Processing System (RDP) of JCAB and used to construct flight trajectories including position, altitude and time.
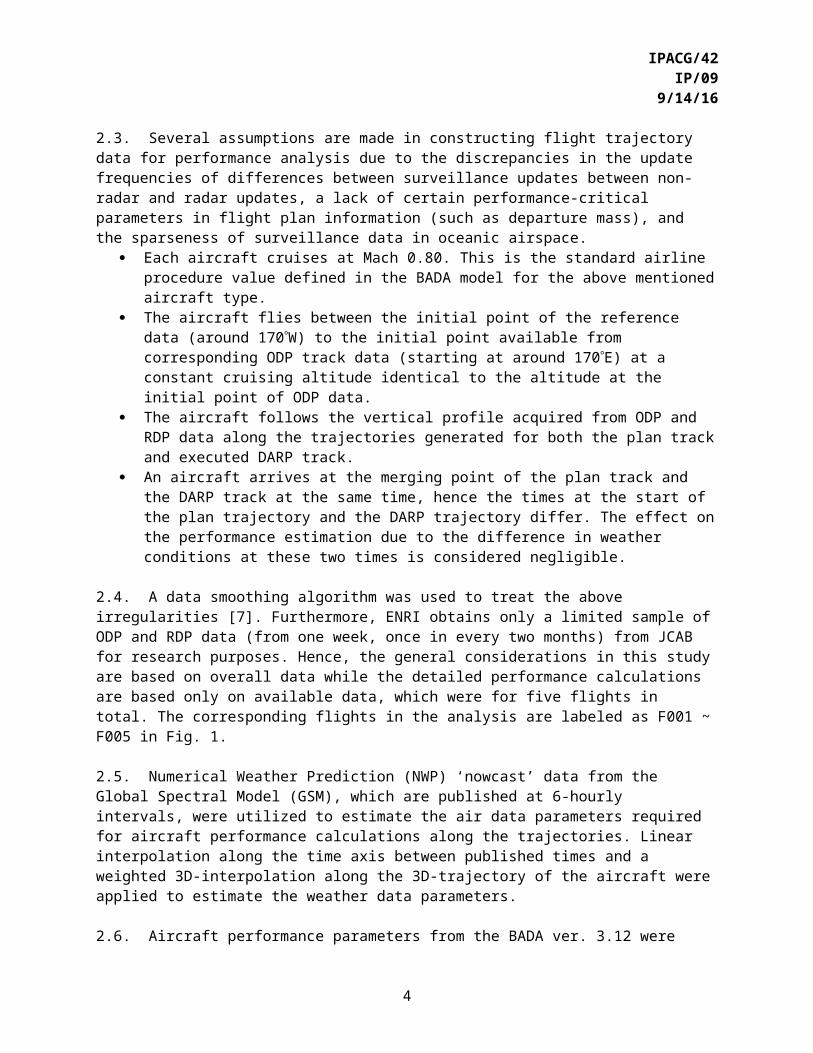
2.3. Several assumptions are made in constructing flight trajectory data for performance analysis due to the discrepancies in the update frequencies of differences between surveillance updates between non-radar and radar updates, a lack of certain performance-critical parameters in flight plan information (such as departure mass), and the sparseness of surveillance data in oceanic airspace.
Each aircraft cruises at Mach 0.80. This is the standard airline procedure value defined in the BADA model for the above mentioned aircraft type.
The aircraft flies between the initial point of the reference data (around 170W) to the initial point available from corresponding ODP track data (starting at around 170E) at a constant cruising altitude identical to the altitude at the initial point of ODP data.
The aircraft follows the vertical profile acquired from ODP and RDP data along the trajectories generated for both the plan track and executed DARP track.
An aircraft arrives at the merging point of the plan track and the DARP track at the same time, hence the times at the start of the plan trajectory and the DARP trajectory differ. The effect on the performance estimation due to the difference in weather conditions at these two times is considered negligible.
2.4. A data smoothing algorithm was used to treat the above irregularities [7]. Furthermore, ENRI obtains only a limited sample of ODP and RDP data (from one week, once in every two months) from JCAB for research purposes. Hence, the general considerations in this study are based on overall data while the detailed performance calculations are based only on available data, which were for five flights in total. The corresponding flights in the analysis are labeled as F001 ~ F005 in Fig. 1.
2.5. Numerical Weather Prediction (NWP) ‘nowcast’ data from the Global Spectral Model (GSM), which are published at 6-hourly intervals, were utilized to estimate the air data parameters required for aircraft performance calculations along the trajectories. Linear interpolation along the time axis between published times and a weighted 3D-interpolation along the 3D-trajectory of the aircraft were applied to estimate the weather data parameters.
2.6. Aircraft performance parameters from the BADA ver. 3.12 were applied in the analysis. As the aircraft mass was unknown, the aircraft mass at the initial point of each flight was estimated (based on the the flight duration and maximum take-off mass) as a proportion of the maximum take-off mass defined in the BADA model based on the assumption that fuel consumption is approximately linearly proportional to flight time during the cruise phase (further details on reference) [8]. Table 1 shows the flight time estimated from the plan tracks with total flight time in brackets, obtained from flight plan data, and the estimated initial mass value for each flight case.
Table 1 Estimated initial mass of aircraft
Flight Flight time (s) Initial mass (kg)F001 23,280 (33,000) 133,704F002 23,610 (33,600) 131,928F003 15,390 (32,880) 88,154F004 22,350 (32,520) 131,655F005 19,670 (26,640) 137,985
3
IPACG/42IP/09
9/14/163. Discussion
Benefits of DARP
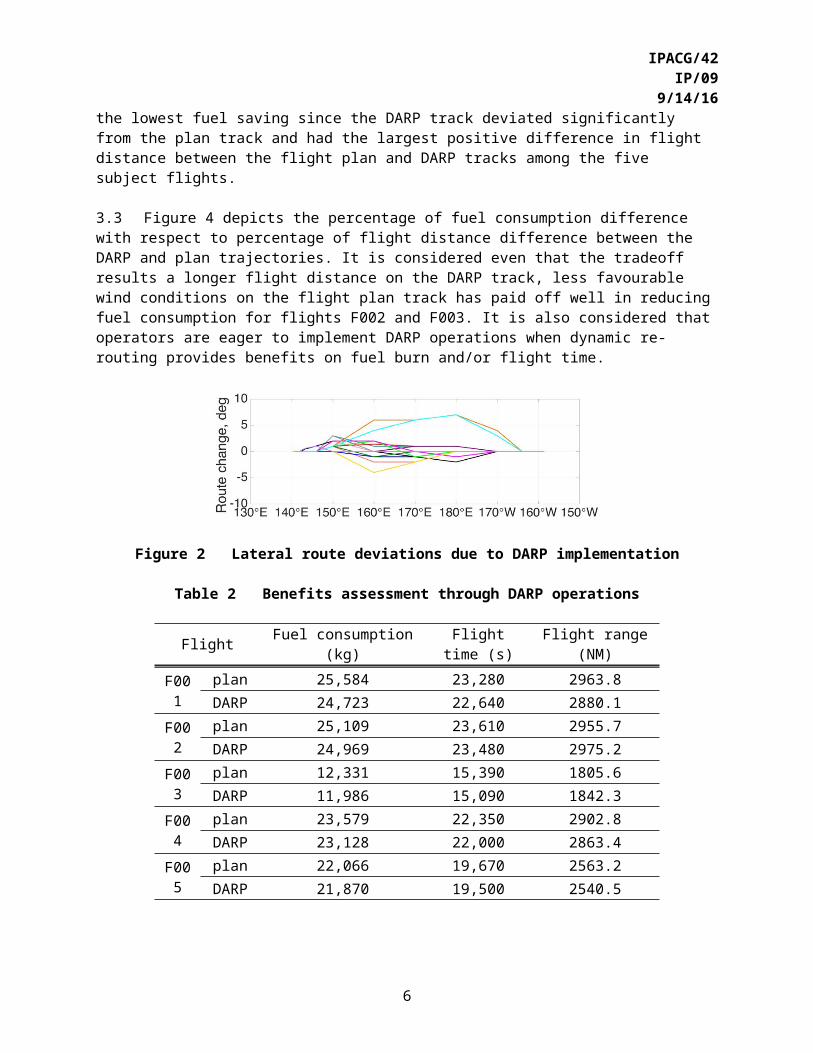
3.1 Figure 2 shows the lateral route deviations of the DARP tracks for all the flights compared to the corresponding plan tracks. Deviations are plotted with respect to longitude. Most of the DARP operations are initiated at about 180E except for two flights which record the largest deviation of 7 degrees.
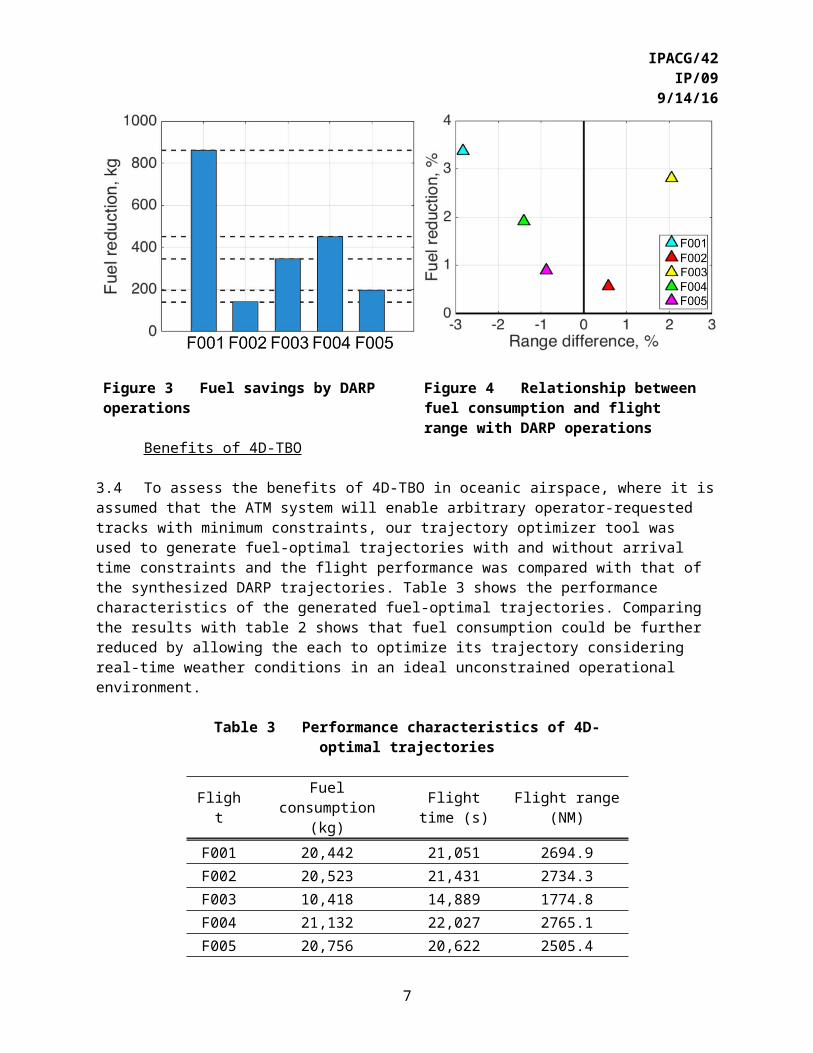
3.2 Table 2 shows the values of total fuel consumption, flight time and flight range for the five subject flight cases estimated from the synthesized flight plan and DARP trajectories. The results show that DARP operations reduced fuel consumption for all flights. Figure 3 shows the bar plot of the fuel saving of each flight. Flight F002 has the lowest fuel saving since the DARP track deviated significantly from the plan track and had the largest positive difference in flight distance between the flight plan and DARP tracks among the five subject flights.
3.3 Figure 4 depicts the percentage of fuel consumption difference with respect to percentage of flight distance difference between the DARP and plan trajectories. It is considered even that the tradeoff results a longer flight distance on the DARP track, less favourable wind conditions on the flight plan track has paid off well in reducing fuel consumption for flights F002 and F003. It is also considered that operators are eager to implement DARP operations when dynamic re-routing provides benefits on fuel burn and/or flight time.
Figure 2 Lateral route deviations due to DARP implementation
Table 2 Benefits assessment through DARP operations
Flight Fuel consumption (kg) Flight time (s) Flight range (NM)
F001plan 25,584 23,280 2963.8
DARP 24,723 22,640 2880.1
F002plan 25,109 23,610 2955.7
DARP 24,969 23,480 2975.2
F003plan 12,331 15,390 1805.6
DARP 11,986 15,090 1842.3
F004plan 23,579 22,350 2902.8
DARP 23,128 22,000 2863.4
F005plan 22,066 19,670 2563.2
DARP 21,870 19,500 2540.5
4

IPACG/42IP/09
9/14/16
Figure 3 Fuel savings by DARP operations Figure 4 Relationship between fuel consumption and flight range with DARP operations
Benefits of 4D-TBO
3.4 To assess the benefits of 4D-TBO in oceanic airspace, where it is assumed that the ATM system will enable arbitrary operator-requested tracks with minimum constraints, our trajectory optimizer tool was used to generate fuel-optimal trajectories with and without arrival time constraints and the flight performance was compared with that of the synthesized DARP trajectories. Table 3 shows the performance characteristics of the generated fuel-optimal trajectories. Comparing the results with table 2 shows that fuel consumption could be further reduced by allowing the each to optimize its trajectory considering real-time weather conditions in an ideal unconstrained operational environment.
Table 3 Performance characteristics of 4D- optimal trajectories
Flight Fuel consumption (kg) Flight time (s) Flight range (NM)
F001 20,442 21,051 2694.9F002 20,523 21,431 2734.3F003 10,418 14,889 1774.8F004 21,132 22,027 2765.1F005 20,756 20,622 2505.4
3.5 Figures 5 and 6 respectively show bar plots of fuel consumption difference and the percentage of fuel reduction with respect to the percentage of flight range difference compared to the DARP track performance. The greatest percentage fuel saving over the DARP track was 18% for flight F002, which also had the greatest percentage flight distance reduction of 8%. Even though these results include errors due to assumptions in the trajectory synthesis for plan tracks and DARP tracks, it can be considered that trajectory optimization was able to further reduce fuel consumption compared to the studied DARP tracks. The results also show that flight distance could be reduced for all five flights. It is thought that this flight distance reduction was the main cause of the reduced fuel consumption.
5
IPACG/42IP/09
9/14/16
Figure 5 Fuel savings of optimized trajectories with respect to DARP tracks
Figure 6 Relationship between fuel consumption and flight range for optimized trajectories with respect to DARP tracks
3.6 Figures 7 and 8 compare the vertical and lateral flight profiles of the DARP and optimal tracks for flight case F005. The results show that altitude selection has also contributed to the reduction of fuel consumption. When using the BADA model, an aircraft exerts its maximum performance when flying close to its service ceiling. Therefore, the aircraft on the optimal track climbs to its service ceiling at the start of the cruise phase. Another factor contributing to the fuel reduction is an earlier Top of Descent (ToD). From our previous studies, it is known that an aircraft which descends at a lower speed while maintaining a high lift-to-drag ratio consumes less fuel compared to a conventional step-down descent profile.
3.7 Regarding the lateral profile, Figs. 8 and 9 respectively denote the wind distributions at pressure altitudes of 250hPa (34,000 ft) and 200hPa (about 39,000 ft). Contour values show that wind is weaker at 200hPa compared at 250hPa. Hence, the optimal track tends to select the Great Circle Route (GCR) as its lateral path.
3.8 The impact of arrival time constraint in optimal trajectories was considered by applying a penalty on flight time in the optimizer algorithm. (See the performance index definition in the Appendix.) As the exact total flight time was not available for the subject flights, fixed CI values were given to simulate two scenarios. The first was to make the aircraft to reach the final point with a shorter flight time (penalty on
Figure 7 Altitude profile comparison (F005)
6
IPACG/42IP/09
9/14/16
Figure 8 Lateral route profile comparison (200hPa, F005)
Figure 9 Lateral route profile comparison (250hPa, F005)
time = 0.5) than the corresponding fuel-optimal track, which simulates the time-prioritized conventional operational environment. The second was to make the aircraft absorb delay (penalty on time = –0.5) and extend its flight time compared to the corresponding fuel-optimal track.
3.9 Tables 4 and 5 provide the numerical results for these two scenarios. Figures 10 and 11 show the tradeoff between fuel consumption and flight time between optimal tracks with and without an arrival time constraint. Fuel consumption increases in both scenarios due to speed increase in early arrival scenario to shorten the flight time and flight time extension in late arrival scenario. The flight distance has not changed in both scenarios. Hence, it can be considered that arrival time constraint is treated only by adjusting the optimal track’s vertical and speed profiles. Figures 10 and 11 show that the delayed arrival time constraint has a substantial effect on the late arrival scenario as the fuel increment and time difference due to the constraint are more noticeable than in the early arrival scenario. Also, the results demonstrate that a larger CI value is required to prioritize the arrival time (as in conventional operations, it is typical to shorten the flight time over fuel consumption) shortening the flight time as is often required in conventional operations to meet a schedule) which can be considered to be less efficient in terms of performance. These obtained results demonstrate that application of 4D-TBO with arrival time management could be a potential enhancement for oceanic operations.
Table 4 Early arrival scenario (μ=0.5) Table 5 Late arrival scenario (μ=−0.5)
Flight Fuel (kg) Time (s) Range (NM) Flight Fuel (kg)
Time (s)
Range (NM)
F001μ=0 20,442 21,051 2694.9
F001μ=0 20,442 21,051 2694.9
μ=0.5 20,503 20,722 2694.9 μ=−0.5 20,742 21,910 2694.9
F002μ=0 20,523 21,431 2734.3
F002μ=0 20,523 21,431 2734.3
μ=0.5 20,576 21,052 2734.3 μ=−0.5 20,880 22,498 2734.3
F003μ=0 10,418 14,889 1774.8
F003μ=0 10,418 14,889 1774.8
μ=0.5 10,606 13,871 1774.8 μ=−0.5 10,441 15,083 1774.8
F004μ=0 21,132 22,027 2765.1
F004μ=0 21,132 22,027 2765.1
μ=0.5 21,211 21,745 2765.1 μ=−0.5 21,503 23,176 2765.1
F005μ=0 20,756 20,622 2505.4
F005μ=0 20,756 20,622 2505.4
μ=0.5 20,816 20,307 2505.4 μ=−0.5 21,069 21,465 2505.4
7

IPACG/42IP/09
9/14/16
Figure 10 Performance comparison of arrival time constraints (fuel increment)
Figure 11 Performance comparison of arrival time constraints (flight time difference)
4. Conclusion
A study was conducted to quantify the benefits of DARP from an operational perspective and to investigate the potential benefits of further enhancing DARP to 4D-TBO in oceanic operations. A series of DARP information provided by a Japanese operator and JCAB-provided surveillance data and flight plan data were used to compare the fuel consumptions between trajectories based on flight plan routes and DARP operations. Results show that dynamic re-routing according to weather conditions can provide fuel saving benefits to operators. It is considered that although the fuel savings from each individual flight might not be so great, the cumulative saving from DARP could bring significant benefits to operators.
A trajectory optimizer was used to exert the aircraft’s maximum performance in an ideal unconstrained operational environment and the impact of imposing flight time constraints for operational purposes was evaluated. The results showed that 4D-TBO applications in oceanic operations could bring significant fuel savings compared to DARP and that 4D-TBO with an arrival time management capability could be a potential enhancement for oceanic operations.
In this study, detailed analyses were based only on five flights due to the limited availability of data, and the scope of this study has to be broadened in order to obtain firmer conclusions. Further rigorous and quantitative estimations on the aircraft performance would provide more concrete conclusions on the impact of DARP in aircraft operations. This would allow more detailed comparisons between optimal and conventional performance in oceanic operations and enable us to understand the needs and challenges in meeting the future demands in the industry.
Overall, the results show that DARP has the potential to improve the performance of conventional oceanic operations and that 4D-TBO is a further potential enhancement to DARP operations that could be applied in a future ATM system.
References1. Wickramasinghe N.K., Brown M., Fukushima S., Fukuda Y., Miyazawa Y. and Harada A.: Correlation
between Flight Time and Fuel Consumption in Airliner Flight Plan with Trajectory Optimization, AIAA Guidance, Navigation and Control Conference, SCITECH2015, Florida, 2015.
2. Miyazawa Y., Matsuda H., Shigetomi S., Harada A., Kozuka T., Wickramasinghe N.K., Brown M. and Fukuda Y.: Potential Benefits of Arrival Time Assignment – Dynamic Programming Trajectory Optimization Applied to the Tokyo International Airport, 11th USA/Europe Air Traffic Management Research and Development Seminar, Lisbon, 2015.
8

IPACG/42IP/09
9/14/163. Itoh E., Wickramasinghe N.K., Hirabayashi H., Uejima K. and Fukushima S.: Analyzing Feasibility of
Continuous Descent Operation Following Fixed-Flight Path Angle from Oceanic Route to Tokyo International Airport, AIAA Modeling and Simulation Technologies Conference, SCITECH2016, San Diego, 2016.
4. All Nippon Airways: Feedback on the Advantages of Dynamic Airborne Reroute Procedures (DARP) Operation, The 41st Meeting of the Informal Pacific ATC Co-ordinating Group (IPACG/41), Kyoto, 2015.
5. The Boeing Company and Air New Zealand: Dynamic Airborne Reroute (DARP) Automation, The 40th
Meeting of the Informal Pacific ATC Co-ordinating Group (IPACG/41), Washington DC, 2014. 6. Air Transport Action Group: Case Study – Aspiring and Inspiring Change Across the Oceans,
Revolutionising Air Traffic Management – Practical steps to accelerating airspace efficiency in your region, pp.11, November 2012.
7. Bach R.E. and Paielli R.A.: A User Guide for Smoothing Air Traffic Radar Data, NASA Technical Reports, NASA/TM 216520, 2014.
8. Wickramasinghe N.K., Brown M., Miyamoto M. and Miyazawa Y.: Effects of Aircraft Mass and Weather Data Errors on Trajectory Optimization and Benefits Estimation, AIAA Modeling and Simulation Technologies Conference, SCITECH2016, San Diego, 2016.
Appendix – Trajectory Optimization
A1. Point mass approximations are considered to address an aircraft’s 3D translational motion as defined by Eqs. (1) – (4) in an Earth-Centered Earth-Fixed coordinate system.
dθdt
= 1( R0+H ) cos ϕ (V TAS cos γa sin ψa+W x ) (1)
dϕdt
= 1( R0+H )
(V TAS cosγ acos ψa+W y ) (2)
dHdt
=V TAS sin γa (3)
md V k
dtcos ( γ a−γ ) cos (ψa−ψ )=T−D−mg sin γ a (4)
ϕ : Latitude g : Gravitational forceθ : Longitude m : Aircraft massH : Altitude V k : Inertial speed
V TAS : True airspeed T : Engine thrustγ : Path angle D : Aerodynamic dragψ : Azimuth angle SubscriptsR0 : Earth radius a : Respect to air flowt : Time x : Zonal component
W : Wind y : Meridional component
9

IPACG/42IP/09
9/14/16A2. Application of the DP algorithm uses four state variables, namely the aircraft’s 3D position (longitude, latitude and altitude) and speed, and three control variables, namely flight path angle, azimuth angle and engine thrust. A combinatorial optimization process is applied in a discretized state-space grid, by defining downrange as the independent variable with altitude, speed and cross-range as state variables and the optimal solution is derived among all the state transitions. In the optimizer, the performance index is defined by considering the minimum cost with a trade-off between fuel consumption and flight time. The optimization cost function is defined in Eq. (5) and the concept of Cost Index (CI) is taken into account in defining the cost function as shown in Eqs. (6) and (7).
Jopt (Hhk+1,V ik +1
, η jk +1, ξk+1 )= min
hk →hk+1
ik →ik+1
jk → jk+1
[ Hhk,V ik
, η jk, ξk+ FF|ξ k
ξ k+1 ∆ t ](5)
min J=∫t0
tf
C fuel ∙ FF ( t ) dt+¿∫t 0
t f
C timedt ¿ (6)
minJ=μ (t f −t 0 )+∫t0
t f
FF (t ) dt (CI=C time
C fuel=79.37 μ) (7)
ξ : Downrange angle η : Cross-range angleV : Calibrated airspeed μ : Weighting parameterFF : Fuel flow J : Performance index
C time : Time cost C fuel : Fuel costSubscripts
h , i , j : Arbitrary waypoints along state variable axesk : kth segment along independent variable axis0 : Initial f : Final
opt : Optimal
A3. A weighting parameter μ enables various settings of the optimizer to generate trajectories optimized only for fuel or trajectories optimized for fuel with flight time constraints. This capability is used to evaluate the feasibility of enhancing the 4D-TBO scope towards oceanic operations.
10