Improving Interaction with Large Medical Image … · A cada una de las personas de Cim@lab, ......
63
Improving Interaction with Large Medical Image Collections Lina Mar´ ıa Guzm´ an Medina Universidad Nacional de Colombia Department of Diagnostic Images, School of Medicine Bogot´ a, Colombia 2016
Transcript of Improving Interaction with Large Medical Image … · A cada una de las personas de Cim@lab, ......

Improving Interaction with LargeMedical Image Collections
Lina Marıa Guzman Medina
Universidad Nacional de Colombia
Department of Diagnostic Images, School of Medicine
Bogota, Colombia
2016


Improving Interaction with LargeMedical Image Collections
Lina Marıa Guzman Medina
Tesis o trabajo de grado presentado como requisito parcial para optar al tıtulo de:
Magıster en Ingenierıa Biomedica
Director(a):
Ph.D. MSc. MD. Eduardo Romero Castro
Lınea de Investigacion:
Efficient Interaction with Large Volumes of Data
Grupo de Investigacion:
Cim@Lab
Universidad Nacional de Colombia
Department of Diagnostic Images, School of Medicine
Bogota,Colombia
2016


“Mire hacia otro lado, y vi que en esta vida hay
algo mas que no tiene sentido. Me refiero al hom-
bre solitario, que no tiene hijos ni hermanos: to-
do el tiempo se lo pasa trabajando, y nunca esta
satisfecho; siempre quiere tener mas. Ese hom-
bre jamas se pone a pensar si vale la pena tanto
trabajar y nunca gozar de la vida. !No tiene sen-
tido esforzarse tanto! La verdad” - Salomon -

Agradecimientos
Dedico este trabajo a la memoria de papa y a la vida de mama.
Agradezco a mi padre citando sus palabras y esperando cumplirlas: “Persevera en el estudio,
es tu objetivo. Pon todo el interes posible, que contando con el talento que se te ha otorgado
y el apoyo de tus queridos familiares se obtendra el exito que todos deseamos. En consecuen-
cia, la formula es: Paciencia en el logro de resultados, insistir en ello y dar al final las gracias
de rigor”. A su disciplina, exigencias, integridad y ejemplo de excelencia, gracias. A mama
por sus lecciones de amor y orden, por retarme a pensar mas alto y lejano que el resto de
personas. Por llevarme a no considerar el camino comodo sino el de grandeza. A su firmeza,
creatividad, inteligencia y ejemplo de mujer, gracias. A los dos por apoyarme en todos mis
planes, retos y suenos, que aunque fueran imposibles ante la vision humana, los hicieron
posibles con sus sacrificios y esfuerzos. Por su sinceridad y contribucion en la construccion
de un caracter firme. Por permitirme disfrutar de un hogar ejemplar, aun mayores gracias.
A mi familia, que es lo maximo ! Siempre fueron positivos, me respaldaron y creyeron en
mı. Aportaron a este trabajo todos los recursos de los que disponian, a todos y cada uno de
ustedes gracias. A Josue, un ejemplo de amor, paciencia y perseverancia, que muchos dıas
me acompano con palabras y acciones de motivacion, eficiencia y trabajo. Sus ideas fueron
de inmensa valıa en los retos que surgieron en el camino, a ti, gracias. A mis amigos de
infancia de Popayan y a los companeros en la lucha de mis convicciones, que me alentaron,
fueron solidarios aceptando que muchas veces no tuviera tiempo para compartir, amorosos
con sus crıticas para llegar a la grandeza y dadores de sonrisas, gracias.
A cada una de las personas de Cim@lab, en cabeza del Profe Romero, quien fue generoso en
sus ensenanzas; a traves de la discusion ayudo a edificar algunos paradigmas que hacen parte
de mis mas profundas convicciones, gracias. A la profe Marcela que me animo a conocer de
la investigacion y a hacer la diferencia, gracias. a German que aparto muchas horas de su
tiempo para explicarme, corregirme y respaldarme, gracias.
La gloria y exito no son mios, son de uno mayor que yo y todos ustedes.

vii
Resumen
Los sistemas de archivado y transmision de imagenes (PACSs) se han constituido en la
base del flujo de trabajo diario para radiologos a nivel mundial. La interaccion con imagenes
medicas en dichos sistemas son un importante campo de investigacion, debido a los intere-
ses de la academia y la industria en mejorar la experiencia del usuario. Reduciendo costos,
la brecha entre medicos e ingenieros, ademas de aumentar la visibilizacion de las grandes
cantidades de datos. Actualmente los visores de PACS solo permiten el acceso a casos por
numero de identificacion, sexo o nombre del paciente, o bien, etiquetas de las imagenes como
modalidad o fecha de captura. Esto ha desenlazado en un amplio rango de capas de la inter-
accion por mejorar como: mecanismos de busqueda, estrategias de clasificacion, recuperacion
y visualizacion.
La contribucion de esta tesis es un marco de trabajo para mejorar la interacion con gran-
des colecciones de imagenes radiologicas, integrando en un solo entorno diversas estrategias
computacionales como las mencionadas previamente. Comenzando por la caracterizacion
de imagenes de resonancia magnetica de cerebro, seno y columna vertebral; empleando di-
ferentes propiedades de la imagen como: textura, intensidad y forma. Posteriormente, un
mecanismo de clasificacion identifica de manera automatica el organo al cual pertenece la
imagen. Una estrategia de recuperacion basada en contenido es empleada para determinar
la distancia entre los casos y finalmente graficarlos en un resumen visual. Empleando este
resumen o buscando un caso especıfico el usuario puede estudiar en detalle cada uno de los
volumenes en el repositorio.
Se desarrollo una plataforma web que integra cada una de las estrategias anteriormente
enunciadas. Adicionalmente se sugiere al usuario casos relacionados con aquellos analizados
previamente, empleando un mecanismo de recomendacion de contenido basado en la estra-
tegia de recuperacion y alimentada por la interaccion de los usuarios. El marco de trabajo
presenta resultados de clasificacion con una exactitud de 92 %, recuperacion con la media de
precision promedio por encima de 0.9 y una aplicacion prototipo funcional web que integra
todas las estrategias para que estudiantes, medicos generales o especialistas puedan interac-
tuar de una manera alternativa con los repositorios de imagenes radiologicas.
Palabras Clave: Sistemas de archivado y comunicacion de imagenes, Informatica Me-
dica, Acceso a Informacion, Interfaz Usuario-computador, Diseno de Software, Alma-
cenamiento y Recuperacion de Informacion, Conocimiento.

viii
Abstract
Picture Archiving and Communication Systems (PACSs) have become into the basis of
the daily workflow for radiologists worldwide. The interaction with medical images in such
systems is an important research field, due to the interests of academy and industry on
improving user experience. Reducing costs, the gap between physicians and engineers, in
addition to increasing large amounts of data visualization. Nowadays, using a PACS viewer
a radiologist access to cases only by patient identification number, sex, name, or image labels
as modality or capture date. As a consequence, a wide range of interaction layers might be
improved: search mechanism, classification, retrieval and finally visualization strategies.
The main contribution of this thesis is a framework to improve the interaction with large
radiological image collections, integrating in a single environment diverse computational
strategies. Starting with the characterization of brain, breast and spine magnetic resonance
images. Using different image properties like: texture, intensity and shape. Subsequently,
a classification mechanism is used to automatically identify the organ to which the image
belongs to. A content-based image retrieval strategy is used to compute the distance among
cases, later these are used to graph a visual resume of the available volumes in the database.
Using this visual summary or searching for an specific case, the user may study on detail
each volume in the repository.
It was developed a web-based system to integrate each strategy previously mentioned. Ad-
ditionally it is suggested to the user cases related to the ones already analyzed, using a
content recommendation mechanism based in the retrieval strategy and complemented by
the users interaction. The framework presents classification results with an accuracy of 92 %,
content-based image retrieval results with mean average precision above 0.9 and a functional
application prototype that integrates all strategies. So that students, general practitioners
or specialists can better interact with the information of a radiological images repository.
Keywords:Picture Archiving and Communication Systems, Medical Informatics, Ac-
cess to information, User-Computer Interface, Software Design, Data Collection, In-
formation Storage and Retrieval,Knowledge.

Contents
Agradecimientos VI
Resumen VII
1 Introduction 2
1.1 Radiology Training and Clinical Challenges . . . . . . . . . . . . . . . . . . . 2
1.1.1 Clinics . . . . . . . . . . . . . . . . . . . . . . . . . . . . . . . . . . . 3
1.1.2 Training . . . . . . . . . . . . . . . . . . . . . . . . . . . . . . . . . . 3
1.1.3 Radiology Systems Scenario . . . . . . . . . . . . . . . . . . . . . . . 4
1.1.4 Proposed Approach . . . . . . . . . . . . . . . . . . . . . . . . . . . . 5
1.2 PACS Benchmark . . . . . . . . . . . . . . . . . . . . . . . . . . . . . . . . . 6
1.2.1 PACS . . . . . . . . . . . . . . . . . . . . . . . . . . . . . . . . . . . 7
1.2.2 Network Connection . . . . . . . . . . . . . . . . . . . . . . . . . . . 9
1.2.3 PACSv . . . . . . . . . . . . . . . . . . . . . . . . . . . . . . . . . . . 10
1.2.4 Discussion and Perspectives . . . . . . . . . . . . . . . . . . . . . . . 15
1.3 Computing PACS strategies . . . . . . . . . . . . . . . . . . . . . . . . . . . 16
1.3.1 Classification . . . . . . . . . . . . . . . . . . . . . . . . . . . . . . . 16
1.3.2 Content Based Image Retrieval (CBIR) . . . . . . . . . . . . . . . . . 17
1.3.3 Visualization . . . . . . . . . . . . . . . . . . . . . . . . . . . . . . . 18
1.4 Our Proposal . . . . . . . . . . . . . . . . . . . . . . . . . . . . . . . . . . . 19
1.4.1 User Analysis . . . . . . . . . . . . . . . . . . . . . . . . . . . . . . . 19
2 Characterization 22
2.1 Dataset . . . . . . . . . . . . . . . . . . . . . . . . . . . . . . . . . . . . . . 22
2.2 Feature Extraction . . . . . . . . . . . . . . . . . . . . . . . . . . . . . . . . 23
2.2.1 Pre-Processing . . . . . . . . . . . . . . . . . . . . . . . . . . . . . . 23
2.2.2 Feature extraction . . . . . . . . . . . . . . . . . . . . . . . . . . . . 23
2.3 Classification Strategy . . . . . . . . . . . . . . . . . . . . . . . . . . . . . . 25
2.3.1 Evaluation and Results . . . . . . . . . . . . . . . . . . . . . . . . . . 27
2.3.2 Discussion . . . . . . . . . . . . . . . . . . . . . . . . . . . . . . . . . 29
3 Interaction Model 30
3.1 Retrieval . . . . . . . . . . . . . . . . . . . . . . . . . . . . . . . . . . . . . . 30
3.1.1 Similarity Metric . . . . . . . . . . . . . . . . . . . . . . . . . . . . . 30

Contents 1
3.1.2 Evaluation . . . . . . . . . . . . . . . . . . . . . . . . . . . . . . . . . 30
3.1.3 Results and Discussion . . . . . . . . . . . . . . . . . . . . . . . . . . 32
3.2 Recommendation Module . . . . . . . . . . . . . . . . . . . . . . . . . . . . 34
3.2.1 Recommendation Strategy . . . . . . . . . . . . . . . . . . . . . . . . 34
3.3 The Visualization Approach . . . . . . . . . . . . . . . . . . . . . . . . . . . 36
3.4 Web-based Application Architecture . . . . . . . . . . . . . . . . . . . . . . 37
3.4.1 Use Case . . . . . . . . . . . . . . . . . . . . . . . . . . . . . . . . . . 37
3.5 Results . . . . . . . . . . . . . . . . . . . . . . . . . . . . . . . . . . . . . . . 38
4 Conclusions 43
5 Annexes 46
5.1 Features Distribution . . . . . . . . . . . . . . . . . . . . . . . . . . . . . . . 46
Bibliografıa 48

1 Introduction
1.1. Radiology Training and Clinical Challenges
During a particular radiology training, students, residents or graduated radiologists, must
develop observational skills that allow them to recognize particular pathologies in real cases.
This process is highly dependent on the student aptness, the number and complexity of
the examined cases during such a training. These students should develop two main skills,
they should recognize pathological patterns hidden by the superposition of different types
of tissues and correlate such information with a corpus of knowledge that supports a par-
ticular diagnosis, in other terms they must observe a lesion and interpret its meaning [54].
Both skills are not necessarily developed synchronously, but their learning can improve if
students have access to a wide variety of different cases with a different degree of complexity
[73]. In contrast, the reality in clinics may be described in different steps: image acquisition,
analysis and diagnosis. First, a radiology technician operates a digital machine that captures
the image. Data associated with the patient personal and medical information and captu-
ring parameters are automatically stored as metadata following the Digital Imaging and
Communication in Medicine (DICOM) specifications. Nonetheless, most of this information
is practically useless in the radiology workflow (graphic 1-1), this is reduced to the time
devoted to analyze.
Figure 1-1: Radiologist Work Flow
Using a PACS viewer (PACSv) a radiologist will access to patient images. The user will find
information using a graphic interface and different filter options. In most current medical
imaging systems, content access and retrieval are achieved by using the image associated text,
i.e., images are annotated with keywords or descriptive text which is organized by topic or
semantic hierarchies. When an user might want to access specific content, he/she inputs
keywords that are compared to the text in the DICOM header and results are retrieved

1.1 Radiology Training and Clinical Challenges 3
using any similarity criterion [11]. Some of these annotations are automatically set by the
imaging system while others are manually added by technicians or physicians during image
capture and routine documentation processes [22].
1.1.1. Clinics
Essentially, radiographs were stored in customized spaces demanding conditions that preven-
ted any physical damage to these examinations [64]. The step from analog to digital x-ray
took about a century and modified completely the necessity of a dedicated room for storing
the radiographs. Nowadays, the use of technology is transversal to any health institution and
the large quantity of daily produced images may be digitally stored [83]. Usually, these cases
are stored in large repositories known as PACS, for Picture Archiving and Communication
Systems [74, 22].
Since 1896, radiology has experienced several changes and many different techniques have
appeared and incorporated to the clinic practice. PACS has become a set of tools designed for
receiving, storing and distributing medical images using applications or web technologies in
a computer network [14]. Nevertheless, current PACS are very limited in terms of interaction
capabilities. Most of these systems barely recover particular cases when Doctors explicitly
ask for them and explicitly list the whole database. This statement implies in practice that
physicians require different interaction scenarios with the stored cases. The actual possibility
of archiving large quantities of cases makes that only relevant cases should be prioritized,
understanding that relevancy is different among users. Like in other medical specializations,
in radiology there is a high diagnosis variability due to the uncontrollable differences of the
human body and patient groups. In clinical scenarios, MD do not follow the same path or
make the same analysis, even if they come to the same diagnosis.
1.1.2. Training
Traditional education in radiology has been historically dependent on classic books and
medical dictionaries. Some drawbacks with this kind of material are (i) the limited number
of cases, which also gets quickly out of date, and (ii) the limited interaction since they have
no information about experts preferences. Yet several training systems and applications has
been proposed, these education material have been complemented with computer systems
and visualization applications, yet these proposals are still limited in content and interaction
level. Generally this options uses text quizzes, sometimes with image cases examples and few
of them with feedback[72, 63].
Besides the potential of this computerized education softwares, they are still limited in the
number of cases to explore, database updating and data interaction. Moreover the barriers in
user-friendly interfaces and system architecture. Authors suggest the practice with a system
for viewing radiographs during their education looking to archive competence in radiographic

4 1 Introduction
interpretation [73]. Strengthen the idea that if undergraduate students get familiarized with
modern radiology might increase the later motivation to entry into radiology specialization
[73].
Overall, there is an unclear relationship between the clinical skills developed by a specialist
during training and the set of events that academically transform a naive student into an
actual Doctor [78]. This relationship has been approached during the last decade by introdu-
cing new concepts such as the evidence based medicine since now physicians are demanded
to support their decisions. There is a general need of quantification strategies that guide
the learning process and enrich the medical act with objective evidence. Such teaching or
learning activities are being systematically integrated with the clinic practice, aided by the
modern technologies that facilitates the processing of large amounts of stored information.
Radiology, in particular, is a medical specialty that might take advantage of the huge number
of cases stored in dedicated repositories or PACS. Summed to other motivation which is the
growing economic interest. For instance, in USA they are spending on diagnostic imaging
in faster pace than any other health care services[3]. Then, academy and enterprises are
enthusiast around the development of medical information software.
1.1.3. Radiology Systems Scenario
Every day, a large quantity of medical images is being produced in hospitals and medical
centers for diagnosis and therapy purposes [58]. A problem with such quantity of data is how
to appropriately access, process and manage the information stored in such huge repositories
[74] [22]. The large quantity of radiology images daily produced in hospitals and medical
centers are being used just for diagnosis and therapy purposes [83]. Systems of different
diagnostic imaging centers, hospitals and other research or training centers dissent in many
interaction tools that PACS nowadays brings to the final-user in terms of big data mining[75].
In addition, the possibility of finding relevant content from large repositories is becoming
increasingly important, especially because of the necessity of making evidence-based medicine
[11]. The different difficulties and limitations aforementioned end up by constituting the
actual interaction and usability bottleneck.
In this scenario, radiologists end up by being overwhelmed with the number of cases they
have access to. Usually they limit themselves to analyze a few number of images with their
respective diagnoses. These professionals are still unaware of the possibility of exploiting the
knowledge from data stored in these repositories. Such quantity of data constitute the ideal
scenario for training and continuously educating by improving the interaction experience.
An optimal training scheme requires a fusion of both spaces, the education strategies and
daily clinic, a challenging task that should reduce the different economic and missionary
purposes. Computer-aided diagnosis might be crucial for radiology training and PACS could
be included in the medical culture from the very beginning. Medical Schools are looking
for PACS and PACS viewers that can be easily adapted to their training requirements [23].
1.1 Radiology Training and Clinical Challenges 5
Preliminary good results have been reported by similar proposals in UCLA and Harvard
Universities [46].
Furthermore, physicians are not taking advantage of these collections of images to design
learning strategies, or to include new methodologies of training, neither use such knowledge
to improve the quality of the diagnosis. As databases grows up, the traditional keyword
based methods become inefficient and limited since this is fully operator dependent and
therefore expensive, time-consuming and highly prone to errors [77, 11]. Also, there is a
high annotation variability due to the inherent human subjectivity [52, 80]. Finally, these
keywords or controlled vocabulary increases linguistic barriers to share image data worldwide
[79]. Although medical specialists express an interest in alternative tools to access these
medical images collections. Current solutions in the market do not address their needs and
basically the number of radiological images has exceed by far the analysis capacity of any
radiology service. This will be archive just using data mining techniques, to discover the
valuable information under explicit information.
1.1.4. Proposed Approach
Based on the user preferences described in the section 1.4.1. It was designed, implemented
and validated a complete framework to fuse radiology image classification, retrieval, recom-
mendation and visualization strategies. First, data was manually labeled according to the
body organ it belong to. Per case, it was selected the middle slice of the axial series as repre-
senting each volume. A characterization and interaction model is applied to these slices, as
it is shown in graphic 1-2. Then, it was determined different shape characteristics, like the
foreground Region of Interest (ROI), the foreground intensity histogram and the foreground
convex hull. Using the different characteristics it is extracted a set of features to reduce the
space size. With this information it is performed a classification and retrieval strategy to or-
ganize data and access to further knowledge. The classification module used a random forest
classifier, once it was done, clustered information was presented in a visual summary. The
retrieval module used a similarity metric to recover related cases to the one user is looking at.
This was complemented with a recommendation strategy to improve the interaction of the
final-user with the database. The complete framework is integrated in one web application,
which contains a visualization module that summarize the available cases in the repository
and allows to the final user observe the general dataset, the connection among cases and
singular case observation. The proposed architecture includes a simple user interface that
allows users to interact with radiology studies in the classic way and to explore with our
proposal of a new interaction framework. Although the application is a prototype, it offers
the possibility of working with different images and is flexible to develop more specialized
systems.
The main aim of this thesis work is to design strategies of image visualization in large
medical databases that facilitate the exploitation of the existent knowledge. The visualization

6 1 Introduction
Figure 1-2: Proposed Methodology
module is connected with a complete framework to enhance the interaction of the final-user.
This project archived the proposed goals to develop a strategy that clusters and retrieves
the images in a radiology dataset. It was designed an approach that organize information
inherit from the knowledge annotated in the metadata, by using body organ data. The PACS
benchmark fused to the user analysis gives a set of good parameters to propose this work.
Then, the investigation of market, state of the art and user interests were the starting point
of each module herein proposed.
1.2. PACS Benchmark
This time might be known as the golden age of biomedical systems which are provided with
a considerable set of supportive tools that improve the daily workflow. Users on the other
hand are more and more demanding of new technology that facilitates such workflow in
different aspects. Before, few options to interact with radiology images were available in the
market. Nowadays, the range of options has considerably increased either for research or
clinical context. Development of attractive tools for PACS or PACSvs are currently a matter
of interest.
In the battle of the competitive edge, it is presented an analysis of components that influence
in the construction of a complete radiology computer-aided ecosystem, based on the general
architecture described in the graphic 1-3. In this case, PACS and PACSv might be analyzed
since the two principal perspectives: academic and commercial. PACSs state of the art was
reviewed and different software were tested. The more reports the industry has about medical
interests, summed up to PACS production. The more useful final products will bring to health
community. In this benchmark were selected the components that affects PACS and PACSv
acquisition or use. Each described factor was selected according to the main features the
industry has and literature reports mentions as influencer in final user experience.

1.2 PACS Benchmark 7
Figure 1-3: PACS environment
1.2.1. PACS
PACS Scenarios
PACSs have been used with different purposes and in several scenarios, the most known are
diagnosis, surgery, research and medical training. Independently of the particular application,
it should exist interaction mechanisms that match the appropriate final user expectations.
The facility of having digital clinical records have increased the interest of medical doctors
in digital image systems or PACS. Depending on the context of use, PACS may be converted
into an image viewer, a surgical support tool or a teaching mechanism.
One popular PACS is CARESTREAM Vue [13], that facilitates some tools to track lesions in
oncology task. Nonetheless, this is still a proposal that can be used just for diagnosis. Other
PACS have been adapted to specific medical specializations or interventions like orthopedic
surgery, neurosurgery, neurology, emergency room, surgical intensive care [15] and minimally
invasive surgery or computer assisted surgery (CAS)[50]. Being this medical scenario the most
specialized in terms of the application.
In medical doctors education or particular radiology specialization there is a rising interest for
including PACS in the medical culture from the very beginning. Medical schools are looking
for PACS that could be easily adapted to their training requirements [23]. Good results have
been shown in UCLA and Harvard Universities [46]. However, in spite of the known benefits
for medical education support, teachers are still reluctant to use these systems because they
have been formed in the classical learning paradigm and most of them are not aware of the
modern technological possibilities. Classroom atmosphere does not report major changes by
the continuous control of teachers and the information exchange of students [78].
On the academic perspective there are different projects, for example, the Harvard Medical
School has strongly invested in computing infrastructures for internal computing cloud to
enable collaborative research, and the UCLA Department of Radiological Sciences that has
developed a large-scale clinical PACS. Their contribution is centered in multi-viewer sections
of all modalities and availability of images to all specialists [46]. As a research scenario, the
computing community is working on two problems, the first related to the management of
large quantities of data and the second associated with reducing the medical and engineering

8 1 Introduction
gap [27, 60].
In particular, the participation of the final user in the process of software design and imple-
mentation is reduced. Owing to this factor that interaction strategies failed in most of cases
with the specialist expectations. The gap between users and engineers has been a problem
since the very beginning. The difference between the imagination of the engineer about what
the user needs and what he/she really needs or wants, set one of the greatest challenges for
innovation in general systems development. Specially in PACS where the specialist workflow
is highly influenced by the software performance. Hospitals and diagnostic centers are ex-
pecting systems that reduce time and improve the effectiveness of the specialist workflow.
Because of the high demand of patients and the long time that a medical expert takes to
study a particular case [51].
Economic Factor
Implementation of PACSs is highly conditioned by the economic factor [15, 3], owing to
the high costs of acquisition, deployment and maintenance. In USA, radiology trainees were
asked about the estimation of their work in the health system, 65.3 % overestimate these cost;
Reveling a distance between the collective imagination and real system costs [3]. According
to TechTarget, global PACS market will grow to $5.4 billion by 2017, up from $2.8 billion in
2012 1. Then, the gap between physicians economic perception and reality is still quit long.
Considering different types of licensing the average PACS cost is 70.000 US dollar, plus
maintenance and updating. Nonetheless, in the market free and pay commercial options are
available, institutions must assess which options are more suitable for their needs according to
the budget, country laws, medical jurisdiction, cultural aspects and user requirements [6, 71].
Any of the selections might guarantee high image quality [78], security of diagnostic cases
and associated reports [6]. Neither pay or free options guarantee the connection with other
systems like Radiology Information System (RIS) and Hospital Information System(HIS).
Free software implementations have been developed by different enterprises and universities
with diverse tools and coverage. For instance, Osirix [66] is a highly used freeware program
to study radiology cases. It supports different images and video formats, storage in a efficient
way [1]. Other open source options are K-PACS [42], a simple application developed in the
Humaine Vogtland-Klinikum Plauen Hospital in Germany, and MicroDicom which supports
primary operations. One of the major challenges with the PACS licensing is to improve the
quality price relation. Certainly, research and implementation costs are incredibly high, but
the impact that it may have is very relevant for public and private sectors.

1.2 PACS Benchmark 9
Figure 1-4: Weasis Web-3, a web-based application to manage a DCM4CHEE Server.
1.2.2. Network Connection
PACSs are conditioned by the type of connection they use with the capture machine, PACSv
and/or other systems. The quality of the network is influence by the high traffic management,
information retrieval and image visualization. Wired-line connection refers to a way of getting
data from point to point using centralized network architectures. Some PACSs, for instance
SYNAPSE[28], use LAN or intranet services for information exchange. The problem with
this kind of connection is the number of retrieval and storage operations that may easily
turn into exponential, becoming into a data bottleneck [14]. These restrictions have made
wired-line PACS play a limited role in medical education and decision support [31].
The importance of a universal access to the information from anywhere, anytime is almost a
most feature nowadays. The massive production of mobile devices has increase the interest in
ubiquity, furthermore the fact that internet connections contribute to content distribution.
PACSs using web for data exchange are known as WEB-PACS, some examples of them are
IQ-WEBX [37] and NovaPACS [18]. Web PACSs allow teachers to perform best practices be-
cause of the control they have on the laboratory computers and the facilities for information
1Source: http://searchhealthit.techtarget.com/definition/picture-archiving-and-communication-system-
PACS

10 1 Introduction
exchange [78], however, Web PACS has several challenges related to the multiple browser
and versions adaptation. The most used web PACS is Dcm4chee, it is free, open source and
several PACSvs can be easily connected to it 1-4[20]. Other Web PACS is Oviyam, a project
looking forward to a full HTML5 architecture [38], with an open source Web-PACS proposal,
extending the access to digital imaging and research. Even though web PACS have several
advantages, there are new challenges at extending the server to built, host and deliver from a
cloud computing platform. Likewise, PACSs could also solve problems regarding resizing and
the maintenance of datacenter, as well as data reliability, interoperability and performance
[71].
Final user interaction is affected by the type of connection and its quality. This is reflected
in the content-retrieval speed, the information and images visualization and server request
time to respond. While it is possible to think in the connectivity as a non-relevant factor,
the time image retrieval and visualization is strongly related with the type of server and
network connection, furthermore, the response time that is highly important for specialists.
1.2.3. PACSv
PACS Ubiquity
Manufacturers and educative institutions are improving hardware devices, due to the high co-
rrelation between workstations performance and specialist workflow [41]. Nevertheless, most
of the PACS are evaluated according to functionality aspects or subjective perspectives [57].
One of the greatest motivations to develop different workstations or applications for PACS
and PACSv is the slow evolution of these. Performance, interfaces and automatically deploy-
ment for mobile devices are not changing with the same velocity than other technologies.
Yet, PACS and PACSv have been adapting to mobile technology. As a result a group of
modification and challenges in the classical interaction mechanism has emerge.
Some enterprises have penetrated the PACSv industry presenting approaches as Osirix HD
for iPad [1], Centricity Radiology Mobile Access of GE Healthcare, CARESTREAM Vue
Motion from Carestream industry and iPaxera [61] for iPad from Paxeramed corporation.
There are different opportunities and offers in the market, owing to the user needs of using
PACS in cellphones and tablets, companies are interested in the automatic adaptation of
PACS from PCs to other devices. The Royal Melbourne Hospital (RMH) uses the application
for economize, share by emailed, save and annotate studies improving the work experience
of medical doctors interacting with patients information, with successful results, the RMH
Imaging service divided into Radiology and Nuclear Medicine services, performed annually
over thousands of inpatient and outpatient diagnostic and therapeutic procedures [67].
Even though the outstanding benefits of mobile PACS there are several challenges related
with patients data retrieval, visualization of large size images, gestures and interaction stra-
tegies in order to improve the user experience. Hardware restrictions most be considered for
software development. The tables 1-1 and 1-2 describe some PACSv and training applications

1.2 PACS Benchmark 11
available for mobile devices.
APP Developer YearUser
QsNo Qs Comments
ACR-Radiology
Assessment &
Review
American
College of
Radiology
2014 4,5 2
Sub-specialization selection,
single slide view, it gives the
score of attempts and in the
end there are the results
per user.
Radiology
Musculoskeletal
StatPearls
Publishing,
LLC
2016 3 1
Text-Questionnaire with
percentage of right or
wrong results
Radiology Tech
CertificationSageMilk 2012 3,5 24
Text-Questionnaire with
percentage of right or wrong
results, dictionary,
graphic examples.
FRCR Physics
for RadiologyRadiology UK 2015 5 7 Text-Questionnaire
DRC MphRx 2013 3,3 6
Check case of a patient,
using the dicom headers,
one series slides
Qevlar
Radiology
Qevlar
Radiology
SAS
2016 3,2 4Text-Questionnaire,
some with images
Radiology
Flashcards:
Body 3
Panorad 2014 2,5 210 possible cases with
right or wrong questions
Table 1-1: Radiology Applications benchmark. Qs: Qualifications.
Since 2011 different application proposals have emerged, nevertheless 30 % of these options
still have not images. This is a major challenge because in radiology training this is a core
fact. The qualification among all is almost 4 points of 5, but most of the commentaries are
in agreement about the need of more innovative proposals.

12 1 Introduction
APP DEVELOPER YEARUSER
Qs
No
QsCOMMENT
St Josephs MphRx 2015 4 1PACS filters,
series view
Doshi Diag MphRx 2016 3,5 6PACS filters, series view,
report attach to report
MphRx MphRx 2015 5 3PACS filters, series view,
measures on the image
mRay -
DICOM Viewer
mbits
imaging
GmbH
2016 3,8 87
PACS filters,
series view, measures
on the image
RADIANT:
Share
Radiology
Cases
panorad 2015 3,4 50
PACS viewer with filters,
series view, measures on the
image
Radiological
Anatomy For
FRCR1
RadRevison 2014 4,8 11
500 images, 1 structure
labeled per image,
the answer button reveals
the answer and an explanation
where appropriate.
Virtual
RadiographerRRC 2011 4 25 Bone structure examples
Centricity Rad
Mobile Access
GE Healthcare
IITS2013 4,1 27
PACS filters,
series view,
measures in the image
Atlas de
Anatomıa
Radiologica
SKADI
DISE2016 4,3 40
Atlas of the thorax,abdomen,
brain,vascular and nervous
system. In several modalities
Table 1-2: Radiology Applications benchmark. Qs: Qualifications.
Interfaces
A PACSv Graphical User Interface (GUI) is the visual presentation of information, connec-
ting the user with lower layers of the system [55]. These layers are interaction mechanisms,
image enhancement tools, customization options, hierarchy of icons and other system featu-
res. For medical doctors, students or radiologist PACSv-GUI is strongly related with a logo
brand or product signature.
The GUI is the part of the software that presents the information to the final user. Particu-
larly in PACSv this is a draft area, as previous have been mentioned. Final user associate

1.2 PACS Benchmark 13
PACSv-GUI with the velocity of connection, retrieval and classification results. All of this
because currently PACSv-GUI offers a vast list of available studies and, in the best cases,
it is possible to be reduced using different types of filters. These are mainly based on pa-
tients information as patient ID or name, the anatomical structure, date and image capture
modality. Innovation in this sense is limited because the fast and continuous information
increment, make of the list data presentation an inefficient and boring data visualization
method for the user. After the long list of cases is introduced, sometimes even across pa-
ges, the user can select an specific case to review. When the user is employing a mobile
applications, PACSv displays PACS data in a reduced visualization window with restricted
interaction mechanisms respect to desktop screens. Then, interacting with large repositories
becomes almost impossible and deeply inefficient [41].
Figure 1-5: Oviyam Web Browser Screenshot . Results after a search process.On the left side
is an example of a regular PACS GUI. On the right side, the typical visualization
of a case in Web PACS
Osirix [66] is one of the most popular and robust open source systems in the market with
an offer of intuitive, customizable GUI, key images, scroll-wheel mouse and Magic Trackpad
supported [66]. Nonetheless, it displays a long list of all series available according to a reques-
ted query, hindering the expert interaction with the database and reducing the opportunities
to exploit implicit knowledge. The mobile version, Osirix HD, sends the entire DICOM series
to a DICOM node, allowing to display images with dimensions smaller than 1536 × 1536
pixels, bigger images are down-sampled [62]. Image resizing may improve performance but
could lead to a lost of information. A different proposal is done by AccessNOW [35], which
was designed by Centricity Radiology Mobile Access (GE). The user has other interaction
options in the visualization window like scrolling, zooming and panning, expanding the avai-
lable cases within the respective clinical images and adding value to classical PACS. There
are different interaction gesture necessities because most of the interaction is limited to the
previously mention gestures options.

14 1 Introduction
CARESTREAM Vue Motion [13] aims to ease the work among physicians, it is an embedded
application that does not require a dedicated workstation and significantly enhances the
assessment of diagnosis on oncology patients [13]. It has a precise lesion measurement, critical
for reliable evaluation of metastatic disease and faster assessment of the patient response
to cancer treatment. SYNAPSE PACS offers different reading protocols as page layout,
including monitor, location and covered monitor count; tile format for each viewport, whether
to display only the current study or compare it [28]. These are options for medical doctors to
expand their examination protocols. This application [13] design brings out a user interface
that takes advantage of the familiar functions of Internet Explorer and Windows, such as
back, forward, links, favorites and right-click context menu, while also providing powerful
imaging functions, necessary in current radiology departments. The Fujifilm proposal [28],
includes annotations and measurements as:
Line length and line ratio ruler
Curved line measurement
Free text arrows
Density values
Elliptical, rectangular and freehand ROI (with calculated perimeter and area)
Density mean and standard deviation.
Label palette for spine images.
Synapse [28] allows user to create their own user level reading protocols depending on per-
sonal preferences and specialist interests. Syngo.plaza [70], developed by Siemens, provides
an intuitive user interface for radiologists with quick and easy access to image mark-ups and
prior studies, browser independent, with further access to surgical planning software. A simi-
lar PACS is InfinittPACS [39], which is operating in a large number of hospitals worldwide
and it is recognized by its performance and coordination with RIS, Mammo PACS, Cardio-
logy PACS and Dental PACS. Furthermore, other feature useful for radiologist is the voice
annotations, this PACS stores MP3 or wavelet exam interpretations on the central server.
Other proposal is NOVAPACS [18] which has a completely customizable GUI, it is possible
to modify the style of buttons, toolbars and mouse settings that allows the user has a mo-
re comfortable interaction with the system. Despite of advances in interfaces design, there
are different needs further than cosmetic or artistic arrangements, for example, coherence
between requests and information retrieval, semi-automatic measure tools and comparison
instruments for tracing cases for the same observer. Moreover, coherence among the PACS
functionalities and PACSv-GUI.

1.2 PACS Benchmark 15
1.2.4. Discussion and Perspectives
To the best of our knowledge, PACSs are usually analyzed in terms of the implicit compo-
nents in their physical structure, image processing tools, communication protocols, usability,
economic models and others, as individual elements. Nevertheless, one of the most important
considerations is the final user participation in PACS and PACSv design, implementation
and testing. Current access to valuable information in radiology image databases is limited
to list of cases, then, knowledge remains hidden since medical experts interact with these
repositories at a very basic level.
Inherent to the medical scenario where PACS or PACSv may be used, hospital or radiology
centers are interested that academy findings and commercial products merge into a most
complete proposal. The best system features the final user has, the most money customers
being medical centers will pay. Licensing has become a challenging business due to the few
differences among PACS in the market and high prices. The PACSv as other systems are
moving from big and static workstations to responsive applications that properly work in
any device. Web-PACS are having a big impact in the market, furthermore the responsible
layout visualization, still has problems with browsers, connectivity, storage and retrieval in-
formation. Proposals that involve classification, retrieval and visualization strategies in PACS
have several problems, for instance, searching in not specific content or generic knowledge
exploration. It is suggested to implement new criteria for search filters, search paradigms re-
definition, among others [43]. Understanding which data in which context is more significant
or useful than other for medical experts[81]; moreover to reduce the semantic gap [40].
There are some challenges to overcome in PACS and PACSv design that involve novel in-
teraction mechanisms that involve several or all software layers. Moreover visualization stra-
tegies for large radiology image collections. In the following, there are navigation content
aspects and information interaction to improve, based on the state of the art characteristics
and users. Data management and interaction with online databases or capture devices are
directly related to content retrieval effectiveness and efficiency.
In conclusion, PACS community is working on two main problems, the first related to ma-
nagement of large quantities of data and the second associated with reducing the medical
and engineering gap. In particular, participation of the final user, medical experts in this
case, in the software design process, may lead to development powerful tools to explore large
databases and take advantage of the big data with the related annotations and tags that
takes perspectives into the look of implicit knowledge, in order to help users to improve the
work flow and extend the training possibilities for future specialist generations.

16 1 Introduction
1.3. Computing PACS strategies
To propose most innovative PACS and PACSv a wide range of interaction layers might be
improved: search mechanism, classification, retrieval and finally visualization strategies.
1.3.1. Classification
Medical imaging classification by organ is a demanding task due to the high intra patient
variability and the differences associated with the body structure uniqueness. There have
been some previous works of automatic classification by organ using visual features [65],
patch-based visual words [5] and Gabor filter [82]. In most current medical imaging systems,
content access and retrieval are achieved by using the image associated text (most of the
time annotations are automatically set by the imaging system while others are manually
added by technicians during image capture).
As databases grow up, the traditional keyword based methods become inefficient and limited
since this is fully operator dependent and therefore expensive, time-consuming and highly
prone to errors [77] [11]. Also, there is a high annotation variability due to the inherent
human subjectivity [52] [80]. In particular, participation of the final user, medical experts in
this case, in the software design process, may lead to development powerful tools to explore
large databases and take advantage of the big data with the related annotations and tags
that takes perspectives into clustering, indexing and medical image retrieval. The problem
is then a multi-class classification, an issue explored using different algorithms that take
advantage of the visual information, aiming to improve the efficiency of the clustering task.
Many approaches have dealt with this multi-class problem using data mining strategies, com-
puting techniques, supervised methods using minimal distances, decision trees, contextual
classifiers [59, 21]. Clustering depends on finding a good matching between an unknown inco-
ming image and a reference image from each cluster. Context-based search like patch-match
algorithm [7, 8], has been used to solve this issue. These techniques find out correspondences
between images using contextual information, that is to say, if something is actually alike
between two images, the similarity exists at both regional and local levels. This approach
has been applied to the medical field for segmentation [69], super resolution [68], retrieval
and classification [4], among others. Nevertheless this natural computing algorithms does
not work properly in radiology images due to the noise issues, fuzzy borders, low contrast,
furthermore the semantic challenge. The latter is related to the high difficulty to determine
to which group belong an image.
One explored option consists in organizing the database information by organ, independently
of the particular modality procedure. This problem is a multi-class clustering, approached
by different algorithms like bag of words, feature-based approach using different similarity
metrics and direct distance pixel to pixel computing. One of the proposals in 2007 consists in
a probabilistic image representation using Gaussian Mixture Modeling (GMM) [33]. A Spine
1.3 Computing PACS strategies 17
Pathology & Image Retrieval System (SPIR) [36], en 2009, retrieved column related-images
base on their shape boundaries that are processed as closed polygons and represented in a
variety of forms. Another proposal [4] differentiates chest x-ray from other organs using a
patch extraction strategy. Patches are organized as a dictionary to later describe each word
as histogram. Each income image is compared to the dictionary and so the requested organ
is retrieved. Nevertheless, results showed a Mean Average Precision (MAP) of 0,33 for the
top 32 runs.
1.3.2. Content Based Image Retrieval (CBIR)
The content-based image retrieval is the searching mechanism that just using image infor-
mation retrieves to a final user or other system similar images. This is important in medical
scenario, because two or three semantic layers are not enough to model medical knowledge
for image retrieval and consequently, results are rather poor when common content-based
image retrieval algorithms are applied to medical images [49]. One of the greatest interest of
specialist in assisted technologies is to produce knowledge, facilitate and decrease time during
the diagnosis. Content retrieval is one of the greatest challenges because of the importance
of accurate answers in the shortest time possible.
Retrieval systems are mostly based in text or tags searches [34], opposite to the CBIR image
searching, usual in other domains such as face recognition [58]. Many of the advances in
biomedical research has been developed without thinking in their final application, having
high computing cost procedures or unnecessary medical scenarios [46, 57]. For instance,
automatic search and selection engine with retrieval tools has extremely high data entry
cost, which prohibits its application for clinical routine[53]. This automatic processes are
unable to identify the content of images without using tags [45].Information retrieval is
not just related with algorithms appropriate design and implementation, but the number,
distribution and display specifications of image collections.
There is reported the need to support query, search, and relational analysis of anatomical
information in the images [26]. Image-based findings and text-based clinical information are
integrated to reach a decision. CBIR has several challenges due to the high inter and intra
variability of image clustering and analysis, moreover, it becomes even worst when images do
not have associated text, the information turn into inaccessible and not useful information
[40]. One of the greatest interest of specialist in assisted technologies is to produce knowledge,
facilitate and decrease time during the diagnosis. There is a great importance of accurate
answers in the shortest time possible because it directly affects the physician workflow.
Image metrics have been used for wide purposes, in medical imaging it is commonly used
as part of segmentation, clustering and retrieval techniques. The are two main approaches,
the local search which is performed in a limited spacial window and the global search that
considers all possible displacements [8].Pathmatch is a renown algorithm for finding co-
rrespondence between small regions and patches using random or a priori information, to

18 1 Introduction
determine the similarity of two images. In 1999, it was introduced a non-parametric texture
synthesis method by sampling patches from a reference texture and pasting them in the
synthesized image with many time efficiency defiances [25]. Since that moment, there have
been different proposals to improve structure preservation [24, 19], computing approximate
nearest-neighbor fields [7], extended the inputs to different scales, rotations, matches across
these dimensions [8], improve kd-tree techniques[8], among others.
Different CBIR and other retrieval techniques have been integrated to PACSs, exploiting
the database implicit knowledge. Valente et al [76] propose a feature space composed of
different features, namely intensity and edge histograms, entropy, among others. The user
must then choose a convenient metric among Euclidean, Weighted Quadratic, Earth Movers
and Bhattacharyya distance. The drawback is that Doctors are responsible for this selection,
without any objective criterion. In such context, there are two common approaches. The first
consists in retrieving visually similar content from low level features such as shape, texture,
orientation, size, among others [12]. Unfortunately, visual similarity is not always enough to
retrieve relevant results because it is still far from the image semantics [32]. For this reason,
a second approach aims to integrate low level information with semantic knowledge, i.e.,
ontologies[48] or user feedback [32], annotations [12], among others.
1.3.3. Visualization
Medical visualization is a special area of scientific visualization that established itself as
a research area in the late 1980s [9], from that moment on, the experimentation field has
been expanding; one of this specific research areas is image collection visualization. This
is the graphic representation of the stored data in a database. Long ordered lists (most
of the time by relevance) has been the mechanism to access to information. Those works
efficiently in small quantity or specific search of data [81], nevertheless big data is a fact.
The access to image collections can define PACS execution because of the different tab pages
and subsystems activation [49].
The research system allows the user access to information as interactive as possible [29]. The
classification, simplification and retrieval of the information in image collection have several
problems, for instance, searching in not specific content or generic knowledge exploration.
Some mechanisms and strategies of interaction are suggested as search paradigms redefinition
[43]. Visualization, interaction and access to medical images depend not only on the system
interface but also on the system aptness to summarize information from the database. Most
current medical visualization systems are incapable of displaying the most basic information,
i.e, the database information organized by organ or pathology [65, 82]. These systems merely
sort the cases out using the associated tags from the DICOM header. However, image tagging
relies on metadata completeness, a task performed in most actual radiology services by
technical personnel, with the consequent introduced human error when annotating a huge
number of cases.
1.4 Our Proposal 19
1.4. Our Proposal
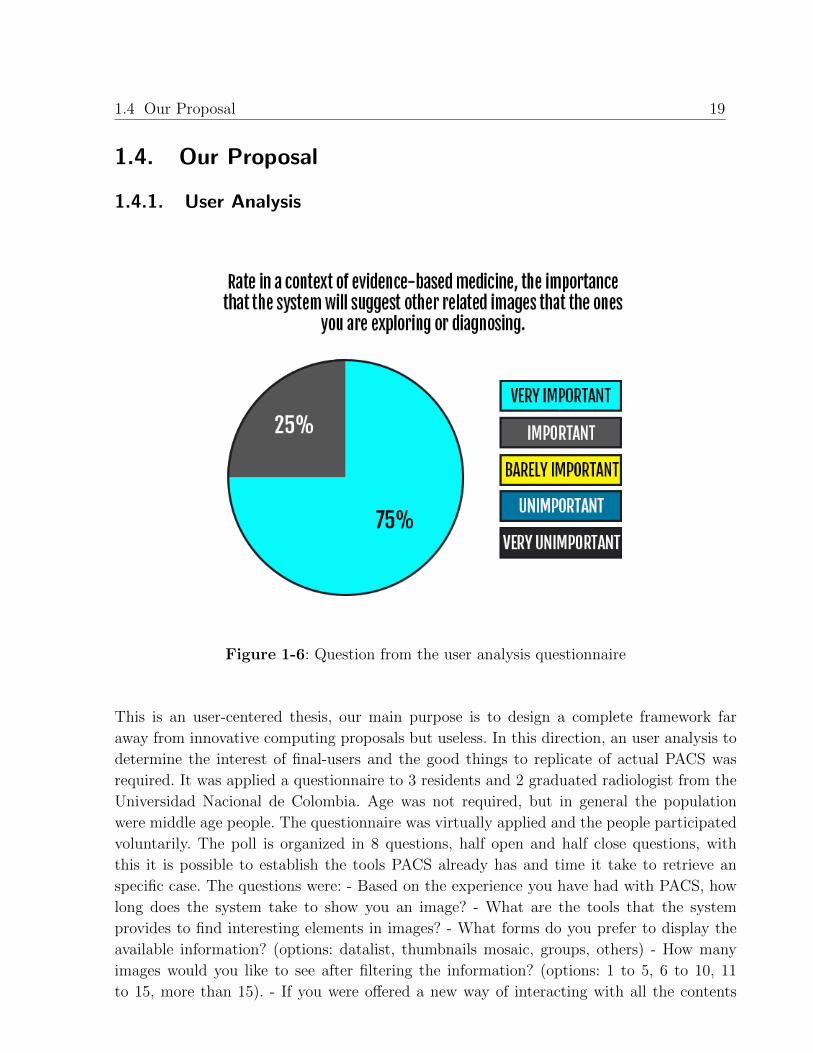
1.4.1. User Analysis
Figure 1-6: Question from the user analysis questionnaire
This is an user-centered thesis, our main purpose is to design a complete framework far
away from innovative computing proposals but useless. In this direction, an user analysis to
determine the interest of final-users and the good things to replicate of actual PACS was
required. It was applied a questionnaire to 3 residents and 2 graduated radiologist from the
Universidad Nacional de Colombia. Age was not required, but in general the population
were middle age people. The questionnaire was virtually applied and the people participated
voluntarily. The poll is organized in 8 questions, half open and half close questions, with
this it is possible to establish the tools PACS already has and time it take to retrieve an
specific case. The questions were: - Based on the experience you have had with PACS, how
long does the system take to show you an image? - What are the tools that the system
provides to find interesting elements in images? - What forms do you prefer to display the
available information? (options: datalist, thumbnails mosaic, groups, others) - How many
images would you like to see after filtering the information? (options: 1 to 5, 6 to 10, 11
to 15, more than 15). - If you were offered a new way of interacting with all the contents

20 1 Introduction
of the databases, would it be in your interest? (options: yes, no) - Classify, the satisfaction
level in the way of interacting with the images in a PACS? (options: highly satisfactory,
fairly satisfactory, less satisfactory, very less satisfactory). - Rate in a context of differential
diagnosis, the importance that the system suggest other images related to those you are
exploring or diagnosing. (option: very important, important, fairly important, less important,
very less important) - What characteristics are you interested in in a PACS to improve your
diagnostic process?
In their opinion, the tools that specialist used the most are intensity range changing and
filtering options. Specialists are highly interested in grouping images, this might organize
information and cluster data. This kind of proposal are thought considering the large an-
notated and diagnosed images. On the other hand, about the PACS nowadays available in
the market, radiologist showed a satisfaction level between average and satisfactory. All the
surveyed expressed the importance of new strategies to interact with hierarchical and orga-
nized content of the whole database. It was obtained a set of features that radiologist were
interested to find in future systems listed as follows:
Measuring with semiautomatic tools.
Comparison tools for tracking.
Assignment of cases for longitudinal studies for the same observer.
Specific pathology measure strategies.
Suggestion of similar cases to make evidence based medicine.
Access to files with similar cases for comparison.
Collaborative environments (sharing information and discussion with colleagues).
Access to bibliographic databases for diagnosis enrichment and information searching.
The large differences among the surveyed preferences of an ideal radiology training and
clinical PACS, makes evident the difficulty of a one-design software. For instance, to the
question of personal predilection in the visualization of available information it was divided
into 50 % preferences for groups and the other 50 % in data lists. When the study group
were asked about the number of images they would like to see in one visualization wire-
frame,answers were fifty percent choose the option 1 to 5 cases and the resting percentage
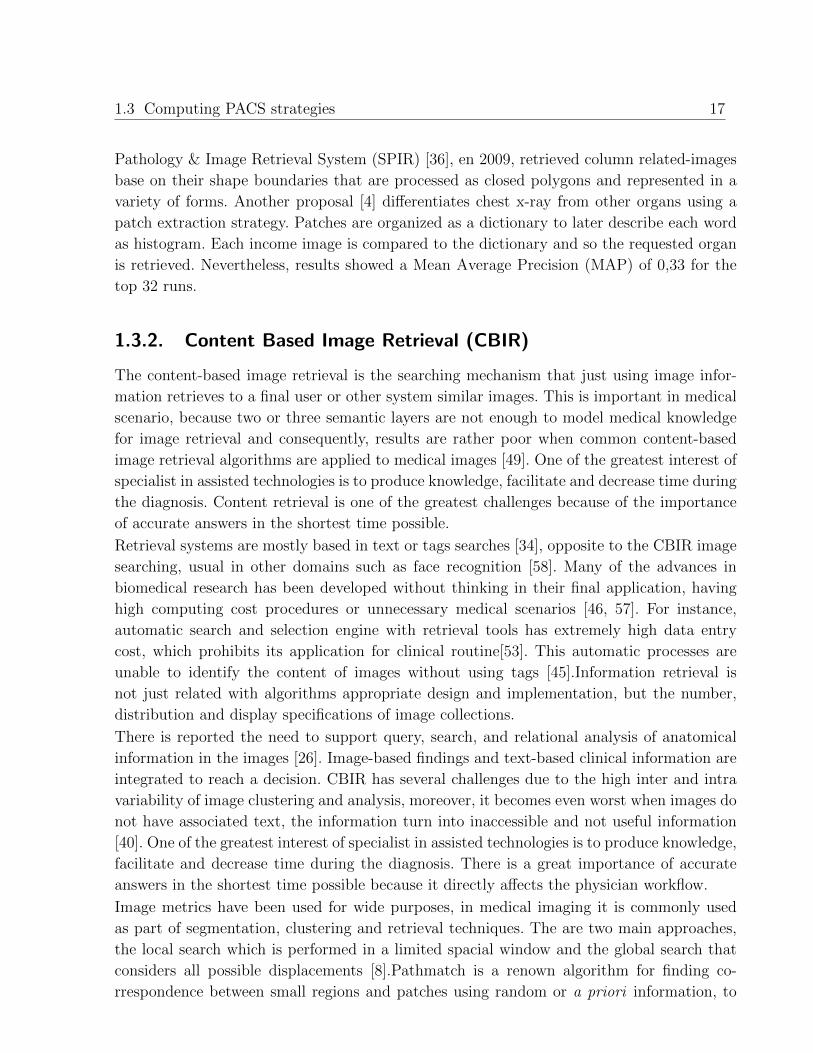
corresponds to 6 to 10 cases. As it is presented in graphic 1-6, 100 % of radiologist answer
positively to the question If is it offer a new way to interact with all the content in the
database, would it be of your interest?”, then, the interest and disposition of radiology
system is open to innovative offers. Specialist determine as important or very important the
qualification of how important will it be if the system suggest some related images of the ones

1.4 Our Proposal 21
you are exploring or diagnosing, in a evidence-based medicine context (Graphic 1-7). Then,
even when many of the radiologist specialist or trainees are interested in new proposals they
have not a clear path of what exactly they want.
Figure 1-7: Question from the user analysis questionnaire
Data management and interaction with online databases or capture devices are directly
related to content retrieval effectiveness and efficiency, which user will perceive as one of
the most representative elements. According to the user analysis results, in general, there is
an increasing interest in innovative data visualization strategies, mechanisms of interaction
with radiology images, knowledge retrieval and cases exploration. Specialist are looking for
systems that avoid extreme sophisticated tools like 3D rendering, colorful maps and keyboard
shortcuts. They recognize the computer graphics and aesthetics value of this proposals but
are distant from clinic reality, moreover a suitable training system.

2 Characterization
2.1. Dataset
Figure 2-1: Dataset examples
A radiology case is organized in one or a group of volumes, which are series of slices. These
correspond to the same modality and body organ, but different anatomical planes, capturing
times or patient preparation. This thesis work was carried out using 125 radiology studies,
it represents a total of 39.545 slices. The dataset is divided in 50 brain and 50 column MRI
cases, provided by the Department of Diagnostic Images of the Universidad Nacional de
Colombia. Summed up to 25 breast MRI cases from The Cancer Imaging Archive (TCIA)
[16]. All images were in DICOM format. The middle slice of the axial series was manually
selected for each volume for two reasons: first, the capturing direction is usually axial, and
second, the middle slice commonly is the larger organ slice. The whole database was annota-
ted by an expert who labeled the type of organ for each volume (Ground Truth Label (GTL).
The image 2-1 show the high intra and inter classes variability of the dataset. On one hand,
these images were taken from patients with different types of pathologies or lesions (i.e.
cancer, seizures,etc.). Even if some cases present the same disease might be in diverse stages.
On the other hand, most of the cases present the typical noise as result of patient motion
or magnetic susceptibility. The most recurrent artifact in this dataset is the echo noise, in
addition to brightness and contrast challenges. Particularly for brain and column images,
there is a great characterization challenge because in some column cases the temporal lobe,
cerebellum and brain-stem might be seen. As breast images are taken from TCIA dataset,
many of the images actually just have one breast

2.2 Feature Extraction 23
2.2. Feature Extraction
The characterization section is done once, if one new image is included the result matrix will
be computed and updated. This module was evaluated using a processor Intel Core i5 CPU
3.20 GHz with a RAM of 7,6 GB, where it take less than 1 minute to describe the complete
dataset, it was implemented in MATLAB using the image processing toolbox. This step is
crucial to perform later classification and retrieval scheme.
2.2.1. Pre-Processing
Each slice was equally pre-processed by resizing the original slice to a smaller grid (250×210
pixels) and scaling the intensity range to the the interval [0, 255]. This resultant image is
then thresholded using a simple Otsu’s algorithm to extract the background.
2.2.2. Feature extraction
Figure 2-2: (i) Slide Foreground (ii) Foreground Intensity Histogram (iii) Foreground
Convex-hull (ii).

24 2 Characterization
Once the image is binarized, the foreground is used as a mask superimposed to the original
image that serves to estimate several shape characteristics, namely the foreground ROI, the
foreground intensity histogram and the foreground convex hull as illustrated in figure 2-3.
The ROI is the foreground itself, the intensity histogram is calculated on this region as well
as the convex hull. The latter is defined as the minimal ellipse that contains the binarized
shape. These characteristics are illustrated in figure 2-3.
Image portion
/ FeatureROI Image Histogram ROI Histogram Convex hull
Entropy X X
Mean Intensity Value X
Template similarity X
Major axis length X
Minor axis length X
Orientation X
Area X
Eccentricity X
Table 2-1: Features extraction in relation with slice representations
Several features, shown in table 2-1, are computed from the ROI, the intensity histogram
and the convex hull. Each one pursuit to characterize in different space the slices. These
features are herein briefly described, its distributions are further illustrated in annex 5.1.
1. Entropy: It is a measure of unpredictability of the state of its average information
content. This is a scalar value that represents the statistical measure of randomness
that can be used to characterize the texture of the ROI.
2. Histogram of the Entropy: The same entropy that was previously described was
used not just for the gray-scale of values (directly in the images) but the histogram.
3. Mean Intensity Value: This is the mean of the gray scale intensity values or each
pixel that each ROI has.
4. Template similarity: For each class, a volume was randomly selected and the middle
slice was used as a template (three templates then). The distance to this template was
calculated as the simple dot product between the two middle slices, normalized by the
maximum value of each slice.
5. Major and Minor Axis Length: Computed from the convex hull, the major and
minor axis is computed over the ellipse that has the same second-moments as the
region. As it is shown in the figure 2-3 the length of any of the axis will be directly
related with the convex hull dimensions.

2.3 Classification Strategy 25
Figure 2-3: Image: from Image Processing Toolbox,regionprops
6. Orientation: Computed a scalar that specifies the angle between the x-axis and the
major axis of the ellipse that has the same second-moments as the region (as it is
shown in figure 2-3). The value is in degrees, ranging from -90 to 90 degrees.
7. Area: This is the scalar that specifies the number of foreground pixels or ROI.
8. Eccentricity: This is a scalar that specifies the eccentricity of the ellipse that has
the same second-moments as the region. The eccentricity is the ratio of the distance
between the foci of the ellipse and its major axis length. The value is between 0 and
1. (0 and 1 are degenerate cases. An ellipse whose eccentricity is 0 is actually a circle,
while an ellipse whose eccentricity is 1 is a line segment.)
2.3. Classification Strategy
Several types of approaches as patchmatch algorithm, context search and direct (pixel to
pixel) similarity metrics were calculated, looking the scheme that fit the best to dataset
classification. The one with better performance and results was Random Forest classifier,
moreover the reported benefits of:
Better accuracy among current algorithms [47].
It works efficiently on big data repositories [30].
It rank variables importance for the classification.
It generates an internal unbiased estimate of the generalization error as the forest
building progresses [10].
Agile and facilities for implementation [56].
It has methods for balancing error in class population unbalanced data sets [10].

26 2 Characterization
Figure 2-4: Random Forest Scheme
Random Forest is an algorithm based in classification trees. For a new input, the classifier set
the input vector down each of the trees in the forest to the determine the class that match
the best. The forest chooses the decision class having the most votes (over all the trees in
the forest), as illustrated in the graphic 2-4. According to some authors, this classifier does
not overfit data [10] which is one of the greatest benefits. This work runs on the complete
feature space using 50 trees in 1 minute on a 3.2 Ghz machine. Then 50 trees according to
the work of [47] where 50 trees are the minimal state of equilibrium and experimentation is
a good middle point, because the more number of trees, the more storage requirements it
will need .
Using the training set of data it is build a set of trees by sampling with replacement. The
third part of the cases are reserved in a oob (out-of-bag), later it will be used to get a
running unbiased estimation of the classification error (as trees are added to the forest).
Having already built the trees, data is run down the tree, and it is computed the distance for
each pair of cases [10]. “If two cases occupy the same node, their proximity is increased by
one. At the end of the run, the proximities are normalized by dividing by the number of trees.
Proximities are used in replacing missing data, locating outliers, and producing illuminating
low-dimensional views of the data” [10]. One of the benefits in using oob approach inside
the Random Forest method is the separation of the test set, for getting an unbiased error
estimation. Each tree uses a different sample from the original data.

2.3 Classification Strategy 27
2.3.1. Evaluation and Results
The classification task evaluation was done comparing results with a classic Support Vector
Machine (SVM) classifier. Taking into account two different kernel functions (Polynomial
and linear).
Baseline
SVM is a supervised learning model that build one or several hyperplane(s) to divide a space
[17]. The largest the distance to the nearest training-data point of some class, the better the
performance of the plane. SVM looks that dot products may be easily calculated in terms
of the variables in the original space, by defining them using a kernel function selected to
suit the problem. This may adjust well to data, avoiding overfitting. There are two types of
SVM classification, Linear and Non-Linear.
Figure 2-5: SVM classifier
The first was used to describe in a simple way the division plane, where the training dataset is
designated as: ( ~x1, y1) , ..., ( ~xn, yn), being n the points. Then, the hyperplane may be written

28 2 Characterization
as the set of points ~x1 satisfying ~w ·~x−b = 0. Where ~w is the normal vector to the hyperplane
and its offset from the origin along the normal vector ~w, defined as b‖~w‖ . On the other hand,
the Non-Linear hyperplane is a polynomial is describe by k (~xi, ~xj) = k (~xi · ~xj)d, where k is
a constant and d the polynomial degree [2].
Evaluation and Results
This work is a multiclass classification, results are highly challenging to evaluate. For this
reason it was taken the decision of computing the accuracy percentage to determine the
performance of the proposed method against the baseline. The dataset was splited in 70 %
for training and the 30 % of the rest for testing, this percentage maintain the same for all
classes. Based on the feature distribution it was possible to determined that characteristics
computed over the Convex Hull has a most discriminant and differential aspects than others.
Then, it was performed a set of two experiments applying the three classifiers (Random
Forest, SMV Linear and SVM Polynomial). The first classify data using the complete set of
features and the other, just using the convex hull characteristics. The computed results are
illustrated in table 2.3.1.
FEATURES METHOD ACCURACY
SVM Linear 83,78 %
SVM Polynomial 72,97Complete Vector
Random Forest 92 %
SVM Linear 81,08 %
SVM Polynomial 78,37 %Convex hull Features
Random Forest 89 %
Table 2-2: Classification Results: Random Forest classifier vs. Baseline

2.3 Classification Strategy 29
2.3.2. Discussion
The quantitative results of the proposed classification strategy shows results around 90 % of
accuracy. Meaning that for each 10 cases, 9 will be correctly clustered. As it is described in
feature extraction (section 2.2) the class that is less discriminative among all is breast. In all
experiments, the baseline performance is superior for SVM linear than SVM polynomial. In
both experiments the proposed approach perform better using the complete set of features
than using the extracted features from the convex hull, even for the baseline.
The Random Forest classifier versus the baseline show a better performance: In the first
experiment our proposal has 8,22 % over the Linear SVM and 19,03 % over Polynomial
SVM. For the second experiment our proposal has 7,92 % over the Linear SVM and 10,63 %
over Polynomial SVM. This thesis classification method shows that brain and column images
are easier to classify because the anatomical structure itself is really different between them,
while, breast has not that significantly differences with brain and column. Moreover, some
breast slices has just one breast then, convex hull characterization might be easily confused
with column and brain class. This group report the less accurate results due to the wide black
spaces, leaving a reduce space to analyze and few contrast among the structures, moreover
the particular texture characteristics.
In this work it was proposed a single methodology for three different classes. Quantitative
results out stand from baseline and qualitative results are useful for practical applications. It
is important to mention that this strategy has reliable response times, classifying a complete
case in less than 2 seconds using an average computer. Other interesting point is that, despite
the high variability of images and noise of the database, the method presented promising
results using a very simple approach. As a result of this module there is an ID number for
determining to what organ belong each image just analyzing the visual information. Future
work might be focus in fusion of this module with semantic content.

3 Interaction Model
3.1. Retrieval
3.1.1. Similarity Metric
Different pixel to pixel metrics were computed to define which similarity metric in the fea-
ture space may work the better for the retrieval task, among them: dot product, euclidean,
mahalanobbis, mean square error,mutual information and correlation coefficient. The results
obtained using this kind of approach were really poor. Moreover the already presented work
in progress for CBIR in introduction section 1.5 .
Distance = cos−1
⟨n∑
j=1
V TslicejV Tslicej+1
⟩(3-1)
Then, it was proposed a new approach using the feature space described in section 2.2,
then it is estimated the distances between cases. Representing each slice as a feature vector
(V Tslicej), being j each slice number and n the total number of slices in the dataset. This
metric applied between each image against all the images in the dataset result in a complete
matrix of distances.
3.1.2. Evaluation
In the state of the art, the validation scheme in medical image retrieval is still a work in
progress [44]. The main aspect to evaluate in this retrieval strategy is the accuracy of the
requested-query vs retrieved-image. For this task, it was run an experiment where each case
is related in proximity order to the rest of slices in the dataset. In the final application the
most similar studies to the case the user is looking at are suggested (the five most similar
cases), then, this is where our attention is focus. They are chosen according to the smallest
distance described in section 3.1. For instance, data is organized as it shows in Table 3.1.2
where it is related two cases of each class (Brain: B, Breast:Br, Column: C) and the first 5
cases retrieved (in the retrieve order).

3.1 Retrieval 31
Case labelRetrieval Order
1 2 3 4 5
Brain B B B B B
Brain B B B B B
Breast Br Br Br Br Br
Breast Br Br Br Br Br
Column C C C C C
Column C C C C C
Table 3-1: Income to the system vs the first 5 retrieved cases
The organ label or case frequency may explain the goodness of this method. The faster
retrieves the requested query (by the user or suggest related cases) the better will be the
performance. The result evaluation is performed by a Set of Queries (SQ), assessing how
accurate is the search with the set of first five retrieved cases, then with the set of first
ten, twenty, forty and up to eighty. SQ is analyzed per class (brain, breast and column),
computing three measures:
True Positive (TP): GTL 1 is the same to the corresponding retrieved case body
part label and was correctly identified.
True Negatives (TN): GTL is different to the corresponding retrieved case body
part label and was correctly identified.
Mean Average Precision (MAP): Average of the precision value obtained for SQ
existing after each relevant result retrieved. This is the proportion of TP and TN.
For each case the TP and TN are computed. After the average per SQ and per class is
calculated. looking for defining the behavior in small groups of images it is analyzed each
SQ and it is computed the average of TP and TN; later known as The TP and TN rate
(i.e. TPfirst5brain, TPfirst10breast,TPfirst20column). It was necessary to study the retrieval per-
formance in general terms, then it was estimated the MAP score. Computing a great total
average per class and per rate (i.e. TPbrain, TPbreast,TNcolumn). For each SQ it is calculated
the MAP score, described by the equation:
MAP =TP
TP + FP(3-2)
1Ground Truth Label: The label defined by the expert.

32 3 Interaction Model
3.1.3. Results and Discussion
The results of validation scheme are presented in the following graphics 3-1, 3-2 and 3-3.
5 10 20 40 800
25
50
75
100
Number of Queries
TP
Rat
e
BrainBreast
Column
Figure 3-1: TP Rate among Classes
The general negative slope of the curves in figure 3-1 presents the expected pattern of a
retrieval system. As queries augmented, TP rate decreased. The TP might show a higher
rate in each class for the first SQ, because those are the ones that final-user will used. Brain
and column images have the closest results, in the mid-time, breast is a most difficult class
to discriminate due to the image structure and mixed intensity values.
5 10 20 40 800
25
50
75
100
Number of Queries
TN
Rat
e
BrainBreast
Column
Figure 3-2: True Negative Rate among Classes

3.1 Retrieval 33
The TN rate graph 3-2 is coherent with the TP rate graph 3-1, because the method not
just retrieve the most similar images,but left behind the ones that are more distant from the
requested query. The TN rate among classes illustrates the way the strategy reject the classes
that are different from the requested query. As in the graphic 3-1 the less discriminate group
is breast, this is the most challenging class in general. The most clearly rejected and retrieve
one is brain.
5 10 20 40 800
0,25
0,5
0,75
1
Number of Queries
MA
Psc
ore
Figure 3-3: MAP score
The proposed retrieval strategy return the ranked sequence of cases, then it is also desirable
to consider the order in which the retrieve studies are presented. The graph 3-3 takes in
each cut (SQ) the corresponding point for the three classes and calculate MAP number to
each, finally computes an unique value by averaging the three values.
The closer the MAP value is to one, the more precise the method is. The first three sequences
(SQ = 5, SQ=10,SQ=20) shown a precision above 0,75 what represent the accuracy of the
method beyond the class type. For instance, from the first 5 to 20 retrieved cases results are
above 0,75, as it is shown in the graph 3-3. It shows the good results of our strategy. While
the first 5 SQ will have results close to 0,95 of MAP, the last 8 SQ are around 0,30 MAP.
The retrieval precision works good for the final radiology application, It uses the SQ of the
first 5 retrieved cases, giving to the final user accurate results around 1 in the MAP curve,
coherently working for the three body part clusters.

34 3 Interaction Model
3.2. Recommendation Module
This module was presented in the article Radiology Image Retrieval System based on
User Preferences, accepted on the 12th International Symposium on Medical Information
Processing and Analysis, SIPAIM 2016
Abstract This module introduces a computer-aided solution for radiology education integra-
ted with the clinic practice, inherited from modern technologies that facilitate the processing
of large amounts of stored information. Radiology training may have several challenges such
as image retrieval, extraction of knowledge, education towards solving problems and the in-
teraction with huge repositories known as Picture Archiving and Communication Systems
(PACS). This project proposes a user-based system that learns from user interaction, re-
trieving not just the requested information but recommending related cases and interesting
images. The recommended images are retrieved using a Click-through rate (CTR) strategy
for defining the most similar cases in the database. This is a fully web-based proposal, poten-
tially useful at classroom or home, that allows students to develop the clinical skills needed
in a more realistic scenario.
3.2.1. Recommendation Strategy
This is a recommendation strategy in specialized education, for different residence years
and medical doctors in radiology training. It is use a Click-Through Ratio (CTR) metric
to determine the closest case to the one, the user is looking at. It is analyzed in two ways,
first counting the body part of the slide the radiologist checked and the ID of the case
itself. Our proposal has an initialization phase detailed explained in the previous section
3.1, nevertheless this recommendation strategy is completely dynamic. This may contribute
to learn from the user interaction, retrieving not just the requested information via query
but recommending related cases and interesting images to increase the study range. This is
by far the major contribution of this work. To the best of our knowledge, it has not been
presented anything similar in a commercial or academic field. In radiology training there are
not reported approaches that fuse this kind of ”smart retrievalcontributing to reduce the
gap between engineering and medical specialized education.
This module is focused in recommendation. The database of neuro-radiology cases is orga-
nized in brain and vertebral column Magnetic Resonance Images (MRI). It was presented
to the conference with two group of images: brain and column. Nevertheless, nowadays it
is working for breast as well. To access this information, the user may search using the
classic filter section (modality, sex, ID, and patient name). Then, the radiologist selects the
case of study, and a visualization module is used to deploy the case. In this part, the re-
commendation module is used to suggest cases of interest. The general radiology system is
presented in figure 3-4. The workflow is initialized by a query-based search, which will be
consulted for a physician from a personal computer, tablet or mobile phone. The user fills

3.2 Recommendation Module 35
some common fields such as name, modality, organ, sex, etc (flexible fields) to access the
visualization module. This is divided in two parts: the first is the classic case review (image
and meta data information), and the second part is the recommended images obtained from
the recommendation module.
Figure 3-4: Recommendation Module Architecture
Each image has a related organ label which is extracted from the DICOM header. The system
reads the DICOM tags and performs a search in the PACS to find related cases using the
retrieval module. Then, the user may access to an specific case and the system will suggest
the cases using a CTR for each body organ in the database (in this case: brain and column).
A CTR is a value corresponding to a non-square matrix where each case is related with
the organ it belongs to. This matrix stores and updates the number of times an user clicks
on each case. This value constitutes a measure of the relevance of such case and is used to
prioritize the recommendation. Each time the user clicks one image, the matrix will increase
the value by one in the corresponding organ. The higher the value in each body part, the
higher the interest of the user in this type of data. The recommendation panel in the inferior
part of the visualization module will use the five highest values of the CTR matrix to suggest
the related cases. For instance, if there are 4 users, the system will start as shown in table
3-2. After 10 click-through interactions with the images the matrix will be updated as shown
in table 3-3.
Table 3-2: CTR matrix initialized in zero
Organ User 1 User 2 User 3 User 4
Brain 0 0 0 0
Column 0 0 0 0

36 3 Interaction Model
Table 3-3: CTR matrix update after 10 click-through interaction with the images
Organ User 1 User 2 User 3 User 4
Brain 1 10 4 8
Column 9 0 6 2
3.3. The Visualization Approach
Visualization, interaction and access to medical images depend not only on the system inter-
face but also on the system aptness to summarize information from the database. Previous
sections aimed to attack classification, interaction and access to radiology images. This sec-
tion is focus in the most superior layer of the software, that may be acceded from the user
view to finally interact with database information. Then two proposals are included in this
section, first to view a particular case, and the second one to view general information of
the database.
It was obtained a visualization scheme of a radiology case with a set of recommended cases in
a computer-aid diagnosis and training system. One of the relevant features of this work is the
interface that aims to be functional and, at the same time, has a user-friendly design looking
to be more attractive to a student or physician. This is the first functional prototype that
includes the complete classification,retrieval and recommendation framework. The Front-
end is an interface that aims to be functional and has a user-friendly design, the system was
developed using bootstrap, HTML5, CSS 3 and JavaScript; the back-end was developed on
Java Platform. This is a fully web-based proposal that can be used anywhere (at classroom
space or home), no additional applets must be installed. The system automatically adapts to
the most popular browsers (Chrome, Mozilla, Internet Explorer, Opera) and it is compatible
with mobile devices. Images are automatically added to the system, a process of adding
images in future work may be done manually. Capturing and analyzing requirements is a
fundamental step in the Software process.
A radiology interaction system was designed and implemented to better exploit the classifi-
cation and retrieval strategies. This allows the user to access information in the classic way
(keyword search) or to explore the dataset in a classified and organized way, by using the
body organ information. The whole framework was designed taking into account the experts
and residents main goals for a retrieval system. A summarization strategy is presented he-
rein to resume the images of the dataset. This approach present a completely draggable and
dynamic network strategy, each node will be a single thumbnail extracted from the sample
slices. Thumbnails were automatically obtained using ImageMagick, computing all images in
a standard size (100 × 100). Edges are strengthen according to the selected node, the color
of each edge is the same color of each body part logo. The network is build using the library
vis.js, which has a full touch support for mobile browsers.

3.4 Web-based Application Architecture 37
3.4. Web-based Application Architecture
The architecture is organize in three layers, the first are the raw data; second, the interaction
modules and in the end, a visualization one. This is illustrated in the graphic 3-5. The data-
base are radiology volumes identified by the corresponding ID of the sample slice, considered
for previous sections (characterization and interaction). The second layer is organized in
three different components: (i) From the classification module each ID will have an assigned
class (i.e.brain,breast). (ii) From the retrieval module it is obtained the first five retrieved
images per case, these are used as recommended images. (iii) From the recommendation
module is obtained the updating of the retrieval matrix. The last layer is a Visualization
module, where the final user may access to the data.
Figure 3-5: Cim@lab PACS, Architecture
In this way, it is possible to recognize some of the functional and non-functional requirements
of the system, and with them to make a better structuring of the architecture and it is show
the use cases.
3.4.1. Use Case
From the use case diagram, it is possible to identify the actors of the system, this information
is very useful when identifying some of the stakeholders at the architectural level. Figure 3-6
presents the use case diagram and Table 3-4 shows the general description of each use case.

38 3 Interaction Model
Figure 3-6: Cim@lab PACS, Use Case diagram
Table 3-4: Use case General Description
USE CASE DESCRIPTION
NavigateThis enable the navigation of final user with a visual
summarization strategy, where he/she may choose a case of study.
Search
This allows to the final user search an specific
type of case by sex, modality, ID of the patient
and body organ
Image Visualization
User will access to image visualization from
the Search or Navigation. This may be useful
to change image contrast, brightness, zoom and panning.
RecommendationThis enable the user to see recommended
cases during Image Visualization user case
3.5. Results
It is described the workflow of the visualization approach, which is the opportunity of exploit
the information available in the database. This is resume in the navigation map 3-7 and
describe in the next steps:
The user may select if he/she wants to access information in the classic way (Availa-

3.5 Results 39
Figure 3-7: Cim@lab PACS, Navigation map.
ble Cases/Casos disponibles) or to explore the database (To explore PACS/Explorar
PACS). The first option was not widely cover because is the interaction paradigm
that usually is used in PACS. The second is the visualization of the whole framework,
illustrated in the screenshot 3-8.
The user choose which type of organ is looking for. This body parts are describe by
body part logo and later, these are fully connected in a network visualization. As it is
presented in the screenshot 3-9
The summarization network is shown in the screenshots 3-10 and 3-11. From this
step, the user might choose a single case to review.
The image can be modified in brightness,contrast and user may interact by using
panning and zooming options. 3-12 3-13
Figure 3-8: Cim@lab PACS, the user may select the experience type.

40 3 Interaction Model
Figure 3-9: Cim@lab PACS, the user may select which type of organ want to explore.
Figure 3-10: Cim@lab PACS, Summarization network of brain class.

3.5 Results 41
Figure 3-11: Cim@lab PACS, Zoom in to one group of the Brain cluster network.
Figure 3-12: The upper part of the Web application is the visualization of radiology cases
(images and metadata), and the inferior part are the recommended cases

42 3 Interaction Model
Figure 3-13: The user can take advantage of full screen image view, it is possible to change
intensity values and modify quality options for better diagnosis

4 Conclusions
The use of technology is currently paramount and transverse to any health institution. Today,
a large quantity of radiology images is daily produced in hospitals and medical centers for
diagnosis and therapy purposes [83]. Usually, these cases are stored in large repositories
known as PACS [74, 22]. This is a set of tools designed for receiving, storing and distributing
medical images using applications or web technologies in a computer network [14]. Specialist,
physicians and medical trainees interact with PACS using a PACS viewer. Current access to
valuable information in radiology image databases is limited to list of cases, then, knowledge
remains hidden since medical experts interact with these repositories at a very basic level.
This thesis introduce a complete framework to improve the interaction with large radiology
image collections. For this purpose, PACS benchmark fused to the user analysis gives a set
of good parameters to propose a solution. Then, the investigation of market, state of the art
and user interests were the starting point of each module herein proposed. This work aims
to integrate in a single and simple framework image classification, retrieval, recommendation
and visualization strategies. This complete interaction framework attempts to improve each
layer of a typical radiology PACS, facilitating the exploitation of the existent knowledge in
medical imaging databases. The visualization module is connected with a complete frame-
work to enhance the interaction of the final-user. This project archived the proposed goals
to develop a strategy that clusters and retrieves the images in a radiology dataset. It was
designed an approach that organized information inherit from the knowledge annotated in
the metadata, by using body organ data.
In general, computer-aided proposals for solving interaction in radiology systems are mainly
focused on one particular area or software layer: characterization, clustering, retrieval or
visualization. On the one hand, centering the attention in a single specific topic gives the
possibility to be specialized in one area and try to fully solve the precise problem. On the
other hand, the usual radiologist or medical doctors interaction with radiology systems will
involve all the software layers. This thesis proposal is looking to improve these challenges by
designing, implementing and validating several modules. This work had presented different
aspects that bring to the medical community a new tool to ameliorate their studies and
work. Some of the modules and features that distinguish our proposal from other works
are: (i) Closing some aspects in the existing gap between research products and potentially
commercial radiology system modules or applications; (ii) Our method introduces a step
forward on radiology training, evidence-based medicine and diagnosis. (iii) This tool exploits
hidden knowledge on the database with image visual similarities and organ-based search.

44 4 Conclusions
(iv) It is proposed a prototype of a functional web application that brings to the user an
alternative workflow in radiology systems; (v) This work is a simple framework that fuses
characterization and interaction strategies.
The characterization module present different features for describing MRIs of different pat-
hologies, adult and childish population, with noise artifacts as ghost like, black spaces and
blurring. Besides, the anatomical complexity of having different body parts, these features
are used for a retrieval and classification strategy. The clustering module is looking to classify
by organ the MRIs, while this problem has not been solved in the state of the art. Our pro-
posal determine automatically to which class belong each study of the dataset, being brain,
breast and column the clustering groups. One of our contributions in this area is the agility
to exploit different image characteristic like foreground histogram ,foreground convex hull
and foreground intensity values. Moreover, to the best of our knowledge, Random Forest
classifier has not been used for organ-based classification in MRIs. Results are above the
baseline and accuracy percentage is superior than 90 % . Other contribution of the classifi-
cation strategy is the use of a single method for three different type of cases in anatomical
terms but wide variability even intra-class. The classification module is a tool for radiologist
access information in one different way besides using patient id, sex or image modality.
The retrieval module introduce a similarity metric to determine the distance among cases
in the dataset. For the first five or ten retrieved cases, MAP rate are over 0,9. The retrie-
val task is successfully done and the metric works appropriately, results are lately used in
the interaction module. Moreover, this strategy considers the user interest recommending
radiology images using the visual features for the unregistered cases interactions. This CBIR
strategy is enrich with a recommendation module, that uses a CTR to define the most in-
teresting content for a user. These suggested images allow the user to identify cases that
probably he/she will never access once or again, if he/she have not search on purpose these
particular cases. As far as we know, a recommendation strategy in a radiology system for
education,clinic or mix purposes has not been previously presented.
In the end, a visualization module connect the complete framework. The integration is done
in one web application design that visually resumes the existent information. The propo-
sed architecture includes a simple user interface that allows users to interact with radiology
studies in the classic way and to explore with our proposal a new interaction framework.
Although the application is a prototype, it offers the possibility of working with different
images and it is flexible to develop more specialized systems. This project propose an specific
module for each challenging radiology software layer. It was archived the proposed objec-
tive to design strategies of image interaction in large medical databases that facilitate the
exploitation of the existent knowledge. If well this thesis findings are promising, this work
has challenges related to the automation in the middle slice selection; unification of imple-
mentation strategies because nowadays multiple tools that are used in order to perfomed
the complete framework (matlab, html, java, javascript). Other weakness of our method is
the missing use of medical doctors and radiologist for validate the complete framework. An

45
usability test for the strategy might be done in future work. To determine the relevancy in
daily practice of this work, a real user evaluation that involves, differences of time, facilities
and accuracy of our proposal with other tasks in the framework proposed
Future work for the complete framework is centered in test more data, with different radiology
modalities, organs and pathologies. Characterization section may be oriented to determine if
more features may describe in a most complete and discriminative way MRIs. Some authors
in classification state of the art report successful fusion of visual based information and
semantic data. Testing this approach in our work the accuracy percentage can be closer
to the 100 %. The retrieval strategy might have a wider number of options of search like
pathology, illness severity and customizable interests. For this to be able, collaborative work
might be done with specialist in each anatomical region; looking to determine the most
common pathologies, the best methods to identify those and all the computing mechanisms
that might be related to them. The visualization module can be improve, including different
types of gestures, weighted edges in the summarization strategy to visually identify the
relationship among cases.

5 Annexes
5.1. Features Distribution
Figure 5-1: Entropy Distribution Figure 5-2: Histogram Entropy Distribution
Figure 5-3: Mean Intensity Value Distribution Figure 5-4: Distance to Brain Template

5.1 Features Distribution 47
Figure 5-5: Distance to Breast Template Figure 5-6: Distance to Column Template
Figure 5-7: Major Axis Length Distribution Figure 5-8: Minor Axis Length Distribution
Figure 5-9: Orientation Distribution Figure 5-10: Eccentricity Distribution

Bibliografıa
[1] Abdul-Jauwad ; AlJaroudi: Developing a wireless DICOM for Osirix. En: Biome-
dical and Health Informatics, 2012 IEEE-EMBS International Conference on, 2012, p.
89–92
[2] Aizerman ; Braverman, Mark A. ; Rozonoer, Emmanuel M. ; I, Lev: Theoreti-
cal foundations of the potential function method in pattern recognition learning. En:
Automation and Remote Control 25 (1964)
[3] Arvind Vijayasarathi, Danny R. Hughes Mark E. Mullins Richard Duszak J.: How
much do common imaging studies cost? A nationwide survey of radiology trainees. En:
American Journal of Roentgenology (AJR) 205 (2015), Nr. 5, p. 929–35
[4] Avni, U. ; Greenspan, H. ; Sharon, M. ; Konen, E. ; Goldberger, J.: X-ray image
categorization and retrieval using patch-based visualwords representation. En: Biome-
dical Imaging: From Nano to Macro, 2009. ISBI ’09. IEEE International Symposium
on, 2009. – ISSN 1945–7928, p. 350–353
[5] Avni, U. ; Greenspan, H. ; Sharon, M. ; Konen, E. ; Goldberger, J.: X-ray image
categorization and retrieval using patch-based visual words representation. En: IEEE
Trans Med Imaging, 2011, p. 733–746
[6] Bakalar ; Whittick: Diagnostic imaging on demand, information management in-
sights based on canadian DI/EHR strategies. En: Computers in Cardiology, 2005, 2005,
p. 687–689
[7] Barnes, Connelly ; Shechtman, Eli ; Finkelstein, Adam ; Goldman, Dan B.:
PatchMatch: A Randomized Correspondence Algorithm for Structural Image Editing.
En: ACM Transactions on Graphics (Proc. SIGGRAPH) 28 (2009), August, Nr. 3
[8] Barnes, Connelly ; Shechtman, Eli ; Goldman, Dan B. ; Finkelstein, Adam:
The Generalized PatchMatch Correspondence Algorithm. En: European Conference on
Computer Vision, 2010
[9] Bernhard Preim, Dirk B. ; Gasbarrini, Tiffany (Ed.): Visualization in Medicine:
Theory, algorithms and applications. Morgan Kaufmann Publishers:El Sevier, 2007
[10] Breiman, Leo: Random Forests. En: Machine Learning Journal (2001)

Bibliografıa 49
[11] Cai, Tom W. ; Kim, Jinman ; Feng, David D.: 4 - Content-Based Medical Image
Retrieval. En: Feng, David D. (Ed.): Biomedical Information Technology. Burlington
: Academic Press, 2008 (Biomedical Engineering). – ISBN 978–0–12–373583–6, p. 83 –
113
[12] Caicedo, Juan ; Gonzalez, Fabio ; Romero, Eduardo: Content-based histopathology
image retrieval using a kernel-based semantic annotation framework. En: Journal of
Biomedical Informatics
[13] Carestream. Carestream Vue PACS. http://www.carestream.com/vue-pacs.html.
2015
[14] Chimmanee, Sanon ; Patpituck, Puttinun: PACS characteristic on wired-line and
wireless network for traffic simulation. En: Information Networking (ICOIN), 2013
International Conference on, 2013. – ISSN 1976–7684, p. 589–594
[15] Choi, Hyung S. ; Ro, Duk W.: Clinical implementation of Samsung Medical Center
PACS. En: Image Management and Communications, 1995., Proceedings of the Fourth
International Conference on, 1995, p. 14–19
[16] Clark K, Smith K et a.: The Cancer Imaging Archive (TCIA): Maintaining and
Operating a Public Information Repository. En: Journal of Digital Imaging 26 (2013),
Nr. 6, p. 1045–1057
[17] Corinna, Cortes ; Vladimir, Vapnik: Support-vector networks. En: Machine Learning
20 (1995), Nr. 3, p. 273–297. – ISSN 1573–0565
[18] Corporation, Novarad. NovaPACS. http://ww1.novarad.net/novapacs/. 2015
[19] Criminisi, A. ; Perez, P. ; Toyama, K.: Object removal by exemplar-based inpainting.
En: Computer Vision and Pattern Recognition, 2003. Proceedings. 2003 IEEE Computer
Society Conference on Vol. 2, 2003. – ISSN 1063–6919, p. II–721–II–728 vol.2
[20] dcm4chee.org. Open Source Clinical Image and Object Management.
www.dcm4che.org/. 2013
[21] Deepa, S. N. ; Devi, B. A.: A Survey on Artificial Intelligence Approaches for Medical
Image Classification. En: Indian Journal of Science and Technology 4 (2011), Nr. 11. –
ISSN 0974 –5645
[22] Dimitrovski, Ivica ; Kocev, Dragi ; Kitanovski, Ivan ; Loskovska, Suzana ;
Dzeroski, Saso: Improved medical image modality classification using a combina-
tion of visual and textual features. En: Computerized medical imaging and graphics :
the official journal of the Computerized Medical Imaging Society 39 (2015), Januar, p.
14–26. – ISSN 1879–0771

50 Bibliografıa
[23] Dong, Peng ; qin Gao, Zhi ; wu Li, Yao ; Zhu, Hong ; zhen Wang, Xi ; Wang,
Bin ; feng Long, Jin: The construction of medical imaging network teaching system
with the PACS in university. En: Systems and Informatics (ICSAI), 2012 International
Conference on, 2012, p. 1023–1025
[24] Drori, Iddo ; Cohen-Or, Daniel ; Yeshurun, Hezy: Fragment-based Image Com-
pletion. En: ACM SIGGRAPH 2003 Papers, ACM, 2003 (SIGGRAPH ’03). – ISBN
1–58113–709–5, p. 303–312
[25] Efros, A.A. ; Leung, T.K.: Texture synthesis by non-parametric sampling. En:
Computer Vision, 1999. The Proceedings of the Seventh IEEE International Conference
on Vol. 2, 1999, p. 1033–1038 vol.2
[26] Fariaa, Andreia V. ; Oishia, Kenichi ; Yoshidaa, Shoko ; Hillisb, Argye ; Millere,
Michael I. ; Moria, Susumu: Content-based image retrieval for brain MRI: An image-
searching engine and population-based analysis to utilize past clinical data for future
diagnosis. En: NeuroImage:Clinical 7 (2015), p. 367–376
[27] Fridell, Kent ; Aspelin, Peter ; Edgren, Lars ; Lindskold, Lars ; Lundberg,
Nina: PACS influence the radiographers work. En: Journal of Diagnostic Imaging and
Radiation Therapy 15 (2009), Nr. 2, p. 121 – 133. – ISSN 1078–8174
[28] na Fujifilm, Espa˙SYNAPSE (PACS). http://www.healthcare.siemens.com/medical-
imaging-it/imaging-it-radiology-image-management-pacs/syngoplaza
[29] Garber ; R, Sharon ; Grunes ; B, Mitch: The Art of Search: A Study of Art Directors.
En: Proceedings of the SIGCHI Conference, 1992 (CHI 92). – ISBN 0–89791–513–5, p.
157–163
[30] Genuer, Robin ; Poggi, Jean-Michel ; Tuleau-Malot, Christine ; Villa-
Vialaneix, Nathalie: Random forests and big data. En: 47‘eme JournA´ees de Sta-
tistique de la SFdS (2015)
[31] Ghanem ; Tawfik ; Owis: An Efficient Strategy for PACS. En: Biomedical Engineering
Conference, 2008. CIBEC 2008. Cairo International, 2008, p. 1–5
[32] Gopal, T V. ; Rani, P P. ; Kumar.K, Kranthi: Relevance feedback: A proposed
method for reducing semantic gap in content-based image retrieval using images with
relevance level. En: International Journal of Engineering Sciences Research 4 (2013),
Nr. 2, p. 842–850
[33] Greenspan, H. ; Pinhas, A. T.: Medical Image Categorization and Retrieval for PACS
Using the GMM-KL Framework. En: IEEE Transactions on Information Technology in
Biomedicine 11 (2007), March, Nr. 2, p. 190–202. – ISSN 1089–7771

Bibliografıa 51
[34] Guld, Mark O. ; Thies, Christian ; Fischer, Benedikt ; Lehmann, Thomas M.:
A generic concept for the implementation of medical image retrieval systems. En:
International Journal of Medical Informatics 76 (2007), p. 252–259
[35] Healthcare, GE. Centricity Radiology Mobile Access.
http://www.gehealthcare.com/en/products/categories/healthcare it medical imaging informatics -
ris-pacscvis/centricity radiology mobile access. 2014
[36] Hsu, William ; Antani, Sameer ; Long, L. R. ; Neve, Leif ; Thoma, George R.:
SPIRS: A Web-based image retrieval system for large biomedical databases. En: In-
ternational Journal of Medical Informatics 78, Supplement 1 (2009), p. S13 – S24. –
MedInfo 2007. – ISSN 1386–5056
[37] Image Information, Systems. iQ-WEBX. http://www.image-
systems.biz/en/products/iq-system-pacs/server-software/iq-webx.html. 2015
[38] Images, Raster. Oviyam, Web DICOM browser. 2013
[39] Infinitt. Infinitt PACS. www.infinitt.com/cms/products/radiology. 2014
[40] Jorge E. Camargo, Fabio A. G.: Multimodal image collection summarization using
non negative matrix factorization. En: Computing Congress (CCC), 2011 6th Colom-
bian, 2011, p. 1–6
[41] Jorritsma, Wiard ; Cnossen, Fokie: Merits of usability testing for PACS selection.
En: Int J Med Inform 83 (2014), p. 27–36
[42] K-PACS. K-PACS. http://www.k-pacs.net/. 2004
[43] Ka Ping Yee, Kirsten Swearingen et a.: Faceted Metadata for Image Search and
Browsing. En: CHI 2003,ACM University of California, 2003
[44] Kalpathy-Cramer, Jayashree [u. a.]: Evaluating performance of biomedical image
retrieval systems. (2015)
[45] Kalpathy-Cramer, Jayashree ; de Herrera, Alba GarcAa S. ; Demmer-Fushman,
Dina ; Antani, Sameer ; Bedrick, Steven ; Muller, Henning: Evaluating performan-
ce of biomedical image retrieval systems - An overview of the medial image retrieval
task at ImageCLEF 2004-2013. En: Computerized Medical Imaging and Graphics 39
(2015), p. 55–61
[46] Kangarloo, Hooshang: PACS Clinical Experience at UCLA. En: PACS in Medicine
Vol. 74. Springer Berlin Heidelberg, 1991. – ISBN 978–3–642–76568–1, p. 189–194

52 Bibliografıa
[47] Ko, Byoung C. ; Kim, Seong H. ; Nam, Jae-Yeal: X-ray Image Classification Using
Random Forests with Local Wavelet-Based CS-Local Binary Patterns. En: Journal of
Digital Imaging 24 (2011), Nr. 6, p. 1141–1151. – ISSN 1618–727X
[48] Kurtz C, Napel S Beaulieu CF Rubin D.: On combining image-based and ontological
semantic dissimilarities for medical image retrieval applications. En: Medical Image
Analysis, 2014
[49] Lehmann, T.M. ; Gult, M.O: Content based Image Retrieval in Medical Applications.
En: Methods Inf Med 43 (2004), Nr. 1, p. 354–361
[50] Lemke, Heinz ; Berliner, Leonard: PACS for surgery and interventional radiology:
Features of a Therapy Imaging and Model Management System (TIMMS). En: Eur J
Radiol 78 (2011), p. 239 – 242. – ISSN 0720–048X
[51] Li, Wei X. ; Lan, Yu D. ; Sheng, Zheng Z. ; Jian, Wang K.: A LAN System for
ECP Medical Center based on DICOM Communication Protocol. En: Complex Medical
Engineering, 2007. CME 2007. IEEE/ICME International Conference on, 2007, p. 299–
302
[52] Liu, Ying ; Zhang, Dengsheng ; Lu, Guojun ; Ma, Wei-Ying: A survey of content-
based image retrieval with high-level semantics. En: Pattern Recognition 40 (2007), Nr.
1, p. 262–282. – ISSN 0031–3203
[53] Long LR, Antani S et a.: Biomedical Information from a National Collection of Spine
X-Rays: Film to Content Based Retrieval. En: Proc. of SPIE Medical Imaging: PACS
and Integrated Medical Information Systems 5033 (2003), p. 70–84
[54] Lucie Brazeau-lamontagne, Robert Gagnon Louise Samson Cees Van Deer V.:
Measurement of perception and interpretation skills during radiology training:utility of
the script concordance approach. En: Medical Teacher 26 (2004), Nr. 4, p. 71–86
[55] Martinez, Wendy L.: Graphical user interfaces. En: Wiley Interdisciplinary Reviews:
Computational Statistics Vol. 3, 2011, p. 119–133
[56] Mathworks. Random Forest Classifier, Matlab implementation. 2012
[57] Kap. 19 In: Muller, Henning ; Deserno, Thomas M.: Content Based Medical Image
Retrieval. Biomedical Image Processing, 2011 (Biological and Medical Physics, Biome-
dical Engineering), p. 471–494. – ISBN 978–3–642–15815–5
[58] Muller, Henning ; N, Michoux ; D, Bandon ; A., Geissbuhler:
[59] Niranjan J. Chatap, Ashish Kr. S.:
Bibliografıa 53
[60] Pare, Guy ; Aubry, David ; Lepanto, Luigi ; Sicotte, Claude: Evaluating PACS
Success: A Multidimensional Model. En: Proceedings of the 38th Annual Hawaii Inter-
national Conference on, 2005. – ISSN 1530–1605
[61] Paxeramed, Corporation. iPaxera PACS Viewer. http://paxeramed.com/ipaxera.
2014
[62] Pixmeo. OsirixHD. https://itunes.apple.com/co/app/osirix-hd/id419227089?mt=8.
2011
[63] or Radiology, American C. ACR-Radiology Assessment and Review. Google Play
Store. 2014
[64] of Radiology, European S.: The Story of Radiology. (2012)
[65] Rajaei, A. ; Dallalzadeh, E. ; Rangarajan, L.: Symbolic features for classification
of medical X-ray body organ images. En: Hybrid Intelligent Systems (HIS), 2012 12th
International Conference on, 2012, p. 378–383
[66] Rosset, Antoine ; Spadola, Luca ; Ratib, Osman: OsiriX: An Open-Source Software
for Navigating in Multidimensional DICOM Images. En: J Digit Imaging 17 (2004),
Nr. 3, p. 205–216. – ISSN 0897–1889
[67] the Royal Melbourne Hospital. MOBILE PACS VIEWER (RMH ZedLink).
http://www.mh.org.au/royal melbourne hospital/www/353/1001127/displayarticle/1037183.html.
2012
[68] Shi, Wenzhe ; Caballero, Jose ; Ledig, Christian ; Zhuang, Xiahai ; Bai, Wenjia ;
Bhatia, Kanwal ; de Marvao, AntonioMSimoesMonteiro ; Dawes, Tim ; ORegan,
Declan ; Rueckert, Daniel: Cardiac Image Super-Resolution with Global Corres-
pondence Using Multi-Atlas PatchMatch. En: Mori, Kensaku (Ed.) ; Sakuma, Ichiro
(Ed.) ; Sato, Yoshinobu (Ed.) ; Barillot, Christian (Ed.) ; Navab, Nassir (Ed.): Me-
dical Image Computing and Computer-Assisted Intervention MICCAI 2013 Vol. 8151.
Springer Berlin Heidelberg, 2013. – ISBN 978–3–642–40759–8, p. 9–16
[69] Shi, Wenzhe et a.: Multiatlas Spectral PatchMatch:x Application to Cardiac Image
Segmentation. En: et al., Golland (Ed.): Medical Image Computing and Computer
Assisted Intervention MICCAI 2014 Vol. 8673. Springer International Publishing, 2014,
p. 348–355
[70] Siemens. Syngo.Plaza. http://www.healthcare.siemens.com/medical-imaging-
it/imaging-it-radiology-image-management-pacs/syngoplaza. 2014
[71] Silva, Bastiao ; Costa ; Silva ; Oliveira: A PACS Gateway to the Cloud. En:
Information Systems and Technologies, 2011 6th Iberian Conference on, 2011, p. 1–6

54 Bibliografıa
[72] StatPearls Publishing, LLC. Radiology Musculoskeletal. Google Play Store. 2016
[73] Subramaniam, Rathan M. ; Kim, Choyee ; Scally, Peter ; Tress, Brian: Medi-
cal Student Radiology Training: What are the Objectives for Contemporary Medical
Practice? En: Academic Radiology 10 (2003), Nr. 3, p. 295 – 300. – ISSN 1076–6332
[74] Thomee, Bart ; S.Lew, Michael: Interactive search in image retrieval. En: Int J
Multimed Inf Retr 1 (2012), p. 71–86
[75] Thomee, Bart ; S.Lew, Michael: Interactive search in image retrieval. En: Internatio-
nal Journal of Multimedia Information Retrieval 1 (2012), p. 71–86
[76] Valente F, Silva A.: Dicoogle, a Pacs Featuring Profiled Content Based Image Re-
trieval. En: Benos PV, ed. PLoS ONE 8 (2013), Nr. 5
[77] de Ves, E ; Domingo, J ; Ayala, G ; Zuccarello, P: A novel Bayesian framework
for relevance feedback in image content-based retrieval systems. En: Pattern Recognition
39 (2006), Nr. 9, p. 1622–1632. – ISSN 0031–3203
[78] Wang, Xi-Zhen ; Shen, Zhen ; Dong, Peng ; wu Li, Yao ; Wang, Bin ; xiang Chen,
Jun ; feng Long, Jin ; quan Sun, Ye: Using the imaging network teaching system
based on PACS in improvement of teaching effect in medical imaging. En: Systems and
Informatics (ICSAI), 2012 International Conference on, 2012, p. 1043–1045
[79] Wang, Xiang-Yang ; Li, Yong-Wei ; Yang, Hong-Ying ; Chen, Jing-Wei: An image
retrieval scheme with relevance feedback using feature reconstruction and SVM reclas-
sification. En: Neurocomputing 127 (2014), Marz, p. 214–230. – ISSN 09252312
[80] Wang, Xiang-Yang ; Yang, Hong-Ying ; Li, Yong-Wei ; Li, Wei-Yi ; Chen, Jing-
Wei: A new SVM-based active feedback scheme for image retrieval. En: Engineering
Applications of Artificial Intelligence 37 (2015), Januar, p. 43–53. – ISSN 09521976
[81] Yushi Jing, Henry A. Rowley et a.: Google Image Swirl: A Large Scale Content Based
Image Visualization System. En: WWW2012, 2012
[82] Zaboli, S. ; Tabibiazar, A. ; Fieguth, P.: Organ Recognition Using Gabor Filters.
En: Computer and Robot Vision (CRV), 2010 Canadian Conference on, 2010, p. 94–100
[83] Zare, M. R. ; Mueen, A. ; Seng, W. C.: Automatic classification of medical X-ray
images using a bag of visual words. En: IET Computer Vision 7 (2013), April, Nr. 2,
p. 105–114. – ISSN 1751–9632