Impacts of climate change for Swiss winter and summer tourism: a general equilibrium ... ·...
31
Impacts of climate change for Swiss winter and summer tourism: a general equilibrium analysis Boris Thurm a,* , Marc Vielle a , Frank V ¨ ohringer b,a a LEURE Laboratory, Swiss Federal Institute of Technology at Lausanne (EPFL), CH-1015 Lausanne, Switzerland. b Econability, Fischermatt 12, CH-3127 M¨ uhlethurnen, Switzerland. Abstract Tourism could be greatly affected by climate change due to its strong dependence on weather. In Switzerland, the sector represents an appreciable share of the econ- omy. Thus, studying climate effects on tourism is necessary for developing ade- quate adaptation strategies. While most of the studies focused on winter tourism, we investigate the climate change impacts on both winter and summer tourism in Switzerland. Using a computable general equilibrium (CGE) model, we simu- late the impacts of temperature increase and snow decrease for climate scenarios A1B and RCP3PD. Our findings show that climate change has a positive effect on the Swiss tourism industry. Alpine resorts could adapt by developing their sum- mer tourism offer. However, impacts are differentiated. While low-altitude ski resorts are more vulnerable to a snow decrease, high-altitude resorts benefit from their comparative advantage with respect to lower resorts in Switzerland and in Europe. Keywords: Tourism, climate change, adaptation, Switzerland, computable general equilibrium model 1. Introduction For Switzerland as for other continental regions, climatologists expect a tem- perature increase much higher than the global average. Even up to 2011, Switzer- land has experienced an increase by 1.7° C since the beginning of institutionalized * Corresponding author Email addresses: [email protected] (Boris Thurm), [email protected] (Marc Vielle), [email protected] (Frank V ¨ ohringer) Preprint submitted to EAERE 23rd Annual Conference May 22, 2017
Transcript of Impacts of climate change for Swiss winter and summer tourism: a general equilibrium ... ·...

Impacts of climate change for Swiss winter and summertourism: a general equilibrium analysis
Boris Thurma,∗, Marc Viellea, Frank Vohringerb,a
aLEURE Laboratory, Swiss Federal Institute of Technology at Lausanne (EPFL), CH-1015Lausanne, Switzerland.
bEconability, Fischermatt 12, CH-3127 Muhlethurnen, Switzerland.
Abstract
Tourism could be greatly affected by climate change due to its strong dependenceon weather. In Switzerland, the sector represents an appreciable share of the econ-omy. Thus, studying climate effects on tourism is necessary for developing ade-quate adaptation strategies. While most of the studies focused on winter tourism,we investigate the climate change impacts on both winter and summer tourismin Switzerland. Using a computable general equilibrium (CGE) model, we simu-late the impacts of temperature increase and snow decrease for climate scenariosA1B and RCP3PD. Our findings show that climate change has a positive effect onthe Swiss tourism industry. Alpine resorts could adapt by developing their sum-mer tourism offer. However, impacts are differentiated. While low-altitude skiresorts are more vulnerable to a snow decrease, high-altitude resorts benefit fromtheir comparative advantage with respect to lower resorts in Switzerland and inEurope.
Keywords: Tourism, climate change, adaptation, Switzerland, computablegeneral equilibrium model
1. Introduction
For Switzerland as for other continental regions, climatologists expect a tem-perature increase much higher than the global average. Even up to 2011, Switzer-land has experienced an increase by 1.7° C since the beginning of institutionalized
∗Corresponding authorEmail addresses: [email protected] (Boris Thurm), [email protected]
(Marc Vielle), [email protected] (Frank Vohringer)
Preprint submitted to EAERE 23rd Annual Conference May 22, 2017

temperature measurements in 1864, while the average on-land warming in thenorthern hemisphere amounted to 1.1° C (Perroud and Bader, 2013). Under thesecircumstances, it is necessary to inquire about climatic effects in Switzerland andtheir economic magnitude. Understanding these effects is a prerequisite for devel-oping adequate adaptation strategies, with the objective to reduce damages and toreap opportunities of climate change. Despite this, there has been limited researchthat would include attempts for monetization over a long period of time. One ofthe reasons is the complexity and heterogeneity of the subject.
In this study, we focus on tourism for two main reasons. First, the tourismindustry is highly dependent on weather and climate. Thus, climate change couldparticularly affect the sector. Second, tourism represents an appreciable part ofthe Swiss economy, accounting for about 3% of GDP and employing 4.4% of thetotal workforce, with high regional disparity (Baumann and Schiess, 2008). Inthe canton of Graubunden, for instance, tourism accounts for around 3.3 billionSwiss francs (CHF) per year, just over 30% of GDP, and 30% of employment(Bergwelten 21/GRF Davos, 2015). In Valais, it represents about 25% of GDPand 30% of employment (Serquet and Rebetez, 2011).
Previous studies focused mainly on winter tourism and have shown that in-ternational effects might have a greater impact than domestic effects of climatechange (Ecoplan/Sigmaplan, 2007; Faust et al., 2012). In this paper, we expandthe analysis to summer tourism. The aim is to investigate the international effectsof climate change on winter and summer tourism in Switzerland.
The rest of the paper is organized as follows. We present an overview of theexisting literature in section 2 and the model used in 3. In section 4, we detailthe socio-economic and climate scenarios used and how they are implemented inthe model. In section 5, we present and discuss the results obtained. Finally, weconclude in section 6.
2. Literature-based assessment of climate change impacts on Swiss tourism
2.1. Climate change impacts on winter tourismIn Switzerland, previous studies assessing climate change impacts have fo-
cused on winter tourism since the sector seems particularly affected. Indeed, ris-ing temperature will decrease snow precipitation, restricting the number of snow-reliable ski areas (CH2014-Impacts, 2014). It will be more difficult to operateglacier ski runs because of changes in glacial routes and an increase in naturalhazard (rockfalls) due to permafrost melting (NELAK, 2013). Thus, many skiresorts are going to face serious challenges, including a shorter business season
2

(CH2014-Impacts, 2014; Klein et al., 2016). Meier (1998), who was the first tostudy the economic impacts of climate change on Swiss alpine tourism, estimateda cost between CHF 1.8 and 2.3 billion in 2050, using the simplifying assumptionthat value added would drop by 30%. Several studies also highlight the greatervulnerability of lower ski areas (Koenig and Abegg, 1997; Muller and Friedli,2007; Gonseth, 2013; CH2014-Impacts, 2014; Abegg et al., 2013). However,Swiss winter tourism could benefit from climate change if international effects aretaken into account. Indeed, Switzerland has more snow-reliable ski fields than itsneighbouring countries, and thus international tourist flows may increase in Swissski resorts. For example, Faust et al. (2012) find a welfare gain of 83 million CHFin 2050 using a CGE framework. Higher snowmaking investments could alsolower the sensitivity of skier visits to natural snow conditions (Gonseth, 2013).However, snowmaking requires large amounts of water and energy, and its eco-nomic and technical viability is not ensured in a future warmer climate. Hence,ski resorts might consider other adaptation measures, such as the promotion ofsummer tourism.
2.2. Climate change impacts on summer tourismTourism could benefit from a longer summer season. The emergence of new
lakes in the alpine regions, the development of new via ferratas and trails due toglacier retreat and an improvement of the thermal comfort could make Switzer-land more attractive (Matasci, 2010; NELAK, 2013). Moreover, since valleys aretoo hot during heat waves, tourists seek refuge at higher altitudes (Bergwelten21/GRF Davos, 2015). Recent cantonal studies have provided new informationabout the economic impacts of climate change at the regional level. They showthat the gains for summer tourism could offset part of the losses for winter tourism.For example in the canton of Graubunden, the reduction of snow cover could costbetween CHF 12 and 25 million in 2060 while frequent heat waves could benefitsummer tourism, with an expected gain between CHF 1 and 5 million in 2060.The projected cost and gain are even larger in Ticino. The change in precipita-tion regime could cost between CHF 24 and 97 million, while heat waves couldgenerate a gain between CHF 11 and 45 million in 2060 (IFEC/Bergwelten 21/In-novaBridge/Consavis/RIBO architecture, 2016).
3

3. Model
3.1. DescriptionThe GEMINI-E3 model is a multi-sectoral multi-regional recursive-dynamic
general equilibrium model (Bernard and Vielle, 2008). It has been used widely forthe analysis of energy and climate-related issues, including: an assessment of theimpact of a warming climate on energy consumption in buildings for Switzerland(Winkler et al., 2014), as well as an analysis of the impact of climate change onheating and cooling on a global level (Labriet et al., 2015). Coupled with a geo-graphical information system, GEMINI-E3 has helped assess economic impactsof sea level rise (Joshi et al., 2016). It has also been further developed to analyzethe impact of climate change in Switzerland for the water, tourism, energy andagriculture sectors (Faust et al., 2015; Gonseth et al., 2017). We extend and up-date the model to assess the impacts of climate change on both winter and summertourism.
GEMINI-E3 is built on the energy disaggregated input-output table of Nathaniet al. (2011) for Switzerland, and on the GTAP-8 dataset (B. Narayanan et al.,2012) for the other regions of the world. The regional and industrial classificationsused are specified in the table 1.
Table 1: GEMINI-E3 classificationsRegional
Switzerland (CH) Other OCDE countries (OECD)European Union (EU) Brazil, Russia, India, China (BRIC)United States of America (USA) Rest of the World (ROW)
Industrial
Coal Transport necOil Sea TransportNatural Gas Air TransportPetroleum Product InsuranceElectricity HealthPublic Heat Supply Other ServicesGrain Soys Winter Overnight TourismOther Crops One-Day Winter TourismAnimal Other Form of TourismForestry WaterIndustry
4

3.2. Modeling tourismSince the tourism sector is not included in the standard version of GEMINI-E3,
it was necessary to create and incorporate it into the model. Doing so, we sepa-rated the snow-dependent winter tourism activities from the rest of the tourismactivities, thereby creating two tourism segments for each region of the model. Inthe following, the two segments are referred to as the “winter sports” and “otherforms of tourism” (OFT) segments. The latter segment represents mainly “sum-mer tourism”.
In addition, the Swiss winter sports segment was split into two segments:“(snow-dependent) winter overnight tourism” (WOT) and “(snow-dependent) one-day winter tourism” (ODT). The former segment represents the part of winteralpine tourism whose production is intended for skiers generating one or severalovernight stays. The latter segment complements the first one. Since the distri-bution of overnight and one-day ski tourists varies strongly across regions, thedifference between the two segments has also a geographical interpretation uponwhich we rely for drawing insights and conclusions. Figures 1 and 2 show thatone-day ski tourists mostly go skiing in lower lying ski areas located near city cen-ters whereas overnight ski tourists predominate in higher lying ones. Therefore,the ODT segment is more representative for the lower and medium ski resorts,and the WOT segment for the higher lying ski resorts.
Figure 1: Regional weights used in the one-day winter tourism sector
5

Figure 2: Regional weights used in the winter overnight tourism sector
The winter sports segment only accounts for 12% of the overall Swiss tourismrevenues. This is due to the OFT segment including a very large spectrum oftourism activities, namely tourism activities that take place in rural and urbanareas as well as summer and snow-independent winter tourism activities in alpineregions. Moreover, we build our work on a broad definition of tourism, i.e. thedefinition set by the UN World Tourism Organization (OMT, 1994) and used innational accounting.
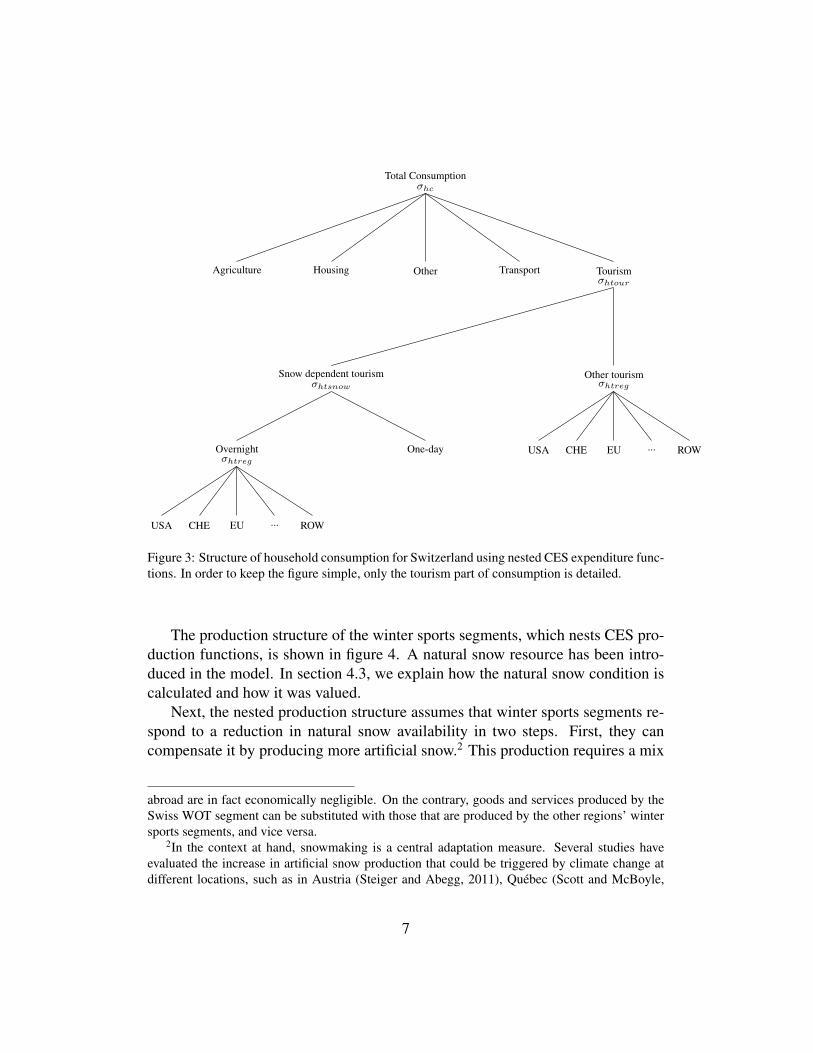
As shown in figure 3, the goods produced by the WOT segment and the ODTsegment are substitutes in the Swiss consumer’s utility function. By combiningthe consumption of these two goods, Swiss consumers determine their final con-sumption of winter sports activities. At the higher node level, consumers substi-tute between their consumption of winter sports activities and their consumptionof other tourism activities. Our quantitative assumptions regarding possibilitiesfor consumers to substitute one tourism segment for another are given in table 2.Figure 3 also shows that goods and services produced in the different regions ofthe model by the same tourism segment are substitutes.1
1Note though that the WOT and ODT segments defined for Switzerland have no direct coun-terparts in the other regions of the model. In the case of the ODT segment, we assume no foreigntrade. For this segment, consumptions by foreign residents in Switzerland or by Swiss residents
6
Total Consumptionσhc
Agriculture Housing Other Transport Tourismσhtour
Other tourismσhtreg
Snow dependent tourismσhtsnow
USA CHE EU ... ROWOne-dayOvernightσhtreg
USA CHE EU ... ROW
Figure 3: Structure of household consumption for Switzerland using nested CES expenditure func-tions. In order to keep the figure simple, only the tourism part of consumption is detailed.
The production structure of the winter sports segments, which nests CES pro-duction functions, is shown in figure 4. A natural snow resource has been intro-duced in the model. In section 4.3, we explain how the natural snow condition iscalculated and how it was valued.
Next, the nested production structure assumes that winter sports segments re-spond to a reduction in natural snow availability in two steps. First, they cancompensate it by producing more artificial snow.2 This production requires a mix
abroad are in fact economically negligible. On the contrary, goods and services produced by theSwiss WOT segment can be substituted with those that are produced by the other regions’ wintersports segments, and vice versa.
2In the context at hand, snowmaking is a central adaptation measure. Several studies haveevaluated the increase in artificial snow production that could be triggered by climate change atdifferent locations, such as in Austria (Steiger and Abegg, 2011), Quebec (Scott and McBoyle,
7
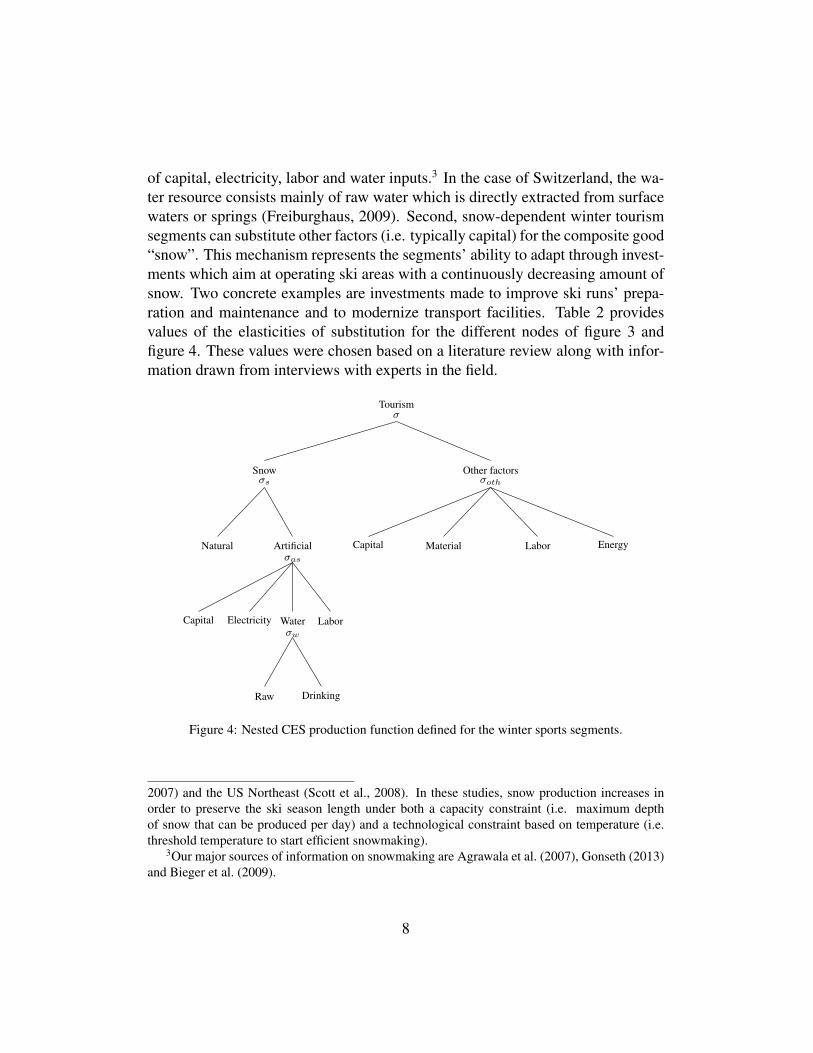
of capital, electricity, labor and water inputs.3 In the case of Switzerland, the wa-ter resource consists mainly of raw water which is directly extracted from surfacewaters or springs (Freiburghaus, 2009). Second, snow-dependent winter tourismsegments can substitute other factors (i.e. typically capital) for the composite good“snow”. This mechanism represents the segments’ ability to adapt through invest-ments which aim at operating ski areas with a continuously decreasing amount ofsnow. Two concrete examples are investments made to improve ski runs’ prepa-ration and maintenance and to modernize transport facilities. Table 2 providesvalues of the elasticities of substitution for the different nodes of figure 3 andfigure 4. These values were chosen based on a literature review along with infor-mation drawn from interviews with experts in the field.
Tourismσ
Other factorsσoth
Snowσs
Natural Artificial Capital EnergyMaterial Laborσas
Capital Electricity Water Laborσw
Raw Drinking
Figure 4: Nested CES production function defined for the winter sports segments.
2007) and the US Northeast (Scott et al., 2008). In these studies, snow production increases inorder to preserve the ski season length under both a capacity constraint (i.e. maximum depthof snow that can be produced per day) and a technological constraint based on temperature (i.e.threshold temperature to start efficient snowmaking).
3Our major sources of information on snowmaking are Agrawala et al. (2007), Gonseth (2013)and Bieger et al. (2009).
8

Eventually, it is worth noting that the two Swiss winter sports segments presenta different profile in relation to climate change. As regards exposure, climatechange impacts in terms of reduced snow endowment will be different for the twosegments as shown in table 7 in the result section 5.1. Moreover, adaptive capac-ity across segments also differs. It is more difficult to produce artificial snow atlower and medium elevated ski resorts than at higher elevation sites because ofshorter and less frequent periods with low temperatures. We translate this differ-ence in adaptive capacity by using two segment-specific elasticities of substitutionbetween the natural and artificial snow (cf. table 2).
Table 2: Elasticities of substitution defined for the tourism sector.Production function (winter sports segments)
Snow and other factors σ 0.1Natural and artificial snow (WOT) σs 0.9Natural and artificial snow (ODT) σs 0.45Among inputs used to produce artificial snow σas 0.3Industrial and drinking water σw 0.5
Household consumption
Aggregated goods σhc 0.4OFT and winter sports σhtour 0.7WOT and ODT σhtsnow 0.5Domestic and foreign tourism σhtreg 3
4. Scenarios and data
4.1. Baseline socio-economic scenarioTo simulate the evolution of the economy, GEMINI-E3 uses projections of
population growth, GDP and energy prices, as well as assumptions on electricitygeneration.
We use the projection for the Swiss population as defined by the A-00-2015scenario from the Federal Office of Statistics (Federal Office of Statistics, 2015).In this publication the population is projected up to 2045. Since the time horizonof our study is 2060, we extrapolate the population up to 2060 by assuming thatits growth rate between 2045-2060 will be same as the one projected for the pe-riod 2040-2045 (i.e. 0.27% per year). Table 3 gives the projection of the Swisspopulation. In 2060, 10.6 million inhabitants are projected to live in Switzerland.
9
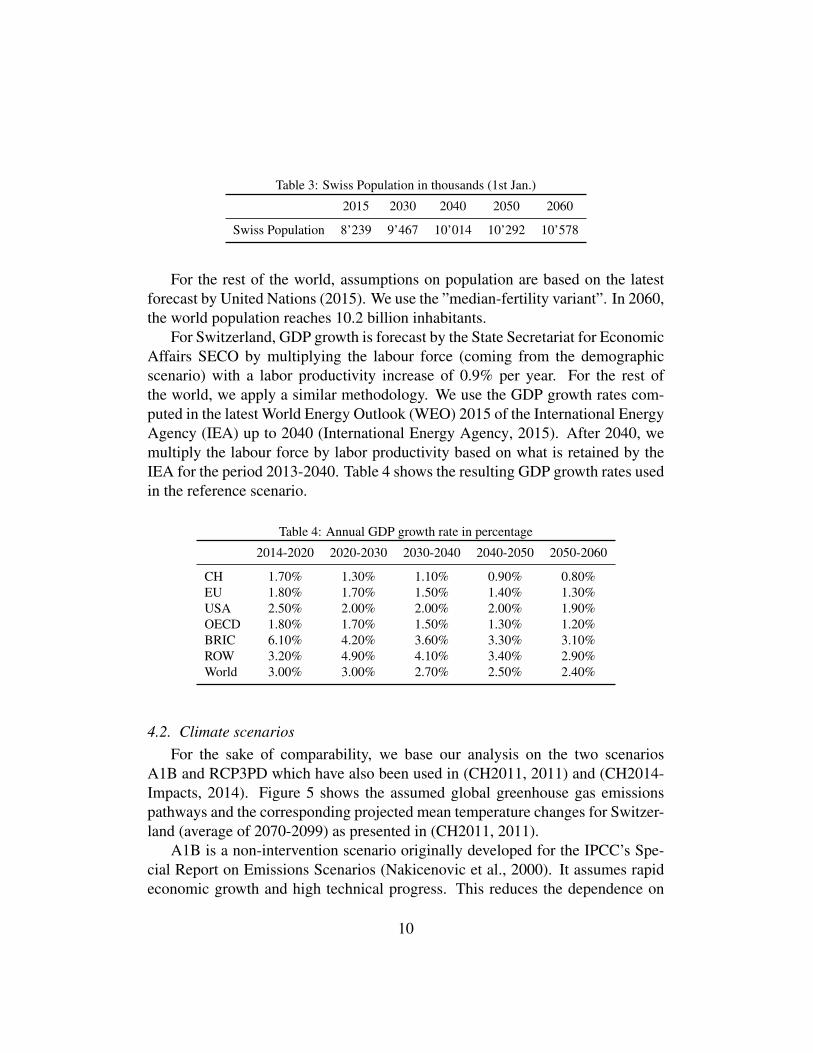
Table 3: Swiss Population in thousands (1st Jan.)
2015 2030 2040 2050 2060
Swiss Population 8’239 9’467 10’014 10’292 10’578
For the rest of the world, assumptions on population are based on the latestforecast by United Nations (2015). We use the ”median-fertility variant”. In 2060,the world population reaches 10.2 billion inhabitants.
For Switzerland, GDP growth is forecast by the State Secretariat for EconomicAffairs SECO by multiplying the labour force (coming from the demographicscenario) with a labor productivity increase of 0.9% per year. For the rest ofthe world, we apply a similar methodology. We use the GDP growth rates com-puted in the latest World Energy Outlook (WEO) 2015 of the International EnergyAgency (IEA) up to 2040 (International Energy Agency, 2015). After 2040, wemultiply the labour force by labor productivity based on what is retained by theIEA for the period 2013-2040. Table 4 shows the resulting GDP growth rates usedin the reference scenario.
Table 4: Annual GDP growth rate in percentage
2014-2020 2020-2030 2030-2040 2040-2050 2050-2060
CH 1.70% 1.30% 1.10% 0.90% 0.80%EU 1.80% 1.70% 1.50% 1.40% 1.30%USA 2.50% 2.00% 2.00% 2.00% 1.90%OECD 1.80% 1.70% 1.50% 1.30% 1.20%BRIC 6.10% 4.20% 3.60% 3.30% 3.10%ROW 3.20% 4.90% 4.10% 3.40% 2.90%World 3.00% 3.00% 2.70% 2.50% 2.40%
4.2. Climate scenariosFor the sake of comparability, we base our analysis on the two scenarios
A1B and RCP3PD which have also been used in (CH2011, 2011) and (CH2014-Impacts, 2014). Figure 5 shows the assumed global greenhouse gas emissionspathways and the corresponding projected mean temperature changes for Switzer-land (average of 2070-2099) as presented in (CH2011, 2011).
A1B is a non-intervention scenario originally developed for the IPCC’s Spe-cial Report on Emissions Scenarios (Nakicenovic et al., 2000). It assumes rapideconomic growth and high technical progress. This reduces the dependence on
10

Figure 5: Pathways of past and future anthropogenic greenhouse gas emissions and projectedannual mean warming for Switzerland for the 30-year average centered at 2085. Source: (CH2011,2011)
fossil fuel and slows down population growth in the second half of the century.The RCP3PD scenario originates from the more recent Representative Concentra-tion Pathways (RCP) family of scenarios, which were used for the simulations ofthe IPCC’s 5th Assessment Report (Stocker et al., 2014). RCP3PD is an ambitiousclimate mitigation scenario, which has a 2/3 likelihood of limiting global warmingto 2°C above the preindustrial level. To allow for a meaningful CGE analysis, thebasic socioeconomic assumptions in GEMINI-E3 are not modified between sce-narios and remain in accordance with the reference case described in section 4.1.This can be viewed as an inconsistency with the IPCC’s SRES approach, but it isnecessary to avoid that differences in results arise mainly because of differencesin socioeconomic assumptions rather than due to the impacts of climate changewhich we are interested in.
4.3. Winter tourismClimate change affects the natural snow conditions used as a production fac-
tor in winter tourism sectors (see Figure 4). We calculate the variation in snowendowment using the variable “Fractional Snow Cover” from ENSEMBLES4 andCORDEX5 projects. These projects provide results of Regional Climate Mod-
4http://ensembles-eu.metoffice.com/data.html5http://www.cordex.org/
11

els (RCMs) simulations, respectively for IPCC SRES and RPC scenarios. Weget monthly data until 2100 at a regional scale from 4 RCMs for the A1B sce-nario (C4I, DMI, KNMI, SMHI) and 2 RCMS for the RCP3PD scenario (KNMI,SMHI). We extract data for Switzerland, Germany, Austria, France and Italy re-gions and aggregate them at GEMINI-E3 level (Switzerland and Europe). To dothat, each point of the grid is weighted according to the length of ski runs (weightscalculated by Faust et al. (2012)). For Switzerland, we also separate between one-day and overnight tourists. While overnight skiers prefer higher altitude remoteregions, one-day skiers mainly go to ski resorts that are close to cities, as illus-trated in Figures 1 and 2. We assume that the regional weights are constant intime, i.e. we do not consider adaptation measures such as closing, expanding oropening ski resorts.
Then, we aggregate monthly snow cover into annual data, giving weights towinter season months based on the distribution of ski lift revenue (Faust et al.,2012). We assume these weights are constant, i.e. we assume skiers do not changetheir behavior.
Table 5: Weights assigned to the winter season months.November December January February March April
0.03 0.17 0.25 0.35 0.15 0.05Note: weights are equal to zero for the other months.
The regional and time aggregation give the annual fractional snow cover forSwitzerland (winter overnight and one-day tourism) and Europe for each RCMand scenario (models C4I, DMI, KNMI, SMHI for A1B scenario and KNMI,SMHI for RCP3PD scenario). Next, we calculate the snow cover variations com-pared to the reference year 2010. For example, for winter overnight tourism(WOT) in Switzerland, for model C4I and scenario A1B, we have:
%V ariationFNS =FNSCH WOT,A1B,C4I,Y ear − FNSCH WOT,A1B,C4I,2010
FNSCH WOT,A1B,C4I,2010
where FNS stands for the fractional snow cover. The results from different modelsfor 2030, 2050, 2070 and 2090 for the Swiss winter overnight sector are presentedin figures 6 and 7, including the model average, which we base our simulations on.Results for the Swiss one-day tourism sector and Europe are presented in figuresA.1, A.2, A.3 and A.4 of the appendix.
The natural snow resource is given an economic value based on results ob-tained in Gonseth (2013). He analyzes the marginal effects of snow conditions on
12

Figure 6: Snow cover variation of the Swiss WOT sector with respect to 2010 under A1B scenario
skiers visits and hotel overnight stays at the ski resort level. We use the econo-metric estimates of these effects in order to extrapolate, for the two Swiss wintertourism segments, the seasonal profit that is generated on average due to the cur-rent natural snow conditions. We mainly use data provided by the Swiss NationalTourist Office. More information about the methods and data used are availablein Faust et al. (2012) and Gonseth (2013).
Since we lack data to estimate the snow variations outside Europe, we simulateclimate scenarios A1B and RCP3PD assuming three alternative snow variationsoutside Europe:
• In a first case, we assume that ski resorts outside Europe would not be im-pacted by climate change. This represents the worst case for winter tourismsectors in Europe;
• In the second case, non-European regions are supposed to be affected byclimate change. We assume that the reduced snow resources roughly cor-respond to the ones computed for the EU (respectively -4% in RCP3PDscenario and -20% in A1B scenario)
• In the last case, reduced snow resources are equal to 50% of the variationused in the previous case.
13

Figure 7: Snow cover variation of the Swiss WOT sector with respect to 2010 under RCP3PDscenario
Finally, for scenario A1B we simulate two cases, namely with and without changesin artificial snowmaking, to show the impacts of technical adaptation measures.Climate change will put additional constraints on artificial snow, since its produc-tion requires cold temperature, water and energy. The scenario without snowmak-ing represents, however, a kind of worst case scenario with a disputably assumedabsence of a particular form of technical adaptation.
4.4. Summer tourismNext, we generate inputs for the GEMINI-E3 model concerning variations in
summer tourism flows. For this, we use the Hamburg Tourism Model (HTM) de-veloped by Hamilton et al. (2005)6. The purpose of the model is to understandhow the current pattern of tourism flows may change under scenarios of futurepopulation growth, economic growth and climate change. It calculates domes-tic tourists flows, international arrivals and departures for 207 countries. Sincesummer tourism dominates winter tourism in most countries, HTM is calibratedon summer tourism. Results from the model have already been implemented in
6A detailed description of the model, related publications as well as the model code can befound on the model webpage https://www.fnu.zmaw.de/index.php?id=5681
14

CGE models to analyze scenarios of climate change and climate policies (Berrit-tella et al., 2006; Bosello et al., 2012). More information about the model, itslimitations and the source of the dataset is available in Hamilton et al. (2005) andBigano et al. (2007).
In the HTM model, the climatic variable of interest is the global mean temper-ature, which is then down-scaled to national means. Temperature change affectscountries’ attractiveness causing a reallocation of tourism flows between coun-tries. We obtain simulations of global mean temperature from the IPCC DataDistribution Center for the A1B scenario and from the CMIP5 data archive for theRCP3PD scenario. We use the average global mean temperature simulated by 14General Circulation Models (GCM) for the A1B scenario and by 32 GCMs forthe RCP3PD scenario.
For each scenario, tourism flows (domestic, departures and arrivals) for allcountries are simulated and then aggregated by GEMINI-E3 regions. Apart fromclimate issues, total number of tourists also depends on population and GDPgrowth in the HTM model. To allow comparisons between climate change sce-narios A1B and RCP3PD, we remove the socioeconomic effects by keeping thetotal flows of tourists constant when implementing tourism flows variations inGEMINI-E3. To do that, we calculate the variations of tourists with respect to thesame scenario without climate change. For example, let CHA1B,Y ear be domestictourism in Switzerland for the scenario A1B in a given year, we have:
%V ariationCHA1B,Y ear =CHA1B,Y ear − CHA1B Without CC,Y ear
CHA1B Without CC,Y ear
For each simulation year and scenario, we get a matrix of results (see for in-stance table 6 for scenario A1B in 2060). Each cell (line i, column j) indicatesthe number of tourists arriving in region i from region j; or equivalently, departingfrom region j to region i. For example, the number of European tourists visit-ing Switzerland decrease by 0.11% because of temperature increase in the A1Bscenario in 2060. Diagonal cells correspond to domestic tourism.
The HTM results are then implemented in GEMINI-E3. We simulate the cli-mate scenarios RCP3PD and A1B. The destination flows in GEMINI-E3 are mod-ified according to the variations calculated with the HTM model. We assume thatthe results of the HTM simulation correspond to the “other forms of tourism” sec-tor. We aggregate in this sector summer tourism, cultural tourism and all the otherforms of tourism.
15

Table 6: Change in tourism flows. HTM results for A1B scenario in 2060A1B Medium, 2060 CH EU USA OECD BRIC ROWCH 18.1% -0.1% -14.8% -26.6% 14.6% 14.3%EU -4.6% 5.4% -23.1% -33.5% 3.7% 3.1%USA -1.5% -7.4% 14.0% -53.1% 7.1% 6.8%OECD 55.4% 45.6% 41.0% 25.4% 58.8% 62.2%BRIC 10.1% 4.6% -14.6% -16.0% 2.2% 13.3%ROW -15.1% -20.0% -31.8% -37.4% -7.6% -5.2%
4.5. Aggregate impact of climate change on tourismTo get an overall view of the combined climate change effects on winter and
summer tourism, we simulate two more scenarios:
• Climate scenario RCP3PD, variations of snow endowment in all regions,and with adaptation (change in artificial snowmaking);
• Climate scenario A1B, variations of snow endowment in all regions, andwith adaptation (change in artificial snowmaking).
5. Simulation results
We first look at winter and summer tourism separately and then simulate thecombined effects.
5.1. Winter tourismThe outcomes obtained with GEMINI-E3 for the nine scenarios outlined in
section 4.3 are given in table 7. In the model, natural snow is used as a pro-duction factor to the goods winter overnight tourism (WOT) and one-day wintertourism (ODT). Climate change decreases natural snow endowment. Thus, pro-ducers must substitute it with more expensive production factors, such as artificialsnow, and production prices increase. For example in the scenario A1B wherewe assume that snow resources outside Europe is impacted by climate change inthe same magnitude as computed for the EU, Swiss producer prices increase by5.1% for one-day winter tourism (ODT) and by 1.6% for winter overnight tourism(WOT). The two price increases are not similar due to the fact that the climatechange impacts on the snow resource vary across segments (-21.8% for the ODTand -12.5% for WOT). The difference also arises, because adaptation capacitieson the supply and demand sides are different in the two segments. Consequently,low altitude Swiss ski resorts are more negatively impacted.
16

Higher Swiss ski resorts also benefit from international effects of climatechange. Indeed, Swiss WOT gains from competitiveness improvements, as theimpacts of climate change on winter tourism are more significant outside Switzer-land. Therefore, Swiss exports (foreign tourists visiting Switzerland) increase andSwiss imports (Swiss tourists abroad) decrease. In the scenario A1B with snowchange outside Europe, Swiss production of tourism services decreases by 2.8%in ODT but increases in WOT by 0.6%. This induces an overall welfare improve-ment in Switzerland, which is however limited (+0.01%). On the other hand,when we assume that ski resort stations outside Europe suffer less from climatechange, Swiss WOT production now decreases by 0.6% in the worst case, and thewelfare improvement vanishes.
If snowmaking stays constant, the impacts are more severe. Ski resorts cannotsubstitute natural snow by relatively cheap artificial snow. They need more capi-tal, labor and energy to maintain and modernize ski slopes. In the A1B scenariowith snow change outside Europe, Swiss producer prices increase by 9.1% for theODT sector and by 6.4% for the WOT sector. This results in a decrease in pro-duction of 5.4% for the ODT sector and of 2.5% for the WOT sector. Despite this,Swiss welfare slightly improves, even more than in the case without snowmaking.This is due to improved terms of trade: the EU is more affected than Switzerlandby climate change. Since snow endowment decreases by 23.4% in the EU andby only 12.5% in Switzerland in the WOT sector, the price of skiing in the EUincreases much more than in Switzerland. Thus, Swiss imports decrease muchmore than Swiss exports. Moreover, revenue from exports grows, because the in-creasing producer prices more than compensate for the loss of demand (decreasein consumption and exports). Switzerland has a comparative advantage with re-spect to the EU, since its ski resorts are located at a higher altitude. In the scenariowith adaptation (change in snowmaking), the EU can compensate its decrease innatural snow by investing in artificial snow, mitigating the Swiss comparative ad-vantage. Thus, the positive welfare effect in Switzerland is larger in the admittedlyunrealistic scenario without adaptation.
The RCP3PD scenario represents a more sustainable future, in which the de-crease in snow endowment is very limited. Therefore, the economic impacts onSwiss winter tourism are very low. The WOT production change ranges between-0.1% to 0.0% and ODT production decreases by 0.4%. Swiss welfare remainsessentially unchanged with respect to the baseline scenario.
In short, even if welfare impacts in Switzerland are slightly positive, the sit-uation is ambiguous. Production of the one-day winter tourism sector decreasesin all scenarios, highlighting the greater vulnerability of ski resorts located at low
17

Table 7: Impacts of climate change for the Swiss winter tourism sector and Swiss welfare, changeto reference in 2060 in %
Scenario RCP3PD Scenario A1B Scenario A1BWith Snowmaking With Snowmaking Without Snowmaking
Snow change outside EuropeNo 50% Yes No 50% Yes No 50% Yes
Variations snow endowment winter overnight tourismCH -2.0% -2.0% -2.0% -12.5% -12.5% -12.5% -12.5% -12.5% -12.5%EU -3.4% -3.4% -3.4% -23.4% -23.4% -23.4% -23.4% -23.4% -23.4%OECD 0.0% -2.0% -4.0% 0.0% -10.0% -20.0% 0.0% -10.0% -20.0%USA 0.0% -2.0% -4.0% 0.0% -10.0% -20.0% 0.0% -10.0% -20.0%BRIC 0.0% -2.0% -4.0% 0.0% -10.0% -20.0% 0.0% -10.0% -20.0%ROW 0.0% -2.0% -4.0% 0.0% -10.0% -20.0% 0.0% -10.0% -20.0%Variations snow endowment oneday winter tourismCH -4.0% -4.0% -4.0% -21.8% -21.8% -21.8% -21.8% -21.8% -21.8%Swiss winter overnight tourismProduction -0.1% 0.0% 0.03% -0.6% -0.1% 0.6% -3.1% -2.8% -2.5%Consumption -0.2% -0.2% -0.2% -1.1% -1.2% -1.2% -3.5% -3.8% -4.2%Exports -0.1% 0.0% 0.2% -0.2% 0.8% 2.3% -2.9% -2.2% -1.2%Imports -0.4% -0.4% -0.4% -3.6% -3.6% -3.7% -7.9% -8.3% -9.0%Artificial Snow 1.1% 1.3% 1.4% 8.4% 9.2% 10.5% 0.0% 0.0% 0.0%Producer Price 0.2% 0.2% 0.2% 1.5% 1.5% 1.6% 5.2% 5.7% 6.4%Swiss oneday winter tourismProduction -0.4% -0.4% -0.4% -2.8% -2.8% -2.8% -5.3% -5.4% -5.4%Consumption -0.4% -0.4% -0.4% -2.8% -2.8% -2.8% -5.3% -5.4% -5.4%Artificial Snow 1.0% 1.0% 1.0% 7.2% 7.2% 7.2% 0.0% 0.0% 0.0%Producer Price 0.7% 0.7% 0.7% 5.1% 5.1% 5.1% 9.3% 9.2% 9.1%
CH welfare change 0.00% 0.00% 0.00% 0.00% 0.00% 0.01% 0.02% 0.02% 0.03%
18

altitudes, since they suffer from a greater natural snow loss. Higher ski resortsbenefit from their comparative advantage with respect to lower altitude resorts inSwitzerland and in the EU. However, their vulnerability also increases, becausethe decrease in natural snow raises their production costs.
The results are sensitive to our modeling approach and assumptions. First, weuse the fractional snow cover to model the change in natural snow. This methoddoes not factor in snow quality. In reality, temperature change will increase snowtemperature and density, lowering snow quality. This might increase the cost ofski slope preparation while decreasing people’s willingness to ski. By using thefractional snow cover, we also assume that the minimum depth to ski is uniform,although it depends on soil types and on slopes (Serquet and Rebetez, 2013).Finally, we use an econometric model to assess the economic impacts of snowcover changes, and assume that the estimated relation will be the same in 2060.However, the lack of snow in cities or the concentration of skiers in high altituderesorts could decrease people’s inclination to ski.
5.2. Summer tourismThe results presented in table 8 correspond to the simulations in GEMINI-E3
for scenarios A1B and RCP3PD in 2060. International tourism flows change ac-cording to the new temperature pattern. Cold countries like Canada, Norway orRussia become more attractive. Thus, regions OECD and BRIC increase their ar-rivals. For example, OECD arrivals increase by 12.1% in RCP3PD and by 35% inA1B. However, temperature increase reduces international tourism flows, i.e. to-tal departures and arrivals decrease while domestic tourism increases. This effectis larger in A1B than in RCP3PD, because the temperature increase is more pro-nounced in the former scenario. International tourism trade decreases by 5.5% inA1B, but by only 2.5% in RCP3PD. On aggregate, the Swiss tourism sector ben-efits from this effect. Indeed, even if international tourists spend less in Switzer-land, Swiss tourists also spend less outside Switzerland and more at home: arrivalsdecrease by 1.6% while departures decrease by 12.9% in A1B.
The reallocation of tourism flows translates into welfare changes. The mainwinner is the OECD region, because the increase in arrivals and the reductionof departures greatly improve the regional trade balance (+0.56% in A1B and+0.21% in RCP3PD). Switzerland is better off with a moderate welfare gain(+0.16% in A1B and +0.08% in RCP3PD). One explanation is that more touristswill enjoy colder mountain areas at the expense of hot city or seaside destinations.Moreover, the summer tourism season in alpine areas could expand to spring and
19

autumn. Thus, the decrease in arrivals is more than compensated for by the de-crease in departures and the increase in domestic tourism. Worldwide, climatechange has a negative impact on tourism, lowering welfare by 0.06% in A1B andby 0.02% in RCP3PD due to the decrease in international trade.
The results presented above must be read with care. Even if we focus on cli-mate change effects, the socioeconomic scenarios have a significant impact on theresults, since they affect the reference case. However, the population and GDPlevels in a distant future are more than difficult to predict. Moreover, the effectof temperature on tourists’ preferences could evolve. For example, tourists couldget used to higher temperatures, making tourism flows more robust to climatechange. Consequently, the simulations should not be interpreted as predictions.They indicate a possible future and are useful to understand how climate changecould impact tourism and the direction of the effects. In this respect, our resultsconfirm those of Roson and Sartori (2016), who find a GDP gain of 1.47% forSwitzerland in case of a 3°C temperature increase. They also show that benefitsare concentrated in a few rich countries so that impacts have regressive distribu-tional consequences.
The simulated scenarios show a positive impact of climate change on totalsummer tourism in Switzerland, but the situation might be more nuanced insidethe country. The HTM model uses a representative temperature for each country.Switzerland’s tourism sector benefits from a lower average annual temperature incomparison with other regions. It is likely that summer tourism will increase incold alpine regions, while it is unsure what will happen in cities. Serquet and Re-betez (2011) for example find a significant correlation between tourism in moun-tain resorts and hot temperature at lower elevation, especially in alpine resortslocated near cities. These results suggest that alpine resorts could adapt to climatechange diversifying and developing their summer tourism offer.
5.3. Aggregate impact of climate change on tourismFinally, we simulate the impacts of climate change on winter and summer
tourism simultaneously in GEMINI-E3, i.e. we model temperature increase andvariation in snow endowment together. The simulations results are shown in table9. The results obtained are similar to what we have seen before. Internationaleffects of climate change are stronger for summer tourism than for winter tourism,and they result in welfare gains for Swiss households.
There are however some interesting deviations from simply summing over theseparate results of winter and summer tourism simulations due to general equilib-rium effects. First, Swiss imports of winter tourism decrease less. Second, exports
20

Table 8: Impacts of climate change for the Swiss other forms of tourism sector and aggregatewelfare, change to reference in 2060 in %
RCP3PD A1B
ProductionCHE 1.4% 3.0%EU 0.2% 0.5%USA 0.6% 0.6%OECD 8.0% 22.3%BRIC 1.0% 1.9%ROW -3.9% -9.6%World 0.0% 0.0%Departures fromCHE -6.0% -12.9%EU -5.0% -11.8%USA -12.4% -25.6%OECD -14.5% -39.2%BRIC 0.0% 0.4%ROW 2.2% 6.3%World -2.5% -5.5%Arrivals toCHE -0.7% -1.6%EU -2.6% -5.9%USA -3.5% -9.3%OECD 12.1% 35.0%BRIC 2.4% 5.8%ROW -6.1% -13.9%World -2.5% -5.5%Households consumption Other TourismCHE 0.1% 0.3%EU 0.0% 0.0%USA 0.0% 0.0%OECD 0.1% 0.3%BRIC 0.1% 0.2%ROW -0.2% -0.4%World 0.0% 0.0%Surplus in % of Households consumptionCHE 0.08% 0.16%EU 0.00% 0.00%USA -0.01% -0.05%OECD 0.21% 0.56%BRIC 0.01% 0.02%ROW -0.12% -0.31%World -0.02% -0.06%
21
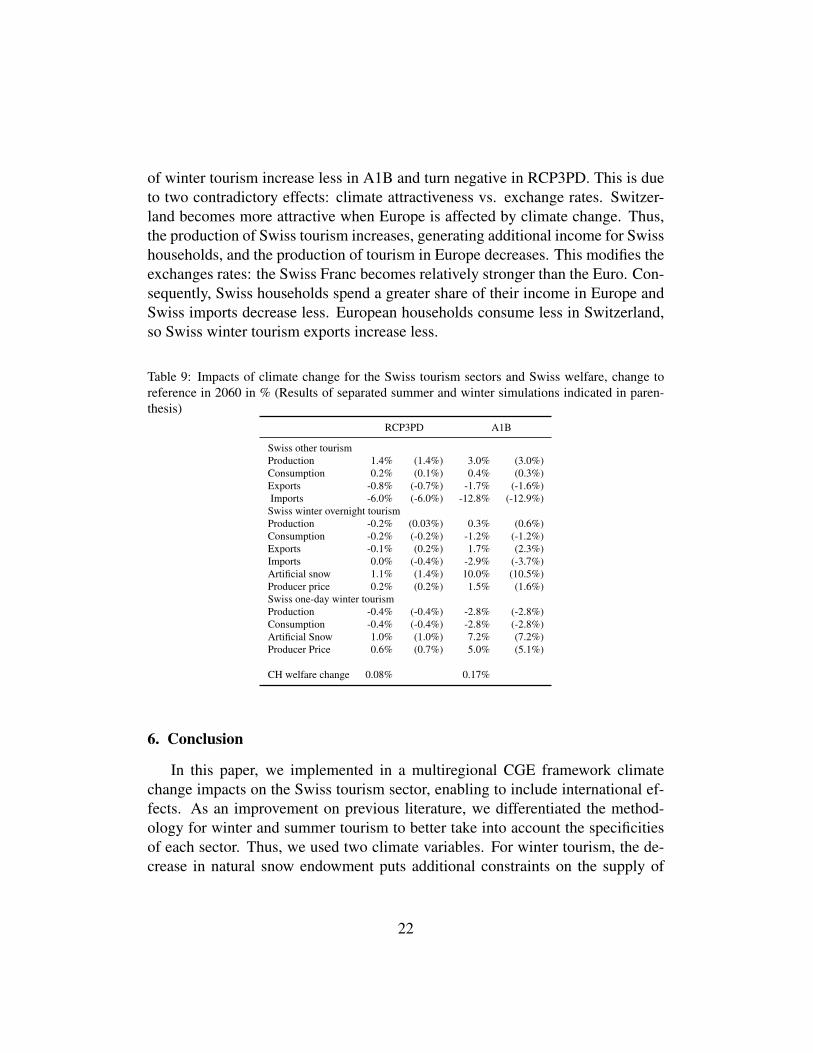
of winter tourism increase less in A1B and turn negative in RCP3PD. This is dueto two contradictory effects: climate attractiveness vs. exchange rates. Switzer-land becomes more attractive when Europe is affected by climate change. Thus,the production of Swiss tourism increases, generating additional income for Swisshouseholds, and the production of tourism in Europe decreases. This modifies theexchanges rates: the Swiss Franc becomes relatively stronger than the Euro. Con-sequently, Swiss households spend a greater share of their income in Europe andSwiss imports decrease less. European households consume less in Switzerland,so Swiss winter tourism exports increase less.
Table 9: Impacts of climate change for the Swiss tourism sectors and Swiss welfare, change toreference in 2060 in % (Results of separated summer and winter simulations indicated in paren-thesis)
RCP3PD A1B
Swiss other tourismProduction 1.4% (1.4%) 3.0% (3.0%)Consumption 0.2% (0.1%) 0.4% (0.3%)Exports -0.8% (-0.7%) -1.7% (-1.6%)Imports -6.0% (-6.0%) -12.8% (-12.9%)
Swiss winter overnight tourismProduction -0.2% (0.03%) 0.3% (0.6%)Consumption -0.2% (-0.2%) -1.2% (-1.2%)Exports -0.1% (0.2%) 1.7% (2.3%)Imports 0.0% (-0.4%) -2.9% (-3.7%)Artificial snow 1.1% (1.4%) 10.0% (10.5%)Producer price 0.2% (0.2%) 1.5% (1.6%)Swiss one-day winter tourismProduction -0.4% (-0.4%) -2.8% (-2.8%)Consumption -0.4% (-0.4%) -2.8% (-2.8%)Artificial Snow 1.0% (1.0%) 7.2% (7.2%)Producer Price 0.6% (0.7%) 5.0% (5.1%)
CH welfare change 0.08% 0.17%
6. Conclusion
In this paper, we implemented in a multiregional CGE framework climatechange impacts on the Swiss tourism sector, enabling to include international ef-fects. As an improvement on previous literature, we differentiated the method-ology for winter and summer tourism to better take into account the specificitiesof each sector. Thus, we used two climate variables. For winter tourism, the de-crease in natural snow endowment puts additional constraints on the supply of
22

winter tourism, notably on skiing. For summer tourism, temperature change real-locates international tourist flows.
We have shown that climate change might have a positive effect on the Swisstourism industry, when international effects are included. Effects on summertourism are stronger and result in overall welfare gains for Switzerland. How-ever, the situation is more contrasted inside the country. Low-altitude ski resortsare vulnerable to climate change since they suffer from a greater natural snowloss. On the other hand, high-altitude ski resorts benefit from a comparative ad-vantage with respect to lower altitude ski resorts in Switzerland, but also in otherparts of Europe. Our results also outline adaptation capacity of alpine resorts,which could develop their summer tourism offer. Indeed, more tourists could en-joy colder mountain areas due to more frequent heatwaves in cities.
There are some caveats associated with our approach. We point out some ofthese limitations to also inspire further research. First, tourism flows not onlydepend on climate but also on population and GDP. We used a reference socio-economic scenario to focus on climate change effects. But this could seem in-consistent since carbon emissions are strongly linked with population and GDPgrowth. Next, we treated the changes in natural snow endowment and temperatureas deterministic using the average change simulated by several models. But un-certainties are high, as highlighted by the high disparities between model results.Moreover, due to our CGE approach, the decrease in natural snow endowmentonly increases the production cost of winter tourism exponentially. This meansthat there is no ultimate restriction on the supply side, and producers substitutemissing natural snow with others production factors, for example increasing theshare of artificial snowmaking. However, the preparation of ski slopes might beimpractical in a warmer climate. Finally, the fractional snow cover used in oursimulations does not factor in snow quality. Higher temperature will lower snowquality which could decrease people’s willingness to ski. This effect could bereinforced by the lack of snow in cities or the concentration of skiers in a fewhigh-altitude ski-resorts. On the other hand, tourists could also get used to highertemperature, making summer tourism flows more robust to climate change. Betterunderstanding people’s preferences under climate change and changes thereof ischallenging but crucial for developing adequate climate change adaptation strate-gies.
23

Acknowledgements
The research leading to these results has received funding from the Swiss Fed-eral Office for the Environment.
7. References
B. Abegg, R. Steiger, and R. Walser. Herausforderung Klimawandel: Chancenund Risiken fur den Tourismus in Graubunden. Technical report, Amt furWirtschaft und Tourismus Graubunden, Chur/Innsbruck, 2013.
S. Agrawala et al. Climate change in the European Alps: adapting winter tourismand natural hazards management. Organisation for Economic Cooperation andDevelopment (OECD), 2007.
B. Narayanan, A. Aguiar, and R. McDougall, editors. Global Trade, Assistance,and Production: The GTAP 8 Data Base. Center for Global Trade Analysis,Purdue University, 2012.
T. Baumann and U. Schiess. Compte satellite du tourisme de la Suisse, 2001 et2005: Principes, methode et resultats. Federal Office of Statistics, Neuchatel,2008.
Bergwelten 21/GRF Davos. Klimawandel Graubunden, Arbeitspapier 3 : Risikenund Chancen, Chur. Technical report, 2015.
A. Bernard and M. Vielle. GEMINI-E3, a General Equilibrium Model of Inter-national National Interactions between Economy, Energy and the Environment.Computational Management Science, 5(3):173–206, May 2008.
M. Berrittella, A. Bigano, R. Roson, and R. S.J. Tol. A general equilibrium anal-ysis of climate change impacts on tourism. Tourism Management, 27(5):913–924, October 2006.
T. Bieger, T. Riklin, and C. Baudenbacher. Umfrage zur aktuellen Situation und zuden wirtschaftlichen Perspektiven der Beschneiung in der Schweiz. UniversitatSt. Gallen, Institut fur Offentliche Dienstleistungen und Tourismus, 7:51, 2009.
A. Bigano, J. M. Hamilton, and R. S. J. Tol. The impact of climate change ondomestic and international tourism: A simulation study. The Integrated Assess-ment Hournal, 7(1):25–49, 2007.
24

F. Bosello, R. Eboli, and R. Pierferedici. Assessing the Economic Impacts ofClimate Change. An Updated CGE Point of View. Nota Di Lavoro, FondazioneEni Enrico Mattei, January 2012.
CH2011. Swiss Climate Change Scenarios CH2011. MeteoSwiss, C2SM, ETH,NCCR Climate and OcCC, Zurich, Switzerland, 2011.
CH2014-Impacts. Toward Quantitative Scenarios of Climate Change Impactsin Switzerland. OCCR, FOEN, MeteoSwiss, C2SM, Agroscope and ProClim,Bern, Switzerland, 2014.
Ecoplan/Sigmaplan. Auswirkungen der Klimaanderung auf die Schweizer Volk-swirtschaft (nationale Einflusse): Schlussbericht. Technical report, Auftragge-ber Bundesamt fur Umwelt (BAFU) und Bundesamt fur Energie (BFE), 2007.URL http://opus.kobv.de/zlb/volltexte/2008/6532/.
A.K. Faust, C. Gonseth, and M. Vielle. Modelisation de l’adaptation auxchangements climatiques dans un modele economique integre. Rapport Final,Recherche en Economie et Management de l’Environnement (REME), EcolePolytechnique Federale de Lausanne (EPFL), Lausanne, Suisse, July 2012.
A.K. Faust, C. Gonseth, and M. Vielle. The economic impact of climate drivenchanges in water availability in Switzerland. Water Policy, 17(5):848–864,2015.
Federal Office of Statistics. Les scenarios de l’evolution de la population de laSuisse 2015-2045. Technical report, 2015.
M. Freiburghaus. Wasserbedarf der Schweizer Wirtschaft. GWA, 89(12):1001–1009, 2009.
C. Gonseth. Impact of snow variability on the swiss winter tourism sector: impli-cations in an era of climate change. Climatic Change, 119(2):307–320, 2013.
C. Gonseth, P. Thalmann, and M. Vielle. Impacts of global warming on energy usefor heating and cooling with full rebound effects in switzerland. Swiss Journalof Economics and Statistics, accepted for publication, 2017.
J. M. Hamilton, D. J. Maddison, and R. S.J. Tol. Climate change and inter-national tourism: A simulation study. Global Environmental Change, 15(3):253–266, October 2005. ISSN 09593780. doi: 10.1016/j.gloenvcha.2004.12.
25

009. URL http://linkinghub.elsevier.com/retrieve/pii/S0959378004000883.
IFEC/Bergwelten 21/InnovaBridge/Consavis/RIBO architecture. Analyseklimabedingter risiken und chancen in der Schweiz: Fallstudie kanton Tessin.Technical report, 2016.
International Energy Agency. World Energy Outlook 2015. 2015.
S. R. Joshi, M. Vielle, F. Babonneau, N. R. Edwards, and P. B. Holden. Physicaland economic consequences of sea-level rise: A coupled gis and cge analysisunder uncertainties. Environmental and Resource Economics, 65(4):813–839,2016.
G. Klein, Y. Vitasse, C. Rixen, C. Marty, and M. Rebetez. Shorter snow coverduration since 1970 in the swiss alps due to earlier snowmelt more than tolater snow onset. Climatic Change, 139(3):637–649, 2016. ISSN 1573-1480. doi: 10.1007/s10584-016-1806-y. URL http://dx.doi.org/10.1007/s10584-016-1806-y.
U. Koenig and B. Abegg. Impacts of climate change on winter tourism in theswiss alps. Journal of Sustainable Tourism, 5(1):46–58, 1997.
M. Labriet, S. R. Joshi, M. Vielle, P. B. Holden, N. R. Edwards, A. Kanudia,R. Loulou, and F. Babonneau. Worldwide impacts of climate change on en-ergy for heating and cooling. Mitigation and Adaptation Strategies for GlobalChange, 20(7):1111–1136, 2015. ISSN 1381-2386.
C. Matasci. The vulnerability of switzerland towards climate change: the case oftourism. In Belpasso International Summer School, 2010.
R. Meier. Soziookonomische Aspekte von Klimaanderungen und Naturkatastro-phen in der Schweiz. Technical report, Final Report of the Project NFP31 vdf,Zurich, Switzerland, 1998.
H. Muller and T. Lehmann Friedli. Klimaanderung und Tourismus: Szenarien-analyse fur das Berner Oberland 2030. Technical report, Forschungsinstitut furFreizeit und Tourismus (FIF) der Universitat Bern, Bern, 2007.
N. Nakicenovic, J. Alcamo, G. Davis, B. De Vries, J. Fenhann, S. Gaffin, K. Gre-gory, A. Griibler, T. Jung, T. Kram et al., Emissions scenarios, 2000.
26

C. Nathani, D. Sutter, R. van Nieuwkoop, M. Peter, S. Kraner, M. Holzhey,H. Rutter, and R. Zandonella. Energy related disaggregation of the Swiss Input-Output Table. Technical report, SFOE, EWG Publication, Bern, 2011.
NELAK. Neue Seen als Folge des Gletscherschwundes im Hochgebirge - Chancenund Risiken. vdf Hochschulverlag AG and der ETH Zurich, 2013.
OMT. Recommandations sur les statistiques du tourisme. Technical report, Na-tions Unies (ONU), 1994.
M. Perroud and S. Bader. Klimaanderung in der Schweiz. Indikatoren zu Ur-sachen, Auswirkungen, Massnahmen. Umwelt-Zustand, 1308, 2013.
R. Roson and M. Sartori. Estimation of climate change damage functions for 140regions in the gtap9 database. Available at SSRN 2741588, 2016.
D. Scott and G. McBoyle. Climate change adaptation in the ski indus-try. Mitigation and Adaptation Strategies for Global Change, 12(8):1411–1431, September 2007. ISSN 1381-2386, 1573-1596. doi: 10.1007/s11027-006-9071-4. URL http://link.springer.com/10.1007/s11027-006-9071-4.
D. Scott, J. Dawson, and B. Jones. Climate change vulnerability of the us north-east winter recreation-tourism sector. Mitigation and Adaptation Strategies forGlobal Change, 13:577–596, 2008.
G. Serquet and M. Rebetez. Relationship between tourism demand in the swissalps and hot summer air temperatures associated with climate change. ClimaticChange, 108(1):291–300, 2011.
G. Serquet and M. Rebetez. Changements climatiques: Quel avenir pour les des-tinations touristiques des alpes et du jura vaudois? Technical report, Institutfederal de recherches sur la foret, la neige et le paysage (WSL)., 2013.
R. Steiger and B. Abegg. Climate change impacts on austrian ski areas. InA. Borsdorf, J. Stotter, and E. Veulliet, editors, Managing Alpine FutureII - Proceedings of the Innsbruck Conference, pages 288–297. Verlag derOsterreichischen Akademie der Wissenschaften, November 2011.
T.F. Stocker, D. Qin, G.K. Plattner, M. Tignor, S.K. Allen, J. Boschung, A. Nauels,Y. Xia, V. Bex, and P.M. Midgley. Climate change 2013: The physical sciencebasis, 2014.
27

United Nations. World population prospects: The 2015 revision. Technical report,Department of Economic and Social Affairs, Population Division, 2015.
R. Winkler, C. Almer, C. Bader, C. Gonseth, J. Laurent-Luchetti, P. Thalmann,and M. Vielle. CH2014 - Impact, Toward Quantitative Scenarios of ClimateChange Impacts in Switzerland, chapter Energy consumption of buildings - di-rect impacts of a warming climate and rebound effects, pages 99–105. OCCR,FOEN, MeteoSwiss, C2SM, Agroscope and ProClim., 2014.
28

Appendix A.
Figure A.1: Snow cover variation of the Swiss one-day winter tourism sector with respect to 2010under A1B scenario
29

Figure A.2: Snow cover variation of the Swiss one-day winter tourism sector with respect to 2010under RCP3PD scenario
Figure A.3: Snow cover variation in Europe with respect to 2010 under A1B scenario
30

Figure A.4: Snow cover variation in Europe with respect to 2010 under RCP3PD scenario
31