IMPACT OF POPULATION MORBIDITY ON HEALTH CARE … · nificación sanitaria, Farmacoeconomia,...
15
Rev Esp Salud Publica. 2016 Jun 8;90:e1-e15. www.msc.es/resp ORIGINAL IMPACT OF POPULATION MORBIDITY ON HEALTH CARE COSTS IN A HEALTH DISTRICT (*) Vicent Caballer Tarazona (1), Natividad Guadalajara Olmeda (1), David Vivas Consuelo (1) and Antonio Clemente Collado (2). (1) Centro de Ingeniería Económica. Universitat Politècnica de València. Valencia. (2) Hospital Marina Salud. Denia. Alicante. The authors declare that there was no conflict of interest in the writing of this paper. This work was partly financed by the Fondo de Investigaciones de la Seguridad Social Instituto de Salud Carlos III (FIS PI 12/0037). There was no conflict of interest. RESUMEN Impacto de la morbilidad en los costes asistenciales de un departamento de salud de la Comunidad Valenciana a través de los grupos de riesgo clínico Fundamentos: Los sistemas de ajuste de riesgo basados en diagnóstico estratifican la población según la morbilidad observada. El objetivo de este trabajo fue analizar el gasto sanitario total en un área de salud en función de la edad, el sexo y la morbilidad observada en la población. Métodos: Estudio observacional de corte transversal y de ámbito po- blacional de los costes de atención sanitaria en el Departamento de salud Dénia-Marina Salud (Alicante) durante el año 2013. Se estratificó a la po- blación (N=156.811) según Grupos de Riesgo Clínico en 9 estados de salud, siendo sano el estado 1 y el 9 el de mayor carga de morbilidad. A cada habitante se le imputaron los costes hospitalarios, de atención primaria y de farmacia ambulatoria para obtener los costes totales. Se analizaron los estados de salud y gravedad por edad y sexo así como los costes de cada grupo. Se aplicaron las pruebas estadísticas t de student y χ 2 para verificar la existencia de diferencias significativas entre e intra grupos. Resultados: El coste medio por habitante fue de 983 euros oscilando desde 240 hasta 42.881 en el estado 9 y nivel de gravedad 6. Los pacientes de los estados de salud 5 y 6 realizaron el mayor gasto, pero los estados de salud 8 y 9 tuvieron el mayor gasto medio, siendo el 80% hospitalario. Conclusiones: Se corrobora una diferente composición del gasto sani- tario por morbilidad individual, con un crecimiento exponencial del gasto hospitalario. Palabras clave: Ajuste de riesgo, Análisis del costo, Atención hospi- talaria, Atención primaria de salud, Costos hospitalarios, Morbilidad, Pla- nificación sanitaria, Farmacoeconomia, Servicio de urgencia en hospital. Suggested citation: Caballer Tarazona V, Guadalajara Olmeda N, Vivas Consuelo D, Clemente Collado A. Impact of population morbidity on health care costs in a health district. Rev Esp Salud Publica. 2016 Jun 8;90:e1-e15. ABSTRACT Background: Risk adjustment systems based on diagnosis stratify the population according to the observed morbidity. The aim of this study was to analyze the total health expenditure in a health area, relating to age, gender and morbidity observed in the population. Methods: Observational cross-sectional study of population and area of health care costs in the Health District of Denia-Marina Salud (Alicante) in 2013. Population (N=156,811) were stratified by Clinical Risk Groups into 9 states of health, state 1 being healthy, and state 9 the highest disease burden. Each inhabitant was charged with the hospital costs, primary care and outpa- tient pharmacy to obtain the total costs. Health status and severity by age and gender, as well as the costs of each group were analysed. The statistical tests, student t and χ 2 were applied to verify the existence of significant differences between and intra groups. Results: The average cost per inhabitant was 983 euros which increased from 240 euros to 42,881 at the state 9 and severity level 6. Patients of health states 5 and 6 caused the largest expenditure by concentration of the population, but health states 8 and 9 had the highest average expenditure, with 80% of hospitalised cost. Conclusions: A different composition of health expenditure per indi- vidual morbidity was corroborated, with an exponential growth in hospital spending. Key words: Cost analysis, Risk adjustment, Hospital costs, Emergency service, Primary health care, Pharmaceutical economics, Morbidity, Health Economics, Health planning. Spain. Correspondence Natividad Guadalajara Olmeda Edificio 7J, 3ª planta Campus de Vera Universitat Politènica de València Valencia España Receipt: 2016 March 31 Accepted: 2016 May 24 ePublish: 2016 June 8
Transcript of IMPACT OF POPULATION MORBIDITY ON HEALTH CARE … · nificación sanitaria, Farmacoeconomia,...

Rev Esp Salud Publica. 2016 Jun 8;90:e1-e15. www.msc.es/resp
ORIGINAL
IMPACT OF POPULATION MORBIDITY ON HEALTH CARE COSTS IN A HEALTH DISTRICT (*)
Vicent Caballer Tarazona (1), Natividad Guadalajara Olmeda (1), David Vivas Consuelo (1) and Antonio Clemente Collado (2).(1) Centro de Ingeniería Económica. Universitat Politècnica de València. Valencia.(2) Hospital Marina Salud. Denia. Alicante.
The authors declare that there was no conflict of interest in the writing of this paper.
This work was partly financed by the Fondo de Investigaciones de la Seguridad Social Instituto de Salud Carlos III (FIS PI 12/0037). There was no conflict of interest.
RESUMEN
Impacto de la morbilidad en los costes asistenciales de un departamento de salud
de la Comunidad Valenciana a través de los grupos de riesgo clínico
Fundamentos: Los sistemas de ajuste de riesgo basados en diagnóstico estratifican la población según la morbilidad observada. El objetivo de este trabajo fue analizar el gasto sanitario total en un área de salud en función de la edad, el sexo y la morbilidad observada en la población.
Métodos: Estudio observacional de corte transversal y de ámbito po-blacional de los costes de atención sanitaria en el Departamento de salud Dénia-Marina Salud (Alicante) durante el año 2013. Se estratificó a la po-blación (N=156.811) según Grupos de Riesgo Clínico en 9 estados de salud, siendo sano el estado 1 y el 9 el de mayor carga de morbilidad. A cada habitante se le imputaron los costes hospitalarios, de atención primaria y de farmacia ambulatoria para obtener los costes totales. Se analizaron los estados de salud y gravedad por edad y sexo así como los costes de cada grupo. Se aplicaron las pruebas estadísticas t de student y χ2 para verificar la existencia de diferencias significativas entre e intra grupos.
Resultados: El coste medio por habitante fue de 983 euros oscilando desde 240 hasta 42.881 en el estado 9 y nivel de gravedad 6. Los pacientes de los estados de salud 5 y 6 realizaron el mayor gasto, pero los estados de salud 8 y 9 tuvieron el mayor gasto medio, siendo el 80% hospitalario.
Conclusiones: Se corrobora una diferente composición del gasto sani-tario por morbilidad individual, con un crecimiento exponencial del gasto hospitalario.
Palabras clave: Ajuste de riesgo, Análisis del costo, Atención hospi-talaria, Atención primaria de salud, Costos hospitalarios, Morbilidad, Pla-nificación sanitaria, Farmacoeconomia, Servicio de urgencia en hospital.
Suggested citation: Caballer Tarazona V, Guadalajara Olmeda N, Vivas Consuelo D, Clemente Collado A. Impact of population morbidity on health care costs in a health district. Rev Esp Salud Publica. 2016 Jun 8;90:e1-e15.
ABSTRACTBackground: Risk adjustment systems based on diagnosis stratify the
population according to the observed morbidity. The aim of this study was to analyze the total health expenditure in a health area, relating to age, gender and morbidity observed in the population.
Methods: Observational cross-sectional study of population and area of health care costs in the Health District of Denia-Marina Salud (Alicante) in 2013. Population (N=156,811) were stratified by Clinical Risk Groups into 9 states of health, state 1 being healthy, and state 9 the highest disease burden. Each inhabitant was charged with the hospital costs, primary care and outpa-tient pharmacy to obtain the total costs. Health status and severity by age and gender, as well as the costs of each group were analysed. The statistical tests, student t and χ2 were applied to verify the existence of significant differences between and intra groups.
Results: The average cost per inhabitant was 983 euros which increased from 240 euros to 42,881 at the state 9 and severity level 6. Patients of health states 5 and 6 caused the largest expenditure by concentration of the population, but health states 8 and 9 had the highest average expenditure, with 80% of hospitalised cost.
Conclusions: A different composition of health expenditure per indi-vidual morbidity was corroborated, with an exponential growth in hospital spending.
Key words: Cost analysis, Risk adjustment, Hospital costs, Emergency service, Primary health care, Pharmaceutical economics, Morbidity, Health Economics, Health planning. Spain.
CorrespondenceNatividad Guadalajara OlmedaEdificio 7J, 3ª plantaCampus de VeraUniversitat Politènica de ValènciaValenciaEspaña
Receipt: 2016 March 31Accepted: 2016 May 24
ePublish: 2016 June 8
Vicent Caballer Tarazona et al.
2 Rev Esp Salud Publica. 2016 Jun 8;90:e1-e15.
INTRODUCTION
The health care systems in developed countries are having to face new challeng-es associated with ageing of the population and the consequent increase of chronic dis-eases and health care costs(1). An increase of health care cost related to age has been demonstrated, but the morbidity factor has a great impact on cost(2–5). Therefore, Diagnos-tic-Based Risk-Adjustment Systems make up an important tool for grouping the population according its chronic conditions and individ-ual health care consumption patterns. These systems are useful not only for the stratifica-tion of patients and analysis of use patterns of resource consumption, but also for the plan-ning and evaluation of health care systems, capitation financing, assigning health care resources based on the real burden derived from morbidity and the monitoring of the prevalence rate of chronic diseases.
The most used risk adjustment systems for health care at international level are: 1) Diagnostic Cost Groups (DCGs)(6) princi-pally used in the US by Medicare(7,8); 2) the Johns Hopkins Adjusted Clinical Groups System(ACG)9 and 3) Clinical Risk Groups (CRG)(10,11).
In Spain, ACG have been used in Aragón(12), Badalona(13) and País Vasco(14), and CRG have been used in Madrid(15), Gero-na(2,16) and the Valencia Community(11).
The main characteristic of CRG is that they classify the population into 1,075 mu-tually exclusive groups (version 1.6) accord-ing to the diseases registered by each patient in the electronic data base. Each category of CRG is further grouped into more generic classifications up to the most aggregated lev-el composed of 9 health statuses. Each health status shares the number and severity of the chronic conditions, which translates into a similar health care cost. These 9 health statuses are: 1) healthy; 2) significant acute disease; 3) single minor chronic disease 4) minor chronic disease in multiple organ sys-
tems; 5) single moderate dominant or chron-ic disease; 6) significant chronic disease in multiple organ systems; 7) dominant chronic disease in three or more organ systems; 8) dominant neoplasms, metastases and com-plications; and 9) severe diseases or extreme health care needs. The level of disaggrega-tion preceding this classification is level 3 of the CRG aggregation (ACRG3), which con-siders the nine health statuses plus six levels of severity.
Among the most notable practical appli-cations of CRG we can find: predicting and explaining health care costs(11), improving assignation of health care resources accord-ing to knowledge of health status(15,17) and population needs and establishing capitation payment and chronic disease management models(10).
Several experiences have already demon-strated its validity regarding stratification of the population and support in health care management(16), strategies for approaching chronicity(18) and the monitoring of chronic diseases(14).
Some studies have focussed on some of the components of health care expenditure: pharmaceutical(12), hospitalisation or prima-ry health care(19), others have analysed total expenditure(5), direct and indirect costs(2), the costs of determined diseases(20) and the ex-penditure on the paediatric or adult popula-tions(5).
The goal of the present article is to analyse the total health care cost per inhabitant, ac-cording to age, sex and morbidity in an inte-grated health department of Alicante (Spain) and to distinguish between hospital, out-pa-tient pharmaceutical and primary health care costs.
METHODS
Observational retrospective cross-section study, analytic, covering the totality of the 156,811 population assigned to the Denia-Ma-

IMPACT OF POPULATION MORBIDITY ON HEALTH CARE COSTS IN A HEALTH DISTRICT
Rev Esp Salud Pública. 2016;Vol. 90: 8 de junio: e1-e15. 3
rina Salud Health District (Alicante, Spain) for the year 2013. This integrated health district, one of 10 in the province of Alicante, includes one hospital in Denia, four integrated health care centres, eight health clinics and 34 doc-tor’s offices. The average age of the popula-tion registered with this district was 43.57; 17.63% were under 18; 59.42% between 18 and 64 and 22.95 were over 64. Regarding sex, 48.92% were male.
The information was obtained from the An-alytical Management System of Denia-Mari-na Salud and from the electronic data bases of the Regional Health Department (Con-selleria de Sanitat Universal i Salut Pública) of the Valencia Community: the Population Information System (SIP), the Information System for Health care Activity (ISHA), the Minimum Data Set (MDS), the Electronic Pharmaceutical Prescription System (GAIA) and the Patient Classification System of the Valencia Community (SCP-CV). 3MTM Clini-cal Risk Grouping Software was used for the stratification of the health district population into CRG.
The estimate of the annual cost per patient (Cj) was carried out using the following ex-pression:
Cj= Chj+Capj+ Cfj
Chj= Cuj+Cqj+Ccej+Cij
Capj= (nj) (p)
Where:
Chj = Hospital cost (specialised care) of pa-tient j, obtained from the Analytical System of Denia Hospital, which includes the costs of intermediate activities per patient, such as diagnostic tests, laboratory and imaging tests, health care material and pharmacy con-sumption, as well as attendance on the patient carried out by other departments.
Capj = Primary health care costs of patient j
Cfj = Outpatient pharmacy cost of patient j ac-
cording to GAIA data
Cuj = Emergency room cost of patient j
Cqj = Operating theatre cost of patient j
Ccej = Outpatient consultation cost of patient j
Cij = Hospitalisation cost of patient j
nj = Number of primary health care consulta-tions of patient j
p = Unit cost of consultation according to rates established by Regional Government(21)
From the annual cost per patient the total cost (CT) for each item was obtained (health status, age group, sex, etc.) and the average cost (Cm) for each item, using the following expressions:
Where N is the number of patients includ-ed in the item.
With this a data base was constructed with the annual cost for each of the 156,811 popu-lation, their assigned CRG, age and sex.
The parametric statistical t Student test was applied to verify the existence of signif-icant differences in the mean values between groups and the nonparametric Pearson χ2 to verify significant differences between two distributions, in both cases 95%.
This research was approved by the Be-havioural Research Ethics Board at the Gen-eralitat Valenciana (Comité Ético de Inves-tigación Clínica Corporativo de Atención Primaria de la Comunitat Valenciana, CEIC) on January 30, 2014, with protocol code RUTFAR - 2013-01, version of 19 Decem-ber 2013. The Research Commission of De-nia Health District approved the project on

Vicent Caballer Tarazona et al.
4 Rev Esp Salud Publica. 2016 Jun 8;90:e1-e15.
12 February 2015.
RESULTS
An increase in morbidity with age was ob-served, especially in health statuses 5 and 6 from 45 years old onwards (figure 1), aggra-vated by an increase in the population of over 60 with chronic diseases. Nevertheless, while the proportion of people in health status 5 is
maintained from 50 years old on at around 25%, the corresponding proportion for those in health status 6 continues to increase with age and stabilizes at 45% for the population older than 80.
Regarding sex, statistically significant differences were found in the distribution of the health statuses (Pearson χ2=1483.085; p value=0.000). Men showed a prevalence
Figure 1Distribution of morbidity (CRG health status) according to population age, in years
Rev Esp Salud Publica. 2016 Jun 8;90:e1-e15. 5
Table 1 Population and total health care expenditure
CRG health status Men%
Women%
Average age
Population (%)
Total expenditure
(€) (%)
Average expenditure (€/person)
Lower and upper confidence interval
(95%)
Average expenditure (€) in men
Average expenditure
(€) in women
1Healthy 58.15 51.26 33.88 85,668
(54.63)20,560.803
(13.34) (DT) 234.98- 245.03 198.29 285.34
2.Hystory of significant acute disease 3.39 4.42 36.93 6,142
(3.92)6,222.537
(4.04)1,013.11
(2,935.89) 939.52-1.086.38 834.13 1.144.32
3Single minor chronic disease 8.82 11.04 47.32 15,610
(9.95)10,617.774
(6.89)680.19
(2,039.05) 648.16-712.14 662.79 693.5
4.Minor chronic disease in multiple 2.81 5.56 58.19 6,607
(4.21)7,485.222
(4.86)1.132.92
(1,605.44) 1,094.04-1.171.47 1,088.06 1,154.67
5Single dominant or moderate chronic disease 15.71 15.98 55.84 24,850
(15.85)39,865.567
(25.87)1.604.25
(3,384.73) 1,562.10-1.646.27 1,657.36 1,554.25
6Chronic disease in two or mor organs 9.42 10.58 69.57 15,706
(10.02)49,875.100
(32.36)3.175.54
(4,443.52) 3,105.85-3.244.84 3,345.78 3,030.37
7Dominant chronic dosease in three or more organs 0.81 0.57 75.91 1,079
(0.69)6,116.463
(3.97)5.668.64
(6,297.42) 5,287.40-6.039.40 6,076.17 5,116.07
8Dominant and metastatic malignances 0.50 0.38 63.83 686
(0.44)6,693.274
(4.34)9.756.96
(12,318.31) 5,287.40-6.039.40 9,794.94 9,709.79
9Catastrophic conditions 0.39 0.20 52.35 463 (0.30) 6,678.068
(4.33)14.423.47
(16,912.34) 12,849.54-15.935.28 14,783.35 13,741.95
IMPACT OF POPULATION MORBIDITY ON HEALTH CARE COSTS IN A HEALTH DISTRICT
Vicent Caballer Tarazona et al.
6 Rev Esp Salud Publica. 2016 Jun 8;90:e1-e15.
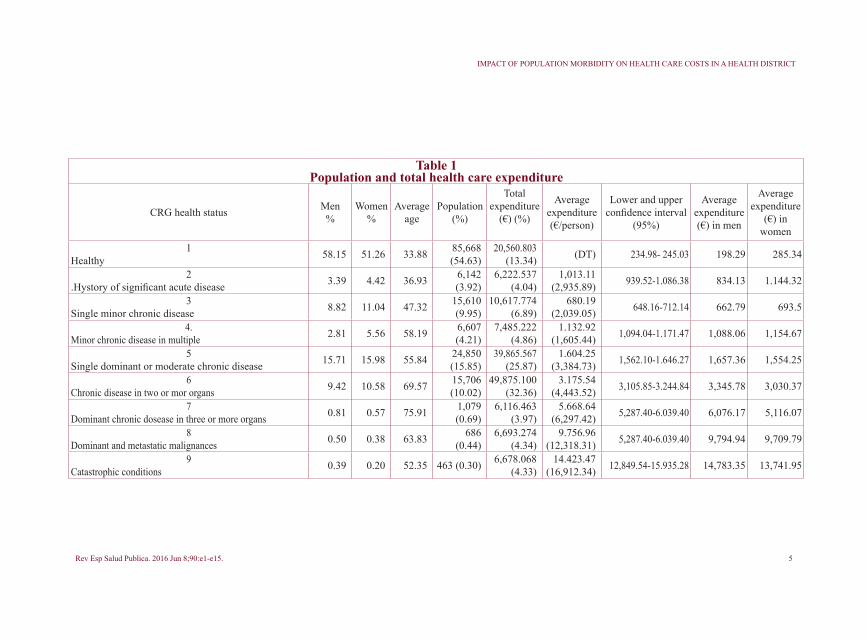
of healthy subjects at 58.15%, with women at 51.26% (table 1). Health statuses 2, 3, 4 and 6 were more present in women, while both sexes showed a similar distribution for health status 5 (15.98% and 15.71%). In the statuses with higher health morbidity (status-es 7, 8 and 9) there was a slightly higher pro-portion of men than women (0.81%, 0.50% and 0.39% against 0.57%, 0.38% and 0.20%, respectively).
The average age of the population in each health status rose in relation to the increase in the burden of disease, from 33.88 years in the status of healthy subjects until health status 7, where the average age was 75.9, after which it decreased to 63.8 in status 8 and 52.5 in status 9.
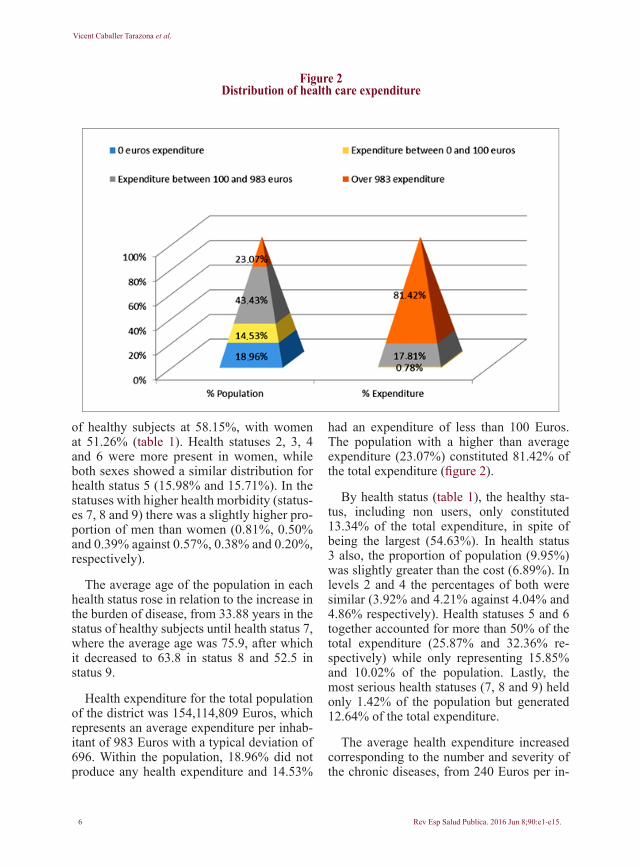
Health expenditure for the total population of the district was 154,114,809 Euros, which represents an average expenditure per inhab-itant of 983 Euros with a typical deviation of 696. Within the population, 18.96% did not produce any health expenditure and 14.53%
had an expenditure of less than 100 Euros. The population with a higher than average expenditure (23.07%) constituted 81.42% of the total expenditure (figure 2).
By health status (table 1), the healthy sta-tus, including non users, only constituted 13.34% of the total expenditure, in spite of being the largest (54.63%). In health status 3 also, the proportion of population (9.95%) was slightly greater than the cost (6.89%). In levels 2 and 4 the percentages of both were similar (3.92% and 4.21% against 4.04% and 4.86% respectively). Health statuses 5 and 6 together accounted for more than 50% of the total expenditure (25.87% and 32.36% re-spectively) while only representing 15.85% and 10.02% of the population. Lastly, the most serious health statuses (7, 8 and 9) held only 1.42% of the population but generated 12.64% of the total expenditure.
The average health expenditure increased corresponding to the number and severity of the chronic diseases, from 240 Euros per in-
Figure 2Distribution of health care expenditure
IMPA
CTO
DE
LA M
ORB
ILID
AD
EN
LO
S CO
STES
ASI
STEN
CIA
LES
DE
UN
DEP
ART
AM
ENTO
DE
SALU
D D
E LA
CO
MU
NID
AD
VA
LEN
CIA
NA
...
IMPACT OF POPULATION MORBIDITY ON HEALTH CARE COSTS IN A HEALTH DISTRICT
habitant in level 1 to 14,423 Euros in level 9. The average expenditure of each health status was significantly different from the others in all possible cases, as is shown by the values in the last column of table 2. By sex, the average health expenditure for women was 1,000 Eu-ros and for men 964 Euros (p=0.007), and was also higher for women in health statuses 1, 2, 3 and 4, while in the remaining health statuses (5 to 9) men registered a greater consumption, such that the distribution of average cost by sex collected in the last two columns of table 1 by health status proved to be significantly different (p=0.000).
Differentiated by age range, sex and health status (figure 3) the total expenditure for each of the age groups 15-44 and 65-74 was in the order of 32,000,000 Euros. In the first group the total expenditure for women was 18,596,376 Euros and for men 11,814,668, a difference caused fundamentally by health statuses 1 and 2. In the age range of 65-74, expense was similar in both sexes (16,000,000 Euros) and had the same distribution by health status. The age range 75-84 was the group with the third greatest total expenditure, with 14,194,382 Euros for men and 14,502,472 Euros for women, with a similar distribution in regards to the total expenditure by health status. Looking, however, at average expend-iture, this age range (75-84) had the highest, with 9,946 Euros for women and 8,696 Euros for men, the differences owing fundamentally to a greater expense in health status 9. In aver-age expenditure, this age range was followed by, in order, that of 65-74; 55-64 and 45-54, in all of which the average expenditure on men was greater than that on women, equally due to the expenditure on those in health status 9.
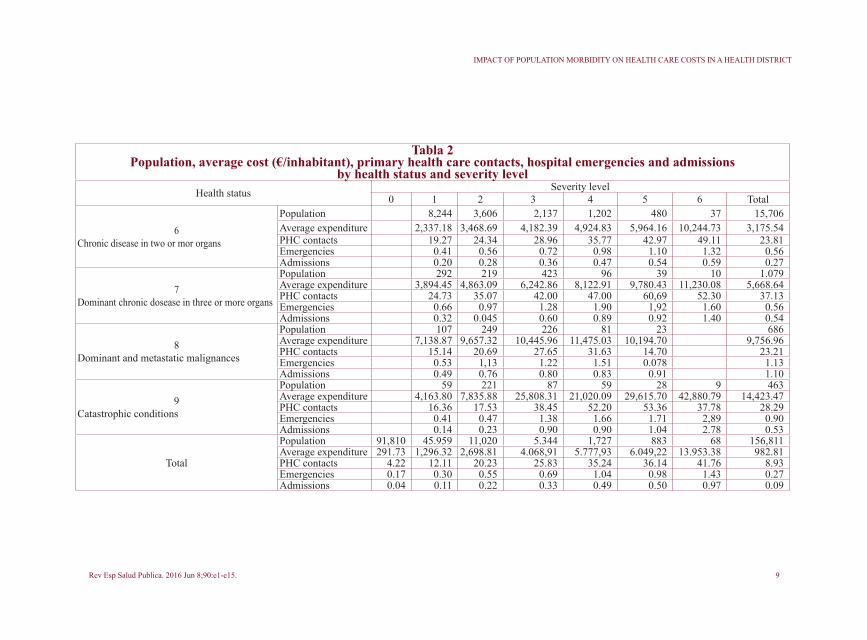
In lower levels of severity (ACRG3) (ta-ble 2), the population group with the greatest average expenditure was health status 9, with severity level 6 (42,881 Euros), in spite of se-verity level 1 having an average expenditure one tenth of this (4,163 Euros). Within health statuses 6 and 7, the variability between sever-ity levels was very great, with differences of
up to 8,000 Euros between the most extreme levels.
The average number of primary health care contacts was close to 9 per inhabitant, going from 3.81 contacts in the healthy status to its highest value (37) in health state 7 (table 2). This means that no continuous increase in contacts related to worsening health was ob-served, rather that the number of contacts de-creased for the worst health statuses 8 and 9 to 23 and 28 respectively. The same occurred with the increase in severity within health sta-tuses 5, 7, 8 and 9, with the number of con-tacts descending in the last severity status.
An average of 0.27 hospital emergencies per inhabitant was seen. The health status for healthy subjects had an average of 0.16 emer-gencies, while health status 7 produced 1.13. Health statuses 8 and 9 had fewer emergen-cies than status 7.
Total hospital admissions were 13,911, which represented an average of 0.09 admis-sions per inhabitant. In health status 8 the av-erage number of admissions was at 1.10, in health status 7 at 0.54 and in 9 at 0.53.
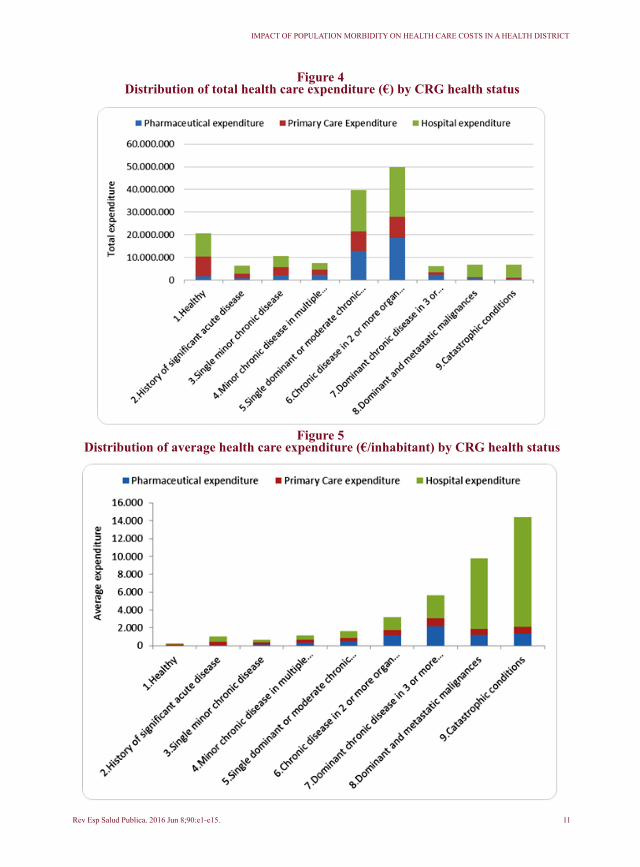
An itemised breakdown showed hospital expenditure at 75,933,585 Euros (49.27%), primary health care at 36,562,637 (23.72%) and that of outpatient pharmacy at 41,618,585 Euros (27.01%). Health statuses 6 and 5 (figure 4) held the largest share of hospital expenditure (22,033,722 and 18,353,528 Euros respectively), of primary health care (9,343,135 and 8,746,380 Euros respectively) and of outpatient pharmaceutical expenditure (18,498,242 and 12,765,659 Euros).
Average hospital expenditure was 484.24 Euros/inhabitant, that of primary health care 233.16 Euros/inhabitant and that of outpa-tient pharmacy 265.41 Euros/inhabitant. The distribution between the three items changed according to worsening health status (figure 5). Those in health status 2 registered a hospi-tal expenditure of 57.34%. In health statuses 3 to 7, the outpatient pharmacy expenditure
Rev Esp Salud Pública. 2016;Vol. 90: 8 de junio: e1-e15. 7

Vicent Caballer Tarazona et al.
8 Rev Esp Salud Publica. 2016 Jun 8;90:e1-e15.
Table 2Population, average cost (€/inhabitant), primary health care contacts, hospital emergencies and admissions
by health status and severity levelHealth status Severity level
0 1 2 3 4 5 6 Total
1Healthy
Population 85,668 85,668Average expenditure 240.01 240.01PHC contacts 3.81 3.81Emergencies 0.16 0,16Admissions 0.03 0.03
2.Hystory of significant acute disease
Population 6,142 6,142Average expenditure 1.013.11 1,013.11PHC contacts 9.95 9.95Emergencies 0.39 0,39Admissions 0.14 0.14
3Single minor chronic disease
Population 14,805 805 15,610Average expenditure 632.95 1,549.00 680.19PHC contacts 8.24 23.09 9.00Emergencies 0.24 1.05 0.28Admissions 0,06 0.020 0.07
4Minor chronic disease in multiple
Population 4,088 1,425 988 106 6.607Average expenditure 931.83 1.288.19 1,629.93 2,168.29 1,132.92PHC contacts 11.07 13.75 20.10 29.00 13.28Emergencies 0.29 0.33 0.53 0.67 0.34Admissions 0.08 0.13 0.19 0.26 0.11
5Single dominant or moderate chronic disease
Población 18,364 4,495 1,483 183 313 12 24,850Gasto medio 1.360,43 1,990.82 2,663.04 4,806.29 3,301.94 5.962.24 1,604.25Contactos AP 12.01 17.87 19.52 25.31 22.66 13.33 13.75Urgencias 0.28 0.47 0.47 0.73 0.62 0.50 0.33Ingresos 0.11 0.17 0.19 0.30 0.32 0.42 0.13
IMPACT OF POPULATION MORBIDITY ON HEALTH CARE COSTS IN A HEALTH DISTRICT
Tabla 2Population, average cost (€/inhabitant), primary health care contacts, hospital emergencies and admissions
by health status and severity levelHealth status Severity level
0 1 2 3 4 5 6 Total
6Chronic disease in two or mor organs
Population 8,244 3,606 2,137 1,202 480 37 15,706Average expenditure 2,337.18 3,468.69 4,182.39 4,924.83 5,964.16 10,244.73 3,175.54PHC contacts 19.27 24.34 28.96 35.77 42.97 49.11 23.81Emergencies 0.41 0.56 0.72 0.98 1.10 1.32 0.56Admissions 0.20 0.28 0.36 0.47 0.54 0.59 0.27
7Dominant chronic dosease in three or more organs
Population 292 219 423 96 39 10 1.079Average expenditure 3,894.45 4,863.09 6,242.86 8,122.91 9,780.43 11,230.08 5,668.64PHC contacts 24.73 35.07 42.00 47.00 60,69 52.30 37.13Emergencies 0.66 0.97 1.28 1.90 1,92 1.60 0.56Admissions 0.32 0.045 0.60 0.89 0.92 1.40 0.54
8Dominant and metastatic malignances
Population 107 249 226 81 23 686Average expenditure 7,138.87 9,657.32 10,445.96 11,475.03 10,194.70 9,756.96PHC contacts 15.14 20.69 27.65 31.63 14.70 23.21Emergencies 0.53 1,13 1.22 1.51 0.078 1.13Admissions 0.49 0.76 0.80 0.83 0.91 1.10
9Catastrophic conditions
Population 59 221 87 59 28 9 463Average expenditure 4,163.80 7,835.88 25,808.31 21,020.09 29,615.70 42,880.79 14,423.47PHC contacts 16.36 17.53 38.45 52.20 53.36 37.78 28.29Emergencies 0.41 0.47 1.38 1.66 1.71 2,89 0.90Admissions 0.14 0.23 0.90 0.90 1.04 2.78 0.53
Total
Population 91,810 45.959 11,020 5.344 1,727 883 68 156,811Average expenditure 291.73 1,296.32 2,698.81 4.068,91 5.777,93 6.049,22 13.953.38 982.81PHC contacts 4.22 12.11 20.23 25.83 35.24 36.14 41.76 8.93Emergencies 0.17 0.30 0.55 0.69 1.04 0.98 1.43 0.27Admissions 0.04 0.11 0.22 0.33 0.49 0.50 0.97 0.09
Rev Esp Salud Publica. 2016 Jun 8;90:e1-e15. 9

Vicent Caballer Tarazona et al.
10 Rev Esp Salud Publica. 2016 Jun 8;90:e1-e15.
Figure 3Total health expenditure (€) and average (€/inhabitant) by sex, age range
and CRG health status
IMPACT OF POPULATION MORBIDITY ON HEALTH CARE COSTS IN A HEALTH DISTRICT
Rev Esp Salud Publica. 2016 Jun 8;90:e1-e15. 11
Figure 4 Distribution of total health care expenditure (€) by CRG health status
Figure 5 Distribution of average health care expenditure (€/inhabitant) by CRG health status
Vicent Caballer Tarazona et al.
12 Rev Esp Salud Publica. 2016 Jun 8;90:e1-e15.
increased to reach 38.77% in health status 7, while at the same time primary health care expenditure decreased. This tendency in the distribution changed drastically in health sta-tuses 8 and 9, in which hospital expenditure (80.86% and 85.23% respectively) increased considerably at the expense of the other two expenditure items.
Differentiated by sex, average hospital ex-penditure was significantly greater for men (499.06 Euros) than for women (470.04 Eu-ros) (p=0.012), the opposite to primary health care, which was lower for men (209.18 Euros against 256.13 Euros for women) (p=0.000), as was outpatient pharmacy (256.06 Euros for men and 274.35 Euros for women) (p=0.000). Regarding health statuses, no statistically sig-nificant difference by sex were found in sta-tuses 3, 4, 8 and 9. In health statuses 1 and 2, however, the average total expenditure was less for men (198.29 Euros against 285.34 Euros in status 1 and 834.13 Euros against 1,114.32 Euros in status 2), while in health statuses 5, 6 and 7 men were responsible for a greater expenditure, specifically 1,657.36, 3,345.78 and 6,076.17 Euros respectively, compared with women who had an aver-age expenditure of 1,554.25 in status 5, of 3,030.37 in status 6 and of 5,116.07 Euros in status 7.
DISCUSSIÓN
The results of this study show a concentra-tion of health expenditure in a reduced group of patients of greater age and comorbidity according to Clinical Risk Groups. A differ-ent distribution by itemised expenditure ac-cording to levels of morbidity and severity was also observed.
A grouping by morbidity according to stratification by Clinical Risk Groups was obtained that was similar to another study previously carried out, also in the Valencia Community(11), but that presented differenc-es with respect to other studies undertaken in other parts of Spain(3,15,16). In the case of our study, the percentage of health status-
es(4,5) and 6 was greater, but the percentage of the status for healthy and non-users and status 2 was lower. This could be due to the year of the study(16) and especially to a differ-ent population structure(2-4), given that in the health district analysed a much older popula-tion was found as a consequence of the high number of elderly people from other Euro-pean countries residing in the Marina Alta area. Nevertheless, these differences could also originate due to a better codification of the electronic registers, which have been improved over recent years by the medical practitioners.
The increase in the greater morbidity health statuses with age agrees with other works(3,4,20), and there is also an increase in the status for healthy subjects in the group of over 85, a phenomenon known as “hypothe-sis of compression of morbidity”(22).
The average expenditure per inhabitant of 983 Euros agrees with the value obtained in other studies carried out in Spain, which ob-tained an average expenditure of 842.8 Eu-ros(13) in 2005 and 685.5 Euros in 2007(4), and in Canada, where the average expenditure for subjects over 19 was $1,382 in 2014(5). The differences in expenditure may be due to a different morbidity, but above all to the way of calculating the expenditure and the items included. According to data from the Ministry of Health in 2013 the consolidat-ed public health expenditure in the Valencia Community was 1,109 Euros/inhabitant and for all Spain together 1,208 Euros(23), which included capital expenditure and the global functioning of the Spanish health system.
As in previous works(2-5), this average ex-penditure increased progressively from the milder health statuses to the more complex, with the exception of level 3 that showed a lower average health expenditure, practical-ly half, than that of the patients of the lower level 2, possibly due to acute patients re-quiring a greater hospital consumption than chronic patients. Moreover, in all the works studied, the cost of health status 9 showed a
IMPACT OF POPULATION MORBIDITY ON HEALTH CARE COSTS IN A HEALTH DISTRICT
Rev Esp Salud Publica. 2016 Jun 8;90:e1-e15. 13
much higher value in comparison to the rest of the statuses.
Lastly, it is noteworthy that the average expenditure for health statuses 6 and 7 is double that of statuses 5 and 6 respectively, as occurred in another previous work(2).
The distribution of expenditure by sex and morbidity showed a greater average cost for women in health statuses 1 to 4, contrary to what occurs in the rest of the more serious states, possibly due to the greater life expec-tation of women, and which is contradicted by other works where women had a higher expenditure in all health statuses(3).
In all the age groups, the total expenditure was slightly higher for men than women, ex-cept in that of over 85, where the number of women is greater than that of men, and above all in the group 15-44 due to health statuses 1 and 2, possibly owing to pregnancies.
As well as contrasting the distribution of population by morbidity and average ex-penditure with other works carried out in Spain and other countries, the main con-tribution of this study is to analyse activity in primary and hospital health care and the distribution of the individual expenditure between hospital, primary health care and outpatient pharmacy for the whole popula-tion of a health district, an analysis for which there is no data available from other works for comparison. Some studies have analysed the activity in each area, but not the expend-iture(2).
An increase was observed in primary health care activity with the health statuses and the severity level within each state, with the exception of the worst states and severity levels, which may be due to these requiring greater hospital care, something corroborat-ed by the higher number of admissions and hospital emergencies carried out in health statuses 7, 8 and 9.
Although the average hospital expenditure
in the district was the highest of the three expenditure items studied, followed by that of outpatient pharmacy and primary health care, this was not so for all the health status-es. For example, for the population of health state 2 the weight of the hospital expendi-ture was greater than average, due to their condition of acute patients without chronic disease. In health statuses 3 to 7, however, an increase in outpatient pharmacy expenditure was observed due to the greater consumption of pharmaceuticals for the treatment of the chronic diseases. This coincides with other works that have studied outpatient pharma-ceutical expenditure in relation to chronic conditions(11) in such a way that the present work confirms the importance of this kind of expenditure per patient in health statuses 6, 7 and 8.
This study also observed the significant average hospital expenditure in these health statuses (6, 7 and 8) and strikingly in status 9, all above average. Although it is difficult to compare these results with those of oth-er countries such as Canada and with other classification systems(5), it has been possible to confirm an increase of average hospital expenditure with morbidity, exponentially so for the most severe statuses (health statuses 8 and 9).
Nevertheless, despite the average expend-iture growing exponentially in the most se-vere statuses, it is health statuses 5 and 6 that contain the greatest total expenditure in all their components, due to the particularity of the very elderly population served by the district.
Thus, the results of this article offer a de-scriptive map of the distribution of popula-tion regarding health statuses and health care consumption and the distribution by items of expenditure for each health status, basic information for preparing any management strategy or health care policy. The next line of research will be to replicate this study in other health districts in the Valencia Commu-nity to verify the results and extrapolate their

Vicent Caballer Tarazona et al.
14 Rev Esp Salud Publica. 2016 Jun 8;90:e1-e15.
consumption structure and health statuses for the whole of the Valencia Community.
The modelling of the expenditure of the burden of disease will allow the establish-ment of systems of capitation financing based on diagnostics and strategies for man-agement of chronic patients.
In general, these classification systems are fundamental to know the state of health of the population in the interest of greater precision in focusing and directing policies for prevention, awareness and management of diseases. As such, this study represents a useful contribution to the state of the art in a research field still in its initial phase in Spain.
BIBLIOGRAFÍA
1. García-Goñi M, Hernández-Quevedo C, Nuño-So-linis R, Paouluci F. Pathways towards chronic care-fo-cused healthcare systems: Evidence from Spain. Health Policy. 2012;108(2-3):236-245.
2. Carreras M, García-Goñi M, Ibern P, Coderch J, Vall-Llosera L, Inoriza JM. Estimates of patient costs related with population morbidity: can indirect costs affect the results? Eur J Heal Econ. 2010;12(4):289-295.
3. Carreras M, Ibern P, Coderch J, Sánchez I, Inoriza JM. Estimating lifetime healthcare costs with morbidi-ty data. BMC Health Serv Res. 2013;13(1):1-11.
4. Coderch J, Sánchez-Pérez I, Ibern P, Carreras M, Perez X, Inoriza JM. Predicción del riesgo individual de alto coste sanitario para la identificación de pacientes crónicos complejos. Gac Sanit. 2014;28(4):292-300.
5. Seow H-Y, Sibley LM. Developing a dashboard to help measure and achieve the triple aim: a popu-lation-based cohort study. BMC Health Serv Res. 2014;14(1):1-10.
6. Ellis RP, Pope GC, Iezzoni L, Ayanian JZ, Bates DW, Burstin H et al. Diagnosis-based risk adjustment for Medicare capitation payments. Health Care Financ Rev. 1996;17(3):101-128.
7. Pope GC, Kautter J, Ellis RP, Ash AS, Ayanian JZ, Lezzoni L et al. Risk adjustment of Medicare capi-tation payments using the CMS-HCC model. Health Care Financ Rev. 2004;25(4):119-141.
8. Robst J, Levy JM, Ingber MJ. Diagnosis-based risk
adjustment for medicare prescription drug plan pay-ments. Health Care Financ Rev. 2007;28(4):15-30.
9. Starfield B, Weiner J, Mumford L, Steinwachs D. Ambulatory care groups: a categorization of diagno-ses for research and management. Health Serv Res. 1991;26(1):53-74.
10. Hughes J, Verill R, Eisenhandler J, Goldfield N, Mul-doon J, Neff J. Clinical Risk Groups (CRGs): A Clas-sification System for Risk-Adjusted Capitation-Based Payment and Health Care Management. Med Care. 2004;42(1):81-90.
11. Vivas-Consuelo D, Usó-Talamantes R, Guada-lajara-Olmeda N, Trillo-Mata J-L, Sancho-Mestre C, Buigues-Pastor L. Pharmaceutical cost manage-ment in an ambulatory setting using a risk adjust-ment tool. BMC Health Serv Res. 2014;14(1):462.
12. Calderón-Larrañaga A, Abrams C, Po-blador-Plou B, Weiner JP, Prados-Torres A. Apply-ing diagnosis and pharmacy-based risk models to predict pharmacy use in Aragon, Spain: The im-pact of a local calibration. BMC Health Serv Res. 2010;10(1):1-9.
13. Sicras-Mainar A, Serrat-Tarres J. Measurement of relative cost weights as an effect of the retrospective ap-plication of adjusted clinical groups in primary care. Gac Sanit. 2006;20:132-141.
14. Orueta JF, Nuño-Solinis R, Mateos M, Vergara I, Grandes G. Monitoring the prevalence of chronic con-ditions : which data should we use ? BMC Health Serv Res. 2012;12(1): 365.
15. Miguel P De, Caballero I, Javier F, Manera J, Aux-iliadora M, Vicente D. Morbilidad observada en un área sanitaria : variabilidad e impacto en profesion-ales y en financiación. Aten Primaria. 2015;47(5):301-307.
16. Inoriza JM, Coderch J, Carreras M, Vall-Llosera L, García-Goñi M, Lisbona J et al. La medida de la morb-ilidad atendida en una organización sanitaria integrada. Gac Sanit. 2009;23(1):29-37.
17. Vivas D, Guadalajara N, Barrachina I, Trillo J-L, Usó R, de-la-Poza E. Explaining primary health-care pharmacy expenditure using classification of medications for chronic conditions. Health Policy. 2011;103(1):9-15.
18. Orueta JF, Nuño-Solinis R, Mateos M, Vergara I, Grandes G, Esnaola S. Predictive risk modelling in the Spanish population: a cross-sectional study. BMC Health Serv Res. 2013;13(1):269.
19. Brotons C, Moral I, Pitarch M, Sellarès J. Estudio
IMPACT OF POPULATION MORBIDITY ON HEALTH CARE COSTS IN A HEALTH DISTRICT
Rev Esp Salud Publica. 2016 Jun 8;90:e1-e15. 15
evaluativo de los costes asistenciales en atención prima-ria. Atención Primaria. 2007;39(9):485-489.
20. Inoriza JM, Pérez M, Cols M, Sánchez I, Carreras M. Análisis de la población diabética de una comarca: perfil de morbilidad, utilización de recursos, complicaciones y control metabólico. Aten Primaria. 2016;45(9):461-475.
21. Diari Oficial de la Comunitat Valenciana. Decreto Legislativo 1/2005, de 25 de febrero, del Consell de la Generalitat, por el que se aprueba el Texto Refundido de la Ley de Tasas de la Generalitat. DOCV núm. 4971 de 22 de Marzo de 2005.
22. Mor V. The compression of morbidity hypothesis: a review of research and prospects for the future. J Am Geriatr Soc. 2005;53(9 Suppl):S308-S309.
23. Lillo-Fernández de Cuevas JM, Rodríguez-Blas M del C. Estadística de Gasto Sanitario Público, 2013. Available at: http://www.msssi.gob.es/estadEstudios/estadisticas/docs/EGSP2008/egspPrincipalesResultados.pdf