
iMedia Agency Summit: Scottsdale, AZ, December 6, 2015
65
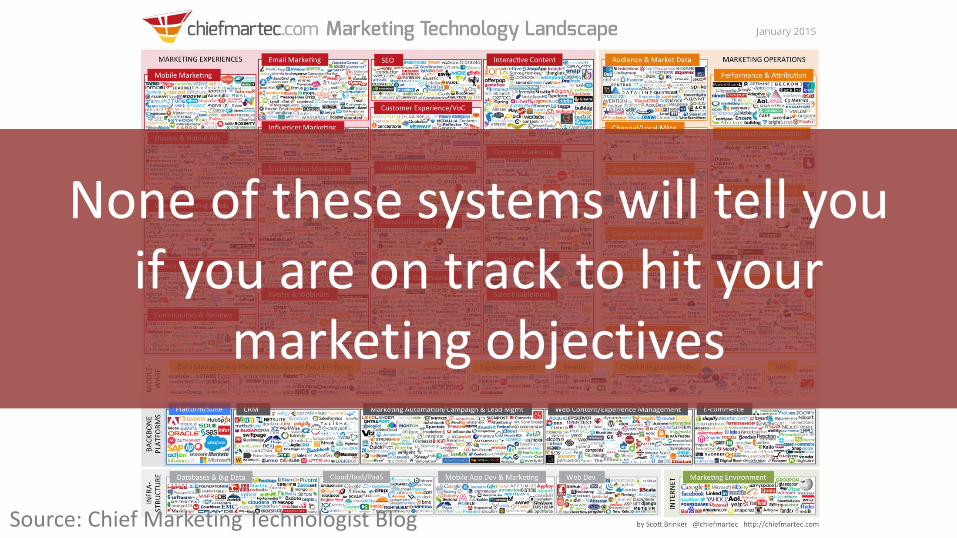
Source: Chief Marketing Technologist Blog None of these systems will tell you if you are on track to hit your marketing objectives
Transcript of iMedia Agency Summit: Scottsdale, AZ, December 6, 2015

Source: Chief Marketing Technologist Blog
None of these systems will tell you if you are on track to hit your
marketing objectives

What is “Pacing”?

Track your pace.
Enter drawing to win Apple Watch.

How many of you are involved in tracking the performance of your
marketing efforts?

Running a marketing campaign is like running a marathon.

If you ignore your pace, you’ll often fail to achieve your
marketing performance goals.
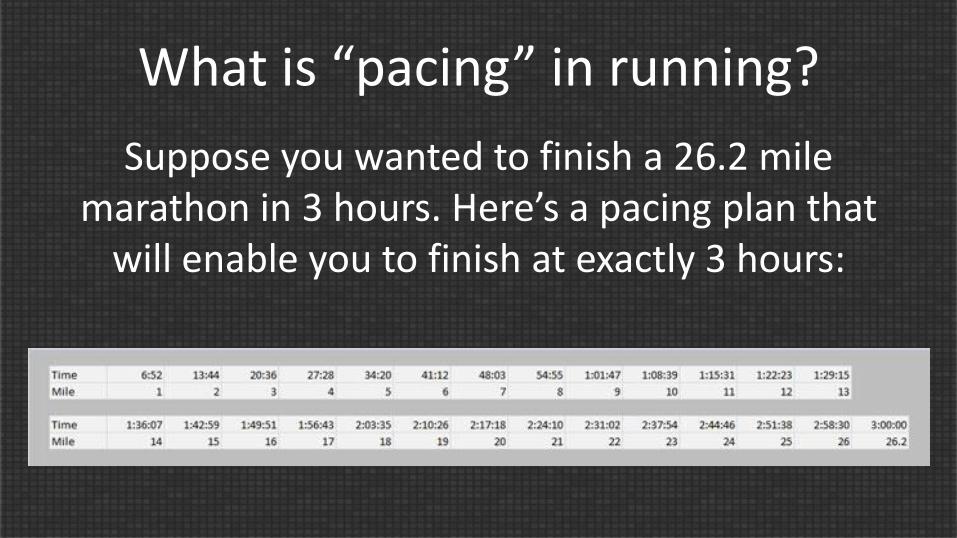
What is “pacing” in running?
Suppose you wanted to finish a 26.2 mile marathon in 3 hours. Here’s a pacing plan that
will enable you to finish at exactly 3 hours:


Unlike marathon runners, most marketers fail to monitor their pace while their campaigns are
running.

Results sometimes fall short of plans
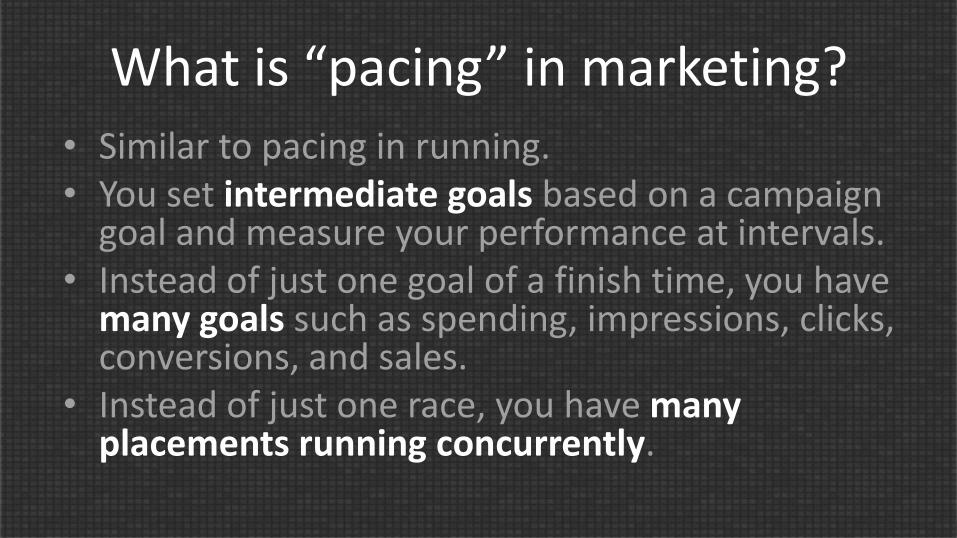
What is “pacing” in marketing? • Similar to pacing in running. • You set intermediate goals based on a campaign
goal and measure your performance at intervals. • Instead of just one goal of a finish time, you have
many goals such as spending, impressions, clicks, conversions, and sales.
• Instead of just one race, you have many placements running concurrently.
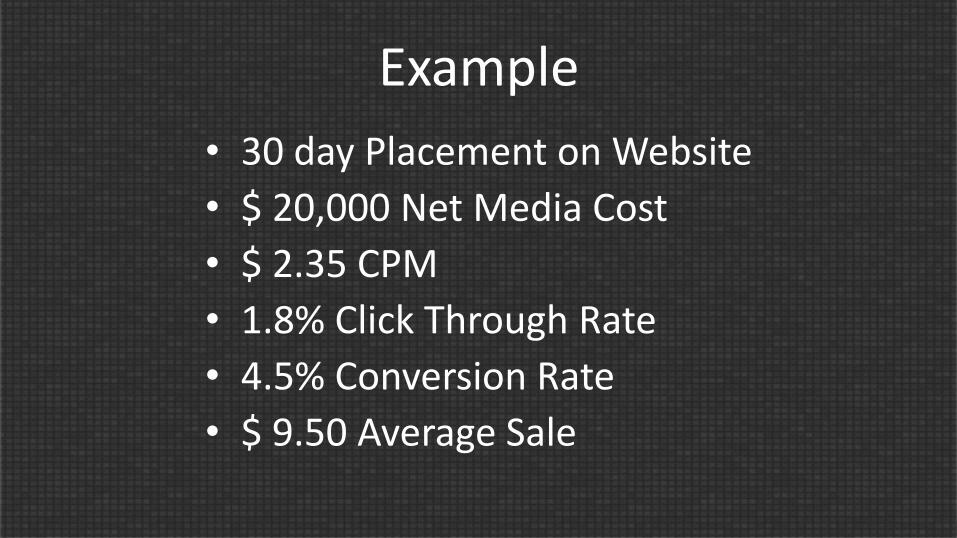
Example
• 30 day Placement on Website
• $ 20,000 Net Media Cost
• $ 2.35 CPM
• 1.8% Click Through Rate
• 4.5% Conversion Rate
• $ 9.50 Average Sale

Implied Goals • Impressions = (Net Media Cost ÷ $ 2.35 CPM ) ×
1000 = 8,510,638 • Clicks = Impressions × 1.8% Click Through Rate
= 153,191 • Conversions = Clicks × 4.5% Conversion Rate
= 6,894 • Sales = Conversions × $ 9.50 Average Sale
= $ 65,489

Interval Goals
Planned Results
Day 1 2 3 4 5 6 7 8 9 10 11 12 13 14 15
Net Media Cost $ 667 $ 1,333 $ 2,000 $ 2,667 $ 3,333 $ 4,000 $ 4,667 $ 5,333 $ 6,000 $ 6,667 $ 7,333 $ 8,000 $ 8,667 $ 9,333 $ 10,000
Impressions 283,688 567,376 851,064 1,134,752 1,418,440 1,702,128 1,985,816 2,269,504 2,553,191 2,836,879 3,120,567 3,404,255 3,687,943 3,971,631 4,255,319
Clicks 5,106 10,213 15,319 20,426 25,532 30,638 35,745 40,851 45,957 51,064 56,170 61,277 66,383 71,489 76,596
Conversions 230 460 689 919 1,149 1,379 1,609 1,838 2,068 2,298 2,528 2,757 2,987 3,217 3,447
Sales $ 2,183 $ 4,366 $ 6,549 $ 8,732 $ 10,915 $ 13,098 $ 15,281 $ 17,464 $ 19,647 $ 21,830 $ 24,013 $ 26,196 $ 28,379 $ 30,562 $ 32,745
Day 16 17 18 19 20 21 22 23 24 25 26 27 28 29 30
Net Media Cost $ 10,667 $ 11,333 $ 12,000 $ 12,667 $ 13,333 $ 14,000 $ 14,667 $ 15,333 $ 16,000 $ 16,667 $ 17,333 $ 18,000 $ 18,667 $ 19,333 $ 20,000
Impressions 4,539,007 4,822,695 5,106,383 5,390,071 5,673,759 5,957,447 6,241,135 6,524,823 6,808,511 7,092,199 7,375,887 7,659,574 7,943,262 8,226,950 8,510,638
Clicks 81,702 86,809 91,915 97,021 102,128 107,234 112,340 117,447 122,553 127,660 132,766 137,872 142,979 148,085 153,191
Conversions 3,677 3,906 4,136 4,366 4,596 4,826 5,055 5,285 5,515 5,745 5,974 6,204 6,434 6,664 6,894
Sales $ 34,928 $ 37,111 $ 39,294 $ 41,477 $ 43,660 $ 45,843 $ 48,026 $ 50,209 $ 52,391 $ 54,574 $ 56,757 $ 58,940 $ 61,123 $ 63,306 $ 65,489

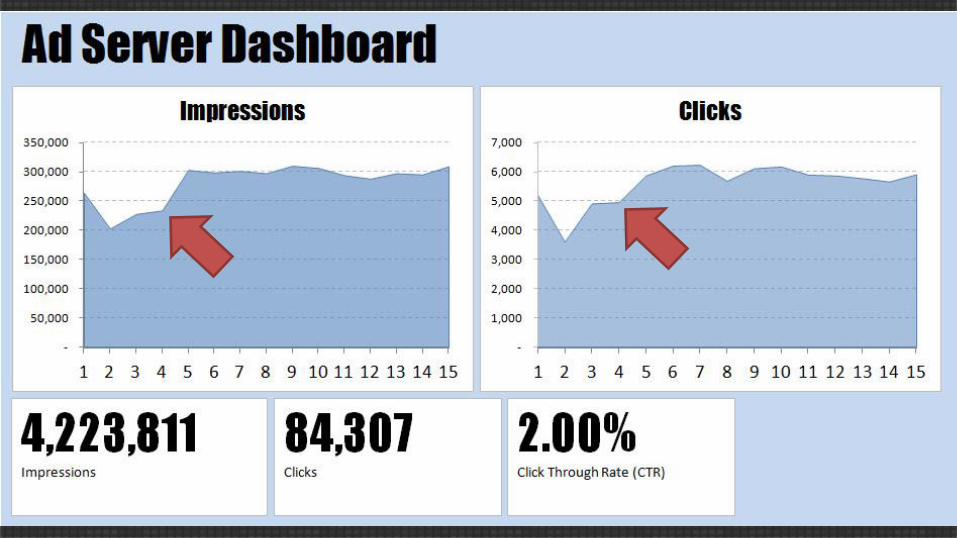
On day 4 of the placement…

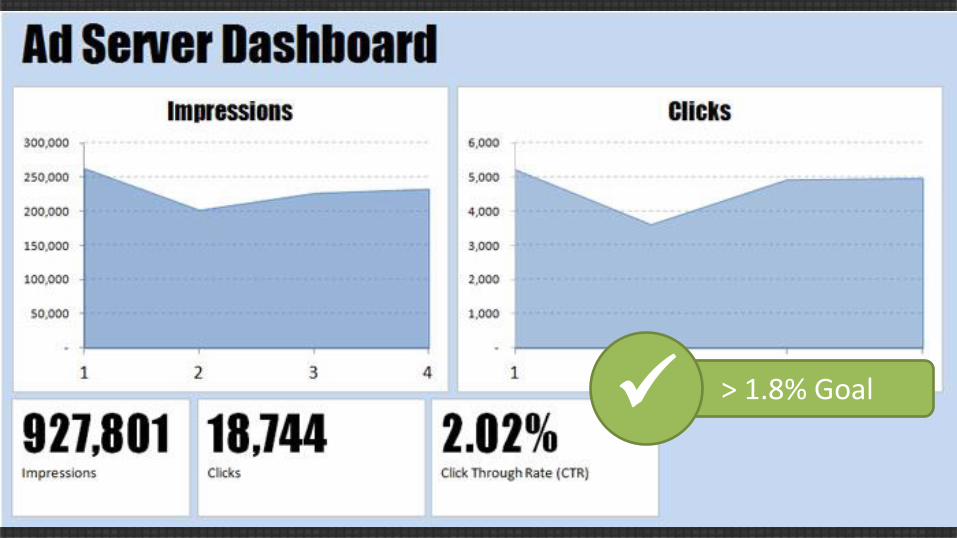
> 1.8% Goal
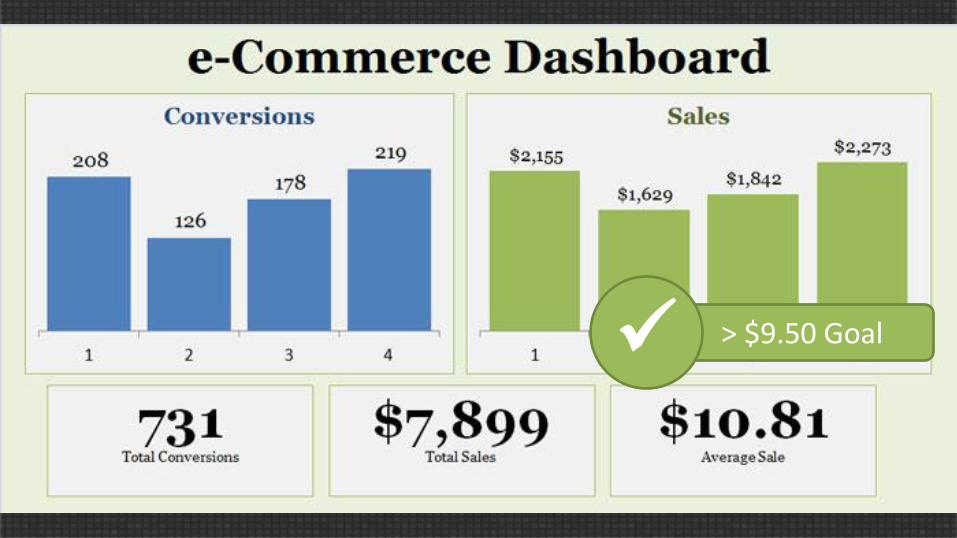
> $9.50 Goal
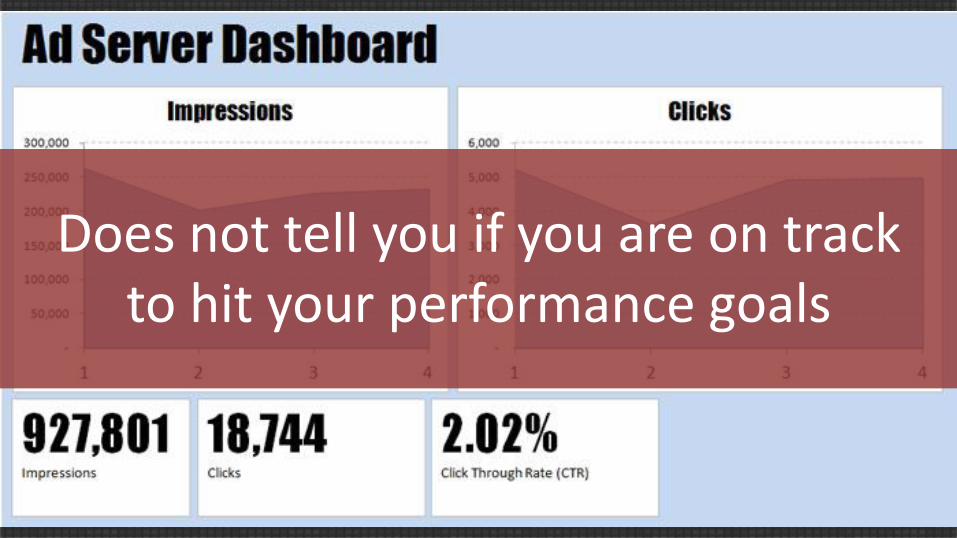
Does not tell you if you are on track to hit your performance goals
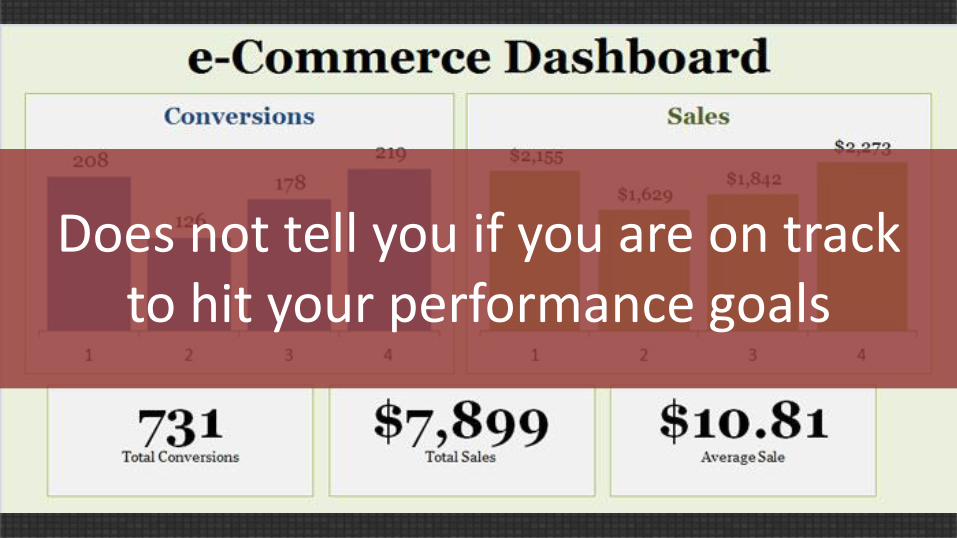
Does not tell you if you are on track to hit your performance goals
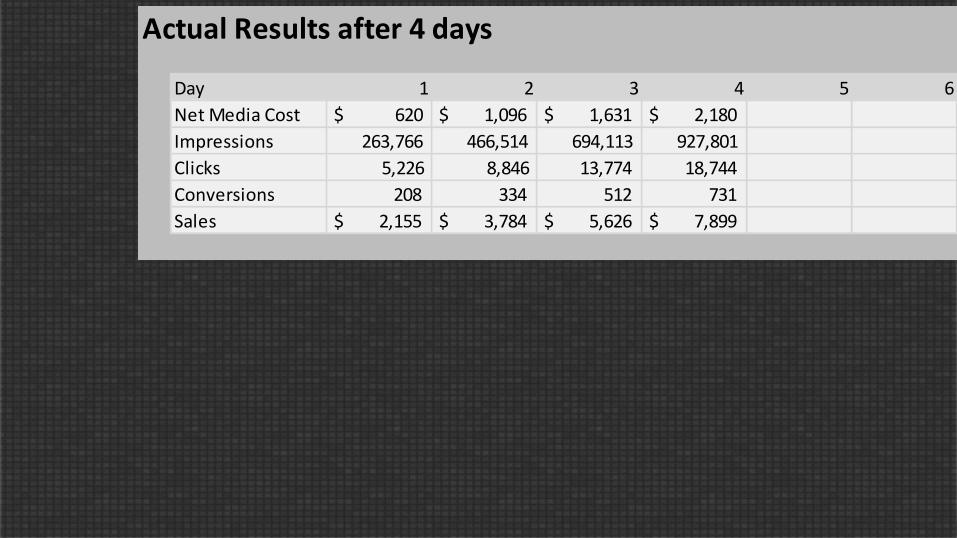
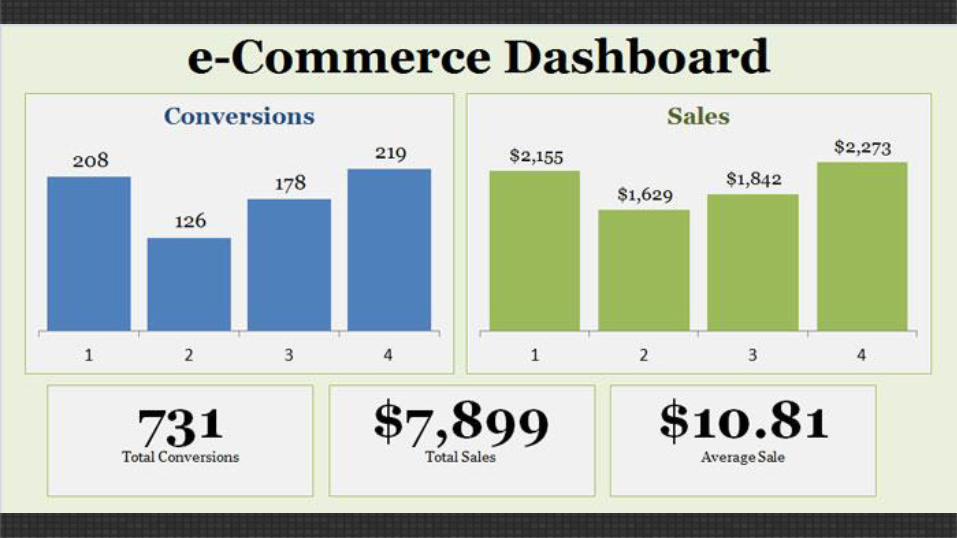
Actual Results after 4 days
Day 1 2 3 4 5 6
Net Media Cost $ 620 $ 1,096 $ 1,631 $ 2,180
Impressions 263,766 466,514 694,113 927,801
Clicks 5,226 8,846 13,774 18,744
Conversions 208 334 512 731
Sales $ 2,155 $ 3,784 $ 5,626 $ 7,899

Planned Results
Day 1 2 3 4 5 6
Net Media Cost $ 667 $ 1,333 $ 2,000 $ 2,667 $ 3,333 $ 4,000
Impressions 283,688 567,376 851,064 1,134,752 1,418,440 1,702,128
Clicks 5,106 10,213 15,319 20,426 25,532 30,638
Conversions 230 460 689 919 1,149 1,379
Sales $ 2,183 $ 4,366 $ 6,549 $ 8,732 $ 10,915 $ 13,098
Actual Results after 4 days
Day 1 2 3 4 5 6
Net Media Cost $ 620 $ 1,096 $ 1,631 $ 2,180
Impressions 263,766 466,514 694,113 927,801
Clicks 5,226 8,846 13,774 18,744
Conversions 208 334 512 731
Sales $ 2,155 $ 3,784 $ 5,626 $ 7,899

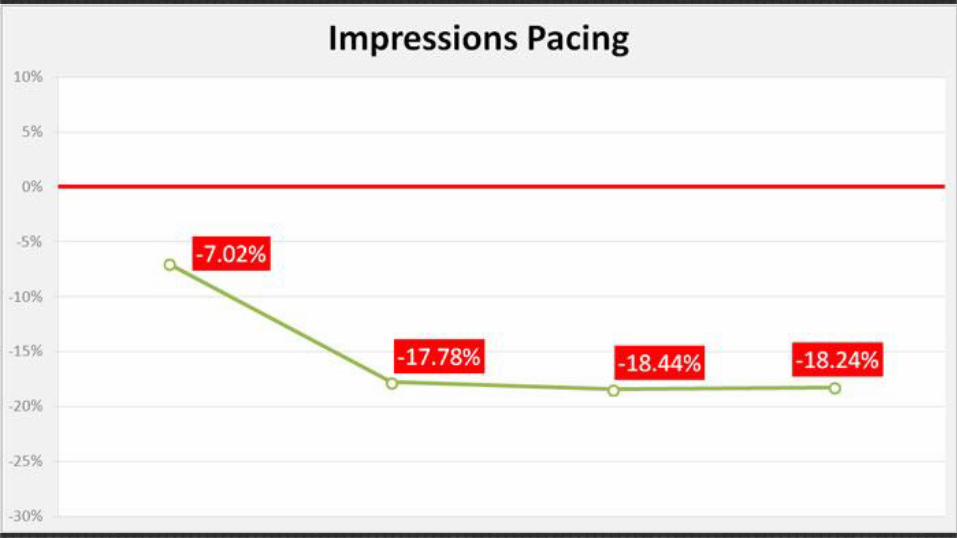
Pacing after 4 days
Day 1 2 3 4 5 6 7
Net Media Cost -7.02% -17.78% -18.44% -18.24%
Impressions -7.02% -17.78% -18.44% -18.24%
Clicks 2.34% -13.38% -10.09% -8.23%
Conversions -9.48% -27.32% -25.73% -20.47%
Sales -1.28% -13.33% -14.09% -9.54%


Simple solution: Fix Ad Delivery
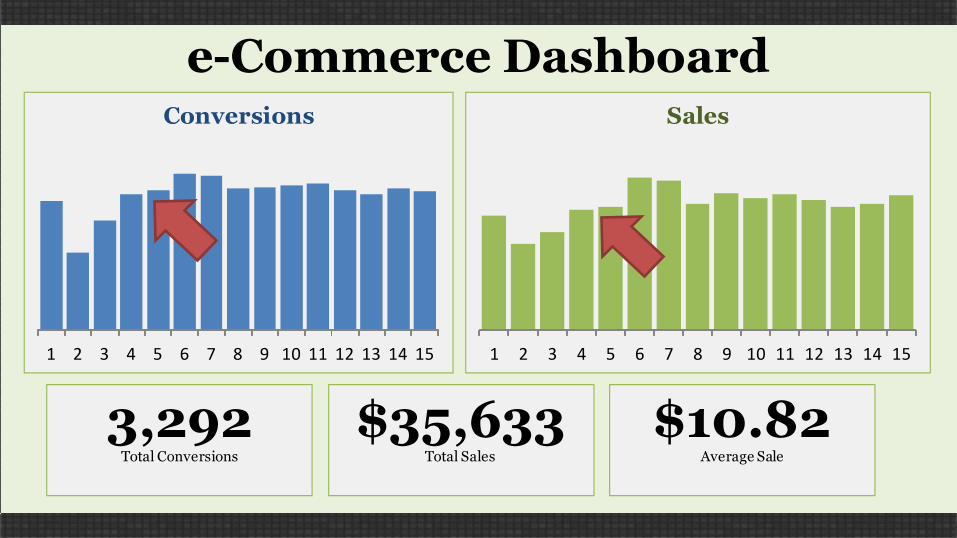
e-Commerce Dashboard
1 2 3 4 5 6 7 8 9 10 11 12 13 14 15
Sales
1 2 3 4 5 6 7 8 9 10 11 12 13 14 15
Conversions
3,292Total Conversions
$35,633Total Sales
$10.82Average Sale
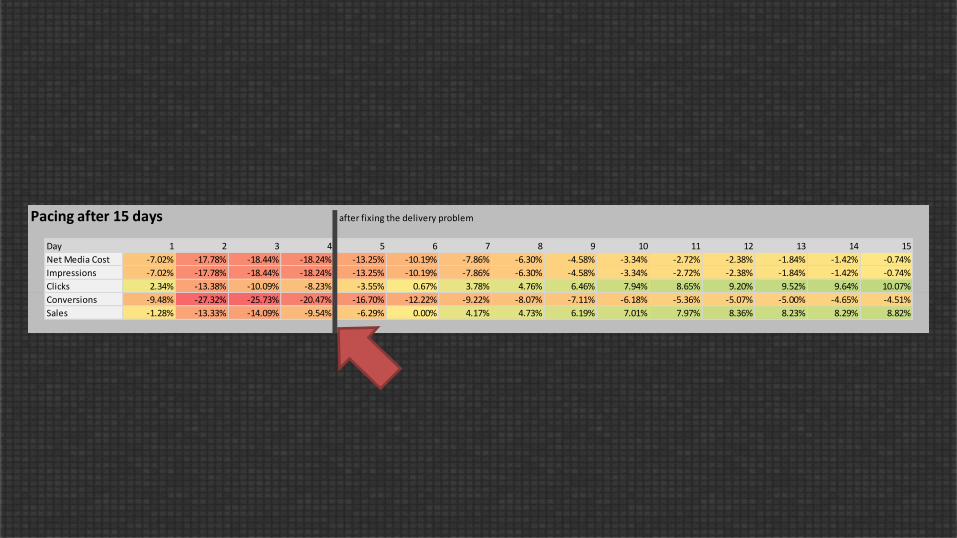
Pacing after 15 days after fixing the delivery problem
Day 1 2 3 4 5 6 7 8 9 10 11 12 13 14 15
Net Media Cost -7.02% -17.78% -18.44% -18.24% -13.25% -10.19% -7.86% -6.30% -4.58% -3.34% -2.72% -2.38% -1.84% -1.42% -0.74%
Impressions -7.02% -17.78% -18.44% -18.24% -13.25% -10.19% -7.86% -6.30% -4.58% -3.34% -2.72% -2.38% -1.84% -1.42% -0.74%
Clicks 2.34% -13.38% -10.09% -8.23% -3.55% 0.67% 3.78% 4.76% 6.46% 7.94% 8.65% 9.20% 9.52% 9.64% 10.07%
Conversions -9.48% -27.32% -25.73% -20.47% -16.70% -12.22% -9.22% -8.07% -7.11% -6.18% -5.36% -5.07% -5.00% -4.65% -4.51%
Sales -1.28% -13.33% -14.09% -9.54% -6.29% 0.00% 4.17% 4.73% 6.19% 7.01% 7.97% 8.36% 8.23% 8.29% 8.82%


So, why aren’t you monitoring your pacing?
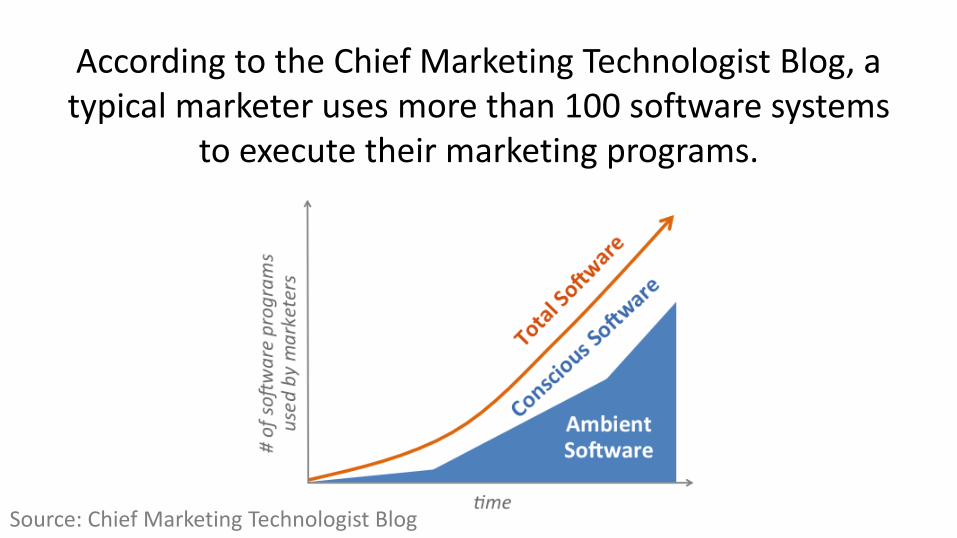
According to the Chief Marketing Technologist Blog, a typical marketer uses more than 100 software systems
to execute their marketing programs.
Source: Chief Marketing Technologist Blog

Source: Chief Marketing Technologist Blog
Source: Chief Marketing Technologist Blog
None of these systems will tell you if you are on track to hit your
marketing objectives


How to build a pacing system
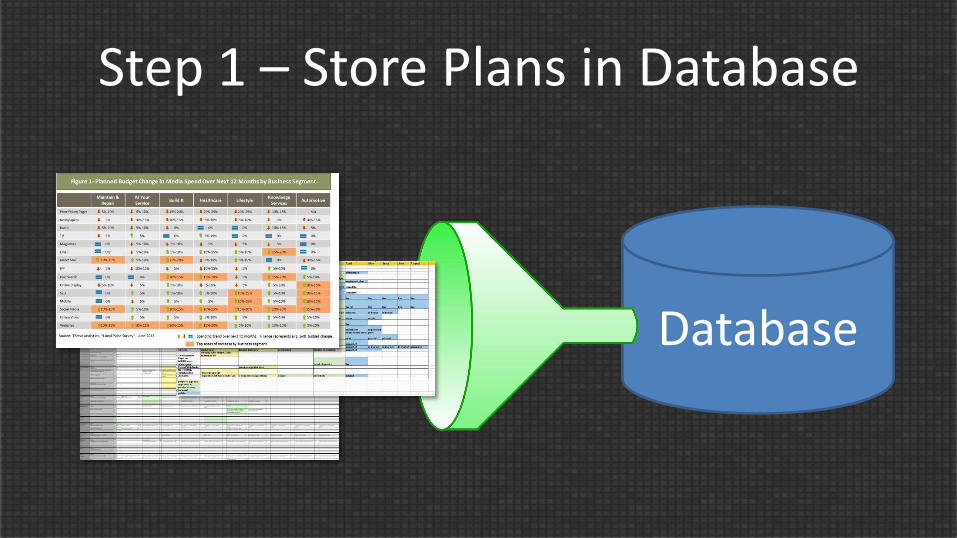
Step 1 – Store Plans in Database
Database
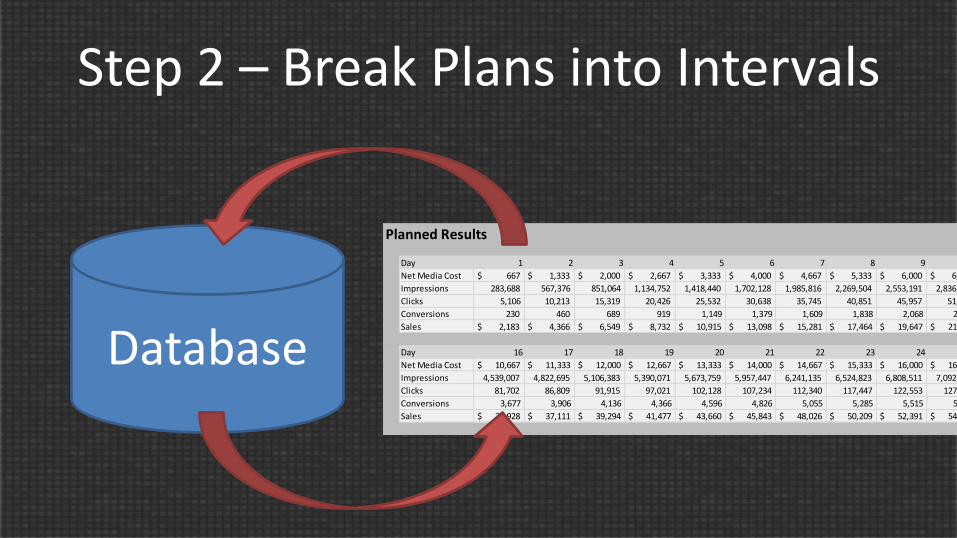
Step 2 – Break Plans into Intervals
Planned Results
Day 1 2 3 4 5 6 7 8 9 10 11 12 13 14 15
Net Media Cost $ 667 $ 1,333 $ 2,000 $ 2,667 $ 3,333 $ 4,000 $ 4,667 $ 5,333 $ 6,000 $ 6,667 $ 7,333 $ 8,000 $ 8,667 $ 9,333 $ 10,000
Impressions 283,688 567,376 851,064 1,134,752 1,418,440 1,702,128 1,985,816 2,269,504 2,553,191 2,836,879 3,120,567 3,404,255 3,687,943 3,971,631 4,255,319
Clicks 5,106 10,213 15,319 20,426 25,532 30,638 35,745 40,851 45,957 51,064 56,170 61,277 66,383 71,489 76,596
Conversions 230 460 689 919 1,149 1,379 1,609 1,838 2,068 2,298 2,528 2,757 2,987 3,217 3,447
Sales $ 2,183 $ 4,366 $ 6,549 $ 8,732 $ 10,915 $ 13,098 $ 15,281 $ 17,464 $ 19,647 $ 21,830 $ 24,013 $ 26,196 $ 28,379 $ 30,562 $ 32,745
Day 16 17 18 19 20 21 22 23 24 25 26 27 28 29 30
Net Media Cost $ 10,667 $ 11,333 $ 12,000 $ 12,667 $ 13,333 $ 14,000 $ 14,667 $ 15,333 $ 16,000 $ 16,667 $ 17,333 $ 18,000 $ 18,667 $ 19,333 $ 20,000
Impressions 4,539,007 4,822,695 5,106,383 5,390,071 5,673,759 5,957,447 6,241,135 6,524,823 6,808,511 7,092,199 7,375,887 7,659,574 7,943,262 8,226,950 8,510,638
Clicks 81,702 86,809 91,915 97,021 102,128 107,234 112,340 117,447 122,553 127,660 132,766 137,872 142,979 148,085 153,191
Conversions 3,677 3,906 4,136 4,366 4,596 4,826 5,055 5,285 5,515 5,745 5,974 6,204 6,434 6,664 6,894
Sales $ 34,928 $ 37,111 $ 39,294 $ 41,477 $ 43,660 $ 45,843 $ 48,026 $ 50,209 $ 52,391 $ 54,574 $ 56,757 $ 58,940 $ 61,123 $ 63,306 $ 65,489
Database

Step 3 – Load Performance Data
Database
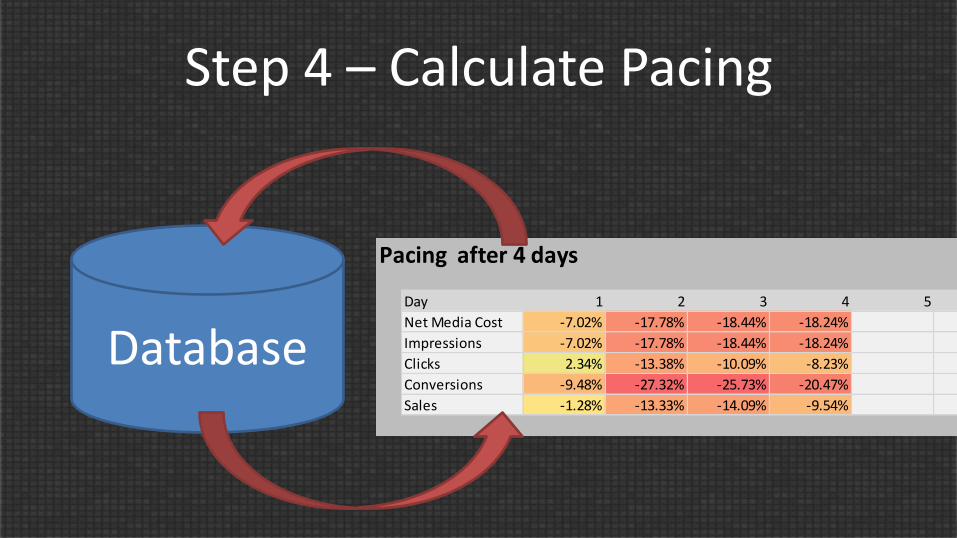
Pacing after 4 days
Day 1 2 3 4 5 6 7
Net Media Cost -7.02% -17.78% -18.44% -18.24%
Impressions -7.02% -17.78% -18.44% -18.24%
Clicks 2.34% -13.38% -10.09% -8.23%
Conversions -9.48% -27.32% -25.73% -20.47%
Sales -1.28% -13.33% -14.09% -9.54%
Step 4 – Calculate Pacing
Database

Step 5 – Visualize

Step 6 - Summarize
KPI 1
-18.4%
KPI 2
+23.7%
KPI 3
-7.7%
Applications of Pacing
1. Monitoring
2. Early Warning
3. Optimization
4. Proving Value of Marketing

Vicki Parker Saves the Day
Ian optimizes his advertising

Pacing is just one of many features of the Bionic
Media Planning System

Centralize All Your Plans

Standardize Media Planning
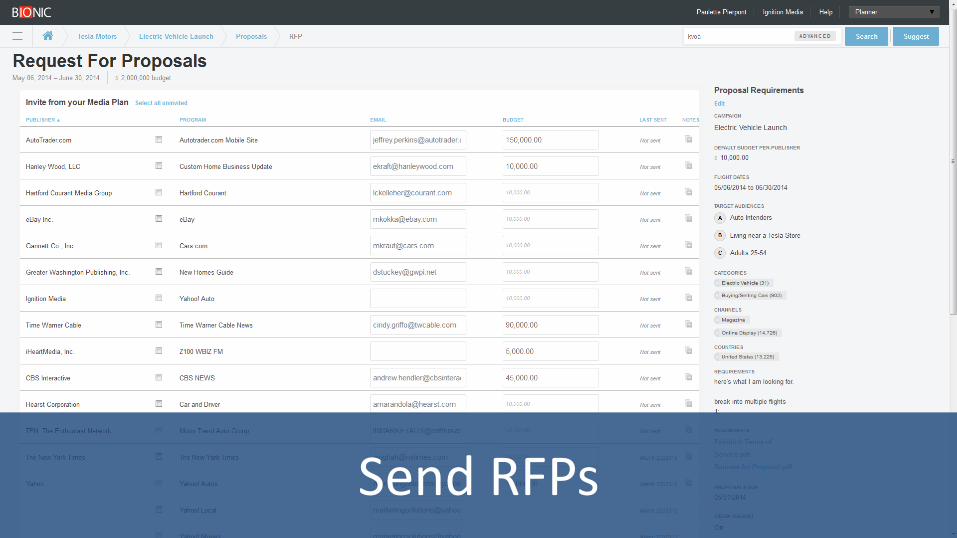
Send RFPs
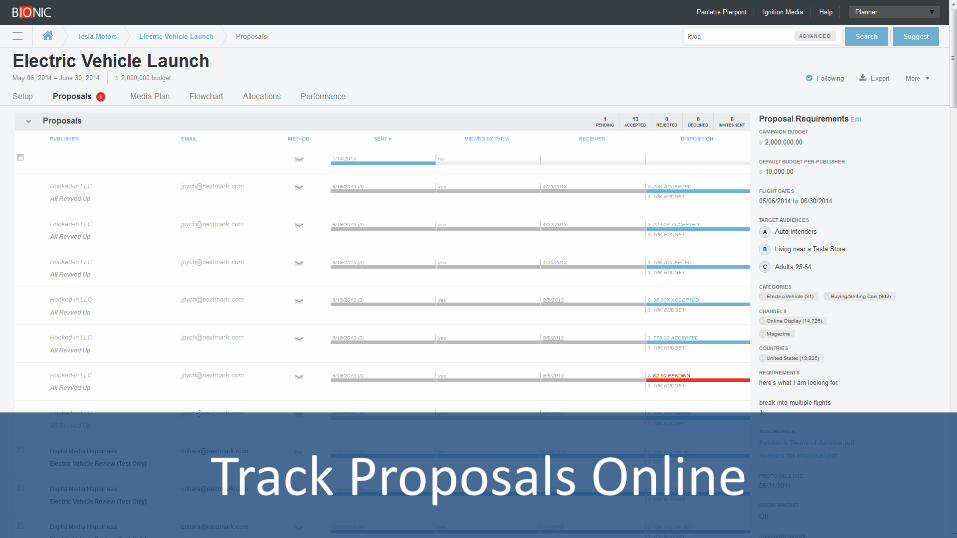
Track Proposals Online

Flowcharting

Campaign Execution
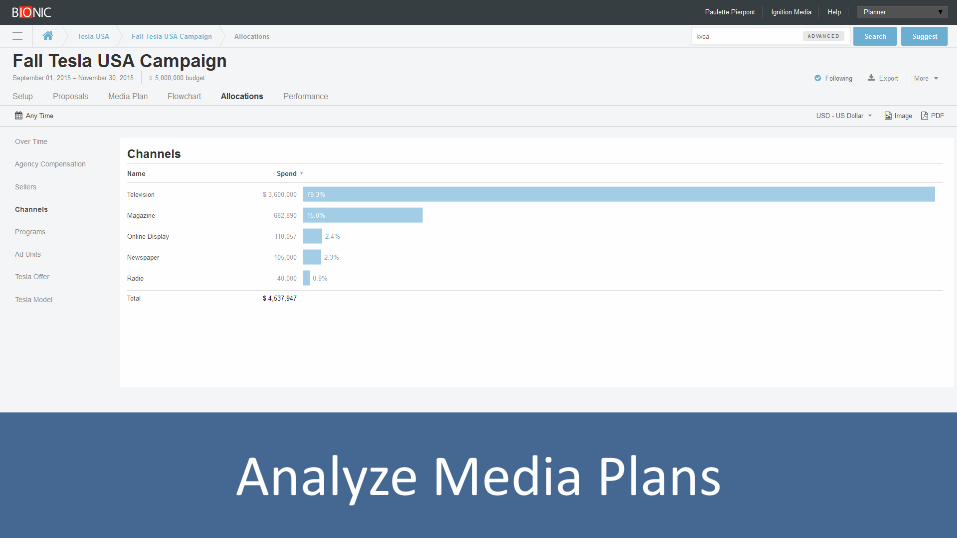
Analyze Media Plans

PowerPoint Output
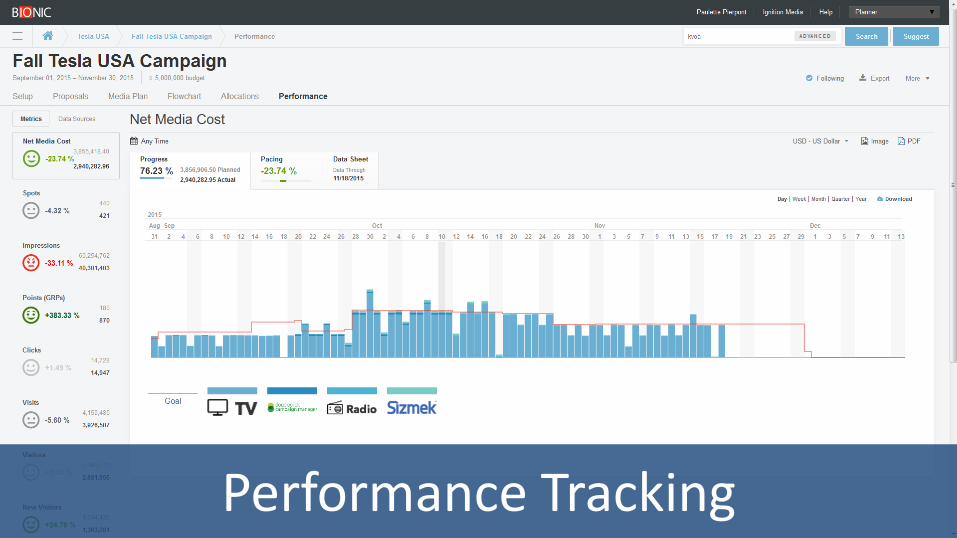
Performance Tracking

See a Full Demo Online

Discussion


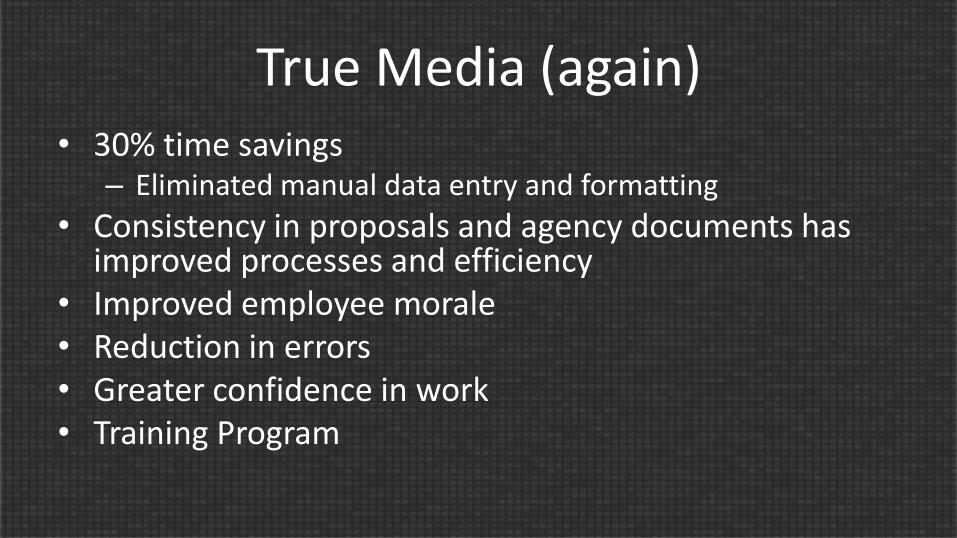
True Media (again) • 30% time savings
– Eliminated manual data entry and formatting
• Consistency in proposals and agency documents has improved processes and efficiency
• Improved employee morale • Reduction in errors • Greater confidence in work • Training Program
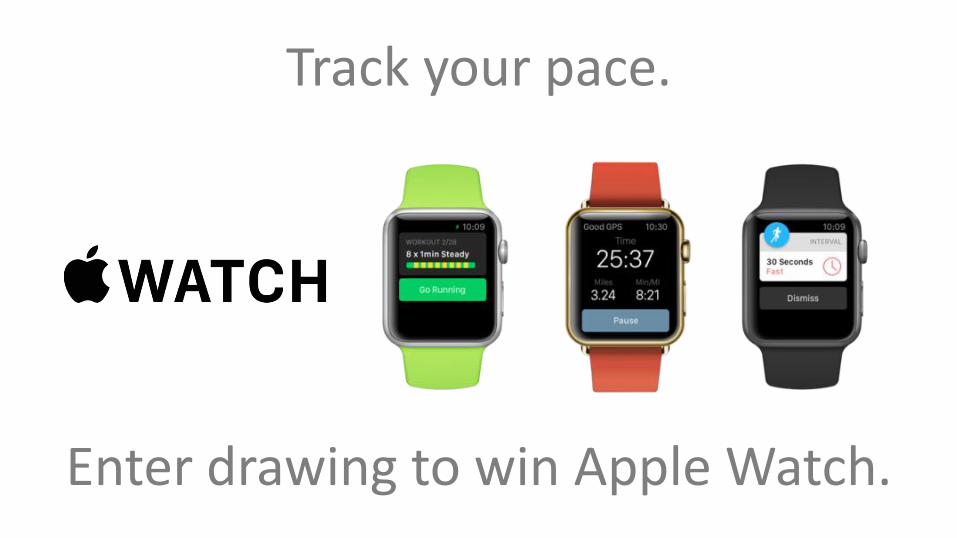
Track your pace.
Enter drawing to win Apple Watch.
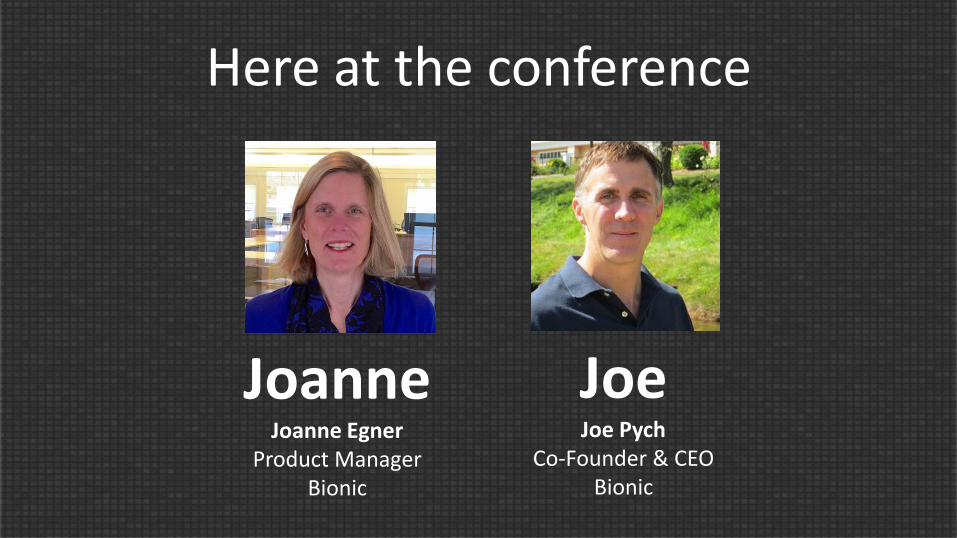
Here at the conference
Joanne Joanne Egner
Product Manager Bionic
Joe Joe Pych
Co-Founder & CEO Bionic


![03 12 Market Update [Sf] Az Scottsdale 85258](https://static.fdocuments.in/doc/165x107/577d20911a28ab4e1e933c69/03-12-market-update-sf-az-scottsdale-85258.jpg)
