Climatological features of electron density in the … · of statistical analysis using long-term...
9
Ann. Geophys., 25, 2561–2569, 2007 www.ann-geophys.net/25/2561/2007/ © European Geosciences Union 2007 Annales Geophysicae Climatological features of electron density in the polar ionosphere from long-term observations of EISCAT/ESR radar H. T. Cai 1,2 , S. Y. Ma 1,2 , Y. Fan 1,2 , Y. C. Liu 1 , and K. Schlegel 3 1 School of Electronics Information, Wuhan University, 430079, China 2 Key Lab of Geospace Environment and Geodesy, CNEM 3 Max Planck Institute for Solar System Research(MPS), 37191 Katlenburg-Lindau, Germany Received: 17 October 2006 – Revised: 15 November 2007 – Accepted: 4 December 2007 – Published: 2 January 2008 Abstract. In this paper, climatological features of the polar F2-region electron density (N e ) are investigated by means of statistical analysis using long-term observations from the European Incoherent Scatter UHF radar (called EISCAT in the following) and the EISCAT Svalbard radar (ESR) dur- ing periods of quiet to moderate geomagnetic activity. Field- aligned measurements by the EISCAT and ESR radars oper- ating in CP-1 and CP-2 modes are used in this study, covering the years 1988–1999 for EISCAT and 1999-2003 for ESR. The data are sorted by season (equinox, summer and win- ter) and solar cycle phase (maximum, minimum, rising and falling). Some novel and interesting results are presented as follows: (1) The well-known winter anomaly is evident dur- ing the solar maximum at EISCAT, but it dies out at the lat- itude of the ESR; (2) The daytime peaks of N e at EISCAT for all seasons during solar maximum lag about 1–2 h behind those at ESR, with altitudes about 10–30 km lower. (3) In addition to the daytime peak, it is revealed that there is an- other peak just before magnetic midnight at ESR around so- lar maximum, especially in winter and at equinox. The day- time ionization peak around magnetic noon observed by ESR can be attributed to soft particle precipitation in the cusp re- gion, whereas the pre-midnight N e maximum seems likely to be closely related to substorm events which frequently break out during that time sector, in particular for the winter case. (4) Semiannual variations are found at EISCAT during solar minimum and the falling phase of the solar cycle; at the rising phase, however, the EISCAT observations show no obvious seasonal variations. Keywords. Ionosphere (Particle precipitation; Plasma con- vection; Polar ionosphere) Correspondence to: H. T. Cai ([email protected]) 1 Introduction The Earth’s ionosphere is formed by the ionization of the atmosphere, owing to the solar EUV and X-ray radiations and, mainly for the high-latitudes, by energetic particles im- pinging on the atmosphere from the magnetosphere. Once formed, the ionized particles of ionospheric plasma are af- fected by numerous processes, including chemical reactions and various transport due to neutral wind, electric and mag- netic fields, etc. The ionosphere is coupled closely with both the magnetosphere and the thermosphere in which the iono- sphere is immersed. These lead the ionosphere to vary signif- icantly with solar cycle, season, local time, and geomagnetic activity. The background characteristics of ionospheric elec- tron density are of basic importance in understanding and forecasting space weather. Electron density variations of the mid- and low-latitude ionospheric F2-layer have been extensively investigated, and a number of anomalies, such as the winter anomaly and the semiannual anomaly, have been reported (Yonezawa and Arima, 1959; Yonezawa, 1971). A number of pos- sible causes have been proposed for these anomalies, as reviewed by Rishbeth (1998). The best-accepted mecha- nism is the chemical explanation suggested by Rishbeth and Setty (1961). Millward et al. (1996) modeled the semian- nual variation, confirming the role of the chemical compo- sition changes. Recently, using ionosonde data, Rishbeth et al. (2000b) studied the semiannual and annual variations of the ionospheric F2-peak at middle and low latitudes. They found that H m F 2 has a well-defined relationship with so- lar activity. Zou et al. (2000) numerically investigated the annual, seasonal and semiannual variation of the F2-layer electron density under geomagnetically quiet conditions, and claimed that the noon N m F 2 is closely related to the ambi- ent atomic/molecular concentration ratio. Rishbeth et al. (2000a) highlighted the role of global-scale thermospheric motions, which produce the composition changes, in the Published by Copernicus Publications on behalf of the European Geosciences Union.
Transcript of Climatological features of electron density in the … · of statistical analysis using long-term...

Ann. Geophys., 25, 2561–2569, 2007www.ann-geophys.net/25/2561/2007/© European Geosciences Union 2007
AnnalesGeophysicae
Climatological features of electron density in the polar ionospherefrom long-term observations of EISCAT/ESR radar
H. T. Cai1,2, S. Y. Ma1,2, Y. Fan1,2, Y. C. Liu 1, and K. Schlegel3
1School of Electronics Information, Wuhan University, 430079, China2Key Lab of Geospace Environment and Geodesy, CNEM3Max Planck Institute for Solar System Research(MPS), 37191 Katlenburg-Lindau, Germany
Received: 17 October 2006 – Revised: 15 November 2007 – Accepted: 4 December 2007 – Published: 2 January 2008
Abstract. In this paper, climatological features of the polarF2-region electron density (Ne) are investigated by meansof statistical analysis using long-term observations from theEuropean Incoherent Scatter UHF radar (called EISCAT inthe following) and the EISCAT Svalbard radar (ESR) dur-ing periods of quiet to moderate geomagnetic activity. Field-aligned measurements by the EISCAT and ESR radars oper-ating in CP-1 and CP-2 modes are used in this study, coveringthe years 1988–1999 for EISCAT and 1999-2003 for ESR.The data are sorted by season (equinox, summer and win-ter) and solar cycle phase (maximum, minimum, rising andfalling). Some novel and interesting results are presented asfollows: (1) The well-known winter anomaly is evident dur-ing the solar maximum at EISCAT, but it dies out at the lat-itude of the ESR; (2) The daytime peaks ofNe at EISCATfor all seasons during solar maximum lag about 1–2 h behindthose at ESR, with altitudes about 10–30 km lower. (3) Inaddition to the daytime peak, it is revealed that there is an-other peak just before magnetic midnight at ESR around so-lar maximum, especially in winter and at equinox. The day-time ionization peak around magnetic noon observed by ESRcan be attributed to soft particle precipitation in the cusp re-gion, whereas the pre-midnightNe maximum seems likely tobe closely related to substorm events which frequently breakout during that time sector, in particular for the winter case.(4) Semiannual variations are found at EISCAT during solarminimum and the falling phase of the solar cycle; at the risingphase, however, the EISCAT observations show no obviousseasonal variations.
Keywords. Ionosphere (Particle precipitation; Plasma con-vection; Polar ionosphere)
Correspondence to:H. T. Cai([email protected])
1 Introduction
The Earth’s ionosphere is formed by the ionization of theatmosphere, owing to the solar EUV and X-ray radiationsand, mainly for the high-latitudes, by energetic particles im-pinging on the atmosphere from the magnetosphere. Onceformed, the ionized particles of ionospheric plasma are af-fected by numerous processes, including chemical reactionsand various transport due to neutral wind, electric and mag-netic fields, etc. The ionosphere is coupled closely with boththe magnetosphere and the thermosphere in which the iono-sphere is immersed. These lead the ionosphere to vary signif-icantly with solar cycle, season, local time, and geomagneticactivity. The background characteristics of ionospheric elec-tron density are of basic importance in understanding andforecasting space weather.
Electron density variations of the mid- and low-latitudeionospheric F2-layer have been extensively investigated, anda number of anomalies, such as the winter anomaly andthe semiannual anomaly, have been reported (Yonezawaand Arima, 1959; Yonezawa, 1971). A number of pos-sible causes have been proposed for these anomalies, asreviewed byRishbeth(1998). The best-accepted mecha-nism is the chemical explanation suggested byRishbeth andSetty (1961). Millward et al. (1996) modeled the semian-nual variation, confirming the role of the chemical compo-sition changes. Recently, using ionosonde data,Rishbeth etal. (2000b) studied the semiannual and annual variations ofthe ionospheric F2-peak at middle and low latitudes. Theyfound thatHmF2 has a well-defined relationship with so-lar activity. Zou et al.(2000) numerically investigated theannual, seasonal and semiannual variation of the F2-layerelectron density under geomagnetically quiet conditions, andclaimed that the noonNmF2 is closely related to the ambi-ent atomic/molecular concentration ratio.Rishbeth et al.(2000a) highlighted the role of global-scale thermosphericmotions, which produce the composition changes, in the
Published by Copernicus Publications on behalf of the European Geosciences Union.

2562 H. T. Cai et al.: Climatological features ofNe in polar ionosphere
Fig. 1. The position of EISCAT/ESR radar in relation to with theauroral ellipse and polar cap. (The solid points represent the lo-cation of EISCAT; asterisks for the ESR, and the two thick blackellipse lines imply the boundaries of the auroral oval during lowergeomagnetic activity).
formation of seasonal and semiannual effects in the mid-latitude F2-layer.
As the aforementioned anomalies are frequently observedat mid- and low-latitudes, they were thought to die away atlatitudes higher than 60◦. Baron and Wand(1983a), how-ever, reported these anomalies in Alaska (65.1◦ N) on the ba-sis of the Chatanika incoherent radar observations. A cou-ple of years later, the winter anomaly at Tromsφ (69.6◦ N,19.2◦ E) was reported byFarmer et al.(1990). Liu (2001)investigated the climatological features of the high-latitudeionosphere using several years of EISCAT/ESR observa-tions, but her research was only carried out in terms of twocharacteristic parameters, namely, the ionospheric F2-layerelectron density peak,NmF2, and the corresponding alti-tude,HmF2. In the Southern Hemisphere,Zhu et al.(1996,1998) reported the existence of an F-region winter anomalyover Zhongshan Station (77.1◦ S), based on ionosonde dataaround solar maximum (1990–1991). Low energy particleprecipitation was proposed to be a possible cause of the iono-spheric F-regionNe peak around magnetic noon. By analyz-ing observations from the same station,Shen et al.(2003)claimed that there is no winter anomaly around solar min-imum, and highlighted the role of magnetospheric particleprecipitation in the formation of ionization enhancementsaround magnetic noon. The seasonal features of averagedionosphericNe based on long-term observations at high lati-tudes, resulting in particular from the polar cusp/cap regions,are not as well reported in the literature.
In both hemispheres, there are funnel-shaped areas withnear zero magnetic field magnitude but dense plasma, whichare called the polar cusps or clefts. In these regions, solarplasma has direct access to the upper atmosphere. They pro-vide an entry for particles from the solar wind and magne-tosphere into near-Earth geospace without crossing geomag-netic field lines. The unique configuration of the geomag-netic field at polar cusps makes them among the most popularregions for research into the geospace environment. Gener-ally, the cusp regions lie around±78◦ MLAT, with about 5◦
extension in latitude. The ESR is located close to Longyear-byen on the island of Spitsbergen. The position of the EIS-CAT and the ESR in relation to the auroral oval and polar capis shown in Fig.1. It can be seen that EISCAT radar lies inthe auroral oval for most of the time. The ESR radar, how-ever, lies in the vicinity of the cusp region during the daytimeand within the polar cap during the nighttime. The specificlocations and powerful capabilities of these two radars pro-vide an excellent opportunity for comparative studies of polarionospheric characteristics, especially in the auroral oval andpolar cusp/cap regions.
The EISCAT radar (69.6◦ N, 19.2◦ E) began taking datain 1981, while the ESR (78◦ N, 16◦ E) began operations in1996. Hence a relatively long period of ionospheric mea-surements have now been accumulated. In this paper, field-aligned measurements from the EISCAT UHF radar duringthe 22nd solar cycle and from the ESR radar during the pe-riod of 1999-2003 are combined in a statistical study of theclimatological characteristics of electron density in the polarionospheric F2-layer.
2 Data analysis
Field-aligned measurements obtained from EISCAT Com-mon Program One and Two (CP-1 and CP-2) during 1988-1999 and measurements from the ESR during 1999–2003 areused in this work. In order to eliminate the effects of exten-sive disturbances, only data with the maximumKp≤4 areincluded. The annual averaged sunspot numbers during thisperiod are shown in Fig.2. According to the variations ofaveraged sunspot number, the period of selected ESR ob-servations is around solar maximum. As for the EISCATUHF data, the period of 1988–1999 can be divided into 4phases: the rising phase (1988, 1998 and 1999), solar max-imum (1989, 1990 and 1991), the falling phase (1992, 1993and 1994) and solar minimum (1995, 1996 and 1997). Eachphase is further divided into 3 seasons, namely the equinox,summer and winter. We do not distinguish spring and au-tumn seasons here because there are not enough observationsto separate them statistically, especially for the falling phaseof the solar cycle at EISCAT. The numbers of EISCAT/ESRradar observation events for each group are listed in Table1.The entries correspond to the number of time sequences of
Ann. Geophys., 25, 2561–2569, 2007 www.ann-geophys.net/25/2561/2007/

H. T. Cai et al.: Climatological features ofNe in polar ionosphere 2563
Table 1. Number of EISCAT/ESR radar observation events for each group.
Seasons EISCAT ESRRising Phase, Solar Max., Falling Phase, Solar Min. Solar Max
Equinox(Feb 5–May 4) 25 14 6 12 150
(Aug. 4–Nov. 5)
Summer 12 8 10 11 30(May 5–Aug 4)
Winter 8 12 11 15 105(Nov 5–Feb 4)
Fig. 2. Annual averaged sunspot number during 1988–2004.
successive measurements with lengths between 4 hours andone day, which have been used in the study.
Global-scale thermospheric motions have an important ef-fect on the long-term variation of the F2-layer electron den-sity (Rishbeth et al., 2000a), and Rishbeth(1998) haspointed out that thermospheric circulation may differ dur-ing quiet and disturbed times. Hence, it seems to be anoversimplification to assume that the daytime peak of elec-tron density,NmF2, has no relation to geomagnetic activity,thoughBaron and Wand(1983b) claimed that there was noobvious relation between the nighttimeNmF2 and theKp in-dex. Therefore, only data obtained under quiet to moderategeophysical conditions are chosen in our study to eliminatevariations caused by extensive disturbances. This is differ-ent from the philosophy employed byFarmer et al.(1990),where measurements made under all conditions were used.
The signal-to-noise ratio (SNR) indicates the reliability ofthe data and is therefore important in the analysis. Unreli-able observations are eliminated according to the quality ofdata fitting. Since the input data come from several differ-ent kinds of radar experiments, they usually have differenttime and range resolutions. For the convenience of analy-sis, a fixed 2-D grid has been specified, with resolutions of10 km in range and 10 min in UT time. A linear interpola-tion method is employed to project all the data sets onto theaforementioned fixed grid. The resulting data sets are binnedby height (H , every 10 km), hour of day (UT , every 10 min),and season of year (S). A sequence ofNe measurements rep-resenting the same conditions can be obtained by collectingall observations falling into the same bin. Within each bin,the final “mean” electron density is defined as the medianvalue of the corresponding electron density sequence:
〈Ne (H, UT , S)〉 = Median( { Ne i (H, UT , S) } ), (1)
where,{ Ne i (H, UT , S) } corresponds to theNe sequenceobtained in the(H, UT , S) bin. The standard deviationσ iscalculated by
σ =
√∑( 〈Ne (H, UT , S)〉 − Ne i (H, UT , S) )2
N (H, UT, S) − 1, (2)
whereN (H,UT, S) is the number of available data in the(H, UT , S) bin, and plotted as an error bar on every 10thtemporal grid points in the following figures. Since theUT
coverage of input data is uneven,N (H, UT, S) varies indifferent bins. In most bins,N (H, UT, S) is no less than 70percent of the number of observation events. The worst casesappear around dawn and dusk at equinox of solar minimum,with N (H, UT, S) being slightly higher than 30 percent ofthe total number of observation events.
www.ann-geophys.net/25/2561/2007/ Ann. Geophys., 25, 2561–2569, 2007
2564 H. T. Cai et al.: Climatological features ofNe in polar ionosphere
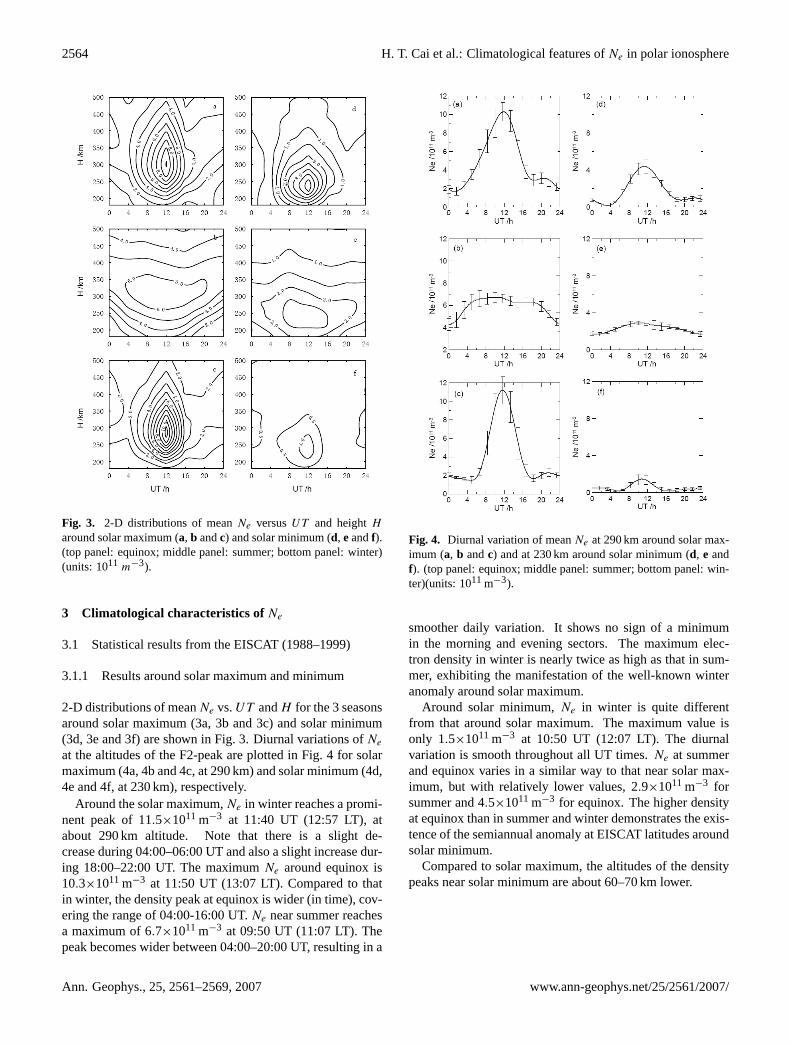
Fig. 3. 2-D distributions of meanNe versusUT and heightHaround solar maximum (a, b andc) and solar minimum (d, eandf).(top panel: equinox; middle panel: summer; bottom panel: winter)(units: 1011 m−3).
3 Climatological characteristics ofNe
3.1 Statistical results from the EISCAT (1988–1999)
3.1.1 Results around solar maximum and minimum
2-D distributions of meanNe vs.UT andH for the 3 seasonsaround solar maximum (3a, 3b and 3c) and solar minimum(3d, 3e and 3f) are shown in Fig.3. Diurnal variations ofNe
at the altitudes of the F2-peak are plotted in Fig.4 for solarmaximum (4a, 4b and 4c, at 290 km) and solar minimum (4d,4e and 4f, at 230 km), respectively.
Around the solar maximum,Ne in winter reaches a promi-nent peak of 11.5×10¹¹ m−3 at 11:40 UT (12:57 LT), atabout 290 km altitude. Note that there is a slight de-crease during 04:00–06:00 UT and also a slight increase dur-ing 18:00–22:00 UT. The maximumNe around equinox is10.3×1011 m−3 at 11:50 UT (13:07 LT). Compared to thatin winter, the density peak at equinox is wider (in time), cov-ering the range of 04:00-16:00 UT.Ne near summer reachesa maximum of 6.7×10¹¹ m−3 at 09:50 UT (11:07 LT). Thepeak becomes wider between 04:00–20:00 UT, resulting in a
Fig. 4. Diurnal variation of meanNe at 290 km around solar max-imum (a, b andc) and at 230 km around solar minimum (d, e andf). (top panel: equinox; middle panel: summer; bottom panel: win-ter)(units: 1011m−3).
smoother daily variation. It shows no sign of a minimumin the morning and evening sectors. The maximum elec-tron density in winter is nearly twice as high as that in sum-mer, exhibiting the manifestation of the well-known winteranomaly around solar maximum.
Around solar minimum,Ne in winter is quite differentfrom that around solar maximum. The maximum value isonly 1.5×10¹¹ m−3 at 10:50 UT (12:07 LT). The diurnalvariation is smooth throughout all UT times.Ne at summerand equinox varies in a similar way to that near solar max-imum, but with relatively lower values, 2.9×10¹¹ m−3 forsummer and 4.5×10¹¹ m−3 for equinox. The higher densityat equinox than in summer and winter demonstrates the exis-tence of the semiannual anomaly at EISCAT latitudes aroundsolar minimum.
Compared to solar maximum, the altitudes of the densitypeaks near solar minimum are about 60–70 km lower.
Ann. Geophys., 25, 2561–2569, 2007 www.ann-geophys.net/25/2561/2007/

H. T. Cai et al.: Climatological features ofNe in polar ionosphere 2565
Fig. 5. The same as Figure3, but for the rising (a, b andc) and thefalling (d, eandf) phase of solar cycle. (top panel: equinox; middlepanel: summer; bottom panel: winter) (units: 1011m−3).
3.1.2 Results at rising and falling phase
Seasonal variations ofNe exhibit quite different features inthe rising and falling phases of the solar cycle. Mean 2-Ddistributions ofNe vs. UT andH for the rising phase (5a,5b and 5c) and falling phases (5d, 5e and 5f) are shown inFig. 5. Corresponding diurnal variations at 270 km (at aboutthe altitude of the F2-peak) are plotted in Fig.6 for the rising(6a, 6b and 6c) and falling phase (6d, 6e and 6f), respectively.
During the rising phase of the 22nd solar cycle, the maxi-mumNe is 4.5×10¹¹ m−3 for winter, 4.8×10¹¹ m−3 for sum-mer and 5.6×10¹¹ m−3 for equinox, exhibiting no obviousseasonal variations.
During the falling phase, however,Ne exhibits quite dif-ferent seasonal behaviors. At equinox,Ne reaches a peakvalue of 11.0×10¹¹ m−3 at 10:50 UT (12:07 LT). Comparedto the dramatic peak near equinox, the maximumNe nearwinter is much smaller, with a value of 4.0×10¹¹ m−3 at11:10 UT (12:27 LT). The peak is confined in the range of08:00–16:00 UT.Ne near summer reaches a maximum of3.4×1011 m−3 at 11:00 UT (12:17 LT), with a smooth dailyvariation. TheNe at equinox is more than 2 times higherthan those in summer and/or winter, demonstrating obviouscharacteristics of the semiannual anomaly.
Fig. 6. The same as Fig.4, but at 270 km for the rising (a, b andc)and the falling phase (d, eandf) of solar cycle. (top panel: equinox;middle panel: summer; bottom panel: winter) (units: 1011m−3).
3.2 The ESR radar observations around solar maximum
2-D meanNe distributions derived from the ESR data aroundsolar maximum are shown in the left-hand column of Fig.7a,b and c. Corresponding diurnal variations ofNe at 310 kmare shown in the right column (7d, 7e and 7f).
The variations ofNe are quite different to those at Tromsφ
around solar maximum (Figs. 3a, b, c and 4a, b, c). Inwinter, Ne reaches a maximum value of 5.2×10¹¹ m−3 at19:45 UT (22:35 MLT), with a minor peak at 09:20 UT(12:05 MLT). At equinox,Ne reaches a prominent maximumof 8.7×10¹¹m−3 at 09:40 UT (12:25 MLT), followed by aweaker but long-lasting peak around 18:00 UT (20:40 MLT).Note that the increase ofNe before 09:00 UT is very fast.The summertimeNe is about 4.0×10¹¹ m−3 before it startsto increase to 5.3×10¹¹ m−3 at 10:10 UT (12:30 MLT). Thepeak density is relatively unchanged up to 20:00 UT beforeNe drops gradually back to 4.0×10¹¹ m−3 at 22:00 UT.
Except for the pre-midnight peak,Ne in winter is less thanthat in summer, demonstrating no sign of the so-called winteranomaly at the latitude of the ESR around solar maximum.
www.ann-geophys.net/25/2561/2007/ Ann. Geophys., 25, 2561–2569, 2007

2566 H. T. Cai et al.: Climatological features ofNe in polar ionosphere
Fig. 7. Mean Ne around solar maximum at the ESR site: 2-Ddistribution vs.UT andH (a, b and c) and diurnal variations at310 km (d, e and f). (top panel: equinox; middle panel: summer;bottom panel: winter) (units: 1011m−3).
The altitude of the daytimeNe peak at ESR is around320 km for all seasons, about 10–30 km higher than that atthe EISCAT site. Those for the minor peak at equinox andthe maximum peak in winter before magnetic midnight are atabout 350 km, slightly higher than that during the daytime.
Note that the standard deviations of the ESR density esti-mates are appreciably larger than those at Tromsφ, implyinglarger day-to-day variations of the electron density. This mayperhaps be related to the characteristic dynamic processes atthe ESR latitude, which will be discussed in the followingsection.
4 Discussion
The aforementionedNe distributions around solar maximumover the ESR site exhibit quite different features from thoseobserved at auroral oval latitudes (EISCAT radar) and at mid-latitudes (Millstone Hill radar) (Lei et al., 2005), such as thetwo-peaked distribution of the electron density in winter andat equinox. The daytime density peaks over the ESR appear1–2 h later and 10–30 km higher than that at EISCAT site, in-
dicating thatNe distributions observed by ESR may not beproduced by solar irradiations alone. Plasma dynamic andelectrodynamic processes which are characteristic at that lat-itude may contribute to the special features of electron den-sity in ionospheric the F2-layer.
4.1 Soft particle precipitation in cusp region
Particle precipitation has been extensively investigated in thepast several decades, with emphasis on particles’ spectra andrelated parameters (e.g. integral energy flux, number flux andcharacteristics energy). Based on long-term satellite obser-vations, various empirical models of particle precipitatinghave been established. The widely-accepted models are fromSpiro et al.(1982) andHardy et al.(1985, 1987, 1989). Onthe basis of FAST observations and EISCAT radar measure-ments, a new empirical model of auroral precipitating elec-trons, PEM-2004, has been established by our colleaguesat Wuhan University (private communication). One of theagreements among these models is that soft electrons aredominant in the cusp region around magnetic midday. In thecusp region, auroral precipitating electrons usually have highnumber flux but low energy flux, resulting in low average en-ergy. Around magnetic noon, the ESR radar moves near tothe cusp region (Fig.1). During this time period, an iono-spheric ionization enhancement at altitudes around 320 kmhas been observed by ESR in all seasons (Fig.7a, b and c).
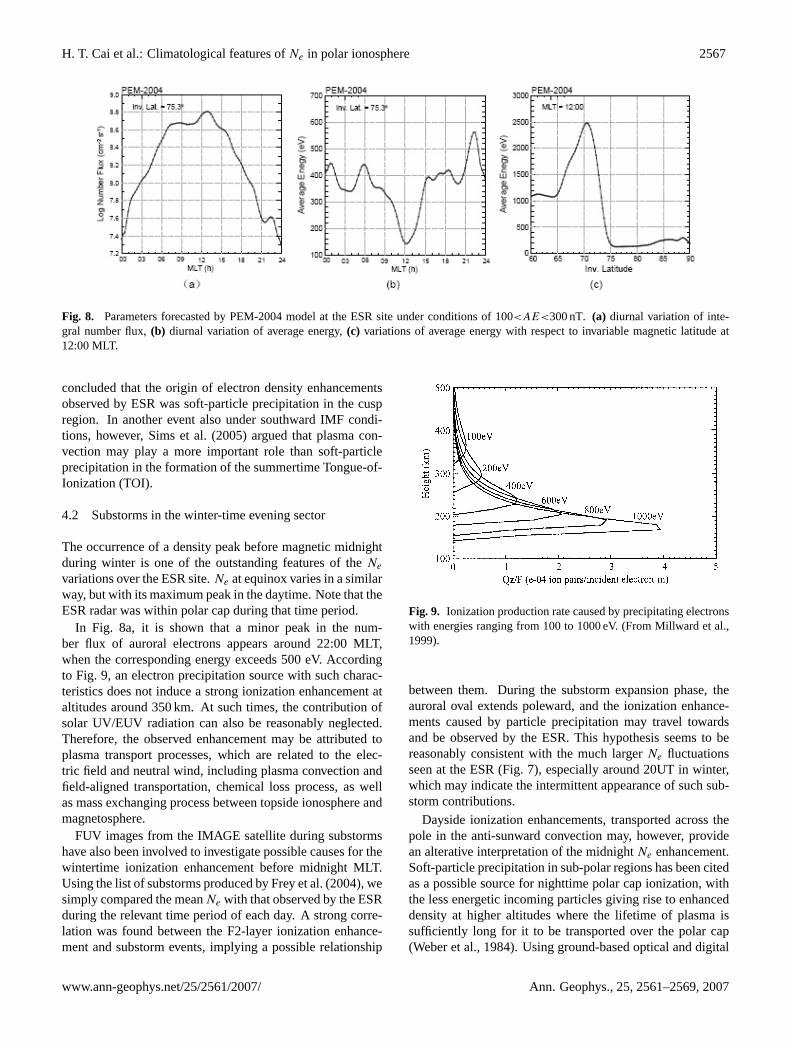
Predicted results over the ESR site (75.3◦ ILAT) fromPEM-2004 under conditions of 100<AE<300 nT are shownin Fig. 8. It is shown that auroral electrons over theESR site have a maximum number flux with the value of6.3×108 el cm−2 s−1 during the magnetic post-noon period(Fig. 8a). The minimum average energy, about 140 eV, ap-pears at about 12:00 MLT (Fig.8b). At magnetic noon(Fig. 8c), the average energy reaches the minimum value of127 eV at 76.3◦ ILAT, which is rather similar to the charac-teristic energy of soft particles from the magnetosheath.
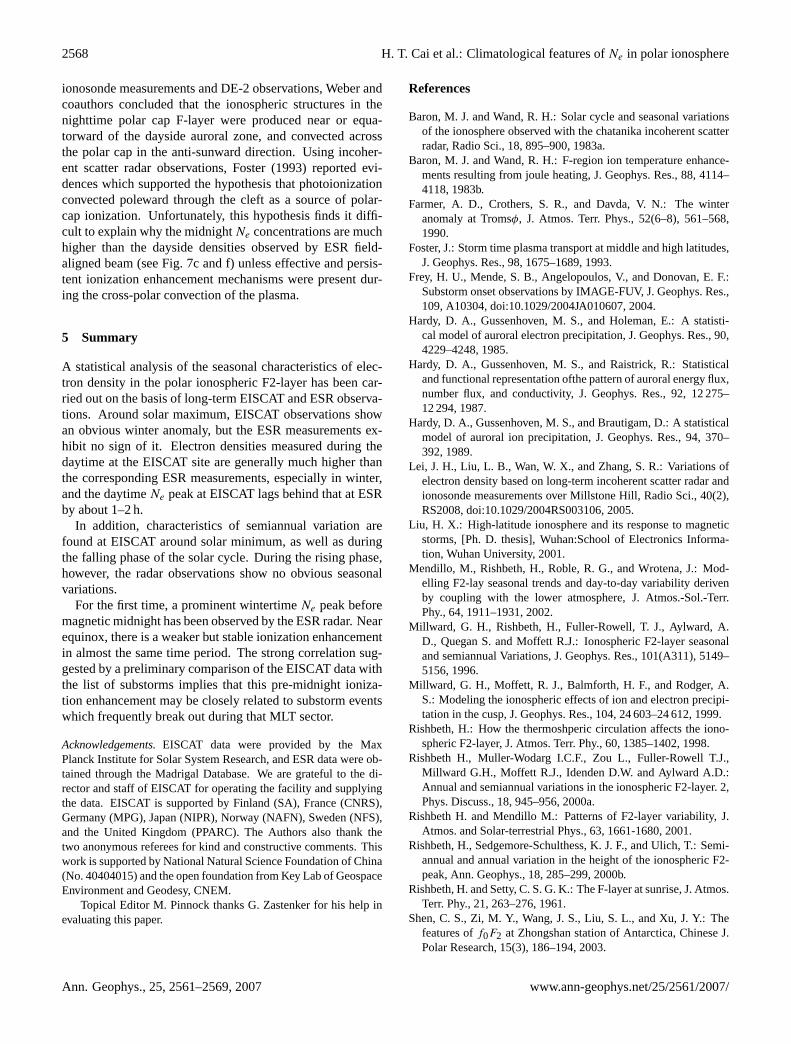
Millward et al. (1999) numerically simulated the iono-spheric effects caused by soft particle precipitation in thecusp region. Ionization rates caused by precipitating elec-trons with different energies ranging from 100 to 1000 eVare shown in Fig.9. The simulations imply that electronswith various energies precipitate at different altitudes. Elec-trons with higher energy can penetrate deeper into the atmo-sphere, while softer electrons stop at higher altitudes. Au-roral electrons with energies of 100 and 200 eV induce thehighest ionization rates at altitudes around 360 and 300 km,respectively. According to the calculations ofMillward etal. (1999), the characteristics of soft particle precipitation incusp region are reasonably consistent with the ionization en-hancements around 320 km observed by the ESR.
Note that intense summertime electron density enhance-ments around magnetic noon have also been reported in re-cent case studies (Smith et al., 2000; Sims et al., 2005). Ina case with southward IMF conditions,Smith et al.(2000)
Ann. Geophys., 25, 2561–2569, 2007 www.ann-geophys.net/25/2561/2007/
H. T. Cai et al.: Climatological features ofNe in polar ionosphere 2567
Fig. 8. Parameters forecasted by PEM-2004 model at the ESR site under conditions of 100<AE<300 nT. (a) diurnal variation of inte-gral number flux,(b) diurnal variation of average energy,(c) variations of average energy with respect to invariable magnetic latitude at12:00 MLT.
concluded that the origin of electron density enhancementsobserved by ESR was soft-particle precipitation in the cuspregion. In another event also under southward IMF condi-tions, however,Sims et al.(2005) argued that plasma con-vection may play a more important role than soft-particleprecipitation in the formation of the summertime Tongue-of-Ionization (TOI).
4.2 Substorms in the winter-time evening sector
The occurrence of a density peak before magnetic midnightduring winter is one of the outstanding features of theNe
variations over the ESR site.Ne at equinox varies in a similarway, but with its maximum peak in the daytime. Note that theESR radar was within polar cap during that time period.
In Fig. 8a, it is shown that a minor peak in the num-ber flux of auroral electrons appears around 22:00 MLT,when the corresponding energy exceeds 500 eV. Accordingto Fig. 9, an electron precipitation source with such charac-teristics does not induce a strong ionization enhancement ataltitudes around 350 km. At such times, the contribution ofsolar UV/EUV radiation can also be reasonably neglected.Therefore, the observed enhancement may be attributed toplasma transport processes, which are related to the elec-tric field and neutral wind, including plasma convection andfield-aligned transportation, chemical loss process, as wellas mass exchanging process between topside ionosphere andmagnetosphere.
FUV images from the IMAGE satellite during substormshave also been involved to investigate possible causes for thewintertime ionization enhancement before midnight MLT.Using the list of substorms produced byFrey et al.(2004), wesimply compared the meanNe with that observed by the ESRduring the relevant time period of each day. A strong corre-lation was found between the F2-layer ionization enhance-ment and substorm events, implying a possible relationship
Fig. 9. Ionization production rate caused by precipitating electronswith energies ranging from 100 to 1000 eV. (FromMillward et al.,1999).
between them. During the substorm expansion phase, theauroral oval extends poleward, and the ionization enhance-ments caused by particle precipitation may travel towardsand be observed by the ESR. This hypothesis seems to bereasonably consistent with the much largerNe fluctuationsseen at the ESR (Fig.7), especially around 20UT in winter,which may indicate the intermittent appearance of such sub-storm contributions.
Dayside ionization enhancements, transported across thepole in the anti-sunward convection may, however, providean alterative interpretation of the midnightNe enhancement.Soft-particle precipitation in sub-polar regions has been citedas a possible source for nighttime polar cap ionization, withthe less energetic incoming particles giving rise to enhanceddensity at higher altitudes where the lifetime of plasma issufficiently long for it to be transported over the polar cap(Weber et al., 1984). Using ground-based optical and digital
www.ann-geophys.net/25/2561/2007/ Ann. Geophys., 25, 2561–2569, 2007
2568 H. T. Cai et al.: Climatological features ofNe in polar ionosphere
ionosonde measurements and DE-2 observations, Weber andcoauthors concluded that the ionospheric structures in thenighttime polar cap F-layer were produced near or equa-torward of the dayside auroral zone, and convected acrossthe polar cap in the anti-sunward direction. Using incoher-ent scatter radar observations,Foster(1993) reported evi-dences which supported the hypothesis that photoionizationconvected poleward through the cleft as a source of polar-cap ionization. Unfortunately, this hypothesis finds it diffi-cult to explain why the midnightNe concentrations are muchhigher than the dayside densities observed by ESR field-aligned beam (see Fig.7c and f) unless effective and persis-tent ionization enhancement mechanisms were present dur-ing the cross-polar convection of the plasma.
5 Summary
A statistical analysis of the seasonal characteristics of elec-tron density in the polar ionospheric F2-layer has been car-ried out on the basis of long-term EISCAT and ESR observa-tions. Around solar maximum, EISCAT observations showan obvious winter anomaly, but the ESR measurements ex-hibit no sign of it. Electron densities measured during thedaytime at the EISCAT site are generally much higher thanthe corresponding ESR measurements, especially in winter,and the daytimeNe peak at EISCAT lags behind that at ESRby about 1–2 h.
In addition, characteristics of semiannual variation arefound at EISCAT around solar minimum, as well as duringthe falling phase of the solar cycle. During the rising phase,however, the radar observations show no obvious seasonalvariations.
For the first time, a prominent wintertimeNe peak beforemagnetic midnight has been observed by the ESR radar. Nearequinox, there is a weaker but stable ionization enhancementin almost the same time period. The strong correlation sug-gested by a preliminary comparison of the EISCAT data withthe list of substorms implies that this pre-midnight ioniza-tion enhancement may be closely related to substorm eventswhich frequently break out during that MLT sector.
Acknowledgements.EISCAT data were provided by the MaxPlanck Institute for Solar System Research, and ESR data were ob-tained through the Madrigal Database. We are grateful to the di-rector and staff of EISCAT for operating the facility and supplyingthe data. EISCAT is supported by Finland (SA), France (CNRS),Germany (MPG), Japan (NIPR), Norway (NAFN), Sweden (NFS),and the United Kingdom (PPARC). The Authors also thank thetwo anonymous referees for kind and constructive comments. Thiswork is supported by National Natural Science Foundation of China(No. 40404015) and the open foundation from Key Lab of GeospaceEnvironment and Geodesy, CNEM.
Topical Editor M. Pinnock thanks G. Zastenker for his help inevaluating this paper.
References
Baron, M. J. and Wand, R. H.: Solar cycle and seasonal variationsof the ionosphere observed with the chatanika incoherent scatterradar, Radio Sci., 18, 895–900, 1983a.
Baron, M. J. and Wand, R. H.: F-region ion temperature enhance-ments resulting from joule heating, J. Geophys. Res., 88, 4114–4118, 1983b.
Farmer, A. D., Crothers, S. R., and Davda, V. N.: The winteranomaly at Tromsφ, J. Atmos. Terr. Phys., 52(6–8), 561–568,1990.
Foster, J.: Storm time plasma transport at middle and high latitudes,J. Geophys. Res., 98, 1675–1689, 1993.
Frey, H. U., Mende, S. B., Angelopoulos, V., and Donovan, E. F.:Substorm onset observations by IMAGE-FUV, J. Geophys. Res.,109, A10304, doi:10.1029/2004JA010607, 2004.
Hardy, D. A., Gussenhoven, M. S., and Holeman, E.: A statisti-cal model of auroral electron precipitation, J. Geophys. Res., 90,4229–4248, 1985.
Hardy, D. A., Gussenhoven, M. S., and Raistrick, R.: Statisticaland functional representation ofthe pattern of auroral energy flux,number flux, and conductivity, J. Geophys. Res., 92, 12 275–12 294, 1987.
Hardy, D. A., Gussenhoven, M. S., and Brautigam, D.: A statisticalmodel of auroral ion precipitation, J. Geophys. Res., 94, 370–392, 1989.
Lei, J. H., Liu, L. B., Wan, W. X., and Zhang, S. R.: Variations ofelectron density based on long-term incoherent scatter radar andionosonde measurements over Millstone Hill, Radio Sci., 40(2),RS2008, doi:10.1029/2004RS003106, 2005.
Liu, H. X.: High-latitude ionosphere and its response to magneticstorms, [Ph. D. thesis], Wuhan:School of Electronics Informa-tion, Wuhan University, 2001.
Mendillo, M., Rishbeth, H., Roble, R. G., and Wrotena, J.: Mod-elling F2-lay seasonal trends and day-to-day variability derivenby coupling with the lower atmosphere, J. Atmos.-Sol.-Terr.Phy., 64, 1911–1931, 2002.
Millward, G. H., Rishbeth, H., Fuller-Rowell, T. J., Aylward, A.D., Quegan S. and Moffett R.J.: Ionospheric F2-layer seasonaland semiannual Variations, J. Geophys. Res., 101(A311), 5149–5156, 1996.
Millward, G. H., Moffett, R. J., Balmforth, H. F., and Rodger, A.S.: Modeling the ionospheric effects of ion and electron precipi-tation in the cusp, J. Geophys. Res., 104, 24 603–24 612, 1999.
Rishbeth, H.: How the thermoshperic circulation affects the iono-spheric F2-layer, J. Atmos. Terr. Phy., 60, 1385–1402, 1998.
Rishbeth H., Muller-Wodarg I.C.F., Zou L., Fuller-Rowell T.J.,Millward G.H., Moffett R.J., Idenden D.W. and Aylward A.D.:Annual and semiannual variations in the ionospheric F2-layer. 2,Phys. Discuss., 18, 945–956, 2000a.
Rishbeth H. and Mendillo M.: Patterns of F2-layer variability, J.Atmos. and Solar-terrestrial Phys., 63, 1661-1680, 2001.
Rishbeth, H., Sedgemore-Schulthess, K. J. F., and Ulich, T.: Semi-annual and annual variation in the height of the ionospheric F2-peak, Ann. Geophys., 18, 285–299, 2000b.
Rishbeth, H. and Setty, C. S. G. K.: The F-layer at sunrise, J. Atmos.Terr. Phy., 21, 263–276, 1961.
Shen, C. S., Zi, M. Y., Wang, J. S., Liu, S. L., and Xu, J. Y.: Thefeatures off0F2 at Zhongshan station of Antarctica, Chinese J.Polar Research, 15(3), 186–194, 2003.
Ann. Geophys., 25, 2561–2569, 2007 www.ann-geophys.net/25/2561/2007/

H. T. Cai et al.: Climatological features ofNe in polar ionosphere 2569
Sims, R. W., Pryse, S. E., and Denig, W. F.: Spatial structure ofsummertime ionospheric plasma near magnetic noon, Ann. Geo-phys., 23, 25–37, 2005,http://www.ann-geophys.net/23/25/2005/.
Smith, A. M., Pryse S. E., and Kersley, L.: Polar Patches observedby ESR and their possible origin in the cusp region, Ann. Geo-phys., 18, 1043–1053, 2000,http://www.ann-geophys.net/18/1043/2000/.
Spiro, R. W., Reiff, P. H., and Maher Jr., L. J.: Precipitating elec-tron energy flux and auroral zone conduc- tances -An empiricalmodel, J. Geophys. Res., 87, 8215–8227, 1982.
Yonezawa, T. and Arima, Y.: On the seasonal and non-seasonalannual variations and the semi-annual variation in the noon andmidnight electron densityes of the F2-layer in middle latitudes,J. Radio Res. Lab., 6(25), 293–309, 1959.
Yonezawam, T.: The solar-activity and latitudinal characteristics ofthe seasonal, non-seasonal and semi-annual variations in the peakelectron densities of the F2-layer at noon and at midnight in mid-dle and low latitudes, J. Atmos. Terr. Phy., 33, 889–907, 1971.
Weber, E., Buchau, J., Moore J., Sharber J. R., and Livingston, R.C.: F-layer ionization patches in the polar-cap, J. Geophys. Res.,89, 1683–1694, 1984.
Zhu, M. H., Cao, C., and Wu, J.: Analyses of Ionospheric Propertiesover Zhongshan station Antarctica, Chinese J. Radio Sci., 11(1),96–101, 1996.
Zhu, M. H., Cao, C., and Wu, J.: The effects of low energy electronprecipitation on the ionosphere over Zhongshan station, Antarc-tica, Chinese J. Polar Research, 10(1), 31–36, 1998.
Zou, L., Rishbeth, H., Muller-Wodarg, I. C. F., Aylward, A. D.,Millward, G. H., Fuller-Rowell, T. J., Idenden, D. W., and Mof-fett, R. J.: Annual and semiannual variations in the ionosphericF2-layer. 1. Modelling, 18, 927–944, 2000.
www.ann-geophys.net/25/2561/2007/ Ann. Geophys., 25, 2561–2569, 2007