IEEE TRANSACTIONS ON GEOSCIENCE AND …teixeira/pdfpapers/2005TGRS_Hue.pdfThree-Dimensional...
12
IEEE TRANSACTIONS ON GEOSCIENCE AND REMOTE SENSING, VOL. 43, NO. 2, FEBRUARY 2005 257 Three-Dimensional Simulation of Eccentric LWD Tool Response in Boreholes Through Dipping Formations Yik-Kiong Hue, Fernando L. Teixeira, Senior Member, IEEE, Luis San Martin, and Michael S. Bittar Abstract—We simulate the response of logging-while-drilling (LWD) tools in complex thee-dimensional (3-D) borehole envi- ronments using a finite-difference time-domain (FDTD) scheme in cylindrical coordinates. Several techniques are applied to the FDTD algorithm to improve the computational efficiency and the modeling accuracy of more arbitrary geometries/media in well-log- ging problems: 1) a 3-D FDTD cylindrical grid to avoid staircasing discretization errors in the transmitter, receiver, and mandrel geometries; 2) an anisotropic-medium (unsplit) perfectly matched layer (PML) absorbing boundary condition in cylindrical coordi- nates is applied to the FDTD algorithm, leading to more compact grids and reduced memory requirements; a simple and efficient algorithm is employed to extract frequency-domain data (phase and amplitude) from early-time FDTD data; 4) permittivity scaling is applied to overcome the Courant limit of FDTD and allow faster simulations of lower frequency tool; and 5) two locally conformal FDTD (LC-FDTD) techniques are applied to better simulate the response of logging tools in eccentric boreholes. We validate the FDTD results against the numerical mode matching method for problems where the latter is applicable, and against pseudoana- lytical results for eccentric borehole problems. The comparisons show very good agreement. Results from 3-D borehole problems involving eccentric tools and dipping beds simultaneously are also included to demonstrate the robustness of the method. Index Terms—Borehole problem, finite-difference time-domain (FDTD) method, logging-while-drilling (LWD) tool, oil explo- ration, well-logging. I. INTRODUCTION N UMERICAL simulation of electromagnetic well-log- ging tools in complex borehole environments is of great importance for the interpretation of measurement data and characterization of oil reservoirs [1]–[3]. Numerical methods such as finite-element [4] (FEM), finite-difference frequency- domain (FDFD) [5], and transmission line matrix (TLM) methods [3], as well as pseudoanalytical methods such as numerical mode matching [6] (NMM) and conjugate gradient fast Fourier-Hankel transform (CG-FFHT) type methods [7], have been employed in the past to study the electromagnetic re- sponse of well-logging tools. Numerical methods such as FEM Manuscript received October 19, 2003; revised: September 15, 2004. This work was supported in part by Halliburton Energy Services, in part by the Na- tional Science Foundation under Grant ECS-0347502, and in part by the Ohio Supercomputer Center (OSC) under Grants PAS-0061 and PAS-0110. Y.-K. Hue and F. L. Teixeira are with the ElectroScience Laboratory and De- partment of Electrical and Computer Engineering The Ohio State University, Columbus, OH 43212 USA (e-mail: [email protected], [email protected]). L. S. Martin and M. S. Bittar are with the Sensor Physics Group, Halliburton Energy Services, Houston, TX 77032 USA (e-mail: luis.sanmartin@halliburton. com). Digital Object Identifier 10.1109/TGRS.2004.841354 and FDFD discretize Maxwell’s equations directly, and hence can be applied to study general tool geometries and responses in arbitrary three-dimensional (3-D) formations. However, such (frequency-domain) methods require the solution of a large sparse linear system. This can become impractical in current machines for large 3-D well-logging problems, especially when the number of unknowns grows beyond – . Moreover, the presence of large resistivity contrasts, which is common in many geophysical formations, poses an additional challenge for both FEM and FDFD methods because the associated linear system can become ill-posed. The NMM and CG-FFHT, on the other hand, are much faster and efficient methods but cannot be easily applied to arbitrary tool geometries and 3-D formations. In this paper, we discuss the implementation and use of fi- nite-difference time-domain (FDTD) methods for the modeling of well-logging tools. Similarly to FEM and FDFD, the FDTD method can solve for arbitrary 3-D formations, since it dis- cretizes Maxwell’s equations directly. However, FDTD involves an explicit time-domain update method. As a result, FDTD does not require the solution of a linear system (matrix-free), and larger problems can be solved. Indeed, FDTD can be classified as an optimal method in the sense that it exhibits compu- tational complexity per time step and requires memory, where is the number of unknowns. The drawback is that, since it requires a time stepping process, the FDTD solution can be slower for small problems than FEM and FD solutions in the frequency domain. Here, we discuss the application of several techniques to the standard FDTD algorithm to solve the well- logging problem more efficiently and accurately as follows. • We implement the FDTD in a 3-D cylindrical grid to avoid staircasing discretization errors in the transmitter, receiver, and mandrel geometries. • An anisotropic-medium (unsplit) perfectly matched layer (PML) absorbing boundary condition in cylindrical coor- dinates is applied to the FDTD algorithm, leading to more compact grids and reduced memory requirements for a problem of given (physical) size. • A simple and efficient algorithm is applied to extract fre- quency domain data from early-time FDTD data, allowing phase and amplitude data to be obtained in shorter simu- lation times. • For low-frequency problems, a scaling on permittivity values is applied to overcome the Courant limit and allow for larger time step sizes (and hence shorter simulation times). 0196-2892/$20.00 © 2005 IEEE
-
Upload
hoangxuyen -
Category
Documents
-
view
215 -
download
0
Transcript of IEEE TRANSACTIONS ON GEOSCIENCE AND …teixeira/pdfpapers/2005TGRS_Hue.pdfThree-Dimensional...

IEEE TRANSACTIONS ON GEOSCIENCE AND REMOTE SENSING, VOL. 43, NO. 2, FEBRUARY 2005 257
Three-Dimensional Simulation of Eccentric LWDTool Response in Boreholes Through
Dipping FormationsYik-Kiong Hue, Fernando L. Teixeira, Senior Member, IEEE, Luis San Martin, and Michael S. Bittar
Abstract—We simulate the response of logging-while-drilling(LWD) tools in complex thee-dimensional (3-D) borehole envi-ronments using a finite-difference time-domain (FDTD) schemein cylindrical coordinates. Several techniques are applied to theFDTD algorithm to improve the computational efficiency and themodeling accuracy of more arbitrary geometries/media in well-log-ging problems: 1) a 3-D FDTD cylindrical grid to avoid staircasingdiscretization errors in the transmitter, receiver, and mandrelgeometries; 2) an anisotropic-medium (unsplit) perfectly matchedlayer (PML) absorbing boundary condition in cylindrical coordi-nates is applied to the FDTD algorithm, leading to more compactgrids and reduced memory requirements; a simple and efficientalgorithm is employed to extract frequency-domain data (phaseand amplitude) from early-time FDTD data; 4) permittivity scalingis applied to overcome the Courant limit of FDTD and allow fastersimulations of lower frequency tool; and 5) two locally conformalFDTD (LC-FDTD) techniques are applied to better simulate theresponse of logging tools in eccentric boreholes. We validate theFDTD results against the numerical mode matching method forproblems where the latter is applicable, and against pseudoana-lytical results for eccentric borehole problems. The comparisonsshow very good agreement. Results from 3-D borehole problemsinvolving eccentric tools and dipping beds simultaneously are alsoincluded to demonstrate the robustness of the method.
Index Terms—Borehole problem, finite-difference time-domain(FDTD) method, logging-while-drilling (LWD) tool, oil explo-ration, well-logging.
I. INTRODUCTION
NUMERICAL simulation of electromagnetic well-log-ging tools in complex borehole environments is of great
importance for the interpretation of measurement data andcharacterization of oil reservoirs [1]–[3]. Numerical methodssuch as finite-element [4] (FEM), finite-difference frequency-domain (FDFD) [5], and transmission line matrix (TLM)methods [3], as well as pseudoanalytical methods such asnumerical mode matching [6] (NMM) and conjugate gradientfast Fourier-Hankel transform (CG-FFHT) type methods [7],have been employed in the past to study the electromagnetic re-sponse of well-logging tools. Numerical methods such as FEM
Manuscript received October 19, 2003; revised: September 15, 2004. Thiswork was supported in part by Halliburton Energy Services, in part by the Na-tional Science Foundation under Grant ECS-0347502, and in part by the OhioSupercomputer Center (OSC) under Grants PAS-0061 and PAS-0110.
Y.-K. Hue and F. L. Teixeira are with the ElectroScience Laboratory and De-partment of Electrical and Computer Engineering The Ohio State University,Columbus, OH 43212 USA (e-mail: [email protected], [email protected]).
L. S. Martin and M. S. Bittar are with the Sensor Physics Group, HalliburtonEnergy Services, Houston, TX 77032 USA (e-mail: [email protected]).
Digital Object Identifier 10.1109/TGRS.2004.841354
and FDFD discretize Maxwell’s equations directly, and hencecan be applied to study general tool geometries and responsesin arbitrary three-dimensional (3-D) formations. However, such(frequency-domain) methods require the solution of a largesparse linear system. This can become impractical in currentmachines for large 3-D well-logging problems, especially whenthe number of unknowns grows beyond – . Moreover,the presence of large resistivity contrasts, which is common inmany geophysical formations, poses an additional challengefor both FEM and FDFD methods because the associated linearsystem can become ill-posed. The NMM and CG-FFHT, on theother hand, are much faster and efficient methods but cannot beeasily applied to arbitrary tool geometries and 3-D formations.
In this paper, we discuss the implementation and use of fi-nite-difference time-domain (FDTD) methods for the modelingof well-logging tools. Similarly to FEM and FDFD, the FDTDmethod can solve for arbitrary 3-D formations, since it dis-cretizes Maxwell’s equations directly. However, FDTD involvesan explicit time-domain update method. As a result, FDTD doesnot require the solution of a linear system (matrix-free), andlarger problems can be solved. Indeed, FDTD can be classifiedas an optimal method in the sense that it exhibits compu-tational complexity per time step and requires memory,where is the number of unknowns. The drawback is that,since it requires a time stepping process, the FDTD solution canbe slower for small problems than FEM and FD solutions in thefrequency domain. Here, we discuss the application of severaltechniques to the standard FDTD algorithm to solve the well-logging problem more efficiently and accurately as follows.
• We implement the FDTD in a 3-D cylindrical grid to avoidstaircasing discretization errors in the transmitter, receiver,and mandrel geometries.
• An anisotropic-medium (unsplit) perfectly matched layer(PML) absorbing boundary condition in cylindrical coor-dinates is applied to the FDTD algorithm, leading to morecompact grids and reduced memory requirements for aproblem of given (physical) size.
• A simple and efficient algorithm is applied to extract fre-quency domain data from early-time FDTD data, allowingphase and amplitude data to be obtained in shorter simu-lation times.
• For low-frequency problems, a scaling on permittivityvalues is applied to overcome the Courant limit and allowfor larger time step sizes (and hence shorter simulationtimes).
0196-2892/$20.00 © 2005 IEEE
258 IEEE TRANSACTIONS ON GEOSCIENCE AND REMOTE SENSING, VOL. 43, NO. 2, FEBRUARY 2005
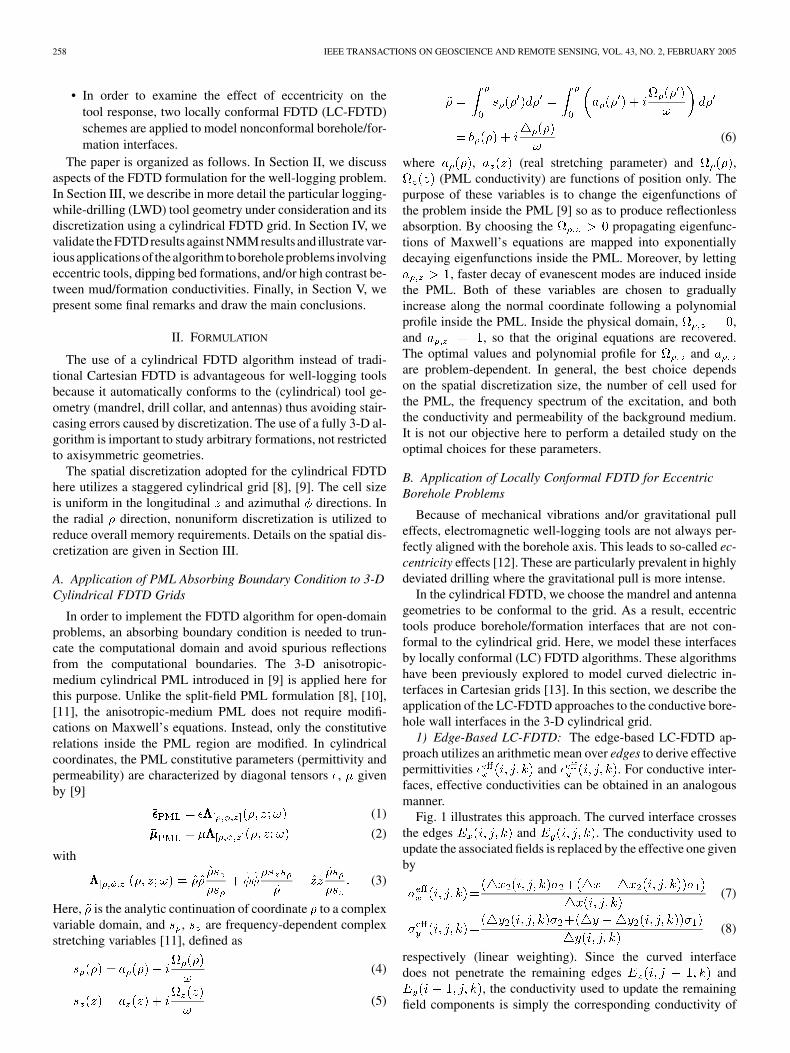
• In order to examine the effect of eccentricity on thetool response, two locally conformal FDTD (LC-FDTD)schemes are applied to model nonconformal borehole/for-mation interfaces.
The paper is organized as follows. In Section II, we discussaspects of the FDTD formulation for the well-logging problem.In Section III, we describe in more detail the particular logging-while-drilling (LWD) tool geometry under consideration and itsdiscretization using a cylindrical FDTD grid. In Section IV, wevalidate the FDTD results against NMM results and illustrate var-iousapplicationsof thealgorithmto boreholeproblems involvingeccentric tools, dipping bed formations, and/or high contrast be-tween mud/formation conductivities. Finally, in Section V, wepresent some final remarks and draw the main conclusions.
II. FORMULATION
The use of a cylindrical FDTD algorithm instead of tradi-tional Cartesian FDTD is advantageous for well-logging toolsbecause it automatically conforms to the (cylindrical) tool ge-ometry (mandrel, drill collar, and antennas) thus avoiding stair-casing errors caused by discretization. The use of a fully 3-D al-gorithm is important to study arbitrary formations, not restrictedto axisymmetric geometries.
The spatial discretization adopted for the cylindrical FDTDhere utilizes a staggered cylindrical grid [8], [9]. The cell sizeis uniform in the longitudinal and azimuthal directions. Inthe radial direction, nonuniform discretization is utilized toreduce overall memory requirements. Details on the spatial dis-cretization are given in Section III.
A. Application of PML Absorbing Boundary Condition to 3-DCylindrical FDTD Grids
In order to implement the FDTD algorithm for open-domainproblems, an absorbing boundary condition is needed to trun-cate the computational domain and avoid spurious reflectionsfrom the computational boundaries. The 3-D anisotropic-medium cylindrical PML introduced in [9] is applied here forthis purpose. Unlike the split-field PML formulation [8], [10],[11], the anisotropic-medium PML does not require modifi-cations on Maxwell’s equations. Instead, only the constitutiverelations inside the PML region are modified. In cylindricalcoordinates, the PML constitutive parameters (permittivity andpermeability) are characterized by diagonal tensors , givenby [9]
(1)
(2)
with
(3)
Here, is the analytic continuation of coordinate to a complexvariable domain, and , are frequency-dependent complexstretching variables [11], defined as
(4)
(5)
(6)
where , (real stretching parameter) and ,(PML conductivity) are functions of position only. The
purpose of these variables is to change the eigenfunctions ofthe problem inside the PML [9] so as to produce reflectionlessabsorption. By choosing the propagating eigenfunc-tions of Maxwell’s equations are mapped into exponentiallydecaying eigenfunctions inside the PML. Moreover, by letting
, faster decay of evanescent modes are induced insidethe PML. Both of these variables are chosen to graduallyincrease along the normal coordinate following a polynomialprofile inside the PML. Inside the physical domain, ,and , so that the original equations are recovered.The optimal values and polynomial profile for andare problem-dependent. In general, the best choice dependson the spatial discretization size, the number of cell used forthe PML, the frequency spectrum of the excitation, and boththe conductivity and permeability of the background medium.It is not our objective here to perform a detailed study on theoptimal choices for these parameters.
B. Application of Locally Conformal FDTD for EccentricBorehole Problems
Because of mechanical vibrations and/or gravitational pulleffects, electromagnetic well-logging tools are not always per-fectly aligned with the borehole axis. This leads to so-called ec-centricity effects [12]. These are particularly prevalent in highlydeviated drilling where the gravitational pull is more intense.
In the cylindrical FDTD, we choose the mandrel and antennageometries to be conformal to the grid. As a result, eccentrictools produce borehole/formation interfaces that are not con-formal to the cylindrical grid. Here, we model these interfacesby locally conformal (LC) FDTD algorithms. These algorithmshave been previously explored to model curved dielectric in-terfaces in Cartesian grids [13]. In this section, we describe theapplication of the LC-FDTD approaches to the conductive bore-hole wall interfaces in the 3-D cylindrical grid.
1) Edge-Based LC-FDTD: The edge-based LC-FDTD ap-proach utilizes an arithmetic mean over edges to derive effectivepermittivities and . For conductive inter-faces, effective conductivities can be obtained in an analogousmanner.
Fig. 1 illustrates this approach. The curved interface crossesthe edges and . The conductivity used toupdate the associated fields is replaced by the effective one givenby
(7)
(8)
respectively (linear weighting). Since the curved interfacedoes not penetrate the remaining edges and
, the conductivity used to update the remainingfield components is simply the corresponding conductivity of

HUE et al.: 3–D SIMULATION OF ECCENTRIC LWD TOOL RESPONSE 259
Fig. 1. Averaging procedure used in the edge-based conformal FDTD schemeshowing, on the top, the intersection between the regular FDTD mesh andcurved interface between two conductive media. (Left) The original problemwith different conductivities along a single edge. (Right) The equivalentproblem with effective conductivities along each edge.
Fig. 2. Linear weighted averaging procedure used in the face-based conformaldielectric FDTD scheme. (Top) Thee intersection between a curved interfaceand the FDTD dual-grid mesh. (Bottom) The equivalent problem using effectiveconductivites over each dual-grid face.
the region where the associated edge is situated. This modi-fication can be incorporated with a minimal amount of extrabookkeeping in the cylindrical FDTD algorithm by identi-fying the edges intersected by the curved borehole/formationinterface, and changing the corresponding conductivities byeffective ones. In Section II-B.2, we discuss the application offace-based LC-FDTD for this same problem. The face-basedLC-FDTD is more intuitively more appealing and indeed leadsto more accurate results than edge-based LC-FDTD. We nev-ertheless include some edge-based results in the examples thatfollow, since this approach is still used in the FDTD literature.
2) Face-Based LC-FDTD: The second LC-FDTD approachutilizes face-based averaging. In this approach, a weighted meanis again used to obtain effective conductivities but the averagingprocess is now applied to the fields normal to the dual-grid facewhere the curved interface exists. Both the permittivity and con-ductivity are associated with a particular electric field, so whena material interface crosses the surface of a dual-grid cell, thepermittivity and conductivity is weighted accordingly.
Fig. 2 illustrates this second approach. From Maxwell’s equa-tions in the integral form applied at a given dual-grid cell face,we have
(9)
Assuming constant electric field over each dual-grid cell faceof the FDTD grid, the above equation simplifies to
(10)
Here, and represent the partial areas of each dual-gridcell face corresponding to conductivities and , respectively
(gray and white areas in Fig. 2). The effective conductivitythen becomes the weighted average below
(11)
Note that this approach applies to all three electric field com-ponents. The effective conductivities used in the FDTD updateequations for each electric field component use the andcalculated on the corresponding normal (dual-grid) face.
C. Application of Frequency Data Extraction Techniques forTreated FDTD Excitations
Well-logging problems usually involves CW (single fre-quency) operation (CW tools). For problems where the steady-state, CW behavior of the fields is of interest, it may be verycostly to run the time-domain simulation for long periods oftime to extract frequency-domain data, particularly for explicittime-domain methods, such as FDTD, in large 3-D domains.As a result, it is important to develop techniques to extractaccurate frequency data at early times during the simulation.
To achieve this, we employ here a treatment on the time-do-main source excitation and use the so-called two-equation two-unknown (2E2U) algorithm proposed in [14] for time-to-fre-quency conversion. The 2E2U is a very simple approach basedon the solution of two linear equations in single-frequency anal-ysis. Assuming a sinusoidal excitation at the source, one canapproximate the field components at any location in the compu-tational domain in the generic form
(12)
where and are the amplitude and the phase, andis the angular frequency. These equations are an approximationbecause, in practice, one cannot have a pure sinusoidal excita-tion but only a truncated one due to the turn-on effect of thesources at . The turn-on effect produces high-frequencycontamination and a dc offset as discussed later on. Given anytwo time instants and and corresponding field valuesand from the FDTD simulation, the unknowns and canbe obtained as
(13)
Successive and are used during the FDTD update untilconvergence is reached for and . In practice, andshould be chosen sufficiently apart to avoid ill-conditioningwhen solving for and . In practice, a satisfactory rule ofthumb is to choose the absolute time difference between and
to be around one tenth of the period .Because of the turn-on effect at , the early excitation
of the truncated sinusoidal source needs to be modified; oth-erwise, high-frequency contamination and dc offset [15] (i.e.,a slowly decaying time-average signal) will occur, leadingto a slower convergence in the frequency data extraction. Asmooth turn-on of the (pseudo)sinusoidal source can be used toavoid such dc offset. In addition, a smooth turn-on avoids high-

260 IEEE TRANSACTIONS ON GEOSCIENCE AND REMOTE SENSING, VOL. 43, NO. 2, FEBRUARY 2005
frequency contamination from the discontinuity on the deriva-tive at . In our case, we choose a time-domain excitationof the form , where is a raised cosine(RC) ramp function given by
(14)
where is the period of the sine function, and is thenumber of sine wave cycles during the ramp duration .
This particular excitation has the desirable properties thatboth the function and its first derivative are continuous for allvalues of at . However, the dc offset is zero only forvalues of multiples of 0.5.
Fig. 5 illustrates a typical convergence result for the phasedifference between the LWD receivers using a ramp-sinusoidalfunction with and the 2E2U approach. The phase dif-ference in this particular example converges after a time periodapproximately equals to .
D. Application of Permittivity Scaling for Lower FrequencyProblems
In the FDTD algorithm, the Courant stability condition in amedium with , , and establishes an upper bound on the timestep given by [16]
(15)where is the phase velocity given by
(16)
In well-logging problems, the spatial discretization resolutionis often dictated by the smallest skin depth inside the conduc-tive formation and not by the wavelength (since the former isoften smaller than the latter). As a result, the maximum timestep can become very small compared to the period of thewave. A small implies that the total number of time stepsnecessary to achieve convergence can become very large. Thisis especially true for low-frequency tools in high-conductivityformations.
Under these conditions, however, the displacement currentis much smaller than the conduction current. When this occurs(diffusion dominated regime), one can simply scale up the per-mittivity of the medium to increase the maximum allowed timestep [17], as can be seen by writing Maxwell’s equations in fre-quency domain
(17)
Here, all field quantities are now complex phasors, and is thecurrent excitation.
If , the above simplifies to
(18)
which does not depend on anymore. Hence, by scaling up(while still satisfying ), the Courant condition is relaxedwithout altering the physics of the problem. Permittivity scalingwas also used in [18] to solve a diffusive time-domain problem.
Fig. 3. Basic configuration of the LWD tool inside a 5-in-radius borehole.
In the present case, the only necessary postprocessing in the finalresults is the scaling back of field amplitudes to incorporate thechange on the intrinsic impedance. This scaling will depend onthe way the excitation is introduced in the problem. If an electricsource is used, then a scaling up is effected on the magnetic field.For a magnetic source, a scaling down is effected on the electricfield.
III. FDTD MODELING OF LWD TOOLS
The LWD tool configuration used here is illustrated in Fig. 3.The frequencies of operation in the examples considered rangefrom 100 kHz to 2 MHz. The tool has a 8-in diameter steel man-drel at its center. The transmitter and receiver antennas consistof 4.5-in radius circular wire loops wrapped around the man-drel. To simulate these loop antennas in the FDTD grid, a spa-tial discretization employing either a gap source excitation or acontinuous source excitation can be utilized. In the gap sourceexcitation, a voltage source is impressed between two points(gap) of the wire transmitter antenna by enforcing the electricfield to assume predetermined values along FDTD edges on astraight line between these two points. In the continuous sourceexcitation, an electric current source is impressed throughoutthe FDTD nodes comprising the wire transmitter antennas byenforcing the magnetic field to assume predetermined valuesover small loops (Ampere’s law) enclosing each FDTD nodealong the wire antenna. In the simulations that follow, we uti-lize continuous source excitations. The two single-loop receiverantennas are situated at 30 and 24 in away from a single-loop

HUE et al.: 3–D SIMULATION OF ECCENTRIC LWD TOOL RESPONSE 261
Fig. 4. Illustration of the cross-section of the LWD tool discretization in alayered formation.
Fig. 5. Example of the convergence behavior of the phase difference betweenLWD tool receiver voltages using the 2E2U approach.
transmitter antenna. The quantities of interest are the phase dif-ference (PD) and the amplitude ratio (AR) between the voltagesmeasured at the two receiver antennas
(19)
where and is the phase and amplitude of the receiver volt-ages, and the subscripts and denote receiver 1 and 2,respectively.
A cross-section plane of the LWD tool discretizationis depicted in Fig. 4. The discretization is nonuniform in the
Fig. 6. FDTD and NMM results for phase difference (PD) and amplitude ratio(AR) of a LWD tool in a uniform formation (infinitely thick bed) for variousvalues of formation conductivities. The mud conductivity is fixed at 0.0005mho/m.
direction, and includes two cells between the coils. Outside thecoils, is gradually increased to minimize memory require-ments. The maximum cell size is chosen aswhere is the skin depth corresponding to the largest conduc-tivity value in the formation. The increase in is gradual toavoid spurious reflections due to abrupt changes in the discreteimpedance of the grid (which depends on the local cell size).The skin depth is given as
m (20)
For , this reduces to
(21)
A uniform discretization is employed along both the longitu-dinal and azimuthal directions.

262 IEEE TRANSACTIONS ON GEOSCIENCE AND REMOTE SENSING, VOL. 43, NO. 2, FEBRUARY 2005
Fig. 7. Horizontal cross-section of an eccentric borehole problem.
Fig. 8. Conductivity distribution along the horizontal cross-section of thecylindrical FDTD for an eccentric LWD tool scenario.
IV. RESULTS
A. Homogeneous Formations
Fig. 6 depicts the phase difference response of the LWDtool in a borehole surrounded by homogeneous formations(infinitely thick bed) with different conductivities. The tooloperates at 2 MHz, and the borehole has 10-in diameter in thiscase. The conductivity of the mud (borehole fluid) is equal to5 mho/m (oil-based mud). A two-dimensional (2-D)version of the algorithm can be employed in this case, sincethe problem is axisymmetric. The domain is discretized usinga grid. The PML is set up using tencells both in and directions and a cubic taper profile forboth the real and imaginary parts of the stretching variables.The cell discretization size in the longitudinal direction in
cm, while in the radial direction varies from0.635 cm close to the mandrel to 3.18 cm at the outer edges.
Fig. 9. FDTD simulation results versus pseudoanalytical results of eccentricLWD tool responses. Phase difference and amplitude ratio are plotted against themandrel offset �x (see Fig. 7). The borehole has 12-in radius and is filled withoil-based mud � = 0:0005 mho/m. The surrounding homogeneous formationhas � = 10 mho/m. Very good agreement is observed between the FDTD andpseudoanalytical results.
This latter value is determined according to the skin depth of theformation with largest conductivity. The results are comparedagainst NMM results in Fig. 6, showing very good agreementfor all conductivity values.
B. Eccentric Tools
We next simulate an eccentric borehole problem, where theLWD tool is not aligned with the borehole axis, as illustrated inFig. 7. The conductivity distribution over an horizontal cross-section ( plane) of the 3-D FDTD grid is depicted in Fig. 8,where face-based averaging of the borehole and formation con-ductivities are visible at the borehole/formation interface.
Fig. 9 shows results from the simulation of an LWD tool ina mud with mho/m) and 12-in radius borehole.

HUE et al.: 3–D SIMULATION OF ECCENTRIC LWD TOOL RESPONSE 263
Fig. 10. FffDTD simulation results versus pseudoanalytical results ofeccentric LWD tool responses. Phase difference and amplitude ratio are plottedagainst the mandrel offset �x (see Fig. 7). The borehole has 12-in radius andis filled with oil-based mud � = 10:0 mho/m. The surrounding homogeneousformation has � = 0:1 mho/m. Very good agreement is again observedbetween the FDTD and pseudoanalytical results.
The abscissa in this figure represents the mandrel offset, i.e.,the distance between the mandrel axis and the borehole axis,as indicated in Fig. 7. The tool operates at 2 MHz. The forma-tion is homogenous with mho/m, and different eccen-tricities are considered. The discretization of the domain in thiscase utilizes a grid. The PMLhas ten cells with cubic taper profiles in both the and direc-tions. The discretization is nonuniform in direction, withvarying from 0.635–18.77 cm, and uniform in direction, with
cm. Fig. 9 compares the face-based and edge-basedLC-FDTD against pseudoanalytical results, showing very goodagreement. Face-based LC-FDTD consistently perform slightlybetter than the edge-based LC-FDTD.
Fig. 11. Influence of eccentricity and borehole size on LWD tool response.(a) Case 1: Borehole size is varied while keeping mandrel centered. (b) Case 2:Borehole size is varied while keeping the offset distance �x fixed.
In general, the effect of eccentricity on the tool response islarger when the conductivity contrast between the mud and thesurrounding formation is high. To illustrate this point, Fig. 10shows results for the same 2-MHz LWD in a 12-in boreholenow with water-based mud with mho/m in homoge-neous formation with mho/m. The discretization uti-lizes the same parameters as the previous example. The varia-tion on the (absolute) phase difference and amplitude ratio asa function of the eccentricity is clearly less pronounced in thiscase. Face-based and edge-based LC-FDTD again show verygood agreement against pseudoanalytical results.
The maximum degree of eccentricity depends on the ratio be-tween the borehole and mandrel radii. In other words, for a given

264 IEEE TRANSACTIONS ON GEOSCIENCE AND REMOTE SENSING, VOL. 43, NO. 2, FEBRUARY 2005
Fig. 12. FDTD simulation of the response of eccentric LWD tools in ahomogenous formation. A high-contrast case is considered with mud andformation conductivities equal to 10 and 0.0001 mho/m, respectively. Case 1curve is the LWD tool reponse versus borehole radius while the tool is keptat the center of the borehole [see Fig. 11(a)]. Case 2 curve is the LWD toolresponse versus borehole size while keeping a fixed distance d = 4:75 in fromthe mandrel axis to closest borehole wall [see Fig. 11(b)].
tool geometry (mandrel radius), the maximum variation on thetool response due to eccentricity effects can be established asa function of the borehole radius. To illustrate the latter point,we consider two borehole scenarios. In the first scenario, welet the borehole size vary while keeping the logging tool cen-tered (Case 1), as illustrated in Fig. 11(a). In the second sce-nario, we let the borehole size vary while keeping the distancefrom the logging tool to the borehole wall fixed (Case 2) andequal to in, as illustrated in Fig. 11(b). We con-sider a high-contrast case where the conductivity of the mudis mho/m and the conductivity of the formation is
mho/m. The phase difference and amplitude ratiobetween the receiver voltages is plotted against the borehole ra-dius in Fig. 12. The difference between Case 1 and Case 2 is
Fig. 13. Electric field (� component) distribution on the horizontalcross-section of the cylindrical FDTD grid for an eccentric LWD tool. (Top)An expanded view of the field distribution on the formation. (Bottom) Zoomedview of the field distribution close to the borehole. The mud conductivity is� = 0:01 mho/m, and the formation conductivity is � = 0:1 mho/m.
produced solely by the eccentricity effect. These two curves pro-vides us with a range of values for phase difference and ampli-tude ratio in a borehole of given size when the degree of eccen-tricity is not exactly known (as often occurs in practice). Fromthis figure, we observe that the variation of the tool response dueto eccentricity effects is more limited for smaller size boreholes,as expected.
To illustrate qualitatively the effect of the eccentricity on thefield distribution, we plot in Figs. 13 and 14 the componentelectric field distribution along the horizontal cross section ofthe borehole. In this case, the mandrel axis is situated 3.5 inaway from the borehole axis in a borehole with 9-in radius. InFig. 13, the conductivity of the mud and formation are
and , respectively. In Fig. 14, the conductivity

HUE et al.: 3–D SIMULATION OF ECCENTRIC LWD TOOL RESPONSE 265
Fig. 14. Electric field (� component) distribution on the horizontalcross-section of the cylindrical FDTD grid for an eccentric LWD tool.(Top) An expanded view of the field distribution on the formation. (Bottom)Zoomed view of the field distribution close to the borehole. The mudconductivity is again � = 1:0 mho/m, and the formation conductivity isnow � = 0:1 mho/m in this case.
of the mud and formation are and , re-spectively. In these figures, we observe that the field penetratesasymmetrically into the formation due to eccentricity effect. Thefield penetration profile not only depends on the degree of ec-centricity but also on the relative conductivities of the mud andthe surrounding formation.
C. Eccentric Tools in Dipping Beds
The present FDTD method allows the simulation of LWDtool problems in eccentric and dipping bed environments si-multaneously. Fig. 15 shows the simulation results for anLWD tool operating at 2 MHz on a three-layer formationwith dipping bed for various eccentricities and dipping angles.The middle layer (dipping bed) is 60 in thick. The upper and
lower layers have conductivity mho/m, whereas themiddle layer has conductivity mho/m. The bore-hole has 9-in radius. We consider an oil-based mud with
mho/m.The discretization employs a
grid. The PML has ten cells with cubic taper profiles in both theand directions. The discretization is nonuniform in direc-
tion, with varying from 0.635–7.11 cm, and uniform in di-rection, with cm. We use the face-based LC-FDTDto model the eccentric geometry and a staircasing approxima-tion to model the dipping bed. The ECCE label in Fig. 15 repre-sents the offset distance (in inches) of the eccentric tool asindicated in Fig. 7. Compared to [19] and [20], the noneccentricresults in these figures show very similar behavior according tothe dip angle.
From these plots, we can observe two main effects caused bythe eccentricity. First, as mentioned before, the change on theapparent resistivity due to the eccentricity effect is larger whenthe contrast between the mud and the resistivity (conductivity)of the surrounding layer is larger. Note that, in this example, thelarger contrast occurs in the upper and lower layers (leftmostand rightmost regions of the figure, respectively). In addition,the eccentricity produces an increase in the horn effect in thehighly deviated bed case for this example.
D. LWD Tools at Lower Frequencies
Fig. 16 shows the simulation results for a LWD tool oper-ating at 500 kHz, using a water-based mud with mho/min a three-layer formation where the center bed is again 60 inthick. The FDTD results are validated against NMM resultsshowing very good agreement. This problem is axisymmetricand the discretization of the 2-D domain in this case uses a
grid. Since the skin depth is larger atthis lower frequency, the cell size in the direction variesfrom 0.635–14.24 cm. Note that, for lower frequencies, largevariations on the cell size have less impact on the discreteimpedance because the number of grid points per wavelength ismuch larger. The direction cell size is uniformly discretizedwith cm. The PML is inserted over the ten outer-most cells in along the radial direction and over the bottom tenand top ten cells along the longitudinal direction. The PMLemploys a cubic tapered profile on both the real and imaginarypart of the stretching variables.
Next, we simulate the same tool operating at 100 kHz. Thediscretization in this case employs agrid. The discretization cell is nonuniform in the directionvarying from 0.635–31.83 cm, and uniform in the directionwith cm. The ten-layer PML employs a cubic ta-pered profile only in the part of the stretching variables.No imaginary stretching is used, since this is now an essen-tially diffusive problem. Permittivity scaling is desirable atthis frequency because the ratio of the displacement current tothe conduction current is very small, .A time step much larger than established by the Courant con-dition 15 can then be used, as illustrated in Table I. Fig. 17shows a comparison between FDTD and NMM results for

266 IEEE TRANSACTIONS ON GEOSCIENCE AND REMOTE SENSING, VOL. 43, NO. 2, FEBRUARY 2005
Fig. 15. FDTD simulations of eccentric LWD tools in formations with dipping beds. The upper and lower layer conductivities is � = 1 mho/m, while the60-in-thick dipping bed has � = 0:01. The borehole has radius 9 in and is filled with oil-based mud with � = 0:0005. The label ECCE in this plots represents theoffset distance �x in inches (see Fig. 7).
the phase difference and amplitude ratio in this case. FDTDresults use and . This figure showsthat the scaled permittivity results still provide very accurateresults. The phase velocity, wavelength, time step, and nor-malized CPU time for and are givenin Table I.
V. CONCLUSION
We have described the application of several techniques tomodel eccentric borehole problems in dipping formations usingcylindrical FDTD. Results from FDTD simulations were val-idated against pseudoanalytical and NMM results (when thelatter are applicable) in a number of scenarios, including eccen-tric tools with high-conductivity contrast between mud and for-mation and for varying degrees of eccentricity.
For the examples considered, the effect of eccentricity on thetool response is observed to be more important when the con-ductivity contrast between the mud and the surrounding forma-tion is high, as expected. The specific behavior of the ampli-tude ratio and phase difference versus the degree of eccentricitydepends on the particular mud and formation conductivities in-volved, as illustrated in Figs. 9 and 10. When considered to-gether with deviated formations, it was observed that eccentricgeometries can produce an increase in the horn effect for largedipping angles, as shown in Fig. 15.
The maximum degree of eccentricity in a borehole problem isa function of the ratio between the mandrel and borehole radii.For a given ratio, curves indicating the predicted variations onthe tools response caused to eccentricity effects can be obtainedby simulating the responses of both centered (axisymmetric)and maximally eccentric cases, such as provided in Fig. 12.

HUE et al.: 3–D SIMULATION OF ECCENTRIC LWD TOOL RESPONSE 267
Fig. 16. FDTD and NMM results of a 500-kHz LWD tool response in a three-layer formation with lower, middle, and upper layer conductivities equal to 1,0.01, and 1 mho/m, respectively. The conductivity of the mud is 2 mho/m. Themiddle bed is 60 in thick.
TABLE IPHASE VELOCITY, WAVELENGTH, TIMESTEP, AND NORMALIZED
CPU TIME WITH SCALED PERMITTIVITIES
The use of PML as absorbing boundary condition for the cylin-drical FDTD algorithms allows the use of more compact gridsaround the logging tool, and the use of locally conformal FDTDtechniques reduces the staircasing error present in the representa-tion of the borehole wall for eccentric problems. Finally, for toolsoperating at lower frequencies, the use of permittivity scaling hasshown to be useful in reducing the computation time for diffusiveproblems. For example, the CPU time necessary to run a 100 KHzLWD tool after scaling is about 13% of the original CPU time(with the actual permittivity) for the case considered in Table I.
Fig. 17. FDTD and NMM results of a 500-kHz LWD tool response in a three-layer formation with lower, middle, and upper layer conductivities again equal to1, 0.01, and 1 mho/m, respectively. The mud conductivity is now 0.0005 mho/m.The middle bed is 60 in thick.
ACKNOWLEDGMENT
The authors would like to thank the reviewers for their usefulsuggestions.
REFERENCES
[1] Z.-Q. Zhang and Q.-H. Liu, “Applications of the BCGS-FFT methodto 3-D induction well-logging problems,” IEEE Trans. Geosci. RemoteSens., vol. 41, no. 5, pp. 998–1004, May 2003.
[2] S. Liu and M. Sato, “Electromagnetic logging technique based onborehole radar,” IEEE Trans. Geosci. Remote Sens., vol. 40, no. 9, pp.2083–2092, Sep. 2002.
[3] J. Li and C. Liu, “A three-dimensional transmission line matrix (TLM)method for simulations of logging tools,” IEEE Trans. Geosci. RemoteSens., vol. 38, no. 4, pp. 1522–1529, Jul. 2000.
[4] B. Anderson, “Simulation of induction logging by the finite-elementmethod,” Geophysics, vol. 49, no. 11, pp. 1943–1958, Nov. 1984.
[5] T. Wang, S. Fang, and A. G. Mezzatesta, “Three-dimensional finite-dif-ference resistivity modeling using an upgridding method,” IEEE Trans.Geosci. Remote Sens., vol. 38, no. 4, pp. 1544–1550, Jul. 2000.

268 IEEE TRANSACTIONS ON GEOSCIENCE AND REMOTE SENSING, VOL. 43, NO. 2, FEBRUARY 2005
[6] Q. H. Liu, W. C. Chew, M. R. Taherian, and K. A. Safinya, “A modelingstudy of electromagnetic propagation tool in complicated borehole en-vironments,” Log Anal., vol. 30, pp. 424–436, 1989.
[7] Z. Q. Zhang and Q.-H. Liu, “Simulation of induction logging responseusing conjugate gradient method with nonuniform fast Fourier and fastHankel transforms,” Radio Sci., vol. 36, no. 4, pp. 599–608, 2001.
[8] J.-Q. He and Q.-H. Liu, “A nonuniform cylindrical FDTD with im-proved PML and quasi-PML absorbing boundary conditions,” IEEETrans. Geosci. Remote Sens., vol. 37, no. 2, pp. 1066–1072, Mar. 1999.
[9] F. L. Teixeira and W. C. Chew, “Finite-difference computation oftransient electromagnetic waves for cylindrical geometries in com-plex media,” IEEE Trans. Geosci. Remote Sens., vol. 38, no. 4, pp.1530–1543, Jul. 2000.
[10] J. Berenger, “Three-dimensional perfectly matched layer for the absorp-tion of electromagnetic waves,” J. Comput. Phys., vol. 127, no. 2, pp.363–379, 1996.
[11] F. L. Teixeira and W. C. Chew, “PML-FDTD in cylindrical and sphericalgrids,” IEEE Microw. Guided Wave Lett., vol. 7, pp. 285–287, Sep. 1997.
[12] J. R. Lovell and W. C. Chew, “Effect of tool eccentricity on some elec-trical well-logging tools,” IEEE Trans. Geosci. Remote Sens., vol. 28,no. 1, pp. 127–136, Jan. 1990.
[13] W. Yu and R. Mittra, “A conformal finite difference time domain tech-nique for modeling curved dielectric surface,” IEEE Microw. WirelessCompon. Lett., vol. 11, pp. 25–27, Jan. 2001.
[14] C. M. Furse, “Faster than Fourier: Ultra-efficient time to frequency-do-main conversions for FDTD simulations,” IEEE Antennas Propag. Mag.,vol. 42, pp. 24–34, Dec. 2000.
[15] C. M. Furse, D. H. Roper, D. N. Buechler, D. A. Christensen, and C.H. Durney, “The problem and treatment of DC offsets in FDTD simu-lations,” IEEE Antennas Propag. Mag., vol. 48, no. 8, pp. 1198–1201,Aug. 2000.
[16] A. Taflove and S. Hagness, Computational Electrodynamics: The Fi-nite-Difference Time-Domain Method, 2nd ed. Norwood, MA: ArtechHouse, 2000.
[17] R. Holland, “Finite-difference time-domain (FDTD) analysis of mag-netic diffusion,” IEEE Trans. Electromagn. Compat., vol. 36, no. 1, pp.32–39, Feb. 1994.
[18] T. Wang and G. W. Hohmann, “A finite difference, time-domain solutionfor three- dimensional electromagnetic modeling,” Geophysics, vol. 58,pp. 797–809, 1993.
[19] R. H. Hardman and L. C. Shen, “Charts for correcting effects of forma-tion dip and hole deviation on induction logs,” Log Anal., vol. 4, no. 28,pp. 349–356, Jul.–Aug. 1987.
[20] R. Chemali, S. Gianzero, and S. M. Su, “The dual laterolog in commoncomplex situations,” in Proc. 29th Annu. Logging Symp. Transactions:Soc. Professional Well Log Analysts, vol. 1, 1988, pp. 1–25.
Yik-Kiong Hue was born in Kuala Lumpur, Malaysia, in 1977. He received theB.S. and M.S. degrees in electrical engineering from The Ohio State University,Columbus, in 2001 and 2003, respectively. He is currently pursuing the Ph.Ddegree at The Ohio State University.
He is currently with the ElectroScience Laboratory, Department of ElectricalEngineering and Computer Engineering, The Ohio State University. His currentresearch interest includes numerical modeling for geophysical application. Mr.Hue was the recipient of a 2004-05 SPWLA scholarship.
Fernando L. Teixeira (S’96–M’99–SM’03) received the Ph.D degree in elec-trical engineering from the University of Illinois, Urbana-Champaign, in 1999.
From 1996 to 1999, he was a Research Assistant with the University of Illi-nois. From 1999 to 2000, he was a Postdoctoral Research Associate with the Re-search Laboratory of Electronics, Massachusetts Institute of Technology, Cam-bridge, MA. Since 2000, he has been an Assistant Professor with the Departmentof Electrical and Computer Engineering, The Ohio State University (OSU),Columbus, OH. He has edited one book and has published over 50 journalsarticles and book chapters.
Dr. Teixeira received the IEEE MTT Fellowship Award in 1998, the RajMittra Outstanding Research Award from the University of Illinois in 1999, aURSI Young Scientist Award in 2002, a National Science Foundation CAREERAward in 2004, and the OSU Lumley Research Award in 2004. He is a memberof Sigma Xi, Phi Kappa Phi, and Elected Member of U.S. Comission B of URSI.
Luis San Martin received the Ph.D. degree in physics from the University ofIllinois, Urbana-Champaign, in 1998.
He is a Principal Scientist with the Sensor Physics Department, HalliburtonEnergy Services, Houston, TX. After graduation, he joined Halliburton EnergyServices Research. He is currently with the Sensor Physics Group as part of theElectromagnetic Group.
Michael S. Bittar received the B.S., M.S., and Ph.D. degrees in electrical engi-neering from the University of Houston, Houtson, TX, in 1983, 1986, and 1990,respectively.
He is the Resistivity Team Leader and the Sensor Physics Manager forboth Sperry–Sun and Logging & Perforating of Halliburton Energy Services,Houston. He joined Sperry–Sun in 1990 and has been working on electricalresistivity tools design and theoretical modeling of electromagnetic wavetools. From 1984 to 1990, he was a Research Assistant in the Well-LoggingLaboratory, University of Houston. He holds many U.S. and internationalpatents and is the author of various publications on electromagnetic logging.