IDENTIFYING BIOTIC AND ABIOTIC FACTORS INFLUENCING …
95
IDENTIFYING BIOTIC AND ABIOTIC FACTORS INFLUENCING SOYBEAN SOIL HEALTH AND WINTER WHEAT PRODUCTION By Michael Joseph Swoish A THESIS Submitted to Michigan State University in partial fulfillment of the requirements for the degree of Crop and Soil Sciences – Master of Science 2016
Transcript of IDENTIFYING BIOTIC AND ABIOTIC FACTORS INFLUENCING …

IDENTIFYING BIOTIC AND ABIOTIC FACTORS INFLUENCING SOYBEAN SOIL
HEALTH AND WINTER WHEAT PRODUCTION
By
Michael Joseph Swoish
A THESIS
Submitted to
Michigan State University
in partial fulfillment of the requirements
for the degree of
Crop and Soil Sciences – Master of Science
2016

ABSTRACT
IDENTIFYING BIOTIC AND ABIOTIC FACTORS INFLUENCING SOYBEAN SOIL
HEALTH AND WINTER WHEAT PRODUCTION
By
Michael Joseph Swoish
Soil microbiota affect crop productivity via nutrient movement to plant roots, disease
incidence, and other specialized relationships including nodule formation in soybean (Glycine
max L.). Field studies were initiated in Lansing, MI to determine the impact of three cover crops
and four fertilizer sources on soybean emergence, height, nodulation, grain yield, soil respiration,
and spatial/temporal changes in microbial diversity, community structure, and community
composition. A significant 5 bu ac-1 yield decrease occurred in 2013 when hairy vetch preceded
soybean. Soil respiration was greatest following chicken manure but never significantly greater
than following inorganic fertilizer. Cover crop and fertilizer source both exhibited the ability to
alter soil microbial community composition within a single growing season indicating that
grower management can influence soil health in production agriculture.
Lodged wheat (Triticum aestivum L.) can result in harvest difficulties and yield loss.
Trinexepac-ethyl is a newly labeled plant growth regulator (PGR) for application to wheat in
Michigan designed to decrease internode length and increase stem thickness to reduce lodging
incidence. Field studies were initiated in Deckerville, MI and Lansing, MI to determine the
effects of PGR rate, timing, and interaction with three N rates on winter wheat height, lodging,
and yield. PGR application reduced plant height, decreased lodging by 67-83%, and increased
grain yield 5% across four site years. When lodging risks are increased (i.e., varieties with poor
stem strength and/or greater than average height), wheat may warrant PGR application, and
applications should occur early in stem elongation to maximize production opportunities.

iii
ACKNOWLEDGEMENTS
I would like to thank my major advisor, Dr. Kurt Steinke, for mentoring me throughout
my Master’s degree and making this achievement possible. I would also like to thank Dr. Chris
DiFonzo and Dr. Brian Teppen for serving on my committee and aiding with my projects and
writing.
I also greatly appreciate the help and support of our research technician, Andrew
Chomas, assistant farm manager, Tom Galecka, and Dr. Noah Rosenzweig. The collaboration
and assistance of fellow graduate students, including Christopher Bauer, Dan Quinn, Jeff Rutan,
and Luke Thurgood, was invaluable during my degree. Thanks is also due to all of our
hardworking undergraduate students who assisted in the field. Lastly, I would like to thank my
friends and family for their unwavering love and encouragement along the way.
iv
TABLE OF CONTENTS
LIST OF TABLES ..................................................................................................................... vi
LIST OF FIGURES .................................................................................................................. viii
CHAPTER 1 LITERATURE REVIEW .................................................................................... 1
Introduction .................................................................................................................... 1
Soybean Response to Soil Properties and Fertility ........................................................ 2
Influence of Soil Bacteria and Management Decisions on Soybean Nodulation .......... 4
Effects of Cover Crops on Soil Properties and Plant Growth ........................................ 6
Hairy Vetch ........................................................................................................ 7
Oilseed Radish ................................................................................................... 9
Effect of Soybean, Cover Crop, and Fertilizer on Soil Microorganisms ....................... 13
REFERENCES .............................................................................................................. 18
CHAPTER 2 INFLUENCE OF PLANT GROWTH REGULATORS AND NITROGEN RATE
ON SOFT WINTER WHEAT GROWTH AND YIELD .......................................................... 29
Using Plant Growth Regulators to Improve Small Grains Production .......................... 29
Materials and Methods ................................................................................................... 31
Locations and Site Descriptions......................................................................... 31
Experimental Procedures for PGR Timing and Rate ......................................... 32
Experimental Procedures for PGR by N Rate.................................................... 33
Statistical Analysis ............................................................................................. 34
Wheat Grain Yield Response to Plant Growth Regulator and Nitrogen ....................... 35
Plant Growth Regulator Effects on Greenness, Height, and Lodging ........................... 37
Conclusions .................................................................................................................... 42
REFERENCES .............................................................................................................. 43
CHAPTER 3 SOIL MICROBIAL COMMUNITY COMPOSITION AND SOYBEAN YIELD
FOLLOWING COVER CROP AND FERTILIZER SOURCE ................................................ 47
Introduction .................................................................................................................... 47
Materials and Methods ................................................................................................... 51
Site Description and Experimental Design ........................................................ 51
Data Collection .................................................................................................. 52
Soil DNA Extraction and Analysis .................................................................... 54
Data Analysis ..................................................................................................... 55
Results and Discussion .................................................................................................. 55
Environmental Conditions ................................................................................. 55
Cover Crop Effects on Residual Soil Nutrient Levels ....................................... 58
Soybean Emergence and Growth ....................................................................... 59
Grain Yield and Quality ..................................................................................... 60
DNA Sequence Analysis.................................................................................... 63
Phyla Relative Abundance ................................................................................. 64

v
Community Metastats (Amount of statistically different OTUs) ...................... 67
Indicator Species Variability Based on Sampling Time and Origin .................. 68
Effect of Cover Crops and Fertilizer on Soil Respiration .................................. 70
Inverse Simpson’s Diversity .............................................................................. 72
Variance in Phylogenetic Tree Clustering ......................................................... 75
Conclusions .................................................................................................................... 77
REFERENCES .............................................................................................................. 79

vi
LIST OF TABLES
Table 2.1. Wheat grain yield as affected by Palisade EC application timing and rate, Deckerville,
MI, 2012 – 2013. ..........................................................................................................................35
Table 2.2. Wheat grain yield as affected by Palisade EC application and N rate, Lansing, MI,
2014 – 2015..................................................................................................................................36
Table 2.3. Main effects and interactions for wheat greenness, lodging, plant height, peduncle
length, heads/ft.2, grain moisture, test weight, and yield across three nitrogen rates, Lansing, MI,
2014-15. .......................................................................................................................................39
Table 2.4. Effects of PGR applied at 12 oz./acre on Feekes 10.5.4 wheat height and peduncle
length, Deckerville and Lansing, MI, 2012-2015. .......................................................................40
Table 2.5. Influence of PGR rate on Feekes 10.5.4 wheat height and lodging incidence,
Deckerville, MI, 2012-2013. ........................................................................................................40
Table 2.6. Severity of wheat plant lodging when present, Deckerville and Lansing, MI, 2012-
2014..............................................................................................................................................41
Table 3.1. Mean precipitation, air temperature, and soil temperature (5-cm depth) in Lansing, MI
for 2012/13 and 2013/14 cover crop and soybean growing seasons. ..........................................57
Table 3.2. Soybean stand count and plant height as affected by previous cover crop, Lansing, MI,
2013..............................................................................................................................................60
Table 3.3. Influence of previous cover crop and fertilizer source on soybean grain yield, Lansing,
MI, 2013 – 2014. ..........................................................................................................................62
Table 3.4. Relative abundance (0 – 10-cm) of individual soil bacterial phyla (representing
>10,000 sequences per year) present in soybean. Values were averaged across three cover crop
treatments and four fertilizer sources from soil sampling at growth stage R1 and harvest,
Lansing, MI, 2013 – 2014. ...........................................................................................................64
Table 3.5. Soil moisture (5-cm), precipitation, and soil temperature (5-cm) for the two-week
period prior to final soil sampling and soybean harvest soil sampling (14 October 2013 and 29
October 2014), Lansing, MI, 2013 – 2014. “N/A” represents days when readings from the
weather station were not available. ..............................................................................................66
Table 3.6. Influence of cover crop on relative abundance (0 – 10-cm) of the top 1,000 OTUs per
year present in soybean, Lansing, MI, 2013 – 2014. Operational taxonomic units were averaged
across four fertilizer sources from soil sampling at growth stage R1 and harvest. Values represent
the number of OTUs with significantly different abundance out of the top 1,000 OTUs. ..........68

vii
Table 3.7. Effect of sample time and sample origin on relative abundance of top 20 OTUs 2013 –
2014. Abundance values were averaged across three cover crop treatments and four fertilizer
sources. An “x” signifies that the OTU was represented significantly (P < 0.05) more for the
given sampling time and origin. Only those OTUs which had a significant sampling time by
origin interaction are shown.........................................................................................................70
Table 3.8. Cover crop and fertilizer source interaction on inverse Simpson’s diversity values (0 –
10-cm) at two soil sample timings, 2013, Lansing, MI. ..............................................................74
Table 3.9. Interaction between soil sampling time and origin on inverse Simpson’s diversity
values (0 – 10-cm), 2014, Lansing, MI. Between-row samples were collected at least 30-cm from
the nearest soybean stem whereas rhizosphere samples were collected within the row between
two adjacent soybean plants.........................................................................................................75

viii
LIST OF FIGURES
Table 3.1. Maximum daily soil moisture (5-cm) comparison for the April – October growing
season, Lansing, MI, 2013 – 2014. ..............................................................................................58

1
CHAPTER 1
LITERATURE REVIEW
Introduction
Farmers in the Midwestern United States (U.S.) have expressed concerns about
inabilities to increase soybean yield (Naeve, 2004). Inconsistent yield response to fertilizer when
soil-test nutrient levels exceed critical values may be one reason mean corn (Zea mays L.) grain
yields in Michigan increased 41% more than soybean (Glycine max (L.) Merr.) yields between
1980 and 2014. Mean soybean grain yields in Michigan are < 3.2 Mg ha-1, but yields sometimes
surpass 5.4 Mg ha-1 in individual fields (NASS, 2015). Better understanding of the relationship
between soil properties, agronomic management, soybean yield, and seed quality is required to
optimize soybean production (Anthony et al., 2012). Field research in the Midwestern U.S.
indicated that relationships between soybean yield and soil physical properties, including soil test
potassium (K), soil water content, and slope, may be dependent upon environmental factors
within individual fields (Kravchenko and Bullock, 2000; Sawchik and Mallarino, 2008). Despite
considerable variation in weather patterns, Anthony et al. (2012) reported within-field spatial
variability in soybean yield remained consistent across years. Although correlation of soybean
yield variation with soil properties or topographical features is well-documented in the literature
(Fahnestock et al., 1996; Changere and Lal, 1997; Kravchenko and Bullock, 2000; Kaspar et al.,
2004; Anthony et al., 2012), few data exist demonstrating whether soil biological components
(i.e., microbial community composition) may also explain yield variability.
Variability in soybean grain quality is a concern since soybean producers may be paid a
premium for specific grain traits (e.g. high protein or oil concentration) (Brumm and Hurburgh,

2
2006). Soybean protein concentrations tend to decrease from the south-east to the north-west
U.S. (Hurburgh et al., 1990; Brumm and Hurburgh, 2006), and growers attempting to capitalize
on premium trait soybeans must determine how management practices affect seed quality. In one
study, soybean protein and oil concentrations varied from 10 – 78% within fields planted to a
single genotype (Kravchenko and Bullock, 2000). Similar to grain yield, protein to oil ratio is
correlated with soil chemical, physical properties, and climate-soil interactions on a regional
scale (Anthony et al., 2012). Increasing soybean grain quality is most important in countries that
cannot meet daily protein intake requirements.
Soybean Response to Soil Properties and Fertility
Although positive soybean yield response to fertilizers is rarely achieved when soil test
nutrient values are sufficient (Welch et al., 1973; Anthony et al., 2012; Slaton et al., 2013),
positive yield or quality responses to soil properties or amendments are present in the literature.
Yield is correlated with increased elevation and greater slope (Fahnestock et al., 1996; Changere
and Lal, 1997; McConkey et al., 1997; Kravchenko and Bullock, 2000). The association between
low, flat portions of the landscape and greater yield is attributed to water movement patterns that
increased plant water supplies in low-lying areas of the field. However, Kaspar et al. (2004)
found the yield and elevation/slope relationship is reversed in years when excess precipitation
results in standing water in low-lying areas. Anthony et al. (2012) attributed a correlation
between elevation and yield to soil pH. Soil pH and elevation were strongly correlated at two
locations, with greater pH correlating with lower elevation in fine-loamy soils. A significant
negative correlation between pH and yield was also observed in all six site years of the study.

3
Whether the addition of nitrogen (N) fertilizer is necessary to achieve maximum soybean
yield is unclear in the literature. Previous research showed the addition of N fertilizer lead to
increased soybean yield (Harper, 1974; Adeli et al., 2005), but more recent studies indicated no
yield increase following N application (Anthony et al., 2012; Slaton et al., 2013). In relation to
grain quality, research suggests that fertilizer N may increase soybean grain protein (Schmitt et
al., 2001; Anthony et al., 2012). The addition of supplemental inorganic or organic N to soybean
may be unnecessary in soils with sufficient rhizobia populations to facilitate adequate N fixation
(Schultz and Thelen, 2008).
Donald et al. (2013) investigated the effects of broiler litter application on soybean in a
field with sufficient soil phosphorus (P) and potassium (K) nutrient levels. They found that plant
height increased by as much as 15% with chicken litter compared to unfertilized control.
Incorporation of the litter did not increase height compared to surface application, nor did rate
(6.7 Mg ha-1 or 13.4 Mg ha-1) of litter applied. Greater soybean grain yield was observed
following broiler litter compared to unfertilized plots in disked soil for three consecutive years.
However, soybean cyst nematode concentration in the soil was also increased two out of three
years following chicken litter application compared to control. Soil test P, magnesium (Mg), and
zinc (Zn) levels were greater following broiler litter application as opposed to control, which was
consistent with the results of Gilfillen et al. (2010). Adeli et al. (2005) reported that the
application of broiler litter prior to soybean planting increased yield compared to soybean
receiving no fertilizer as well as soybean planted after inorganic fertilization. However, due to
the buildup of heavy metals to plant-toxic levels, successive broiler litter applications may not be
advisable (Gilfillen at al., 2010). Nutrient availability of poultry litter may vary based on number
of animals, composition of the animal feed ratios, design of waste management systems, bedding

4
material, and environmental conditions (Hochmuth et al., 2007). Since nutrient content of litter
varies across time and location, Walker (2010) advised testing to accurately record the amount of
nutrient being applied.
Influence of Soil Bacteria and Management Decisions on Soybean Nodulation
Soybean can fix up to 70% of the total N required for growth via symbiotic partnerships
with soil bacteria (Tien et al., 2002; Lindemann and Glover, 2003). Bacteria-soybean N fixation
was previously thought to occur only between soybean and Bradyrhizobium japonicum, but
further research showed that symbiotic relationships between other species of bacteria and
soybean can also contribute to N fixation (Rodriguez-Navarro et al., 2011). Rhizobia which form
nitrogen-fixing soybean nodules include Bradyrhizobium elkanii (Kuyendall et al., 1992),
Bradyrhizobium lianoningense (Xu et al., 1995), Mesorhizobium tianshanense (Chen et al.,
1995), and Sinorhizobium fredii and xinjianganse (Chen et al., 1988). Bradyrhizobium
japonicum is the species most specific to soybean N fixation in most North American cultivars
(Balatti and Pueppke, 1992). Nodulation efficiency between specific strains of rhizobium and
individual soybean genotypes is an important factor to consider, as increased nodulation
efficiency can lead to enhanced N fixation potential.
Rhizobium inoculation increases soybean yield by as much as 50% in fields with no
history of soybean (Duong et al., 1984; Seneviratne et al., 2000). Rhizobium inoculation in fields
with history of soybean increased yield in some studies (Beuerlein, 2005; Conley and Christmas,
2006) and have no effect in others (Vitosh, 1997; Pedersen, 2003; Abendroth and Elmore, 2006;
Schulz and Thelen, 2008). Soil factors including pH, soil water content, organic matter, and soil
texture can impact Bradyrhizobium japonicum populations (Albrecht et al., 1984; Graham, 1992;

5
Bacanamwo and Purcell, 1999; Abendroth and Elmore, 2006), and successive inoculation may
increase soybean nodulation only in areas with high annual reductions in rhizobium populations
(e.g., pH < 5, sandy soil types). Economic return of repeated inoculation can vary by location,
and may be cost effective depending upon soil physical and chemical properties, precipitation,
and temperature (Schultz and Thelen, 2014).
Management decisions (e.g. cover crop or fertilizer selection) affect soybean nodule
formation. In the greenhouse, Sato et al. (2011) measured the effect on soybean nodulation of
incorporating hairy vetch foliage into soil prior to planting across soil types. Number of nodules
and total nodule biomass varied based on soil type. An increase in nodulation and N2 fixation
were observed in a gley lowland soil, which was observed by Sato et al. (2007) as well. In a
sand-dune regosol soil, the amount of nodules was not affected, but nodule dry weight decreased
significantly after hairy vetch foliage application, indicating that the growth of individual
nodules was inhibited (Takashi et al., 2011). In a non-allelopathic andosol soil, the number of
nodules was decreased, which could have been due to a low soil pH as opposed to a direct effect
of hairy vetch residue. Ill-Min and Joung-Kuk (1994) reported that a 1% weight/volume hairy
vetch residue extract reduced hydroponically-grown soybean nodule number by 20%. Variable
results between soil types and between field and greenhouse experiments suggest that soil factors
including pH, soil type, and soil microbiological activity all influence the effect of hairy vetch
residues on subsequent soybean nodulation. It is not known whether increased Rhizobium
leguminosarum biovar viceae (i.e. the bacterium responsible for hairy vetch nodule formation)
presence following a hairy vetch cover crop competes directly with Bradyrhizobium japonicum
to decrease soybean nodulation (Mothapo et al., 2013).

6
Nodulation also depends on fertilizer use. Matsunaga and Matsumoto (1984) reported
that soybean yield was dependent upon a combination of N fixed by nodule bacteria and
supplemental N from soil and fertilizer applications. Nutrient additions besides N also promoted
soybean nodule formation and productivity. For example, Matsunaga and Matsumoto (1984)
observed increased nodulation with both P and K applications. Jones et al. (1977) stated that P
fertilization increased nodule number and weight significantly over an unfertilized check. Tagoe
et al. (2008) observed a significantly greater number of soybean nodules when chicken litter was
applied at 100 kg first year mineralizable N ha-1 and attributed the increase to the high available
P content in the litter. In contrast, Streeter (1985) said that N contributions from manure or
fertilizer applications on soybean were unnecessary and interfered with biological N2 fixation.
Adeli et al. (2005) indicated that broiler litter application to soybean decreased subsequent
nodulation and N fixation.
Effects of Cover Crops on Soil Properties and Plant Growth
Potential benefits of cover crops include reduction of fertilizer use due to nutrient cycling
or fixation, increased soil organic matter and soil aeration (Lu et al. 2000), reduced subsoil
compaction (Williams and Weil, 2004), decreased pest pressure to subsequent crops (Fisk et al.,
2001), reduced erosion and nutrient leaching, increased microbial activity, improved soil
structure (Ercoli et al., 2007), and weed suppression (Hill et al., 2007). Adding a cover crop(s)
into an agricultural system may improve farm profitability by reducing the need for fertilizer and
pesticides (Weil and Kremen, 2007).

7
Hairy Vetch
Hairy vetch has been referred to as the superior winter annual legume in the central and
southern U.S. (Smith et al., 1987), due in part to its ability to consistently accumulate 100 – 200
kg N ha-1 year-1 (Cline and Silvernail, 2002; Seo et al., 2006; Acosta et al., 2011). Fixing and
supplying N for a subsequent crop provides an economic benefit to growers if the amount of N
fertilizer can be reduced or eliminated. Cline and Silvernail (2002) reported hairy vetch supplied
an inorganic N fertilizer equivalent of 82 kg ha-1 to a subsequent corn crop. Acosta et al. (2011)
found that the biological N fixation of hairy vetch was on average 72.4%, which represented an
annual input of 130 kg ha-1 of atmospheric N. Nitrogen was released from hairy vetch relatively
quickly, with approximately 90% of total N released within four weeks after cover crop
termination. The recovery of labeled 15N from hairy vetch by maize was low compared to total N
uptake, with an average of only 12.3% at harvest. Multiple studies with labeled 15N in hairy
vetch have shown that soil, not direct crop uptake, is the main destination of legume-derived N
(Scivittaro et al., 2003; Seo et al., 2006).
Hairy vetch typically overwinters in Michigan. Terminating hairy vetch in a timely
matter prior to planting is necessary to avoid soil nutrient depletion or excessive green manure,
which may interfere with crop seed germination. Cline and Silvernail (2001) observed
significantly greater hairy vetch biomass production and significantly less shoot N concentration
compared to hairy vetch terminated eight days earlier. Additional biomass production and lower
shoot N concentration leads to a greater tissue C:N ratio, and can decrease or eliminate the
amount of N supplied to the subsequent crop. However, spring termination of hairy vetch is a

8
negative factor under wet springtime conditions that make entering a field with equipment
difficult or undesirable.
Hairy vetch exhibited allelopathic effects on weeds in field (Teasdale, 1996) and
laboratory extract (Hill et al., 2007) studies. The release of allelopathic chemicals by hairy vetch
could be beneficial if weed suppression at soybean germination is enough to reduce competition
for resources. Reduction of germination or radicle elongation appears to be highly species
dependent, with some weed species being unaffected and others experiencing over 50%
reduction (Hill et al., 2006). The degree of allelopathic interference towards weeds is dependent
on, and thus varies with, the amount of hairy vetch biomass established and incorporated into the
soil.
The potential allelopathic effects of cover crops on the subsequent cash crop should also
be considered. Hairy vetch extracts have an allelopathic effect on soybean and corn seed
germination, seedling length, and seedling weight (Ill-Min and Joung-Kuk, 1994). Twenty-
percent weight/volume extracts of hairy vetch decreased soybean seed germination, seedling
length, and weight by 15%, 42%, and 25%, respectively, when compared to a control. A residue
rate of 1% resulted in a decrease in soybean plant height and leaf area by 10% and a 23%,
respectively, compared to control. Research is needed to test the effect of hairy vetch on soybean
in-situ because results may differ between laboratory and field studies due to factors such as soil
microbiology, weather, and soil chemical properties. Variable effects on weed species and
difficulty controlling the dose and timing of residue release indicate that hairy vetch alone may
not be suitable to provide adequate weed control for soybean production without potentially
interfering with soybean growth as well.
9
Oilseed Radish
Oilseed radish (Raphanus sativus L.) is a cover crop that is new to many areas of the U.S.
and has been gaining popularity worldwide in the last decade (Lawley et al., 2011). There are
many names and varieties of radish cover crops being sold in the species Raphanus sativus L.
The term “oilseed radish” generally refers to sativus L. var. oleoferus, and the term “forage
radish” generally refers to sativus L. var. longipinnatus or sativus L. cv. Daikon in the literature.
These common names are sometimes used interchangeably, while the terms fodder radish,
daikon radish, radish ripper, and Japanese radish are also alternate common names for various
radish cover crops. Raphanus sativus var. oleifer Metzg Stokes, sativus L. ssp. Oleiferus, and
sativus L. var. oleiformis Pers. are all alternate scientific names sometimes used for radish.
Tillage radish™ (Cover Crop Solutions LLC, Lititz, Pennsylvania), Groundhog™ (Ampac Seed
Company, Tangent, Oregon), and NitroRadish™ (GS3 Quality Seed Inc., Monmouth, Oregon),
are examples of radish brands, which make claims about gene line purity and features such as
increased root growth or hardpan alleviation that are brand exclusive. European varieties of
oilseed radish include ‘Adagio’ and ‘Colonel’. Radishes that are not one of the commercial
brands tend to be referred to as forage radish. Research shows that growth and biomass
production tend to be similar across varieties and brands (Ngouajio and Mutch, 2004; Dean and
Weil, 2009; White and Weil, 2011). Research cited in this review will not differentiate between
alternate names used within the same species.
Potential benefits and risks of a radish cover crop can vary greatly by location and
growing conditions. One of the agronomic limitations of radish as a cover crop is that it requires
relatively early planting in northern U.S. climates to establish the biomass necessary to
10
potentially alleviate hardpans in the soil (Dean and Weil, 2009). An oilseed radish cover crop
produced as much as 8168 kg ha-1 of above and belowground biomass in a single Mid-Atlantic
growing season (Dean and Weil, 2009). The biomass produced is dependent on location and
growing conditions, most notably number of growing degree days and N availability (Krall et al.,
2000). Biomass production is important because larger plants can potentially release more
nutrients to a subsequent cash crop.
In addition to amount of nutrient uptake, timing of nutrient release from a cover crop to
the subsequent crop is important since crop nutrient uptake is not uniform throughout a growing
season (Bender et al., 2013). Studies show oilseed radish is effective at reducing potentially
leachable nitrate in the fall (Rogasik and Obenhaul, 1992; Stivers-Young, 1998), and measured
nitrate levels have been greater when sampled in the spring following oilseed radish (Dean and
Weil, 2009). However, oilseed radish decomposition occurs relatively quickly, with as much
39% decomposition after just 15 days of frost melt (Viola et al., 2013). Dean and Weil (2009)
discovered that the potential for nitrate leaching and loss to runoff following oilseed radish may
be greater in the spring during snowmelt and rainy periods than rye and rapeseed cover crops,
especially in course textured, well-drained soils. Greater rainfall may also increase the potential
amount of leached nitrate to levels deep enough that even an early-planted crop may not root fast
enough to reach. Although oilseed radish may result in increased nitrate release compared to
other cover crops, multiple studies indicated that oilseed radish reduced N losses early in the
spring compared to control plots (Isse et al., 1999; Vyn et al., 2000). Because N release from
oilseed radish often occurs prior to subsequent crop sowing, literature suggests that an oilseed
radish N credit to succeeding crops will likely not be observed in climates where oilseed radish
winter kills.

11
Wang et al. (2008) and O’Reilly et al. (2012) found oilseed radish to accumulate over
300 kg N ha-1 at maturity in Ontario and Michigan, respectively. Despite relatively large N
uptake compared to other cover crops, no increase in plant available N in the following crop
season was observed by Wang et al. (2008) or O’Reilly et al. (2012). Results from Isse et al.
(1999) and Vyn et al. (2000) concurred that an oilseed radish cover crop did not increase N
uptake in the following crop. Conversely, Thorup-Krsitensen (1994) found that oilseed radish
could effectively cycle N and improve the N balance of a system by at least 67 kg N ha-1 year-1
when preceding barley. Schomberg et al. (2006) also found oilseed radish to result in an N credit
similar to that of crimson clover, however this occurred in Georgia, U.S., where the oilseed
radish did not winter kill due to a warmer climate and was terminated three weeks prior to cash
crop sowing.
Viola et al. (2013) reported P and K accumulation in oilseed radish up to 15 and 277 kg
ha-1, respectively, and observed K release from oilseed radish dry matter beginning less than one
week after winter-kill. Rapid K release is not as concerning as rapid N release because K is less
mobile in the soil and is not considered as environmentally harmful if leaching or runoff occur.
Wang et al. (2008) observed uptake rates of 310.7, 42.7, 446.6, 23.8, 209.2, 48.2, 34.7, 3.3, 0.12,
0.25, 0.07, and 0.26 kg ha-1 for N, P, K, Mg, calcium, sulfur, sodium, iron, manganese, boron,
copper, and Zn, respectively at maturity in above and belowground-biomass averaged across two
years. Despite substantial biomass nutrient accumulation, only soil test P increased significantly
following oilseed radish compared to the control. Increased soil P levels from 0 – 2.5-cm soil
depth were observed by White and Weil (2011) after three successional years of forage oilseed
radish cover crop. Phosphorus levels surrounding the holes left by oilseed radish in the soil
surface also had significantly greater P test levels. Increases in P near the root holes were thought

12
to be due to biological, chemical, and physical interactions among plants, the soil, and the
environment. Holes left in the soil by oilseed radish may also increase water infiltration in the
spring and reduce runoff. Miller et al. (1994) determined that oilseed radish had a greater
likelihood of losing nitrate and P to runoff in the winter than ryegrass and red clover cover crops
due to its high biomass production, relatively high P concentration, and winter decomposition.
Phosphorus in runoff is detrimental to lakes and streams due to increased eutrophication (Boesch
et al., 2001), so oilseed radish cover crops in areas where erosion into rivers or bodies of water is
more likely is ill-advised.
An oilseed radish cover crop is better suited than most other cover crops to naturally
reduce soil compaction. Chen and Weil (2009) found that oilseed radish root biomass increased
with soil strength and was more effective at alleviating compaction in no-till farming systems
than a rapeseed or rye cover crop. Williams and Weil (2004) observed soybean roots utilizing
holes through a compaction layer made by brassica cover crops in order to reach water at lower
depths than those roots without a preceding brassica cover crop. Reduced compaction may lead
to enhanced root profiles that can increase access to water and nutrients.
Weed suppression by oilseed radish may increase a grower’s bottom line, as shown by
the profit margin increase reported by O’Reilly et al. (2011, 2012). Decreased weed density in
the fall following oilseed radish was perceived to lead to greater sweetcorn yields. Stivers-Young
(1998) achieved 100% weed suppression with an oilseed radish cover crop into late March and
early April when the cover crop was planted by 3 September the year prior. Lawley et al. (2011)
also observed complete control of weeds into early spring, and determined that oilseed radish
could effectively replace a pre-plant burndown herbicide. Wang et al. (2008) found a decreased

13
weed population density in onions as late as July of the following year following oilseed radish,
and also noted a change in weed species composition following oilseed radish. Allelopathic
effects on weeds have been shown in wild radish (Raphanus raphanistrum), but there is a lack of
information in the literature on allelochemicals produced by sativus L. (Norsworthy, 2003; Malik
et al., 2008). Oilseed radish weed control may be due to canopy shading, allelopathy, or a
combination of both. A study by White and Weil (2009) concluded that an oilseed radish cover
crop did not have negative allelopathic effects on mycorrhizal fungi colonization of maize roots
at the V4 stage. Gruver et al. (2010) concluded that no negative allelopathic effects were
exhibited on nematodes, and measured an increase in bacterivore nematodes following oilseed
radish.
Held et al. (2000) reported a sugarbeet-cyst-nematode trapping variety of oilseed radish
cover crop to increase the net return as a percent of land value for a subsequent barley crop from
3.9% to 5.9%, or up to 9.3% if sheep were allowed to graze on the leafy greens of the oilseed
radish. Wang et al. (2008) found that oilseed radish prior to onion production in Michigan
increased onion stand count by 14.6%, which resulted in a 5 t ha-1 marketable yield increase.
Other studies in the literature did not show a yield increase, but none showed a yield decrease
after an oilseed radish cover crop (Isse et al., 1999; Vyn et al., 2000; Lawley et al., 2011).
Effect of Soybean, Cover Crop, and Fertilizer on Soil Microorganisms
Microbial life occupies only a minor volume of soil and is often localized in densely
populated “hot spots” such as the rhizosphere (Nannipieri et al. 2003). The rhizosphere refers to
the soil volume surrounding the rhizoplane (i.e. root surface), first coined by Hiltner in 1904
(Brimecombe at al., 2001). Rhizosphere microbial communities perform fundamental processes

14
that contribute to nutrient cycling, healthy root growth, and the promotion of plant growth
(Buchenauer, 1998; Atkinson and Watson, 2000; Sylvia and Chellemi, 2001). The reason soil
microbial biomass is fundamental to maintaining soil functions is that microbes represent the
main source of soil enzymes that regulate transformative processes of elements in soils to plant
available nutrients (Böhme and Böhme 2006). Soil bacteria and fungi use organic and inorganic
substrates as energy sources, altering molecules to plant available forms of nutrients, and
therefore directly affect crop productivity and yield (Sun et al. 2004).
Microbial communities in the soil are dynamic, vast, and complex (Carelli et al., 2000).
Plant type, soil type, and soil management all contribute to soil microbial community structure,
and complex interactions are involved (Garbeva et al., 2004; Buyer et al., 2010). Soil amendment
and environmental factors that are most important to microbial community variation appear to be
site-specific- depending on the cropping system, the factors that are measured, and the amount of
variation in each factor found within each study. Mulch or cover crop were found to be more
important than soil temperature, pH, and texture in determining soil microbial community
composition in a study conducted by Buyer et al. (2010), indicating that management decisions
made by growers have a drastic effect on soil microorganisms. The literature suggests that the
soil microbial community composition is dynamic and responsive to yearly management
decisions, and therefore should not be treated as a “black box” in theory or process based models
(Kennedy and Smith, 1995).
There is convincing evidence that plants have a strong selective influence on microbial
populations in the rhizosphere (Marilley and Aragno, 1999; Marschner et al, 2002), resulting in
conditions most suitable for select niches of soil microbes. Root exudates supply energy for the

15
soil subsystem and can specifically influence microbial communities (Miethling et al., 2000),
and can differ based on plant species, cultivar, and plant growth stage (Rovira, 1965; Nelson,
1990; Whipps, 2001; Rengel, 2002). Soil properties, plant species and genotypes, and the growth
stage of the plant can also interactively influence the survival, growth, and activity of
microorganisms in the rhizosphere (Duineveld et al., 2001). Rhizodeposits released from
soybean roots are different from other plant species, and can even differ between cultivars (Jones
et al., 2004; Yanxai et al., 2009). Microorganisms in the rhizosphere have been observed
responding to rhizodeposits of soybean root, changing the community profile for subsequent
crops (Duineveld et al., 2001). Decreased pH in the rhizosphere of soybean has been documented
(Jin et al., 2007) and may be selective for microbes that prefer lower pH soils (Marschner at al.,
2004). Changes observed in soybean rhizosphere microbial communities between growth stages
of soybean may be explained by interactions between soybean roots, soil, and soil microbes
varying across time within a growing season due to environmental conditions (Peterson and Sim,
1999, Singh et al., 2007).
Cover crops can directly and indirectly affect soil microbial community structure.
Experiments using 15N labeled hairy vetch have shown that up to 55% of N in hairy vetch
biomass is found in the soil after decomposition (Seo et al., 2006). Increased biological activity
associated with the relatively low C:N ratio of hairy vetch tissue may account for accelerated N
release upon biomass decomposition (Varco et al., 1993). Buyer et al. (2010) reported hairy
vetch roots and shoots both increased microbial biomass in the soil when mowed and left on the
soil surface. Wang et al. (2007) observed an increase in microbial biomass when hairy vetch was
incorporated into the soil as well. Hairy vetch has been shown to increase arbuscular mycorrhizal
(AM) colonization of soybean roots, which was accredited with increasing soybean growth,

16
shoot P content, and yield compared with previous cropping of a non-AM host or fallow
(Norikuni et al., 2010). One study indicated that cover cropping with hairy vetch affected
microbial community composition more than soil temperature, moisture, pH, and texture (Buyer
et al., 2010). Although studies concerning the effect of hairy vetch on soil microorganisms are
present in the literature, more information regarding the effect of oilseed radish on soil biological
communities is needed to evaluate the potential effects of repeated oilseed radish plantings, as
well as potential negative effects on soil microbes that form symbiotic relationships with other
crops in a given rotation. With more data regarding cover crop effects on the microbial
community and the mechanisms stimulating these changes, researchers could develop cover crop
systems that maximize desirable outcomes on the subsequent crop (Gruver et al., 2010).
Applications of organic based fertilizer (e.g. manure) can cause changes in the physical,
chemical, and biological properties of soils (Zhong et al., 2010). Applying organic-based
fertilizer (e.g. manure) has been shown to increase soil microbial activity (Brady and Weil, 1999;
Liu and Ristaino 2003), microbial diversity (Girvan et al. 2004; Grayston et al. 2004), and
bacterial densities (van Bruggen and Semenov 2000). Tewolde et al. (2009) suggested that
application of chicken litter may increase the number of successive years the same crop can be
grown on the same soil without a yield decline by stimulating soil microorganisms to simulate
the effects of crop rotation. Organic amendments may provide a rich medium supporting greater
microbial activity (Chen et al. 1988) and may also contain a diverse microbial population
(McKinley and Vestal 1984), which could directly supplement existing microbial communities.
Bibhuti and Dkhar (2012) reported that plots treated with organic substrates showed an increase
in fungal and bacterial population compared to the control plot in two study years. Gelsomino et
al. (2004) compared organic and conventional agricultural systems by examining their effects on

17
soil microbial biomass, microbial activity, and substrate utilization and documented an increased
microbial biomass in the plots with organic amendments. Addition of manure leads to an
increase in secondary and micronutrients in the soil, which may help to increase the microbial
population (Krishnakumar et al. 2005). Soil microorganisms play an important role in degrading
the complex organic compounds such as cellulose, lignin, and protein that can be found in
poultry manure applications, which may lead to increased microbial activity.

18
REFERENCES

19
REFERENCES
Abendroth, L. and Elmore, R. 2006. Soybean inoculation: Applying the facts to your field.
NebGuide G1622. Univ. of Nebraska, Lincoln.
Adeli, A., Sistani, K.R., Rowe, D.E., and Tewolde. H. 2005. Effects of broiler litter on soybean
production and soil N and phosphorus concentrations. Agron. J. 97:314–321.
doi:10.2134/agronj2005.0314
Albrecht, S.L., Bennett, J.M., and Boote. K.J. 1984. Relationship of nitrogenase activity to plant
water stress in field grown soybeans. Field Crops Res. 8:61-71.
Almeida Acosta, José Alan de, Amado, T.J.C., Neergaard, A.d., Vinther, M., Silva, L.S.d., and
Silveira Nicoloso, R.d. 2011. Effect of 15N-Labeled Hairy Vetch and N Fertilization n Maize
Nutrition and Yield Under No-Tillage. R. Bras. Ci. Solo, 35:1337-1345.
Anthony, P., Malzer, G., Sparrow, S., and Zhang, M. 2012. Soybean Yield and Quality in
Relation to Soil Properties. Agron. J. 104:1443-1458.
Ash, M., Livesey, J., and Dohlman. E. 2006. Soybean backgrounder. Electronic Outlook Rep.
OCS-2006-0. Available at
www.ers.usda.gov/publications/OCS/apr06/OCS200601/OCS200601.pdf (verified 2 Aug.
2008). USDA, Economic Research Service, Washington, DC.
Atkinson, D. and Watson, C.A. 2000. The beneficial rhizosphere: a dynamic entity. Applied Soil
Ecology 15:99–104.
Aulakh, M.S., Doran, J.W., Walters, D.T., Mosier, A.R., and Francis, D.D. 1991 Crop residue
type and placement effects on denitrification and mineralization. Soil Sci. Soc. Am. J.
55:1020-1025.
Bacanamwo, M. and Purcell, L. 1999. Soybean dry matter and N accumulation responses to
flooding stress, N sources and hypoxia. J. Exp. Bot. 50:689-696.
Balatti, P.A. and Pueppke, S.G. 1992. Identification of North American soybean lines that form
N-fixing nodules with Rhizobium-fredii USDA257. Can. J. Plant Sci. 72:49-55.
Beuerlein, J. 2005. 2005 Ohio inoculation study. Available at
agcrops.osu.edu/soybean/documents/2005SoyInoculationRe port.pdf (verified 2 Aug. 2008).
Agronomic Crops Network, Ohio State Univ., Columbus.
Boesch, D.F., Brinsfield, R.B., and Magnien, R.E. 2001. Chesapeake Bay eutrophication:
Scientific understanding, ecosystem restoration, and challenges for agriculture. J. Environ.
Qual. 30:303–320.

20
Böhme, L. and Böhme, F. 2006. Soil microbiological and biochemical properties affected by
plant growth and different long-term fertilization. European J. of Soil Biology 42:1–12.
Brady, N. C. and Weil, R. R. 1999. Soil organic matter. In The nature and properties of soils,
446–490. Upper Saddle River, N.J.: Prentice Hall.
Bender RR, Haegele JW, Ruffo ML, Below FE. 2013. Nutrient uptake, partitioning, and
remobilization in modern, transgenic insect-protected maize hybrids. Agron. J. 105:161–170.
Brimecombe, M. J., De Lelj, F. A., and Lynch, J. M. 2001. The rhizosphere: The effect of root
exudates on rhizosphere microbial populations. In The rhizosphere: Biochemistry and organic
substances at the soil plant interface, ed. R. Pinton, Z. Varanini, and P. Nannipieri, 95–140.
New York: Marcel Dekker.
Brumm, T.J. and Hurburgh, C.R. 2006. Changes in long-term soybean compositional patterns. J.
Am. Oil Chem. Soc. 83:981–983. doi:10.1007/s11746-006-5056-4
Buchenauer, H. 1998. Biological control of soil-borne diseases by rhizobacteria. J. of Plant
Diseases and Protection 105:329–348.
Buyer, J.S., Teasdale, J.R., Roberts, D.P., Zasada, I.A., and Maul, J.E. 2010. Factors affecting
soil microbial community structure in tomato cropping systems. Soil Biol. Biochem. 42:831–
841.
Carelli, M., Gnocchi, S., Fancelli, S., Mengoni, A., Paffetti, D., Scotti, C., and Bazzicalupo, M. 2000. Genetic diversity and dynamics of Sinorhizobium meliloti populations nodulating
different alfalfa cultivars in Italian soils. Appl. Environ. Microbiol. 66:4785–4789.
Changere, A. and Lal, R.1997. Slope position and erosional effects on soil properties and corn
production on a Miamian soil in Central Ohio. J. Sustain. Agric. 11:5–21.
doi:10.1300/J064v11n01_03
Chen W., Wang E., Wang S., Li Y., Chen X., and Li, Y. 1995. Characteristics of Rhizobium
tianshanense sp. nov., a moderately and slow growing root nodule bacterium isolated from an
arid saline environment in Xinjiang, People’s Republic of China, Int. J. Syst. Bacteriol.
38:392–397.
Chen, G. and Weil, R.R. 2009. Penetration of cover crop roots through compacted soils. Plant
Soil 331:31-43.
Chen, W., Hoitink, H.A.J., Schmitthenner, A.F., and Tuovinen, O.H. 1988. The role of microbial
activity on the suppression of damping-off caused by Pythium ultimum. Phytopathology
78:314–322.
Chen, W.X., Yan, G.H., and Li, J.L. (1988) Numerical taxonomic study of fast-growing soybean
rhizobia and a proposal that Rhizobium fredii be assigned to Sinorhizobium gen. nov. Int. J.
Syst. Bacteriol. 38:392–397

21
Cline, G.R. and Silvernail, A.F. 2002. Effect of cover crops, N, and tillage on sweet corn. Hort-
Technology. 12:118-125.
Conley, S. and Christmas, E. 2006. Utilizing inoculants in a corn-soybean rotation. Purdue Ext.
Bull. SPS-100-W. Purdue Univ., West Lafayette.
Dahama, A.K. and Sinha, M.N. 1985. Residual and cumulative effects of kharif legumes and P
applied to them on succeeding wheat. Indian J. Agron. 30:422-428.
Dean, J.E. and Weil, R. 2009. Brassica cover-crops for N retention in the Mid-Atlantic Coastal
Plain. J. of Environmental Quality, 38:520–528.
Donald, P.A., Allen, P.B., Tyler, D.D., Sistani, K.R., Tewolde, H., and Walker, E.R. 2013. Effect
of Broiler Litter Application to Soybean Crop Infested With Soybean Cyst Nematode.
Nematropica. 43(1):24-34.
Duineveld, B.M., Kowalchuk, G.A., Keijzer, A., van Elsas, J.D., and van Veen, J.A. 2001.
Analysis of bacterial communities in the rhizosphere of chrysanthemum via denaturing
gradient gel electrophoresis of PCR-amplified 16S rRNA as well as DNA fragments coding
for 16S rRNA. Appl. Environ. Microbiol. 67:172–178.
Duong, T.P., Diep, C.N., Khiem, N.T., Hiep, N.H., Toi, N.V., Lich, N.V., and Nhan, T.K.L.
1984. Rhizobium inoculant for soybean [Glycine max (L.) Merrill] in Mekong Delta. Plant
Soil 79:235-240.
Ercoli, L., Masoni, A., Pampana, S., and Arduini, I. 2007. Allelopathic effects of rye, brown
mustard and hairy vetch on redroot pigweed, common lambsquarter and knotweed.
Allelopathy J. 19:249-256.
Fahnestock, P., Lal, R., and Hall, G.F. 1996. Land use and erosional effects on two Ohio soils: II.
Crop yields. J. Sustain. Agric. 7:85–100. doi:10.1300/J064v07n02_09
Finney, D.M. 2013. Cover Crop Cocktails Enhance N Management. Abstract from 2013
American Society of Agronomy Meeting Program.
Fisk, J.W., Hesterman, O.B., Shrestha, A., Kells, J.J., Harwood, R.R., Squire, J.M., and Sheaffer,
C.C. 2001. Weed suppression by annual legume cover crops in no-tillage corn. Agron. J.
93:319–325.
Garbeva, P., van Veen, J.A., and van Elsas, J.D. 2004. Microbial diversity in soil: Selection of
microbial populations by plant and soil type and implications for disease suppressiveness.
Ann. Rev. of Phyt. 42:243-270.
Gelsomino, C.C., Ambrosoli, A., Minati, R., and Ruggiero, P. 2004. Functional and molecular
responses of soil microbial communities under differing soil management practice. Soil
Biology and Biochemistry 36:1873–1883.

22
Gilfillen, R.A., Rowland, N.S., Willian, W.T., Slelugh, B.R., Tekeste, M.A., and Sistani, K.R.
2010. Effects of broiler litter application on nutrient accumulation in soil. Forage and
Grazinglands. doi: 10.1094/FG-2010-1105-01-RS.
Girvan, M.S., Bullimore, J., Ball, A.S., Pretty, J.N., and Osborn, A.M. 2004. Responses of active
bacterial and fungal communities in soil under winter wheat to different fertilizer and
pesticide regimens. Applied and Environmental Microbiology 70:2692–2701.
Graham, P.H. 1992. Stress tolerance in Rhizobium and Bradyrhizobium, and nodulation under
adverse soil conditions. Can. J. Microbiol. 38:475-484.
Grayston, S.J., Campbell, C.D., Bardgett, R.D., Mawdsley, J.L., Clegg, C.D., Ritz, K., Griffiths,
B.S., Rodwell, J.S., Edwards, S.J., Davies, W.J., Elston, D.J., and Millard, P. 2004. Assessing
shifts in microbial community structure across a range of grasslands of differing management
intensity using CLPP, PLFA, and community DNA techniques. Applied Soil Ecology 25:63–
84.
Gruver, L.S., Weil, R.R., Zasada, I.A., Sardanelli, S., and Momen, B. 2010. Brassicaceous and
rye cover crops altered free-living soil nematode community composition. Appl. Soil Ecol.
45:1-12.
Harper, J.E. 1974. Soil and symbiotic N requirements for optimum soybean production. Crop
Sci. 14:255–260. doi:10.2135/cropsci1974.0011183X001400020026x
Held, L.J., Jennings, J.W., Koch, D.W., and Gray, F.A. 2000. Economics of trap cropping for
sugarbeet nematode control. J. Sugar Beet Res. 37:45-55.
Hill, E.C., Ngouajio, M., and Nair, M.G. 2006. Differential response of weeds and vegetable
crops to aqueous extracts of hairy vetch and cowpea. HortScience 41:695-700.
Hill, E.C., Ngouajio, M., and Nair, M.G. 2007. Allelopathic potential of Hairy Vetch (Vicia
Villosa) and Cowpea (Vigna Unguiculata) methanol and ethyl acetate extracts on weeds and
vegetables. Weed Technology 21:437-444.
Hochmuth, G., Hochmuth, R., and Mylavarapu, R. 2007. Using composted poultry manure
(litter) in mulched vegetable production. University of Florida IFAS Extension SL 293.
http://edis.ifas.ufl.edu/pdffiles/SS/SS50600.pdf
Hurburgh, C.R., Brumm, T.J., Guinn, J.M., and Hartwig, R.A. 1990. Protein and oil patterns in
U.S. and world soybean markets. J. Am. Oil Chem. Soc. 67:966–973.
doi:10.1007/BF02541859
Ill-Min, C. and Joung-Kuk, A. 1994. Allelopathic Influence of alfalfa and vetch extracts and
residues on soybean and corn. Korean J. of Crop Science, 39(3):295-305.
Isse, A.A., Mackenzie, A.F., Stewart, K., Cloutier, D.C., and Smith, D.L. 1999. Cover crops and
nutrient retention for subsequent sweet corn production. Agron. J. 91:934–939.

23
Jin, J., Wang, G.H., Liu, X.B., Wang, G.D., and Herbert, S.J. 2007. Inspection of nutrients
uptake and distribution across rhizosphere at seedling stage of soybean by rhizobox method.
J. Graduate School Chinese Acad. Sci. (in Chinese). 24:193–200.
Jones G.D., Lutz J.A., Jr., and Smith, T.J. 1977. Effects of phosphorus and potassium on soybean
nodules and seed yield. Agron. J. 69:1003–1006
Jones, D.L., Hodge, A., and Kuzyakov, Y. 2004. Plant and mycorrhizal regulation of
rhizodeposition. New Phytol. 163:459–480.
Kaspar, T.C., Pulido, D.J., Fenton, T.E., Colvin, T.S., Karlen, D.L., Jaynes, D.B., and Meek,
D.W. 2004. Relationship of corn and soybean yield to soil and terrain properties. Agron. J.
96:700–709. doi:10.2134/agronj2004.0700
Krall, J.M., Koch, D.W., Gray, F.A., and Nachtman, J.J. 2000. Cultural management of trap
crops for control of sugarbeet nematode. J. of Sugar Beet Research 37:27-43.
Kravchenko, A.N. and Bullock, D.G. 2000. Correlation of corn and soybean grain yield with
topography and soil properties. Agron. J. 92:75–83.
Kravchenko, A.N. and Bullock, D.G. 2002. Spatial variability of soybean quality data as a
function of field topography. Crop Sci. 42:804–815. doi:10.2135/cropsci2002.0804
Krishnakumar, S., Saravanan, A., Natarajan, S.K., Veerabadram, V., and Mani, S. 2005. Microbial population and enzymatic activity as influenced by organic farming. Research J. of
Agricultural and Biological Sci. 1:85–88.
Kuykendall, L.D., Saxena, B., Devine, T.E., and Udell, S.E. 1992. Genetic diversity in
Bradyrhizobium japonicum Jordan 1982 and a proposal for Bradyrhizobium elkanii sp. Nov
Can. J. Microbiol. 38:501–505
Lawley, Y. E., Weil, R.R., and Teasdale J.R. 2011. Forage radish cover crop suppresses winter
annual weeds in fall and before corn planting. Agron. J. 103:137-144.
Lindemann, W.C. and Glover, C.R. 2003. N fixation by legumes. New Mexico State Univ. Coop.
Ext. Serv. Guide A-129. New Mexico State Univ., Las Cruces.
Liu, B. and Ristaino, J. B. 2003. Microbial community structure in soils from organic and
conventional agroecosystems. Phytopathology 96:53.
Lu, Y., Watkins, K., Teasdale, J. R., and Abdul-Baki, A. 2000. Cover crops in sustainable food
production. Food Rev. Int. 16:121–157.
Malik, M.S., Norsworthy, J.K., Culpepper, A.S., Riley, M.B., and Bridges Jr., W. 2008. Use of
wild radish (Raphanus raphanistrum) and rye cover crops for weed suppression in sweet corn.
Weed Sci. 56:588-595.

24
Marilley, L. and Aragno, M. 1999. Phylogenetic diversity of bacterial communities differing in
degree of proximity of Lolium perenne and Trifolium repens roots. Appl. Soil Ecol. 13:127–
136.
Marschner, P., Neumann, G., Kania, A., Weiskopf, L., and Liebere, R. 2002. Spatial and
temporal dynamics of the microbial community structure in the rhizosphere of cluster roots of
white lupin (Lupinus albus L.). Plant Soil 246:167–174.
Matsunaga, R., Matsumoto, S. 1984. Phosphorus and potassium response to wild and cultivated
soybeans. (in Japanese with English summary). Jpn J Crop Sci 53:138
McConkey, B.G., Ulrich, D.J., and Dyck, F.B. 1997. Slope position and subsoiling effects on soil
water and spring wheat yield. Can. J. Soil Sci. 77:83–90. doi:10.4141/S95-067
McKinley, V.L. and Vestal, J.R. 1984. Biokinetic analyses of adaptation and succession:
Microbial activity in composting municipal sewage sludge. Appl. Environ. Microbiology
47:933–941.
Miethling, R., Wieland, G., Backhaus, H., and Tebbe, C.C. 2000. Variation of microbial
rhizosphere communities in response to crop species, soil origin, and inoculation with
Sinorhizobium meliloti L33. Microbial Ecol. 41: 43–56.
Miller, M.H., Beauchamp, E.G., and Lauzon, J.D. 1994. Leaching of N and phosphorus from the
biomass of three cover crop species. J. Environ. Qual. 23:267–272.
Mothapo, N. V., Grossman, J. M., Sooksa-Nguan, T., Maul, J., Bräuer, S. L., and Shi, W. 2013.
Cropping history affects nodulation and symbiotic efficiency of distinct hairy vetch (Vicia
villosa Roth.) genotypes with resident soil rhizobia. Biol. Fert. Soils. 49:871-879.
Naeve, S.L. 2004. Where’d all our beans go? In: Proceedings of the 2004 Crop Pest Management
Short-Course. Univ. of Minnesota Ext. Serv., St. Paul.
www.extension.umn.edu/agprofessionals/cpm2004 proceedings.html
Nannipieri, P., Ascher, J., Ceccherini, M.T., Landi, L., Pietramellara, G., and Renella, G. 2003.
Microbial diversity and soil functions. European J. of Soil Science 54:655–670.
Nelson, E. B. 1990. Exudate molecules initiating fungal responses to seeds and roots. Plant Soil
129:61–73.
Ngouajio, M. and Mutch, D.R. 2004. Oilseed radish: a new cover crop for Michigan. Michigan
State Univ. Extension Bulletin E 2907, East Lansing.
Norikuni, O., Toshihiko, K., Keiki, O., and Masako, T. 2010. Maintenance of soybean yield with
reduced phosphorus application by previous cropping with mycorrhizal plants. Soil Sci. and
Plant Nutrition 56:824-830.
Norsworthy, J.K. 2003. Allelopathic potential of wild radish (Raphanus raphanistrum). Weed
Tech. 17:307-313.

25
O’Reilly, K.A., Robinson, D.E., Vyn, R.J. and Van Eerd, L.L. 2011. Weed populations, sweet
corn yield, and economics following fall cover crops. Weed Technol. 25:374-384.
O'Reilly, K.A., Lauzon, J.D., Vyn, R.J., & Van Eerd, L.L. 2012. Nitrogen cycling, profit margins
and sweet corn yield under fall cover crop systems. Can. J. Soil Sci. 92:353-365.
Pedersen, P. 2003. Soybean seed inoculation. Integrated Crop Manage. News (Iowa) IC-
490(5):12-13.
Rengel, Z. 2002. Genetic control of root exudation. Plant and Soil 245:59–70.
Rodríguez-Navarro, D. N., Oliver, I. M., Contreras, M. A., and Ruiz-Sainz, J. E. 2011. Soybean
interactions with soil microbes, agronomical and molecular aspects. Agron. Sustain. Dev.
31:173-190.
Rogasik, J., Smukalski, M., & Obenauf, S. 1992. Cover crops on sandland in Germany:
Husbandry and fate of N. Aspects Appl. Biol. 30:309-316.
Rovira, A. D. 1965. Plant root exudates and their influence upon soil microorganisms. In
Ecology of soil-borne pathogens, ed. K. F. Bacer and W. C. Snyder. Berkeley: University of
California Press.
Sato, T., Yoshimoto, S., Watanabe, S., Kaneta, Y., Sato, A. 2007. Effect of hairy vetch planting
on changes in soil physical properties and soybean early growth in a heavy clayey soil field.
Jpn. J. Soil Sci. Plant Nutr. 78:53–60.
Sawchik, J. and Mallarino, A.P. 2008. Variability of soil properties, early phosphorus and
potassium uptake, and incidence of pests and weeds in relation to soybean grain yield. Agron.
J. 100:1450–1462. doi:10.2134/agronj2007.0303
Schmidt, J.P., Lamb, J.A., Schmitt, M.A., Randall, G.W., Orf, J.H., and Gollany, H.T. 2001
Soybean varietal response to liquid swine manure application. Agron J 93:358–363.
Schomberg, H.H., Endale, D.M., Calegari, A., Peixoto, R., Miyazawa, M., and Cabrera, M.L.
2006. Influence of cover crops on potential N availability to succeeding crops in a Southern
Piedmont soil. Biol. Fert. Soils, 42:299–307.
Schulz, T. J. and Thelen, K. D. (2008) Soybean Seed Inoculant and Fungicidal Seed Treatment
Effects on Soybean. Crop Sci. 48.5:1975-1983.
Scivittaro, W.B., Muraoka, T., Boaretto, A.E., and Trivelin, P.C.O. 2003. Transformations of
nitrogen from velvet bean and urea used as fertilizers in corn crop. Pesq. Agropec. Bras.
38:1427-1433.
Seneviratne, G., Van Holm, L.H.J., and Ekanayake, E.M.H.G.S. 2000. Agronomic benefits of
rhizobial inoculant use over N fertilizer application in tropical soybean. Field Crops Res.
68:199-203.

26
Seo, J.H., Meisinger, J.J., and Lee, H.J. 2006. Recovery of Nitrogen-15-labeled hairy vetch and
fertilizer applied to corn. Agron. J., 98:245-254.
Singh, B.K., Munro, S., Potts, J.M. and Millard, P. 2007. Influence of grass species and soil type
on rhizosphere microbial community structure in grassland soils. Appl. Soil Ecol. 36:147–
155.
Slaton, N.A., Roberts, T.L., Golden, B.R., Ross, W.J., and Norman, R.J. 2013. Soybean
Response to Phosphorous and Potassium Supplied as Inorganic Fertilizer or Poultry Litter.
Agron. J. 105:812-820.
Smith, S.M., Frye, W.W., and Varco, J.J. 1987. Legume winter cover crops. Adv. Soil. Sci. 7:96-
139.
Stivers-Young, L. 1998. Growth, nitrogen accumulation, and weed suppression by fall cover
crops following early harvest of vegetables. Hort Sci. 33:60-63.
Streeter, J. G. 1985. Nitrate inhibition of legume nodule growth and activity. II. Short term
studies with high nitrate supply. Plant Physiology 77:325-328.
Sun, H.Y., Deng, S.P., and Raun, W.R. 2004. Bacterial community structure and diversity in a
century-old manure-treated agroecosystem. Appl. Environ. Microbiol. 70:5868–5874.
Sylvia, D.M. and Chellemi, D.O. 2001. Interactions among root-inhabiting fungi and their
implications for biological control of root pathogens. Advances in Agronomy 73:1–33.
Tagoe, S.O., Horiuschi, T., and Matsui, T. 2008. Effects of carbonized and dried chicken
manures on the growth, yield, and N content of soybean. Plant Soil 306:211–220.
doi:10.1007/s11104-008-9573-9
Takashi, S., Emiko, S., Fumiaki, T., Tadashi, Y., and Yoshihiro, K. 2011. Effects of hairy vetch
foliage application on nodulation and N fixation in soybean cultivated in three soil types. Soil
Sci. and Plant Nutrition. 57(2):313-319. DOI: 10.1080/00380768.2011.569375
Teasdale, J.R. 1996. Contribution of cover crops to weed management in sustainable agricultural
systems. J. Prod. Agric. 9:475–479.
Thorup-Kristensen, K. 1994. The effect of nitrogen catch crops species on the nitrogen nutrition
of succeeding crops. Fertil. Res. 37:227–234.
Tien, H.H., Hien, T.M., Son, M.T., and Herridge, D. 2002. Inoculation and N2 Fixation of
Soybean and Mungbean in the Eastern Region of South Vietnam. In: Inoculants and N at
Legumes in Vietnam, Herridge, D. (Ed.). Australian Centre for International Agricultural
Research, Australia, pp: 29-36.
Varco, J.J., Frye, W.W., Smith, M.S., and MacKown, C.T. 1993. Tillage effects of legume
decomposition and transformation of legume and fertilizer Nitrogen-15. Soil Sci. Soc. Am. J.
57:750-756.

27
Van Bruggen, A.H.C. and Semenov, A. M. 2000. In search of biological indicators for plant
health and disease suppression. Appl. Soil Ecol. 15:13–24.
Viola, Ricardo et. al. 2013. Green manure and N fertilization in the spring wheat under no-
tillage. Bragantia. 72:90-100.
Vitosh, M.L. 1997. Soybean inoculation in Michigan. Michigan State Univ. Ext. Facts Sheet
9708. Michigan State Univ., East Lansing.
Vos, J. and van der Putten, P.E.L. 2001. Field observations on N catch crops. III. Transfer of
nitrogen to the succeeding main crop. Plant and Soil 236:263-273.
Vyn, T.J., Faber, J.G., Janovicek, K.J., and Beauchamp, E.G. 2000. Cover crop effects on
nitrogen availability to corn following wheat. Agron. J. 92:915-924.
Walker, F. 2010. On-farm composting of poultry litter. P&SS Info #319.
http://utestension.tennessee.edu/publications/Document/Info%20319.pdf
Wang, G., Ngouajio, M., and Warncke, D.D. 2008. Nutrient cycling, weed suppression, and
onion yield following brassica and sorghum sudangrass cover crops. HortTechnology 18:68-
74.
Wang, Q.R., Li, Y.C., and Klassen, W. 2007. Changes of soil microbial biomass carbon and
nitrogen with cover crops and irrigation in a tomato field. J. of Plant Nutrition 30, 623-639.
Weil, R. and Kremen, A. 2007. Thinking across and beyond disciplines to make cover crops pay.
J. Sci. Food Agric. 87:551–557.
Welch, L.F., Boone, L.V., Chambliss, C.G., Christiansen, A.T., Mulvaney, D.L., Oldham, M.G.,
and Pendelton, J.W. 1973. Soybean yields with direct and residual N fertilization. Agron. J.
65:547–550. doi:10.2134/agronj1973.00021962006500040007x
Whipps, J. M. 2001. Microbial interaction and biocontrol in the rhizosphere. J. Exp. Bot.
52:487–511.
White, C.M. and Weil, R.R. 2009. Forage radish and cereal rye cover crop effects on
mycorrhizal fungus colonization of maize roots. Plant Soil. 328:507-521.
White, C.M. and Weil, R.R. 2011. Forage radish cover crops increase soil test phosphorus
surrounding radish taproot holes. Soil Sci. Soc. Am. J. 75:121–130.
Williams, S.M. and Weil, R.R. 2004. Crop cover root channels may alleviate soil compaction
effects on soybean crop. Soil Sci. Soc. Am. J. 68:1403–1409.
Xu, L.M., Ge, C., Cui, Z., Li, J., and Fan, H. 1995. Bradyrhizobium liaoningense sp. nov.,
isolated from the root nodules of soybeans. Int. J. Syst. Bacteriol. 45:706–711.
28
Xu, Y., Wang, G., Jin, J., Liu, J., Zhang, Q., and Liu, X. 2009. Bacterial communities in soybean
rhizosphere in response to soil type, soybean genotype, and their growth stage. Soil Biology
and Biochemistry. 41:919-925.

29
CHAPTER 2
INFLUENCE OF PLANT GROWTH REGULATORS AND NITROGEN RATE ON
SOFT WINTER WHEAT GROWTH AND YIELD
Using Plant Growth Regulators to Improve Small Grains Production
Plant lodging in small grains is caused by failure of roots to anchor the plant or bending
of the internodes near the culm base (Pinthus, 1973). Plant growth regulators (PGRs), designed
to decrease internode length and increase stem thickness to reduce plant lodging, have been
applied to cereal crops in the United States (U.S.) over five decades (Humbries et al., 1965).
Grain yield potential decreases >1% for each day wheat plants lodge prior to harvest (Stapper
and Fischer, 1990), due to the inhibition of water and nutrient transport from plant roots to the
grain head (Van Sanford et al., 1989). Lodging may further increase yield loss due to threshing
difficulties, resulting in unharvestable grain remaining on the soil surface (Knapp et al., 1987).
Lodging risk increases with increased plant height, decreased stem rigidity, high wind speeds
and frequency, and increased nitrogen (N) rate (Wiersma et al., 1986; Knapp et al., 1987; White,
1991). Although environmental conditions cannot be predicted, management practices such as
cultivar selection, sowing rate, and N application can be modified to affect lodging incidence
(White, 1991).
Factors including climate and soil properties also affect optimal N rates for wheat
production. Major et al. (1988) and Frederick and Camberato (1994) reported that wheat yield
remained constant or decreased when N was applied in excess of 143 lb. N/acre in North Dakota
or 60 lb. N/acre in South Carolina, respectively. Excessive spring N applications on wheat
reduced stem strength and resulted in 17% decreased root-anchorage strength leading to
increased likelihood of plant lodging (Crook and Ennos, 1995). Crop rotation also affects the

30
quantity of N fertilizer required to optimize yield. Wheat following soybean (Glycine max L.)
required 19 lb./acre less N than wheat following sorghum (Sorghum bicolor L.) to obtain similar
yield (Staggenborg et al., 2003). Despite lack of research support, some Michigan wheat
producers report yield gains with 25 – 50% more N than recommended by Michigan State
University. A trend of increasing N rates and using a PGR to combat lodging has now emerged.
Limited research on the combination of PGR and N rates is available, but Knott et al. (2016)
reported no difference in wheat height or peduncle diameter among recommended (100 lb
N/acre) and elevated (150 and 200 lbs N/acre) rates in Kentucky following PGR application.
Multiple researchers reported decreased height (Matysiak, 2006; Wiersma et al., 2011;
Knott et al., 2016) and decreased lodging (Nolte, 2007; Penckowski et al., 2009; Wiersma et al.,
2011; Knott et al., 2016) following PGR application to wheat. Decreased lodging was attributed
to increased stalk strength as well as decreased plant height (Matysiak, 2006). Increased stem
diameter was observed and may contribute to enhanced straw strength (Zagonel et al., 2002;
Knott at al., 2016). Data on other wheat physiological responses to PGR are limited. Knott et al.
(2016) reported increased spikelets head-1 following PGR application. Perennial ryegrass
(Lolium perenne), another cool-season grass species, had increased tillering with PGR
application (Ervin and Koski, 1998). Photosynthesis in turfgrass was unaffected by PGR
application (Stier et al., 1997; Qian et al., 1998). Little information regarding the effect of PGR
rate or application timing in wheat is available. Matysiak (2006) and Weirsma et al. (2011) found
that plant height and lodging decreased with increased PGR application rates. Applying PGR at
Feekes 8 resulted in less lodging compared to Feekes 5 (Weirsma et al. 2011).
Palisade® EC (Syngenta, Basel Switzerland) (trinexapac-ethyl) {ethyl 4-
[cyclopropyl(hydroxyl)methylene]-3,5-dioxocyclohexane-1-carboxylate} is a PGR labeled to

31
reduce wheat lodging incidence by decreasing plant height and thus susceptibility to wind
damage. This PGR has been used in Europe under the common name Moddus® (Syngenta,
Basel, Switzerland) for over 20 years and has been considered a fast degrading and easily-
detectable product in crop residue (Syhre et al., 1997). Palisade® EC functions similar to other
PGRs by inhibiting the formation of gibberellic acid, resulting in decreased stem elongation
(Rademacher, 2000). However, other PGRs labeled for use on wheat inhibit the production of
gibberellic acid earlier in the biosynthetic pathway and therefore may affect wheat growth and
yield differently than Palisade® EC (Rademacher, 2000; Hafner, 2001).
Michigan wheat yields ranked in the top-five nationally and first in the Midwest from
2012-2015, with a new state record of 81 bu/acre in 2015 (NASS, 2014, 2015). Nitrogen
application rates have increased along with yield. Increasing N rates, in combination with
elevated danger of high-wind from spring weather volatility during the April – June growth
period, increased both risk and incidence of wheat lodging. The objective of this study was to
investigate the individual and combined effects of N rate and PGR application on wheat growth,
grain yield, plant structure, and lodging incidence.
Materials and Methods
Locations and Site Descriptions
PGR rate and timing field studies were conducted on-farm in Deckerville, MI
(43°30'58.30"N, 82°46'47.00"W) during 2012 and 2013. The soil type was a Parkhill loam (fine-
loamy, mixed, semiactive, nonacid, mesic Mollic Epiaquepts). Soil samples were collected prior
to planting at a depth of 8 inches, dried, and ground to pass a 0.08-inch sieve. Soil characteristics
over both study years were 6.5 to 6.7 pH, 35 to 40 ppm P, and 140 to 165 ppm K. Fields were
32
previously cropped to dry edible bean (Phaseolus vulgaris L.) and tilled prior to planting using
either a field cultivator (John Deere, Moline, IL) or vertical tillage tool (Case IH, Racine, WI).
PGR and N rate field studies were conducted in 2014 and 2015 at the Michigan State
University South Campus Field Research Facility in Lansing, MI (42°41'21.18"N,
84°29'15.46"W) on a Capac loam (fine-loamy, mixed, active, mesic Aquic Glossudalfs). Soil
samples were collected prior to planting at a depth of 8 inches, dried, and ground to pass a 0.08-
inch sieve. Soil characteristics over both study years were 6.8 to 7.3 pH, 48 to 62 ppm P, and 103
to 127 ppm K. Fields were previously cropped to soybean and autumn disked and cultipacked
prior to planting.
Experimental Procedures for PGR Timing and Rate
Separate studies were done to examine PGR timing (Study 1) and rate (Study 2).
Individual plots were 18 x 75 ft. (7.5-in spacing), planted to 1.8 million seeds/acre, and arranged
in a randomized complete block design with four replications. Treatments in study 1 were two
PGR application timings (Feekes 7 and 8) at 12 oz./acre and an untreated check. Treatments in
study 2 were three PGR application rates (10, 12, and 14 oz./acre) applied at Feekes 7 and an
untreated check. Plots were planted 7 Oct 2012 and 2013 with a commercial grain drill to a depth
of 1.25 inches (John Deere, Moline, IL). The varieties planted were ‘Syngenta 1062’ (Basel,
Switzerland) in 2012 and ‘Ambassador’ (Michigan Agricultural Experiment Station, East
Lansing, MI) in 2013. Nitrogen was split-applied each study year using the recommended N rate
from Michigan State University for soft white wheat production of 160 lbs. N/acre. In 2012, N
application was split between 115 lbs. N/acre broadcast applied on 10 March using ammonium
nitrate (34N - 0P - 0K) and ammonium sulfate (21N - 0P - 0K) and 15 gal/acre urea ammonium
nitrate (UAN) (28N - 0P - 0K) applied 19 April using streamer bars. In 2013, 33 gal./acre UAN

33
was applied 28 April and 20 gal./acre additional UAN was applied 13 May. Palisade EC was
applied using a tractor mounted boom sprayer on 25 Apr and 8 May 2012, and 16 May and 25
May 2013, at Feekes 7 and 8, respectively. Fields were managed to minimize disease and weed
incidence each year.
Plant height was measured from 20 plants/plot at Feekes 10.5.4. Lodging ratings were
based on the percentage of each plot leaning 45 degrees or more prior to harvest. Environmental
data were recorded throughout the growing season at an MSU weather station five miles away
(http://www.agweather.geo.msu.edu/mawn/, Michigan State University, East Lansing, MI).
Grain yield was harvested from the center 15 x 70 ft. of individual plots using an International
2144 (Racine, Wisconsin) combine equipped with a Juniper HarvestMaster system that provided
grain yield, test weight, and moisture. Final grain yields were corrected to 13.5% moisture.
Experimental Procedures for PGR by N Rate
Individual 12-row plots were 8 x 25 ft. (7.5-inch row spacing) and arranged in a split-plot
randomized complete block design with four replications and an untreated check. Treatments
were three rates of N applied at green-up (75, 105, and 135 lb. N/acre) by two PGR application
rates at Feekes 6 (12 oz./acre and no application). Nitrogen application rates were chosen to
encompass a spectrum of deficient and non-limiting N conditions for most Michigan soft red
wheat environments. Nitrogen was broadcast-applied at Feekes 3 using urea (46N - 0P - 0K) on
11 April and 6 April 2014 and 2015, respectively. Plots were planted on 11 Oct. 2013 and 29
Sept. 2014 at a population of 1.8 million seeds/acre using ‘Red Dragon’ (Michigan Crop
Improvement Association, Okemos, MI). Plant growth regulator was applied with a backpack
sprayer 14 May 2014 and 6 May 2015. Affinity BroadSpec (7 May) and Harmony Extra (27
April) were applied in 2014 and 2015, respectively (DuPont, Wilmington, DE). Disease control

34
consisted of Quilt applied at Feekes 9 (29 May 2014 and 14 May 2015) and Prosaro applied at
Feekes 10.5.1 (6 June 2014 and 2 June 2015).
Three plant greenness measurements were collected from the uppermost leaves of each
plot every 10-14 days after green-up using a FieldScout® Chlorophyll Meter (Spectrum
Technologies, Inc., Aurora, IL). The number of grain heads per square foot were counted at
Feekes 10.5.1. Plant height and peduncle length (i.e., stem portion between the uppermost leaf
and bottom of the grain head) were averaged from measurements of five plants within each plot
at Feekes 10.5.4. After lodging occurred in any plot, ratings were taken on a per-plot basis using
the Belgian lodging scale (Szoke et al., 1979). Environmental data were recorded throughout the
growing season at an MSU weather station one mile away
(http://www.agweather.geo.msu.edu/mawn/, Michigan State University, East Lansing, MI).
Grain yield was harvested from the center 4 ft. of each plot using a small plot combine (Almaco,
Nevada, IA) on 21 July 2014 and 16 July 2015. Moisture and test weight for each plot were
obtained using a GAC 2100 (DICKEY-john, Auburn, IL). Final grain yields were corrected to
13.5% moisture.
Statistical Analysis
Data were subjected to analysis of variance using PROC GLIMMIX in SAS (SAS
Institute, 2012) to determine the significance of PGR timing and PGR rate in 2012 and 2013, and
N rate by PGR application in 2013 and 2014. Replication was considered a random factor in all
experiments and all other factors were considered fixed. When ANOVA generated a significant
F value (P ≤ 0.05), treatment means were separated using Fisher’s protected LSD. Data were
significantly different by year (P ≤ 0.05) and thus were analyzed separately.

35
Wheat Grain Yield Response to Plant Growth Regulator and Nitrogen
Grain yield was not significantly (P > 0.05) affected by PGR timing at Feekes 7 or
Feekes 8, but the earlier Feekes 7 application timing produced 2% – 6% greater yield than
untreated wheat indicating potential for greater productivity (Table 1). Plant growth regulator
application at Feekes 8 reduced yield compared to Feekes 7 likely due to application timing too
late in the stem elongation growth phase to positively affect grain yield. Previous studies
reported no significant difference in grain yield following PGR applications on hard red spring
wheat at Feekes 5 compared to Feekes 8 (Wiersma et al., 2011) or Feekes 6 compared to Feekes
7 (Penckowski et al., 2009). The Palisade® EC label recommends single applications between
Feekes 4 and Feekes 7, but our data appear to indicate that growers are more likely to see a
benefit on soft winter wheat if applied earlier in the suggested application window prior to
extensive stem elongation and node development (e.g., Feekes 6). Timing of PGR application
did not affect grain moisture or test weight (data not shown).
Table 2.1. Wheat grain yield as affected by Palisade EC application timing and rate, Deckerville,
MI, 2012 – 2013.
Yield
2012 2013
-----------bu/acre-----------
PGR timing
Untreated 93 a† 103 a
Feekes 7 99 a 105 a
Feekes 8 98 a 102 a
PGR rate (oz./acre)
No PGR 93 b 103 a
10 100 a 106 a
12 99 a 105 a
14 100 a 103 a
Significance (P>F)
PGR timing 0.10 0.19
PGR rate 0.05 0.43
† Values followed by the same letter within a column are not significantly different α=0.05.
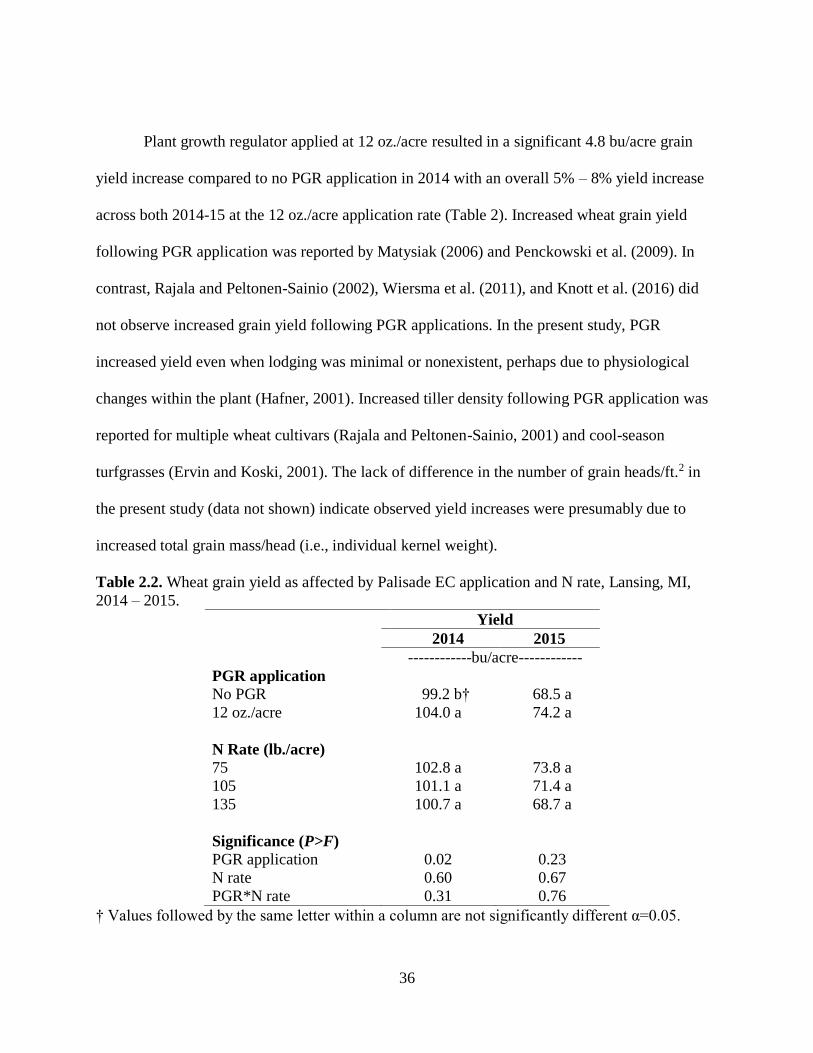
36
Plant growth regulator applied at 12 oz./acre resulted in a significant 4.8 bu/acre grain
yield increase compared to no PGR application in 2014 with an overall 5% – 8% yield increase
across both 2014-15 at the 12 oz./acre application rate (Table 2). Increased wheat grain yield
following PGR application was reported by Matysiak (2006) and Penckowski et al. (2009). In
contrast, Rajala and Peltonen-Sainio (2002), Wiersma et al. (2011), and Knott et al. (2016) did
not observe increased grain yield following PGR applications. In the present study, PGR
increased yield even when lodging was minimal or nonexistent, perhaps due to physiological
changes within the plant (Hafner, 2001). Increased tiller density following PGR application was
reported for multiple wheat cultivars (Rajala and Peltonen-Sainio, 2001) and cool-season
turfgrasses (Ervin and Koski, 2001). The lack of difference in the number of grain heads/ft.2 in
the present study (data not shown) indicate observed yield increases were presumably due to
increased total grain mass/head (i.e., individual kernel weight).
Table 2.2. Wheat grain yield as affected by Palisade EC application and N rate, Lansing, MI,
2014 – 2015.
Yield
2014 2015
------------bu/acre------------
PGR application
No PGR 99.2 b† 68.5 a
12 oz./acre 104.0 a 74.2 a
N Rate (lb./acre)
75 102.8 a 73.8 a
105 101.1 a 71.4 a
135 100.7 a 68.7 a
Significance (P>F)
PGR application 0.02 0.23
N rate 0.60 0.67
PGR*N rate 0.31 0.76
† Values followed by the same letter within a column are not significantly different α=0.05.

37
Michigan State University wheat N recommendations are based on the equation (YP x
1.33) -13 while the Tri-State Fertilizer recommendations utilize [(YP – 50) x 1.75] + 40 where
YP indicates yield potential (Vitosh et al., 1995; Warncke et al., 2009). As previously reported in
other states, producers are increasing N rates in excess of recommendations with inconsistent
yield responses (Knott et al., 2016). No interaction between PGR and N rate on grain yield
occurred in 2014 or 2015. No significant yield differences were observed with N rates > 75 lb.
N/acre in either study year (Table 2). Tripathi et al. (2002) also reported no increase in grain
yield for N rates equal to or above locally recommended N rates. Ervin and Koski (2001) found
no difference in cool-season turfgrass response to PGR across four rates of N. The lack of yield
response to greater rates of N was not surprising, as rapid N uptake in wheat (i.e., Feekes 5
growth stage) occurs in March – April, and precipitation totals were 61% and 70% below 30-yr
averages for 2014 and 2015, respectively (data not shown). In addition to reduced N uptake from
lack of water, dry spring soil conditions also tend to limit downward N movement and N losses
(Balkcom et al., 2003). Reduced yield in 2015 compared to 2014 was likely due to a combination
of 57% more precipitation, fewer growing degree days, and below average air temperatures in
June 2015 which hampered crop maturation and harvest. These results applying a PGR because
of greater rates of N application may not be justified, and other factors (e.g., cultivar, lodging
susceptibility) may impart greater significance in the grower decision making process.
Plant Growth Regulator Effects on Greenness, Height, and Lodging
Plant greenness significantly increased by 9% – 18% in wheat treated with PGR from
Feekes 10.5.1 to Feekes 11.2 in 2014 and by 7% at Feekes 10.5.4 in 2015 (Table 3). These
results agree with Steinke et al. (2003) who observed increased greenness and a > 13% increase
in chlorophyll content across three cool-season turfgrass species following PGR application. The

38
increased wheat greenness following PGR application in this study was likely due to reduced cell
elongation concentrating plant chlorophyll in lieu of increased chlorophyll production per cell
(Nangle et al., 2012). Retention of greenness in the flag leaf is especially important because it
intercepts more light than lower leaves (Gooding et al., 2000) and contributes 30 – 50% of the
photosynthetic energy required during grain fill (Sylvester-Bradly et al., 1990).

39
Table 2.3. Main effects and interactions for wheat greenness, lodging, plant height, peduncle length, heads/ft.2, grain moisture, test
weight, and yield across three nitrogen rates, Lansing, MI, 2014-15.
P Value
Effect
Feekes 8
greenness
Feekes 10.5.4
greenness
Lodging
Plant
height
Peduncle
length
Heads/
ft.2 Moisture
Test
weight Yield
--------------------------------------------------------2014------------------------------------------------------------------
Plant growth
regulator (PGR) 0.47 0.03 0.04 < 0.01 0.01 0.48 0.52 0.16 0.02
Nitrogen (N) rate 0.74 0.62 0.96 0.20 0.83 0.60 0.24 0.07 0.60
PGR x N rate 0.83 0.73 0.44 0.34 0.43 0.22 0.52 0.42 0.31
--------------------------------------------------------2015------------------------------------------------------------------
Plant growth
regulator (PGR) 0.99 0.01 N/A† < 0.01 < 0.01 0.06 0.86 0.74 0.23
Nitrogen (N) rate 0.48 0.24 N/A 0.66 0.11 0.15 0.03 0.62 0.67
PGR x N rate 0.88 0.25 N/A 0.34 0.79 0.18 0.66 0.50 0.76
† N/A, not applicable as lodging did not occur.

40
At the 12 oz./acre rate, wheat receiving PGR was 2.8 inches shorter on average across all
four study years (Table 4). Plant height was 0.6 – 1.6 and 3.1 – 4.1 inches shorter following 14
oz. PGR/acre compared to 12 oz./acre and untreated plots, respectively (Table 5). In 2013, only
rates >12 oz. PGR/acre resulted in significantly shorter plants than untreated wheat. Plant height
reductions ranging from 12% – 27% have been reported in previous studies following PGR
application (Łęgowiak and Wysmułek, 2000; Rajala and Peltonen-Sainio, 2001; Matysiak,
2006). The peduncle (i.e., last elongated internode that supports the grain head) accounted for the
majority of stem length reduction in this study. Peduncle length was significantly decreased by
0.5 inches and 1.2 inches in 2014 and 2015, respectively, indicating that >50% of the plant
height reduction occurred beneath the flag leaf.
Table 2.4. Effects of PGR applied at 12 oz./acre on Feekes 10.5.4 wheat height and peduncle
length, Deckerville and Lansing, MI, 2012-2015.
Plant height Peduncle length
PGR application 2012 2013 2014 2015 2014 2015
-------------------------------------inches-------------------------------------
No PGR 35.4 a† 35.5 a 34.6 a 33.1 a 7.9 a 7.1 a
12 oz./acre 32.9 b 33.0 b 32.6 b 28.9 b 7.5 b 5.8 b
P>F < 0.01 0.02 < 0.01 < 0.01 0.01 < 0.01
† Values followed by the same letter within a column are not significantly different α=0.05.
Table 2.5. Influence of PGR rate on Feekes 10.5.4 wheat height and lodging incidence,
Deckerville, MI, 2012-2013.
Plant height Lodging
PGR rate
(oz./acre)
2012 2013 2012† 2013
--------inches-------- ---- % of plot ----
No PGR 35.4 a‡ 35.5 a 11 a 48 a
10 33.1 b 33.9 ab 7 ab 16 b
12 32.9 b 33.0 b 3 b 8 b
14 31.3 c 32.4 b 1 b 0 b
P>F < 0.01 0.02 0.03 0.04
† Lodging was accessed as percent of plot leaning 45° or more ‡ Values followed by the same letter within a column are not significantly different α=0.05.

41
In all study years, plant lodging was significantly lower at Feekes 10.5.4 using the 12
oz./acre application rate except for 2015 when no lodging occurred (Table 6). Feekes 7 or 8
application timings at the 12 oz./acre rate did not impact lodging incidence (data not shown), but
lodging severity increased with later PGR application timings (P = 0.09 in 2013 and 0.10 in
2014). Weirsma et al. (2011) determined that PGR reduced lodging incidence when applied at
Feekes 5 compared to Feekes 8. Decreased plant height and reductions in lodging are often
related and attributed to increased stem strength and diameter (Hafner, 2001; Matysiak, 2006;
Weirsma et al., 2011). To take full advantage of lodging protection, growers may be advised to
apply PGR earlier in the growing season (i.e., Feekes 5 – 6). Reductions in plant height and
decreased lodging severity indicate that growers may want to place greater emphasis on these
two factors rather than N rate individually when deciding whether to input a PGR into their
management regime. Mean plant height and lodging incidence are annually rated in variety trials
(e.g. Michigan State University Wheat Variety Trials) (Olson, 2015), and cultivars displaying an
increased tendency for one or both of these characteristics may be more probable to result in a
positive yield response to PGR applications.
Table 2.6. Severity of wheat plant lodging when present, Deckerville and Lansing, MI, 2012-
2014.
Wheat lodging†
PGR application 2012† 2013 2014
12 oz./acre 3 b‡ 8 b 1 b
No PGR 11 a 48 a 2 a
P>F 0.03 0.04 0.04
† Lodging accessed as percent of plot leaning 45° or more in 2012 – 2013 and by the Belgian
Lodging Scale in 2014 ‡ Values followed by the same letter within a column are not significantly different α=0.05.

42
Conclusions
Grain yield was significantly increased by 4.8 and 6.0 bu/acre in 2012 and 2014
following PGR application at 12 oz./acre. Rate (10, 12, or 14 oz./acre) and timing (Feekes 7 or 8)
of PGR application did not affect grain yield, and PGR was not influenced by overall N
application rate. Averaged across all PGR application rates and timings, grain yields increased
5% across the four study years compared to no PGR application. A 12 oz./acre application would
have yielded an economic gain in three of four study years. However, profit margins would
decrease if a PGR was applied alone instead of tank-mixed with a fungicide or nutrient
application.
Plant growth regulator applied at 12 oz./acre decreased lodging 67% – 83% compared to
untreated plots in all three years that lodging occurred. Applying 12 oz./acre decreased plant
height by 2.8 in. compared to the control plots across all four study years. Rates in excess of 12
oz./acre decreased plant height an additional 1.6 – 1.8 inches but offered no yield benefit.
Although plant height is genetically determined and environmentally influenced, taller wheat
cultivars are more likely to benefit from PGR application. Due to PGRs targeting stem
elongation and lodging resistance, application should occur early in the stem elongation growth
phase (i.e., Feekes 5 – 6) to fully maximize this benefit, though some lodging resistance was
observed at later application timings. Additional wheat research is needed utilizing cultivars that
vary in height and susceptibility to plant lodging under a variety of environmental conditions.

43
REFERENCES

44
REFERENCES
Balkcom, K.S., A.M. Blackmer, D.J. Hansen, T.F. Morris. and A.P. Mallarino, 2003. Testing
soils and cornstalks to evaluate nitrogen management on the watershed scale. J. of
Environ. Quality, 32(3):1015-1024.
Crook, M.J., and A.R. Ennos. 1995. The effect of nitrogen and growth regulators on stem and
root characteristics associated with lodging in two cultivars of winter wheat. J. of
Exp. Botany. 46:931-938.
Ervin, E.H., and A.J. Koski. 2001. Kentucky bluegrass growth responses to trinexapac-ethyl,
traffic, and nitrogen. Crop Sci. 41:1871–1877.
Frederick, J.R., and J.J. Camberato. 1995. Water and nitrogen effects on winter wheat in the
southeastern coastal plain: I. grain yield and kernel traits. Agron. J. 87:521-526.
Gooding, M.J., J.P.R.E. Dimmock, J. France, and S.A. Jones. 2000. Green leaf area decline of
wheat flag leaves: the influence of fungicides and relationships with mean grain weight
and grain yield. Ann. Appl. Biol. 136:77–84.
Hafner, V. 2001. Moddus—Universal product for lodging prevention in cereals. p. 167–172. In.
Proc. Slovenian Conf. on Plant Protection, 5th. Catezob Savi, Slovenia. 6–8 March 2001.
Humbries, E.C., P.J. Welbank, and K.J. Witts. 1965. Effects of CCC (chlorocholine chloride) on
growth and yield of spring wheat in the field. Ann. Appl. Biol. 56:351-361.
Knapp, J.S., C.L. Harms, and J.J. Volenec. 1987. Growth regulator effects on wheat culm
nonstructural and structural carbohydrates and lignin. Crop Sci. 27(6):1201-1205.
Knott, C.A., D.A Van Sanford, E.L. Ritchey, E. Swiggart. 2016. wheat yield response
and plant structure following increased nitrogen rates and plant growth regulator
applications in Kentucky. Crop, Forage & Turfgrass Management 2(1).
Łęgowiak Z., and A. Wysmułek. 2000. The application of growth regulators in winter cereals.
Prog. Plant Protection. Post. Ochr. Roślin. 40:932–934.
Major, D.J., B.L. Blad, A. Bauer, J.L. Hatfield, K.G. Hubbard, E.T. Kanemasu, and R.J.
Reginato. 1988. Winter wheat grain yield response to water and nitrogen on the North
American Great Plains. Agric. For. Meteorology. 44:141-149.
Matysiak, K. 2006. Influence of trinexapac-ethyl on growth and development of winter wheat. J.
Plant Prot. Res. 46:133–143.

45
Nangle, E.J., S.D. Gardner, J.D. Metzger, J.R. Street, and T.K. Danneberger. 2012. Impact
of nitrogen source and trinexapac-ethyl application on creeping bentgrass (Agrostis
stolonifera L.) physiology under neutral shade, deciduous tree shade, and full sunlit
conditions. Hort Sci. 936-942.
NASS. 2014. Small grains annual summary. USDA, Washington, D.C.
https://usda.mannlib.cornell.edu/MannUsda/viewDocumentInfo.do?documentID=1268
(accessed 10 May 2016).
NASS. 2015. Small grains annual summary. USDA, Washington, D.C.
https://usda.mannlib.cornell.edu/MannUsda/viewDocumentInfo.do?documentID=1268
(accessed 10 May 2016).
Nolte, K., 2007. The PGR trinexapac-ethyl reduces lodging in desert durum wheat. Hort. Sci.
42(4):865-866.
Olson, E., and L. Siler. 2015. Michigan wheat variety trial results. Michigan State University.
http://www.varietytrials.msu.edu/wheat (accessed 20 May 2016).
Otteson, B.N., M. Mergoum, and J.K. Ransom. 2007. Seeding rate and nitrogen management
effect on spring wheat yield and yield components. Agron. J. 99:1615-1621.
Penckowski, L.H., J. Zagonel, and E.C. Fernandes. 2009. Nitrogen and growth reducer in high
yield wheat. Acta Sci., Agron. 31:473–479.
Pinthus, M.J. 1973. Lodging in wheat, barley, and oats: The phenomenon, its causes, and
preventative measures. Advances in Agronomy. 25:209-263.
Qian, Y.L., M.C. Engelke, M.J.V. Foster, and S. Reynolds. 1998. Trinexapac-ethyl restricts
shoot growth and improves quality of Diamond zoysiagrass under shade. HortSci.
33(6):1019-1022.
Rademacher, W. 2000. Growth retardants: effects on gibberellin biosynthesis and other
metabolic pathways. Ann. Rev. Plant Biol. 51(1):501-531.
Rajala, A., and P. Peltonen-Sainio. 2001. Plant growth regulator effects on spring cereal root and
shoot growth. Agron. J. 93:936–943.
Rajala, A., and P. Peltonen-Sainio. 2002. Timing applications of growth regulators to alter
spring cereal development at high latitudes. Agric. Food Sci. Finl. 11:233–244.
SAS Institute. 2012. The SAS system for Windows. Release 9.4. SAS Inst., Cary, NC.
Staggenborg, S.A., D.A. Whitney, D.L. Fjell, and J.P. Shroyer. 2003. Seeding and nitrogen rates
required to optimize winter wheat yields following grain sorghum and soybean. Agron. J.
95:253-259.

46
Stapper, M., and R.A. Fischer. 1990. Genotype, sowing date and plant spacing influence on high-
yielding irrigated wheat in southern New South Wales. II. Growth, yield and nitrogen
use. Crop and Pasture Sci. 41(6):1021-1041.
Steinke, K., and J.C. Stier. 2003. Nitrogen selection and growth regulator applications for
improving shaded turf performance. Crop Sci. 43:1399–1406.
Stier, J.C., 1997. The effects of plant growth regulators on Kentucky bluegrass (Poa pratensis L.)
and supina bluegrass (P. Supina schrad) in reduced light conditions. PhD. Diss.,
Michigan State University., East Lansing, MI.
Syhre, M., G. Hanschmann, and R. Heber. 1997. Problems in analyzing trinexapac-ethyl: a new
plant growth regulator. J. of Agric. and Food Chem. 45(1):178-179.
Sylvester-Bradley, R., R.K. Scott, and C.E. Wright. 1990. Physiology in the production and
improvement of cereals. Home-Grown Cereals Authority Research Review, vol. 18,
HGCA, London.
Szoke, T.G., J. Anthonissen, and J. Vergracht. 1979. New ethephon based anti-lodging product
for barley. In Proc. Int. Symposium on Crop Protectium. Ghent, Belgium. 843–852.
Tripathi, S.C., K.D. Sayre, J.N. Kaul, and R.S. Narang. 2002. Effect of planting methods and N
rates on lodging, morphological characteristics of culm and yield in spring wheat
varieties. Cereal Research Communications. 30:431-438.
Van Sanford, D.A., J.H. Grove, L.J. Grabau, and C.T. MacKown. 1989. Ethephon and nitrogen
use in winter wheat. Agron. J. 81, 6:951-954.
Vitosh, M.L., J.W. Johnson, and D.B. Mengel. 1995. Tri-state fertilizer recommendations for
corn, soybean, wheat, and alfalfa. Ext. Bull. E-2567. Michigan State Univ., East Lansing,
MI. https://soil.msu.edu (accessed 20 May 2016).
Warncke, D., J. Dahl, and L. Jacobs. 2009. Nutrient recommendations for field crops in
Michigan. Ext. Bulletin E2904. Michigan State University Ext., East Lansing, MI.
White, E.M., 1991. Response of winter barley cultivars to nitrogen and a plant growth regulator
in relation to lodging. The J. of Ag. Sci., 116(02):191-200.
Wiersma, D.W., E.S. Oplinger, and S.O. Guy. 1986. Environment and cultivar effects on winter
wheat response to ethephon plant growth regulator. Agron. J. 78(5):761-764.
Wiersma, J.J., J. Dai, and B.R. Durgan. 2011. Optimum timing and rate of trinexapac-ethyl to
reduce lodging in spring wheat. Agron. J. 103:864-870.
Zagonel, J., W.S. Venancio, and R.P. Kunz. 2002. Effect of growth regulator on wheat crop
under different nitrogen rates and plant densities. Planta Daninha, 20(3):471-476.

47
CHAPTER 3
SOIL MICROBIAL COMMUNITY COMPOSITION AND SOYBEAN YIELD
FOLLOWING COVER CROP AND FERTILIZER SOURCE
Introduction
Improved understanding of the relationship between soil physical properties, agronomic
management, soybean yield, and seed quality is required to optimize soybean production
(Anthony et al., 2012). Mean Michigan soybean grain yields are < 3.2 Mg ha-1, although
individual growers may surpass 5.4 Mg ha-1 (NASS, 2015). Inconsistent yield response to
fertilizer inputs may partially explain why Michigan soybean grain yields only increased 29%
between 1980 and 2014 compared to a 69% increase for corn (Zea mays L.). Field research in the
Midwestern U.S. indicated that relationships between soybean yield and soil physical properties
(e.g., soil moisture content) and soil chemical properties (e.g., soil test potassium [K]) may be
dependent upon environmental factors within individual fields (Kravchenko and Bullock, 2000;
Sawchik and Mallarino, 2008). Although within-field soybean spatial yield variability has been
correlated to soil physical properties or topography and remained consistent across years
(Fahnestock et al., 1996; Changere and Lal, 1997; Kravchenko and Bullock, 2000; Kaspar et al.,
2004; Anthony et al., 2012), few data exist detailing how soil microbiological components (i.e.,
microbial community composition) may vary in response to management practices. Soil
microbes may be the next area of crop/environment interaction that must be understood in order
to fully optimize soybean production.
Rhizosphere microbial communities fundamentally affect nutrient cycling, root growth,
and plant biomass production (Buchenauer, 1998; Atkinson and Watson, 2000; Sylvia and
Chellemi, 2001). Specialized mutualistic relationships (e.g., soybean and Bradyrhizobium
48
japonicum) develop in the rhizosphere which enable soybean to provide roughly 70% of the total
N required for growth (Tien et al., 2002; Lindemann and Glover, 2003). Plant type (e.g.
including the use of cover crops), soil texture, and soil management may all influence soil
microbial community composition and interactions within the soil-plant continuum (Garbeva et
al., 2004; Buyer et al., 2010).
A limited autumn and spring fallow period prior to planting has prevented widespread
adoption of cover crops preceding soybean in Michigan and areas with similar or shorter
growing seasons. The documented benefits of using cover crops including increased soil organic
matter (SOM), tightening of nutrient cycles, and weed suppression warrant further investigation
to address stagnant soybean grain yield (Lu et al., 2000; Hill et al., 2006). Oilseed radish
(Raphanus sativus L.) reduces compaction and improves soil tilth and water infiltration, but few
data exist regarding the impact of oilseed radish on soil microbial communities (Chen and Weil,
2009; White and Weil, 2011). Oilseed radish root growth and ensuing desiccation often result in
soil disturbance, which can reduce soil microbial diversity (i.e., the total number of species
present [richness] and the distribution of individuals among those species [evenness]) (Margalef,
1958; Giller, 1996; Lupwayi et al., 1998). The allelopathic effects of oilseed radish on weed
suppression (Wang et. al., 2008) also affect microbial community composition, because root
exudates influence the survival, growth, and activity of specific soil microbes (Duineveld et al.,
2001; Whipps, 2001; Marschner et al., 2002; Rengel, 2002). Another cover crop, Hairy vetch
(Vicia villosa Roth), fixes atmospheric nitrogen (N) via bacteria-induced root nodules and may
supply up to 82 kg N ha-1 to a subsequent crop (Cline and Silvernail, 2002). The low
carbon:nitrogen ratio of hairy vetch (8:1) may account for the accelerated N release following
biomass decomposition (Aulakh et al., 1991; Varco et al., 1993). Buyer et al. (2010) reported

49
hairy vetch roots and shoots increased the 0 – 15-cm soil microbial biomass when hairy vetch
residue was mowed and left on the soil surface. Wang et al. (2007) recorded an increase in
microbial biomass when hairy vetch residue was soil-incorporated. A pervious crop of hairy
vetch increases arbuscular mycorrhizal colonization of roots, growth, shoot phosphorous (P)
content, and yield of soybean as compared to a previous non-arbuscular mycorrhizal host or
fallow (Norikuni et al., 2010). Buyer et al. (2010) concluded that planting cover crop mixtures
containing hairy vetch resulted in greater shifts in microbial community operational taxonomic
unit (OTU) composition than soil temperature, moisture, pH, and texture. Nutrient source and
abundance within the soil may alter soil microbial community composition (Fauci and Dick,
1994), but whether changes in yield are due to shifts in soil microbial community composition or
biological activity are unclear.
Fertilizer source (i.e., inorganic vs. organic) may also affect the soil microbial community
composition and in turn impact soil carbon content, organic matter percentage, soil aggregation,
and grain yield (Coleman et al., 2004; Zhong and Cai, 2007). Soybean yield often does not
respond to inorganic P or K application when soil test values are above critical levels (Welch et
al., 1973; Anthony et al., 2012; Slaton et al., 2013). Although some studies reported increased
soybean yield after N fertilization (Harper, 1974; Adeli et al., 2005), more recent research has
not shown a consistent yield response following N application (Anthony et al., 2012; Slaton et
al., 2013). Poultry litter increased soybean grain yield compared to inorganic fertilizers (Adeli et
al., 2005), and positive yield responses to poultry litter application have occurred where soil P
and K levels were sufficient for soybean production (Donald et al., 2013). Chinnadurai et al.
(2014) concluded that organic soil amendments resulted in greater microbial populations and
enzyme diversity than inorganic or no fertilizer application. Zhong et al. (2010) reported

50
increased microbial diversity following organic manure applied alone or in combination with
inorganic fertilizer as compared to inorganic fertilizer individually. The addition of manure
increased microbial biomass even when manure accounted for only 25% of the total N, P, and K
application (Lazcano et al., 2013). Organic fertilizers often supply carbon necessary for
microbial growth and increased microbial biomass (Diacono and Montemurro, 2010; Knapp et
al., 2010). The addition of carbon from organic fertilizers may alter microbial community
composition as copiotrophs favor nutrient-rich conditions and oligotrophs are better suited for
nutrient-poor environments (Hu et al., 1999; Marschner et al., 2003; Ros et al., 2006; Zhong et
al., 2010). Organic fertilizers mineralize over a longer period of time than inorganic fertilizers
and therefore may provide a competitive advantage for copiotrophs throughout the growing
season by acting as a long-term source of organic carbon and N, similar to cover crop residue
(Carrera et al., 2007).
In-situ, field-scale data are lacking regarding the effects of cover crop and fertilizer
source on soil microbial communities in soybean production. Previous work defining microbial
communities use methods including denaturing gradient gel electrophoresis (DGGE) (Xu et al.,
2009) and phospholipid fatty-acid analysis (PLFA) (Lazcano et al., 2013). While DGGE was
more effective than culturing techniques for determining the presence or absence of broad
microbial groups (Yang and Crowley, 2000), newer methods (i.e., Illumina 16S high-throughput
sequencing) produce a more detailed and cost-effective assessment of the soil microbial
community (Degnan and Ochman, 2011). Other studies measured soil respiration to determine
the activity and biomass of soil microbiota (Ajwa and Tabatabai, 1994; Peacock et al., 2001;
Mamilov and Dilly, 2002), but the relationships between soil respiration, fertilizer source and/or
cover crop, and crop yield were seldom reported. The effects of cover crops and fertilizer inputs
51
on soybean yield and soil microbial community composition have not been reported. Because
cover crops prior to soybean are not common for this region and very little information detailing
the in-situ soil microbial community response to management is available, the objectives of this
study were to i) investigate the effects of previous cover crop and fertilizer source on soybean
emergence, growth, grain yield, and soil respiration, and ii) evaluate and characterize temporal
and spatial variations of soybean soil microbial community composition in response to these
same cover crop and fertilizer sources.
Materials and Methods
Site Description and Experimental Design
Field studies were conducted in 2013 and 2014 at the Michigan State University South
Campus Field Research Facilities in Lansing, MI (42°41'21.18"N, 84°29'15.46"W) on a Capac
loam soil (fine-loamy, mixed, active, mesic Aquic Glossudalfs) located 266 m above sea level.
The study was arranged as a split-plot randomized complete block design with four replications
each containing 12 experimental units (4.5 x 12.1 m). Main plots consisted of one of these cover
crop treatments preceding soybean: oilseed radish (Raphanus sativus L.) (Ampac Seed
Company, Tangent, OR), hairy vetch (Vicia villosa Roth), or no cover crop. Sub-plots consisted
of three fertilizer sources and a non-fertilized check (C). Fertilizers included sterilized, organic-
based (SO) chicken litter with inoculum and nutrient additions at 2.2 Mg ha-1 (8-4-4 [N-P2O5-
K2O]) (Perfect Blend Biotic Fertilizer, Bellevue, WA), organic (O) chicken litter applied at 4.5
Mg ha-1 (4-3-2 [N-P2O5-K2O]), and inorganic (I) N-P-K fertilizer based on first-year nutrient
mineralization of the SO and O treatments (45-27-36 kg of N, P2O5, and K2O ha-1 applied as urea
[46-0-0], monoammonium phosphate [MAP] [11-52-0], and muriate of potash [MOP] [0-0-62]).

52
Fields were cropped to wheat prior to cover crop establishment and cultivated following
wheat harvest. Soil characteristics in autumn 2012, preceding cover crop planting, were 7.1 pH
(1:1 soil/water) (Watson and Brown, 1998), 118 mg kg-1 K (ammonium acetate extractable K)
(Warncke and Brown, 1998), 41 mg kg-1 P (Bray P1) (Frank et al., 1998), 12.9 cmolc kg-1 cation
exchange capacity (CEC) (Warncke et al., 1998), and 3.7% SOM (loss on ignition) (Combs and
Nathan, 1998). Soil characteristics preceding 2013 cover crop planting were 6.5 pH, 24 mg kg-1
P, 97 mg kg-1 K, 12.2 meq 100g-1 CEC, and 2.7% SOM. Cover crops were planted 9 Aug 2012
and 5 August 2013. A 12-row grain drill (Great Plains Ag, Salina, KS) was used to plant oilseed
radish at 13.4 kg ha-1 and hairy vetch at 22.4 kg ha-1. Seeds were planted at a depth of 1.5 cm in
19-cm rows. Oilseed radish decomposes prior to winter, but hairy vetch and weeds required
spring termination and were sprayed 6 May 2013 and April 22 2014 with 2.3 L ha-1 Glystar Plus
(N-(phosphonomethyl)glycine, in the form of its isopropylamine salt) (Albaugh, Ankeny, IA)
and 2.3 L ha-1 Roundup WeatherMAX (N-(phosphonomethyl)glycine, in the form of its
potassium salt) (Monsanto, St. Louis, MO), respectively.
Fields were disked prior to spring planting to minimize hairy vetch and weed residue on
the soil surface. Soil amendments were broadcast and incorporated using a soil finisher to a 10-
cm depth prior to soybean planting. Soybean was seeded with a six-row planter in 76-cm rows
(Monosem Inc., Edwardsville, KS). A 2.5 maturity group soybean (92Y51) (DuPont Pioneer,
Johnston, IA) was planted on 22 May 2013 and 19 May 2014 at a population of 381,777 seeds
ha-1 at a depth of 3.2 cm.
Data Collection
Soil samples were collected to depths of 10, 15, 20, and 30-cm for individual
measureables. Pre-plant, R1, and harvest 10-cm soil samples were collected during the soybean
53
growing season for DNA extraction. Pre-plant 10-cm main-plot composite soil samples were
taken after cover crop termination and prior to spring fertilizer application. Rhizosphere within-
row (i.e. between two soybean stems within a row) and between-row (i.e. at least 30 cm from the
nearest soybean stem) 10-cm soil samples were collected on all in-season sampling dates.
Monthly soil samples were collected June – September to a depth of 15-cm in every plot to
assess soil respiration (Solvita, Mt Vernon, ME) and to a depth of 30-cm in non-fertilized plots
to measure soil N. To evaluate the effects of cover crops on soil pH, P, and K, 20-cm soil
samples were collected at cover crop planting, prior to the first autumn frost, and prior to
soybean planting.
Soybean emergence (plants m-1) was evaluated eight days after soybean planting. Mean
height of 10 plants per plot was measured at V3 and R5. SPAD chlorophyll meter readings were
taken at V3 and R5 on the uppermost fully-developed trifoliate from 25 plants per plot
(Spectrum Technologies, Aurora, IL). Twenty-five of the uppermost fully-developed trifoliates
were collected from non-harvest rows at R1 and analyzed for nutrient content. At R3, 10 plants
plot-1 were excavated and the root systems were washed of soil to determine mean number of
root nodules per plant.
At physiological maturity, 10 plants plot-1 were collected to determine average number of
nodes per plant, pod producing nodes per plant, pods per node, and beans per pod. Grain yield
was harvested from the center 1.2 m of each plot using a small plot combine (Almaco, Nevada,
IA) on 9 October 2013 and 22 October 2014. Moisture and test weight for each plot were
obtained using a GAC 2100 (DICKEY-John, Auburn, IL). Final grain yields were corrected to
13.5% moisture. Grain subsamples from each plot were used to determine protein and oil
content.

54
Soil DNA Extraction and Analysis
The present study utilized next-generation sequencing (NGS) to precisely characterize
soil microbial communities. Bacterial DNA from rhizosphere and between-row soil samples
collected throughout the growing season were the basis for microbial identification and
subsequent classification. Soil DNA extraction was accomplished using a MoBio PowerSoil
DNA Isolaton kit (Mo Bio Laboratories, Inc., Carlsbad, CA). DNA was amplified using
Accuprime™ Pfx Supermix for downstream application (ThermoFisher Scientific, Waltham,
MA) with a Mastercycler gradient thermocycler (Eppendorf, Hauppauge, NY) with the following
cycling parameters: 3 min. at 94°C; 30 cycles of 45 sec.at 94°C, 45 sec. at 56°C, and 1 min. at
72°C; final extension time of 7 min. at 72°C; hold at 4°C. Samples were visualized by
electrophoresis on a 0.75 % agarose gel. If bands were visually present on the gel, DNA was then
amplified. To ensure approximately equal sample sizes, individual samples were normalized
following successful PCR amplification using a SequalPrep™ normalization kit (ThermoFisher
Scientific, Waltham, MA). Final DNA concentration following combination of all samples was
measured in ng µl-1 using a Qubit fluorometer (ThermoFisher Scientific, Waltham, MA). Final
16S rRNA analysis was performed using an Illumina MiSeq Sequencer (San Diego, California)
at the Michigan State University Genomics Core (East Lansing, MI).
The resulting sequence data were analyzed using a previously described SOP analysis
pipeline (Kozich, et al. 2013) with the MOTHUR v.1.33.2b software package (Schloss et al.,
2009) and processed using the protocol from http://www.mothur.org/wiki/MiSeq_SOP (accessed
5 October 2015). Processing was conducted at the Michigan State University High Performance
Computing Center (East Lansing, MI). A cutoff of 8,000 reads sample-1 was used for sample
homogeneity. A series of calculators were run on the data, including inverse Simpson’s diversity
55
(∑ 𝑛𝑖(𝑛𝑖−1)
𝑠𝑜𝑖=1
𝑁(𝑁−1))−1
, where So = the number of observed OTUs, ni = the number of individuals in
the ith OTU, and N = the number of total individuals in the community. Indicator analysis in
MOTHUR was utilized to depict differences in occurrence and relative abundance of individual
OTUs based on sampling time and origin. The ‘parsimony’ command determined whether
clustering within the phylogenetic tree created during analysis was significantly different among
groups of samples on the probability that two given treatments would have similar ecological
structures (Schloss et al. 2009). The ‘metastats’ command was used to determine whether the
abundance of OTUs was significantly different among cover crop treatments.
Data Analysis
Data were subjected to analysis of variance using PROC GLIMMIX in SAS version 9.4
to determine the significance of cover crop and fertilizer (SAS Institute, 2012). Cover crop,
fertilizer, sampling time, and sample origin were considered fixed effects and replication was
considered a random effect. When ANOVA generated a significant F value (P ≤ 0.05), treatment
means were separated using Fisher’s protected LSD. The data were determined to be
significantly different by year (P ≤ 0.05) and were analyzed separately.
Results and Discussion
Environmental Conditions
September – November rainfall was 34% below, and similar to, the 30-year mean in 2012
and 2013, respectively, while air and soil temperatures were near the 30-year mean (Table 1).
Dry soil conditions following the 2013 cover crop seeding resulted in delayed germination as
compared to 2012. Monthly growing season (April – October) precipitation was 26% greater and
10% less than the 30-year mean in 2013 and 2014, respectively. Soil moisture levels in 2013
exceeded 2014 levels for 123 out of 153 days between 1 April and 31 August (Fig.1). April

56
through August air and soil temperatures were 2.1 – 12.4 and 1.0 – 4.0 ºC cooler in 2014
compared to 30- and 10-yr means, respectively. The cooler, drier conditions encountered in the
second year of the study may have limited soybean growth and adversely affected soil microbial
activity. Although increased soil moisture can stress soil microbes due to increased frequency of
anaerobic conditions, lack of soil water can also impede nutrient movement through the soil due
to thinner water films on soil particles and more tortuous substrate paths (Linn and Doran, 1984;
Stark and Firestone, 1995). Warmer soil temperatures four of six months in the 2013 compared
to 2014 growing season may have increased microbial activity (Han et al., 2007), potentially
increasing plant available nutrients and opportunity for shifts in microbial community structure.

57
Table 3.1. Mean precipitation, air temperature, and soil temperature (5-cm depth) in Lansing, MI
for 2012/13 and 2013/14 cover crop and soybean growing seasons.
Precipitation† Air Temperature Soil Temperature
Month 2012/
13
2013/
14
30-yr
avg.‡
2012/
13
2013/
14
30-yr
avg.
♀
2012/
13
2013/
14
10-yr
avg.§
----------cm---------- ----------°C---------- ----------°C----------
Aug. 5.3 9.7 8.4 20.4 19.7 21.3 22.6 21.4 22.8
Sept. 5.5 2.1 9.2 16.0 15.8 16.9 18.2 17.3 18.2
Oct. 9.2 12.6 7.0 10.0 10.7 10.4 12.0 12.4 11.8
Nov. 0.8 5.8 7.1 3.3 10.7 4.6 5.4 5.5 6.0
Dec. 3.2 3.2 4.2 0.6 2.2 -1.9 3.9 1.1 2.1
Jan. 6.9 1.5 4.6 -3.3 -4.4 -4.6 1.0 0.6 0.7
Feb. 3.0 1.5 3.8 -4.5 -9.9 -3.2 -0.3 0.5 0.3
March 1.7 2.4 4.5 -0.7 -9.2 1.9 1.1 0.8 3.2
April 17.9 2.2 7.3 6.5 -3.7 8.7 7.6 8.5 9.5
May 8.3 8.6 8.5 16.0 8.0 14.7 17.2 14.2 15.8
June 16.1 12.3 8.9 19.2 14.4 20.0 20.9 19.1 21.7
July 6.1 6.2 8.3 21.3 20.0 22.1 24.2 19.9 23.9
Aug. 9.7 8.6 8.4 19.7 18.8 21.3 21.4 21.8 22.8
Sept. 2.1 8.5 9.2 15.8 15.4 16.9 17.3 17.4 18.2
Oct. 12.6 5.2 7.0 10.7 9.1 10.4 12.4 11.4 11.8
Total 108.4 90.4
44
106.4
†Precipitation, air temperature, and soil temperature data were collected from the Michigan
Automated Weather Network (http://www.agweather.geo.msu.edu/mawn/).
‡30-yr means for precipitation. Source: Weather DB (http://www.weatherdb.com/).
♀30-yr means for air temperature. Source: NOAA (http://www.ncdc.noaa.gov/cdo-
web/datatools/normals).
§10-yr means for soil temperature. Source: Michigan Automated Weather Network
(http://www.agweather.geo.msu.edu/mawn/).

58
Fig. 3.1. Maximum daily soil moisture (5-cm) comparison for the April – October growing
season, Lansing, MI, 2013 – 2014.
Cover Crop Effects on Residual Soil Nutrient Levels
Cover crop did not significantly change soil test P or K values between August (i.e.,
preceding cover crop planting) and May (i.e., preceding soybean planting) (data not shown) in
either study year. The autumn-seeded cover crops did not increase P or K availability or slow the
rate of P or K drawdown as compared to the indigenous weed population in the no cover crop
main plot. Wang et al. (2008) measured an increase in soil test P following an oilseed radish
cover crop, but they found no impact on soil test K. Similar to Wang et al. (2008) and O’Reilly et
al. (2012), soil test N (0 – 30 cm) following oilseed radish did not increase compared to the
untreated control (data not shown). Although not significant, vetch resulted in the greatest
amount of available N (0 – 30 cm) in June, July, August, and September 2013 (P = 0.09, 0.81,
0.06, and 0.83, respectively) and June, July, and September 2014 (P = 0.07, 0.48, 0.20,
respectively). Data suggest that those growers whose goal is to provide N to a subsequent
rotational crop may consider selecting an N-fixing cover crop (i.e. hairy vetch) as compared to
0.05
0.1
0.15
0.2
0.25
0.3
0.35
0.4
4/1 5/1 6/1 7/1 8/1 9/1 10/1 11/1
Soil
Mois
ture
(cm
3cm
-3)
Date

59
an N-scavenging cover crop (i.e., oilseed radish) or no cover crop. Soil nitrate levels, which can
affect soil microbial community structure (Inselsbacher et al., 2010), remained greater
throughout the growing season following hairy vetch. Higher soil nitrate could reduce the
amount of supplemental N required by a subsequent crop (Cline and Silvernail, 2002).
Soybean Emergence and Growth
Cover crop influenced soybean emergence and growth in 2013 (Table 2). Oilseed radish
prior to soybean increased seedling emergence by 139 – 189% 8 days after planting and
increased plant height 5 – 7 cm at V4 and 7 – 10 cm at R5 compared to previous hairy vetch or
no cover crop. Soybean plant height at V4 following hairy vetch was 2 – 7 cm less than
following no cover crop and oilseed radish. Excessive precipitation (17.9 cm) in April 2013
delayed spring cover crop termination until eight days prior to soybean planting which was an
insufficient amount of time for surface residue to senesce and decompose. Oilseed radish is a
winter annual, allowing aboveground biomass and belowground taproot to completely
decompose prior to soybean planting. In contrast, indigenous weed and hairy vetch growth
produced surface residue that decreased seed-to-soil contact and reduced emergence. Soybean
population eight days after planting was significantly correlated to R1 and R5 plant height (R2 =
0.64 and 0.37, respectively), indicating that quicker seedling emergence following oilseed radish
allowed more days for soybean to grow. Allelopathic effects from hairy vetch have resulted in
decreased soybean germination and reduced plant height (Ill-Min and Joung-Kuk, 1994). Weed
presence following oilseed radish was minimal, indicating canopy shading or allelopathic effects
may have prevented weed growth and emergence as documented previously (Stivers-Young,
1998; Lawley et al., 2011; O’Reilley et al., 2011). No significant differences in emergence or
plant height were observed in 2014, most likely due to cover crop and weed termination 27 days

60
prior to planting and thus greater desiccation of plant residue than in 2013. Despite hairy vetch
functioning as a leguminous cover crop, soybean nodulation was not affected in either study
year.
Table 3.2. Soybean stand count and plant height as affected by previous cover crop, Lansing,
MI, 2013.
Treatment Stand 8 DAP June Height August Height
--Plants m-1-- ----cm---- ----cm----
Cover Crop
No Cover 7.6 b†
34 b 112 b
Oilseed Radish 18.2 a 39 a 119 a
Hairy Vetch 6.3 b 32 c 109 b
Significance (P>F) < 0.01 < 0.01 < 0.01
†Means in a column followed by the same letter are not statistically different (α=0.05).
Organic fertilizer increased R1 tissue K concentrations in 2014, but no differences were
observed in 2013 (data not shown). Tissue K concentration was correlated with yield (R2 = 0.56)
and R5 plant height (R2 = 0.43) in 2014, supporting previous findings where R1 tissue K
concentration served as an indicator of plant height and yield (Slaton et al., 2013). Fertilizer
source did not affect population or plant height in either study year. Fertilizer application
significantly affected root nodulation in 2013 (P = 0.01) in the following order: C > O > SO > I.
Although all treatments contained similar quantities of first year mineralizable N, organic
amendments contain a diverse microbial population (McKinley and Vestal, 1984) and also
provide organic carbon and micronutrients that may impact microbial activity (Chen et al.,
1988). The increased root nodulation following O as compared to I and SO may be due to the
lack of organic carbon or absence of live microorganisms.
Grain Yield and Quality
Cover crop influenced soybean grain yield in one of two years with similar yield patterns
over both study years (oilseed radish > no cover crop > hairy vetch) (Table 3). Yield was

61
significantly correlated with plants m-1 eight days after planting (R2 = 0.17) and R1 and R5 plant
height in 2013 (R2 = 0.23 and 0.42, respectively), all of which increased following oilseed radish.
Soybean grain yield in 2013 was 0.33 Mg ha-1 and 0.25 Mg ha-1 less following hairy vetch
compared to oilseed radish and no cover crop, respectively. Reddy (2001) observed similar yield
reductions following hairy vetch in Mississippi and determined that no cover crop resulted in a
greater net economic return. Grain yield differences in this study may also be explained by
planting conditions following each cover crop, as the winterkilled oilseed radish produced little
surface residue while hairy vetch spring biomass may have inhibited plant emergence. However,
final plant population was statistically similar between cover crops (data not shown), and uneven
emergence in soybean rarely affects grain yield due to growth plasticity (i.e. plants compensate
for other missing plants by growing larger) (Egli, 1993; Andrade and Abbate, 2005). Other
factors including increased soil tilth following oilseed radish may account for yield variability as
belowground taproots produce large fissures within the soil (Williams and Weil, 2004; Chen and
Weil, 2009). Grain oil and protein were not affected by cover crop in either study year.

62
Table 3.3. Influence of previous cover crop and fertilizer source on soybean grain yield,
Lansing, MI, 2013 – 2014.
Treatment Yield
2013 2014
---Mg ha-1---
Cover Crop
No Cover 4.6 a† 4.1 a
Radish 4.7 a 4.2 a
Vetch 4.3 b 4.0 a
Fertilizer
Check 4.5 a 3.9 a
Organic 4.7 a 4.3 a
Sterilized Organic 4.4 a 3.9 a
Inorganic 4.6 a 4.1 a
Significance (P>F)
Cover Crop .04 .51
Fertilizer .11 .06
Cover Crop x Fertilizer .08 .56
†Means in a column followed by the same letter are not statistically different (α=0.05).
Fertilizer source did not affect (P = 0.11 and 0.06 in 2013 and 2014, respectively) grain
yield in either study year. Treatment O resulted in the greatest grain yield each year with an
increase of 0.12 Mg ha-1 and 0.40 Mg ha-1 in 2013 and 2014, respectively, as compared to
treatment C. Previous research reported increased grain yield when applying poultry litter to
soybean (Adeli et al., 2005; Donald et al., 2013). Since soybean grain yield is more probable to
respond to P and K fertilization when soil P and K are below critical levels, larger yield increases
following O in 2014 than 2013 may be explained by lower antecedent soil P and K levels in
2014. Fertilizer source did not affect grain oil or protein in 2013. In 2014, grain protein was
significantly increased by 0.7 – 0.8% following C and SO compared to O and I treatments while
grain oil was significantly increased by 0.2 – 0.3% after the O and I treatments as compared to
SO and C treatments (data not shown).

63
DNA Sequence Analysis
Over 12.3 million unique bacterial sequences were identified, with a mean of 36,400
sequences per sample. Twenty-four bacterial phyla were detected each year, with 23 of the 24
phyla appearing across both study years. The top five phyla represented 80% and 82% of the
total sequences in 2013 and 2014, respectively (Table 4). A total of 94,455 and 63,287 unique
species were identified in 2013 and 2014, respectively. Analysis at the species level (i.e., 0.03
cutoff level in MOTHUR) did not produce a plateauing rarefaction curve, indicating that taking
more samples would have resulted in a greater number of recovered unique sequences. Twenty-
two and 27% of the recovered sequences were not classifiable (i.e. the genetic code has not been
cataloged) at the phyla taxonomic level, while 56% and 59% were not classifiable at the genus
level in 2013 and 2014, respectively. Singletons (i.e. sequences found only once per sample)
accounted for 60% of all sequences identified in 2013 and 51% in 2014, indicating that the
agriculturally-managed soils in this study may have contained greater phylogenetic richness than
has been previously reported from a prairie soil (Rosenzweig et al., 2013).

64
Table 3.4. Relative abundance (0 – 10-cm) of individual soil bacterial phyla (representing
>10,000 sequences per year) present in soybean. Values were averaged across three cover crop
treatments and four fertilizer sources from soil sampling at growth stage R1 and harvest,
Lansing, MI, 2013 – 2014.
Phyla Relative Abundance
2013 2014
-------%------
Acidobacteria 24.9 a† 26.0 a
Actinobacteria 8.6 b 15.4 a
Armatimonadetes 1.4 b 1.5 a
Bacteroidetes 7.4 a 6.8 a
Chloroflexi 1.0 b 1.6 a
Cyanobacteria 2.0 b 2.3 a
Firmicutes 20.2 a 4.0 b
Gemmatimonadetes 1.4 a 1.5 a
Nitrospira 0.3 b 0.4 a
Planctomycetes 6.5 b 9.1 a
Proteobacteria 18.6 b 24.4 a
Verrucomicrobia 7.5 a 6.8 b
†Values in a row followed by the same letter are not statistically different (α=0.05).
Phyla Relative Abundance
The relative abundance of bacterial phyla was not consistent between 2013 and 2014
despite the close proximity of the two fields. Of the common bacterial phyla (i.e. those which
represented >10,000 sequences total per year), only Acidobacteria, Bacteroidetes, and
Gemmatimonadetes were similar in relative abundance between years (Table 4). Similar to
previous studies, Acidobacteria, Actinobacteria, Firmicutes, and Proteobacteria were four
prevalent phyla detected and have been reported to dominate the plant rhizosphere (da Rocha UN
et al., 2009; da C. Jesus et al., 2010, Rosenzweig et al., 2012). Actinobacteria and Proteobacteria
both had greater relative abundance in 2014 than 2013, and each contain genera shown to act as
biological control agents (BCAs). Bacteria in the genus Streptomyces, within the phylum
Actiniobacteria, and Pseudomonas, in the Proteobacteria phylum both can produce a number of
antibiotic compounds which protect host plants from pathogens and decrease in-field disease
pressure (Haas and Keel, 2003; Kaltenpoth et al., 2005). Plant productivity can be enhanced if

65
increases in beneficial bacteria results in a disease-suppressive soil. Firmicutes had the greatest
difference in relative abundance, with a five-fold higher population in 2013 than 2014. The
dominance of Firmicutes in 2013 (20% of all samples in 2013 vs. 4% in 2014) may explain why
7 of the 11 other common phyla were significantly less abundant, suggesting that the
proliferation of one bacterial phyla may affect the relative abundance of other phyla. The
increased presence of Firmicutes in 2013 may have been influenced by environmental
conditions, as relative abundance was greater at harvest than R1. One OTU within the Firmicutes
phylum classifiable to the order Bacillales was the most common OTU in 2013, encompassing
12% of all sequences for the year and 29% of between-row harvest soil sequences. Due to the
uncertainty of genus classification, conclusions on why Bacillales dominated the 2013 between-
row harvest samples remains unclear. However, bacteria in this order often produce endospores
during times of stress (Leggett et al., 2012). Environmental conditions such as soil moisture <
0.07 cm3 cm-3 (Table 5) may have induced Bacillales to produce endospores and increase their
perceived relative abundance, as endospores resist degradation and preserve genetic material for
later extraction and amplification (Leggett et al., 2012). Bacteria in the genus Bacillus, within the
Bacillales order, also demonstrated antagonism towards soil-borne pathogens and are widely
used in commercially available biological control agents (Fravel, 2005). Members of the Bacillus
genus combat fungal pathogens such as S. sclerotiorum (Fernando et al., 2004), which decreases
soybean yield by 133 – 333 kg ha-1 for every 10% increase in occurrence (Hoffman et al., 1998;
Yang et al., 1999; Danielson et al., 2004) and has resulted in widespread soybean yield loss in
Michigan (Grau, 1988). Although disease-induced plant stress was not visually present in 2013,
reduced disease pressure could have resulted in greater yield compared to 2014 as fungi were not
enumerated within this study due to read length limitations from initial NGS technologies.

66
Table 3.5. Soil moisture (5-cm), precipitation, and soil temperature (5-cm) for the two-week
period prior to final soil sampling and soybean harvest soil sampling (14 October 2013 and 29
October 2014), Lansing, MI, 2013 – 2014. “N/A” represents days when readings from the
weather station were not available.
Date Maximum
soil moisture
Minimum
soil
moisture
Precipitation Maximum
soil
temperature
Minimum
soil
temperature
------cm3 cm-3------ ---cm--- ------°C ------
2013
10/1 0.068 0.068 0.00 15.8 14.3
10/2 0.068 0.067 0.05 17.8 14.7
10/3 0.067 0.067 0.00 16.7 14.0
10/4 0.067 0.067 0.00 17.4 16.0
10/5 0.161 0.067 5.21 18.5 16.6
10/6 0.143 0.136 0.79 18.3 16.9
10/7 0.144 0.139 0.10 17.0 13.8
10/8 0.139 0.134 0.00 14.7 12.5
10/9 0.134 0.130 0.00 14.8 12.6
10/10 0.130 0.126 0.00 14.5 12.1
10/11 0.126 0.122 0.00 14.3 11.7
10/12 0.122 0.119 0.00 15.0 12.4
10/13 0.119 0.116 0.00 14.8 13.4
10/14 0.116 0.112 0.00 13.4 11.9
2014
10/15 0.142 0.142 0.00 14.4 13.3
10/16 0.143 0.141 0.03 13.3 11.6
10/17 0.142 0.141 0.00 13.3 12.6
10/18 0.141 0.140 0.00 12.8 10.1
10/19 0.140 0.138 0.00 10.0 7.9
10/20 0.139 0.138 0.30 11.3 9.2
10/21 0.138 0.137 0.08 11.1 8.8
10/22 0.137 0.136 0.00 9.4 8.2
10/23 0.136 0.135 0.00 9.4 6.8
10/24 0.136 0.135 0.00 9.9 7.2
10/25 0.135 0.134 0.00 10.7 8.4
10/26 0.134 0.133 0.00 9.9 8.2
10/27 N/A N/A N/A N/A N/A
10/28 N/A N/A N/A N/A N/A
10/29 0.131 0.131 0.03 11.0 9.0

67
Community Metastats (Amount of statistically different OTUs)
Shifts in the abundance of common OTUs can determine whether a management practice
has the ability to promote or demote the survival and activity of soil microbes towards a
population of beneficial, rather than pathogenic, bacteria. Metastat analysis revealed that of the
top 1,000 OTUs per year, oilseed radish and no cover had the most similar microbial
communities, while hairy vetch and oilseed radish had dissimilar communities (Table 6). These
data suggest that oilseed radish affected fewer OTUs than hairy vetch, but that OTUs affected by
oilseed radish were mostly different than the OTUs influenced by hairy vetch. Oilseed radish
may have had a reduced effect on OTU relative abundance for a variety of reasons. The absence
of spring growth in oilseed radish may have reduced selection pressure on soil microbes, since
actively-growing roots release exudates. Alternately, autumn microbial communities supported
by oilseed radish may not have persisted throughout the dormant winter season in Michigan. If
shifts in soil microbial community populations from autumn cover crop growth cannot be
sustained throughout the winter season, then overwintering cover crops may be more
advantageous in northerly climates where soil freezing and snow cover are prevalent. Another
possibility was that the antecedent microbial community was less sensitive to oilseed radish root
exudates than to hairy vetch exudates. If the focus is on microbial relative abundance, greater
emphasis may be placed on specific cover crop attributes (i.e. brassica vs. legume; winter-killed
vs. overwintering) in lieu of whether or not to plant a cover crop. Data suggest that a
monoculture vs. naturalized weed growth containing multiple plant species resulted in greater
changes in the distribution of common soil bacteria. Increased soil temperature (Table 1) and
moisture (Figure 1), two factors affecting bacterial activity, may have resulted in greater
bacterial growth and motility, increasing certain OTUs in 2013 as compared to 2014 (Han et al.,

68
2007). These data suggest that environmental factors influenced the extent to which common
OTUs were affected but that selection of cover crop species is a management decision with
implications on soil microbial community structure. More research is required to determine
which cover crop species may influence the abundance of plant growth promoting bacteria most
suitable for individual cash crop rotations.
Table 3.6. Influence of cover crop on relative abundance (0 – 10-cm) of the top 1,000 OTUs per
year present in soybean, Lansing, MI, 2013 – 2014. Operational taxonomic units were averaged
across four fertilizer sources from soil sampling at growth stage R1 and harvest. Values represent
the number of OTUs with significantly different abundance out of the top 1,000 OTUs.
Cover crop comparison Year
2013 2014
Radish-None 85 56
Vetch-None 92 67
Vetch-Radish 171 80
Indicator Species Variability Based on Sampling Time and Origin
The timing and location of OTU prevalence can impact the distribution and relative
abundance of all bacteria when analyzed across an entire growing season. Indicator species
analysis found 15 of the top 20 OTUs in the current study were present across both years but
differed in abundance due to sampling time or origin (Table 7). The Acidobacteria Gp6 genera
represented harvest rhizosphere samples in 2013 but not in 2014. Other Acidobacteria genera
(e.g. Gp4, Gp16) were indicator species at earlier sampling dates in 2013 highlighting the fact
that closely related OTUs may differ in occurrence and relative abundance both spatially and
temporally within the same field. Bacteria from the Bacillales order were prevalent from harvest
between-row soil samples in 2013 and 2014. Indicator analysis avoids incorrect conclusions
concerning microbial abundance as this method accounted for Bacillales presence in space and
time within the present study. Although sequencing data indicated similar bacterial community
membership between years, the prevalence and activity of individual groups differed based on
69
sampling time and origin. Determining the presence of common bacteria by sampling time and
origin may better explain the interaction between soil microbes and other production factors
including plant growth and disease suppression. Timing of activity for each OTU is important
since soil bacteria can increase nutrient mineralization and help plants manage environmental
stresses, both of which have varying importance depending on plant growth stage during the
growing season. Analyzing both between- and within-row sampling origins following changes in
soil management may be beneficial because while the rhizosphere directly affects plant growth,
between-row soil serves as an inoculum for plant roots to attract beneficial bacteria or encounter
soil-borne pathogens (Rosenzweig, 2014). Variations in OTUs based on sample origin suggest
that growers may benefit from consistent seed placement across growing seasons with the aid of
precision planting equipment as the rhizosphere is comprised of a unique microbial community
that the crop selects for throughout the growing season. Future research should consider shifts in
the soil microbial community throughout the growing season as single point-in-time community
samples may not accurately represent the evolution of the soil microbial community throughout
the growing season.

70
Table 3.7. Effect of sample time and sample origin on relative abundance of top 20 OTUs 2013
– 2014. Abundance values were averaged across three cover crop treatments and four fertilizer
sources. An “x” signifies that the OTU was represented significantly (P < 0.05) more for the
given sampling time and origin. Only those OTUs which had a significant sampling time by
origin interaction are shown.
Sample timing (0 – 10-cm sample origin)
OTU (classifiable level) Pre-plant
(bulk
soil)
R1†
(rhizo-
sphere)
Harvest
(rhizo-
sphere)
Harvest
(between-
row)
----------2013----------
Bacillales (order) x
Acidobacteria Gp16 (genus) x
Acidobacteria Gp6 (genus) x
Acidobacteria Gp4 (genus) x
Acidobacteria Gp6 (genus) x
Paenibacillus (genus) x
Acidobacteria Gp6 (genus) x
Sphingomonadaceae
(family)
x
Spartobacteria (order) x
Acidobacteria Gp4 (genus) x
Arthrobacter (genus) x
Acidobacteria Gp6 (genus) x
----------2014----------
Bacillales (order) x
Acidobacteria Gp16 (genus) x
Bradyrhizobium (genus) x
Mycobacterium (genus) x
unclassified (phyla) x
Comamonadaceae (family) x
unclassified (phyla) x
Flavobacterium (genus) x
Spartobacteria (order) x
Blastococcus (genus) x
†Between-row R1 samples were not collected in 2013 and no OTUs had a significant sampling
time by origin interaction for R1 2014.
Effect of Cover Crops and Fertilizer on Soil Respiration
A significant cover crop by fertilizer interaction on soil respiration occurred in June 2014
(data not shown). Slicing the data by cover crop revealed significantly greater soil respiration
following O than I or C in oilseed radish main plots and may have been due to a lack of plant
residue compared to hairy vetch and no cover plots. Treatments O and SO both supplied organic

71
carbon to the soil, whereas I and C did not. Differences in soil organic carbon would likely occur
after oilseed radish, since there was very little plant residue incorporated into the soil, and
increased organic carbon increases soil respiration (Han et al., 2007). This finding suggests that
addition of supplemental organic carbon when little plant residue remains prior to cash crop
planting may be necessary to maximize soil biological activity.
In 2013, soil respiration was significantly increased in July by 19 – 20% following hairy
vetch as compared to oilseed radish or no cover crop (data not shown). Increased soil respiration
may be attributed to decomposing hairy vetch tissue that was disked into the soil prior to the
growing season, providing an energy source for microbial growth (Varco et al., 1993; Wang et
al., 2007; Acosta et al., 2011). In the present study, increased July soil respiration was
accompanied by a decrease in soybean yield. This yield decrease may have occurred due to
delayed emergence, as previously discussed, in lieu of a direct relationship to respiration, but
increased soil respiration could correlate with yield loss if pathogenic soil microbes were
prevalent enough to increase soil respiration measurements. Previous research encountered
difficulties when attempting to identify specific processes responsible for increased soil CO2
measurements (Raich and Mora, 2005).
Fertilizer source significantly affected soil respiration two out of four months in 2013
(data not shown). Treatment O significantly increased soil respiration by 15% – 27% compared
to C and SO in June 2013 and 17% compared to C in July 2013. Increased soil respiration
following organic fertilizer may be due to the organic carbon contributions, the addition of
microbes to the soil biological pool, or both (Chen et al., 1988; Brady and Weil, 1999; Liu and
Ristaino, 2003). Soil respiration following SO was consistently less than O, indicating that the
destruction of naturally-occurring microbes in chicken litter decreased subsequent soil microbial

72
activity. The decrease in respiration following SO compared to O could also be attributed to
approximately 50% less organic carbon. However, treatment I contained no carbon and ranged
from 5% less to 2% more respiration than treatment O. Treatment C resulted in significantly
lower respiration values than O in June and July 2013 and observed values were less than O and
I in all months tested, further corroborating findings by Qiao et al. (2009) that fertilization with
organic or inorganic fertilizer both increased soil respiration. Increased soil respiration following
fertilization could be due in part to increased soybean root growth, increasing the volume of
rhizosphere soil which contains increased microbial activity compared to between-row soil
(Nannipieri et al., 2003). While the addition of organic matter, micronutrients, and bacteria when
using O should be considered as long-term factors with regards to grower decisions regarding
fertilizer application, this study found no adverse effects on soil microbial activity following I
compared to C or O.
Inverse Simpson’s Diversity
A significant interaction among fertilizer, cover crop, and sample timing occurred for
inverse Simpson’s diversity index in 2013. Treatment C had a greater R1 bacterial diversity
following no cover than hairy vetch (Table 8). This may have been caused by increased available
N following hairy vetch compared to no cover resulting in a greater amount of organic N to be
used as an energy source for organic matter decomposition (Mamilov and Dilly, 2002). Past
studies have shown hairy vetch to have allelopathic properties on weeds (Ercoli et al., 2007; Hill
et al., 2007) so chemicals exuded by hairy vetch roots may also impart selective pressure on
some bacterial groups reducing their relative abundance to undetectable amounts. Plots treated
with SO also demonstrated decreased R1 diversity following hairy vetch than oilseed radish or
no cover crop. A significantly greater number of singletons were identified following SO x hairy

73
vetch x R1 (data not shown), which would decrease evenness and also diversity. Treatments O
and I did not differ in diversity between cover crops in 2013, contradicting results of previous
studies using PLFA or DGGE methods stating that organic-based fertilizer sources increased soil
bacterial diversity compared to inorganic sources (Zhong et al., 2010; Kamaa et al., 2011).
Following no cover crop, C and SO had greater R1 diversity than O. Without the effect of cover
crops influencing microbial growth, treatment O likely increased the activity of bacteria capable
of capitalizing on nutrient-rich condition (i.e. copiotrophs). If copiotrophic bacteria dominated
following O application, evenness of the microbial community would have decreased thereby
decreasing diversity as well. Although diversity decreased following treatment O, soybean yield
was greater after O than any other fertilizer in both study years. Since overall community
diversity did not correlate with yield either year, the relative abundance of beneficial bacteria and
functional groups may be more important than community diversity from a crop yield standpoint.

74
Table 3.8. Cover crop and fertilizer source interaction on inverse Simpson’s diversity values (0 –
10-cm) at two soil sample timings, 2013, Lansing, MI.
R1 Harvest
Cover crop
Fertilizer -None- -Radish- -Vetch- -None- -Radish- -Vetch-
Check 386 a A† 329 ab A 268 b AB 35 a A 30 a A 33 a A
Inorganic 370 a AB 315 a A 318 a A 26 a A 26 a A 25 a A
Organic 310 a B 328 a A 327 a A 26 a A 30 a A 22 a A
Sterilized Organic 387 a A 377 a A 241 b B 26 a A 36 a A 30 a A
Significance (P>F)
Cover 0.0144
Fertilizer 0.8356
Origin 0.8177
Timing <.0001
Cover x Fertilizer 0.0120
Origin x Cover 0.4249
Origin x Fertilizer 0.7712
Origin x Cover x Fertilizer 0.9969
Timing x Cover 0.0006
Timing x Fertilizer 0.8363
Timing x Cover x Fertilizer 0.0197
† Means in a row for each sampling time followed by the same lowercase letter are not
significantly different (α=0.05). Means in a column followed by the same uppercase letter are not
significantly different (α=0.05).
In 2014 a significant interaction between sampling time and origin on microbial diversity
occurred (Table 9). Between-row and rhizosphere diversity were significantly different at both
R1 and harvest, with between-row more diverse at R1 and rhizosphere more diverse at harvest.
Soybean roots may have had decreased rhizosphere diversity at R1 due to increased microbial
competition for nutrients or through selection pressure via the release of root exudates. At
harvest, between-row diversity was 18% less compared to R1, possibly due to root senescence
and a deficit of resources for microbial growth. It is also plausible that oligotrophs began to
dominate the between-row soil, decreasing evenness and diversity. Sampling time (i.e. R1 or
harvest) and origin (i.e. rhizosphere or between-row soil) had a strong effect on bacterial
diversity and community membership in the present study. Discrepancies between sampling time

75
and origin are important to determine because while the present study found that changes to the
soil microbial community can occur by altering management practices, the degree and timing of
these changes are critical to determining whether improvements in crop production can be made.
Changes to the microbial community must ultimately affect the rhizosphere to influence crop
growth and yield, and beneficial changes must occur early enough in the growing season to
reduce crop stress and have sufficient time to improve crop yield potential.
Table 3.9. Interaction between soil sampling time and origin on inverse Simpson’s diversity
values (0 – 10-cm), 2014, Lansing, MI. Between-row samples were collected at least 30-cm from
the nearest soybean stem whereas rhizosphere samples were collected within the row between
two adjacent soybean plants.
Sample origin
Sampling time ---Between-row--- ---Rhizosphere---
R1 322 a A† 264 b B
Harvest 278 b A 292 a A
Significance(P>F)
Cover 0.9431
Fertilizer 0.2633
Origin 0.0215
Timing 0.3784
Cover x Fertilizer 0.1866
Origin x Cover 0.3450
Origin x Fertilizer 0.4886
Origin x Cover x Fertilizer 0.9000
Timing x Cover 0.2042
Timing x Fertilizer 0.1529
Timing x Cover x Fertilizer 0.6763
Timing x Origin 0.0003
Timing x Origin x Cover 0.8301
Timing x Origin x Fertilizer 0.0820
†Means in a row followed by the same lowercase letter are not significantly different (α=0.05).
Means in a column followed by the same uppercase letter are not significantly different (α=0.05).
Variance in Phylogenetic Tree Clustering
Shifts in the phylogenetic tree structure of the soil microbial community may be a good
indicator of changes in function diversity, since closely-related microbes are grouped together
more closely on the tree and likely perform similar soil functions than bacteria which are
76
distantly-related. The ‘parsimony’ command in MOTHUR compares samples within predefined
groups to determine whether the two groups were statistically phylogenetically similar or
different. While multiple treatments can be compared at once using this method (e.g. treatment O
within oilseed radish main plots and treatment O within no cover main plots), this does not
indicate a statistical interaction. In 2013 bacterial community structure was significantly different
between oilseed radish and hairy vetch main plots (P = 0.006) and no cover and oilseed radish
main plots (P = 0.005), but no differences were observed between no cover and hairy vetch main
plots (P = 0.357) (data not shown). The parsimony calculator implied that oilseed radish had a
greater effect on the structure of the phylogenetic tree than hairy vetch. When analyzed within
sample time, oilseed radish and hairy vetch at R1 (P < 0.001) and no cover and oilseed radish at
harvest (P = 0.009) significantly differed in community structure. Significantly different initial
bacterial communities within pre-plant samples among cover crop and the lack of end-of-season
community structure differences between hairy vetch and no cover seem to indicate a
diminishing influence of hairy vetch residue as decomposition progressed throughout the
growing season. Rhizosphere and between-row samples were significantly differed within each
cover crop indicating that rhizosphere community structure differed from between-row soil
regardless of cover crop. Oilseed radish and hairy vetch community structure differed
significantly in rhizosphere samples (P = 0.002), but no differences in between-row soil samples
were observed indicating oilseed radish and hairy vetch may have differentially affected the
degree to which the subsequent soybean crop altered rhizosphere community structure.
Community structure was not significantly altered by any fertilizer treatment in 2013.
Combinations of cover crop and fertilizer source had a significant effect on bacterial
community structure in 2014. Within no cover main plots, all three fertilizer sources contained

77
significantly different communities from each other but no treatment differed from the
unfertilized check. Treatment I was significantly different than C (P = 0.05) and SO (P = 0.01)
within hairy vetch main plots, but did not differ from treatment O (P = 0.36). Community
structure only differed for rhizosphere and between-row samples following a hairy vetch cover
crop (P = 0.05) indicating that hairy vetch may have affected the interaction between soybean
roots and rhizosphere bacterial community structure more than oilseed radish or no cover crop.
Fertilizer source had no effect on community structure following oilseed radish indicating that
oilseed radish may impart greater impacts on microbial community structure than hairy vetch or
no cover crop. Each fertilizer differed significantly in community structure from pre-plant
samples except SO (P = 0.08) implying that community structure changes due to SO were less
than the other fertilizers in 2014. Changes in phylogenetic tree structure would likely be
necessary to improve soil health, indicating that treatments which did not alter tree structure
would not be as influential on microbial community function.
Conclusions
Cover crop and fertilizer source affected both soybean growth and soil microbial
composition. Oilseed radish aboveground biomass decomposed earlier than hairy vetch resulting
in less surface plant residue during soybean planting, more uniform emergence, and greater grain
yield. Indicator analysis determined that hairy vetch and oilseed radish each altered unique
genera within the top 1,000 OTUs detected, indicating that selection of cover crop by attributes
(e.g., N-fixing vs. N-scavenging, winter persistence) affected the survival and activity of
different microbial genera in one growing season. When compared to fertilizer source, cover
crops had a greater impact on inverse Simpson’s diversity values. However, soil respiration and
microbial community structure were better indicators of plant productivity than soil microbial

78
diversity in the present study. Therefore, a shift towards investigating the effect of management
decisions on specific beneficial or pathogenic soil microbes rather than overall community
diversity may be warranted in order to determine in-field practices to sustainably increase plant
productivity. Organic-based fertilizer resulted in greater soybean grain yield both study years and
increased soil respiration in seven of eight months. Grain yield, soil microbial diversity, and soil
respiration were not statistically different between inorganic and organic-based fertilizer
additions, implying no adverse effects on microbial activity or soybean yield occurred due to
inorganic fertilization. The sterilized organic treatment resulted in decreased grain yield and soil
respiration, indicating in this study that the destruction of microbes prior to fertilization did not
benefit yield production. These results show that each cover crop and fertilizer differentially
affected soil microbes, and that management decisions may produce variable soil micro-
environments for subsequent cash crops that are not detectable through common soil test
procedures. Further investigation into microbiome/plant interactions and their mechanistic
influence on crop production could lead to custom sub-field prescriptions of fertilizer and/or
cover crops for soil immunization against disease-prone areas and other soil health-related
improvements.

79
REFERENCES

80
REFERENCES
Adeli, A., K.R. Sistani, D.E. Rowe, and H. Tewolde. 2005. Effects of broiler litter on soybean
production and soil N and phosphorus concentrations. Agron. J. 97:314–321.
Ajwa, H.A. and M.A. Tabatabai. 1994. Decomposition of different organic materials in soils.
Biol. Fertil. Soils. 18:175–182.
Almeida Acosta, J.A.d., T.J.C. Amado, A.d. Neergaard, M. Vinther, L.S.d. Silva, and R.d.
Silveira Nicoloso. 2011. Effect of 15N-Labeled Hairy Vetch and N Fertilization in Maize
Nutrition and Yield Under No-Tillage. R. Bras. Ci. Solo, 35:1337-1345.
Andrade, F.H. and P.E. Abbate. 2005. Response of maize and soybean to variability in stand
uniformity. Agron. J. 97:1263–1269.
Anthony, P., G. Malzer, S. Sparrow, and M. Zhang. 2012. Soybean Yield and Quality in Relation
to Soil Properties. Agron. J. 104:1443-1458.
Atkinson, D. and C.A. Watson. 2000. The beneficial rhizosphere: a dynamic entity. Appl. Soil
Ecol. 15:99–104.
Aulakh, M.S., J.W. Doran, D.T. Walters, A.R. Mosier, and D.D. Francis. 1991 Crop residue type
and placement effects on denitrification and mineralization. Soil Sci. Soc. Am. J.
55:1020-1025.
Berg, G. and K. Smalla. 2009. Plant species and soil type cooperatively shape the structure and
function of microbial communities in the rhizosphere. FEMS Microbiol. Ecol. 68:1–13.
Brady, N.C. and R.R. Weil. 1999. Soil organic matter. In: The nature and properties of soils,
446–490. Upper Saddle River, NJ: Prentice Hall.
Buchenauer, H. 1998. Biological control of soil-borne diseases by rhizobacteria. J. of Plant
Diseases and Protection. 105:329–348.
Buyer, J.S., J.R. Teasdale, D.P. Roberts, I.A. Zasada, and J.E. Maul. 2010. Factors affecting soil
microbial community structure in tomato cropping systems. Soil Biol. Biochem. 42:831–
841.
Changere, A. and R. Lal. 1997. Slope position and erosional effects on soil properties and corn
production on a Miamian soil in Central Ohio. J. Sustain. Agric. 11:5–21.
doi:10.1300/J064v11n01_03
Chen, G. and R.R. Weil. 2009. Penetration of cover crop roots through compacted soils. Plant
Soil. 331:31-43.

81
Chen, W., H.A.J. Hoitink, A.F. Schmitthenner, and O.H. Tuovinen. 1988. The role of microbial
activity on the suppression of damping-off caused by Pythium ultimum. Phytopathology.
78:314–322.
Chinnadurai, C., G. Gopalaswamy, and D. Balachandar. 2014. Impact of long-term organic and
inorganic nutrient management on the biological properties and eubacterial community
diversity of the Indian semi-arid Alfisol. Agron. and Soil Sci. 60:531-549.
Cline, G.R. and A.F. Silvernail. 2002. Effect of cover crops, N, and tillage on sweet corn. Hort.
Technology. 12:118-125.
Coleman D.C., D.A. Crossley Jr., and P.F. Hendrix. 2004. Fundamentals of soil ecology.
Burlington, VT: Elsevier.
Combs, S.M. and M.V. Nathan. 1998. Soil Organic Matter. In: J.R. Brown, editor,
Recommended chemical soil test procedures for the North Central Region. North Central
Region Publ. 221 (rev.), Publ. SB 1001. Univ. of Missouri, Columbia. 57-62.
da Rocha, U.N., L. van Overbeek, and J.D. van Elsas. 2009. Exploration of hitherto-uncultured
bacteria from the rhizosphere. FEMS Microbiol. Ecol. 69:313–328.
Danielson, G.A., B.D. Nelson, and T.C. Helms. 2004. Effect of sclerotinia stem rot on yield of
soybean inoculated at different growth stages. Plant Dis. 88:297–300.
Degnan, P.H. and H. Ochman. 2011. Illumina-based analysis of microbial community diversity.
The ISME J., 2011:1–12.
Diacono, M. and F. Montemurro. 2010. Long-term effects of organic amendments on soil
fertility. A review. Agron. Sustain. Dev. 30:401–422.
Donald, P.A. P.B. Allen, D.D. Tyler, K.R. Sistani, H. Tewolde, and E.R. Walker. 2013. Effect of
broiler litter application to soybean crop infested with soybean cyst nematode.
Nematropica. 43(1):24-34.
Duineveld, B.M., G.A. Kowalchuk, A. Keijzer, J.D. van Elsas, and J.A. van Veen. 2001.
Analysis of bacterial communities in the rhizosphere of chrysanthemum via denaturing
gradient gel electrophoresis of PCR-amplified 16S rRNA as well as DNA fragments
coding for 16S rRNA. Appl. Environ. Microbiol. 67:172–178.
Egli, D.B. 1993. Relationship of uniformity of soybean seedling emergence to yield. J. Seed
Technol. 17:22–28.
Ercoli, L., A. Masoni, S. Pampana, and I. Arduini. 2007. Allelopathic effects of rye, brown
mustard and hairy vetch on redroot pigweed, common lambsquarter and knotweed.
Allelopathy J. 19:249–256.
Fahnestock, P., R. Lal, and G.F. Hall. 1996. Land use and erosional effects on two Ohio soils: II.
Crop yields. J. Sustain. Agric. 7:85–100. doi:10.1300/J064v07n02_09

82
Fauci, M.F. and R.P. Dick. 1994. Soil microbial dynamics: short- and long-term effects on
inorganic and organic nitrogen. Soil Sci. Soc. Am. J. 58:801–806.
Fernando, W.G.D., S. Nakkeeran, and Y. Zhang, 2004. Ecofriendly methods in combating
Sclerotinia sclerotiorum (Lib.) de Bary. Dev. Toxicol. Environ. Sci. 1:329–347.
Frank, K., D. Beegle, and J. Denning. 1998. Phosphorus. In: J.R. Brown, editor, Recommended
chemical soil test procedures for the North Central Region. North Central Region Publ.
221 (rev.) Publ. SB 1001. Univ. of Missouri, Columbia. 21–30.
Fravel, D. 2005. Commercialization and implementation of biocontrol 1. Ann. Rev. of Phyt.
43:337–359
Garbeva, P., J.A. van Veen, and J.D. van Elsas. 2004. Microbial diversity in soil: Selection of
microbial populations by plant and soil type and implications for disease suppressiveness.
Ann. Rev. of Phyt. 42:243–270.
Giller, P.S. 1996. The diversity of soil communities, the “poor man's tropical forest'”.
Biodiversity and Conservation. 5:135-168.
Grau, C.R. 1988. Sclerotinia stem rot. In: Compendium of Soybean Diseases, 3rd edition. J. B.
Sinclair and P. A. Backman, eds. APS Press, St. Paul, MN. 56–66.
Haas D. and C. Keel 2003. Regulation of antibiotic production in root-colonizing Pseudomonas
spp. and relevance for biological control of plant disease. Ann. Rev. Phyt. 41:117–153.
Han, G.X., G.S. Zhou, Z.Z. Xu, Y. Yang, J.L. Liu, and K.Q. Shi. 2007. Biotic and abiotic factors
controlling the spatial and temporal variation of soil respiration in an agricultural
ecosystem. Soil Biol. and Biochem. 39:418–425.
Harper, J.E. 1974. Soil and symbiotic nitrogen requirements for optimum soybean production.
Crop Sci. 14:255–260. doi:10.2135/cropsci1974.0011183X001400020026x
Hill, E.C., M. Ngouajio, and M.G. Nair. 2006. Differential response of weeds and vegetable
crops to aqueous extracts of hairy vetch and cowpea. Hort. Sci. 41:695–700.
Hill, E.C., M. Ngouajio, and M.G. Nair. 2007. Allelopathic potential of Hairy Vetch (Vicia
Villosa) and Cowpea (Vigna Unguiculata) methanol and ethyl acetate extracts on weeds
and vegetables. Weed Tech. 21: 437-444.
Hoffman, D.D., G.L. Hartman, D.S. Mueller, R.A. Leitz, C.D. Nickell, and W.L. Pedersen. 1998.
Yield and seed quality of soybean cultivars infected with Sclerotinia sclerotiorum. Plant
Dis. 82, 826–829.
Hu, S.J., A.H.C. Van Bruggen, and N.J. Grünwald, 1999. Dynamics of bacterial populations in
relation to carbon availability in a residue amended soil. Appl. Soil Ecol. 13, 21–30.

83
Ill-Min, C. and A. Joung-Kuk. 1994. Allelopathic Influence of Alfalfa and Vetch Extracts and
Residues on Soybean and Corn. Korean J. Crop Sci. 39(3):295-305.
Inselsbacher, E., N.H.N Umana, F.C. Stange, M. Gorfer, E. Schüller, K. Ripka, S. Zechmeister-
Boltenstern, R. Hood-Novotny, J. Strauss, and W. Wanek. 2010. Short-term competition
between crop plants and soil microbes for inorganic N fertilizer. Soil Biol. and Biochem.
42(2):360-372.
Jesus, E.D.C., E. Susilawati, S.L. Smith, Q. Wang, B. Chai, R. Farris, J.L. Rodrigues, K.D.
Thelen, and J.M. Tiedje. 2010. Bacterial communities in the rhizosphere of biofuel crops
grown on marginal lands as evaluated by 16S rRNA gene pyrosequences. Bioenergy Res.
3(1):20–27.
Kaltenpoth M., W. Göttler, G. Herzner, and E. Strohm. 2005. Symbiotic bacteria protect wasp
larva from fungal infestation. Curr. Biol. 15:475–479.
Kaspar, T.C., D.J. Pulido, T.E. Fenton, T.S. Colvin, D.L. Karlen, D.B. Jaynes, and D.W. Meek.
2004. Relationship of corn and soybean yield to soil and terrain properties. Agron. J.
96:700–709. doi:10.2134/agronj2004.0700
Knapp, B.A., M. Ros, and H. Insam. 2010. Do composts affect the soil microbial community? In:
Insam H, Franke-Whittle I, Goberna M (eds) Microbes at work. Springer, Berlin. 271–
291.
Kozich J.J., S.L Westcott, N.T. Baxter, S.K. Highlander, and P.D. Schloss. 2013. Development
of a dual-index sequencing strategy and curation pipeline for analyzing amplicon
sequence data on the MiSeq Illumina sequencing platform. Appl. and Environ. Microbiol.
79(17):5112-20. Accessed 7 Oct 2015.
Kravchenko, A.N. and D.G. Bullock. 2000. Correlation of corn and soybean grain yield with
topography and soil properties. Agron. J. 92:75–83.
L.M. Carrera, J.S. Buyer, B. Vinyard, A.A. Abdul-Baki, L.J. Sikora, and J.R. Teasdale. 2007.
Effects of cover crops, compost, and manure amendments on soil microbial community
structure in tomato production systems. Appl. Soil Ecol., 37:247–255
Lawley, Y E., R.R. Weil, and J.R. Teasdale. 2011. Forage Radish Cover Crop Suppresses Winter
Annual Weeds in Fall and Before Corn Planting. Agron. J. 103:137-144.
Lazcano, C., M. Gómez-Brandón, P. Revilla, and J. Domínguez. 2013. Short-term effects of
organic and inorganic fertilizers on soil microbial community structure and function.
Biol. Fertil. Soils 49:723-733.
Leggett, M.J., G. McDonnell, S.P. Denyer, P. Setlow, and J.Y. Maillard. 2012. Bacterial Spore
Structures and Their Protective Role in Biocide Resistance. J. of Appl. Microbiol. 113
(2012): 485-98.

84
Lindemann, W.C. and C.R. Glover. 2003. N fixation by legumes. New Mexico State Univ. Coop.
Ext. Serv. Guide A-129. New Mexico State Univ., Las Cruces, NM.
Linn, D.M. and J.W. Doran, 1984. Effect of water-filled pore space on carbon dioxide and
nitrous oxide production in tilled and nontilled soils. Soil Sci. Soc. Am. J., 48(6):1267-
1272.
Liu, B. and J.B. Ristaino. 2003. Microbial community structure in soils from organic and
conventional agroecosystems. Phytopathology. 96:53.
Lu, Y., K. Watkins, J.R. Teasdale, and A. Abdul-Baki. 2000. Cover crops in sustainable food
production. Food Rev. Int. 16:121–157.
Lupwayi, N.Z., W.A. Rice, and G.W. Clayton. 1998. Soil microbial diversity and community
structure under wheat as influenced by tillage and crop rotation. Soil Biol. Biochem.
30:1733-1741.
Mamilov, A.S. and O.M. Dilly. 2002. Soil microbial eco-physiology as affected by short-term
variations in environmental conditions. Soil Biol. Biochem. 34:1283–1290.
Margalef, R. 1958. Information theory in ecology. Gen. Syst. 3:36-71.
Marschner, P., E. Kandeler, and B. Marschner. 2003. Structure and function of the soil microbial
community in a long-term fertilizer experiment. Soil Biol. Biochem. 35:453–461.
Marschner, P., G. Neumann, A. Kania, L. Weiskopf, and R. Liebere. 2002. Spatial and temporal
dynamics of the microbial community structure in the rhizosphere of cluster roots of
white lupin (Lupinus albus L.). Plant Soil. 246:167–174.
McKinley, V. L. and J. R. Vestal. 1984. Biokinetic analyses of adaptation and succession:
Microbial activity in composting municipal sewage sludge. Appl. Environ. Microbiol.
47:933–941.
Murphy D.V., E.A. Stockdale, P.R. Poulton, T.W. Willison, and K.W.T. Goulding. 2007.
Seasonal dynamics of carbon and nitrogen pools and fluxes under continuous arable and
ley-arable rotations in a temperate environment. Eur. J. Soil Sci. 58:1410–1424.
Nannipieri, P., J. Ascher, M.T. Ceccherini, L. Landi, G. Pietramellara, and G. Renella. 2003.
Microbial diversity and soil functions. Eur. J. of Soil Sci. 54:655–670.
NASS. 2015. National Agricultural Statistics Service. USDA, Washington D.C.
http://quickstats.nass.usda.gov/ (accessed 5 Jan. 2016)
Norikuni, O., K. Toshihiko, O. Keiki, and T. Masako. 2010. Maintenance of soybean yield with
reduced phosphorus application by previous cropping with mycorrhizal plants. Soil Sci.
and Plant Nutrition. 56:824-830.

85
O’Reilly, K.A., D.E. Robinson, R.J. Vyn and L.L. Van Eerd. 2011. Weed populations, sweet
corn yield, and economics following fall cover crops. Weed Technol. 25:374-384.
O'Reilly, K.A., J.D. Lauzon, R.J. Vyn, and L.L. Van Eerd. 2012. Nitrogen cycling, profit
margins and sweet corn yield under fall cover crop systems. Can. J. Soil Sci. 92:353-365.
Peacock A.D., M.D. Mullen, D.B. Ringelberg, D.D. Tyler, D.B. Hedrick, P.M. Gale, and D.C.
White. 2001. Soil microbial community responses to dairy manure or ammonium nitrate
applications. Soil Biol. Biochem. 33:1011–1019.
Qiao, Y., S. Miao, X. Han, and B. Xing. 2009. Root and microbial contributions to soil
respiration during a soybean growing season Commun. Soil Sci. Plant Anal. 40:1658–
1673.
Raich J.W. and G. Mora. 2005. Estimating root plus rhizosphere contributions to soil respiration
in annual croplands. Soil Sci. Soc. Am. J. 69:634–639
Reddy, K.N. 2001. Effects of Cereal and Legume Cover Crop Residues on Weeds, Yield, and
Net Return in Soybean (Glycine max). Weed Technol. 15:660-668.
Rengel, Z. 2002. Genetic control of root exudation. Plant and Soil. 245:59–70.
Ros, M., S. Klammer, B. Knapp, K. Aichberger, and H. Insam. 2006. Longterm effects of
compost amendment of soil on functional and structural diversity and microbial activity.
Soil Use Manag. 22:209–218.
Rosenzweig, N., J.M. Bradeen, Z.J. Tu, S.J. McKay, and L.L. Kinkel. 2013. Rhizosphere
bacterial communities associated with long-lived perennial prairie plants vary in
diversity, composition, and structure. Can. J. Microbiol. 59:494–502
Rosenzweig, N., J. Tiedje, J.I. Quensen, Q. Meng, and J. Hao. 2012. Microbial communities
associated with potato common scab suppressive soil determined by pyrosequencing
analyses. Plant Dis. 96:718–725.
Rosenzweig, N. 2014. The importance and application of bacterial diversity in sustainable
agricultural crop production ecosystems. In Bacterial Diversity in Sustainable
Agriculture. Springer International Publishing. 341-367.
Saito, A., S. Tanabata, T. Tanabata, S. Tajima, M. Ueno, S. Ishikawa, N. Ohtake, K. Sueyoshi,
and T. Ohyama. 2014. Effect of Nitrate on Nodule and Root Growth of Soybean (Glycine
Max (L.) Merr.). Int. J. of Mol. Sci. 15(3):4464-4480.
Sawchik, J. and A.P. Mallarino. 2008. Variability of soil properties, early phosphorus and
potassium uptake, and incidence of pests and weeds in relation to soybean grain yield.
Agron. J. 100:1450–1462. doi:10.2134/agronj2007.0303
Schloss, P.D., S.L. Westcott, T. Ryabin, J.R. Hall, M. Hartmann, E.B. Hollister, R.A.
Lesniewski, B.B. Oakley, D.H. Parks, C.J. Robinson, and J.W. Sahl. 2009. Introducing

86
mothur: Open-source, platform-independent, community-supported software for
describing and comparing microbial communities. Appl. Environ. Microbiol.
75(23):7537-41.
Slaton, N.A., T.L. Roberts, B.R. Golden, W.J. Ross, and R.J. Norman. 2013. Soybean response
to phosphorus and potassium supplied as inorganic fertilizer or poultry litter. Agron. J.
105:812–820. doi:10.2134/agronj2012.0490
Stark, J.M. and M.K. Firestone. 1995. Mechanisms for soil moisture effects on activity of
nitrifying bacteria. Appl. and Environ. Microbiol. 61:218-221.
Stivers-Young, L. 1998. Growth, N Accumulation, and Weed Suppression by Fall Cover Crops
Following Early Harvest of Vegetables. Hort. Sci. 33:60-63.
Sylvia, D.M. and D.O. Chellemi. 2001. Interactions among root-inhabiting fungi and their
implications for biological control of root pathogens. Advances in Agron. 73:1–33.
Tien, H.H., T.M. Hien, M.T. Son, and D. Herridge. 2002. Inoculation and N2 Fixation of
Soybean and Mungbean in the Eastern Region of South Vietnam. In: Inoculants and N at
Legumes in Vietnam, Herridge, D. (Ed.). Australian Centre for International Agricultural
Research, Australia. 29-36.
U. Baetz and E. Martinoia. 2013. Root exudates: the hidden part of plant defense. Trends Plant
Sci. 19:90–98.
van Overbeek, L and J.D. van Elsas. 2008. Effects of plant genotype and growth stage on the
structure of bacterial communities associated with potato (Solanum tuberosum L.). FEMS
Microbiol. Ecol. 64:283–296.
Varco, J.J., W.W. Frye, M.S. Smith, and C.T. MacKown. 1993. Tillage effects of legume
decomposition and transformation of legume and fertilizer nitrogen-15. Soil Sci. Soc.
Am. J. 57:750-756.
Wang, G., M. Ngouajio, and D.D. Warncke. 2008. Nutrient cycling, weed suppression, and
onion yield following brassica and sorghum sudangrass cover crops. Hort. Technol.
18:68-74.
Wang, Q.R., Y.C. Li, and W. Klassen. 2007. Changes of soil microbial biomass carbon and
nitrogen with cover crops and irrigation in a tomato field. J. of Plant Nutrition. 30:623-
639.
Warncke, D. and J.R. Brown. 1998. Potassium and other basic cations. In: J.R. Brown, editor,
Recommended chemical soil test procedures for the North Central Region. North Central
Region Publ. 221 (rev.), Publ. SB 1001. Univ. of Missouri, Columbia. 31–33.
Watson, M.E. and J.R. Brown. 1998. pH and lime requirement. In: J.R. Brown, editor,
Recommended chemical soil test procedures for the North Central Region. North Central
Region Publ. 221 (rev.) Publ. SB 1001. Univ. of Missouri, Columbia. 13-16.

87
Welch, L.F., L.V. Boone, C.G. Chambliss, A.T. Christiansen, D.L. Mulvaney, M.G. Oldham,
and J.W. Pendelton. 1973. Soybean yields with direct and residual nitrogen fertilization.
Agron. J. 65:547–550. doi:10.2134/agronj1973.00021962006500040007x
Whipps, J. M. 2001. Microbial interaction and biocontrol in the rhizosphere. J. Exp. Bot.
52:487–511.
White, C.M. and R.R. Weil. 2011. Forage radish cover crops increase soil test phosphorus
surrounding radish taproot holes. Soil Sci. Soc. Am. J. 75:121–130.
Williams, S.M. and R.R. Weil. 2004. Crop cover root channels may alleviate soil compaction
effects on soybean crop. Soil Sci. Soc. Am. J. 68:1403–1409.
Xu, Y., G. Wang, J. Jin, J. Liu, Q Zhang, and X. Liu. 2009. Bacterial communities in soybean
rhizosphere in response to soil type, soybean genotype, and their growth stage. Soil Biol.
Biochem. 41:919–925.
Yang, C.H. and D.E. Crowley. 2000. Rhizosphere microbial community structure in relation to
root location and plant iron nutrition status Appl. Environ. Microbiol., 66:345–351.
Yang, X.B., P. Lundeen, and M.D. Uphoff, 1999. Soybean varietal response and yield loss
caused by Sclerotinia sclerotiorum. Plant Dis. 83:456–461.
Zhong, W.H. and Z.C. Cai. 2007. Long-term effects of inorganic fertilizers on microbial biomass
and community functional diversity in a paddy soil derived from quaternary red clay.
Appl. Soil Ecol. 36:84–91.
Zhong, W.H., T. Gu, W. Wang, B. Zhang, X.G. Lin, Q.R. Huang and W.S. Shen. 2010. The
effects of mineral fertilizer and organic manure on soil microbial community and
diversity. Plant Soil. 326:511–522.