Ecology Biology 30. Ecology Study of Ecosystems Study of Ecosystems Abiotic & Biotic factors...
78
Ecology Ecology Biology 30 Biology 30
-
Upload
sheena-white -
Category
Documents
-
view
234 -
download
2
Transcript of Ecology Biology 30. Ecology Study of Ecosystems Study of Ecosystems Abiotic & Biotic factors...

EcologyEcology
Biology 30Biology 30

EcologyEcology Study of Study of EcosystemsEcosystems Abiotic & Biotic factors interactingAbiotic & Biotic factors interacting Biotic Factors include populations & communitiesBiotic Factors include populations & communities
Population
•Same species
•Same place
•Same time
Community
•Groups of pops interacting

Same species: Same place: Same time!

Can you explain the difference between Can you explain the difference between
a population and a community?a population and a community?
The definition for a The definition for a populationpopulation??
The definition for a The definition for a communitycommunity??

Biotic and Abiotic Factors?
Abiotic factors are the non-living
components of an ecosystem
Biotic factors are the living
components of an ecosystem

Can you tell me…Can you tell me…
The difference between The difference between abioticabiotic and and bioticbiotic factors in an ecosystem?factors in an ecosystem?
An example of an An example of an abiotic factorabiotic factor?? An example of a An example of a biotic factorbiotic factor??
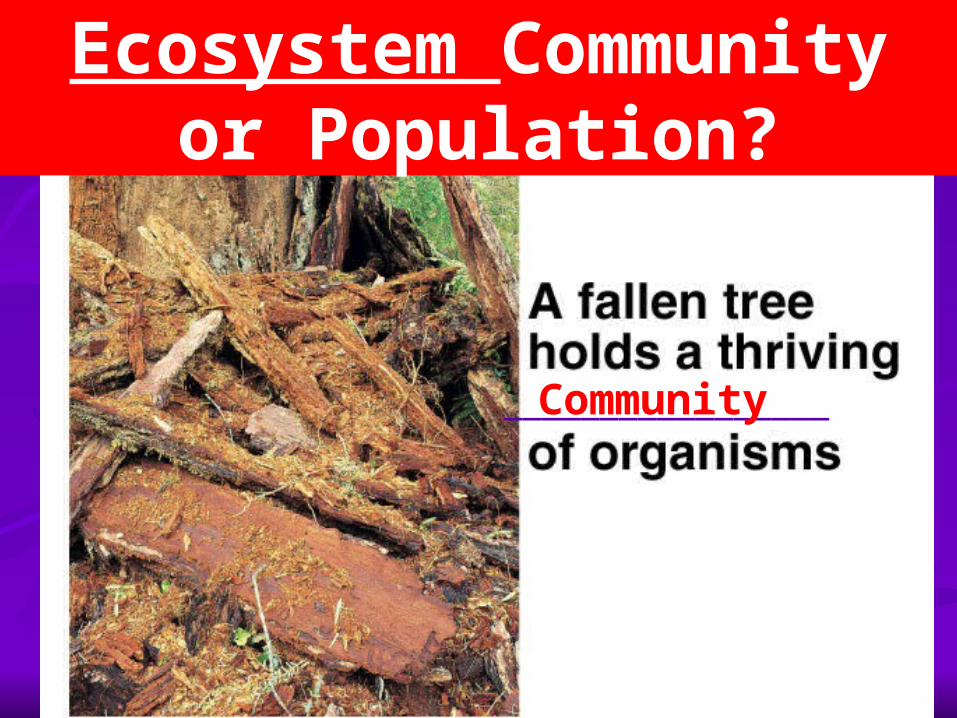
Ecosystem Communityor Population?
_________________Community

Why is the picture in the previous slide an example Why is the picture in the previous slide an example of of a a communitycommunity and not an example of a and not an example of a population?population?

PopulationsPopulations Variables we will consider:Variables we will consider:
Geographic RangeGeographic Range HabitatHabitat Ecological NicheEcological Niche Population DistributionPopulation Distribution Population SizePopulation Size Population DensityPopulation Density Population Growth Rate and PatternsPopulation Growth Rate and Patterns
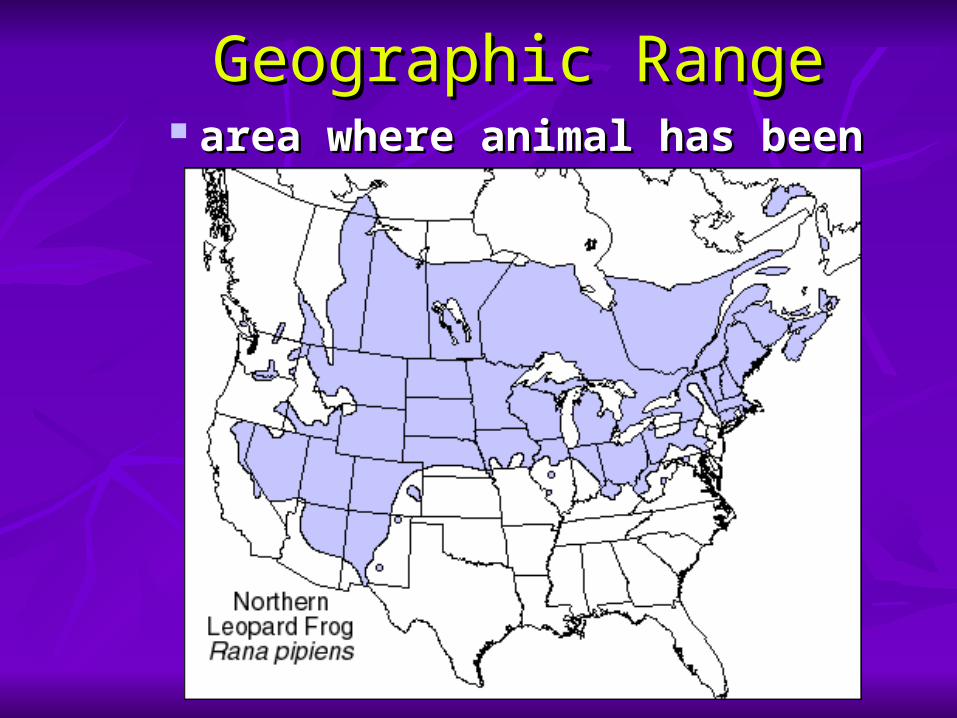
Geographic RangeGeographic Range area where animal has been seenarea where animal has been seen

Fire Ant RangeGeographic range can change over time
due to abiotic factors.

Range Changes in Moose Populations
How has the geographic range of moose changed since the 1870’s??

areaarea where the population lives where the population lives where environmental conditions are best where environmental conditions are best
for survivalfor survival
Habitat

How does an organism’s geographic range How does an organism’s geographic range differ from its habitat?differ from its habitat?

Ecological NicheEcological Niche RoleRole of the species in the community of the species in the community Includes ALL Includes ALL biotic and abioticbiotic and abiotic factors a factors a
species needs to survivespecies needs to survive
Each group has a different role to minimize competition

Populations co-exist only if each group occupies a different niche

Explain the meaning of the term Explain the meaning of the term ecological nicheecological niche..

Population Distribution
Uniform
Clumped

Population DistributionPopulation Distribution Determined largely by habitat preferenceDetermined largely by habitat preference Divided into three patterns:Divided into three patterns: 1. 1. Clumped Clumped - - individuals grouped in patches due to individuals grouped in patches due to
certain environmental factors (e.x. trees clump on south certain environmental factors (e.x. trees clump on south slopes of river valleys b/c less direct sunlight and slopes of river valleys b/c less direct sunlight and sturdier soils)sturdier soils)
2. Random- not very common- biotic and abiotic factors have little effect

3. 3. UniformUniform competition among individuals for resources competition among individuals for resources
results in regular spacingresults in regular spacing

What is the difference between What is the difference between clumped, random clumped, random and uniform population distributionand uniform population distribution??
What What factorsfactors are responsible for creating clumped, are responsible for creating clumped, random and uniform population distributions?random and uniform population distributions?

Population SizePopulation Size Number of organisms of Number of organisms of samesame type in type in
samesame place, at place, at samesame time time There are There are 2000 students2000 students at at CentreCentre HighHigh
during the during the 2004/52004/5 school year. school year. Can be determined by exact count or Can be determined by exact count or
estimation!!estimation!!

Population DensityPopulation Density Describes number of organisms in a defined Describes number of organisms in a defined
areaarea eg. Snow geese at Beaver Hills = eg. Snow geese at Beaver Hills = # of geese per hectare# of geese per hectare Density (D) calculated by dividing Density (D) calculated by dividing total total
numbernumber (N) by amount of (N) by amount of space space occupied (S) occupied (S) by the populationby the population

What is the difference between What is the difference between population sizepopulation size and and population densitypopulation density??

Density ExampleDensity Example

If 200 lemmings are living in a 25 hectare (ha) If 200 lemmings are living in a 25 hectare (ha) area of tundra, what is the population density area of tundra, what is the population density of this area?of this area? Use the formula Use the formula D = N/SD = N/S

Growth RateGrowth Rate After finding the population density, we After finding the population density, we
can find the rate of change over timecan find the rate of change over time
Change in number
Change in timeRate of growth

Density Change exampleDensity Change example In 1993, the mouse population in my In 1993, the mouse population in my
backyard was 50 mice/acre. After three backyard was 50 mice/acre. After three years, various control measures had been in years, various control measures had been in place, and the population dropped to 10 place, and the population dropped to 10 mice/acre. Calculate the rate of density mice/acre. Calculate the rate of density changechange..

When arriving at their summer cabin, the Smiths When arriving at their summer cabin, the Smiths discovered 10,000 cockroaches roaming throughout discovered 10,000 cockroaches roaming throughout their 1000 mtheir 1000 m22 cabin. After 1 week, the exterminators cabin. After 1 week, the exterminators were able to control the situation and reduced the were able to control the situation and reduced the cockroach population to 10 per 1000 mcockroach population to 10 per 1000 m22. Calculate the . Calculate the rate of density change.rate of density change.

Population GrowthPopulation Growth Determined by four Determined by four
factors:factors: NatalityNatality MortalityMortality ImmigrationImmigration EmmigrationEmmigration

Population GrowthPopulation Growth
Also known as per capitagrowth rate

CalculationCalculation Using this table, calculate CGR for Using this table, calculate CGR for
Sandhill cranes:Sandhill cranes:


Puffins are small marine birds Puffins are small marine birds found off the coast of Atlantic found off the coast of Atlantic Canada. Calculate the population Canada. Calculate the population growth rate of a puffin colony growth rate of a puffin colony based on the following population based on the following population in 1999.in 1999.
Original population = 200 000Original population = 200 000
Natality = 15 000Natality = 15 000
Mortality = 10 000Mortality = 10 000
Immigration = 175 000Immigration = 175 000
Emigration = 160 000Emigration = 160 000

Calculate the population density of shrews Calculate the population density of shrews per mper m22, if an average of 7.8 shrews are , if an average of 7.8 shrews are found in an area 14 m wide by 20 m.found in an area 14 m wide by 20 m.
Density Problem

Calculate the per capita growth rate of a mouse Calculate the per capita growth rate of a mouse population if the original population size is 34 and population if the original population size is 34 and
over a period of a week, 5 die, 8 are born, 12 over a period of a week, 5 die, 8 are born, 12
immigrate into and 7 emigrate out of the areaimmigrate into and 7 emigrate out of the area ..
CGR Calculation

Dynamic EquilibriumDynamic Equilibrium Present in mature ecosystemsPresent in mature ecosystems Characterized by long term balanceCharacterized by long term balance Pops remain relatively stable over timePops remain relatively stable over time Great biodiversity = stabilityGreat biodiversity = stability Can be compared with homeostasisCan be compared with homeostasis

Define dynamic equilibrium.Define dynamic equilibrium.

2 population types:2 population types:1. 1. Open populationsOpen populations::
immigration & emigration occursimmigration & emigration occurs
2. 2. Closed populationsClosed populations:: Density changes are result of natality Density changes are result of natality
and mortality onlyand mortality only No immigration or emigrationNo immigration or emigration eg. Game preserveseg. Game preserves

What is the difference between What is the difference between open and open and closed populationsclosed populations??

Growth CurveGrowth Curve Graph showing changes in a population over Graph showing changes in a population over
time.time. X = time (independent or X = time (independent or manipulatedmanipulated
variable)variable) Y = density or # of organisms (dependent or Y = density or # of organisms (dependent or
responding responding variable)variable)

Exponential Pop Growth

Growth Curve for Closed Growth Curve for Closed SystemSystem
4 phases:4 phases: 1. 1. Lag phaseLag phase…slow…not enough …slow…not enough reproducing organismsreproducing organisms 2. 2. Growth phaseGrowth phase….exponential increase….exponential increase 3. 3. Stationary phaseStationary phase….natality= mortality….natality= mortality 4. 4. Death phaseDeath phase…decline…decline
Not always presentNot always present

Bacterial Growth Curve Closed population
4 distinct phases

Draw a growth curve for a closed population. Draw a growth curve for a closed population. Label and define the four stages of this curve.Label and define the four stages of this curve.

Growth Curve for Open SystemsGrowth Curve for Open Systems
When a limiting factor is introduced to a When a limiting factor is introduced to a population, curve results in an population, curve results in an “S” shape“S” shape Typical of an organism placed in a new environmentTypical of an organism placed in a new environment
As organisms respond to increased nutrients, As organisms respond to increased nutrients, natalitynatality increases. increases. Equilibrium is established again and curve levels offEquilibrium is established again and curve levels off
New New carrying capacitycarrying capacity (max. # of individuals (max. # of individuals environment can support)environment can support)

Define carrying capacity.Define carrying capacity. When does a population growth curve of an When does a population growth curve of an
open system show an “S shape”?open system show an “S shape”?

Population Growth Curves
Click on the link aboveClick on the link above Read the instructions and hit the “run applet” buttonRead the instructions and hit the “run applet” button Set the carrying capacity to 1000Set the carrying capacity to 1000 Set the birth rate to 1.5Set the birth rate to 1.5 Hit RUNHit RUN View the graph and draw this in your notesView the graph and draw this in your notes Have you simulated an open or a closed population?Have you simulated an open or a closed population? Change the parameters and try it again!Change the parameters and try it again!

Population Curves

Human Population GrowthHuman Population Growth

Population Curves

Population Curves

How could you describe the population growth How could you describe the population growth of humans in the past 500 years?of humans in the past 500 years? Hint: one word that begins with an ‘e’Hint: one word that begins with an ‘e’

Population Explosion & Crashes
What h
appened?
Bottle
neck

Describe the bottleneck effect.Describe the bottleneck effect.

Boom and Bust Cycles

What trends do you see in the population What trends do you see in the population curve for Soay Sheep that give its curve for Soay Sheep that give its characteristic shape of “boom and bust”?characteristic shape of “boom and bust”?

Survivorship Curves

Population Curves

Population Curves

Population HistogramsPopulation Histograms
Wide base…fast growthNarrow base….decline
What information is given in a population What information is given in a population histogram?histogram?
What shape would a histogram look like if it What shape would a histogram look like if it were representing an declining population? A were representing an declining population? A stabilized population? A young population?stabilized population? A young population?

More HistogramsMore HistogramsWhat are these graphs showing?
1. Which country demonstrates
a very high reproductive rate?
2. Which country represents a stabilized population?

Histograms
Show Age Structure of Pop

What do each of the histograms on slides 63 to What do each of the histograms on slides 63 to 64 tell you?64 tell you?
What trends do you see in the population What trends do you see in the population curves on slides 63 to 64?curves on slides 63 to 64?

Biotic PotentialBiotic Potential Max. # of offspring produced in ideal Max. # of offspring produced in ideal
conditionsconditions Regulated by four factors:Regulated by four factors:
offspringoffspring - max #/birth - max #/birth survival capacitysurvival capacity – chance that offspring – chance that offspring
will reach reproductive agewill reach reproductive age procreationprocreation - # times/year organism - # times/year organism
reproducesreproduces maturitymaturity - age when reproduction begins - age when reproduction begins

Environmental ResistanceEnvironmental Resistance All factors that limit pop. All factors that limit pop.
growthgrowth Can be biotic or abioticCan be biotic or abiotic Examples include…….Examples include…….
Food, water, space, disease, predation, natural Food, water, space, disease, predation, natural disasters, availability of mates, etcdisasters, availability of mates, etc

Environmental Resistance
In a fresh water habitat
Define biotic potential and environmental Define biotic potential and environmental resistance. Give an example for resistance. Give an example for environmental resistance.environmental resistance.

Limiting FactorsLimiting Factors Affect population size!Affect population size!
flood, fire, extreme cold, disease, starvation, flood, fire, extreme cold, disease, starvation, predationpredation
Law of the minimum Law of the minimum various substances are required for growth.various substances are required for growth. the one with the lowest concentration will limit the one with the lowest concentration will limit
growth ( known as limiting factor)growth ( known as limiting factor)
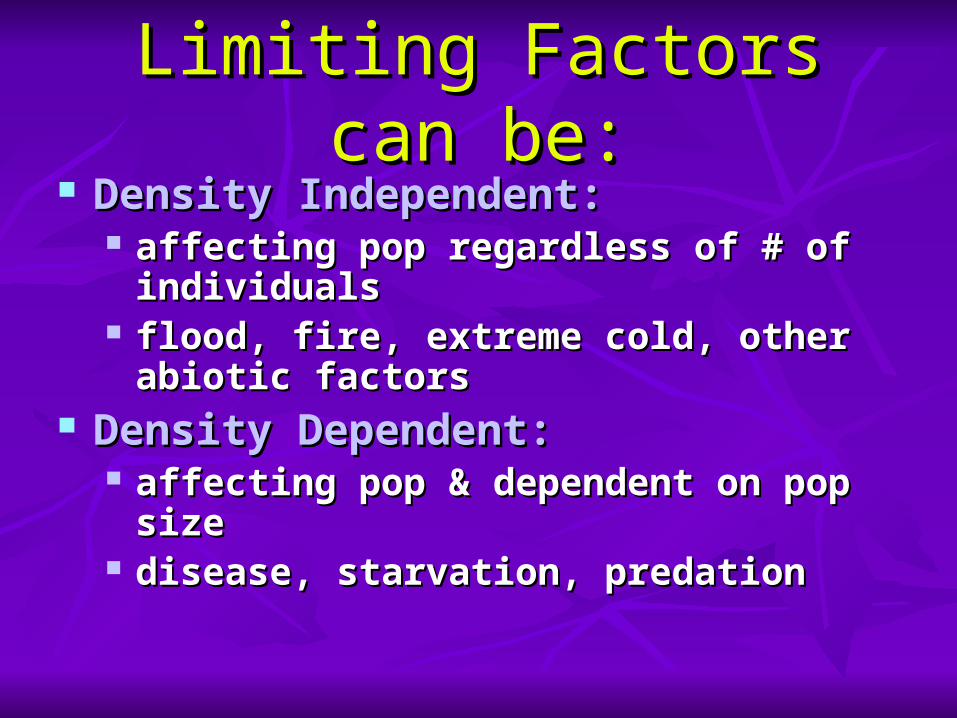
Limiting Factors can be:Limiting Factors can be: Density Independent:Density Independent:
affecting pop regardless of # of individualsaffecting pop regardless of # of individuals flood, fire, extreme cold, other abiotic factorsflood, fire, extreme cold, other abiotic factors
Density Dependent:Density Dependent: affecting pop & dependent on pop sizeaffecting pop & dependent on pop size disease, starvation, predationdisease, starvation, predation

State the law of the minimum.State the law of the minimum. Define limiting factors.Define limiting factors. What are some examples of limiting factors?What are some examples of limiting factors?

Name the Density Dependent Factor!

Pops can also be r or K SelectedPops can also be r or K Selected
r - selected
High Reproductive
Rate
K - selected
Low Reproductive
RateAlmost atCarryingCapacity

K- selected Populations

r- selected Populations

Differentiate between r and K-strategies. Give Differentiate between r and K-strategies. Give 2 examples of the types of organisms that use 2 examples of the types of organisms that use each of these strategies.each of these strategies.