Identification of Adulteration or origins of whisky and ...
23
Identification of Adulteration or origins of whisky and alcohol with the Electronic Nose Dr Vincent Schmitt, Alpha M.O.S AMERICA [email protected] www.alpha-mos.com Alpha M.O.S. Eastern Analytical Symposium, November 2004
Transcript of Identification of Adulteration or origins of whisky and ...

Identification of Adulteration or origins of whisky and alcohol with
the Electronic Nose
Dr Vincent Schmitt,Alpha M.O.S [email protected]
Alpha M.O.S.Eastern Analytical Symposium, November2004

Slide 2
Alcoholic beverage challenges
Taste and smell in the beverage industry are important for the success of the product.
Aroma and taste reflect the quality point of view, for example:- the vineyard- the type of distillation- the age- the contamination- the packaging

Slide 3
Taste and odor analysis are currently carried out by sensory panels. Actually, it is extremely problematic for production control. It is also very difficult to screen a large number of samples in one shot.
Alcoholic beverage challenges
Slide 4
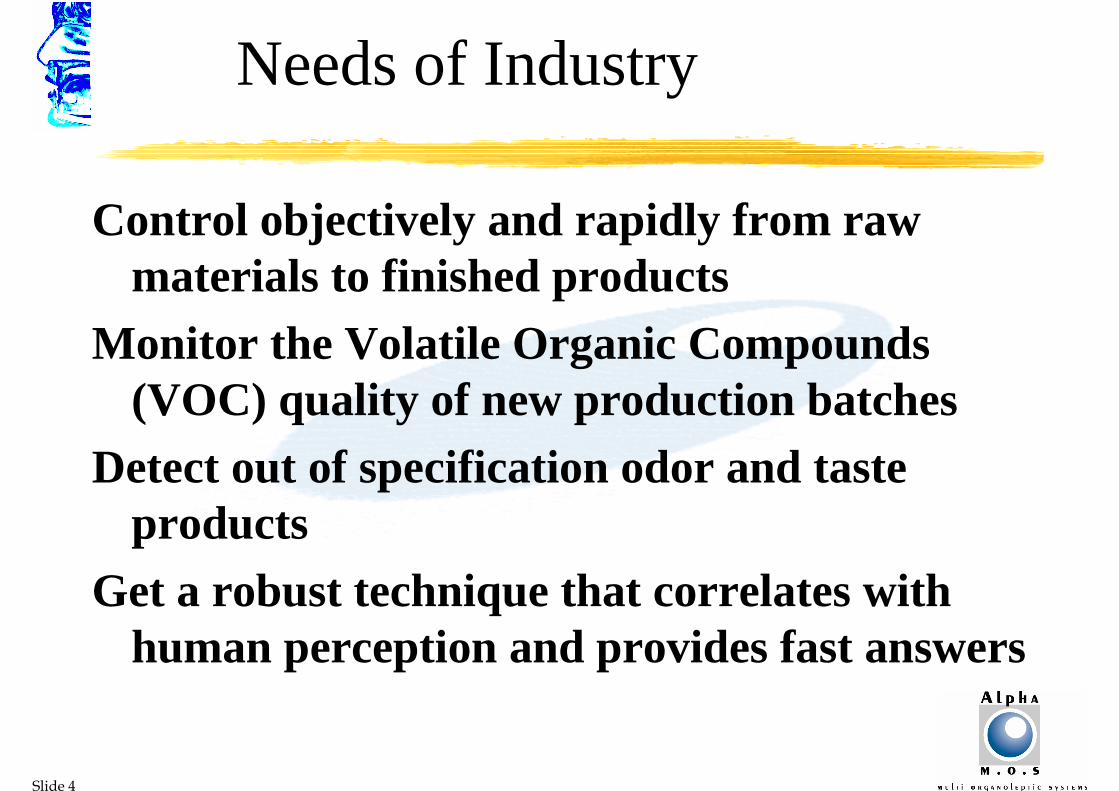
Needs of Industry
Control objectively and rapidly from raw materials to finished products
Monitor the Volatile Organic Compounds (VOC) quality of new production batches
Detect out of specification odor and taste products
Get a robust technique that correlates with human perception and provides fast answers

Slide 5
Human nose and Sensing systemsimulation
Recognized as BRAZILIAN
Comparison of the odorby pattern recognition
DataProcessingAcquisition
Raw signals Processed signal Data treatment
RESULTS
Brain NeuronsSmellOdor
RECOGNIZED ASBRAZILIAN

Slide 6
Electronic Noses
The advantages of this new technique:
� Volatile and odor measurement systems
� Both qualitative and quantitativeresults
� Solid, liquid or gaseous samples
� Correlation with human perception
� Fast(a few minutes per sample)
� Robust
� Very little sample preparation

Slide 7
αPROMETHEUS
A development platform combining 2 technologies:
• ααααFOX - Sensor array system
Flexible sampling system, up to 18 sensors, QC or laboratory tool
• ααααKronos - Fingerprint MS
High discrimination power, SCAN and SIM available, qualitative and quantitative

Slide 8
Fingerprint Mass Spectrometry (FMS) Principle

Slide 9
Multi organolepticsystem: principle of one analysis
Sampler forvolatile analysis
Fingerprint measurement
Multivariate analysis
Printingthe report
Crimping the sample in a vial and headspace generation
Raw data are transferred in a Library Prediction
Results
Fingerprint identification withchemometrics
Sampling Data Processing
Headspace
SPDE SPDE (PDMS/AC)(PDMS/AC)

Slide 10
Multivariate Statistics Tools
Data Processing
Discrimination Quantification Quality control
Slide 11
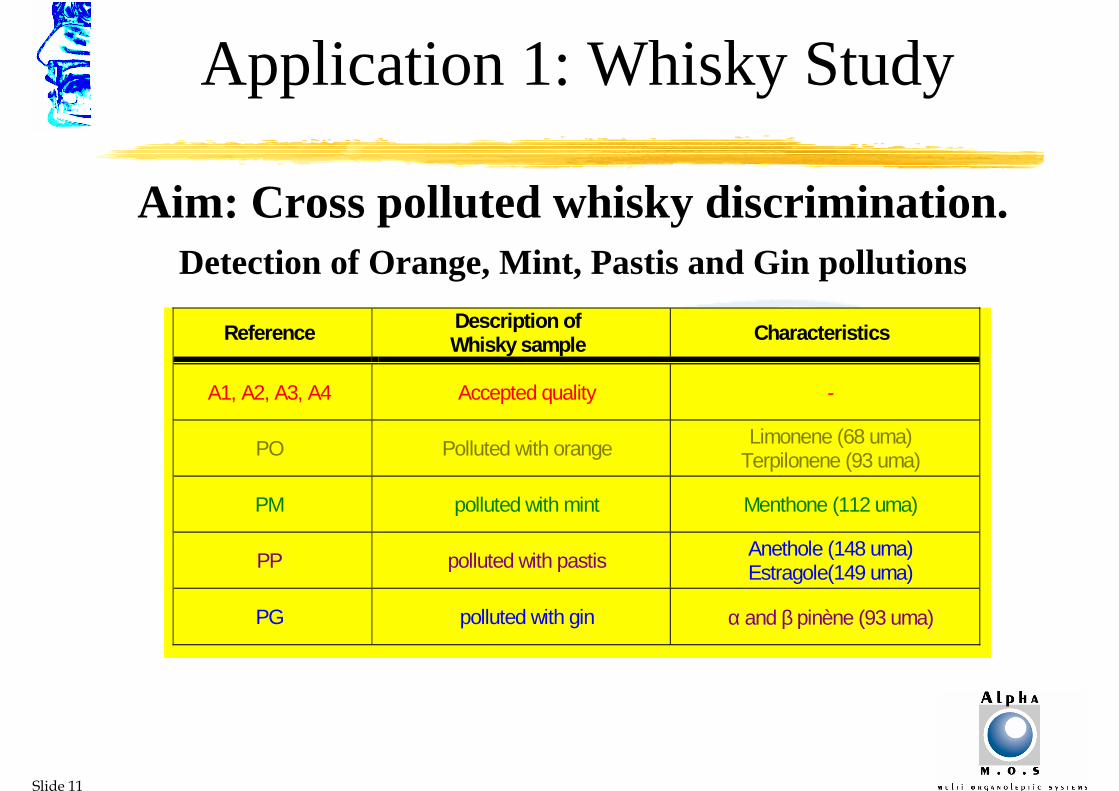
Application 1: Whisky Study
Aim: Cross polluted whisky discrimination. Detection of Orange, Mint, Pastis and Gin pollutions
Reference Description ofWhisky sample Characteristics
A1, A2, A3, A4 Accepted quality -
PO Polluted with orange Limonene (68 uma)Terpilonene (93 uma)
PM polluted with mint Menthone (112 uma)
PP polluted with pastisAnethole (148 uma)Estragole(149 uma)
PG polluted with gin α and β pinène (93 uma)

Slide 12
System configuration
• ααααKronos - Fingerprint Mass Spectrometry
New automated dynamic extraction technique
2,5mL HeadspaceSyringe
Internal coating
Steel needle
Conical tip withside port
56mm
Cross-sectionview
Specific syringe coating
• Solid Phase Dynamic Extraction (SPDE) Option

Slide 13
Analytical parameters
Sample preparationQuantity of sample in the vial 0.5ml whisky / 0.5ml waterTotal volume of the vial 10 ml
Headspace generationHeadspace generation time 15 minHeadspace generation temperature 70°C
SPDE extraction / injectionSPDE Syringe PDMS/AC syringeStroke Number 80 strokes / 2500µµµµl pumped / 500µµµµl/secAnalysis time 15 minPredesorption time delay 15 sec, 0.6 ml N2 injected / 50 µµµµL/sec

Slide 14
Application: results with the Fingerprint Mass Spectrometry
Anis polluted sample MSThe chemical compounds characteristic of Anis are clearly detected (anethole and estragole respectively mass 147 and 148).
SPDE SPDE (PDMS/AC)(PDMS/AC)
Anetholeestragole
Calculation type RSD (%)1 - 55 uma peak 1.72 - TIC average 3.0
In order to validate the analytical parameters the Residual Standard Deviation has been computed on one mass 55 and on the TIC (Total Ion Current). In this case, an excellent reproducibility is obtained.
Clear detection of Anis characteristic massesExcellent repeatability of the measurements
Slide 15
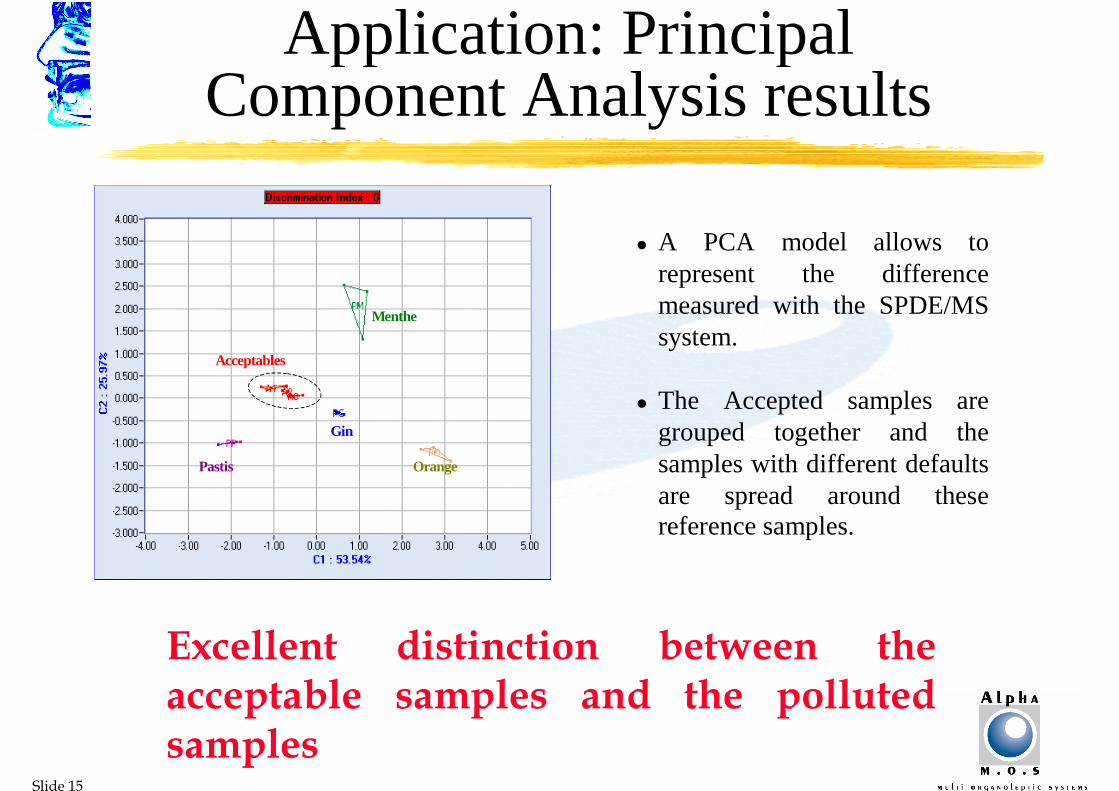
Application: Principal Component Analysis results
Acceptables
OrangePastis
Gin
Menthe
� A PCA model allows to represent the difference measured with the SPDE/MS system.
� The Accepted samples are grouped together and the samples with different defaults are spread around these reference samples.
Excellent distinction between the acceptable samples and the polluted samples

Slide 16
Application 2: Wine packaging selection
Aim: Study the shelf life of wine during eight months in two different packagings: Glass bottle (B) and Can (C).
Sample designation Alpha-MOSReference
Red wine in bottle – 1 month R_B_1_565Red wine in bottle – 2 month R_B_2_605Red wine in bottle – 3 month R_B_3_074Red wine in bottle – 4 month R_B_4_998Red wine in bottle – 5 month R_B_5_087Red wine in bottle – 6 month R_B_6_817Red wine in bottle – 7 month R_B_7_332Red wine in bottle – 8 month R_B_8_928Red wine in can – 1 month R_C_1_656Red wine in can – 2 month R_C_2_746Red wine in can – 3 month R_C_3_481Red wine in can – 4 month R_C_4_018Red wine in can – 5 month R_C_5_953Red wine in can – 6 month R_C_6_337Red wine in can – 8 month R_C_8_557

Slide 17
Analytical conditions
Sample preparationQuantity of product in vial 2 grVolume of the vial 10 ml
Head-space generation parametersGeneration time 5 min.Generation temperature 65 °C
Head-space injection parametersInjected volume 5000 µlInjection speed 150 µl/sSyringe temperature 70 °C
Acquisition parameters KRONOSMode ScanScan range 50-110Acquisition time 90 secondsAccuracy 25
System configuration: ααααKronos - Fingerprint Mass Spectrometry

Slide 18
Results
The First month is the reference.
At the beginning there is a big change in the quality of the wine compared to the reference month.
The wine in can ages slightly more rapidly than the wine in bottle.
After 5 months, the wine has changed but it reaches the same target whatever it is in Can or in Bottle.
0
0,5
1
1,5
2
2,5
1 2 3 4 5 6 7 8
Months
Dis
tan
ce Bottle
Can
The distances between the sample of month 1 and each other month have been reported on the following graph:
Reference
After 5 months, the wines in can or in bottle reach the same target quality.
Slide 19
Conclusion
The results obtained demonstrate the ability for the Kronos Mass Spectrometry E-nose to identify several origins, process, packaging effect and to detect counterfeits on the market.
Results show:Excellent discrimination between all the alcoholic
beverage qualities
Excellent repeatability of the measurements

Slide 20
Benefits of the method
�Fast, reliable and simple to use
�Objective identification of grade products
�Used for qualitative and quantitative analysis of complex odorous matrices

Slide 21
Raw material (rice,
malt) selection and Quality control
(Fox, Gemini)
Ageing control(Prometheus, Kronos,
Astree)
Qualitative and quantitative control of yeast (Fox)
Astringency determination
(Astree)
Control of barrel burning
Wood chip toasting
(Fox, Gemini)
Blending controlPackaging selection
Counterfeit and fraud
detection (Kronos, Astree)
Trade mark protection

Slide 22
Electronic Nose and Tongue Products
Research& Development2nd generationof hybrid system
αααα PROMETHEUS
R&D Quality Control
αααα FOX / αααα KRONOS
Factory Quality ControlProduct conformity test
αααα GEMINI
Research & DevelopmentElectronic tongue
αααα ASTREE
Slide 23
Please come and see us
Booth # 411
Website: www.alpha-mos.com