IB Business and Management 5.3 Breakeven analysis.
35
IB Business and Management 5.3 Breakeven analysis
-
Upload
griffin-kristopher-norris -
Category
Documents
-
view
265 -
download
3
Transcript of IB Business and Management 5.3 Breakeven analysis.

IB Business and Management
5.3 Breakeven analysis

Quick test:1. Give 2 other names for Revenue (2)2. Give 2 examples of fixed costs (2)3. Give 2 examples of variable costs (2)4. What is the formula for Revenue? (1)A firm has fixed costs of £2000 per month.
Variable costs of £3 per unit and selling price of £5. In July they sell 1,200 units
5. How much revenue does the firm make? (1)6. What are the firms total costs? (1)7. How much profit does the firm make in July?
(1)
Total marks = 10

What Is Breakeven?
If a firm is breaking even it means that the business is neither making a profit or a loss.
Breakeven is the output at which a firm’s total revenue is equal to its total costs.
Profit = Total Revenue – Total Costs

Why might a firm use breakeven analysis?
• New firms need to estimate how much they must produce before they make a profit
• This may help them to decide if their business idea is viable
• May be required as part of a business plan• Existing firms may wish to know:• Profit/Loss at any level of output• The output needed to produce a certain
level of profit

Assumptions of simple break-even analysis
• The selling price remains the same, regardless of the number of units sold
• Fixed costs remain the same regardless of the number of units of output
• Variable costs vary in direct proportion to output

Finding The Breakeven Point
The Breakeven point can be found in 2 ways
1. Graphical Method2. Contribution method

Break Even ChartsCosts/Revenue
Output/Sales
Initially a firm will incur fixed costs, these do not depend on output or sales.
FC
As output is generated, the firm will incur variable costs – these vary directly with the amount produced.
VC The total costs therefore (assuming accurate forecasts!) is the sum of FC+VC
TC Total revenue is determined by the price charged and the quantity sold – again this will be determined by expected forecast sales initially.
The lower the price, the less steep the total revenue curve.
TR
Breakeven Output
The break even point occurs where total revenue equals total costs. The firm will have to produce and sell this number of units to breakeven
Breakeven Revenue

ExampleA small Photo frame manufacturer has the following
costs:Rent £5,000 per yearBusiness Rates £2,000 per yearRaw Materials £1.25 per unitUtilities £3,000 per yearPackaging £1 per unitSalaries £10,000 per year
The firm sells the photo frames for £4.50 to retailers
How many photo frames does the firm need to produce in a year in order to break-even?

Step 1: Creating a TableOutputOutput Fixed CostFixed Cost Variable Variable
CostCostTotal CostTotal Cost Total Total
RevenueRevenue
00
10001000
20002000
30003000
40004000
50005000
60006000
70007000
80008000
90009000
1000010000

ExampleA small Photo frame manufacturer has the following
costs:Rent £5,000 per yearBusiness Rates £2,000 per yearRaw Materials £1.25 per unitUtilities £3,000 per yearPackaging £1 per unitSalaries £10,000
The firm sells the photo frames for £4.50 to retailers
How many photo frames does the firm need to produce in a year in order to break-even?

Step 2:Adding Fixed CostsOutputOutput Fixed CostFixed Cost Variable Variable
CostCostTotal CostTotal Cost Total Total
RevenueRevenue
00 20,00020,000
10001000 20,00020,000
20002000 20,00020,000
30003000 20,00020,000
40004000 20,00020,000
50005000 20,00020,000
60006000 20,00020,000
70007000 20,00020,000
80008000 20,00020,000
90009000 20,00020,000
1000010000 20,00020,000

ExampleA small Photo frame manufacturer has the following
costs:Rent £5,000 per yearBusiness Rates £2,000 per yearRaw Materials £1.25 per unitUtilities £3,000 per yearPackaging £1 per unitSalaries £10,000
The firm sells the photo frames for £4.50 to retailers
How many photo frames does the firm need to produce in a year in order to break-even?
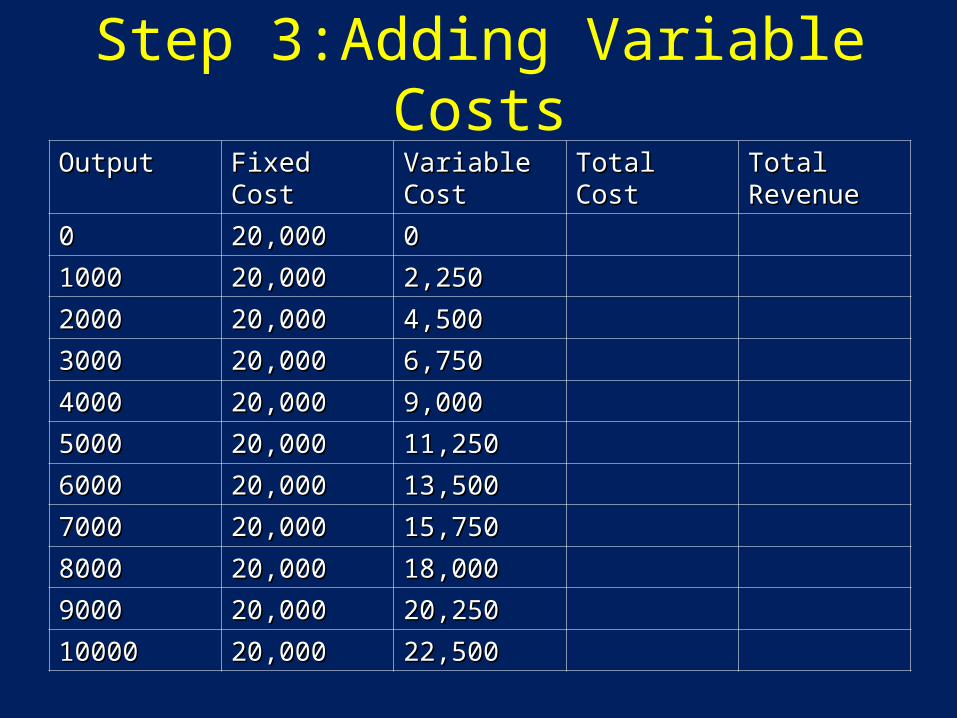
Step 3:Adding Variable Costs
OutputOutput Fixed CostFixed Cost Variable Variable CostCost
Total CostTotal Cost Total Total RevenueRevenue
00 20,00020,000 00
10001000 20,00020,000 2,2502,250
20002000 20,00020,000 4,5004,500
30003000 20,00020,000 6,7506,750
40004000 20,00020,000 9,0009,000
50005000 20,00020,000 11,25011,250
60006000 20,00020,000 13,50013,500
70007000 20,00020,000 15,75015,750
80008000 20,00020,000 18,00018,000
90009000 20,00020,000 20,25020,250
1000010000 20,00020,000 22,50022,500

ExampleA small Photo frame manufacturer has the following
costs:Rent £5,000 per yearBusiness Rates £2,000 per yearRaw Materials £1.25 per unitUtilities £3,000 per yearPackaging £1 per unitSalaries £10,000
The firm sells the photo frames for £4.50 to retailers
How many photo frames does the firm need to produce in a year in order to break-even?

Step 4:Adding Total CostsOutputOutput Fixed CostFixed Cost Variable Variable
CostCostTotal CostTotal Cost Total Total
RevenueRevenue
00 20,00020,000 00 20,00020,000
10001000 20,00020,000 2,2502,250 22,25022,250
20002000 20,00020,000 4,5004,500 24,50024,500
30003000 20,00020,000 6,7506,750 26,75026,750
40004000 20,00020,000 9,0009,000 29,00029,000
50005000 20,00020,000 11,25011,250 31,25031,250
60006000 20,00020,000 13,50013,500 33,50033,500
70007000 20,00020,000 15,75015,750 35,75035,750
80008000 20,00020,000 18,00018,000 38,00038,000
90009000 20,00020,000 20,25020,250 40,25040,250
1000010000 20,00020,000 22,50022,500 42,50042,500

ExampleA small Photo frame manufacturer has the following
costs:Rent £5,000 per yearBusiness Rates £2,000 per yearRaw Materials £1.25 per unitUtilities £3,000 per yearPackaging £1 per unitSalaries £10,000
The firm sells the photo frames for £4.50 to retailers
How many photo frames does the firm need to produce in a year in order to break-even?

Step 5:Adding Total Revenues
OutputOutput Fixed CostFixed Cost Variable Variable CostCost
Total CostTotal Cost Total Total RevenueRevenue
00 20,00020,000 00 20,00020,000 00
10001000 20,00020,000 2,2502,250 22,25022,250 4,5004,500
20002000 20,00020,000 4,5004,500 24,50024,500 9,0009,000
30003000 20,00020,000 6,7506,750 26,75026,750 13,50013,500
40004000 20,00020,000 9,0009,000 29,00029,000 18,00018,000
50005000 20,00020,000 11,25011,250 31,25031,250 22,50022,500
60006000 20,00020,000 13,50013,500 33,50033,500 27,00027,000
70007000 20,00020,000 15,75015,750 35,75035,750 31,50031,500
80008000 20,00020,000 18,00018,000 38,00038,000 36,00036,000
90009000 20,00020,000 20,25020,250 40,25040,250 40,50040,500
1000010000 20,00020,000 22,50022,500 42,50042,500 45,00045,000

Plotting the Graph
Draw a set of Axis• X axis= output (0-10,000)• Y axis= £ Cost/Revenue (0-50,000)Plot the line for Total CostsPlot the line for Total Revenues

Breakeven Chart
TC
TR
Output
Costs/Revenue
£
BEP

Answer
• Breakeven output is approx 8,900
• Breakeven Revenue = £40,000
Margin Of Safety
• Margin of safety is the quantity sold which is greater than the breakeven level of output.
= Actual Output – Breakeven output
• E.g. If a company has a BEP of 260 units and actually make and sell 310 units they have a margin of safety of 50

Break Even Charts – What they show
Costs/Revenue
Output/Sales
TCTR
Breakeven OutputD1
Loss
D2
Profit
Margin of safety
Contribution
• Contribution is the amount each unit pays towards fixed costs once variable costs have been covered.
• Contribution = Selling price – Variable cost per item

Using Contribution to calculate the Breakeven Point
To calculate the breakeven point in terms of output the following formula can be used
• Breakeven Output = Fixed Costs Contribution per Unit
• How can we work out the Breakeven Revenue?
• Multiply the Breakeven output by the Selling Price
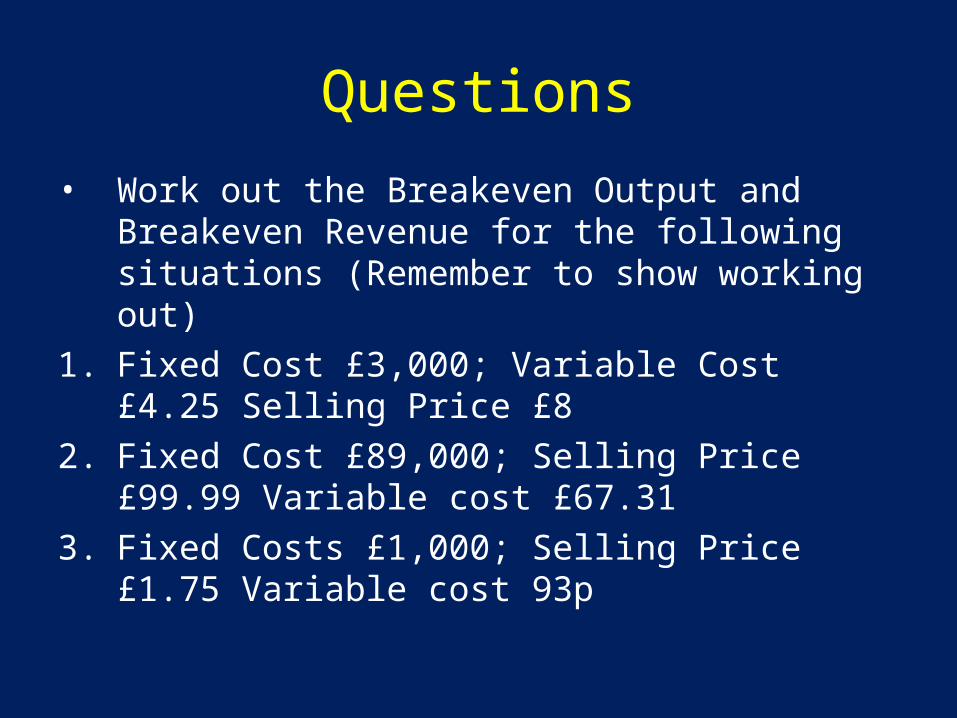
Questions
• Work out the Breakeven Output and Breakeven Revenue for the following situations (Remember to show working out)
1. Fixed Cost £3,000; Variable Cost £4.25 Selling Price £8
2. Fixed Cost £89,000; Selling Price £99.99 Variable cost £67.31
3. Fixed Costs £1,000; Selling Price £1.75 Variable cost 93p
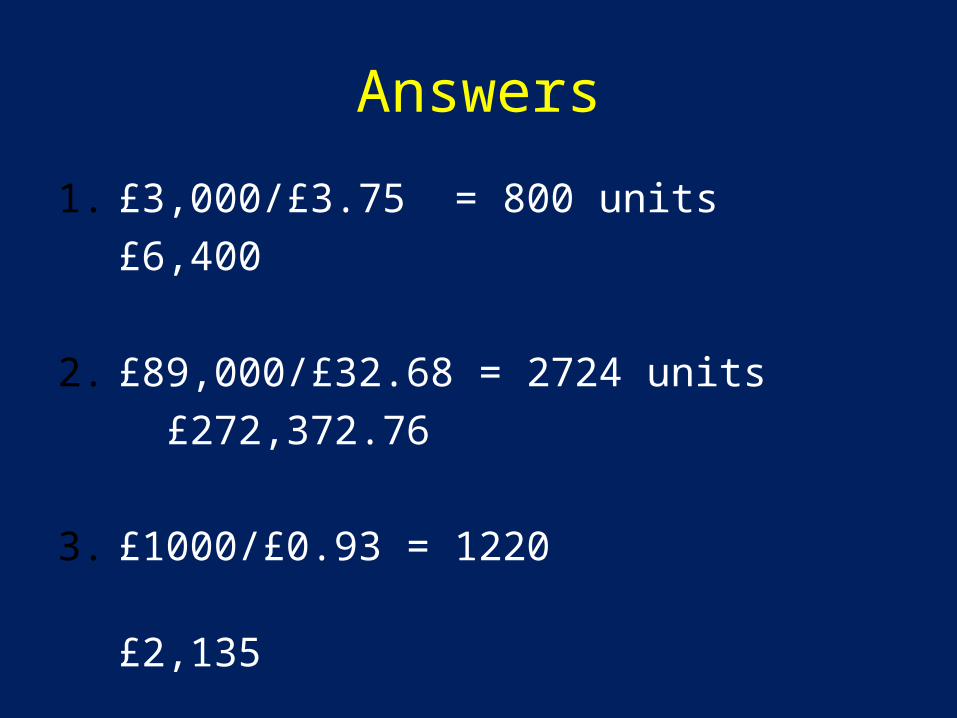
Answers
1. £3,000/£3.75 = 800 units£6,400
2. £89,000/£32.68 = 2724 units £272,372.76
3. £1000/£0.93 = 1220 £2,135
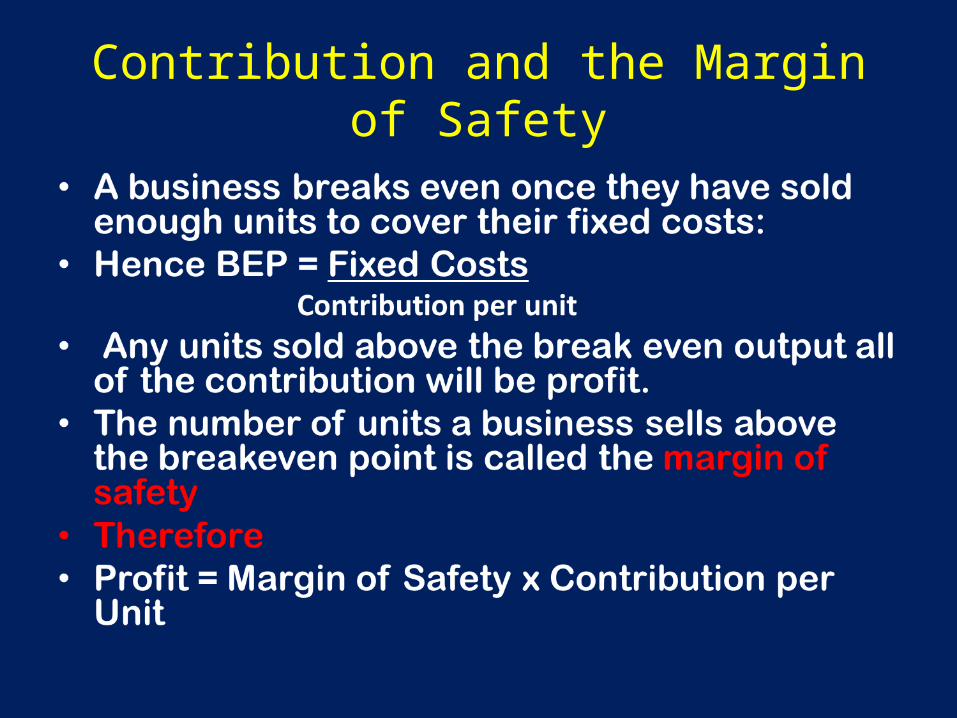
Contribution and the Margin of Safety

Changes in Variable CostsCosts/Revenue
Output/Sales
TC
TR
BEP
The level of variable costs affects the gradient of the Total Costs line.
If Variable Costs go up the line will become steeper. What will happen to the Break Even Point?
If Variable Costs go down the line will become less steep. What will happen to the Break Even Point?
TC1
BEP1
TC2
BEP2

Changes in Fixed CostsCosts/Revenue
Output/Sales
TC
TR
BEP
The fixed cost line affects where the Total Cost line starts
If fixed costs go up, the Total Costs line will shift upwards
TC1
BEP1
If fixed costs go down, the Total Costs line will shift downwards
TC2
BEP2

Changes in Selling PriceCosts/Revenue
Output/Sales
TC
TR
BEP
A change in Selling price will affect the gradient of the Total Revenue line
An increase in the selling price will make the TR line steeper
TR1
BEP1
A decrease in the selling price will make the TR line less steep
TR2
BEP2

Example – Advertising costs increase
Costs/Revenue
Output/Sales
TCTR
BE1
TC2
BE2
An increase in Advertising causes an upwards shift of the Total Cost line. This results in an increase of the breakeven output from BE1 to BE2

Questions
Explain what will happen to the Breakeven output in the following situations. Illustrate with a diagram.
1. The cost of raw materials increases2. The company moves to premises with
cheaper rent3. The company decreases the selling price
to compete with a new competitor4. The electricity supplier increases their
prices

Limitations of Breakeven Analysis
• Information used may be unreliable as it is based on forecasts and predictions
• Assumes SP stays the same regardless of output
• Fixed Costs may not stay the same• Ignores factors such as economies of scale• Assumes that all output is sold• Only suitable for analysis of single products• Only considers quantitive factors


Breakeven TableOutputOutput Fixed Fixed
CostCostVariable Variable CostCost
Total CostTotal Cost Total Total RevenueRevenue
ProfitProfit
00
10001000
20002000
30003000
40004000
50005000
60006000
70007000
80008000
90009000
1000010000