Hyperspectral Imaging for Intelligence, Surveillance, and ...
10
108 ABSTRACT This paper highlights SSC San Diego contributions to the research and development of hyperspectral technology. SSC San Diego developed the real-time, onboard hyperspectral data processor for automated cueing of high-resolution imagery as part of the Adaptive Spectral Reconnais- sance Program (ASRP), which demonstrated a practical solution to broad area search by leveraging hyperspectral phenomenology. SSC San Diego is now implement- ing the ASRP algorithm suite on parallel processors, using a portable, scalable architecture that will be remotely accessible. SSC San Diego performed the initial demonstrations that led to the Littoral Airborne Sensor Hyperspectral (LASH) program, which applies hyperspectral imaging to the problem of sub- marine detection in the littoral zone. Under the In-house Lab- oratory Independent Research (ILIR) program, SSC San Diego has developed new and enhanced methods for hyperspectral analysis and exploitation. Hyperspectral Imaging for Intelligence, Surveillance, and Reconnaissance David Stein, Jon Schoonmaker, and Eric Coolbaugh SSC San Diego INTRODUCTION The optical spectrum is generally considered to include the ultraviolet (200 to 400 nm), the visible (400 to 700 nm), the near infrared (700 to 1100 nm), and the short-wave infrared (1100 to 2500 nm). Sensors operat- ing in these bands detect reflected light which is used to discriminate an object from its background and to classify it based on spectral character- istics. Spectral sensors capitalize on the color difference between objects and the background. A color video camera that divides the reflected light into red, green, and blue components is thus a simple spectral sensor. More complicated sensors break the spectrum into finer and finer bands and/or selectively tune to bands appropriate for a specific object or back- ground. In general, a multispectral sensor, illustrated in Figure 1, is defined as a sensor using two to tens of bands, while a hyperspectral sen- sor, illustrated in Figure 2, is defined as a sensor using tens to hundreds of bands. Spectral sensors are divided into four types or approaches. Currently, the most common type is the "pushbroom" hyperspectral sen- sor. In this approach (Figure 2), a single line is imaged through a dispers- ing element so that the line is imaged in many different bands (colors) simultaneously. A second spatial dimension is realized through sensor motion. A second type is a multispectral filter wheel system in which a scene is imaged consecutively in multiple bands. A third type images multiple bands simultaneously using multiple chips (or multiple areas on the same chip). This approach uses multiple apertures or a splitting tech- nique, such as a series of dichroic prisms or a tetrahedral mirror or lens. The fourth approach is the use of a Fourier transform spectrometer. The product of any of these sensors is an image cube as illustrated in Figure 3. Hyperspectral Imaging at SSC San Diego SSC San Diego has supported a number of hyperspectral programs over the last several years for a variety of government agencies, including the Defense Advanced Research Projects Agency (DARPA), the Spectral Information and Technology Assessment Center (SITAC), the Office of Naval Research (ONR), the Office of the Secretary of Defense (OSD), and the High Performance Computing Management Office (HPCMO). We have worked on DARPA’s Adaptive Spectral Reconnaissance Program (ASRP), the goal of which was to demonstrate the detection of concealed terrestrial military targets and the cueing of a high-resolution imager. For ONR, we have been involved with maritime applications of
Transcript of Hyperspectral Imaging for Intelligence, Surveillance, and ...

108
ABSTRACTThis paper highlights SSC SanDiego contributions to theresearch and development ofhyperspectral technology. SSC SanDiego developed the real-time,onboard hyperspectral dataprocessor for automated cueing ofhigh-resolution imagery as part ofthe Adaptive Spectral Reconnais-sance Program (ASRP), whichdemonstrated a practical solutionto broad area search by leveraginghyperspectral phenomenology.SSC San Diego is now implement-ing the ASRP algorithm suite onparallel processors, using aportable, scalable architecturethat will be remotely accessible.SSC San Diego performed theinitial demonstrations that led tothe Littoral Airborne SensorHyperspectral (LASH) program,which applies hyperspectralimaging to the problem of sub-marine detection in the littoralzone. Under the In-house Lab-oratory Independent Research(ILIR) program, SSC San Diegohas developed new and enhancedmethods for hyperspectral analysisand exploitation.
Hyperspectral Imaging for Intelligence,Surveillance, and ReconnaissanceDavid Stein, Jon Schoonmaker, and Eric CoolbaughSSC San Diego
INTRODUCTIONThe optical spectrum is generally considered to include the ultraviolet(200 to 400 nm), the visible (400 to 700 nm), the near infrared (700 to1100 nm), and the short-wave infrared (1100 to 2500 nm). Sensors operat-ing in these bands detect reflected light which is used to discriminate anobject from its background and to classify it based on spectral character-istics. Spectral sensors capitalize on the color difference between objectsand the background. A color video camera that divides the reflected lightinto red, green, and blue components is thus a simple spectral sensor.More complicated sensors break the spectrum into finer and finer bandsand/or selectively tune to bands appropriate for a specific object or back-ground. In general, a multispectral sensor, illustrated in Figure 1, isdefined as a sensor using two to tens of bands, while a hyperspectral sen-sor, illustrated in Figure 2, is defined as a sensor using tens to hundredsof bands. Spectral sensors are divided into four types or approaches.Currently, the most common type is the "pushbroom" hyperspectral sen-sor. In this approach (Figure 2), a single line is imaged through a dispers-ing element so that the line is imaged in many different bands (colors)simultaneously. A second spatial dimension is realized through sensormotion. A second type is a multispectral filter wheel system in which ascene is imaged consecutively in multiple bands. A third type imagesmultiple bands simultaneously using multiple chips (or multiple areas onthe same chip). This approach uses multiple apertures or a splitting tech-nique, such as a series of dichroic prisms or a tetrahedral mirror or lens.The fourth approach is the use of a Fourier transform spectrometer. Theproduct of any of these sensors is an image cube as illustrated in Figure 3.
Hyperspectral Imaging at SSC San DiegoSSC San Diego has supported a number of hyperspectral programs overthe last several years for a variety of government agencies, including theDefense Advanced Research Projects Agency (DARPA), the SpectralInformation and Technology Assessment Center (SITAC), the Office ofNaval Research (ONR), the Office of the Secretary of Defense (OSD),and the High Performance Computing Management Office (HPCMO).We have worked on DARPA’s Adaptive Spectral ReconnaissanceProgram (ASRP), the goal of which was to demonstrate the detection ofconcealed terrestrial military targets and the cueing of a high-resolutionimager. For ONR, we have been involved with maritime applications of
Report Documentation Page Form ApprovedOMB No. 0704-0188
Public reporting burden for the collection of information is estimated to average 1 hour per response, including the time for reviewing instructions, searching existing data sources, gathering andmaintaining the data needed, and completing and reviewing the collection of information. Send comments regarding this burden estimate or any other aspect of this collection of information,including suggestions for reducing this burden, to Washington Headquarters Services, Directorate for Information Operations and Reports, 1215 Jefferson Davis Highway, Suite 1204, ArlingtonVA 22202-4302. Respondents should be aware that notwithstanding any other provision of law, no person shall be subject to a penalty for failing to comply with a collection of information if itdoes not display a currently valid OMB control number.
1. REPORT DATE AUG 2001 2. REPORT TYPE
3. DATES COVERED -
4. TITLE AND SUBTITLE Hyperspectral Imaging for Intelligence, Surveillance, and Reconnaissance
5a. CONTRACT NUMBER
5b. GRANT NUMBER
5c. PROGRAM ELEMENT NUMBER
6. AUTHOR(S) 5d. PROJECT NUMBER
5e. TASK NUMBER
5f. WORK UNIT NUMBER
7. PERFORMING ORGANIZATION NAME(S) AND ADDRESS(ES) Space and Naval Warfare Systems Center,53560 Hull Street,San Diego,CA,92152-5001
8. PERFORMING ORGANIZATIONREPORT NUMBER
9. SPONSORING/MONITORING AGENCY NAME(S) AND ADDRESS(ES) 10. SPONSOR/MONITOR’S ACRONYM(S)
11. SPONSOR/MONITOR’S REPORT NUMBER(S)
12. DISTRIBUTION/AVAILABILITY STATEMENT Approved for public release; distribution unlimited
13. SUPPLEMENTARY NOTES The original document contains color images.
14. ABSTRACT This paper highlights SSC San Diego contributions to the research and development of hyperspectraltechnology. SSC San Diego developed the real-time, onboard hyperspectral data processor for automatedcueing of high-resolution imagery as part of the Adaptive Spectral Reconnaissance Program (ASRP),which demonstrated a practical solution to broad area search by leveraging hyperspectral phenomenology.SSC San Diego is now implementing the ASRP algorithm suite on parallel processors, using a portable,scalable architecture that will be remotely accessible. SSC San Diego performed the initial demonstrationsthat led to the Littoral Airborne Sensor Hyperspectral (LASH) program, which applies hyperspectralimaging to the problem of submarine detection in the littoral zone. Under the In-house LaboratoryIndependent Research (ILIR) program, SSC San Diego has developed new and enhanced methods forhyperspectral analysis and exploitation.
15. SUBJECT TERMS
16. SECURITY CLASSIFICATION OF: 17. LIMITATION OF ABSTRACT
18. NUMBEROF PAGES
9
19a. NAME OFRESPONSIBLE PERSON
a. REPORT unclassified
b. ABSTRACT unclassified
c. THIS PAGE unclassified
Standard Form 298 (Rev. 8-98) Prescribed by ANSI Std Z39-18

Hyperspectral Imaging for Intelligence, Surveillance, and Reconnaissance 109
hyperspectral sensors. UnderOSD sponsorship, we havedemonstrated the capabilities ofhyperspectral remote sensing forsearch and rescue applications.For SITAC, we have providedground truth measurements ofocean optical properties and illu-mination required for controlledexperiments, and we have analyzedthe bands required for optimalocean imaging. The HPCMO issponsoring our work to developscalable and portable implementa-tions of the ASRP algorithms.Under ONR and SSC San DiegoIn-house Laboratory IndependentResearch (ILIR) funding, we havedeveloped new and enhancedmethods for hyperspectral analy-sis and exploitation. Highlights ofthese efforts are described in moredetail below.
Terrestrial HyperspectralRemote Sensing The DARPA ASRP successfullydemonstrated the capability todetect military targets of interestin real time by using an airbornehyperspectral system to cue high-resolution images for groundanalysis. SSC San Diego led allresearch, development, coding,and implementation of the end-to-end processing and criticalhyperspectral detection andrecognition algorithms. The algo-rithms and processing architecturedeveloped are applicable to abroad scope of missions, targetsof interest, and platform architec-tures. ASRP pushed the state ofthe art beyond simple detection oftargets in the open, making detec-tion of difficult, realistically posi-tioned targets possible at low falsealarm rates. Figure 4 shows thedifficult environment, used byASRP for real-time hyperspectralsystem demonstrations, that maybe encountered during militaryoperations. The variety of naturaland man-made materials and the
13
12
ALONG TRACKAXIS
SENSOR FOV
DETECTORARRAY
=
+ +
11
FIGURE 1. Schematic of three-band multispectral imaging camera.
ACROSS TRACKAXIS
SPECTRALAXISDETECTOR
ARRAY
SPATIALAXIS
SENSOR FOV
ENTRANCE SLIT
DISPERSINGELEMENT
SCAN DIRECTION(PLATFORM MOTION OR MIRROR)
FIGURE 2. Schematic of a pushbroom dispersive hyperspectral sensor.
FIGURE 3. Hyperspectral image cube's cross-track, 1; along track, 2; and spectraldimension, 3.
1
3 2

DATA ACQUISITION AND EXPLOITATION110
variability of illumination com-bine to form a highly complexspectral detection challenge.Figure 5 compares the visibilityof two targets in high-resolutionimagery (top), in a red-green-blue(RGB) image (middle), and in theoutput of a detection statistic (bottom). These detections exem-plify the ability of the hyperspectralsystem to identify target positionseven when they may not be evi-dent in traditional high-resolutionimagery.
The High Performance ComputingManagement Office (HPCMO)has funded SSC San Diego, as partof the Hyperspectral InformationExploitation Project, to imple-ment the ASRP hyperspectralalgorithm suite and end-to-endprocessing on high-performancecomputer (HPC) platforms in aportable, scalable architectureaccessible by a wide variety ofGovernment users. Parallel pro-cessing capabilities will provide anew dimension for hyperspectralprocessing, allowing multiplehyperspectral algorithms to opti-mize target detection and recogni-tion on massive data sets.
Maritime Sensor SystemsSSC San Diego has been instru-mental in initiating and demon-strating the use of hyperspectralimagery for surveillance of the lit-toral. In 1996, SETS Technology,working with SSC San Diego, flewthe SETS Technology AdvancedAirborne Hyperspectral ImagingSystem (AAHIS) over submarinesat the Pacific Missile RangeFacility northwest of Kauai. Theresults of these flights led to theLittoral Airborne Sensor Hyper-spectral (LASH) program.
LASH is an integrated optical sen-sor system that uses pushbroomscanning for the detection of sub-marines in the littoral environment.The LASH system consists of a
FIGURE 4. Three-color image of an ASRPhyperspectral image.
FIGURE 5. These figures show a high-resolution panchromaticimager (6-inch ground sample distance [GSD]) [top], and RGBimage created from three hyperspectral bands (1-meter GSD)[middle], and one hyperspectral algorithm detection statistic image[bottom] for two different targets hidden along tree lines in shadow.

Hyperspectral Imaging for Intelligence, Surveillance, and Reconnaissance 111
passive hyperspectral imager (HSI) assembly, an image processor, a datastorage (archival) unit, a data display unit for operator use that incorpo-rates the system monitoring, and control functions. The system is inte-grated into a modified ALE-43 (chaff cutter and dispenser pod) andmounted on a standard pylon at wing station 12 (Figure 6). All principalelements of the LASH system are contained within the pod. The unitsinstalled within the aircraft itself are limited to the system display proces-sor, the power interface to the aircraft, the operator controls, and a globalpositioning system (GPS) antenna. This design was established to providea system that could be considered independent of the individual aircrafttail number. It is estimated that all of the internal aircraft mounted unitscould be installed in less than 2 hours if necessary.
The passive and stabilized hyperspectral sensor collects both spatial (770pixels) and spectral data (up to 288 pixels) on each instantaneous imageincrement. The data are binned by 2 spatially and 6 spectrally to give 385spatial and 48 spectral channels. This imaged data is framed at 50 Hz,with each frame covering a 40-degree lateral field of view and approxi-mately a 0.06-degree (1 milli-radian) field of view in the direction offlight. The data are simultaneously recorded in the archival storage sys-tem, processed by the image processor, and presented in a pseudo-colorwaterfall display to the operator. The processing system evaluates thedata sensed in near real time using both spectral and spatial processing,and it provides a "frozen" display of the target along with its position inlongitude and latitude. A stabilization system automatically adjusts thesensor so that it compensates for aircraft roll, pitch, and yaw. A "point totrack" option forces the stabilization system to point the sensor along apredetermined track (otherwise the sensor points directly down).
These sensors can perform a wide range of ocean sensing tasks. Targetsrange from submarines and sea mines for military applications, to chlorophylland sediment load in physical oceanographic applications, to schools ofdolphins and whales in marine biology applications. Figure 7 demon-strates the ability of the sensor to image a pod of humpback whales. Inthese applications and others, a common goal is to detect an extremelylow-contrast target in a high-clutter background.
Ocean Environmental MeasurementsHyperspectral systems such as LASH are being developed that use spec-tral and spatial processing algorithms to discern objects and organismsbelow the sea surface. The performance of such systems depends on envi-ronmental and optical properties of the sea. An instrument suite, thePortable Profiling Oceanographic Instrument System (PorPOIS), wasdeveloped to ascertain and quantify these environmental and hydro-opticconditions. Profiling of the downwelling irradiance leads to a value of thediffuse attenuation coefficient, kd, for the water column. Measurementsof the beam absorption, a, and attenuation, c, provide information aboutthe non-pure water absorption and scattering characteristics of the water.Measurement of the backscatter at different wavelengths determines whatfraction of the downwelling photons is scattered back toward space.These and a number of other measurements made by PorPOIS allow fora thorough characterization of the water body. These data are used in theLASH program to optimize parameters of the processing algorithms andto predict the performance of the sensor by using modeling software thatrequires these oceanographic data as inputs.
FIGURE 6. LASH pushbroom hyper-spectral imager mounted on the wing ofa P3 aircraft.
FIGURE 7. A pod of humpback whalesimaged using the AAHIS sensor,a precursor to LASH.
DATA ACQUISITION AND EXPLOITATION112
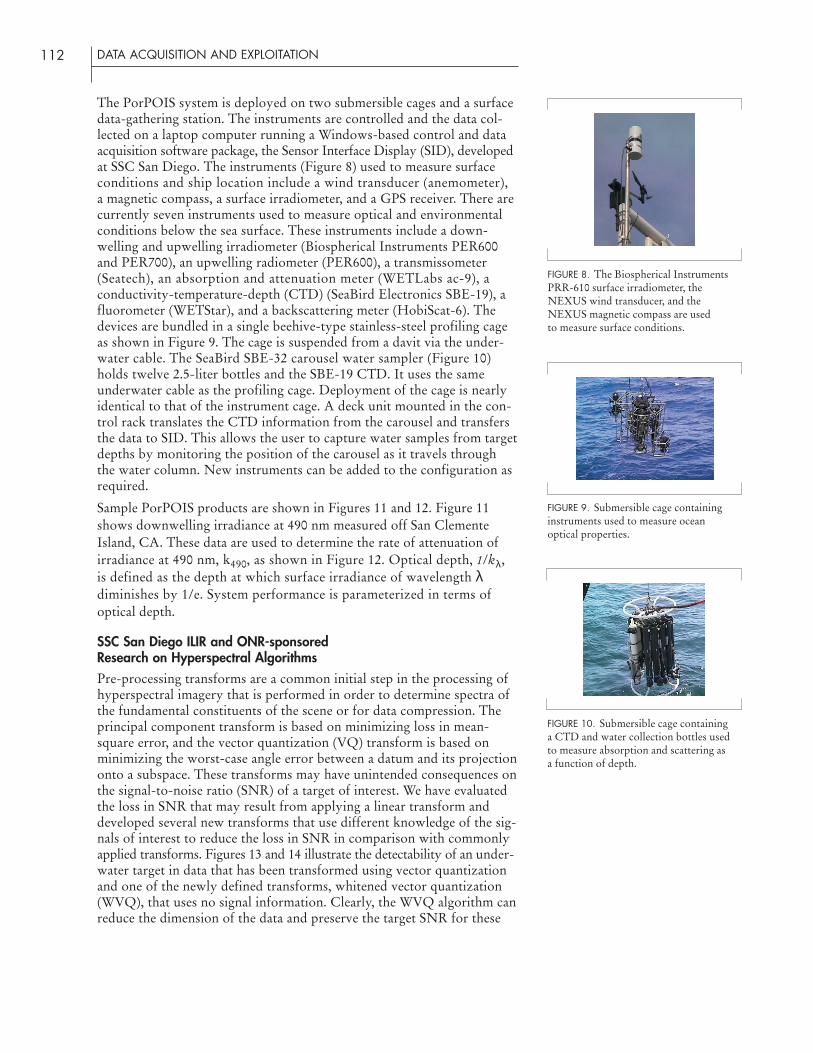
The PorPOIS system is deployed on two submersible cages and a surfacedata-gathering station. The instruments are controlled and the data col-lected on a laptop computer running a Windows-based control and dataacquisition software package, the Sensor Interface Display (SID), developedat SSC San Diego. The instruments (Figure 8) used to measure surfaceconditions and ship location include a wind transducer (anemometer),a magnetic compass, a surface irradiometer, and a GPS receiver. There arecurrently seven instruments used to measure optical and environmentalconditions below the sea surface. These instruments include a down-welling and upwelling irradiometer (Biospherical Instruments PER600and PER700), an upwelling radiometer (PER600), a transmissometer(Seatech), an absorption and attenuation meter (WETLabs ac-9), aconductivity-temperature-depth (CTD) (SeaBird Electronics SBE-19), afluorometer (WETStar), and a backscattering meter (HobiScat-6). Thedevices are bundled in a single beehive-type stainless-steel profiling cageas shown in Figure 9. The cage is suspended from a davit via the under-water cable. The SeaBird SBE-32 carousel water sampler (Figure 10)holds twelve 2.5-liter bottles and the SBE-19 CTD. It uses the sameunderwater cable as the profiling cage. Deployment of the cage is nearlyidentical to that of the instrument cage. A deck unit mounted in the con-trol rack translates the CTD information from the carousel and transfersthe data to SID. This allows the user to capture water samples from targetdepths by monitoring the position of the carousel as it travels throughthe water column. New instruments can be added to the configuration asrequired.
Sample PorPOIS products are shown in Figures 11 and 12. Figure 11shows downwelling irradiance at 490 nm measured off San ClementeIsland, CA. These data are used to determine the rate of attenuation ofirradiance at 490 nm, k490, as shown in Figure 12. Optical depth, 1/kλ,is defined as the depth at which surface irradiance of wavelength λdiminishes by 1/e. System performance is parameterized in terms ofoptical depth.
SSC San Diego ILIR and ONR-sponsoredResearch on Hyperspectral AlgorithmsPre-processing transforms are a common initial step in the processing ofhyperspectral imagery that is performed in order to determine spectra ofthe fundamental constituents of the scene or for data compression. Theprincipal component transform is based on minimizing loss in mean-square error, and the vector quantization (VQ) transform is based onminimizing the worst-case angle error between a datum and its projectiononto a subspace. These transforms may have unintended consequences onthe signal-to-noise ratio (SNR) of a target of interest. We have evaluatedthe loss in SNR that may result from applying a linear transform anddeveloped several new transforms that use different knowledge of the sig-nals of interest to reduce the loss in SNR in comparison with commonlyapplied transforms. Figures 13 and 14 illustrate the detectability of an under-water target in data that has been transformed using vector quantization and one of the newly defined transforms, whitened vector quantization(WVQ), that uses no signal information. Clearly, the WVQ algorithm canreduce the dimension of the data and preserve the target SNR for these
FIGURE 9. Submersible cage containinginstruments used to measure oceanoptical properties.
FIGURE 8. The Biospherical InstrumentsPRR-610 surface irradiometer, theNEXUS wind transducer, and theNEXUS magnetic compass are usedto measure surface conditions.
FIGURE 10. Submersible cage containinga CTD and water collection bottles usedto measure absorption and scattering asa function of depth.

Hyperspectral Imaging for Intelligence, Surveillance, and Reconnaissance 113
NORMALIZED Kd PROFILENORMALIZED DOWNWELLING IRRADIANCE
DEPT
H (m
)
Ed490/Sfc490 LINEFIT
FIGURE 12. Rate of attenuation of downwelling irradiance at 490 nmderived from PorPOIS measurements of downwelling irradiance.
0.05 0.1 0.150100
90
80
70
60
50
40
30
20
10
0
0.2 0.4
490 nm
0.6 0.8 10100
90
80
70
60
50
40
30
20
10
0
FIGURE 11. Plot of downwelling irradiance at 490 nm as a functionof depth as measured using PorPOIS in waters off San ClementeIsland, CA.
data. The transformed data are processed herewith the Reed-Xioali (RX) quadratic anomalydetector. The enhanced discrimination of thetarget at lower dimension using the WVQalgorithm arises from the fact that the per-formance of quadratic detectors improvesfor a given SNR if the dimension is reduced.
Linear unmixing and image segmentation are common means of analyz-ing hyperspectral imagery. Linear unmixing models the observed spectraas
d dyij = � ak
ijek , such that � akij ≤ 1 and 0 ≤ ak
ij ≤ 1.k=1 k=1
The spectral vectors, ek are known as endmembers, and akij is the abun-
dance of the kth material at pixel (i,j). There are several means availablefor estimating the endmembers. The abundances are usually estimated bysolving the constrained least-squares problem.
Image segmentation typically models the observation vector as arisingfrom one of several classes, such that each class has a multi-variate normaldistribution. The number of classes, d, is selected and the mean andcovariance of the classes {(�k, Σk) | 1 ≤ k ≤ d} are estimated from thehyperspectral data. The expectation maximization and the stochasticexpectation maximization algorithm are two methods of estimating theseparameters. Given the parameters and the probability of each class, thedata may be classified by assigning yij to the class that, conditioned onthe observation, is most likely. This computation is carried out usingBayes Law.

DATA ACQUISITION AND EXPLOITATION114
We have generalized the linear unmixing and image segmentationapproaches in the development of the stochastic compositional model.We assume an A×B image of multivariate date: yij �Rn, 1 ≤ i ≤ A, 1 ≤ j ≤ B.The stochastic compositional approach models each observation vector asa constrained linear combination of normally distributed random variables.Let d be the number of classes, and let N(k, Σk), 1 ≤ k ≤ d denote thenormal distribution with mean k and covariance Σk then
d dyij = � aij xij such that xij ~ N(k, Σk), 0 ≤ aij ≤ 1, and � aij = 1. (1)
k=1 k k k k k=1 k
To account for scalar variation in the illumination, we also consider themodel that uses an inequality constraint:
d dyij = � aij xij such that xij ~ N(k, Σk), 0 ≤ aij ≤ 1, and � aij ≤ 1. (2)
k=1 k k k k k=1 k
For given parameters (k, Σk), 1 ≤ k ≤ d, and given abundancesd
� =(a1,…,ad), let (dropping the pixel indices) (�) = � ak k, andd k=1
Σ(�) = � ak2Σk. Then, yij ~ N((�),Σ(�)). Maximum likelihood abundance
k=1
estimates are thus obtained by solving
^ 1 -1�ij = arg(max(––––––––––––––exp�––(yij–(�))Σ(�)-1(yij–(�))�. (3)
|Σ(�)|0.5 (2�)n/2 2
FIGURE 13. The RX algorithm applied to VQ-transformed 48-bandhyperspectral imagery transformed to 48, 36, 20, 12, 9, and 7dimensions (A through F, respectively).
A B C
D E F
FIGURE 14. The RX algorithm applied to WVQ-transformed 48-band hyperspectral imagery transformed to 48, 36, 24, 8, 4, and 2dimensions (A through F, respectively).
D E F
A B C

Hyperspectral Imaging for Intelligence, Surveillance, and Reconnaissance 115
Let X = (x1,…,xd); the maximum likelihood estimates of the decomposi-tion of the observation into contributions, xk from the classes is obtainedby solving
^X = arg(max(p(X | y,�,k,Σk)))
d1 -1=arg� max� –––––––––––––exp�––(xk - k)�Σk
-1(xk - k)���k=1 (2�)
n/2 |Σk |1/2 2
dsuch that y = � akxk . (4)
k=1
The stochastic compositional model and deterministic linear unmixinghave been compared by using simulated hyperspectral imagery. Class sta-tistics were estimated from hyperspectral imagery by using the stochasticexpectation maximization algorithm. Using these parameters, a set ofsimulated hyperspectral imagery was generated so that the mixing pro-portions of the classes were known. The test data were then unmixed byusing both deterministic unmixing (with the class means as endmembers)and by stochastic compositional modeling, such that the class parameterswere estimated using the expectation maximization algorithm. Figure 15compares the error in the abundance estimates of one of the classes usingthe two methods. In this example, the stochastic compositional modelreduces the abundance estimation error by a factor of two to three. Workis ongoing to compare the performance of detection algorithms emanat-ing from the segmentation, linear unmixing, and stochastic compositionalmodels.
ABUNDANCE ESTIMATION ERROR
CUMU
LATIV
E PRO
BABI
LITY
00
0.1
0.2
0.3
0.4
0.5
0.6
0.7
0.8
0.9
STOCHASTIC COMPOSITIONAL MODEL
LINEAR UNMIXING
1
0.2 0.4 0.6 0.8 1
FIGURE 15. A comparison of the absolute error in the abundanceestimate using linear unmixing and stochastic compositionalmodeling.

DATA ACQUISITION AND EXPLOITATION116
SUMMARYSSC San Diego has been involved in many aspects of hyperspectralimaging. We are making important contributions in the areas of real-timeprocessing implementations, system design for a variety of missions,environmental characterization, and the development of new models andmethods. SSC San Diego is continuing to work across the Department ofDefense (DoD)/Intelligence communities to bring mature hyperspectraltechnologies to the warfighter, making this unique source of criticalinformation more widely available and user friendly.
❖
David SteinPh.D. in Mathematics, BrandeisUniversity, 1986Current Research: Multidimen-sional statistics; detection theory;hyperspectral algorithms; remotesensing of littoral processes.
Jon SchoonmakerBS in Physics/Mathematics,University of Oregon, 1985Current Research: Hyperspectralsystems; data analysis and algo-rithm development; remote sens-ing of littoral processes.
Eric CoolbaughMS in Oceanography andMeteorology, Naval PostgraduateSchool, 1989Current Research: Hyperspectralimaging systems; high-perform-ance computing; hyperspectralalgorithms.