
HYPERSPECTRAL CORE IMAGING APPLICATIONS
30
February 2021 FOR RESTRICTED USE ONLY – NO DISTRIBUTION ALLOWED [email protected] CORESCAN: APPLICATIONS IN HYPERSPECTRAL CORE IMAGING APPLICATIONS - GREENSTONE GOLD DEPOSITS -
Transcript of HYPERSPECTRAL CORE IMAGING APPLICATIONS
February 2021
FOR RESTRICTED USE ONLY – NO DISTRIBUTION ALLOWED
CORESCAN: APPLICATIONS IN
HYPERSPECTRAL CORE IMAGING APPLICATIONS
- GREENSTONE GOLD DEPOSITS -
Mineral
Class Map
Core Photo
(50μm)
50mm
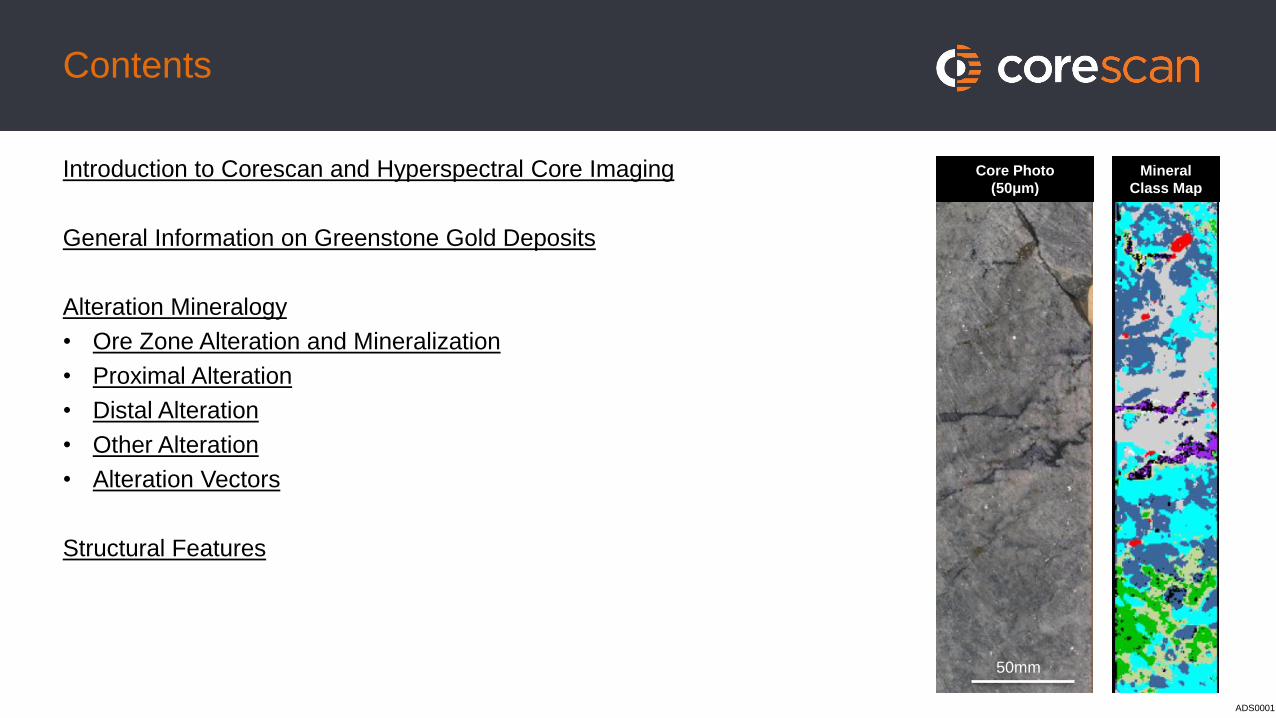
Contents
Introduction to Corescan and Hyperspectral Core Imaging
General Information on Greenstone Gold Deposits
Alteration Mineralogy
• Ore Zone Alteration and Mineralization
• Proximal Alteration
• Distal Alteration
• Other Alteration
• Alteration Vectors
Structural Features
ADS0001
July 2020
20mm
AP0001
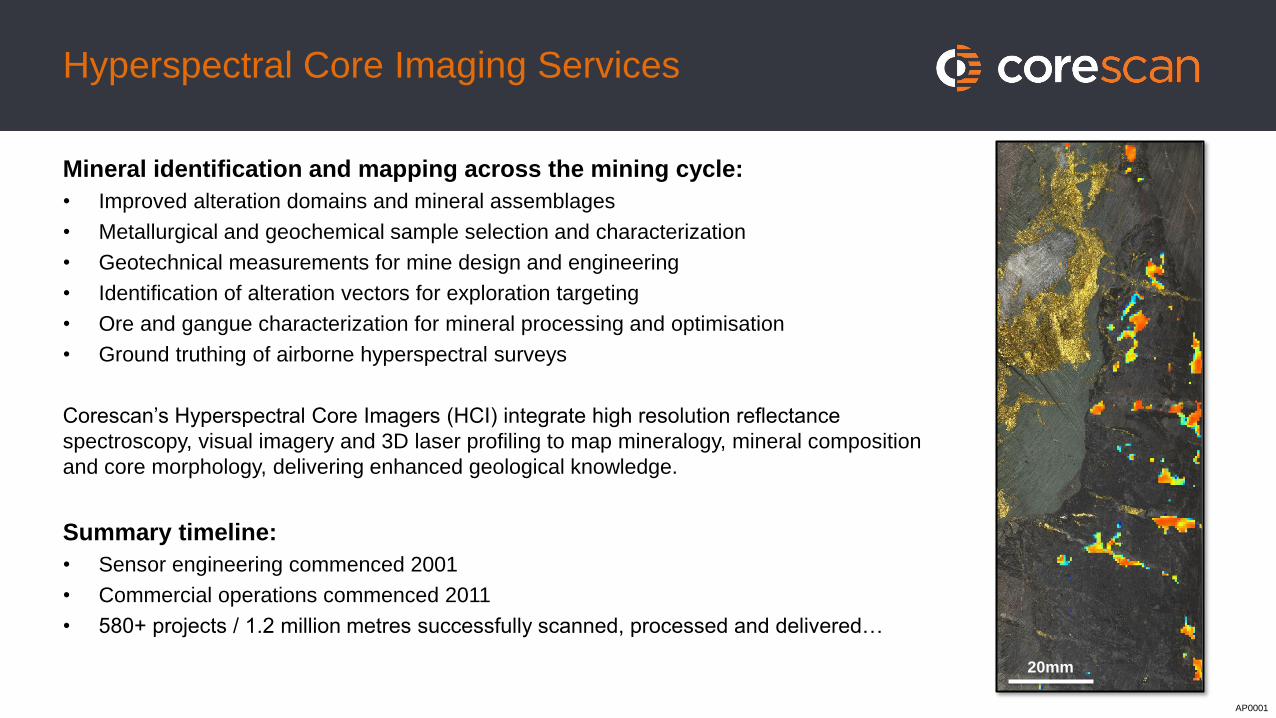
Hyperspectral Core Imaging Services
Mineral identification and mapping across the mining cycle:
• Improved alteration domains and mineral assemblages
• Metallurgical and geochemical sample selection and characterization
• Geotechnical measurements for mine design and engineering
• Identification of alteration vectors for exploration targeting
• Ore and gangue characterization for mineral processing and optimisation
• Ground truthing of airborne hyperspectral surveys
Corescan’s Hyperspectral Core Imagers (HCI) integrate high resolution reflectance
spectroscopy, visual imagery and 3D laser profiling to map mineralogy, mineral composition
and core morphology, delivering enhanced geological knowledge.
Summary timeline:
• Sensor engineering commenced 2001
• Commercial operations commenced 2011
• 580+ projects / 1.2 million metres successfully scanned, processed and delivered…
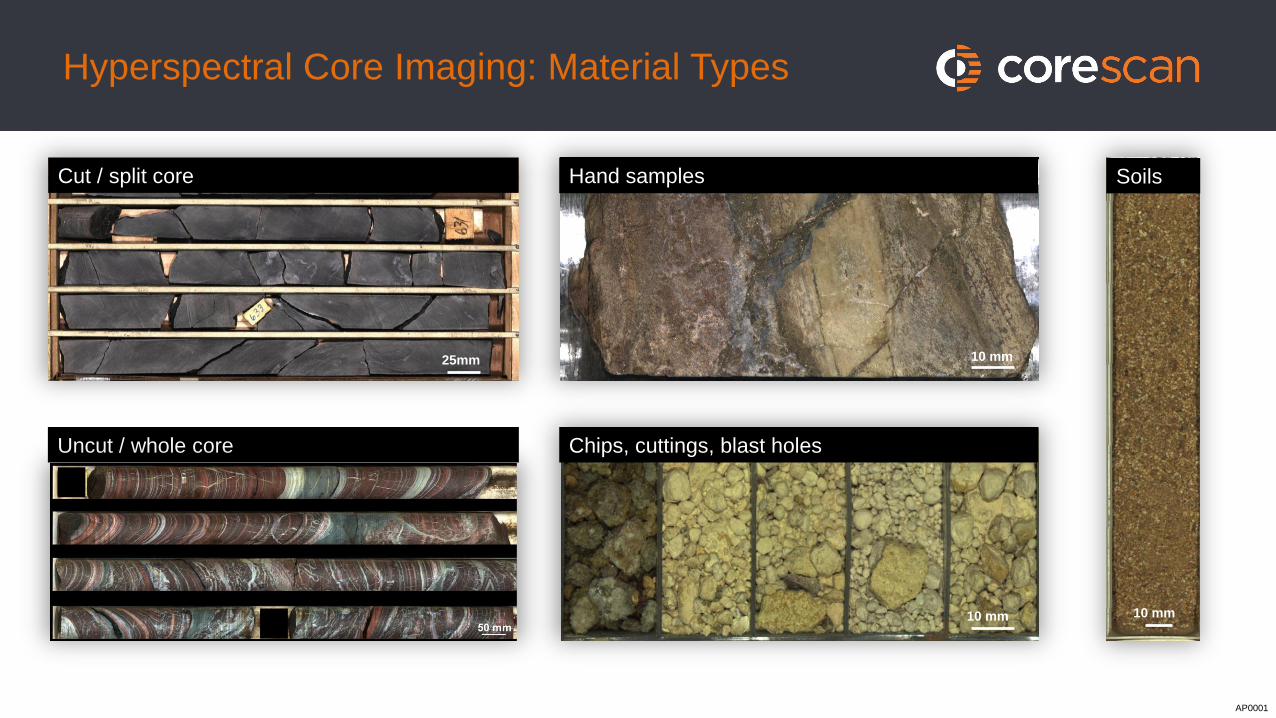
Cut / split core
Uncut / whole core
Hand samples
Chips, cuttings, blast holes
25mm
10 mm
10 mm
Soils
10 mm
AP0001
Hyperspectral Core Imaging: Material Types
AP0001
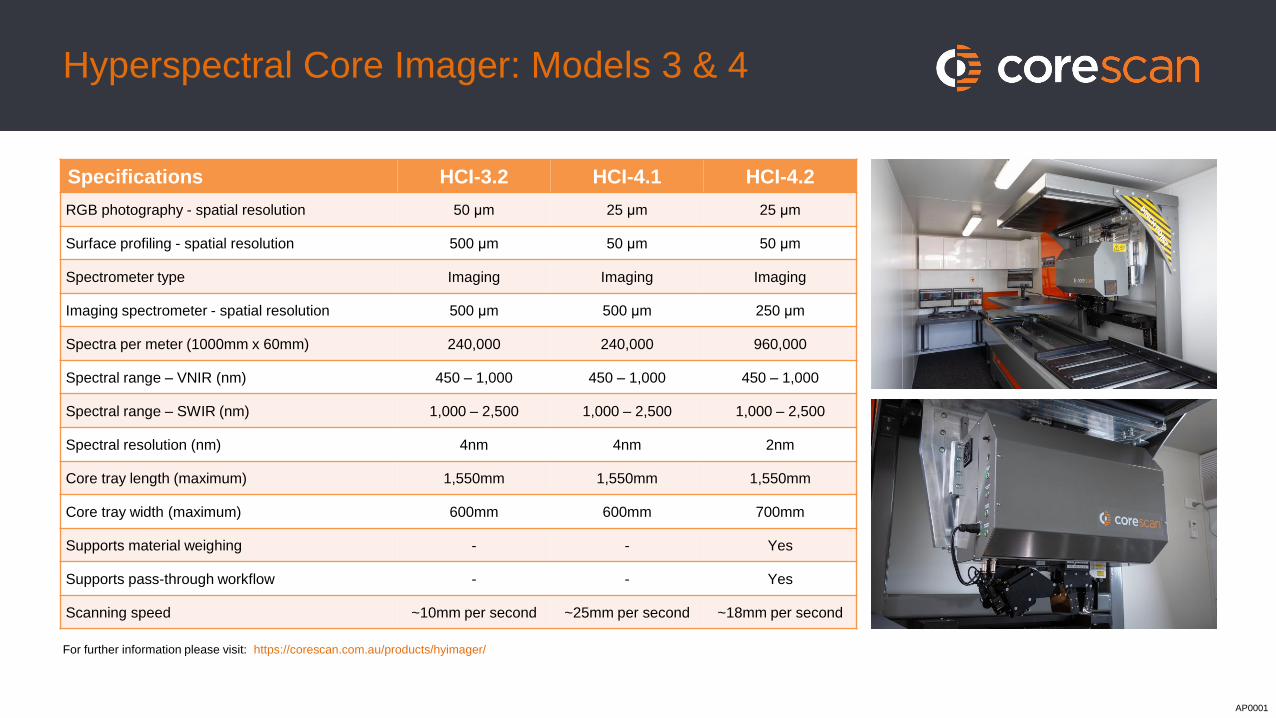
Hyperspectral Core Imager: Models 3 & 4
Specifications HCI-3.2 HCI-4.1 HCI-4.2
RGB photography - spatial resolution 50 μm 25 μm 25 μm
Surface profiling - spatial resolution 500 μm 50 μm 50 μm
Spectrometer type Imaging Imaging Imaging
Imaging spectrometer - spatial resolution 500 μm 500 μm 250 μm
Spectra per meter (1000mm x 60mm) 240,000 240,000 960,000
Spectral range – VNIR (nm) 450 – 1,000 450 – 1,000 450 – 1,000
Spectral range – SWIR (nm) 1,000 – 2,500 1,000 – 2,500 1,000 – 2,500
Spectral resolution (nm) 4nm 4nm 2nm
Core tray length (maximum) 1,550mm 1,550mm 1,550mm
Core tray width (maximum) 600mm 600mm 700mm
Supports material weighing - - Yes
Supports pass-through workflow - - Yes
Scanning speed ~10mm per second ~25mm per second ~18mm per second
For further information please visit: https://corescan.com.au/products/hyimager/
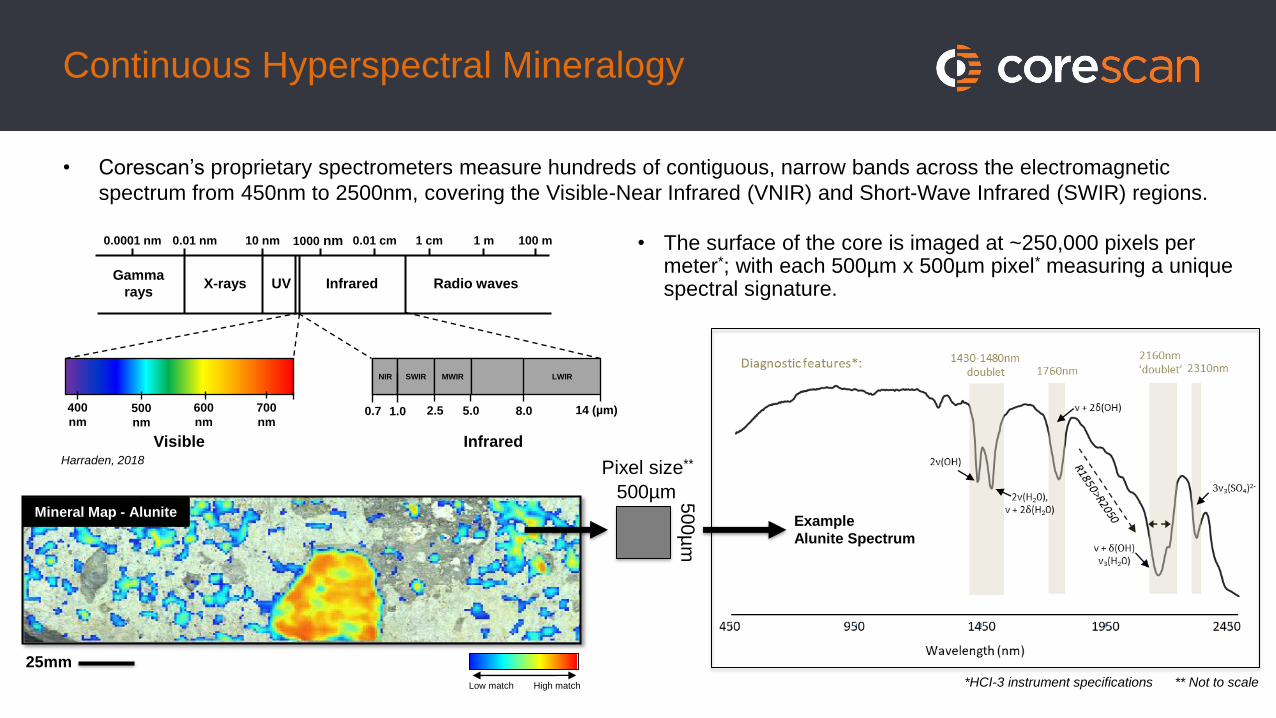
Continuous Hyperspectral Mineralogy
• Corescan’s proprietary spectrometers measure hundreds of contiguous, narrow bands across the electromagnetic
spectrum from 450nm to 2500nm, covering the Visible-Near Infrared (VNIR) and Short-Wave Infrared (SWIR) regions.
Mineral Map - Alunite
• The surface of the core is imaged at ~250,000 pixels per meter*; with each 500µm x 500µm pixel* measuring a unique spectral signature.
500µm 500
µm
Pixel size**
*HCI-3 instrument specifications ** Not to scale
Visible
500
nm
400
nm
600
nm
700
nm0.7 1.0 2.5 5.0 8.0 14 (µm)
Infrared
NIR SWIR MWIR LWIR
Gamma
raysX-rays UV Infrared Radio waves
0.0001 nm 0.01 nm 10 nm 1000 nm 0.01 cm 1 cm 1 m 100 m
High matchLow match
Harraden, 2018
Example
Alunite Spectrum
25mm
ACON0014
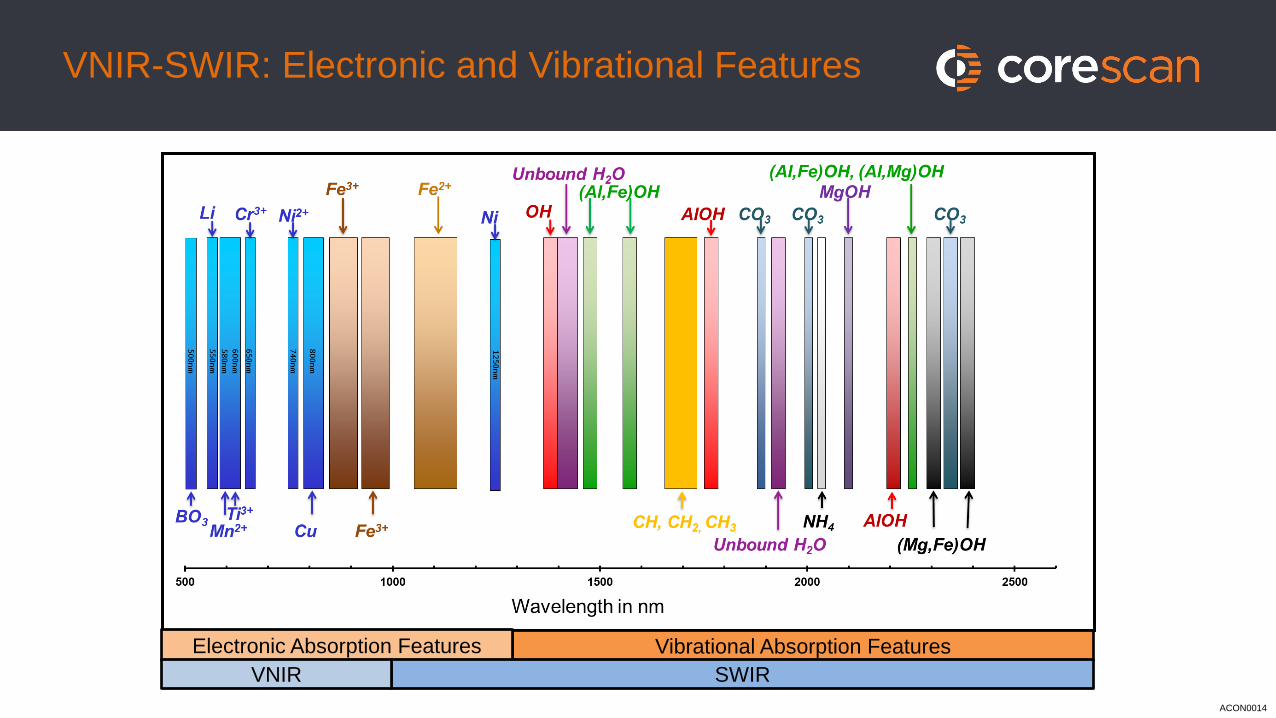
VNIR-SWIR: Electronic and Vibrational Features
Vibrational Absorption FeaturesElectronic Absorption Features
SWIRVNIR
Groves et al., 2020
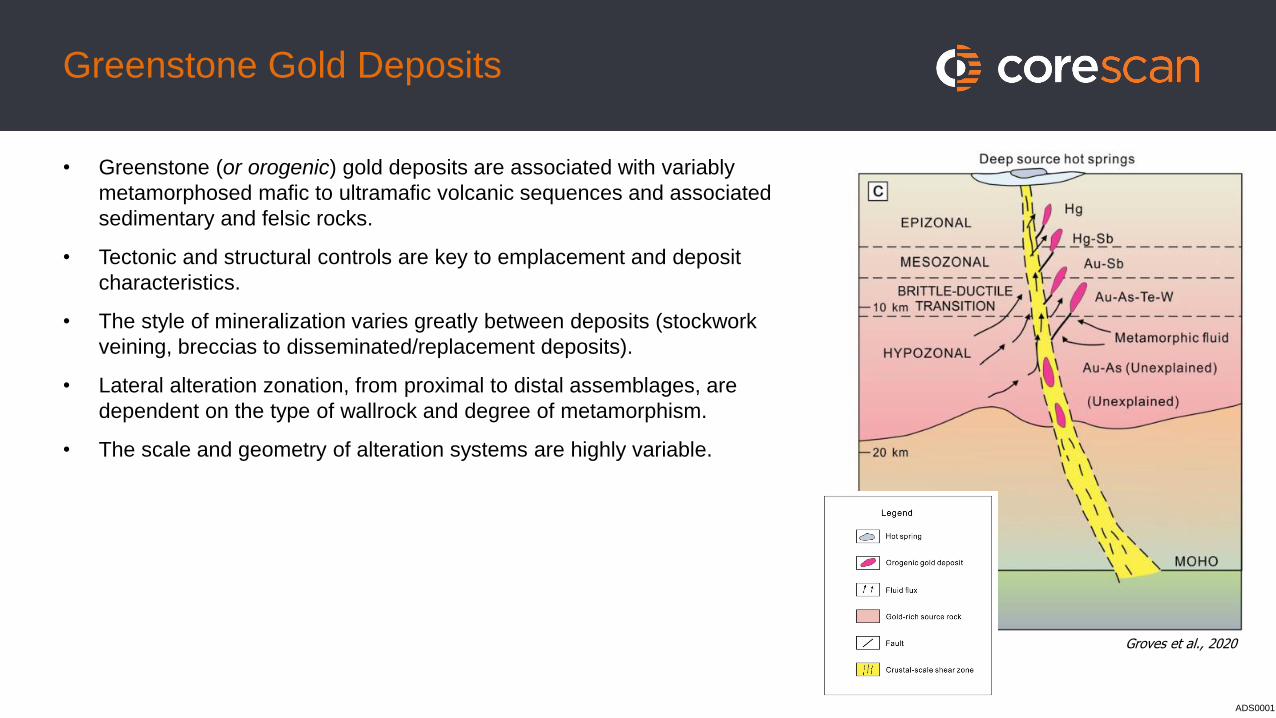
Greenstone Gold Deposits
• Greenstone (or orogenic) gold deposits are associated with variably
metamorphosed mafic to ultramafic volcanic sequences and associated
sedimentary and felsic rocks.
• Tectonic and structural controls are key to emplacement and deposit
characteristics.
• The style of mineralization varies greatly between deposits (stockwork
veining, breccias to disseminated/replacement deposits).
• Lateral alteration zonation, from proximal to distal assemblages, are
dependent on the type of wallrock and degree of metamorphism.
• The scale and geometry of alteration systems are highly variable.
ADS0001
Greenstone Gold Deposits – Alteration Mineralogy
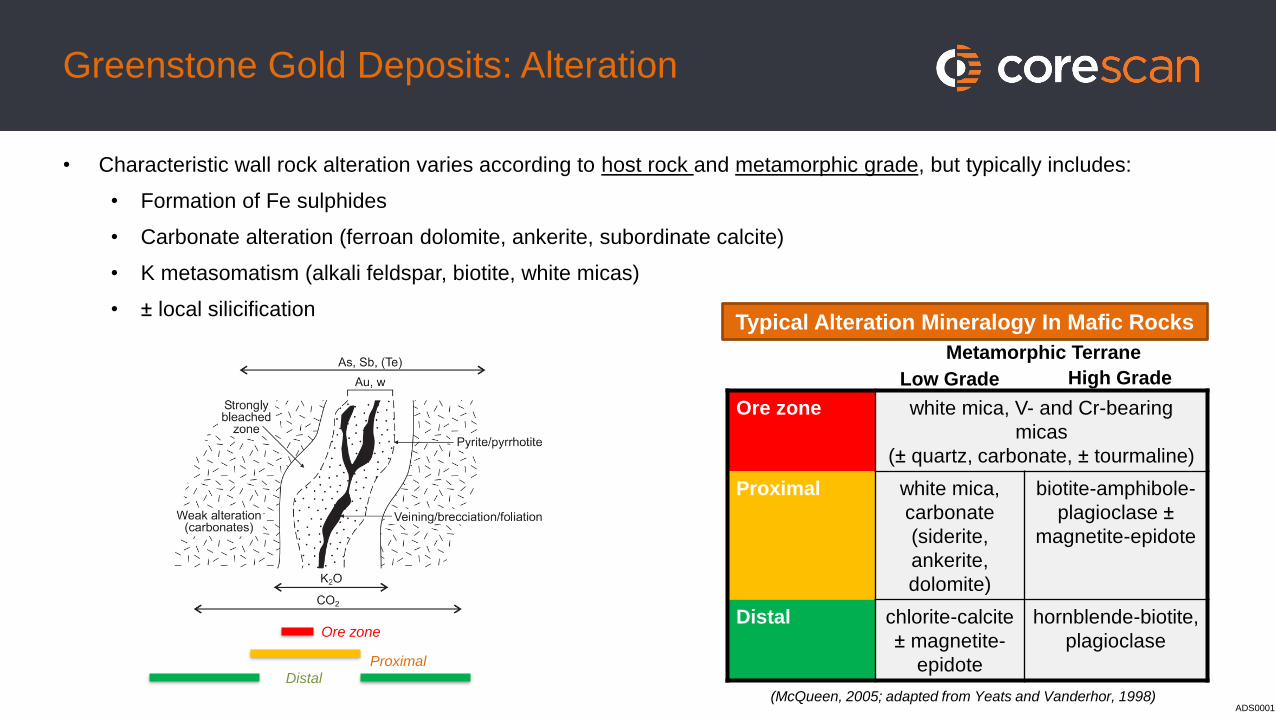
(McQueen, 2005; adapted from Yeats and Vanderhor, 1998)
Ore zone white mica, V- and Cr-bearing
micas
(± quartz, carbonate, ± tourmaline)
Proximal white mica,
carbonate
(siderite,
ankerite,
dolomite)
biotite-amphibole-
plagioclase ±
magnetite-epidote
Distal chlorite-calcite
± magnetite-
epidote
hornblende-biotite,
plagioclase
Metamorphic Terrane
Low Grade
Ore zone
Proximal
Distal
Typical Alteration Mineralogy In Mafic Rocks
High Grade
Greenstone Gold Deposits: Alteration
• Characteristic wall rock alteration varies according to host rock and metamorphic grade, but typically includes:
• Formation of Fe sulphides
• Carbonate alteration (ferroan dolomite, ankerite, subordinate calcite)
• K metasomatism (alkali feldspar, biotite, white micas)
• ± local silicification
ADS0001
50m Core Photo
Cr-Mica Match
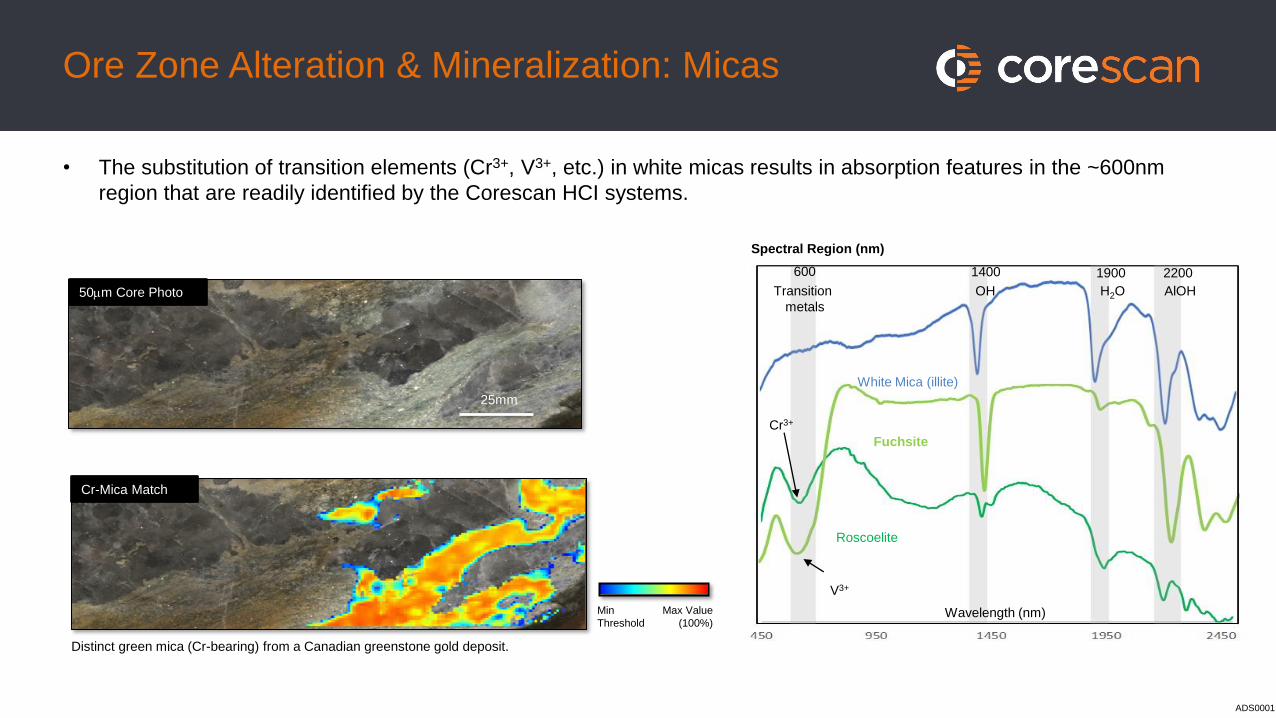
Distinct green mica (Cr-bearing) from a Canadian greenstone gold deposit.
Roscoelite
Fuchsite
White Mica (illite)
V3+
Cr3+
Wavelength (nm)
Spectral Region (nm)
600 2200
AlOH
19001400
Transition
metals
OH H2O
Min
Threshold
Max Value
(100%)
25mm
Ore Zone Alteration & Mineralization: Micas
• The substitution of transition elements (Cr3+, V3+, etc.) in white micas results in absorption features in the ~600nm
region that are readily identified by the Corescan HCI systems.
ADS0001
450 950 1450 1950 2450
Tourmaline Match
Min
ThresholdMax Value
(100%)
Spectral Region (nm)
Wavelength (nm)
2200-240019001400750 1100
(Al, Mg, Fe, B)-OHFe2+Fe3+
Refl
ecta
nce
OH H2O
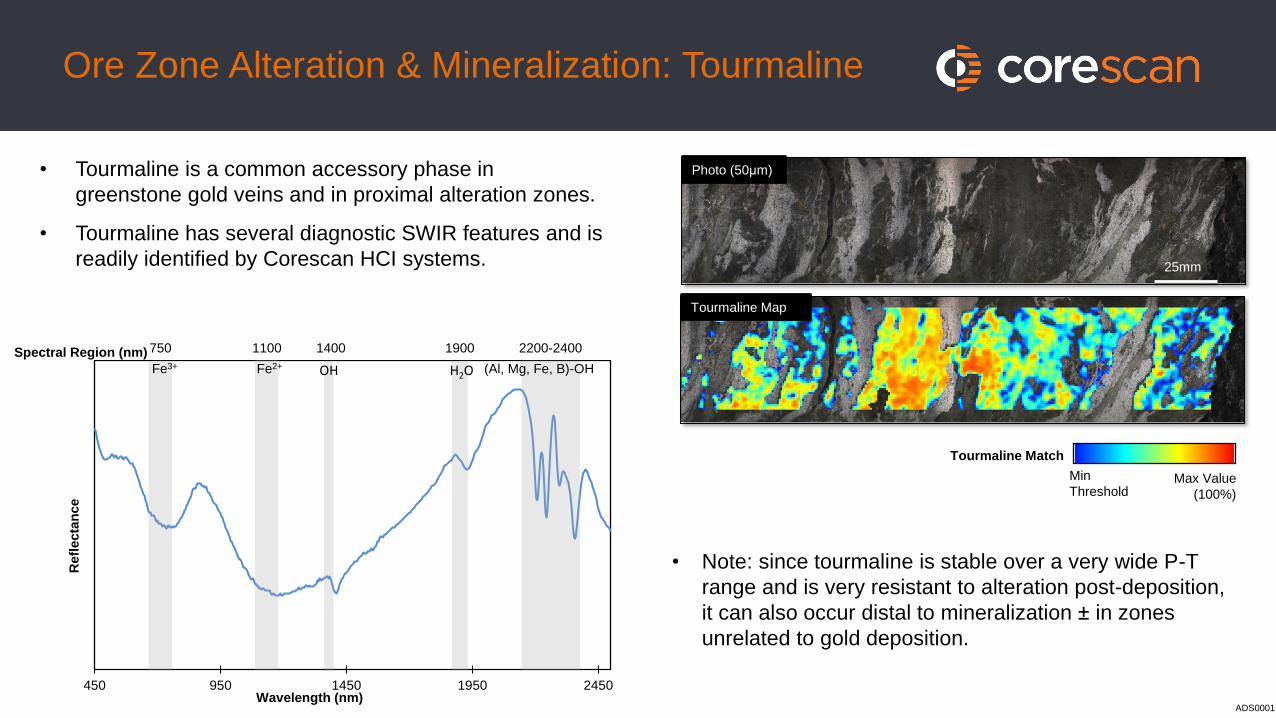
• Note: since tourmaline is stable over a very wide P-T
range and is very resistant to alteration post-deposition,
it can also occur distal to mineralization ± in zones
unrelated to gold deposition.
Tourmaline Map
Photo (50μm)
25mm
• Tourmaline is a common accessory phase in
greenstone gold veins and in proximal alteration zones.
• Tourmaline has several diagnostic SWIR features and is
readily identified by Corescan HCI systems.
Ore Zone Alteration & Mineralization: Tourmaline
ADS0001
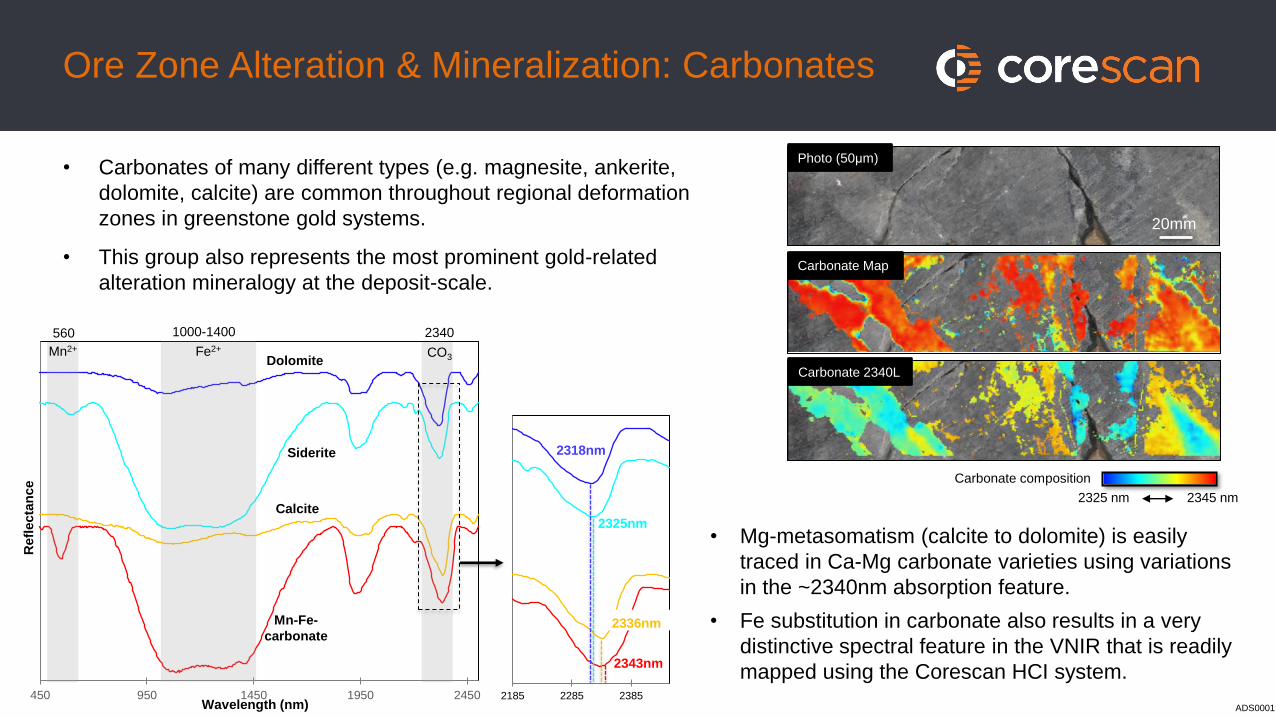
• Mg-metasomatism (calcite to dolomite) is easily
traced in Ca-Mg carbonate varieties using variations
in the ~2340nm absorption feature.
• Fe substitution in carbonate also results in a very
distinctive spectral feature in the VNIR that is readily
mapped using the Corescan HCI system.
Carbonate Map
Carbonate 2340L
Photo (50μm)
20mm
450 950 1450 1950 2450
Refl
ecta
nce
Wavelength (nm)
560 23401000-1400
2185 2285 2385
Dolomite
Siderite
Calcite
Mn-Fe-
carbonate
2318nm
2325nm
2336nm
2343nm
Mn2+ Fe2+ CO3
2345 nm2325 nm
Carbonate composition
Ore Zone Alteration & Mineralization: Carbonates
• Carbonates of many different types (e.g. magnesite, ankerite,
dolomite, calcite) are common throughout regional deformation
zones in greenstone gold systems.
• This group also represents the most prominent gold-related
alteration mineralogy at the deposit-scale.
ADS0001
Min
Threshold
Max Value
(~100%)
0
10
20
30
40
50
60
500 700 900 1100 1300 1500 1700 1900 2100 2300 2500
Sulphide Library spectrum
Wavelength (nm)
Refl
ecta
nce (
%)
Class MapPhoto (50μm) Sulphide Map
Sulphide
Chlorite
Chl + White mica
Carbonate
Fe-carb
White Mica
Hydrous silica
Featureless Slope
20mm
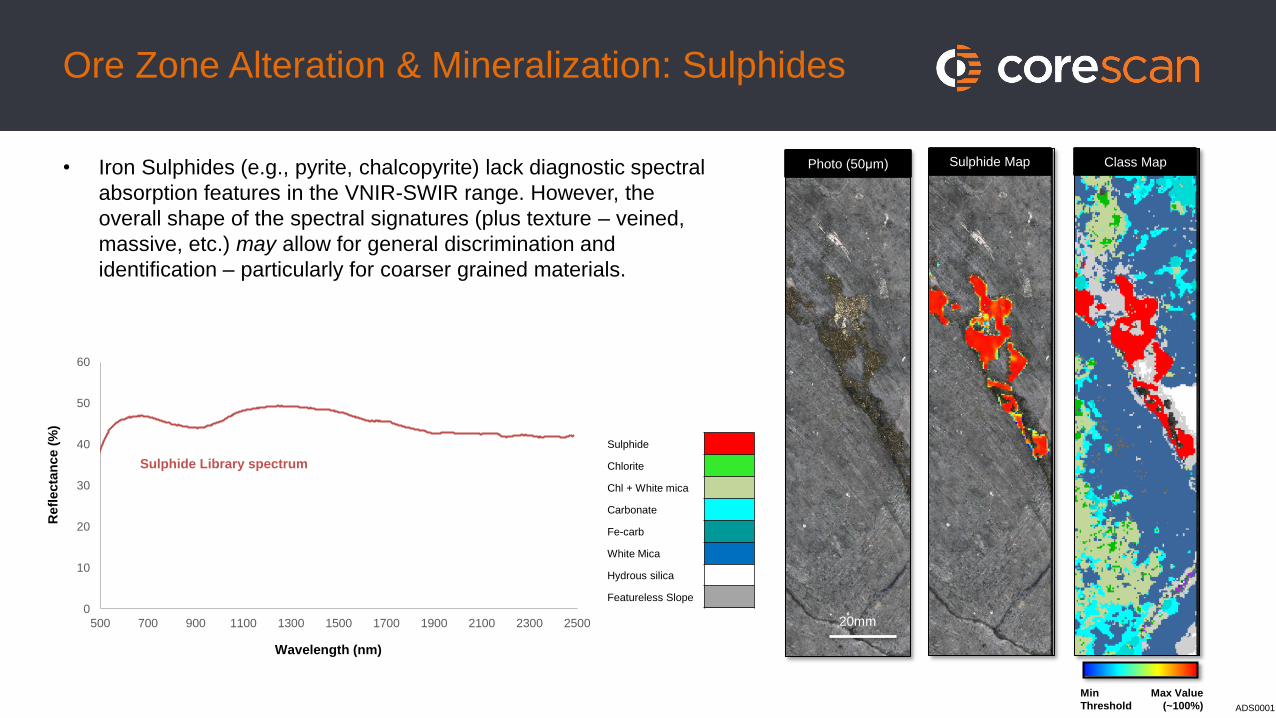
Ore Zone Alteration & Mineralization: Sulphides
• Iron Sulphides (e.g., pyrite, chalcopyrite) lack diagnostic spectral
absorption features in the VNIR-SWIR range. However, the
overall shape of the spectral signatures (plus texture – veined,
massive, etc.) may allow for general discrimination and
identification – particularly for coarser grained materials.
ADS0001
2200-240019001400750Spectral Region (nm)
Wavelength (nm)
450 950 1450 1950 2450
(Al,Mg,Fe)
-OH
Fe3+
Refl
ecta
nce
OH H2O
Biotite
Actinolite
Biotite Map
Photo (50μm)
Amphibole Map
Min
Threshold
Max Value
(100%)
15mm
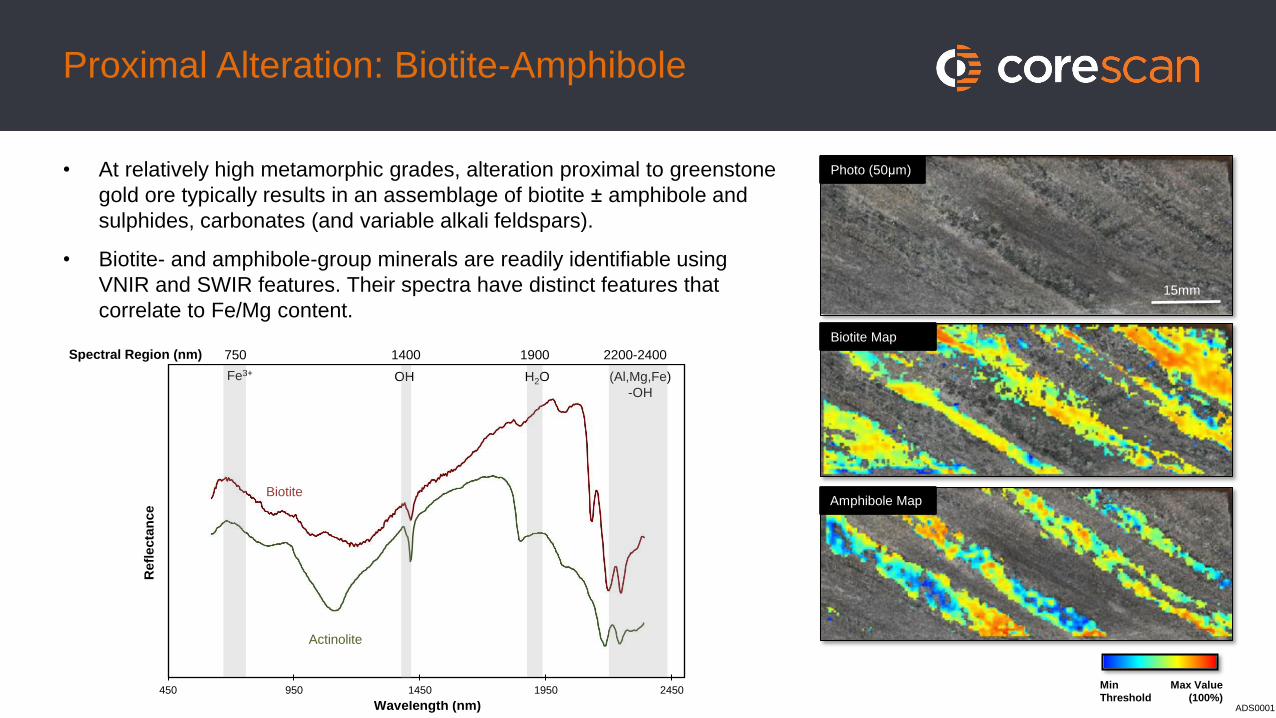
Proximal Alteration: Biotite-Amphibole
• At relatively high metamorphic grades, alteration proximal to greenstone
gold ore typically results in an assemblage of biotite ± amphibole and
sulphides, carbonates (and variable alkali feldspars).
• Biotite- and amphibole-group minerals are readily identifiable using
VNIR and SWIR features. Their spectra have distinct features that
correlate to Fe/Mg content.
ADS0001
Min
Threshold
Max Value
(100%)
White Mica Map
Photo (50μm)
40mm
Wavelength (nm)
1400 1900 2200Spectral Region (nm)
Reflecta
nce (
R)
500 1000 1500 2000 2500
White Mica
White Mica
+ Iron Oxide
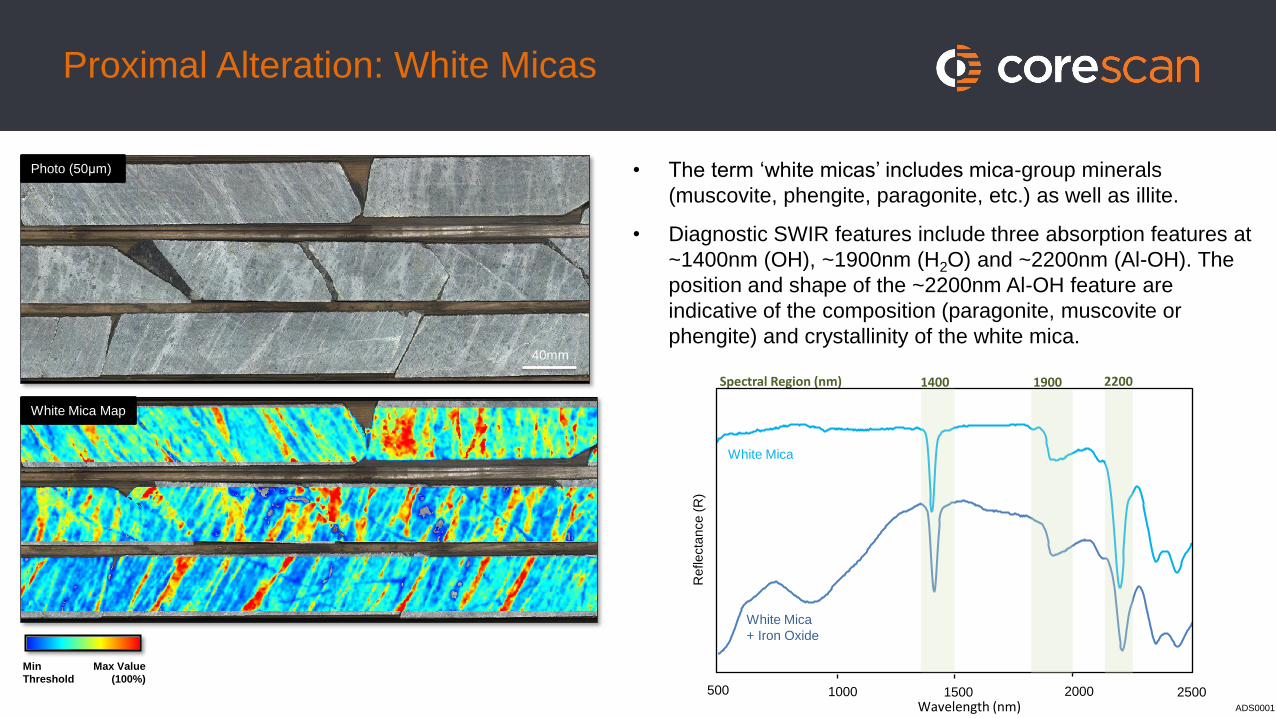
Proximal Alteration: White Micas
• The term ‘white micas’ includes mica-group minerals
(muscovite, phengite, paragonite, etc.) as well as illite.
• Diagnostic SWIR features include three absorption features at
~1400nm (OH), ~1900nm (H2O) and ~2200nm (Al-OH). The
position and shape of the ~2200nm Al-OH feature are
indicative of the composition (paragonite, muscovite or
phengite) and crystallinity of the white mica.
ADS0001
Wavelength (nm)
450 950 1450 1950 2450
Spectral Region (nm) 19001400
OH H2O
2250
(Fe,Mg)-OH
2350
Chlorite
Epidote
20mm
Chlorite Map
Photo (50μm)
Epidote Map
Class Map
Min
Threshold
Max Value
(100%)
Carbonate
Epidote
Chlorite
Aspectral
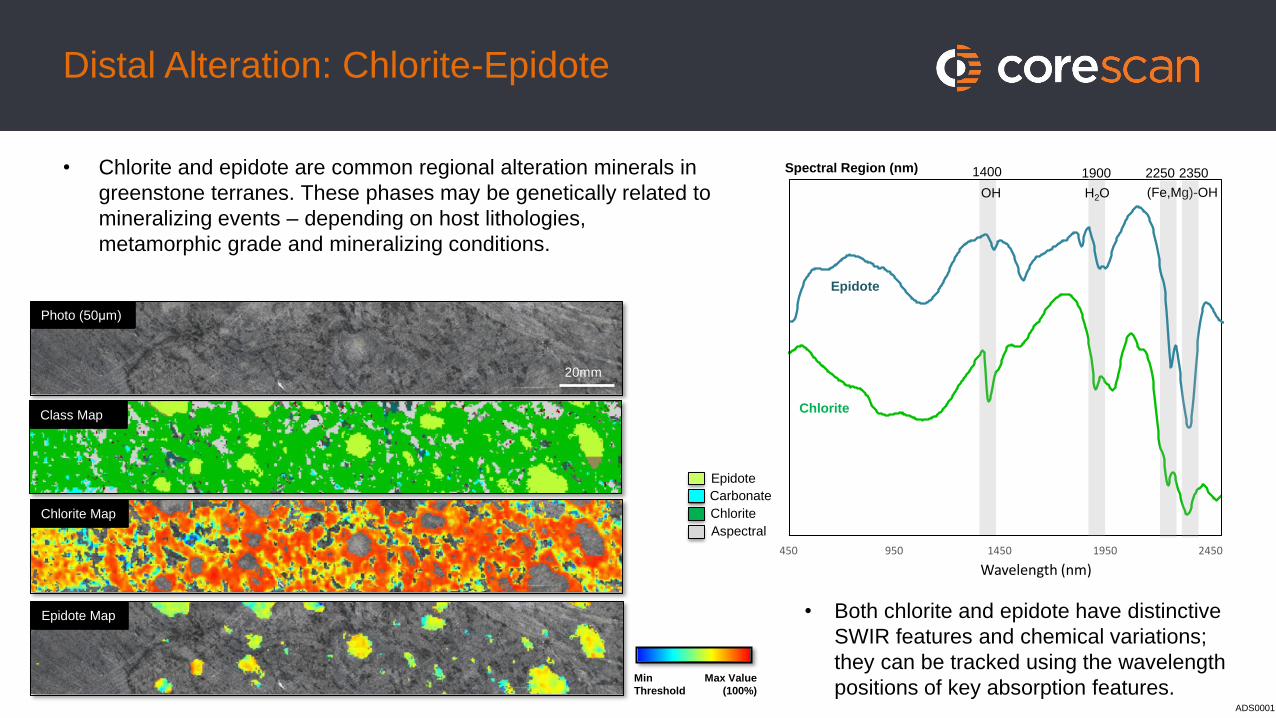
• Both chlorite and epidote have distinctive
SWIR features and chemical variations;
they can be tracked using the wavelength
positions of key absorption features.
Distal Alteration: Chlorite-Epidote
• Chlorite and epidote are common regional alteration minerals in
greenstone terranes. These phases may be genetically related to
mineralizing events – depending on host lithologies,
metamorphic grade and mineralizing conditions.
ADS0001
Wavelength (nm)
450 950 1450 1950 2450
Spectral Region (nm) 19001400
OH H2O
2300-2400
(Fe,Mg)-OH
Fe-talc
Talc
Tremolite
Fe-Talc Map
Photo (50μm)
Talc Map
Class Map
Min
Threshold
Max Value
(~100%)
Carbonate
Hematite
Fe-Talc
Talc
Serpentine
25mm
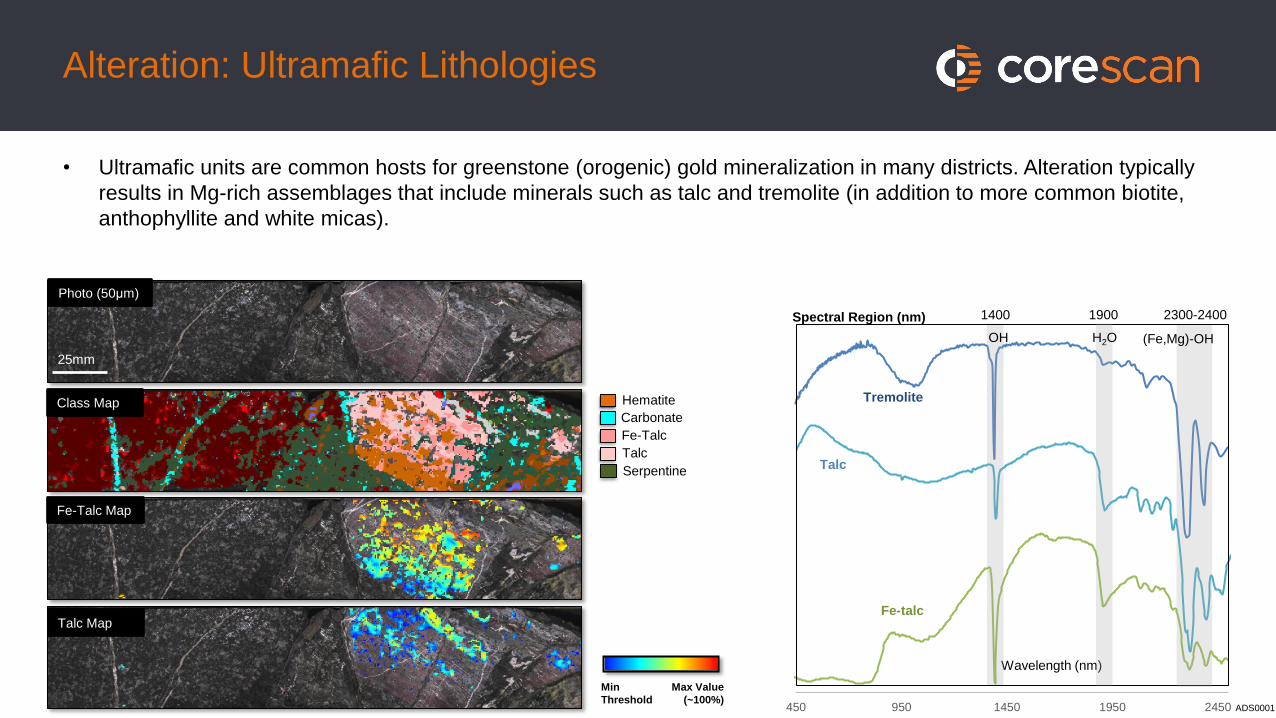
Alteration: Ultramafic Lithologies
• Ultramafic units are common hosts for greenstone (orogenic) gold mineralization in many districts. Alteration typically
results in Mg-rich assemblages that include minerals such as talc and tremolite (in addition to more common biotite,
anthophyllite and white micas).
ADS0001
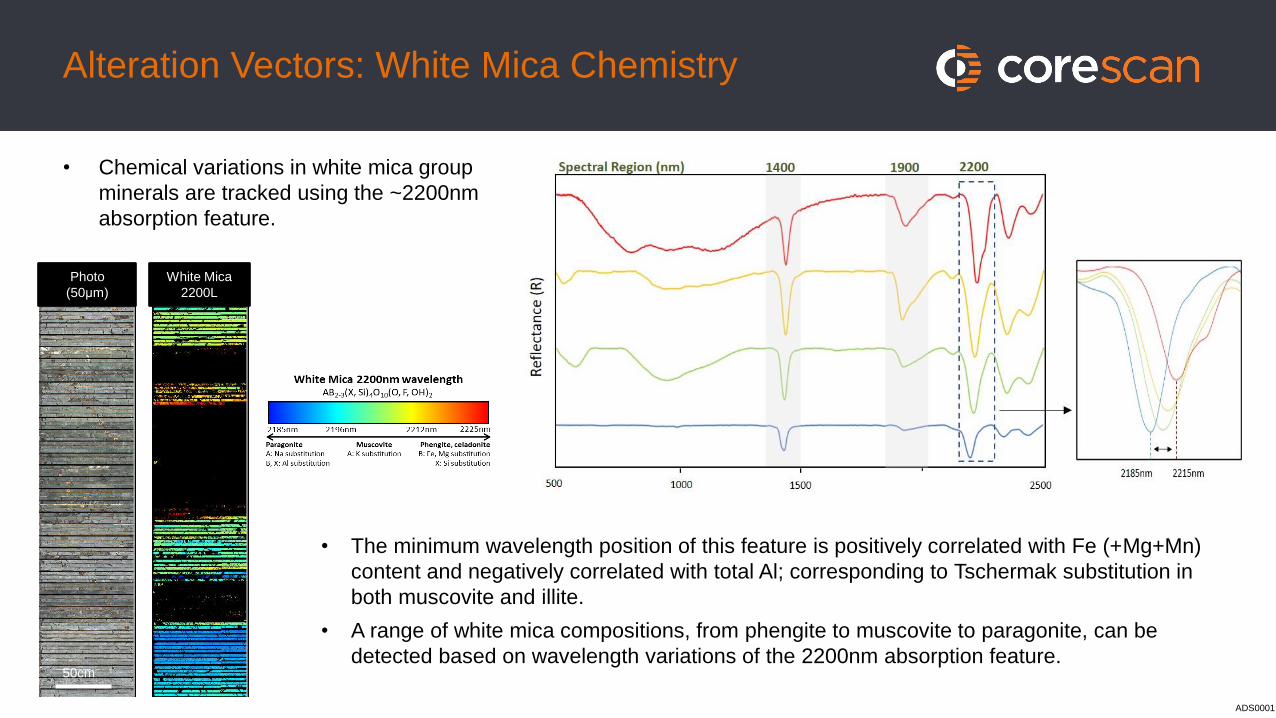
• The minimum wavelength position of this feature is positively correlated with Fe (+Mg+Mn)
content and negatively correlated with total Al; corresponding to Tschermak substitution in
both muscovite and illite.
• A range of white mica compositions, from phengite to muscovite to paragonite, can be
detected based on wavelength variations of the 2200nm absorption feature.
White Mica
2200L
Photo
(50μm)
50cm
Alteration Vectors: White Mica Chemistry
• Chemical variations in white mica group
minerals are tracked using the ~2200nm
absorption feature.
ADS0001
Cudahy, 2016
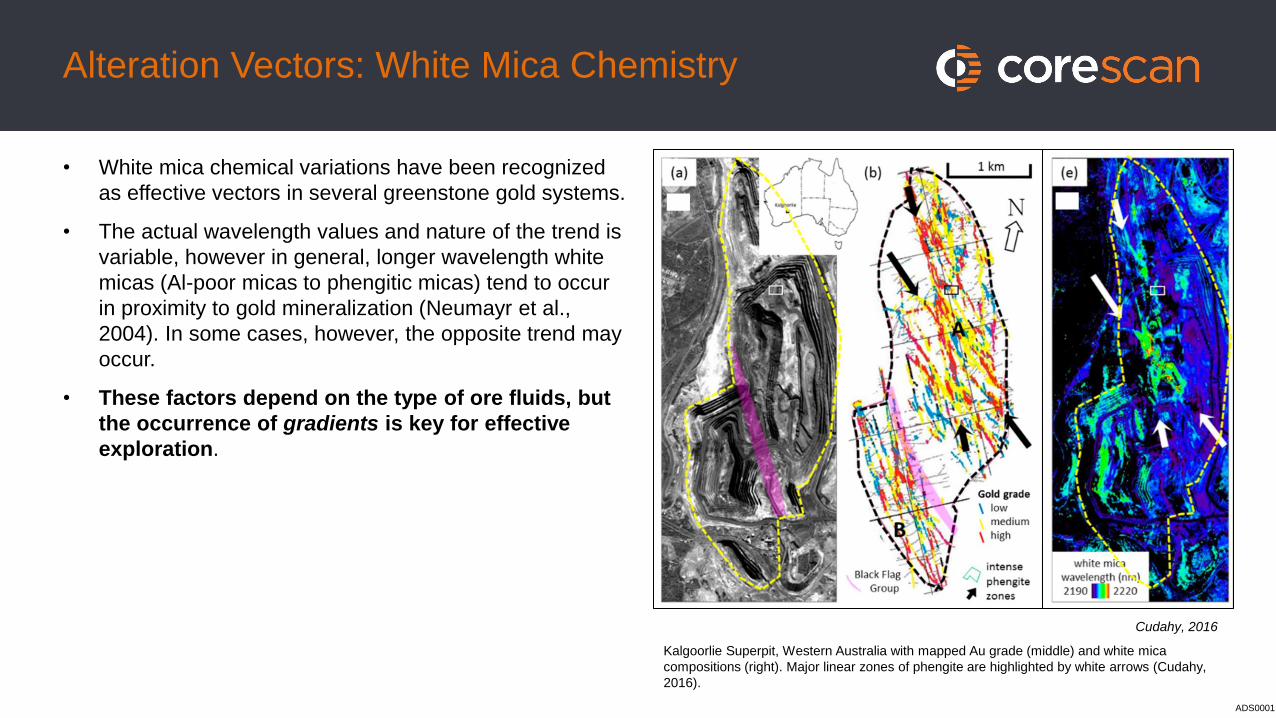
Cudahy, 2016
Kalgoorlie Superpit, Western Australia with mapped Au grade (middle) and white mica
compositions (right). Major linear zones of phengite are highlighted by white arrows (Cudahy,
2016).
Alteration Vectors: White Mica Chemistry
• White mica chemical variations have been recognized
as effective vectors in several greenstone gold systems.
• The actual wavelength values and nature of the trend is
variable, however in general, longer wavelength white
micas (Al-poor micas to phengitic micas) tend to occur
in proximity to gold mineralization (Neumayr et al.,
2004). In some cases, however, the opposite trend may
occur.
• These factors depend on the type of ore fluids, but
the occurrence of gradients is key for effective
exploration.
ADS0001
Chlorite 2250L
Photo (50μm)
20mm
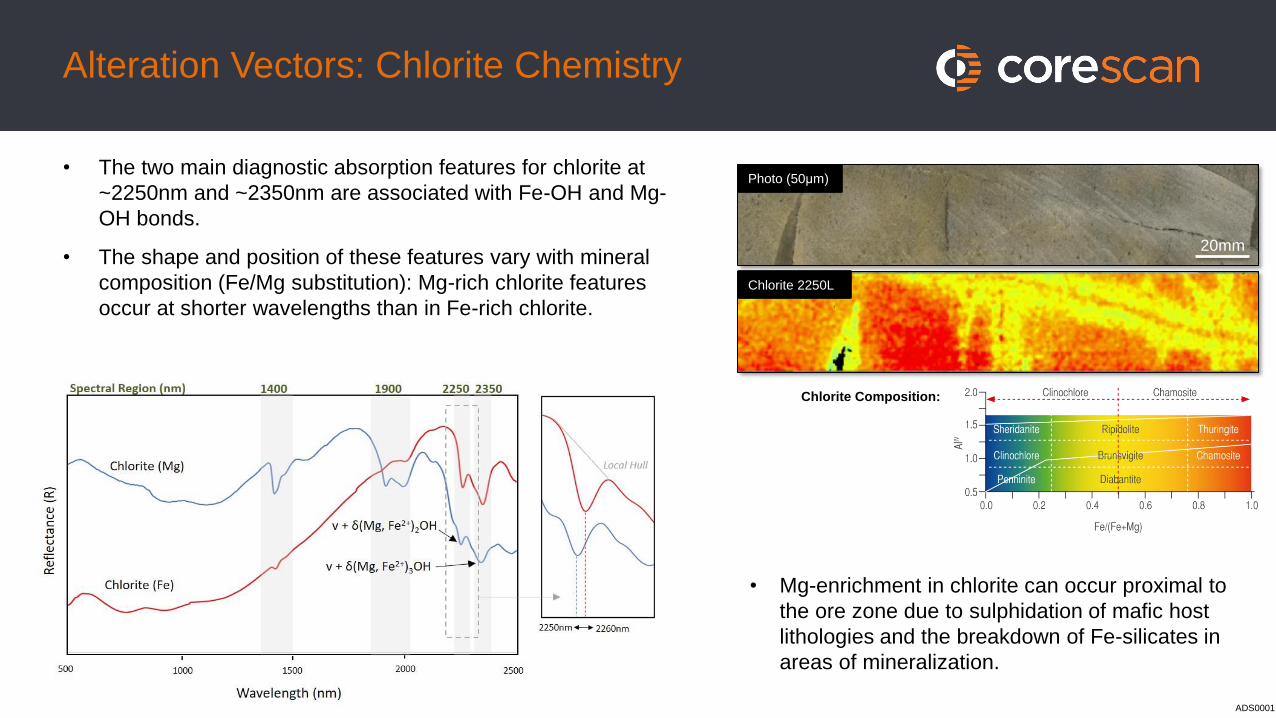
Chlorite Composition:
• Mg-enrichment in chlorite can occur proximal to
the ore zone due to sulphidation of mafic host
lithologies and the breakdown of Fe-silicates in
areas of mineralization.
Alteration Vectors: Chlorite Chemistry
• The two main diagnostic absorption features for chlorite at
~2250nm and ~2350nm are associated with Fe-OH and Mg-
OH bonds.
• The shape and position of these features vary with mineral
composition (Fe/Mg substitution): Mg-rich chlorite features
occur at shorter wavelengths than in Fe-rich chlorite.
ADS0001
Biotite 2350L
Photo (50μm)
30mm
Mg-rich Fe-rich
2340nm 2360nm
Refl
ecta
nce (
R)
Wavelength (nm)
500 1000 1500 2000 2500
1400 1900 2250Spectral Region (nm) 23802350
~2250 ~2380~2350
Mg Fe
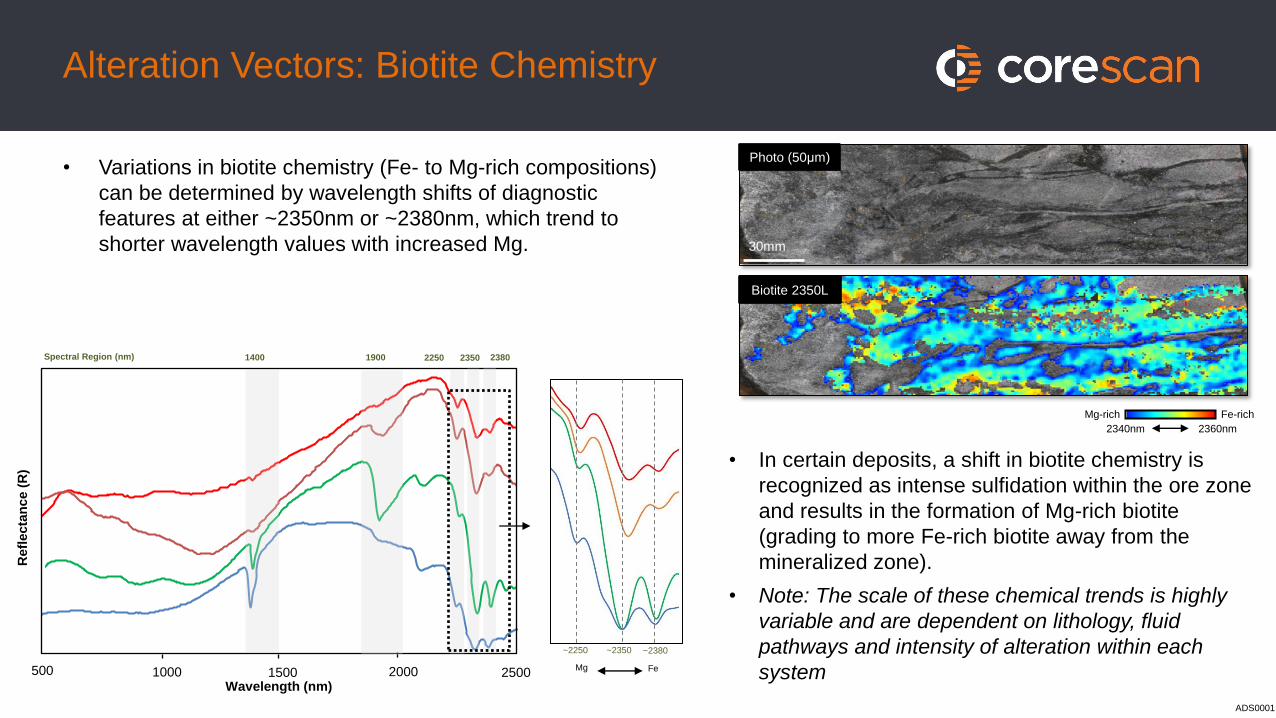
• In certain deposits, a shift in biotite chemistry is
recognized as intense sulfidation within the ore zone
and results in the formation of Mg-rich biotite
(grading to more Fe-rich biotite away from the
mineralized zone).
• Note: The scale of these chemical trends is highly
variable and are dependent on lithology, fluid
pathways and intensity of alteration within each
system
Alteration Vectors: Biotite Chemistry
• Variations in biotite chemistry (Fe- to Mg-rich compositions)
can be determined by wavelength shifts of diagnostic
features at either ~2350nm or ~2380nm, which trend to
shorter wavelength values with increased Mg.
ADS0001

Structural Features
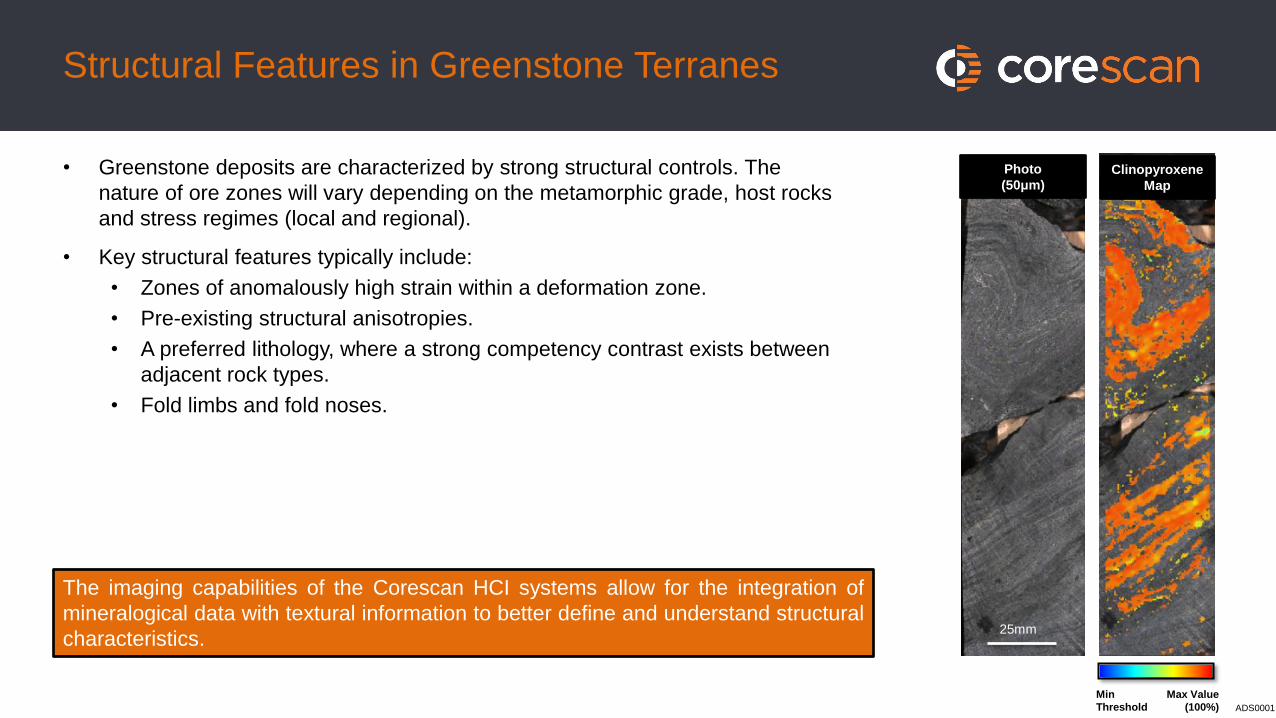
Photo
(50μm)
Clinopyroxene
Map
25mm
The imaging capabilities of the Corescan HCI systems allow for the integration of
mineralogical data with textural information to better define and understand structural
characteristics.
Min
Threshold
Max Value
(100%)
Structural Features in Greenstone Terranes
• Greenstone deposits are characterized by strong structural controls. The
nature of ore zones will vary depending on the metamorphic grade, host rocks
and stress regimes (local and regional).
• Key structural features typically include:
• Zones of anomalously high strain within a deformation zone.
• Pre-existing structural anisotropies.
• A preferred lithology, where a strong competency contrast exists between
adjacent rock types.
• Fold limbs and fold noses.
ADS0001
Min
Threshold
Max Value
(100%) 20cm
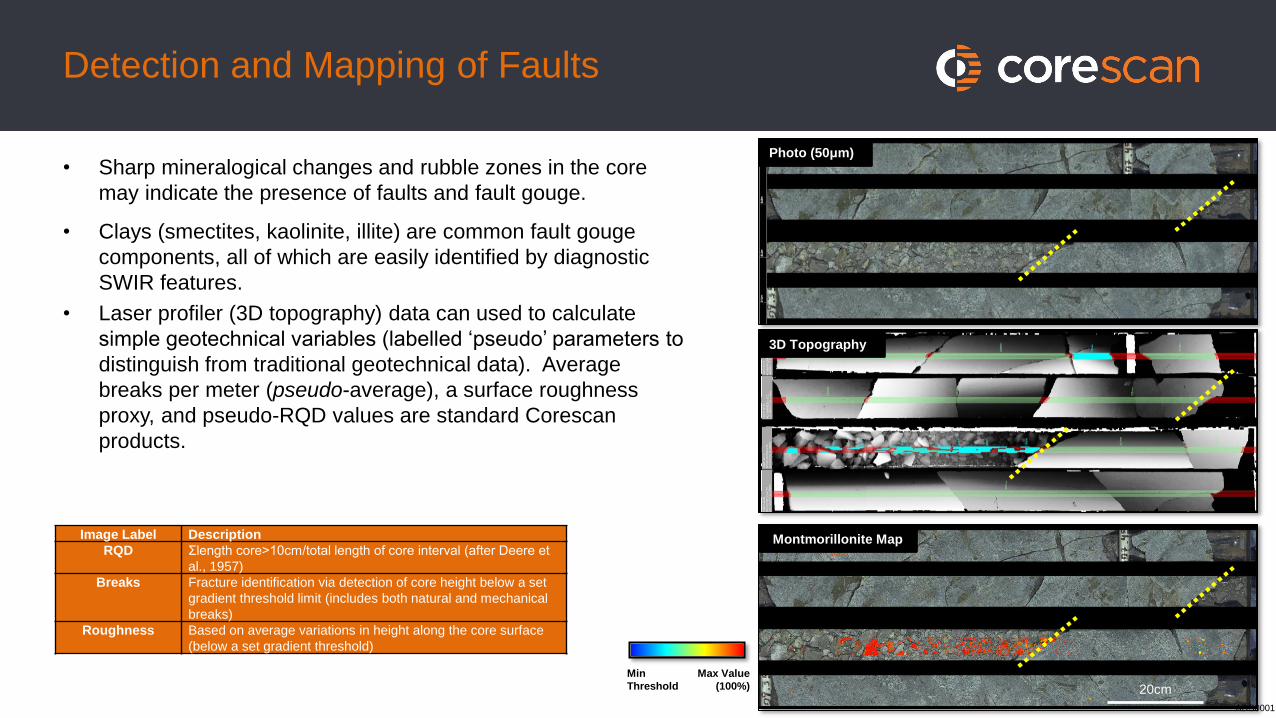
Photo (50μm)
3D Topography
Montmorillonite MapImage Label Description
RQD Σlength core>10cm/total length of core interval (after Deere et
al., 1957)
Breaks Fracture identification via detection of core height below a set
gradient threshold limit (includes both natural and mechanical
breaks)
Roughness Based on average variations in height along the core surface
(below a set gradient threshold)
Detection and Mapping of Faults
• Sharp mineralogical changes and rubble zones in the core
may indicate the presence of faults and fault gouge.
• Clays (smectites, kaolinite, illite) are common fault gouge
components, all of which are easily identified by diagnostic
SWIR features.
• Laser profiler (3D topography) data can used to calculate
simple geotechnical variables (labelled ‘pseudo’ parameters to
distinguish from traditional geotechnical data). Average
breaks per meter (pseudo-average), a surface roughness
proxy, and pseudo-RQD values are standard Corescan
products.
ADS0001
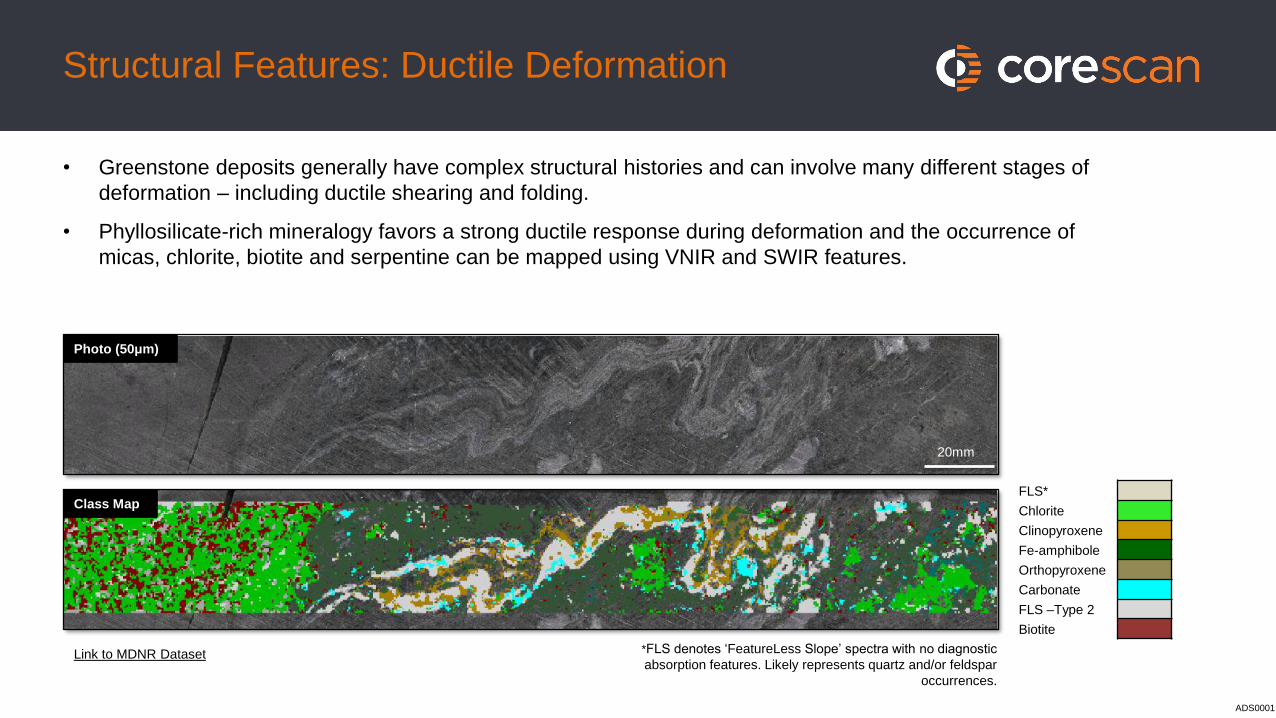
FLS*
Chlorite
Clinopyroxene
Fe-amphibole
Orthopyroxene
Carbonate
FLS –Type 2
Biotite
Link to MDNR Dataset
Photo (50μm)
Class Map
20mm
*FLS denotes ‘FeatureLess Slope’ spectra with no diagnostic
absorption features. Likely represents quartz and/or feldspar
occurrences.
Structural Features: Ductile Deformation
• Greenstone deposits generally have complex structural histories and can involve many different stages of
deformation – including ductile shearing and folding.
• Phyllosilicate-rich mineralogy favors a strong ductile response during deformation and the occurrence of
micas, chlorite, biotite and serpentine can be mapped using VNIR and SWIR features.
ADS0001
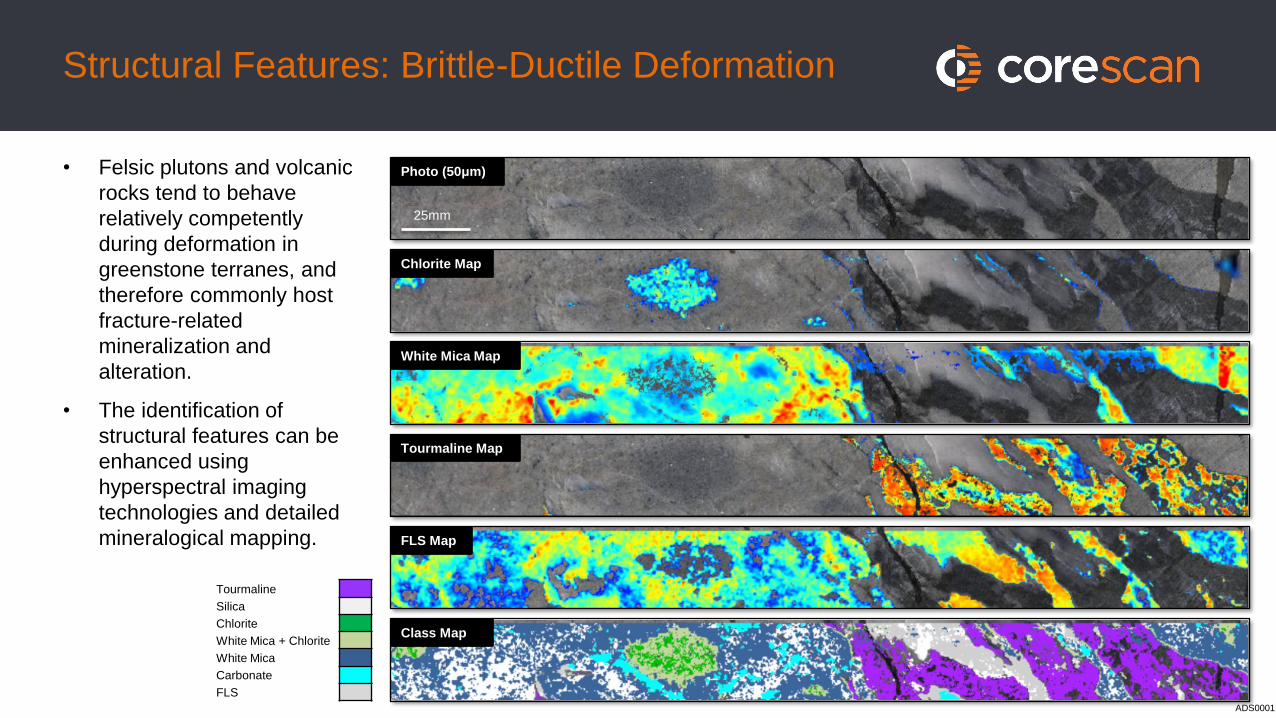
Photo (50μm)
Chlorite Map
White Mica Map
Tourmaline Map
FLS Map
Class Map
25mm
Tourmaline
Silica
Chlorite
White Mica + Chlorite
White Mica
Carbonate
FLS
Structural Features: Brittle-Ductile Deformation
• Felsic plutons and volcanic
rocks tend to behave
relatively competently
during deformation in
greenstone terranes, and
therefore commonly host
fracture-related
mineralization and
alteration.
• The identification of
structural features can be
enhanced using
hyperspectral imaging
technologies and detailed
mineralogical mapping.
ADS0001
The information contained in this document is confidential, privileged and only for the information of the intended recipient and may not be used, published or
redistributed without the prior written consent of Corescan.
Any opinions expressed in this document are in good faith and while every care has been taken in preparing this document, Corescan makes no
representations and gives no guarantees of whatever nature in respect to this document, including the accuracy or completeness of any information, facts
and/or opinions contained therein. Corescan, the directors, employees and agents cannot be held liable for the use of and reliance on any information, facts
and/or opinions contained in this document.
Disclaimer
AP0001

February 2021
FOR RESTRICTED USE ONLY – NO DISTRIBUTION ALLOWED
CORESCAN: APPLICATIONS IN
HYPERSPECTRAL CORE IMAGING APPLICATIONS
- GREENSTONE GOLD DEPOSITS -