Hydrogen and Fuel Cell Activities - Department of Energy · Hydrogen and Fuel Cell Activities Dr....
42
1 | Fuel Cell Technologies Program Source: US DOE 8/5/2011 eere.energy.gov 5 th International Conference on Polymer Batteries & Fuel Cells Argonne, Illinois Hydrogen and Fuel Cell Activities Dr. Sunita Satyapal U.S. Department of Energy Fuel Cell Technologies Program Program Manager August 4, 2011
Transcript of Hydrogen and Fuel Cell Activities - Department of Energy · Hydrogen and Fuel Cell Activities Dr....

1 | Fuel Cell Technologies Program Source: US DOE 8/5/2011 eere.energy.gov
5th International Conference on Polymer
Batteries & Fuel Cells
Argonne, Illinois
Hydrogen and Fuel Cell Activities
Dr. Sunita Satyapal
U.S. Department of Energy
Fuel Cell Technologies Program
Program Manager August 4, 2011

2 | Fuel Cell Technologies Program Source: US DOE 8/5/2011 eere.energy.gov
Fuel Cells: Benefits & Market Potential
The Role of Fuel Cells Key Benefits
Very High Efficiency
Reduced CO2 Emissions
• 35–50%+ reductions for CHP systems (>80% with biogas)
• 55–90% reductions for light-duty vehicles
• up to 60% (electrical)
• up to 70% (electrical, hybrid fuel
cell / turbine)
• up to 85% (with CHP)
Reduced Oil Use
• >95% reduction for FCEVs (vs. today’s gasoline ICEVs)
• >80% reduction for FCEVs (vs. advanced PHEVs)
Reduced Air Pollution
• up to 90% reduction in criteria pollutants for CHP systems
Fuel Flexibility
• Clean fuels — including
biogas, methanol, H2
• Hydrogen — can be produced
cleanly using sunlight or
biomass directly, or through
electrolysis, using renewable
electricity
• Conventional fuels —
including natural gas, propane,
diesel

3 | Fuel Cell Technologies Program Source: US DOE 8/5/2011 eere.energy.gov
Fuel Cell Market Overview
0
25
50
75
100
2008 2009 2010
USA Japan South Korea Germany Other
(MW
)
Megawatts Shipped, Key Countries: 2008-2010
North American Shipments by Application
Fuel cell market continues to grow
• ~36% increase in global MWs shipped
• ~50% increase in US MWs shipped
3
FuelCells2000, Pike Research, Fuel Cell Today, ANL
Widespread market penetration of fuel
cells could lead to:
• 180,000 new jobs in the US by 2020
• 675,000 jobs by 2035
Various analyses project that the global
fuel cell/hydrogen market could reach
maturity over the next 10 to 20 years,
producing revenues of:
• $14 – $31 billion/year for stationary
power
• $11 billion/year for portable power
• $18 – $97 billion/year for transportation
http://www1.eere.energy.gov/hydrogenandfuelcells/pdfs/program_plan2010.pdf

4 | Fuel Cell Technologies Program Source: US DOE 8/5/2011 eere.energy.gov
Fuel Cell Patents Reflect Emerging Growth
Clean Energy Patent Growth Index[1] shows that fuel cell patents lead in the clean
energy field with nearly 1,000 fuel cell patents issued worldwide in 2010.
• 3x more than the second place holder, solar, which has just ~360 patents.
• Number of fuel cell patents grew > 57% in 2010.
[1} http://cepgi.typepad.com/heslin_rothenberg_farley_/

5 | Fuel Cell Technologies Program Source: US DOE 8/5/2011 eere.energy.gov
Fuel Cell Patents per Country
Overall patents led by USA and Japan. Significant growth and acceleration of fuel
cell patents by Japan to move ahead of the USA by 2010.
Annual granted fuel cell patents per country of origin (top ten)
FuelCell Today

6 | Fuel Cell Technologies Program Source: US DOE 8/5/2011 eere.energy.gov
Fuel Cells - Where are we today?
Fuel Cells for
Transportation
In the U.S., there are currently:
> 200 fuel cell vehicles
~ 20 active fuel cell buses
~ 60 fueling stations
In the U.S., there are currently:
~9 million metric tons
of H2 produced annually
> 1200 miles of
H2 pipelines
Fuel Cells for Stationary Power,
Auxiliary Power, and Specialty
Vehicles
Fuel cells can be a
cost-competitive
option for critical-load
facilities, backup
power, and forklifts.
The largest markets for fuel cells today are in
stationary power, portable power, auxiliary
power units, and forklifts.
~75,000 fuel cells have been shipped worldwide.
>15,000 fuel cells shipped in 2009
Sept. 2009: Auto
manufacturers
from around the
world signed a
letter of
understanding
supporting fuel
cell vehicles in
anticipation of
widespread
commercialization,
beginning in 2015.
Source: US DOE 09/2010
Production & Delivery of
Hydrogen

7 | Fuel Cell Technologies Program Source: US DOE 8/5/2011 eere.energy.gov
Analysis by Argonne National Lab, DOE Vehicle Technologies Program, and FCT
Program shows benefits from a portfolio of options
Notes:
For a projected state of technologies in 2035-2045. Ultra-low carbon renewable electricity includes wind, solar, etc. Does not include the lifecycle
effects of vehicle manufacturing and infrastructure construction/decommissioning.
Analysis & Assumptions at: http://hydrogen.energy.gov/pdfs/10001_well_to_wheels_gge_petroleum_use.pdf
Well-to-Wheels Greenhouse Gases Emissions
Grams CO2-equivalent per mile
H2 from Natural Gas
Even FCEVs fueled by
H2 from distributed NG
can result in a >50%
reduction in GHG
emissions from
today’s vehicles.
Use of H2 from NG
decouples carbon from
energy use—i.e., it
allows carbon to be
managed at point of
production vs at the
tailpipe.
Even greater emissions
reductions are possible
as hydrogen from
renewables enter the
market.
Well-to-Wheels CO2 Analysis

8 | Fuel Cell Technologies Program Source: US DOE 8/5/2011 eere.energy.gov
Notes:
For a projected state of technologies in 2035-2045. Ultra-low carbon renewable electricity includes wind, solar, etc. Does not include the life-cycle
effects of vehicle manufacturing and infrastructure construction/decommissioning.
Analysis & Assumptions at: http://hydrogen.energy.gov/pdfs/10001_well_to_wheels_gge_petroleum_use.pdf
Well-to-Wheels Petroleum Energy Use
Btu of petroleum per mile
H2 from Natural Gas
FCEVs fueled by H2 from
distributed natural gas
can almost completely
eliminate petroleum use.
1 million FCEVs would
only increase current
natural gas consumption
by less than 0.2%*
* 1 million FCEVs would require ~1
billion cubic meters/year of NG;
current NG consumption is about 600
billion cubic meters/yr
Well-to-Wheels Petroleum Analysis
Analysis by Argonne National Lab, DOE Vehicle Technologies Program, and FCT
Program shows benefits from a portfolio of options.

9 | Fuel Cell Technologies Program Source: US DOE 8/5/2011 eere.energy.gov
Te
ch
no
lo
gy
Ba
rrie
rs*
Ec
on
om
ic
&
In
stitu
tio
na
l
Ba
rrie
rs
Fuel Cell Cost & Durability Targets*:
Stationary Systems: $750 per kW,
40,000-hr durability
Vehicles: $30 per kW, 5,000-hr durability
Safety, Codes & Standards Development
Domestic Manufacturing & Supplier Base
Public Awareness & Acceptance
Hydrogen Supply & Delivery Infrastructure
Hydrogen Cost Target*: $2 – 4 /gge, (dispensed and untaxed)
Key Challenges
Technology
Validation:
Technologies must
be demonstrated
under real-world
conditions. Assisting the
growth of early
markets will help to
overcome many
barriers, including
achieving
significant cost
reductions through
economies of scale.
Market
Transformation
Hydrogen Storage Capacity Target: > 300-mile range for vehicles—without
compromising interior space or performance
The Program has been addressing the key challenges facing the widespread
commercialization of fuel cells.

10 | Fuel Cell Technologies Program Source: US DOE 8/5/2011 eere.energy.gov
Program R&D – Federal Role

11 | Fuel Cell Technologies Program Source: US DOE 8/5/2011 eere.energy.gov
Balance of Plant ($/kW, includes assembly & testing)
Stack ($/kW)
Current status: $51/kW vs
target of $30/kW
Initial Estimate
Target
$30/kW
$51/kW $61/kW
$73/kW $94/kW
$108/kW
Projected high-
volume cost of fuel
cells has been
reduced to $51/kW
(2010)*
•More than 30% reduction since 2008
•More than 80% reduction since 2002
*Based on projection to high-volume manufacturing
(500,000 units/year).
**Panel found $60 – $80/kW to be a ―valid estimate‖:
http://hydrogendoedev.nrel.gov/peer_reviews.html
Progress – Fuel Cells
2010
2007
Preliminary Results
2011 Status: $49/kW

12 | Fuel Cell Technologies Program Source: US DOE 8/5/2011 eere.energy.gov 12
Four Strategies for Catalysts & Supports R&D:
● Lower PGM Content
– Improved Pt catalyst utilization and durability
● Pt Alloys
– Pt-based alloys with comparable performance to Pt and cost less
● Novel Support Structures
– Non-carbon supports and alternative carbon structures
● Non-PGM catalysts
– Non-precious metal catalysts with improved performance and durability
Fuel Cell Challenges: Catalysts and Supports
Challenges:
• Platinum (Pt) cost is ~34% of total stack cost at high volume
• Catalyst durability needs improvement
DTI, 2010 analysis, scaled to high
volume production of 500,000 units/yr
Used $1100/Troy Ounce for Pt Cost
Stack Cost - $25/kW

13 | Fuel Cell Technologies Program Source: US DOE 8/5/2011 eere.energy.gov
Electrocatalysts for
Transportation
Applications
Statusa Targetsb
2011 2017
Platinum group metal (PGM)
total content (both electrodes) 0.19 g/kW 0.125 g/kW
PGM Total Loading 0.15 mg/cm2 0.125 mg/cm2
Loss in catalytic (mass) activityc <40% <40% loss of initial
Catalyst support lossd <10% mass loss < 10% mass loss
Mass activitye 0.24 A/mg Pt in MEA
>0.44 A/mg Pt new alloy
in RDE
0.44 A/mg PGM
Activity per volume of supported
catalyst (non-PGM)f 60 A/cm3 (measured)
160 A/cm3 (extrapolated) >300 A/cm3
a single cell status – will require scale-up b preliminary targets – approval pending c after 30,000 cycles from 0.6 – 1.0 V;
after 400 hours at 1.2 V d after 400 hours at 1.2 V e baseline @ 900mVIR-free f baseline @ 800mVIR-free
H
M/H L
M= High (significant
challenge)
= Medium/High
= Medium
= Low (minimal
challenge)
H
M/H L
M= High (significant
challenge)
= Medium/High
= Medium
= Low (minimal
challenge)
Fuel Cell Catalysts Technical Targets vs. Status
Update of Multiyear RD&D Plan in process

14 | Fuel Cell Technologies Program Source: US DOE 8/5/2011 eere.energy.gov
Catalysts: Non-PGM catalysts demonstrate activity approaching that of Pt
Catalyst SEM: Layered-graphene
sheet marked with green arrow;
FeCo-containing nanoparticle
shown with red arrow.
The Synthesis
t (hours)
0 100 200 300 400 500 600 700
i (A
/cm
2)
0.2
0.4
0.6
PANI-FeCo-C
Stability at 0.40 V
Activity vs. Pt
P. Zelenay et al., LANL
Progress - Fuel Cell R&D
• High ORR activity reached with polyaniline-based
and cyanamide-based catalysts
• Intrinsic activity getting close that of Pt, but electrode structure needs improvement
G. Wu, K. L. More, C. M.
Johnston, P. Zelenay,
Science, 332, 443-7 (2011)

15 | Fuel Cell Technologies Program Source: US DOE 8/5/2011 eere.energy.gov 15
Catalysts: Nano-segregated binary and ternary catalysts demonstrate performance more than 6X that of platinum
N. Markovic et al., ANL
Performance: FePt(shell)/Au(core) demonstrates ORR mass activity more than 3X that of Pt/C Durability: Maintains 80% of initial activity after 80,000 potential cycles (cf. less than 20% for Pt/C)
Nanosegregated Binary (PtNi) NanosegregatedTernary (PtFeAu)
2010 Progress & Accomplishments
Performance: Nanosegregated PtNi/C catalysts have ORR mass activity ~0.35 A/mg in MEA testing – approaching 0.44 A/mg target Durability: 3X improved retention of mass activity after 20,000 potential cycles compared to Pt/C

16 | Fuel Cell Technologies Program Source: US DOE 8/5/2011 eere.energy.gov 16
Membrane R&D:
● High-Temperature, Low Humidity Conductivity
– Phase segregation (polymer & membrane)
– Non-aqueous proton conductors
– Hydrophilic additives
● High Conductivity and Durability Across Operating Range with Cycling
– Mechanical support or membrane reinforcement
– Chemical stabilization (additives, end-group capping)
– Polymer structure (side chain length, grafting, cross-linking, backbone properties, blends, EW)
– Processing parameters (temperature, solvents)
– New materials
Challenges:
• Membranes account for 45% of stack cost at low volume
• Limits on operating range
• Chemical and mechanical durability
Fuel Cell Challenges: Membranes
DTI, 2010 analysis, production of 1,000
units/yr
Stack Cost - $144/kW

17 | Fuel Cell Technologies Program Source: US DOE 8/5/2011 eere.energy.gov
Characteristic Units
2011 2017 Nafion®
status target NRE211
Maximum oxygen crossover mA/cm2 <1 2 2.7
Maximum hydrogen crossover mA/cm2 <1.8 2 2.2
Area specific resistance at:
Max operating temp and 40 – 80
kPa water partial pressure
ohm cm2 0.023 (40 kPa)
0.012 (80 kPa)
0.02 0.186
80
C and water partial
pressures from 25 - 45 kPa
ohm cm2 0.017 (25 kPa)
0.006 (44 kPa)
0.02 0.03-0.12
30
C and water partial
pressures up to 4 kPa
ohm cm2 0.02 (3.8 kPa) 0.03 0.049
-20
C ohm cm2 0.1 0.2 0.179
Operating temperature
C <120 ≤120 120
Minimum electrical resistance ohm cm2 1000
Cost $/m2 20
Durability
Mechanical Cycles w/<10 sccm
crossover >20,000 20,000 5,000
Chemical hours >2,300 500
Fuel Cell Membrane Targets

18 | Fuel Cell Technologies Program Source: US DOE 8/5/2011 eere.energy.gov
Innovative membranes demonstrate high conductivity at low RH
• PFIA membranes meet
most DOE targets for
performance and
durability
• PFIA maintains high
crystallinity at lower
equivalent weight than
PFSAs better
mechanical properties
• High conductivity with
PFIA under dry
conditions: 0.087 S/cm
@ 120
C, 25% RH
• Supported and
stabilized membranes
are durable: >2,300
hours chemical stability
test; >20,000 RH cycles
Two superacid sites
per side chain
S. Hamrock et al., 3M
0
0.1
0.2
0.3
0.4
0.5
0.6
0.7
70 90 110 130Cell Temperature (ºC)
Vo
ltag
e (V
olt
s)
@ 0
.8 a
mp
s/cm
2
0
0.1
0.2
0.3
0.4
0.5
0.6
0.7
HF
R (
oh
m-c
m2)
6 2 5 ew PF IA
8 2 5 ew PFSA
6 2 5 ew PF IA HFR
8 2 5 ew PFSA HFR
0.010
0.100
1.000
0 20 40 60 80 100
Relative Humidity (%RH)
Co
nd
ucti
vit
y (
S/c
m)
PFIA 625 EW
825 EW
700 EW
Bis/Tris Acid 450 EW
a
b
Progress - Fuel Cell R&D

19 | Fuel Cell Technologies Program Source: US DOE 8/5/2011 eere.energy.gov
Progress - Fuel Cell R&D
Application Average
Automotive 4,046
Backup Power 3,281
Material Handling 13,168
Stationary 16,545
Challenges – Continue to decrease cost and increase durability without
compromising performance.
Tracking durability for diverse applications. Maximum projected durability exceeds some
DOE targets.
LANL, ORNL, ANL, BNL
NREL
Tracking durability data from multiple companies (NREL)
20 | Fuel Cell Technologies Program Source: US DOE 8/5/2011 eere.energy.gov
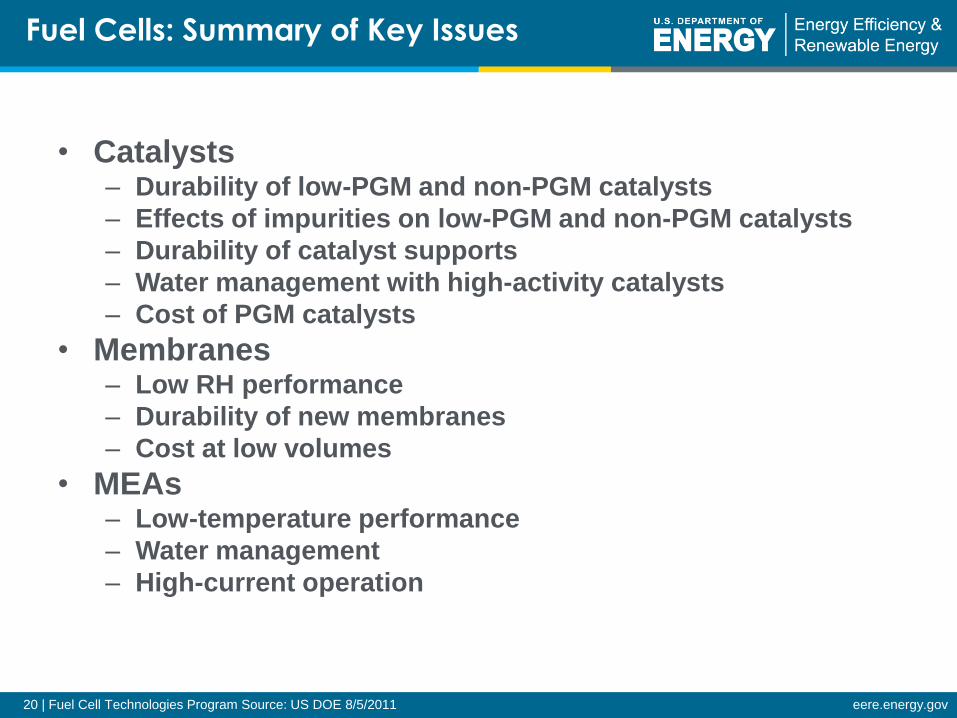
Fuel Cells: Summary of Key Issues
• Catalysts – Durability of low-PGM and non-PGM catalysts
– Effects of impurities on low-PGM and non-PGM catalysts
– Durability of catalyst supports
– Water management with high-activity catalysts
– Cost of PGM catalysts
• Membranes – Low RH performance
– Durability of new membranes
– Cost at low volumes
• MEAs – Low-temperature performance
– Water management
– High-current operation

21 | Fuel Cell Technologies Program Source: US DOE 8/5/2011 eere.energy.gov
Technology advancements, advanced manufacturing, and economies of scale are
required to achieve necessary cost reductions.
Biogas contains impurities that must be
removed before it can be used in fuel cells.
Gas cleanup equipment and operation result in
costs beyond those associated with systems
that use only natural gas.
Cost Reduction Roadmap for Stationary Fuel Cells (using biogas or natural gas)
0
1000
2000
3000
4000
5000
6000
7000
8000
2010 Cost Status Fuel Flexibility & Gas Cleanup
Stack R&D Manuf R&D and Volume
2020
$/k
W I
nst
all
ed
Natural Gas-Only
Biogas Capable $0.21/kWh
$0.17/kWh
Stationary Fuel Cell Cost-Reduction Pathways
$0.08/kWh
$0.09/kWh

22 | Fuel Cell Technologies Program Source: US DOE 8/5/2011 eere.energy.gov
Assumptions
• Fuel cells
Cost: $51/kW → $30/kW
(low-volume cost is $100/kW)
Durability: 75k → 150k miles
• Hydrogen Production
Cost: $5.50/gge → $3.00/gge
• On-board Hydrogen Storage
Cost: $5,050 → $1,100
• FCEV fuel economy
50 mpgge → ~60 mpgge
• Annual miles driven:
10,000 mi
Hydrogen
Fuel Cell
FCEV Lifecycle Cost Reduction Pathways
12¢/mi
5¢/mi
9¢/mi
53¢/mi
28¢/mi
Other
Vehicle
Costs
Other
Vehicle
Costs
Hydrogen
Fuel Cell
Fuel Cell
Hydrogen
Manufacturing
R&D and volume
will make
substantial
contributions to
overall reductions
in the cost of fuel
cells
Fuel Cell R&D will
address cost,
performance, and
durability Hydrogen R&D
will reduce cost
for multiple H2
production
pathways,
delivery, and
storage
Cost Reduction Roadmap for Fuel Cell Electric Vehicles
We have pathways to reduce cost for all key components in lifecycle cost.

23 | Fuel Cell Technologies Program Source: US DOE 8/5/2011 eere.energy.gov
Progress - Hydrogen Production
Demonstrated continued progress in hydrogen cost reduction
23
$/gge H2 Delivered
• Increased hydrogen yield by 65%
• Reduced production cost to an
estimated $4.65/gge delivered
Autothermal Reforming of
Pyrolysis Oil
Photoelectrochemical Conversion (PEC):
• Demonstrated potential to exceed 10% solar-to-hydrogen
efficiency target >16% observed at lab scale (NREL)
Reduced electrolyzer cost by 80% since 2001
• 15% cost reduction in just the last year
• Projected high volume capital cost of $350/kW (vs.
2012 target $400/kW) (Proton, Giner)

24 | Fuel Cell Technologies Program Source: US DOE 8/5/2011 eere.energy.gov
Progress - Hydrogen Storage
Tanks can achieve 430 mile range. Focus is on materials R&D but meeting all
weight, volume, performance and cost requirements is still challenging.
Developed > 420 new materials with potential to store hydrogen at low to moderate pressures
0
2
4
6
8
10
12
14
16
-200 -100 0 100 200 300 400
Temperature for observed H2 release (ºC)
Ob
serv
ed
H2 C
ap
ac
ity
, w
eig
ht
%
AB/IL (20% bminCl)
LiMgN
LiBH4/CA
Ca(BH4)2
Mg(BH4)2
LiNH2/MgH2
MgH2
NaAlH4
Li3AlH6/LiNH2
solid AB (NH3BH3)
1,6 naphthyridine
AB ionic liq.
IRMOF-177
PANI
PCN-12
metal hydrides
sorbents
chemical hydrides
carbide-derived C
M-B-N-H
PANI
H2 sorption temperature (ºC)
0-100-200
Mg(BH4)2(NH3)2
Mg(BH4)(AlH4)
Mg(BH4)2(NH3)2
Li3AlH6/Mg(NH2)2
Material capacity
must exceed
system targets
DOE system
targets
LiBH4/MgH2
MOF-74
C aerogel
B/C
Open symbols denote
new mat'ls for FY2009
NaMn(BH4)4
2015
Ultimate
AlB4H11
Ca(BH4)2/2LiBH4
Mg-Li-B-N-H
Na2Zr(BH4)6
LiMn(BH4)3
Mg(BH4)2(NH3)2
CsC24 CsC24
BC8
AC (AX-21)
MPK/PI-6PCN-6
MD C-foam
LiBH4/Mg2NiH4
bridged cat./IRMOF-8
Ti-MOF-16
Bridged cat/AX21 BC8
C123BF8 AC(AX-21)M-doped CA
LiAB
KAB
DADB
AlH3
AB/LiNH2
Liq AB:MeAB
AB/AT/PS soln
AB/Cat.
Li-AB
Ca(AB)2
Ti(AB)4
AB+AF(Me-Cell)
25 | Fuel Cell Technologies Program Source: US DOE 8/5/2011 eere.energy.gov
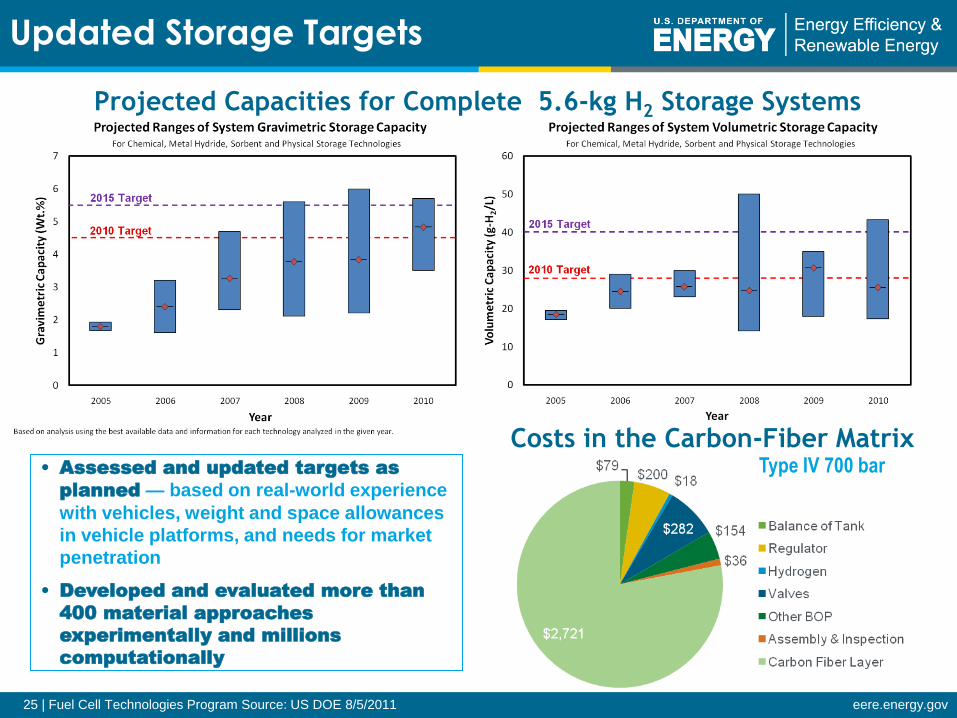
Updated Storage Targets
• Assessed and updated targets as
planned — based on real-world experience
with vehicles, weight and space allowances
in vehicle platforms, and needs for market
penetration
• Developed and evaluated more than
400 material approaches
experimentally and millions
computationally
Projected Capacities for Complete 5.6-kg H2 Storage Systems
Costs in the Carbon-Fiber Matrix Type IV 700 bar

26 | Fuel Cell Technologies Program Source: US DOE 8/5/2011 eere.energy.gov
Progress – Technology Validation
Demonstrations are essential for validating technologies in integrated systems.
Real-world Validation
Vehicles & Infrastructure
• 155 fuel cell vehicles and 24 hydrogen fueling stations
• Over 3 million miles traveled
• Over 131 thousand total vehicle hours driven
• 2,500 hours (nearly 75K miles) durability
• Fuel cell efficiency 53-59%
• Vehicle Range: ~196 – 254 miles (430 miles on separate FCEV)
Buses (with DOT)
• H2 fuel cell buses have a 42% to 139% better fuel economy when compared to diesel & CNG buses
Forklifts
• Over 45,000 refuelings at Defense Logistics Agency site
CHHP (Combined Heat, Hydrogen and Power)
• Achieved 54% (hydrogen + power) efficiency of fuel cell when operating in hydrogen co-production mode
• 100 kg/day capacity, renewable hydrogen supply
Air Products, Fuel Cell Energy
27 | Fuel Cell Technologies Program Source: US DOE 8/5/2011 eere.energy.gov
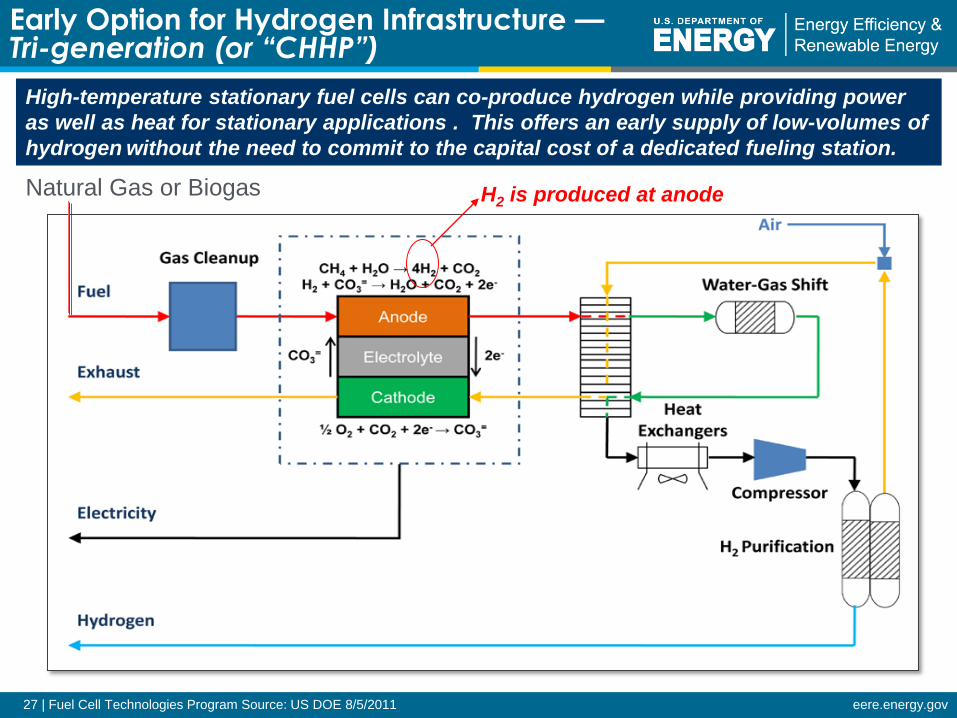
Early Option for Hydrogen Infrastructure — Tri-generation (or “CHHP”)
H2 is produced at anode
High-temperature stationary fuel cells can co-produce hydrogen while providing power
as well as heat for stationary applications . This offers an early supply of low-volumes of
hydrogen without the need to commit to the capital cost of a dedicated fueling station.
Natural Gas or Biogas

28 | Fuel Cell Technologies Program Source: US DOE 8/5/2011 eere.energy.gov
• 12.4 million MT per year of methane is available from landfills in the U.S.
• ~50% of this resource could provide ~8 million kg/day
of hydrogen.
SOURCE: Wastewater Treatment,
could provide enough H2 to refuel 100,000
vehicles per day.
• 500,000 MT per year of methane is available from wastewater treatment plants in the U.S.
• ~50% of this resource could provide ~340,000 kg/day of hydrogen.
Background: Biogas as an Early Source of Renewable Hydrogen
• The majority of biogas resources are situated near large urban centers—ideally located near the major demand centers for hydrogen for FCEVs.
• Hydrogen can be produced from this renewable resource using existing steam-methane-reforming technology.
SOURCE: Landfills, could provide enough
H2 to refuel 2–3 million vehicles/day.

29 | Fuel Cell Technologies Program Source: US DOE 8/5/2011 eere.energy.gov
Natural Gas Pipeline Network, 2009
Source: Energy Information Administration, Office of Oil & Gas, Natural Gas Division, Gas Transportation Information System
Options for hydrogen
production 1. Distributed production from natural
gas (long term renewables)
2. Co-produce hydrogen, heat, and
power (tri-gen) with natural gas or
biogas
3. Hydrogen from waste (industrial,
wastewater, landfills)
> 300,000 miles of
interstate and intrastate
transmission pipelines
Natural gas fueling stations
Natural Gas Opportunities

30 | Fuel Cell Technologies Program Source: US DOE 8/5/2011 eere.energy.gov
DOE-funded efforts have reduced the cost of hydrogen produced from natural gas (at
the fueling station) to $3/gallon gasoline equivalent (gge), assuming high-volumes.
Hydrogen from Distributed Natural Gas — The Near-term Approach
Program Success in
Distributed NG
Reforming:
– Completed R&D phase
– Achieved high volume
$3/gge cost for H2
dispensed at the station (validated by independent
panel*)
– Near-term option for
commercialization has
potential to reduce
transportation sector GHG
emissions by > 50%
DNG reforming is an
affordable option for
a range of natural
gas prices.
0
1
2
3
4
5
6
2003Technology
CurrentTechnology
Hyd
rog
en
Co
st,
$/g
ge
Feedstock Cost
Other VariableO&M Cost
Fixed O&M Cost
Capital Cost
Cost projection
assumes natural gas
cost of $5/Mbtu, with
error bars based on
range from:
$10/Mbtu to $4.50/MBtu
Progress & Plans in Renewable Hydrogen (all costs assume high-volume production**)
– $4.60 – $5.70/gge for distributed production (including all station costs) from electrolysis, pyrolysis oil reforming
– As low as $2.70/gge for centralized production from renewables (high-volume production, at plant gate)
– Direct solar conversion — progress in several pathways (photoelectrochemical, biological, and thermochemical)
– Renewable electrolysis — $5/gge or less if Sunshot and other DOE renewable targets are met
(<$4/gge with improvements in catalysts and membranes and corrosion-resistant and more-durable materials)
* Program Record #10001, www.hydrogen.energy.gov/program_records.html. ** Distributed costs assume station capacities of 1500 kg/day, with 500 stations built per year; costs for centralized production assume a range of production capacities, from 50,000 kg/day to 194,000 kg/day.
Cost of H2 Produced from Natural Gas—at the Station
(projected to high-volume, includes all station costs)
(NAS Report)
Challenge Low volume
cost is still
too high

31 | Fuel Cell Technologies Program Source: US DOE 8/5/2011 eere.energy.gov
Progress - Market Transformation & Recovery Act
Deployed more than 630 fuel cells to date for use in forklifts and backup power at
several companies including Sprint, AT&T, FedEX, Kimberly Clark, and Whole Foods
FROM the LABORATORY to DEPLOYMENT:
DOE funding has supported R&D by all of the fuel cell
suppliers involved in these projects.
DOE: $42 M
Cost-share: $54 M
Total: $96 M.
ARRA JOBS
STATUS
(Apr 2011)
~46 jobs
reported on
Recovery.gov
• Forklifts • FedEX Freight East, GENCO, Nuvera Fuel Cells,
Sysco Houston
• Back-up Power • Plug Power, Inc., ReliOn, Inc., Sprint Nextel
• Portable Power • Jadoo Power, MTI MicroFuel Cells, Univ. of N. Florida
• Auxiliary Power • Delphi Automotive
44
5
75
95
12
3
0
20
40
60
80
100
120
140
160
180
200
2009 2010
Un
its
MT Funding Year
Market Transformation Hydrogen and Fuel Cell Deployments*
Infrastructure*
Buses
MHE
Stationary
EBU*

32 | Fuel Cell Technologies Program Source: US DOE 8/5/2011 eere.energy.gov
DOE Deployments – Backup Power
$3.6M in a cost-shared effort to install more than 230 kW in fuel cell backup power
across 8 DOD installations, 1 NASA Research Center, and DOE National Lab.
Locations • Cheyenne Mountain AFB (CO)
• Fort Hood (TX)
• Fort Bragg (NC)
• Aberdeen Proving Ground (MD)
• Picatinny Arsenal (NJ)
• U.S. Military Academy West
Point (NY)
• U.S. Marine Corps (CA)
• Ohio National Guard (OH)
• NASA Ames (CA)
• Argonne National Laboratory (IL)
ERDC-CERL will manage the project with
NREL collecting data for the first two
years of the 5-year demonstration.
LOGANEnergy will use fuel cells from
four manufacturers: ReliOn, Altergy,
Idatech and Hydrogenics.
LOGANEnergy will manage three
PEM fuel cell backup power units
at Argonne National Laboratory.
• 6kW system by ReliOn
• 10kW system by Hydrogenics
• 15kW system by Altergy
Projected installation date is
December 2011.
The fuel cells will ensure the availability
of electric power for critical
applications during outages.

33 | Fuel Cell Technologies Program Source: US DOE 8/5/2011 eere.energy.gov
Accomplishments
Additional fuel cell lift truck
deployments taking place
based on ARRA experience
and lessons learned!
ARRA Material Handling
Equipment Data
As of 12/31/2010
Hydrogen Dispensed > 18,500 kg
Hydrogen Fills > 38,800
Hours Accumulated > 307,400 hrs
Durability ~3,000 hrs*
Reliability 75% w/MTBF > 100 hrs
Data Collection Snapshot (NREL)
MORE THAN 500
ADDITIONAL FUEL CELL
FORKLIFTS PLANNED
E.g., Sysco, H-E-B
Grocery, BMW
ADDITIONAL DEPLOYMENTS
*Average projected hours to 10% voltage drop of all the fleets with a max fleet project of
more than 9,500 hours. 25% of systems have more than 2,300 operation hours and one fleet
averages more than 2,6000 operation hours.
33

34 | Fuel Cell Technologies Program Source: US DOE 8/5/2011 eere.energy.gov
Example – The Case for Fuel Cell Forklifts
Fuel cell forklifts offer several advantages compared to conventional fork lift technology
Preliminary Analysis
Compared to conventional forklifts,
fuel cell forklifts have:
• 1.5 X lower maintenance cost
• 8 X lower refueling/recharging labor cost
• 2 X lower net present value of total
system cost
Preliminary Analysis: Comparison of PEM Fuel Cell-
and Battery-Powered Forklifts
Time for Refueling/
Changing Batteries
4-8 min/day 45-60 min/day (for
battery change-outs)
8 hours (for battery
recharging & cooling)
Labor Cost of
Refueling/Recharging
$1,100/year $8,750/year
NPV of Capital Costs $12,600 ($18,000
w/o incentives)
$14,000
NPV of O&M Costs
(including fuel)
$52,000 $128,000
34
Published Fact Sheets
& Case Studies

35 | Fuel Cell Technologies Program Source: US DOE 8/5/2011 eere.energy.gov
Progress: Costs Reduced in Early Markets
Deployments of fuel cells in early markets have reduced costs substantially.
2005 and 2010 averages based on estimates supplied by OEMs. 2010 predicted assumed government procurements of 2,175
units per year, total for all market segments. Predictions assumed a progress ratio of 0.9 and scale elasticity of -0.2.
• 50% or greater reduction in costs
• 2008 model generally underestimated cost reductions

36 | Fuel Cell Technologies Program Source: US DOE 8/5/2011 eere.energy.gov
Fuel Cells - The Economic Potential
The fuel cell and hydrogen industries could generate
substantial revenues and job growth.
DOE Employment Study
• Projects net increase of 360,000 – 675,000 jobs.
• Job gains would be distributed across up to 41 industries.
• Workforce skills would be mainly in the vehicle manufacturing and service sectors.
www.hydrogen.energy.gov/pdfs/epact1820_employment_study.pdf
Renewable Energy Industry Study*
• Fuel cells are the third-fastest growing
renewable energy industry (after biomass & solar).
• Potential U.S. employment from fuel cell and
hydrogen industries of up to 925,000 jobs (by 2030).
• Potential gross revenues up to $81 Billion/year (by 2030).
*Study Conducted by the American Solar Energy Society www.ases.org/images/stories/ASES/pdfs/CO_Jobs_Final_Report_
December2008.pdf
0
200
400
600
800
1,000
2000 2005 2010 2015 2020 2025 2030
Thousa
nds
of
Jobs
Advanced Scenario:
925,000 jobs
Modest Scenario:
301,000 jobs
Base Case:
115,800 jobs
2006 Status:
20,000 jobs
2007 Status:
22,000 jobs
Total Jobs Created by Hydrogen and Fuel Cell Industries(includes direct and indirect employment)

37 | Fuel Cell Technologies Program Source: US DOE 8/5/2011 eere.energy.gov
Employment Impacts of Early Markets
Preliminary Analysis
Gross National Impact of PEMFCs in Forklifts
Technology/Market Assumptions:
• $1,300/kW initial mfg cost (Battelle), $4,200/kW retail price.
• Shipments reach 3,300 annually by 2020 (Greene et. al.) out of ~100,000.
• 15,000 FC forklifts in operation by 2020 (<2 percent of Class 1-3 forklifts).
• Average of 60 fuel cells/site, 250 site installations by 2020.
• Tax credit expires in 2016.
Developed user-friendly tool to calculate
economic impacts
Includes short-term jobs (construction/ expansion of mfg capacity, installation &
infrastructure) & on-going jobs (manufacturing, O&M and fuel production & delivery)
Select State or Region
Type of Fuel Cell
Application
Average Size of Manufactured Fuel Cell
Fuel Cells Manufactured by Year
Annual Fuel Cell Production (kW/year)
Time Frame (years)
Existing Fuel Cell Production Capacity (kW/year)
Additional Manufacturing Capacity to be Constructed (kW/year)
Sales Price ($/kW)
Production Cost ($/kW, initial)
Progress Ratio
Production Volume for Initial Cost
Scale Elasticity
Full Scale Production Level (kW/year)
Annual Rate of Technological Progress
Average Production Cost Over Time Frame ($/kW)
Installation Cost ($/kW)
Operations & Maintenance Cost ($/kW, annual)
37
Argonne National Lab/RCF

38 | Fuel Cell Technologies Program Source: US DOE 8/5/2011 eere.energy.gov
Federal budget in fuel cells complements industry
0
500
1,000
1,500
2,000
2,500
3,000
3,500
2001 2002 2003 2004 2005 2006 2007 2008 2009 2010
Marine
Fuel Cells/Hydrogen
Energy Storage
Efficiency
Biopower
Geothermal
Wind
Solar
Biofuels
DOE’s funding is critical
to the emerging fuel cell
industry
Source: Bloomberg New Energy Finance, as of June 8th, 2011. Completed and disclosed deals only.
2009
Fuel cell industry is less established than other clean energy industries—DOE funds
have significant impact on the much smaller, emerging industries such as fuel cells.
* Source: www.cleanedge.com/reports/pdf/Trends2009.pdf
U.S. VC Funding
Source: Bloomberg New Energy Finance; completed and disclosed deals only; includes VC/PE, public
market activity, asset financing, and acquisition transactions.

39 | Fuel Cell Technologies Program Source: US DOE 8/5/2011 eere.energy.gov
Portable Power Targets
Portable Power
Applications, Under 2W1
Portable Power
Applications, 10-50 W1
Portable Power
Applications, 100-250 W1
Units 2011 Status 2015 Target 2011 Status 2015 Target 2011 Status 2015 Target
Specific
Power2
W/kg 5 10 15 45 25 50
Power Density2 W/L 7 13 20 55 30 70
Specific
Energy2,3
Wh/kg 110 230 150 650 250 640
Energy
Density2,3
Wh/L 150 300 200 800 300 900
Cost4 $/system 150 70 15 7 15 5
Durability5,6 hours 1500 5000 1500 5000 2000 5000
Mean Time
Between
Failures6,7
hours 500 5000 500 5000 500 5000
Assumptions and supporting information can be found here: http://hydrogendoedev.nrel.gov/pdfs/11009_portable_fuel_cell_targets.pdf.

40 | Fuel Cell Technologies Program Source: US DOE 8/5/2011 eere.energy.gov
APU Targets
Revised FCT fuel cell APU targets published in 2010
Assumptions and supporting information can be found here:
http://hydrogendoedev.nrel.gov/pdfs/11009_portable_fuel_cell_targets.pdf.
APU targets were developed
using:
• Comparison with incumbent
technology (diesel ICE APUs)
• An RFI process to obtain
input from stakeholders
• Direct discussion with
developers
Example: 2020 power density
target
Stakeholder recommendations:
20 – 55 W/L
Incumbent technology: 11 – 33
(mean 20) W/L
Final DOE 2020 target: 40 W/L –
within range suggested by
stakeholders and superior to
incumbent technology

41 | Fuel Cell Technologies Program Source: US DOE 8/5/2011 eere.energy.gov
Micro-CHP Targets
Targets developed with input from stakeholders and the research community
Cost and durability are the major challenges
2010 Independent Assessment of
CHP Fuel Cell Status & Targets
• Confident that by 2015, LT-
PEM & HT-PEM can achieve
40,000 hr
• 45% electrical efficiency
(2020 target) for 1-10kW
systems is feasible for HT-
PEM, LT-PEM depends on
improved catalysts & higher
operating temps
• SOFT systems are likely to
achieve DOE tarets for
electricla and CHP
efficiences. 90% CHP
efficiency is likely to be
attainable by SOFC systems.
• Confident that by 2020, LT-
PEM & HT-PEM can achieve
$450-$750/kW, while SOFC
can achieve $1000-2000/kW
Assumptions and supporting information can be found here:
http://hydrogendoedev.nrel.gov/pdfs/11009_portable_fuel_cell_targets.pdf.

42 | Fuel Cell Technologies Program Source: US DOE 8/5/2011 eere.energy.gov
Thank you
For more information, please contact