Hydraulic Hybrid Fluid Conditioning System for Challenge X
79
Hydraulic Hybrid Fluid Conditioning System for Challenge X Christopher Blauvelt, Sakib Elahi, Amanda Gore, and Jonathan Quijano Sponsors: Environmental Protection Agency and Steve Dockstader, Challenge X Section Instructor: Professor Albert Shih ME450 Winter 2006, Team #21 Department of Mechanical Engineering University of Michigan Ann Arbor, MI 48109-2125 Final Report April 19, 2006
Transcript of Hydraulic Hybrid Fluid Conditioning System for Challenge X

Hydraulic Hybrid Fluid Conditioning System for Challenge X Christopher Blauvelt, Sakib Elahi, Amanda Gore, and Jonathan Quijano
Sponsors: Environmental Protection Agency
and Steve Dockstader, Challenge X Section Instructor: Professor Albert Shih
ME450 Winter 2006, Team #21 Department of Mechanical Engineering
University of Michigan Ann Arbor, MI 48109-2125
Final Report
April 19, 2006

2
EXECUTIVE SUMMARY The University of Michigan Challenge X Team is designing a series configuration hydraulic-diesel hybrid powertrain for the Chevy Equinox platform. This powertrain uses a small diesel engine that is less powerful and more efficient than that used in a conventional powertrain, but when coupled with the hydraulic powertrain, it maintains, or even exceeds, the original performance. Using a smaller engine minimizes energy consumption and emission of greenhouse gases. When braking, the hydraulic system can also recover energy normally dissipated as heat in a conventional system. Maintenance of the hydraulic fluid is important to the well-being of the system. Small debris, high temperatures, and nitrogen gas in the fluid can cause serious problems through wear, breakdown, and cavitation. These problems necessitate the use of a fluid conditioning system to filter debris, maintain the temperature, and monitor the level of aeration in the fluid, which is the purpose of our project. According to our sponsor, Steve Dockstader of the Challenge X Team, we need to design a fluid conditioning system that will cool to approximately 120°F, filter out debris as small as 3 μm, and ensure that less than 6% of the fluid volume is dissolved nitrogen gas. The system must handle the flow requirements of the connected systems (80 gpm, 200 psi). Our design should be fit within the chassis of the Equinox, weigh less than 60 lb, and cost between $400 and $1000. We purchased a filter and cooler, summarized in Table 1. We selected these components through a Product Value Assessment (PVA), concluding that these best met our customer requirements. Their performances were validated at the Environmental Protection Agency (EPA). We concluded that to ensure that the level of aeration in the fluid is less than 6%, it is more practical to develop a monitoring system for the fluid than deaerating it because the extent of the problem of nitrogen permeating through the bladder has not been determined by the EPA or other sources. An aeration detection system (ADS) will be used to measure the % volume of air in the hydraulic fluid. The ADS we designed is a fully automated piston-cylinder vacuum system. The cylinder takes in a sample of fluid, controlled by a solenoid valve and the piston speed. The valve then closes, sealing the system, while the piston continues moving to apply a pressure drop on the sample. By Henry’s Law, this causes the gas in the fluid to come out of solution due to a vacuum; the gas is then ejected. A cable-extension transducer measures the piston displacement at pre- and post-deaeration, from which we can calculate the amount of nitrogen that was originally dissolved in the fluid. We did validation testing that proved that creating a vacuum does indeed deaerate hydraulic fluid. However, we were unable to detect a change in the fluid level to calculate the amount of air in the fluid. Most of the air in the fluid was dissolved, so its removal had a negligible impact on change in fluid volume. We were unable to create observable standards to test against, such as oil with 10 % volume of air. In the future, observable standards will help further validate our design concept and evaluate the accuracy and precision of our ADS.
Table 1: Design problems for the Challenge X Team and planned solutions. Design Problem Solution
Filtration of debris Hydrotechnik KF3 Return Line Filter Temperature regulation Hydac EDL-4 Air Cooler
Air management Aeration Detection System (ADS) Location in Equinox After front drive motor, going into low pressure accumulator
3
1. ABSTRACT 6 2. PROBLEM DESCRIPTION 7 3. CUSTOMER REQUIREMENTS AND ENGINEERING SPECIFICATIONS 9
3.1 CUSTOMER REQUIREMENTS 9 3.2 DEVELOPMENT OF QFD 9 3.5 CUSTOMER REQUIREMENTS TRANSLATED INTO ENGINEERING TARGETS 9
3.5.1 Filter out debris 10 3.5.2 Control temperature 10 3.5.3 Monitor amount of nitrogen in oil 10 3.5.4 Handle required flow 10 3.5.6 Minimize Size 11 3.5.7 Minimize weight 11 3.5.8 Minimize cost 11
3.3 HYDRAULIC FLUID CONDITIONING SYSTEM QFD RESULTS 11 3.4 NITROGEN MONITORING SYSTEM QFD RESULTS 11
4. PRELIMINARY ENGINEERING PROBLEM ANALYSIS 12 4.1 FLUID CONDITIONING SYSTEM ENGINEERING ANALYSIS 12 4.2 FILTER SYSTEM ENGINEERING ANALYSIS 12 4.3 COOLING SYSTEM ENGINEERING ANALYSIS 12 4.4 AIR MANAGEMENT SYSTEM ENGINEERING ANALYSIS 13
4.4.1 Passive Deaeration Approach 13 4.4.2 Aeration Detection Approach 13
5. FLUID CONDITIONING SYSTEM CONCEPT GENERATION AND SELECTION 14 5.1 FLUID CONDITIONING SYSTEM CONFIGURATION CONCEPTS 14
5.1.1 Location A: After Front Drive Motor into Low Pressure Accumulator 14 5.1.2 Location B: After Front and Rear Drive Motors into Low Pressure Accumulator 14 5.1.3 Location C: After Rear Drive Motor into Low Pressure Accumulator 14 5.1.4 Location D: After Front Engine Pump into High Pressure Accumulator 14 5.1.5 Location E: After Low Pressure Accumulator into Front Engine Pump 14
5.2 FLUID CONDITIONING SYSTEM LOCATION SELECTION RESULTS 15 6. AERATION DETECTION SYSTEM CONCEPT GENERATION AND SELECTION 16
6.1 AERATION DETECTION BENCHMARKING 16 6.1.1 FES – Aeration Measuring Device 16 6.1.2 SMAC – Compressibility Aeration Measuring Device 16
6.2 AERATION DETECTION SYSTEM CONCEPTS 16 6.2.1 Vacuum Force ADS 16 6.2.2 Compression Force ADS 17 6.2.3 Electrical Resistance ADS 17 6.2.4 Digital Micrometer ADS 17 6.2.5 Digital Laser ADS 18 6.2.6 In-line Digital Micrometer ADS 18
6.3 AERATION DETECTION SYSTEM CONCEPT SELECTION RESULTS 18 7. COMPONENT SELECTION PROCESS 20
7.1 COMPONENTS SELECTED USING PVA 20 7.2 HYDROTECHNIK RETURN LINE KF3 FILTER SELECTED 21 7.3 HYDAC EDL-4 AIR COOLER SELECTED 22
8. ENGINEERING DESIGN PARAMETER ANALYSIS FOR AERATION DETECTION 24 8.1 MEASURING PERCENTAGE OF DISSOLVED AND ENTRAINED AIR IN SAMPLE 24 8.2 DEVELOPMENT OF DEVICE DIMENSIONAL PARAMETERS 24

4
8.3 FORCE PARAMETERS 25 8.4 PISTON ACTUATION MECHANISM PARAMETERS 26
8.4.1 Motor Selection Parameters 26 8.5 MATERIAL SELECTION PARAMETERS 27
8.5.1 Cylinder Material 27 8.5.2 Cylinder Top Cap Design 27
8.6 REQUIREMENTS FOR SYSTEM FUNCTIONALITY AND CONCERNS WITH DESIGN 27 9. FLUID CONDITIONING SYSTEM FINAL DESIGN DESCRIPTION 28
9.1 FILTERING AND COOLING SYSTEM COMPONENTS AND LOCATIONS 28 9.2 CONTROL SYSTEM FUNCTIONS 28
9.2.1 Control System for Cooler 29 9.2.2 Control System for Filter 29
10 AERATION DETECTION SYSTEM INITIAL DESIGN DESCRIPTION 30 10.1 AERATION DETECTION SYSTEM 30 10.2 AERATION DETECTION SENSOR DIMENSIONING 31
10.2.1 Components for Initial Design 32 10.3 METHODS OF MEASURING DISPLACEMENT AND OIL LEVEL 32
10.3.1 Piston Displacement Measured with Cable-Extension Transducer 32 10.3.2 Method of Measuring Oil Level 32
10.4 VALVE TO CONTROL FLUID SAMPLING 33 10.5 AERATION DETECTION SENSOR LOCATION AND CONFIGURATION 33
11. PROTOTYPE DESCRIPTION 34 11.1 CHANGES TO PROTOTYPE MECHANISM 34
11.1.1 Photoelectric Sensor Removed from Design 36 11.1.2 Height and Material of Cylinder Changed 36 11.1.3 Maximum Fluid Pressure Changed to 50psi 36 11.1.4 Pitch of Rack and Pinion Changed to 2 36 11.1.5 Piston Head Redesigned 36
11.2 ELECTRONICS OF PROTOTYPE 37 11.2.1 Amplifier Needed to Interface Motor 37 11.2.2 Powering the OOPic and Amplifier 37 11.2.3 Relay needed to Interface Solenoid Valve 38 11.2.4 Fluid Level Sensor and Cable Extension Transducer Interfaced Directly 38
11.3 ELECTRONIC AUTOMATED CONTROL OF PROTOTYPE 38 11.3.1 Hardware Interfaced to Software by Object-Oriented Programming 38 11.3.2 Electronic Control Program Description 39
12. PROTOTYPE MANUFACTURING PLAN 40 12.1 PISTON MANUFACTURING PROCESS 40 12.2 CYLINDER MANUFACTURING PROCESS 41 12.3 TOP CAP MANUFACTURING PROCESS 41 12.4 BOTTOM BRACKET MANUFACTURING PROCESS 41 12.5 ADS TESTING APPARATUS 42 12.6 COMMENTS ON PROTOTYPE MANUFACTURING 42
13. FINAL DESIGN MASS PRODUCTION MANUFACTURING PLAN 43 14. VALIDATION APPROACH 44
14.1 OFF-LINE FILTER AND COOLER TESTING 44 14.1.2 Filter Testing Results 45 14.1.3 Cooler Testing Results 45
14.2 AERATION DETECTION SYSTEM TESTING 47 14.2.1 Validation Plan 47

5
14.2.2 Validation Results 47 15. FINAL RECOMMENDED DESIGN 48
15.1 ADS DESIGN CRITIQUE 48 15.2 FINAL RECOMMENDED ADS DESIGN 48
16. DISCUSSIONS 50 16.1 FAILURE AND SAFETY OF DESIGN 50
17. CONCLUSIONS 51 18. RECOMMENDATIONS 51 19. ACKNOWLEDGEMENTS 52 20. INFORMATION SOURCES 53 21 REFERENCES 55 APPENDIX A.1 56 APPENDIX A.2 57 APPENDIX B.1 58 APPENDIX B.2 59 APPENDIX B.3 60 APPENDIX C.1 64 APPENDIX C.2 65 APPENDIX C.3 66 APPENDIX C.4 66 APPENDIX C.5 67 APPENDIX C.6 68 APPENDIX D 69 APPENDIX E 71 APPENDIX C.6 71 APPENDIX F 72 APPENDIX G 73 APPENDIX H 74 APPENDIX H.2 75 APPENDIX H.3 76 APPENDIX H.4 77 APPENDIX I.1 78

6
1. ABSTRACT Challenge X is a three year competition sponsored by GM and the Department of Energy for the development of sustainable mobility technology. The University of Michigan Challenge X team is constructing a hydraulic hybrid powertrain for a Chevrolet Equinox platform. One requirement for the success of this powertrain is the integration of a hydraulic fluid conditioning system to ensure that the hydraulic oil is managed properly. Overheated fluid, contaminants, and entrained air accelerate the degradation of components and reduce the performance hydraulic system. Our system is responsible for maintaining oil temperature, cleanliness, and aeration level. Working with the EPA, we selected a hydraulic cooler and filter that achieves the performance level specified by our sponsor and withstands the demanding operating conditions of the vehicle. We approached the aeration concern by designing an Aeration Detection System (ADS) utilizing a piston induced vacuum to monitor the percentage of dissolved and entrained air within the oil for the Environmental Protection Agency.
7
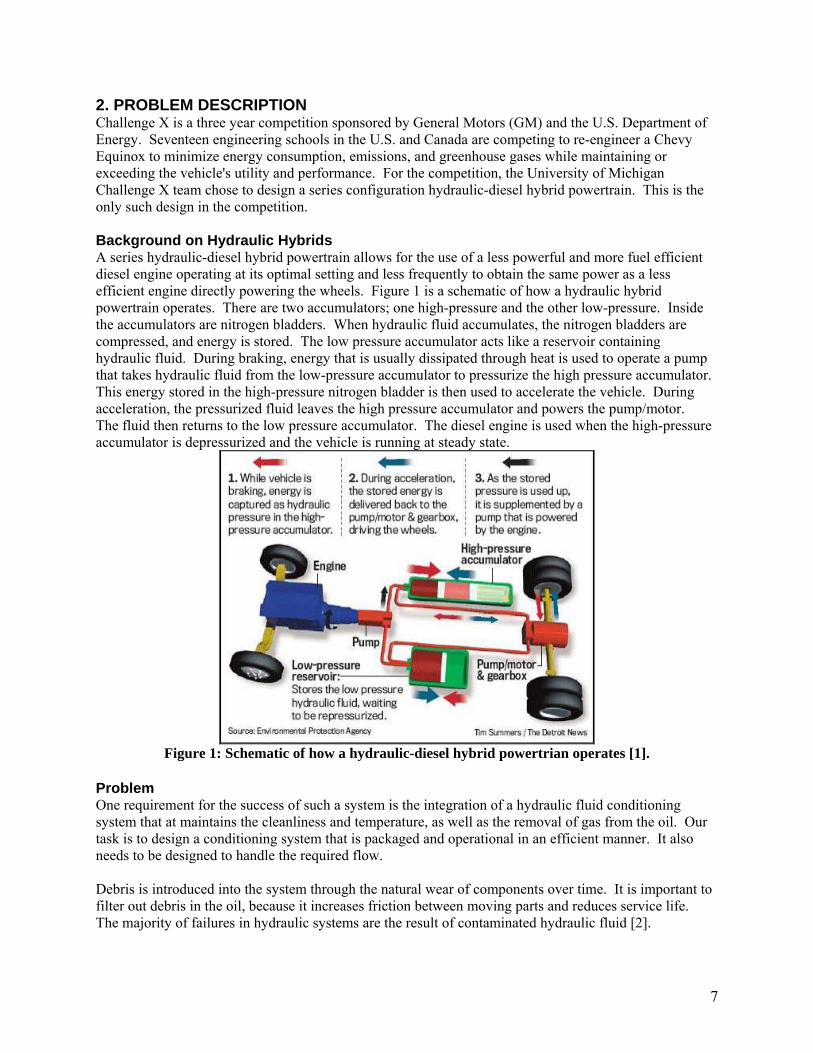
2. PROBLEM DESCRIPTION Challenge X is a three year competition sponsored by General Motors (GM) and the U.S. Department of Energy. Seventeen engineering schools in the U.S. and Canada are competing to re-engineer a Chevy Equinox to minimize energy consumption, emissions, and greenhouse gases while maintaining or exceeding the vehicle's utility and performance. For the competition, the University of Michigan Challenge X team chose to design a series configuration hydraulic-diesel hybrid powertrain. This is the only such design in the competition. Background on Hydraulic Hybrids A series hydraulic-diesel hybrid powertrain allows for the use of a less powerful and more fuel efficient diesel engine operating at its optimal setting and less frequently to obtain the same power as a less efficient engine directly powering the wheels. Figure 1 is a schematic of how a hydraulic hybrid powertrain operates. There are two accumulators; one high-pressure and the other low-pressure. Inside the accumulators are nitrogen bladders. When hydraulic fluid accumulates, the nitrogen bladders are compressed, and energy is stored. The low pressure accumulator acts like a reservoir containing hydraulic fluid. During braking, energy that is usually dissipated through heat is used to operate a pump that takes hydraulic fluid from the low-pressure accumulator to pressurize the high pressure accumulator. This energy stored in the high-pressure nitrogen bladder is then used to accelerate the vehicle. During acceleration, the pressurized fluid leaves the high pressure accumulator and powers the pump/motor. The fluid then returns to the low pressure accumulator. The diesel engine is used when the high-pressure accumulator is depressurized and the vehicle is running at steady state.
Figure 1: Schematic of how a hydraulic-diesel hybrid powertrian operates [1].
Problem One requirement for the success of such a system is the integration of a hydraulic fluid conditioning system that at maintains the cleanliness and temperature, as well as the removal of gas from the oil. Our task is to design a conditioning system that is packaged and operational in an efficient manner. It also needs to be designed to handle the required flow. Debris is introduced into the system through the natural wear of components over time. It is important to filter out debris in the oil, because it increases friction between moving parts and reduces service life. The majority of failures in hydraulic systems are the result of contaminated hydraulic fluid [2].

8
The temperature of the oil increases as it is pumped through the system due to the inefficiencies in various components. High temperatures promote thinning, oxidation, and breakdown of the hydraulic oil; cause deterioration of seals, packings, and hydraulic hoses; and cause malfunction or inefficiency in components because required clearances between such parts as valve spools and pump parts cannot be maintained [3]. To ensure that high temperatures do not affect the performances of other systems and to prevent a change in fluid properties, a cooling mechanism is required. Gas can be introduced into the system in two ways; nitrogen penetration through the bladder and cavitations of the fluid due to the pressure drop from filtration. Air in the fluid is undesirable because it is highly compressible, compared to hydraulic fluid and would decrease the efficiency of the system. Also, at high pressure and high velocity the air particles can chip away at the metal pumps creating a rough surface and a reduction in efficiency. The team leader of the University of Michigan Challenge X team and our sponsor is Steve Dockstader, a graduate student at the University of Michigan, Ann Arbor. He works closely with Neil Johnson at the Environmental Protection Agency (EPA), our other sponsor, who will also be helping the Challenge X team.

9
3. CUSTOMER REQUIREMENTS AND ENGINEERING SPECIFICATIONS We have clarified our problem definition from gathering background information relevant to our hydraulic fluid condition system, and we determined our customer requirements. We then took these requirements and translated them into engineering specifications. 3.1 Customer Requirements The University of Michigan Challenge X team is the customer for which we are designing the hydraulic conditioning system. Challenge X is designing the hydraulic hybrid powertrain for GM and ultimately automotive consumers. Therefore, we are also keeping in mind the requirements of the manufacturer and consumer during our design process. According to our sponsor we need to design a hydraulic fluid conditioning system that will:
• Cool the hydraulic fluid to prevent thermal breakdown of the fluid • Filter out all possible debris • Monitor and/or remove nitrogen introduced into the fluid
In our design, we need to take numerous things into consideration. It is very important that our designed system:
• Handles the flow requirements of the connected systems • Is efficient such that the pressure drop across our system and the energy losses are minimized as the
fluid passes through. • Fits within the chassis of the Equinox • Is light enough so that it does not affect the performance of the Equinox. • Has a minimized cost of the system and its components.
There are some customer requirements that are not required, but we would like to keep them in mind during our design process. For example, it is desirable for the system to be compact enough to fit within one area, but the placement of all three components may not necessarily be optimal in one location. Also, a manufacturer may require the number of steps needed for installation be minimized, and a consumer may require the time it takes to replace the filter be minimized and the service life be maximized. While these are requirements to keep in mind, we will focus on satisfying the requirements most important to the Challenge X team. 3.2 Development of QFD To develop the QFD, we first met with our sponsor to discuss the requirements that must be satisfied and discussed as a group the importance of the other requirements. We then brainstormed quantifiable engineering specifications that will help us meet our customer requirements and set quantified engineering targets for each specification. We used our background information on similar products to determine how these products meet customer requirements and which areas need to be improved. We created two Quality Function Deployment (QFD) charts; one for the fluid conditioning system and one for the nitrogen monitoring system. We used the system QFD to determine which engineering targets are most important for the fluid conditioning system to reach. The nitrogen monitoring system QFD helped us determine what improvements need to be made to current designs to better serve our purpose. Both QFD charts can be found in Appendix A 3.5 Customer Requirements Translated into Engineering Targets Meetings with Steve Dockstader, The Challenge X Team, Neil Johnson (EPA), and Andy Moskalik (EPA) provided us with specific information about the hydraulic hybrid systems and their components. Based on this information, we were able set our engineering targets. The engineering targets corresponding to the customer requirements are listed in Table 2.

10
Table 2: Customer requirements translated into engineering targets.
Customer Requirements Engineering Targets 3.5.1 Filter out debris 3-5 micron particles 3.5.2 Control Temperature Cool to approximately 120ºF. 3.5.3 Monitor Air in Oil Ensure < 6% air/nitrogen in fluid volume 3.5.4 Handle Required Flow Flowrate capability of 80 GPM 3.5.5 Handle Required Pressure Pressure capability of 200 psi 3.5.6 Minimize Size Approx 2ft x 2ft x 1ft 3.5.7 Minimize Weight Less than 60 lbs 3.5.8 Minimize Cost $400 - $600
It is most important to the Challenge X team that the fluid conditioning system maintains the cleanliness and temperature of the hydraulic fluid. Our design must have a filter, cooler. Since we do not know whether or not the fluid needs to be deaerated, our design will have a device to measure the amount of air in the fluid. It is very important that each component handles the required flow and pressure of the hydraulic system. 3.5.1 Filter out debris: Filtration of debris from hydraulic fluid has been researched extensively. There are many hydraulic fluid filters on the market. According to sponsor and our research [2], the smallest particles that need to be filtered are 3-5 microns in size. 3.5.2 Control temperature: Challenge X will be using Mobil 1 Synthetic Automatic Transmission fluid. They are using this because the synthetic Poly-Alfa-Olefin is the most cost effective fluid to meet the design criteria for the hydraulic system, and it is used by the EPA on their hydraulic hybrids. As the temperature of this fluid increases, the oil can reach a degradation point where the viscosity decreases to where it no longer provides lubrication to the necessary parts. Our research [18] suggests that the typical operating temperature of a hydraulic system remain between 110°-130°F and that we keep the temperature below 150°F to prevent degradation of the rubber (Buna-N: Nitrile) seals and accumulator bladders. 3.5.3 Monitor amount of nitrogen in oil: The main source of air/nitrogen into the system is permeation of nitrogen through the bladders within the accumulators. The EPA has investigated other less permeable bladder materials, but the Challenge X team will be using the standard Buna-N (nitrile) bladders. A centrifugal pump can withstand 0.5% air by volume; however, 6% can cause significant loss of efficiency and a slight level of cavitation damage [16]. The extent of this problem of aeration into the fluid system of a hydraulic hybrid vehicle has not yet been determined. Predictions have been made that it may take up to 10 years of vehicle use for this critical amount of nitrogen to enter the system [4]. Therefore, we must determine the extent of this issue by monitoring the amount of nitrogen both dissolved and entrained in oil. We have been asked to establish a practical method of managing the amount of air in the system 3.5.4 Handle required flow: The largest pump in the powertrain is a 80 cc/rev Bosch Rexroth Axial Piston Variable Displacement Motor. This pump produces a maximum flowrate of 80 GPM. Our fluid conditioning system should be able to withstand this flowrate. 3.5.5 Handle required pressure: The system should be able to handle up to 200 psi of hydraulic fluid pressure. This is the maximum pressure in the low pressure lines as the fluid leaves the low pressure accumulator, which is where we plan on placing the system due to component robustness and cost issues.

11
3.5.6 Minimize Size: Our size limitation on the chassis of the Chevrolet Equinox is approximately 4ft x 2 ft x 1ft. Our sponsor has not specified a location for us to mount our system, but due to the elimination of the transmission and the significantly smaller engine, there is a plethora of places to locate our three components. We plan to minimize the size of the system as much as possible. 3.5.7 Minimize weight: Our sponsor has not set a weight limitation, but we are aware that any weight added to a vehicle will affect its performance. When the previous ME450 team designed a deaerator for the EPA they were required to keep it less than or equal to 6 lbs. Since our design will consist of three components, we approximated a weight limitation of 60 lbs. This is comparable to the weight of the combined filter and cooler of the EPA’s Ford Expedition. 3.5.8 Minimize cost: For the Challenge X competition the cost of system is not set in stone. We were asked to keep it “reasonable”. From a manufacturer’s point of view the cost should be minimized for mass production. After pricing some hydraulic filters and coolers we found a price range of $400-$600 to be realistic. 3.3 Hydraulic Fluid Conditioning System QFD results Hydraulic fluid conditioning system QFD results can be found in Appendix A.1. The results show that when designing our fluid conditioning system it is most important for the following engineering targets to be met:
• Maximum flow rate through the system • Pressure drop across the system • Minimum size of particles the system can filter • Maximum temperature reaches
Different hydraulic systems have different requirements for the fluid conditioning system. These requirements determine which components can be chosen. There isn’t another hydraulic hybrid that has the same requirements as the Equinox. For this reason, we did not benchmark our fluid conditioning system. 3.4 Nitrogen Monitoring System QFD results The nitrogen monitoring system QFD results can be found in Appendix A.2. We found an offline air measuring system for hydraulic devices to benchmark for our design. Results of the QFD show that when considering a device that will monitor the level of nitrogen present in the hydraulic system, we meet the following engineering specifications:
• 100 % of air in oil should be detected • Minimize number of components • Handle pressure requirements of the system
We found that our benchmarked design is effective in that it detects 100% of the air in the oil. For the purpose of our application, improvements could be made to the number components and pressure capability of the benchmarked design. We want the design to be as simple as possible, so we would like to have a fewer number of components. The benchmarked design is capable of handling the pressure requirements of our system, but it is highly over designed. This implies that when we can design our aeration monitoring device to have a lower pressure capability.

12
4. PRELIMINARY ENGINEERING PROBLEM ANALYSIS To meet our customer requirements, we need to develop a system that will (1) remove debris, (2) regulate the oil temperature, and (3) monitor the amount nitrogen in the oil. 4.1 Fluid Conditioning System Engineering Analysis A general problem we need to address is the placement of our fluid conditioning system relative to the other hydraulic components. Preferably, the components should be along a flow where it is:
• Low pressure • Uni-directional • The hottest location in the hydraulic system • Unaffected by a pressure drop upstream • Unaffected to cavitations forming upstream
The outlet from the low pressure reservoir to the front pump motor is the ideal location so far for this system because of the low pressure flow in addition to the one directional flow of fluid. Although it is possible to split up the components, it would be best to keep them together since all three of these devices (monitoring system, filter, and cooler) all have the similar issues regarding pressure and flow requirements, pressure drops, and potential to introduce cavitations. We have determined that it would be best to place this system at the inlet of the low pressure accumulator. At this location, the pressure drop and potential cavitations have an insignificant effect on the hydraulic system. This is also one of the lowest areas of pressure in the system. 4.2 Filter System Engineering Analysis In order to remove the debris, a filter will be used. The filter will be purchased rather than designed, so no any engineering analysis will be done for the filter. However, extensive research was done to determine the filters available on the market that will best meet our customer requirements for pressure capability, flowrate capability, micron filtration, and pressure drop. This is described in more detail in Section 7. We will test the efficiency our filter oil once it is installed into the fluid conditioning system. We plan to run oil of a known cleanliness through the system, and then measure the fluid again for cleanliness. We will use Equation 1 to calculate the efficiency.
Filter efficiency = number of particles upstream – number of particles downstream (1) number of particles of upstream
4.3 Cooling System Engineering Analysis In order to regulate the oil temperature, a cooler will be used. The cooler will be purchased rather than designed, and benchmarking will have to be conducted to determine which filter available on the market will best meet our customer requirements for pressure drop, flow rate, and heat dissipation. Greater heat dissipation rates means that the cooler regulates the temperature of the oil more effectively. We must select a cooler with a sufficiently high heat dissipation yet reasonable size and weight to fit in a vehicle. There are many types of heat exchangers available, and we must select the type that is most practical for mobile applications. One equation we found [13] that can help us in measuring heat load of the system (P, in kW) is Eq 2. We can calculate the heat load from an existing hydraulic system by measuring the temperature of an oil reservoir both at start up and after the system has been in operation for a measured amount of time. This is a much simpler calculation than calculating the efficiency losses in each component that the fluid flows through.
t
TVPΔ×
Δ×=
4.32
V = fluid volume (L) T = Temperature Change (°C) t = Time Change (Minutes)
(2)

13
4.4 Aeration Management System Engineering Analysis We have been asked to establish a practical method of managing the amount of air in the system. We discovered that the rate at which nitrogen enters the fluid system is still unknown and varies from application to application. Two possibilities for managing the amount of air in the system if it is above the critical level of 6% are as follows:
• Passive deaeration system that continually deaerates the nitrogen dissolved and entrained in the oil. • Deaeration system that only runs when a critical percentage of nitrogen is detected by a device
located in the system 4.4.1 Passive Deaeration Approach The nitrogen can either be dissolved in the hydraulic oil or entrained (bubbles). According to Le Chatelier’s Principle and Henry’s Law, an increase in temperature or a decrease in pressure to the critical values for nitrogen will pull the gas out of solution. The first step for a deaerator design is to remove the nitrogen from solution, and then we want to collect the entrained nitrogen bubbles by a method of separating the gas from the liquid. As previously mentioned, to remove the nitrogen from solution one can either decrease the pressure or increase the temperature. The increase in temperature can be obtained through a heating element, however there are several options available to cause a pressure drop. As shown by Equation 3, Bernoulli’s extended equation, this pressure drop can be achieved through an decrease in velocity, an increase in height difference, and an increase in head loss. Our concept designs attempt to capture each of these methods of separating the gas from liquid.
])())(21[( 22
finoutinoutinout hzzVVg
PPP +−+−−=−=Δ γ (3)
4.4.2 Aeration Detection Approach We developed several concepts for fluid deaeration as shown in Appendix B.3. However, the extent of the problem of nitrogen permeating through the bladder has not been determined by the EPA or other sources. The EPA’s prediction is for a dangerous amount of nitrogen to enter the system after 10 years. Since the extent of nitrogen levels is unknown, we feel that it is most practical to place a nitrogen monitoring system that will signal a warning message to the vehicle owner when the level is too high. At this time, the owner can take the car to be serviced. This is similar to a current automobile engine oil change. There are several engineering approaches to this:
• Compressibility – by compressing the fluid and noting the change in volume, the % volume of air may be calculable from the bulk modulus.
• Fluid Contamination – a laser could detect particles (bubbles) of various radii and what % of the volume they make up.
• Expandability – by expanding a fixed volume of fluid a vacuum will be created, pulling out entrained bubbles and separating them from the fluid.
• Physical Properties – assuming that as the % volume of air increases in the fluid, the fluid properties (electrical conductivity, thermal resistance, etc.) should change

14
5. FLUID CONDITIONING SYSTEM CONCEPT GENERATION AND SELECTION 5.1 Fluid Conditioning System Configuration Concepts Our hydraulic fluid conditioning system is to be placed on the chassis of the Challenge X Chevrolet Equinox where we will have to deal with issues regarding packaging constraints and effects on the performance of the hydraulic system. Figure 2 shows five possible locations for this fluid conditioning system. Four of these locations are at the low pressure side of the system, and one is located at the high pressure side. 5.1.1 Location A: After Front Drive Motor into Low Pressure Accumulator The EPA has a filter and cooler on their hydraulic hybrid Ford Expedition in a very similar location as this design. Pros: Low pressure side, max flowrate of 80 GPM, low cavitation effects Cons: Does not filter and cool all fluid, works only when accelerating and at steady state, must deal with two directional flow 5.1.2 Location B: After Front and Rear Drive Motors into Low Pressure Accumulator Pros: Low pressure side, filters and cools all fluid flow, low cavitation effects Cons: Max flowrate of 160 GPM, works only when accelerating and at steady state, must deal with two directional flow 5.1.3 Location C: After Rear Drive Motor into Low Pressure Accumulator Pros: Low pressure side, max flowrate of 80 GPM, low cavitation effects, flow is uni-directional Cons: Does not filter and cool all fluid, works only when accelerating and at steady state 5.1.4 Location D: After Front Engine Pump into High Pressure Accumulator Pros: Most likely the hottest location of the system, flow is uni-directional, max flowrate of 55 GPM Cons: High pressure side, only works when running at steady state 5.1.5 Location E: After Low Pressure Accumulator into Front Engine Pump Pros: Flow is uni-directional, low pressure side, max flowrate of 55 GPM Cons: Cavitations into the pump can be disastrous, only works when running at steady state
A
C
D
B
Figure 2: Possible Locations for Hydraulic Fluid Conditioning System
LP Accumulator
HP Accumulator
Diesel Engine
E
X = Fluid Conditioning System

15
5.2 Fluid Conditioning System Location Selection Results To evaluate these 5 designs, we used a weighted, 3 degree Pugh chart. Using this matrix resulted in:
• Greater insight into the problem specification and constraints • Finding conceptual vulnerability, i.e bad designs that cannot be fixed • Realization that further analysis may change a decision • The generation of newer concepts
To perform this analysis, we compared each configuration concept relative to a reference (the EPA hydraulic hybrid Ford Expedition) for certain selection criteria. The results can be seen below in Table 3. Table 3: Pugh Chart for Fluid Conditioning System Configuration Concept Selection CONCEPT VARIANTS SELECTION CRITERIA Wt. A B C D E REF Packaging 3 0 0 0 0 0 0 Passiveness 4 0 - + - - 0 Maintainability 1 0 - 0 0 0 0 Heat Removal 3 0 + - + 0 0 Debris Removal 4 0 + - + + 0 Cost 1 0 0 0 + 0 0 Safety 3 0 0 0 - - 0 Resistance to Wear 3 0 - + - 0
PLUSES 0 7 7 8 4 SAMES 22 7 8 4 11
MINUSES 0 8 7 10 7 NET 0 -1 0 -2 -2
RANK 1 3 1 5 5 CONTINUE? Yes No Yes No No
Our results show us that we should further investigate the placement of our system at locations A (after front drive motor into low pressure accumulator) and C (after rear drive motor into low pressure accumulator). Both of these locations share similar characteristic, but location C has the benefit of uni-directional flow because the rear driveline is only used for acceleration and steady state, not regenerative braking. The two directional flow at location A requires use of parallel bypass lines for reverse flow. Since our sponsor, Steve Dockstader, mentioned that the Challenge X team will first configure the Chevrolet Equinox for just front wheel drive and eventually incorporate rear wheel drive, we have decided to place our system at location A. Location C requires a rear wheel drive configuration.

16
6. AERATION DETECTION SYSTEM CONCEPT GENERATION AND SELECTION 6.1 Aeration Detection Benchmarking We found two types of devices currently available that can detect the amount of air in hydraulic fluid. These two devices work on different principles: vacuum and compression. 6.1.1 FES – Aeration Measuring Device This product uses an applied vacuum to separate the entrained gas from the oil. This hand operated device uses a digital micrometer to measure the location of the plunger relative to the end and the hand crank allows a vacuum to be placed on the fluid. The separated air is then expelled and the final distance measurement is taken. This company states that this product can measure 9% of air by volume with a 2% error. 6.1.2 SMAC – Compressibility Aeration Measuring Device This product uses compression to determine the amount of air in the fluid. By obtaining the pressure and volume information of the liquid-gas mixture compression, one can determine the volumetric ratio. The log-log graph (P/P0,1-V/V0) of the mixture of pressurized sample shows an inflection point. The y value of the inflection point (1-V/V0) is equal to the volumetric gas ratio initially in the sample. No information on performance was able to be obtained. 6.2 Aeration Detection System Concepts An aeration detection system (ADS) will be used to measure the % volume of air in the hydraulic fluid. Our Functional Decomposition Diagram is located in Appendix E. The ADS will need to be able to take small samples periodically and make accurate measurements. Since the designs take small samples and some of them require gravity, they will operate when the vehicle is not running and the fluid is not flowing. This also allows us to assume that the fluid is at zero pressure since it is not flowing and is cut off from the accumulators. Five of these concepts work on the principle that the hydraulic fluid is completely incompressible and that the nitrogen gas can be both compressed and expanded depending on the applied pressure. 6.2.1 Vacuum Force ADS In this design a sample of oil will be drawn and after reaching a set volume, the valve to the main line will close. Then a motor with a worm gear will slowly expand the volume of the cylinder. The torque will be measured via voltage, and the displacement measured via digital micrometer. The machine will be calibrated so torque and displacement relate to the % volume of air in the sample. If there is no air present and the reservoir is 100% oil, the volume will not expand. Another method for measuring the amount of nitrogen in the fluid using a similar apparatus would require use of a digital micrometer to measure the displacement of the piston. In this design the chamber will be filled with fluid and the micrometer will record this location/volume. The small piston will move up to create a vacuum and separate all entrained and dissolved nitrogen. With the gas and liquid separated, a valve will open and the plunger will compress, allowing the air to leave the chamber into the atmosphere. When all air has left the chamber, the final plunger position will be recorded. Knowing the original volume (air and oil) and final volume (just oil) we can solve for the original % volume of air.
Pros: Simple, independent of gravity and can be placed in various positions Cons: May not be precise enough, requires accurate torque and displacement measuring devices, need to develop calibration curve between applied force, displacement, and % volume of air.
Figure 3: FES - AMD
Figure 4: SMAC

17
6.2.2 Compression Force ADS This design will draw a sample of oil, and close the valve to the main line after it reaches a set volume. The motor will compress this volume. The torque will be measured through input voltage, and the displacement measured by a digital micrometer. The machine will be calibrated so torque and displacement relate to the % volume of air in the sample. If there is no air present and the reservoir is 100% oil, the volume will not compress. Pros: Simple, independent of gravity and can be placed in various positions Cons: May not be precise enough, requires accurate torque and displacement measuring device, need to develop calibration curve between applied force, displacement, and % volume of air. 6.2.3 Electrical Resistance ADS In this design two electrodes will be placed a certain distance from one another and measure the resistance of a given volume of oil. This relies upon the principle that a change in composition of a material will cause its physical/electrical properties to change. The ADS will need to be calibrated so resistance relates to the % volume of air in the fluid.
Pros: Simple, no moving parts, compact, can be placed in confined spaces, long service life Cons: Precision may be very difficult, calibration required, no way to ensure fresh fluid in and force tested fluid back into flow, requires electricity 6.2.4 Digital Micrometer ADS In this design a large chamber will be filled with fluid and a small piston will move up to create a vacuum and separate all entrained and dissolved nitrogen. The change in distance will be recorded by a digital micrometer, which equates to change in volume. Knowing the original and final volume of oil will provide the ability to solve for the original % volume of air. The narrow upper neck geometry of the container will allow for a greater displacement of the micrometer/plunger (improved accuracy).
Figure 6: Compression Force ADS
Figure 7: Thermal Resistance ADS
Figure 5: Vacuum Force ADS

18
Pros: No calibration necessary, precise Cons: Difficult pull oil into container, difficult to manufacture, larger size 6.2.5 Digital Laser ADS This design works the same as the Digital Micrometer ADS, but measures the change in distance with a laser instead of a digital micrometer. This laser located at the end of the plunger will need to be able to measure the distance from the plunger end to the surface of the oil
Pros: No calibration necessary, precise Cons: Difficult to pull oil into container, expensive, difficult to manufacture, requires a special laser that can measure the distance to a liquid level 6.2.6 In-line Digital Micrometer ADS This design works the same as the Digital Laser/Micrometer ADS designs, but fluid enters the chambers by being in flow with the rest of the system. Valves will lock the fluid in place when the small piston starts moving and the change in distance is measured.
Pros: No calibration necessary, precise, Cons: Difficult to make, introduces pressure drop and inefficiencies into flow. 6.3 Aeration Detection System Concept Selection Results Similar to our selection process for the fluid conditioning system configuration concept selection, we also used a Pugh chart to select the best ADS concepts (see Table 4). We compared our 6 concept designs relative to a commercial handheld aeration measuring device [19].
Figure 9: Digital Laser ADS
Figure 10: In-line Digital Micrometer/Laser ADS
Figure 8: Digital Micrometer ADS

19
Table 4: Pugh Chart for Aeration Detection System Concept Selection CONCEPT VARIANTS SELECTION CRITERIA Wt.
Vacuum Force
Compression Force
Electrical Resistance
Digital Micrometer
Laser meter
In-line meter REF
Simplicity 4 + + + 0 - + 0 Cost 1 0 0 0 0 - 0 0 Size 2 0 0 + - - - 0 Precision 5 0 - - + + 0 0 Ease of Production 3 - - + - - - 0 Passiveness 3 + 0 + 0 0 - 0 Refresh fluid 4 0 0 - - - + 0
PLUSES 7 4 12 5 5 8 SAMES 15 10 1 8 3 1
MINUSES 3 8 9 9 14 8 NET 4 -4 3 -4 -9 0
RANK 1 5 2 4 6 3 CONTINUE? Yes No Yes No No Yes
Our Pugh chart results indicate that the only concepts that are worth further investigation are the Vacuum Force ADS, Electrical Resistance ADS, In-line Meter, ADS. Our rankings show that the Vacuum Force performed the best at meeting the selection criteria compared to the other two. We will select this design for further engineering analysis.

20
7. FILTER AND COOLER SELECTION PROCESS We chose a filter and cooler for our fluid conditioning system based on how well the components met our customer requirements. We used www.globalspec.com to find manufacturers of our components. We visited the manufacturer’s websites and made a list of the components that could handle the flow rate and pressure requirements of the hydraulic system. To find which component best meets our customer requirements, we performed a product value assessment (PVA). PVA is a mathematical method used to compare the characteristics of products and predict which product will best satisfy the customer. Product value assessment uses weighted product characteristics to determine functionality, and price and cost expectation to show how the value of the product changes with price. A detailed explanation of our PVA can be found in Appendix C. 7.1 Components Selected Using PVA When selecting a component for a hydraulic system it is most important for it to handle the flow rate and pressure of the system. The flow rate and pressure our components are required to handle is 80gpm and 200psi, respectively. All the components we considered met these two requirements. We then looked at other characteristics important to Challenge X and used a PVA to determine the components that best meet our customer requirements. Equation 4 is the general PVA equation. In the numerator, weighted product characteristics determine the functionality of a product. In the denominator, price and cost expectation are used to show how the value of the product changes with price. ci is the weight that represents the importance of the corresponding characteristic, Zi is the product characteristic, Pi is the price of the filter being considered, and Pexp is the price the customer expects the filter to cost. This equation computes a number that is only meaningful when comparing products. The component with the largest PVA when compared to similar components best satisfies customer requirements.
)1(exp
2211
PP
ZcZcZcPVAi
nn
+
+++=
Λ (4)
To maximize the functionality of our components we need to maximize the numerator. However, the functionality of our components increases as some characteristics decrease. For example, our filter better meets our customer requirements as the pressure drop across the filter decreases. To account for this, we assigned values to ranges of characteristic measurements. When appropriate, values were assigned such that a high value represents a range of low characteristic measurements. For example, a low range of pressure drops of 0-5 psi was assigned the value 8, whereas a high range of pressure drops of 21-25 psi were assigned the value of 4. Ranges of characteristic measurements were assigned values to accurately compare a component characteristic. For example, when comparing the weight of two filters, a 5 lb. filter is not twice as functional as a 10 lb. filter. We know this because the weight of the Equinox is increased by up to 670 lbs. from other hydraulic components, so adding the weight of either filter is insignificant. Appendix C.2 shows for each component the ranges determined for each characteristic and the values assigned to the ranges. Weights assigned to characteristics are determined based on the importance of satisfying customer requirements. For example, it is critical to the hydraulic system that the size of the filtered particles and the pressure drop are minimized. Therefore, particle size and pressure drop were assigned much higher weights than the other characteristics. Weights are normalized to ensure that the most important characteristic accounts for a higher percentage of the functionality. We normalized the weights by choosing a component and defining the characteristics of that component as the standard characteristics. We divided each weight by the corresponding standard characteristic to obtain the normalized weight, or

21
factor. To redefine the terms in Equation 4, ci represents the factor and Zi represents the value assigned to a range of characteristic measurements. The denominator of Equation 4 is meant to show how the value of the component changes with price. It is necessary for Challenge X to have a filter and a cooler that meet the requirements of their hydraulic system. They will use their sponsor money for the competition to buy these components no matter the cost. Since price is not an object, the price expectation can approach infinity, which causes the denominator to be one. We computed the PVA for each cooler and filter using the simplified version of Equation 4. The PVA for the both components and the results are found in Appendix C. The filter and cooler with the highest PVA were the components that best meet our customer requirements and are the components we suggest Challenge X to use in their system. 7.2 Hydrotechnik Return Line KF3 Filter Selected We suggest that Challenge X use the Hydrotechnik return line filter with model number KF3. This filter meets the system requirements, and according to our PVA results, shown in Appendix C.2, it has the most desirable characteristics compared to the other filters considered. Table 5 lists the filter’s characteristics and shows how it meets customer requirements.
Table 5: Characteristics of Hydrotechnik KF3 filter with respect to customer requirements. Characteristic Customer Requirement Performance
Maximum Flow Capability 80 gpm 100 gpm Maximum Allowable Operating Pressure 200 psi 300 psi
Size of smallest particle filtered 3-5 μ 5 μ Pressure drop at flow of 50 gpm Minimize pressure drop 9 psi
Weight Less than 40 lbs. 10.5 lbs. Length Minimize size 13.12”
Head diameter Minimize size 6.25” We used globalspec.com find 40 hydraulic filter manufacturers [17]. After visiting each manufacturer's website, we found that there are five manufacturers that offer a total of 13 filters that meet our system's requirements. These filters and their characteristics can be seen in Appendix C.1. All the filters we considered meet the flow rate and pressure requirements of the hydraulic system. We used the following characteristics in our PVA, listed in order of importance:
• Size of smallest filtered particle • Pressure drop corresponding to a flow rate of 50gpm • Weight • Length • Diameter
. It is important for the filtered particle size to be as small as possible because the main cause of hydraulic system failure is contaminated fluid. Finer filtering corresponds to cleaner fluid and an increased service life. However, a finer filter causes a greater pressure drop across the filter. Pressure drops within the hydraulic system decrease the performance of the entire system. Therefore it is very important to find a filter that can remove the required particle size without causing a large pressure drop. The Hydrotechnik KF3 filter meets this criterion better than the other filters considered.

22
According to Challenge X, there the weight and size requirements of our system are flexible. Weight and size were still considered in our filter choice, but it wasn’t critical that choose the lightest and smallest filter. The Hydrotechnik KF3 filter was not the lightest or the smallest, but it also was not the heaviest or the largest. The Hydrotechink KF3 filter can remove particles 5 μm in size while producing a pressure drop of only 9 psi. This is better than the other filters considered. Neither the weight nor size of this filter is excessive. This combination of characteristics makes the Hydrotechnik KF3 filter the best choice for Challenge X’s fluid conditioning system. 7.3 Hydac EDL-4 Air Cooler Selected We suggest that Challenge X use the Hydac air cooler with model number EDL-4. This cooler meets the system requirements, and according to our PVA results, shown in Appendix C.4, it has the most desirable characteristics compared to the other coolers considered. Table 6 lists the cooler’s characteristics and shows how it meets the customer requirements.
Table 6: Characteristics of Hydac EDL-4 air cooler with respect to customer requirements. Characteristic Customer Requirement Performance
Maximum Flow Capability 80 gpm 60 gpm Maximum Allowable Operating Pressure 200 psi 230 psi
Heat dissipation Maximize heat dissipation 55,990 BTU/hr Pressure drop at flow of 45 gpm Minimize pressure drop 15 psi
Weight Less than 40 lbs. 35 lbs. Height Minimize size 19.67” Width Minimize size 16.57” Depth Minimize size 7.37”
Many types of heat exchangers are available to cool hydraulic oil. These include shell-and-tube, plate, and air-cooled. Shell-and-tube heat exchangers are used in applications with high temperature and pressure demands. Plate heat exchangers have channels that two different fluids can flow through to exchange heat. These types of heat exchangers are used in low-viscous applications with moderate temperature and pressure demands. Air cooled heat exchangers contain an integral fan for cooling the fluid. For mobile applications, air cooled heat exchangers are the most practical choice. Their compact design allows them to fit most equipment. Although shell-and-tube type heat exchangers have higher heat dissipation rates, their great size and weight makes them impractical for use in vehicles. Using globalspec.com and thomasnet.com, we found nearly 600 heat exchanger manufacturers and distributors. First we narrowed down the options by looking at the companies that were based in the Midwest region of the United States. We then visited the companies’ websites and found which ones manufactured air coolers. At this point we had about a dozen companies to choose from. We could then quickly eliminate companies whose heat exchangers did not meet our maximum flow capability (80 gpm) and maximum allowable operating pressure (200 psi) requirements. This allowed us to narrow our options down to four manufacturers. These manufactures and the characteristics of their coolers can be found in Appendix C.3. To choose a cooler from these four options, we used the following characteristics in our PVA, listed in order of importance:
• Heat dissipation rate • Pressure drop corresponding to a flow rate of 45 gpm • Weight • Height, width, and depth

23
The most important characteristic to consider is the heat dissipation rate. This determines the cooling capacity of the heat exchanger. The Hydac ELD-4 had the highest heat dissipation rate of the four main candidates. It also had the lowest pressure drop. As stated in the Filter Selection section, size and weight constraints are flexible for our system. Although the Hydac EDL-4 was the heaviest cooler considered, and the ASA Hydraulik cooler had smaller dimensions, the benefits of the high heat capacity and low pressure drop of the Hydac system outweighed the disadvantages, as shown in the PVA in Appendix C. The cooling fan on the Hydac EDL-4 is powered by a 12 V DC motor. The cooler dissipates 22 HP. According to Curis Caufy at Bosch Rexroth, the overall efficiency of the motor is 75%, assuming an average displacement of 30% of the maximum displacement. This produces a heat input to the oil of 3 HP. With two motors in the Equinox, this means that the cooler must remove 6 HP from the hydraulic fluid. Thus, the 22 HP cooling capacity of the ELD-4 cooler is sufficient for our system.

24
8. INITIAL ENGINEERING PARAMETER ANALYSIS FOR AERATION DETECTION As shown in our Pugh chart, we decided to further investigate the feasibility of an aeration detection device by applying a vacuum. This entails taking a sample of the fluid flowing through the system and applying a drop in pressure to separate the entrained and dissolved air from the hydraulic oil. We performed a rigorous engineering design analysis to determine the dimensions, material, and components for our system. Many engineering changes have been made since the development of the design presented in this section. Please refer to Section 11 for all engineering change notices. 8.1 Measuring Percentage of Dissolved and Entrained Air in Sample To measure the percentage of dissolved air and entrained air in our sample we developed a technique that requires applying a vacuum force. Reducing the pressure in the sample will cause the gas (both entrained and dissolved) and liquid to separate through Henry’s Law. In the aerated mixture, both the entrained and dissolved nitrogen molecules make up a certain percentage of the volume. With the air and oil separated, we will be able to determine the amount of air that was in originally aerated in the oil as shown by the following equations: % Air in Oil = 1- = We can obtain this information by measuring the piston location and displacement as well as the level of the oil relative to the top of the cylinder. These distances are shown in the Figure 11.
Figure 11: Measurement of Fluid to Determine Percentage of Air in Oil
We can calculate the change in volume of the oil by using the measurements of P and Y as shown in Figure 11 by Equation 5. To measure P and Y we will use a cable extension transducer and a photoelectric sensor, respectively.
∆X = P-Y (5) Taking this difference allows us to neglect the possible expanded volume of air if we apply a great enough vacuum force (ideal gas law). Thus, ∆X represents the amount of air that was present in the oil. Please refer to Section 8.6 for requirements for this measurement to work properly. We strongly believe that obtaining these measurements will allow us to determine the percent volume of nitrogen in the fluid. 8.2 Development of Device Dimensional Parameters We began sizing our piston and cylinder to obtain a balance between length, diameter, and applied pressure. Minimizing the diameter of the cylinder has the benefits of minimizing the required force to obtain a desired pressure (Force = Pressure*Cross Sectional Area). A smaller diameter is also less sensitive to vehicle angle (gravitational force). The sensitivity to vehicle angle is an important consideration due to our need to accurately measure fluid level. For ease of material selection, we
Volume of Pure Oil + Expanded Gas . Volume of Pure Oil + Volume of Entrained Air + Volume of Dissolved Air
P = Piston Displacement
Change in Volume of Oil. Original Volume of Oil
Y = Distance from top of cylinder to oil level X2 = New height of deaerated oil
X1 = Original height of aerated oil
P

25
decided to choose a pipe inner diameter that is readily available on the market and would allow us to fit all of our measuring components at each end. We decided to use a 2 inch inner diameter pipe for our cylinder housing. The limiting factor for this decision was the size of our photoelectric sensor which will be placed on the top. The length of the cylinder will affect the accuracy of our measurements greatly. As shown in Figure 12, the percent volume of air (V1) that is in the sampled volume of fluid (V0) is equal to the ratio of the height of the air (H’) to the height of both the air and oil (H). Thus, when measuring a small percentage of air in the sample, a longer cylinder will have a greater H’. However, a longer cylinder requires a longer piston shaft which protrudes out of the cylinder when extended. Since the ADS will be placed on a vehicle we also need to consider packaging constraints. Our goal is to keep the length of the ADS when the piston is fully extended to less than 2 feet. To determine the height of our cylinder, we needed to first determine the required height of the initial fluid sample. This is determined from the resolution of our fluid level measuring device and the smallest percentage of air we desire to detect. The resolution of our photoelectric sensor is 0.1mm (0.00393 in) and we would like to detect at least 0.5% aeration. Based on the logic shown in Equation 6, we need the height of our sample to be approximately 4 inches. Equation 6 shows that if there is 0.5% volume air in our 4 inch sample, then the height difference between the aerated and deaerated fluid sample will be 0.00393 inches, the smallest change in height that the photoelectric sensor can detect. We also need to take into account the size of our piston head; therefore our cylinder length should be 5-6 inches. 0.5% volume air = 0.1mm (0.00393 in.) => 100% volume air = 10mm (7.87 in.) (6) 8.3 Force Parameters The amount of pressure required to separate the entrained and dissolved gas from the hydraulic oil can be determined by Henry’s Law. This simplified version of this law states that “the amount of gas absorbed by a liquid is directly proportional to the partial pressure of that gas in contact with the liquid and the solubility coefficient of that gas in the particular fluid”, as shown below [19].
P = kC The value of k is the same for the same gas, liquid, and temperature combination. As long as the temperature remains constant, the concentration to pressure ratio is the same.
1
2
1
2
2
2
1
1
PP
CC
PC
PC
=⇒= (7)
If we make certain assumptions, we can use Equation 7 to determine the pressure needed to apply a vacuum force. If we have a greater initial concentration, the equation shows that we will need to apply a smaller pressure compared to if we had a smaller initial concentration. Thus, we will turn to our desired resolution for our detection system because it is the smallest concentration that we will need to detect. We want to detect 0.1% concentration of air. Assuming that the cylinder is rigid and non-deformable, when the cylinder is closed off from the flowing fluid, the pressure inside of the cylinder will be
P = Partial Pressure of Gas k = Henry’s Law Constant C = Concentration of Dissolved Gas
H
R
H’ • V0 = πR2*H • V1 = πR2*H’ • V1 / V0 = (πR2*H’)/ (πR2*H) • V1 / V0 = H’/ H
Figure 12: Proportion of Air in Volume Related to Height Ratio

26
atmospheric (14.69psi). This results in a required final pressure of 0.2938psi. This is a pressure drop of 14.4psi. This relates to the force required to actuate the piston. Multiplying the pressure by the area of the piston, we require a 98.96 lb. force for our chosen cylinder size.
Figure 12: Force Applied to Piston is Equal to Pressure Times Piston Area We also determined the force required to push the fluid back into the system. From meetings with Professor Kurabayashi, we found out that this can be calculated by assuming that the motion is slow and that the fluid is static. The required force is affected by the weight of the fluid (fluid density and height) and the cross sectional area of the cylinder. The weight of our fluid can be neglected because our volume is so small. Thus, if the fluid in the hydraulic system is pressurized at 200psi, the force required to put the sample of fluid back into the hydraulic line is 628 lbs. The greatest pressure that our piston will need to withstand is 200psi. This also occurs when the solenoid valve is open and a fluid sample is being drawn. 8.4 Piston Actuation Mechanism Parameters With the amount of force required to actuate the piston calculated (628 lbs), we designed the mechanism to operate the linear motion of the piston. We chose to use a rack and pinion to translate the rotational motion of an electric motor into linear motion of the piston. This method will allow us to incorporate a mechanical advantage, use an electric motor with less torque, and position the piston precisely. We have decided to use a shaft diameter of 0.75 inch so that we can place a 0.1875 inch2 rack with a 14-1/2 degree pressure angle within it similar to Figure 13.
Figure 13: Example of Rack Integrated with Piston Shaft We chose a gear with the same pitch (24 pitch) and had the smallest available pitch diameter. A smaller gear will require less torque from the motor. The smallest steel pinion gear that we found has a 0.5 inch pitch diameter. 8.4.1 Motor Selection Parameters Based on the 628 lbs. force required to actuate the piston and the 0.5 inch diameter gear, the force torque required by the motor is 157 in-lbs. For this high torque application, we found many gear drive electric DC motors that can obtain handle this torque as well as run at a low RPM. We also want to incorporate into our final design a motor controller with a feedback loop to precisely control the motion of our motor. This also needs to be considered when choosing a motor.
Pressure
Area
Force

27
8.5 Material Selection Parameters We must select materials that can handle the operating conditions of the Aeration Detection System. This includes the materials of the piston and cylinder. The selected materials must handle the required pressures encountered by the system. They must also have the proper dimensions to carry the given loads. In addition to handling the engineering requirements, the selected materials should be economically reasonable and readily available. 8.5.1 Cylinder Material We selected Cast Aluminum 195-T6 to make the cylinder. Aluminum is corrosion-resistant, which is desirable for long-term purposes. With a specific weight of 0.100 lb/in3, it is much lighter than ferrous metals such as stainless steel. Cast Aluminum 195-T6 is a common and readily available material. To handle the required pressure requirements, with a safety factor of 10, the minimum thickness of the cylinder must be at least 0.083 in. We determined this by modeling the cylinder as a thin-walled pressure vessel. The formulas for the hoop stress, σh, and circumferential stress, σa, are given in Equations 8 and 9 [22], where p is the internal pressure, r is the inner radius, and t is the thickness of the cylinder.
tpr
h =σ (8)
tpr
a 2=σ (9)
The internal pressure, p, of our system is 200 psi. The inner radius, r, is 1 in. We need to determine the minimum thickness, tmin, of the cylinder to ensure that the material will not fail. We can define failure as the stress at which the material yields. The yield strength, σY, of Cast Aluminum 195-T6 is 24,000 psi [22]. We substitute these values for σh and σa in Equations 8 and 9, respectively, and solve for tmin. This gives us two values of tmin, 0.00833 in and 0.00417 in. The former is for the hoop stress and the latter is for the circumferential stress. We must regard the larger number, 0.00833 in, to be the minimum thickness required for the cylinder, because anything thinner than this will cause the cylinder to yield. Using a safety factor of 10, the minimum thickness of the cylinder must be at least 0.083 in. This ensures that the cylinder will not yield from the internal pressure under regular circumstances. 8.5.2 Cylinder Top Cap Design The cylinder cap will have a small channel where the fluid level sensor will be embedded, of diameter 7/16 inches. The end will poke into a hole drilled out for fluid exit flow, 11/32 inches in diameter. The ratio of the small exit area to the cylinder area is approximately 1:76. This allows monitoring of when oil has reached the surface much more accurately. Having this small exit channel, of height 1 inch, is equal to being able to detect when the fluid has reached the top of the cylinder within 0.013 inches. The cap should be part of the aluminum casting with the rest of the cylinder and machined afterwards. 8.6 Requirements for System Functionality and Concerns with Design In order for our system to function properly, there are several requirements that must be met. Our cylinder must be completely filled with fluid and there cannot be any air inside of it initially. Having air in the system introduces issues with properly measuring our distances to determine the original percentage of air in the oil. Also, we must ensure that all tested fluid and air must be ejected at the end of our diagnostic test The piston will be used to control the fluid flow into the cylinder chamber. Otherwise, the valve has the ability to cause a pressure drop on the incoming fluid. This reduction in pressure can separate the air from the liquid before any measurements are taken; this outcome is undesired. Our design requires that when the valve is opened to allow a sample of fluid to be taken, the piston is located at the same height of the valve. The piston will then slowly draw the sample to prevent any cavitation.

28
9. FLUID CONDITIONING SYSTEM FINAL DESIGN DESCRIPTION From our concept selection Pugh charts and our component selection PVA analyses, we have determined the components and location for our system that best meet our customer requirements. We have selected a Hydrotechnik Return Line KF3 Filter and Hydac EDL-4 Air Cooler and have placed them in serial configuration. 9.1 Filtering and Cooling System Components and Locations Through analysis, we discovered that it is beneficial to place the filter before the cooler. Due to the cooler’s intricate flow, having clean fluid will prevent wear on the internal tubing of the filter as well as to promote better cooling since the fluid has fewer contaminants. Having particles in the fluid can actually cause the fluid to heat up as it flows through a tube configuration similar to that of the cooler and the contaminants can affect the thermal conductivity of the fluid resulting in less effective cooling. We found no benefits of placing the cooler before the filter because the filter performance is independent of fluid temperature. Our schematic for our configuration can be seen in Figure 14. We will utilize the same tubing as the rest of the vehicle, and we will purchase the check valves, thermostatic relief valve, and pressure relief valve from the same supplier. 9.2 Control System Functions In order for our system to function properly, we need to place check valves and relief valves at various locations to control our system. Several things that we took into account in our design were:
• Filters and cools the fluid only when flowing from high pressure accumulator to low pressure accumulator (during acceleration and steady state)
• Check valves ensure that there is no backwards flow into the system when the vehicle braking (fluid flows from low pressure accumulator to high pressure accumulator.
• When cooling is not needed, we have the ability to bypass it. • We must filter as often as possible as long as there is no “backwash” • If the pressure is too great in our system (heavy acceleration or clogged components), we can
bypass it with a relief valve.
This configuration meets our customer requirements the best, but there are some downsides to our design’s control system:
• Requires use of many bypass lines which add weight and complexity to the system • The extensive use of valves can lead to cavitation from pressure drops • Need to calibrate and configure the thermostatic relief valve and pressure relief valve to desired
settings
HP Accumulator LP Accumulator
Check Valves Air to Oil Cooler
Thermostatic Relief ValvePressure
Relief Valves
Filter
Figure 14: Schematic of Fluid Conditioning System
ADS

29
9.2.1 Control System for Cooler The purpose of the control system for the cooler is to bypass the cooling element when the oil is at a safe temperature, and divert flow from the cooler at high flow rates. Allowing cool oil to enter the cooler is unnecessary and will cause unwarranted pressure drops. Allowing the full flow fluid to enter the cooler can damage the cooler because the maximum flow rate that the cooler can handle is 45 GPM. However, the average flow rate in the Challenge X vehicle is approximately 50 GPM, and at times there can be bursts of flow up to 80 GPM. We purchased the Hydac ELD-4 with an optional thermal relief valve. This controls the passage of the fluid through the cooling element. The fluid bypasses the cooling element when the valve is open, and enters the cooling element when the valve is closed. The thermal relief valve is completely open at temperatures lower than 113° F. The valve starts closing at 113° F, sending some of the flow through the cooler, and is completely closed at 131° F, sending the full flow through the cooler. This maintains the temperature at approximately 120° F, the desired operating temperature for hydraulic fluid [18]. The fluid should not reach the maximum allowable temperature of 150° F. The Hydac ELD-4 also has an optional pressure relief valve. This controls the amount of fluid flow through the cooler. The full fluid flow enters the cooler when the valve is closed, and as the valve opens, the flow can be partially bypassed around the cooler. The pressure relief valve is completely closed at pressures lower than 3 bars, sending the full fluid flow through the cooler. As the pressure increases over 3 bars, the bypass valve opens, so that the cooler only handles its maximum allowable flow rate. This way, even if the flow rate in the vehicle exceeds 45 GPM, the flow rate through the cooler will not reach a dangerous level. 9.2.2 Control System for Filter The control system for the filter includes only a pressure bypass valve. Fluid will bypass the filter through a spring loaded valve when the pressure drop through the filter is greater then 15 psi. The bypass valve is important because a pressure drop through the filter greater than 15 psi in addition to the pressure drop through the cooler will affect the performance of the hydraulic system [4]. The Hydrotechnik KF3 filter comes standard with a spring that will allow the fluid to bypass at 30 psid. However, we were able to order it with a different valve spring so that it will bypass at 15 psid. We ordered the filter through J.E. Myles Incorporated out of Troy, Michigan and we corresponded with Colin Myles. He verified that the filter we chose is indeed the correct filter for our application.

30
10 AERATION DETECTION SYSTEM INITIAL DESIGN DESCRIPTION We developed an aeration detection system for the Challenge X vehicle (can be used in any hydraulic hybrid vehicles) that will be able to measure the percentage of air entrained and dissolved in the hydraulic fluid to determine the extent of the nitrogen leakage problem. This is our initial design which we used to design our prototype. 10.1 Aeration Detection System Our initial design encompasses all of our engineering parameters described in the previous section. It utilizes components such as:
• T-junction solenoid valve to control the sampling of hydraulic fluid • Photoelectric sensor to locate fluid level • Cable-extension transducer sensor to measure piston displacement • DC electric gear motor to actuate the piston • Sealed piston to apply vacuum on fluid sample • Rack and pinion to translate rotational motion from motor into linear motion
A SolidWorks CAD model of our ADS is shown below with all of our major components labeled. Our ADS is designed to operate when the vehicle is on level ground and is stationary (hydraulic fluid not flowing but under pressure from accumulators). The vehicle must be on level ground for the device to obtain an accurate fluid level, and there will be lower likelihood of obtaining cavitations and sloshing of the fluid when sampling if the vehicle is not moving and fluid not flowing. Sampling will take place once per hour when the vehicle is in use and stationary. The following is a list of the operation steps of the device:
1. Piston is located against top of sampling chamber near valve 2. Solenoid valve opens and the piston draws sample of fluid to mid height of chamber 3. Solenoid valve closes and the piston applies vacuum 35psi vacuum inside of chamber 4. Cable extension transducer measures displacement of piston 5. After waiting 30 seconds for surface bubbles to settle, photoelectric sensor measures fluid height 6. All data is recorded and interfaced to computer 7. Solenoid valve opens and fluid is pushed back into system by the piston
Figure 15: Isometric View of our ADS Design
Photoelectric Sensor
Cable Extension Transducer Sensor
Piston
T-junction w/ Solenoid Valve
DC Gear Motor Sampling Chamber
Rack and Pinion

31
10.2 Aeration Detection Sensor Dimensions Our engineering parameter analysis allowed us to determine our key dimensions. Below are dimensioned versions of our CAD drawing. For further explanation behind these key dimensions, please refer to Section 8
Figure 18: Dimensioned Right-Side View of ADS Design
Figure 17: Dimensioned Front View of ADS Design
Figure 16: Dimensioned Top View of ADS Design
1 in
2 in
5 in
1.18 in
1 in
8.75 in
2.36 in
2.65 in
6 in
2.5 in 3 in

32
10.2.1 Components for Initial Design Table 7 lists both our major off the shelf and in house components for our initial design. Table 7: Components Used in the Initial Design of ADS
Part Manufacturer Model Details Price Cylinder Housing McMaster-Carr 9056K241 Alloy 6061 Aluminum Round Tube 3-1/2" Od,
3" Id, .250" Wall Thickness, 1' Length $33.88 Piston McMaster-Carr 9035K11 Alloy 7075 Aluminum Disc 3" Diameter, .500"
Thick $11.85 Pinion McMaster-Carr 6325K89 Steel Plain Bore 14-1/2 Deg Spur Gear
32 Pitch, 16 Teeth, 0.5" Pitch Dia, 3/16" Bore
$9.39
Rack McMaster-Carr 6295K11 Steel 14-1/2 Deg Pressure Angle Gear Rack 32 Pitch, 3/16" Face Width, 3/16" H O'all, 2' Length
$19.17
Solenoid Valve McMaster-Carr 4738K177 Brass Solenoid Valve W/ Buna-N Diaphragm 1" NPT Female, 120 Vac, 230psi max $106.66
DC Gear Motor McMaster-Carr 6470K54 Parallel-Shaft DC Gearmotor 1/2 hp, 60 rpm, 476 In-lbs Torque
$536.51
Photoelectric Sensor Banner Q50 LED, 60x20x50mm, resolution is 0.25mm
TBD
Cable Extension Transducer Sensor
Micro-Epsilon MK30 range of 150 mm resolution is 0.1 mm
TBD
Piston Shaft McMaster-Carr 8974K37 Alloy 6061 Aluminum Rod 1" Diameter X 6' Length $27.15
10.3 Methods of Measuring Displacement and Oil Level For our calculations, we need to take accurate measurements of the piston displacement and the level of hydraulic fluid within several microns. A variety of methods of measuring distances are available on the market. These include different types of calipers, micrometers, depth gauges, linear position sensors, and optical sensors. We needed to select the best measurement method applicable to our purposes and constraints. 10.3.1 Piston Displacement Measured with Cable-Extension Transducer To measure the displacement of the piston, we selected the Micro-Epsilon WPS-150 MK30 cable-extension transducer. The datasheet for this device can be found in the Appendix. This device attaches a cable to a moveable object. As the object moves, the cable extends and the transducer produces an electrical signal proportional to the cable’s linear extension. The output is analog, and can be used to determine how far the object moved [20]. There are many advantages to using a cable-extension transducer over other displacement measuring methods. These systems are compact, easy to mount, offer high accuracies and resolutions. Their construction is designed for mobile applications and can withstand difficult ambient conditions. They are also economical compared to other measurement options. The most important parameters that went into our selection process were the maximum usable range and the resolution. The range of the transducer had to be sufficient to measure the maximum possible displacement of the piston, but excessive ranges raise the price of the transducer. The WPS-150 MK30 has a range of 500 mm (19.68 inches), which is sufficient to measure the displacement of the piston. The resolution is 0.1 mm (0.00393 inches), which is ample for our purposes. Additionally, this transducer is compact and easy to mount. It measures 52 X 45.5 X 42.5 mm. and weighs only 45 g [21]. 10.3.2 Method of Measuring Oil Level The oil level in our initial design was to be measured with a photoelectric sensor. The sensor must be able to measure a range of 20 mm with a maximum resolution of 0.5 mm. Originally a laser was going to be used, because the resolution is very high (measured in microns), but it was too expensive (~$1000). A

33
more affordable LED-sensor can measure a range of 100 mm with a resolution of 0.25 – 0.5 mm (Banner – Model Q50). The sensor works by reflecting back light off the surface of the oil at an angle and calculates the gap. Because there will need to be a 20 – 50 mm buffer zone, the sensor was to be mounted slightly above the surface of the cylinder, which is made of transparent Plexiglas to allow light through. Other sensors were considered, but were determined to not be useful. A ultrasonic proximity sensor would be precise enough, but does not work in vacuums. As mentioned above, a laser was determined to be too expensive. A floating magnet was also considered, but then the plunger would not be able to push all of the oil out. 10.4 Valve to Control Fluid Sampling A solenoid valve will be used to permit fluid to enter the ADS. The solenoid valve will be a normally closed, small valve. When fluid is to enter the ADS, a current will be sent to the solenoid valve. This will power a coil to create a magnetic field, opening the valve and allowing fluid through. However, fluid will not be able to fill the ADS until the plunger is lowered, which will be done slowly so cavitation is avoided by regulating the flow through the valve. This will also help to avoid interrupting the main flow in the system, should it be running. After the ADS fills to the desired level, the solenoid valve will close again, thus sealing the system and permitting a vacuum to be created. The size of the solenoid valve should be small, such that the volume at the exit area of the valve connected to the ADS is minimized. This is important because as the vacuum is created, air will first collect in this area before inside the ADS, where it can be measured. We chose a McMaster-Carr brass solenoid valve with a Buna-N diagram, 1” diameter and can handle 230psi 10.5 Aeration Detection Sensor Location and Configuration We decided not to place our Aeration Detection System as part of our fluid conditioning system since it does not actually condition the fluid; rather it acts as a passive monitoring device that can also be placed parallel to the hydraulic system. The benefits of placing the ADS after the fluid conditioning system as shown in Figure 9 are:
• Low pressure side of the system • Any aeration or cavitation caused by pressure drops from our conditioning system will be detected
before cycling through the other components • Placing it downstream from the filter ensures that the ADS will not accidentally detect dirt particles
for air bubbles. One major disadvantage for placing the ADS after the fluid conditioning system is that the fluid will be at a lower temperature than it was before the cooler. As mentioned earlier in this report, according to Le Chatelier’s Principle, as the temperature of the fluid increases, it is easier for the gas to come out of solution. Thus, placing the ADS after the cooler will hinder the ability of our aeration detection system to pull the gas out of the liquid. The ADS cylinder should be mounted vertically so that the fluid is above the piston, similar to Figure 15. Since the unit has a length of 2.5 feet when fully extended, it would be preferred to place it inside of the engine compartment where it can be protected from any road debris.

34
11. PROTOTYPE DESCRIPTION Many engineering changes were made to our ADS between our final design and our prototype. The prototype was meant to be a proof of concept, so it did not need to operate under the same conditions or be made with the same material that would be seen in the vehicle. Also, upon further evaluation we were able to simplify our design concept. 11.1 Changes to Prototype Mechanism
IS: 1. Piston is flush against the top of sampling
chamber near valve 2. Solenoid valve opens and the piston
draws a fluid sample 3. Solenoid valve closes and cable extension
transducer measures height of the aerated fluid.
4. Piston applies vacuum force inside chamber
5. After waiting a delayed period for deaeration to take place, directional valve turns to atmosphere, solenoid valve opens, and piston pushes air out of the cylinder until fluid touches fluid level sensor.
6. Solenoid valve closes; directional valve turns to the flowing fluid, and cable extension transducer measures height of the dearated fluid.
7. Solenoid valve opens and fluid is pushed back into system by the piston.
WAS: 1. Piston is flush against the top of sampling
chamber near valve 2. Solenoid valve opens and the piston
draws a fluid sample 3. Solenoid valve closes and cable extension
transducer measures displacement of piston
4. Piston applies a vacuum force inside chamber
5. After waiting 30 seconds for dearation to take place, photoelectric sensor measures fluid height
6. Solenoid valve opens and fluid is pushed back into system by the piston
Figure 19: Engineering change notice regarding the design concept and ADS process

Figure 20: Multiple engineering change notices were made between the final design and the prototype
WAS: IS:
DC Gear Motor with parallel shaft
Automotive Window Motor with 90 degree shaft
Notes: We changed the cylinder length because removing the photoelectric sensor from our design changed the resolution of our fluid level measuring device. We changed the length of the rod accordingly. We used an acrylic cylinder for the prototype instead of the aluminum cylinder we designed so that we could see our ADS work. We pressurized the fluid going to the ADS to 50psi instead of the 200psi that would be seen on the vehicle to ensure safety and prevent a mess. This changed the force-torque requirement for the motor from 157in.-lb to 40in.-lb. For this reason we used an automotive motor with a 90 degree shaft instead of the DC gear motor chosen for the final design.
Notes: We used a rack and pinion with a pitch of 24 instead of the original 32 because the bore size was too small to fit the shaft of our motor. We used a solid piece of aluminum and O-rings for our piston head instead of sandwiching nitrile rubber between multiple pieces of aluminum to simplify the design and ensure a rigid seal.

11.1.1 Photoelectric Sensor Removed from Design We realized that we would not be able to manufacture a vacuum sealed prototype and that any air leaks into the system would lead to an inaccurate measurement of Y in Figure 11. Instead of using the photoelectric sensor, we decided to eject all the air inside the cylinder after we separate it from the fluid, and then use the cable-extension transducer to measure the height of the deaerated fluid, X2 in Figure 11. To do this we had to connect a directional valve to our solenoid valve so that we could eject the air to atmosphere. We also had to add an optical fluid level sensor to sense when the fluid touched it, indicating that all of the air was ejected. We made all changes as a team and they were approved by our sponsors. Figure 19 shows how the change in components change 11.1.2 Height and Material of Cylinder Changed Since we eliminated the photoelectric sensor, the length of our cylinder is now based on the resolution of the cable extension transducer, 2mm (0.0787 in.). This resolution is different than the resolution previously reported for the cable-extension transducer. In automating the ADS (See Section 11.2), the analog to digital conversion decreased the resolution of our measuring device because of the number of bits used. We found that a safe concentration of air range is between 1% and 6%. Therefore we would now like to detect at least 1% aeration. We used the same logic as before to determine that the height of the initial fluid sample required in order for our prototype to detect a 1% volume of air. Our calculations show that the initial fluid height needs to be 8in. We also need to account for the height of the piston head 1in. and the distance the piston may travel while creating a vacuum. Accounting for these heights leads to a cylinder length of 12in. Since the prototype is meant to be used as a proof of concept, is beneficial to see inside the cylinder during the aeration detection process. For this reason, we used an acrylic pipe as the cylinder with an inner diameter of 2 inches instead of the aluminum cylinder in the original design. 11.1.3 Maximum Fluid Pressure Changed to 50psi For the prototype, we borrowed a small accumulator from the EPA that could be pressurized to 3000psi. However, to pressurize the accumulator we used a bicycle pump that could produce a maximum pressure of 100psi. To ensure our safety and prevent a mess we decided to pressurize the accumulator to only 50psi. We then recalculated the maximum force our piston needed to withstand to be 157 lbs. This new pressure changes the force-torque required for the motor to produce to 40 in-lbs for our prototype. Keeping in mind that we would be connecting the motor to a controller, we searched for motors that could be run on a low voltage and draw a small current. We found that an automatic car window motor would meet all of our requirements 11.1.4 Pitch of Rack and Pinion Changed to 24 The bore of the pinion originally chosen was too small to fit on the shaft of the motor. We used a pinion with a bore one size larger for our prototype. This changed the pitch to 24 but kept a pitch diameter of 0.5 in. We used a rack that also had a pitch of 24. 11.1.5 Piston Head Redesigned Upon further evaluation of the sandwich design for the piston head and nitrile seals, we realized that it was not the simplest possible design. It would be difficult to cut nitrile rubber perfectly circular such that a perfect seal could be produced and multiple layers of aluminum would increase the complexity of our design.
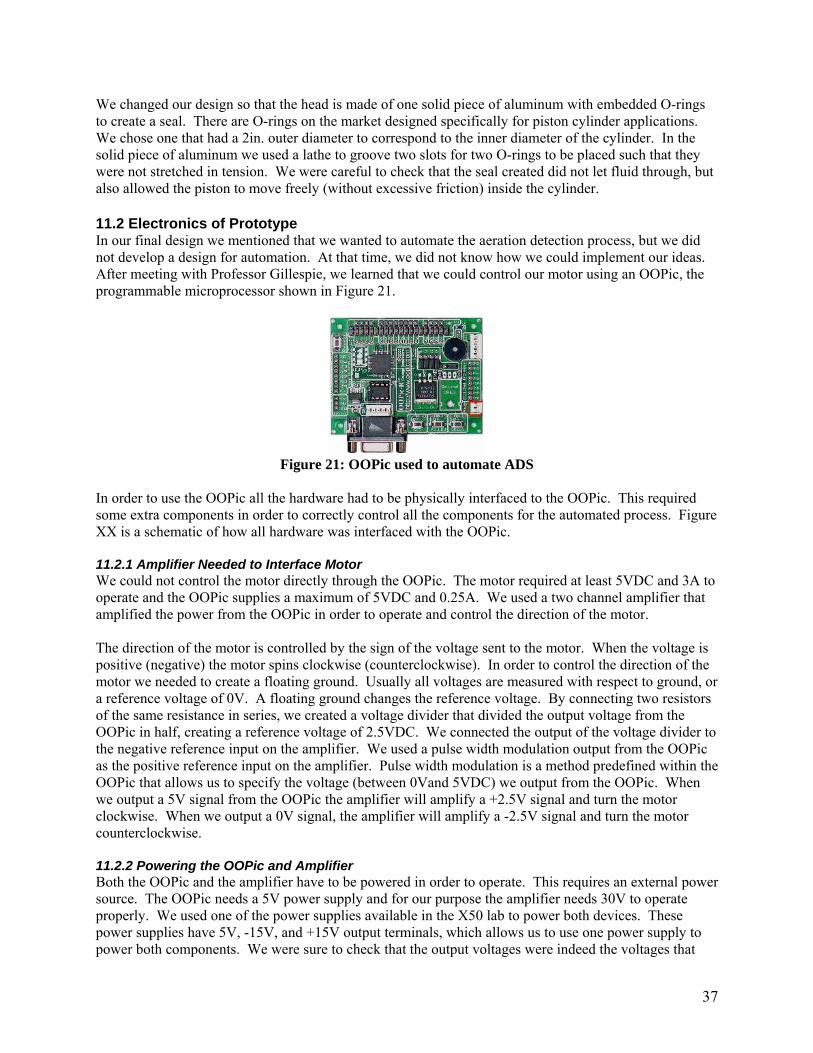
37
We changed our design so that the head is made of one solid piece of aluminum with embedded O-rings to create a seal. There are O-rings on the market designed specifically for piston cylinder applications. We chose one that had a 2in. outer diameter to correspond to the inner diameter of the cylinder. In the solid piece of aluminum we used a lathe to groove two slots for two O-rings to be placed such that they were not stretched in tension. We were careful to check that the seal created did not let fluid through, but also allowed the piston to move freely (without excessive friction) inside the cylinder. 11.2 Electronics of Prototype In our final design we mentioned that we wanted to automate the aeration detection process, but we did not develop a design for automation. At that time, we did not know how we could implement our ideas. After meeting with Professor Gillespie, we learned that we could control our motor using an OOPic, the programmable microprocessor shown in Figure 21.
Figure 21: OOPic used to automate ADS
In order to use the OOPic all the hardware had to be physically interfaced to the OOPic. This required some extra components in order to correctly control all the components for the automated process. Figure XX is a schematic of how all hardware was interfaced with the OOPic. 11.2.1 Amplifier Needed to Interface Motor We could not control the motor directly through the OOPic. The motor required at least 5VDC and 3A to operate and the OOPic supplies a maximum of 5VDC and 0.25A. We used a two channel amplifier that amplified the power from the OOPic in order to operate and control the direction of the motor. The direction of the motor is controlled by the sign of the voltage sent to the motor. When the voltage is positive (negative) the motor spins clockwise (counterclockwise). In order to control the direction of the motor we needed to create a floating ground. Usually all voltages are measured with respect to ground, or a reference voltage of 0V. A floating ground changes the reference voltage. By connecting two resistors of the same resistance in series, we created a voltage divider that divided the output voltage from the OOPic in half, creating a reference voltage of 2.5VDC. We connected the output of the voltage divider to the negative reference input on the amplifier. We used a pulse width modulation output from the OOPic as the positive reference input on the amplifier. Pulse width modulation is a method predefined within the OOPic that allows us to specify the voltage (between 0Vand 5VDC) we output from the OOPic. When we output a 5V signal from the OOPic the amplifier will amplify a +2.5V signal and turn the motor clockwise. When we output a 0V signal, the amplifier will amplify a -2.5V signal and turn the motor counterclockwise. 11.2.2 Powering the OOPic and Amplifier Both the OOPic and the amplifier have to be powered in order to operate. This requires an external power source. The OOPic needs a 5V power supply and for our purpose the amplifier needs 30V to operate properly. We used one of the power supplies available in the X50 lab to power both devices. These power supplies have 5V, -15V, and +15V output terminals, which allows us to use one power supply to power both components. We were sure to check that the output voltages were indeed the voltages that

38
they were labeled. 11.2.3 Relay needed to Interface Solenoid Valve We used a 120VAC solenoid valve from McMaster-Carr with model number 7994K55. Since the valve operates on 120VAC and draws 0.33A, we could not control the valve directly through the OOPic. We needed to find a relay that could be controlled by the OOPic and provide 120VAC while handling a current draw of 0.33A. A relay works like a switch. When it is powered, it completes the circuit and 120VAC from the wall is sent to the valve. We were able to find a solid state relay in the Digikey catalog with model number Z903-ND that met the requirements. The data sheet for this relay can be found in the Appendix. 11.2.4 Fluid Level Sensor and Cable Extension Transducer Interfaced Directly The fluid level sensor and the cable extension transducer were both interfaced directly with the OOPic. This was possible components could be powered by the 5VDC provided by the OOPic. There is a special Input/Output area of the OOPic where the pins are arranged such that one row of pins will power a device and take an input from the device. This can be seen in the figure in Appendix F. 11.3 Electronic Automated Control of Prototype Using the OOPic programmable microprocessor described above, we were able to interface the hardware of the prototype to a computer and fully automate the control of the prototype. We programmed the OOPic using the Visual Basic language. By taking inputs from the cable extension transducer and the optical sensor, the OOPic is capable of controlling the behavior of the prototype with its outputs to the motor and the solenoid valve. 11.3.1 Hardware Interfaced to Software by Object-Oriented Programming OOPic programming is object-oriented. Every piece of hardware in the prototype is declared as an object at the beginning of the program, and each object has an associated set of properties and methods that the OOPic can use to read and control the hardware. Table 8 lists the physical hardware in our prototype and their associated objects in the program.
Table 8: Prototype hardware and associated objects in OOPic program. Hardware OOPic Object Data Range Description
Cable extension transducer
Analog to Digital Input/Output Line 0 - 255 Reads voltage signal from transducer
and converts to digital signal
Optical Sensor Digital Input/Output Line 0 – 1 Reads signal from optical sensor triggered by liquid
DC Motor Pulse Width Modulator 0 – 255 Controls speed and direction of motor
Solenoid valve Digital Input/Output Line 0 – 1 Controls opening and closing of solenoid valve
By declaring objects in the program for the hardware, we can now interface the hardware with the software. We can read inputs such as displacement measurements from the cable extension transducer and the state of the optical sensor. For the cable extension transducer a value of 255 corresponds to a full range displacement of 500 mm, and a value of 0 corresponds to no displacement. A signal of 1 from the optical sensor means that the sensor is dry, and a signal of 0 means that liquid is touching the sensor. We can also control output such as the speed and direction of the DC motor and the state of the solenoid

39
valve. For the DC motor, a value of 255 corresponds to a voltage of +2.5 V, and a value of 0 corresponds to a voltage of -2.5 V. By setting the value to be 125 we can turn the motor off. For the solenoid valve, we close the valve by sending a value of 0, and open it by sending a value of 1. 11.3.2 Electronic Control Program Description The control of the prototype consists of four major steps: an initial draw of aerated fluid into the cylinder, an application of a pressure drop onto the aerated fluid to take air out of solution, an ejection of the removed air into the atmosphere, and finally an ejection of the deaerated fluid into the hydraulic line. We programmed the OOPic to perform these functions automatically. An overview of the program is given below, and the full programming script is in Appendix E. At the beginning of the experiment, the piston head is positioned at the top of the cylinder. As a first step, the cable extension transducer records and stores the initial position of the piston. The prototype begins taking the initial draw of aerated fluid by opening the solenoid valve and powering the motor so the piston moves downward. During this process, the transducer is continuously measuring the position of the piston and inputting the value to the OOPic. When the piston position has reached a level such that there is a column of 8 inches of aerated fluid in the cylinder, the OOPic signals the solenoid valve to close and the motor to turn off. We now have a cylinder filled with 8 inches of aerated fluid. At this point the transducer measures the height of the aerated fluid and displays the result onto the monitor. The next step is to apply a vacuum to the aerated fluid to take dissolved air out of solution. With the solenoid valve still closed, the OOPic signals the motor to move the piston down. The transducer takes measurements of the displacement of the piston in time intervals of 0.1 seconds. Using this data, the OOPic can calculate the velocity of the piston. We programmed the OOPic to stop powering the motor when the velocity of the piston is slower than 20 mm/sec. When the velocity of the piston is this slow, it means that a maximum pressure drop that can be applied by the motor has been reached and continuing to drive the piston may burn out the motor. Once the motor has stopped there is a time delay of one minute to allow air to bubble out of the liquid. Now that there is a volume of air sitting on top of the liquid in the cylinder, we must eject that air out into the atmosphere. The OOPic sends a signal to open the solenoid valve again and power the motor to move the piston up. The piston pushes the air out into the atmosphere. We need to stop the piston when all the air has been removed. The OOPic knows that all the air has been removed when it receives a signal from the optical sensor that liquid has touched it. When the OOPic receives this signal, it immediately closes the solenoid valve and turns off the motor. Now we have a cylinder filled with a certain volume of deaerated fluid. At this point the transducer takes a second measurement of the height of the fluid and displays it on the screen. We now have two displacements displayed on the monitor, one of the height of aerated fluid, and another of the deaerated fluid. By finding the difference between the two, we can determine the volume of air originally dissolved in the fluid. Although we have now gathered all the data needed for our experiment, we must finish the job by ejecting the deaerated fluid back into the hydraulic line. In this final step of the process, the OOPic signals the solenoid valve to open again and the motor to push the piston upward. The piston continues moving upward until the transducer reads a position that is equal to the original position of the piston at the beginning of the experiment, when the piston was at the top of the cylinder. The OOPic then signals the motor to turn off, and the final state is the same as the initial state: the cylinder is empty and the piston is at the top of the cylinder. If desired, the experiment can now be repeated.

40
12. PROTOTYPE MANUFACTURING PLAN Our prototype was manufactured as four main components. We made the piston assembly, the cylinder housing, the top cap for the sensor and valve, and the bottom bracket in separate stages. The following will go into detail the steps we took to manufacture these parts and information on the tools used. The information regarding the parts used in our prototype can be seen in the Bill of Materials in Appendix G. 12.1 Piston Manufacturing Process The manufacture of the piston head requires good accuracy and a tight tolerance level to ensure a strong seal with the surface of the acrylic cylinder. We created the piston/rod assembly with 2-3/8” aluminum stock, ¾” aluminum stock, and rubber o-rings with 0.25” width x 2” O.D. The grooves in the piston head allowed a very slight protrusion of the o-rings from the side to create the seal. Also, the piston head was attached to the rod by using a male to male connector threaded into each part; this allowed for easy disassembly if necessary. We were also every careful in machining down our piston head because we wanted to create a strong seal for our vacuum. In order to connect the cable transducer to the piston head, we had to attach a hook to the bottom surface of the piston to allow for the attachment. The rack was embedded into the rod by milling a 0.25” square slot along the length of the rod. The rack was press fit into this rod and did not require any other means of securing it. Table 9: Detailed Steps to Manufacture Piston
Step Action Machine 1 Insert 2-3/8" Aluminum stock into chuck Lathe 2 Face off end (600 rpm) Lathe 3 Drill No 8 bit 3/8" deep for screw Lathe 4 Tap hole using 1/4 X 20 tap Lathe 5 Turn stock to a diameter of 2.005" up to 4" from face (600 rpm) Lathe 6 Use 3/32" groove tool to create two 3/16" deep grooves for o-ring placement Lathe 7 Cut piston to 1" length Bandsaw
8 Insert 3/4" Aluminum stock into chuck Lathe 9 Face off end (600 rpm) Lathe 10 Drill No. 8 bit 3/8" deep for screw Lathe 11 Tap hole using 1/4 X 20 tap Lathe 12 Cut rod to 18" length Bandsaw
13 Cut 1/4" X 20 screw to join rod and piston Bandsaw
14 Using 1/4" end mill, cut 17" long and 3/16" deep groove for rack Mill 15 Cut rack to 17" length Bandsaw 16 Press fit rack into rod groove
Cylinder
Cylinder Top Cap Bottom
Bracket
Piston/Rod
Rack
Baseplate
Figure 22: Exploded Diagram of Main Assemblies
Figure 23: Piston Assembly CAD Dwg.

41
17 Drill 3/64" hole for transducer hook into bottom of piston head Drill Press 12.2 Cylinder Manufacturing Process We needed to prepare the purchased 2” I.D. acrylic tube for use in our prototype. After cutting the tube, we needed to face off the ends to ensure a smooth contact surface to epoxy the top cap. It is important to not to use cutting fluid during this process because it is undesirable to have oil impregnate the freshly cut surface and affect the bonding of the cap. Table 10: Detailed Steps to Prepare Cylinder
Step Action Machine 1 Cut tube to 12" in length Bandsaw 2 Face off ends using long end mill bit (1000 rpm) Mill
12.3 Top Cap Manufacturing Process Due to the design of the top cap and the availability of ¼” thick Plexiglas, manufacturing of the top cap required using epoxy to create our 0.75”x0.75”x1.5” rectangular prism by stacking layers of the material. Our circular and rectangular sections were cut using the laser cutter found in the Machine Shop. We made sure to take into account the 0.005” thickness of
the laser itself during our BobCAD modeling to ensure the proper fit. All drilling was done after the adhesive cured overnight. We clamped the cap in a vise and used the drill press to initially drill pilot holes and then holes of the final diameter. We were very careful to ensure that no cracking or splitting occurred during this step. The M12x1.00 tap used to create the threads for the optical sensor was very difficult to find. Al Wilson at the Chemistry Instrument Shop specially ordered this tap for his shop and allowed us to borrow it. However, the 1/8” pipe fitting tap used to tap the hole for the solenoid valve was easily found in the Mechanical Engineering Machine Shop. We had to use extreme caution when threading these two holes because we did not want to split the Plexiglas sandwich. Table 11: Detailed Steps to Manufacture Cylinder Top Cap
Step Action Machine 1 Cut 1/4" plexiglass into 2.5" diameter pattern Laser Cutter 2 Cut 1/4" plexiglass into 1.5"x0.75 " rectangular pattern (3 times) Laser Cutter 3 Epoxy stacked plexiglass rectangles onto top of cap 4 Drill 11/32" drill bit into top of plexiglass rectangle after pilot hole Drill Press 5 Tap hole with 1/8" NPT 6 Drill 7/16" drill bit into side of plexiglass rectangle after pilot hole Drill Press 7 Tap hole with M12x1.00 tap
12.4 Bottom Bracket Manufacturing Process The bottom bracket of our design was used to house the motor and cable transducer as well as to act as a guide for the piston rod. The bracket was made out of a 1/16” aluminum plate bent into the shape shown in Figure 25. This bracket was attached to a plexiglass baseplate that consisted of two ¼” thick lasercut sheets. We began by cutting the two baseplate components in the laser cutter. These two plates were adhered together using a thin epoxy and cured over night before being handled
Figure 24: Top Cap (CAD and Actual)
Figure 25: Bottom Bracket CAD Dwg.

42
We then cut the aluminum plate using the bandsaw and metal sheet cutter into the desired pattern taking into account the radius of bend (0.3”) we would be applying to this 1/16” aluminum material (found in Machining Handbook). The hole for the rod guide was drilled into the plate before we bent it into the shape shown in Figure 25 using the metal bending machine. Once both components were made, we aligned the two rod guide holes and fastened the baseplate to the bottom bracket using ¼” dia screws and nuts. We also drilled holes for the motor mount and cable transducer after we assembled the bottom bracket to the baseplate to ensure proper alignment of these devices relative to other components in the system. Table 12: Detailed Steps to Manufacture Bottom Bracket
Step Action Machine 1 Cut 1/4" Plexiglas into 5"x5" square with 2.5" hole pattern Laser Cutter 2 Cut 1/4" Plexiglas into 5"x5" square with 0.75." hole pattern and 0.25" hole Laser Cutter 3 Epoxy the two Plexiglas squares together
4 Cut 1/16" aluminum plate into desired pattern Bandsaw 5 Drill 3/4" hole into aluminum plate for piston rod alignment Drill Press 6 Bend aluminum plate into desired pattern Metal Bender
7 Drill four 1/4" holes in both aluminum and Plexiglas plates to mount together Drill Press
8 Drill two 1/16" holes in aluminum plate for cable transducer mounting screws Drill Press
9 Drill three 1/4" holes in aluminum plate for motor mounting screws Drill Press 12.5 ADS Testing Apparatus In addition to our ADS, we created an apparatus to hold the device during validation testing. We simply constructed this using ½” medium density fiberboard and L-brackets. We were able to mount the accumulator, pressure gauge, solenoid valve, and switch to the board. We supported the ADS using L-brackets mounted to the board, and these brackets served to apply a force at the top of the cylinder and at the bottom of the baseplate to ensure that these two components maintain a force against each other. Not only did this design eliminate the need to permanently attach the cylinder to the baseplate, but it also allowed us to slide the ADS in and out of the apparatus for any necessary adjustments. 12.6 Comments on Prototype Manufacturing Although most of the tools we used were readily available at the Mechanical Engineering Machine Shop, we encountered several areas of difficulty in building our prototype. For instance, issues arose when integrating the pinion that we purchased because the automobile window motor that we selected had a pinion permanently fitted to the shaft and both were made out of hardened steel. We had to request the help of Kent Pruss in the Automotive Laboratory Machine Shop to use a special tool to bore down this shaft and then solder weld our purchased pinion onto the shaft. We also had difficulty finding the M12x1.00 tap to thread the hole for our optical fluid sensor. Al Wilson specially ordered this tap for our group to use. Sealing the connections for the solenoid valve and optical sensor into the Plexiglas cap also proved to be an issue. Use of Teflon tape did not completely seal these threaded sections and air leakage occurred.
Figure 27: ADS Testing Apparatus
Figure 26: Baseplate CAD Dwg.

43
13. FINAL DESIGN MASS PRODUCTION MANUFACTURING PLAN We hope that this product will be mass produced in the future if hydraulic hybrid vehicles develop a strong market share. The production model of our ADS design would not be manufactured in the same way as our final prototype. The amount of machining that we performed was very time consuming and would not be efficient for large scale production. We can reduce the amount of assembly time and manufacturing time through part consolidation. By making the rod and piston as one piece that is die-cast with machined piston surfaces, we could greatly reduce the amount of time required for assembly; this would also enhance the performance and strength of the device. We would also like to have the cylinder and top cap die-cast as one part where the inside surface would be machined afterwards to achieve the proper tolerance grade and surface finish. Die casting for these types of aluminum components is more suitable than other metal forming methods. We conducted a cost analysis of the production run of 100,000 units of our design. This required making several assumptions. We performed our calculations assuming no bulk purchase discount for the motor, solenoid valve, o-rings, cable transducer, and optical sensor. Although discounts for bulk purchases of these components will most likely ensue, we are unsure of the reasonable discount to perform our calculations. We also assume that the machining and assembly will still be a lengthy process, and we estimate this time to be 20 minutes per unit. Table 13: Projected Mass Production Cost Analysis
Expense Quantity Cost per Unit Cost Aluminum 500000 lb $5/lb $2,500,000 Fasteners 1000000 units $0.01 each $10,000 Motor 100000 units $70 each $7,000,000 O-rings 200000 units $0.05 each $10,000 Sensors 100000 units $20 each $2,000,000 Valves 100000 units $50 each $5,000,000 Control Circuitry 100000 units $5 each $500,000 Die 1 mold units $50,000 each $50,000 Engineering 100 hours $50/hour $5,000 Die Operation 33,333 hours $50/hour $1,666,650 Machining 33,333 hours $20/hour $666,660 Assembly 33,333 hours $15/hour $499,995 Total Cost $19,908,305 Cost per Part $199.08
Our cost analysis shows that each manufactured Aeration Detection System would cost around $200. This price is most likely an over estimate based on our previously stated assumption that discounts for bulk component purchases from suppliers was not taken into account.

44
14. VALIDATION APPROACH Every component that we have designed or purchased was tested to verify that they function as intended and specified by the manufacturer. These tests would be difficult to perform if the equipment was already mounted on the vehicle, and if they failed the tests, it would result in wasted time and energy for installing and removing the cooler. We tested both the filter and cooler together on a testing apparatus through simulation of the Challenge X vehicle operating conditions. We performed this testing at the EPA under the guidance of Neil Johnson. We spent over six hours at the EPA doing this testing, and the great amount of time and effort necessary to perform validation testing was certainly a surprise and a learning experience for us. The filter tests validate that the pressure drop does not exceed the customer requirement of 15 psi. This is important because a pressure drop through the filter exceeding 15 psi will affect the performance of our system. We did not test the filter’s ability to clean the fluid; the EPA does not have the technology to do this. Neil Johnson suggested that we could send a sample to a company that will tell us the cleanliness of our fluid for $50 per sample. We would have to send both a dirty and filtered sample for comparison. With the other costs of this project, we cannot afford to spend $100 on testing fluid cleanliness. We also do not want to install a previously clogged filter into the Equinox. Cooler tests confirm that the cooler is capable of properly maintaining the oil temperature. They also verify that the cooler can withstand the necessary pressure requirements and flow rates. Similar to the filter testing, cooler validation testing also verifies that the pressure drop across the cooler is minimal. 14.1 Off-line Filter and Cooler Testing We created a test setup as shown in Figure 20. We placed the filter and cooler in series, just as they would be in the Challenge X vehicle. A pump circulated hydraulic fluid through the system at flow rates from 0 to 40 GPM. 40 GPM is the average flow rate in the Challenge X vehicle. The EPA does not have equipment to test at higher flow rates. The fluid was continuously heated. We heated the fluid to 130 °F. It was not possible to heat the fluid to higher temperatures at such high flow rates. We placed thermocouples and pressure gauges before and after the filter and cooler. We recorded the temperature and pressure of the oil going into and coming out of both the filter and the cooler. From this data, we can calculate the pressure drop through the filter, the pressure drop through the cooler, and the oil temperature drop through the cooler. Figure 28 shows the setup of the filter and cooler test.
Figure 28. Setup of oil cooler testing apparatus.
COOLER
RESERVOIR
PUMP
HEATING ELEMENT
Thermocouples & Pressure
Gauges
FILTER

45
14.1.2 Filter Testing Results The filter test results are shown in Figure 29. This shows the pressure drop across the filter over varying flow rates from 0 to 40 GPM. These results show that the pressure drop does not exceed 15 psi over a range of flow rates from 0 to 40 GPM. The filter thus meets our customer requirements and can be installed in the Challenge X vehicle.
-5
0
5
10
15
20
0 5 10 15 20 25 30 35 40 45
Flow Rate (gpm)
Pres
sure
Dro
p (p
si)
Figure 29: Pressure drop across filter over varying flow rates from 0 to 40 GPM. 14.1.3 Cooler Testing Results The pressure drop across the cooler is shown in Figure 30 for varying flow rates from 0 to 40 GPM. These results show that the pressure drop does not exceed 15 psi over a range of flow rates from 0 to 40 GPM. The cooler thus meets our customer requirements and can be installed in the Challenge X vehicle. The temperature drop across the cooler is shown in Figure 31 for varying flow rates from 0 to 40 GPM. With an incoming temperature of 130 °F, the cooler consistently brings the temperature down by approximately 10 °F to 120 °F. 120 °F is the optimum temperature of hydraulic fluid. Also, the testing shows that the cooler produces a steady temperature drop at all flow rates.

46
0
5
10
15
20
25
0 5 10 15 20 25 30 35 40 45
Flow Rate (gpm)
Pres
sure
Dro
p (p
si)
Figure 30: Pressure drop across cooler over varying flow rates from 0 to 40 GPM.
0
5
10
15
20
25
0 5 10 15 20 25 30 35 40 45
Flow Rate (gpm)
Tem
pera
ture
Dro
p (F
)
Figure 31: Temperature drop across cooler for varying flow rates from 0 to 40 GPM.
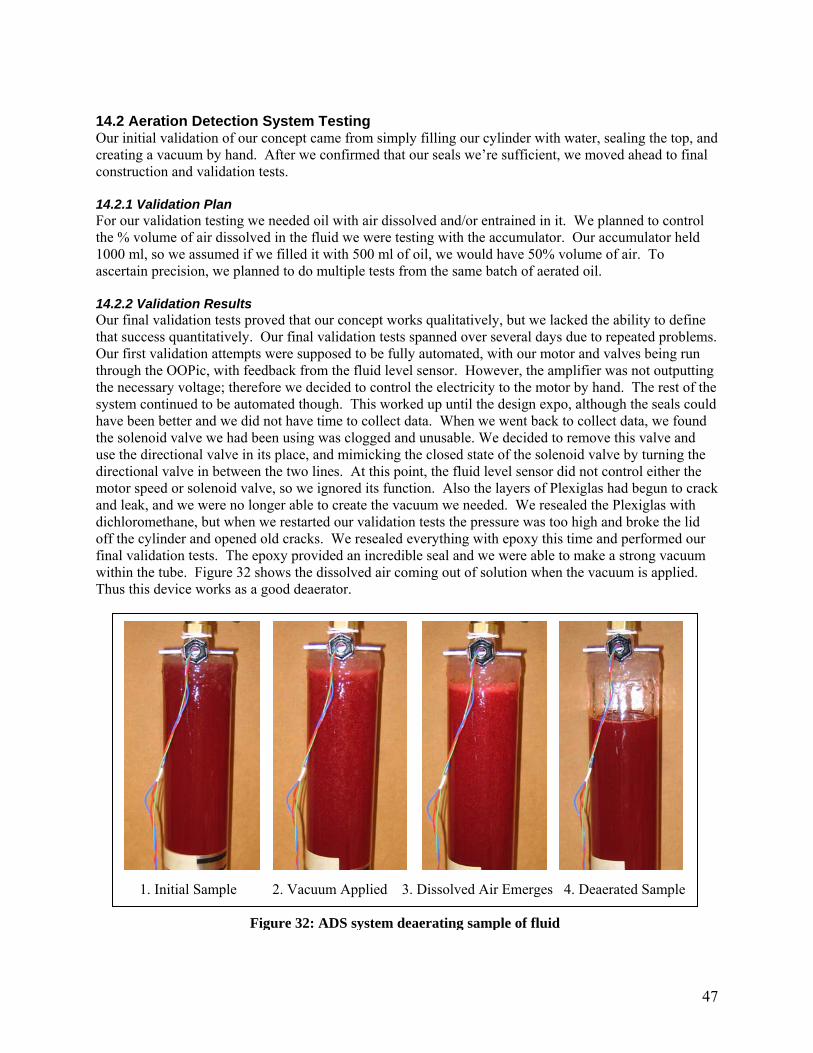
47
14.2 Aeration Detection System Testing Our initial validation of our concept came from simply filling our cylinder with water, sealing the top, and creating a vacuum by hand. After we confirmed that our seals we’re sufficient, we moved ahead to final construction and validation tests. 14.2.1 Validation Plan For our validation testing we needed oil with air dissolved and/or entrained in it. We planned to control the % volume of air dissolved in the fluid we were testing with the accumulator. Our accumulator held 1000 ml, so we assumed if we filled it with 500 ml of oil, we would have 50% volume of air. To ascertain precision, we planned to do multiple tests from the same batch of aerated oil. 14.2.2 Validation Results Our final validation tests proved that our concept works qualitatively, but we lacked the ability to define that success quantitatively. Our final validation tests spanned over several days due to repeated problems. Our first validation attempts were supposed to be fully automated, with our motor and valves being run through the OOPic, with feedback from the fluid level sensor. However, the amplifier was not outputting the necessary voltage; therefore we decided to control the electricity to the motor by hand. The rest of the system continued to be automated though. This worked up until the design expo, although the seals could have been better and we did not have time to collect data. When we went back to collect data, we found the solenoid valve we had been using was clogged and unusable. We decided to remove this valve and use the directional valve in its place, and mimicking the closed state of the solenoid valve by turning the directional valve in between the two lines. At this point, the fluid level sensor did not control either the motor speed or solenoid valve, so we ignored its function. Also the layers of Plexiglas had begun to crack and leak, and we were no longer able to create the vacuum we needed. We resealed the Plexiglas with dichloromethane, but when we restarted our validation tests the pressure was too high and broke the lid off the cylinder and opened old cracks. We resealed everything with epoxy this time and performed our final validation tests. The epoxy provided an incredible seal and we were able to make a strong vacuum within the tube. Figure 32 shows the dissolved air coming out of solution when the vacuum is applied. Thus this device works as a good deaerator.
1. Initial Sample 2. Vacuum Applied 3. Dissolved Air Emerges 4. Deaerated Sample
Figure 32: ADS system deaerating sample of fluid

48
We were unable to accumulate data to quantitatively define the deaeration we were observing. We increased the resolution of our transducer to approximately .25mm or 0.25% through our analog to digital conversion, yet out of almost ten tests we were only able to identify a % volume of air greater than 1% in one. This indicates to us that the dissolved air occupies little to no volume, and our assumptions in our validation test were wrong. The main challenge we faced in our validation tests was we were unable to do a proper design of experiment because we could not create standards to test against. In other words, we were unable to find or create oil that was 5%, 10%, 20% etc. volume of air to test our system against. Without this we are unable to validate the accuracy and precision of our system. Other products we benchmarked against appeared to obtain these standards to test against by cycling a known volume of air through an oil system until it became homogenously entrained. We lacked the time and resources to duplicate this, but it is certainly a possibility for future groups. 15. FINAL RECOMMENDED DESIGN 15.1 ADS Design Critique The ADS design is unique and functionary but can be greatly improved and diversified in its applications. For one, the ADS is too large currently to conveniently fit inside a car. The motor also has to apply a lot of force to move the piston, whereas another actuator, perhaps a lead screw, would have been more appropriate. The piston often has trouble starting if left alone for many days, due to static friction. The linear transducer is also a fragile and expensive piece to the system. Other measurement devices that may be able to replace it are sonar or capacitive distance measurement devices. Currently there is both a solenoid valve followed by a directional valve our prototype. If the two could be combined into a three way solenoid valve it would be much better. The system also needs to be able to work in non-optimal conditions, such as if its in a car on an angle, or the car is driving and sloshing the fluid. Also, sampling time should be reduced from a minute to seconds. Reducing the sampling volume can help with this, although it may sacrifice accuracy. We believe the ADS can also be made into a small, hand size tool with applications beyond hydraulics. A handheld ADS has potential in the biomedical field, to monitor oxygen levels in blood. It can also be used by environmental agencies in monitoring the dissolved oxygen levels in ponds and lakes. A recent aeration monitoring system was released that is of great interest to this project. Pulse Air, an automated on-line tester, can measure the % volume of entrained air in a fluid from 0.5 – 50% within 1 or 2% [24]. Whether this could be used by the EPA or not, this is at least a great benchmark to design against, if not use the product altogether. Because this product just came to market last month, after our benchmarking period, we were not able to study it in depth. However, future teams and the EPA should seriously consider this product, its abilities, limitations, and potential. 15.2 Final Recommended ADS Design Part of the engineering design process involves learning from your past failures. From our benchmarking, initial design, prototype, and validation testing, we discovered the many shortcomings and benefits of our ADS design. We have tried to build off of this knowledge to develop our final recommended design, which we recommend be pursued for further investigation. We found out that the concept works, but there were several inherent flaws in our prototype that prevented it from being a complete success. Table 14 shows a detailed list of the components that will build a better ADS than our prototype. If somebody were to use these components and the design shown in Figure 33, it is possible they might build a device that will be more adequate for performing the desired task.

49
Table 14: Bill of Material for Recommended Final Design Quantitity Part Description Source Part Number Cost Contact
1 2-3/8"OD x2"ID - 5' Aluminum Tubing McMaster-Carr 4699T26 $35.10 www,mcmaster.com1 2-3/8" ROUND 6061-T6511 ALUM ASAP Source RD:RDA6061:02375-6061-012 $30.06 www.asapsource.com
1Steel 14-1/2 Deg Pressure Angle Gear Rack 24 Pitch, 1/4" Face Width, 1/4" H O'all, 2' Length McMaster-Carr 6295K12 $20.00 www.mcmaster.com
1Steel Plain Bore 14-1/2 Deg Spur Gear 24 Pitch, 12 Teeth, 0.5" Pitch Diameter, 1/4" Bore McMaster-Carr 6325K31 $9.92 www.mcmaster.com
1 1/16 X 12 X 12" Aluminum plate ASAP Source SP:SPA6061:00063-6061 $6.62 www.asapsource.com1 Optical Fluid Sensor Honeywell LLE102000 $20.00 www.honeywell.com1 Brass Three-way Solenoid Valve McMaster-Carr 49085K14 $225.65 www.mcmaster.com1 DC motors with gear assembly Bosch 1 397 220 375 $100.00 www.bosch.com1 Cable Length Transducer Sensor Micro-epsilon MK30 $200.00 www.me-us.com2 Rubber o-ring 2" OD, 1-5/8" ID, 3/16" Width Stadium Hardware $1.002 #4-40x1" machine screws and nuts Home Depot $1.293 1/4"x2"x20 machine screws and nuts Stadium Hardware $2.004 1/4"x1"x20 machine screws and nuts Stadium Hardware $2.006 1/4" Washer Stadium Hardware $0.50
Figure 33: Dimensioned CAD Drawing of Final Recommended ADS Design

50
16. DISCUSSIONS 16.1 Failure and Safety of Design We performed extensive failure and safety analysis for our final design using DesignSafe 3.0 software. This is to ensure that the ADS minimizes risk to the user population. We used a risk assessment methodology to approach our analysis. In this methodology we first identify the hazards in our system. Then we assess the risk associated with those hazards both qualitatively and quantitatively. Finally we apply risk reduction measures until we reach an acceptable risk level. We used the default risk scoring system in DesignSafe 3.0 to judge the risk level of each hazard, from high to medium to low (with low being an acceptable risk level). This was based on our ratings of the severity of the hazard, the exposure of the user to the hazard, and the probability of failure occurring. We identified the risks for two modes of operation: normal operation and installation/removal. The major hazards and failure modes related to normal operation of the ADS are associated with the motor and rack/pinion, and the electronics. The motor can overheat during use, and if the flammable hydraulic fluid leaks from the cylinder and comes in contact with the hot motor, this could lead to a fire. Also, if the fluid leaks and comes in contact with the electronic circuitry controlling the system, this can be catastrophic. In addition, high voltages applied to the solenoid valve can be dangerous to the user. Many risks endanger the user who installs/removes the ADS. The major hazards and failure modes related to installation/removal include pinch points in the rack and pinion if the system unexpectedly starts up. A hot motor could burn the user’s hands. The user could get shocked by the high voltages throughout the system. There are also environmental and health hazards associated with the hydraulic fluid. The oil is hazardous waste, and improper disposal of the oil could lead to wastewater contamination. Prolonged exposure to the oil can cause skin irritation. When removing the ADS, hydraulic fluid could spill out of the line, creating a big spill and potentially exposing the user to large amounts of fluid. Once identifying these risks, we applied appropriate hazard control to reduce the risks to an acceptable level. We eliminated hazards by design, applied guard systems, provided warning systems, and used training instructions for the user. To protect the user from pinch points and the hot motor, we designed a casing for the bottom section of the system, which encloses the motor and rack/pinion. Not only does this protect the installer/remover, it also separates the hot motor from possible contact with the flammable oil. As a guard system, we can insulate the electronic circuitry with a waterproof cover to protect it from fluid leakage. We can also cover the solenoid valve with insulation to protect the user from shock. In regards to the environmental/health risks associated with the oil, we can place warning signs alerting the user to properly dispose of the oil and to wash his or her hands thoroughly after contact with the oil. We must also provide training instructions to the user to advise the user to clamp the hydraulic line prior to installing/removing the ADS in order to prevent a fluid spill. After applying these risk reduction methods, the DesignSafe software showed that all failure modes are now low risk, which is acceptable. In addition to those listed above, other low risk failure modes included fluid leakage, high fluid pressure, and others. The complete DesignSafe report showing all failure modes, risk reduction methods, and risk levels is found in Appendix I on page 78.

51
17. CONCLUSIONS The University of Michigan Challenge X Team needs a fluid conditioning system for its hydraulic-diesel hybrid Chevy Equinox. The system must filter out debris as small as 3 μm, cool the hydraulic fluid to approximately 120°F to prevent thermal breakdown of the fluid, and ensure that less than 6% of the fluid volume is dissolved nitrogen gas. The system must handle the flow requirements of the connected systems (80 gpm, 200 psi). Our design should be fit within the chassis of the Equinox, weigh less than 60 lb, and cost between $400 and $1000. We purchased a Hydrotechnik KF3 Return Line Filter and a Hydac EDL-4 Air Cooler to filter and cool the fluid. We selected these components through a Product Value Assessment (PVA), concluding that these best met our customer requirements. Their performance was positively verified at the Environmental Protection Agency (EPA). We concluded that to ensure that the level of aeration in the fluid is less than 6%, it is more practical to develop a monitoring system for the fluid than deaerating it, because the extent of the problem of nitrogen permeating through the bladder has not been determined by the EPA or other sources. An aeration detection system (ADS) will be used to measure the % volume of air in the hydraulic fluid. The ADS we designed is a fully-automated piston-cylinder vacuum system. The cylinder takes in a sample of fluid, controlled by a solenoid valve and the piston speed. The valve then closes, sealing the system, while the piston continues moving to apply a pressure drop on the sample. By Henry’s Law, this causes the gas in the fluid to come out of solution due to a vacuum; the gas is then ejected. A cable-extension transducer measures the piston displacement at pre- and post-deaeration, from which we can calculate the amount of nitrogen that was originally dissolved in the fluid. Due to time constraints, we only created a proof-of-concept prototype. We were able to prove our concept by creating a vacuum and observing the fluid deaerate. However, we were unable to quantitatively analyze this. Most of the air in the fluid was dissolved, so its removal had a negligible impact on change in fluid volume. This was because we were unable to create observable standards to test against, such as oil with 10 % volume of air. In the future, observable standards will help evaluate the accuracy and precision of our ADS. 18. RECOMMENDATIONS The ADS system should be made of aluminum and the suggested components to achieve optimal performance. Efforts should be made to minimize any volume between the exit valve and the fluid level sensor at the top of the cylinder. This is because any fluid build up here introduces an unseen error in mearsurement. Seals need to be very tight to ensure a proper vacuum, and to improve the vacuum the piston can be dropped in stages with time. Additionally, standards to test against should be developed to evaluate the precision and accuracy of the ADS. This is the next important step for this project. To improve precision a taller sample column should be taken. However, a long term goal for the ADS is to make it much smaller and compact.The new aeration measurement device on the market, Pulse Air, should also be evaluated in more depth. This new device can be used for both ideas for improvement to our current ADS system, as well as a possible alternative. Finally, application beyond hydraulics should be considered for our ADS. For example, applications in medicine and environmental monitoring should be considered. There are no other products like the ADS on the market, and if a smaller version could be constructed that functioned automatically it could be well marketed across a number of fields.

52
19. ACKNOWLEDGEMENTS We would like to thank: • Steve Dockstader and the entire Challenge X team for providing us with funding and all information
that we requested regarding customer requirements and constraints • Neil Johnson for all of his information and insight in finding a filter and cooler and the extended
hours he spent helping us test these two devices • Andy Moskalik for giving us information and parts from previous ME450 projects and for his insight
on deaerating • Collin Myles at the J.E. Myles Inc. for his help in choosing the correct filter for our application • Mark Firkis at Hydac for his help in understanding the functions of the cooler • Bill Miller at Perferred Technical Resources for his help in understanding how to operate the cable-
extension transducer. • Kent Pruss in the Autolab Machine Shop for installing the pinion onto the hardened alloy shaft • Al Wilson at the Chemistry Instrument Shop for ordering a tap for our optical sensor • Professor Katsuo Kurabayashi for working through with us the equations and concepts for our initial
deaeration attempts • Robert Coury and Marvin Cressey for all of their help and advice in the machine shop • Professor Albert Shih for all of his efforts in leading our section and giving us good feedback and
advice on approaching our project. We would also like to thank him for obtaining sponsorship from the EPA for our team.
• Professor Gillespie for all of his help on choosing a motor, understanding the OOPic, choosing a relay, and troubleshooting our electronics.

53
20. INFORMATION SOURCES We obtained information on the filtration, temperature control, and removal of gas from hydraulic fluid from multiple sources. These sources include the following:
• United States Patent and Trademark Office (www.uspto.gov) • Delphion Intellectual Property Network (www.delphion.com) • Engineering Village (www.engineeringvillage2.org) • University of Michigan Art, Architecture, and Engineering Library • Meetings with Neil Johnson (EPA), Andrew Moskalik (EPA), Steve Dockstader (Challenge X),
Prof. Katsuo Kurabayashi (UofM), Challenge X Team, Prof. Ralph Yang (UofM), and Prof Albert Shih (UofM)
• Limited internet searches • Product catalogs
We found several books from the Art, Architecture, and Engineering Library to be very useful in providing us with background information on hydraulic systems. We were able to obtain information on:
• the effects of high temperature on hydraulic fluid [12] • the effects of cavitation on hydroabrasive erosion [14] • calculating the heat exchanger requirements [12] • filter selection and filter efficiencies [12] • general conditioning of hydraulic fluid [13]
Neil Johnson [4] and Andrew Moskalik [15] of the advanced technology division at the U.S. Environmental Protection Agency and Steve Dockstader [5], the team leader of Challenge X for the University of Michigan, provided us with information regarding hydraulic hybrids. Steve explained the basics of hydraulic hybrids and constraints that we may encounter on the Challenge X Equinox platform. Neil on the other hand, explained the details and implications of placing a fluid conditioning system in a hydraulic system, described some engineering requirements, and showed us examples of a hydraulic hybrid Ford Expedition and UPS delivery vehicle. Andrew explained previous ME450 (Fall 2004 and Winter 2005) projects that he sponsored for fluid deaeration and gas venting. He provided insight on ways that those previous designs could be improved. During our initial investigation into deaerator designs (see Appendix B), we met with Professor Ralph Yang to find our more information regarding semipermeable membranes that are permeable to nitrogen and impervious to oil. We also met with Professor Kurabayashi to discuss methods to model our flow. Our meetings resulted in obtaining the following ideas:
• Use of the rigid body motion equation and Newton’s second law will allow us to determine the length of centripetal deaerator necessary to deaerate a certain percentage of nitrogen.
• Use of Henry’s law will allow us to find the speed at which the cylinder needs to rotate to overcome the surface pressure at the collecting surface
• The bubbles can be modeled as small cubes • With this information one can also determine the maximum pressure on the cylindrical tube
When began developing a deaerator design, we researched previous ME450 projects. We obtained information from a ME450 senior design (Fall 2004) project titled Nitrogen Removal System for Hydraulic Devices [6]. This information details different approaches to deaeration of hydraulic fluid. From our patent searches, we covered two areas: deaerators and aeration detection systems. As for deaerators, we discovered two patents. One patented design [5,383,958] that includes a flow passageway with a device to restrict flow at its inlet to induce a pressure drop and has two discharge ports at its outlet

54
- one for the hydraulic fluid and the other for air. The fluid is drawn through this passageway via vacuum pump. This is the idea that the past ME 450 Team 13 used in their design. Another patent [6,863,712] found utilizes centripetal forces to channel the air and force it out of the system. A third by a company G.E. Totten and Associates also utilizes centripetal forces. These designs are further discussed in Appendix B.2. As for aeration detection systems, we had trouble finding any relevant patents. However, we found a commercial micro aeration measuring device [19] that extracts a small sample a fluid like a syringe, then creates a vacuum, expels the resulting air, and remeasures the volume of liquid. Through calculations it is then possible to determine the % volume of air. However, this device is manually operated. This was one of our major motivating designs for our concept generation, discussed in section 6. Examples of information obtained from the internet include material properties of the hydraulic fluid from the Mobil 1 Synthetic Automatic Transmission Fluid website [7] (hydraulic fluid used by the Challenge X team) and filter and cooling selection information [8, 9]. We were able to find useful information to help us choose a filter and cooling system to meet our customer requirements and packaging constraints on the internet. However, the majority of our filter and cooler selection information came from product catalogs and emails and phone calls to numerous manufacturers.

55
21. REFERENCES [1] Plungis, Jeff. “EPA Turns Innovator with Hydraulic Hybrids.” Detroit News. 12 Jan. 2006 <http://www.detnews.com/apps/pbcs.dll/article?AID=/20051218/AUTO01/512180348/1148>. [2] “Hydraulic Filters” Toro. 23 Jan. 2006 <http://www.toro.com/golf/services/parts_filters.html> [3] Sullivan, James A., 1998, Fluid Power: Theory and Applications, 4th Edition. Prentice Hall, Inc. New Jersey. [4] EPA, Neil Johnson, [email protected], Phone: 734-214-4797 [5] Challenge X, Steve Dockstader, [email protected], Phone: 734-276-3457 [6] McKnight, Spalding, Szykula , and Zelasko. Final Report: Team #13: Nitrogen Removal System for Hydraulic Devices. ME 450, Fall 2004, Ann Arbor, MI. [7] “Mobil 1 Synthetic ATF.” Mobil. 20 Jan. 2006 < http://www.mobil.com/USA-English/Lubes/PDS/GLXXENPVLMOMobil_1_Synthetic_ATF.asp >. [8] “About Heat Exchangers.” GlobalSpec. 17 Jan. 2006 <http://heat-exchangers.globalspec.com/LearnMore/Processing_Equipment/Heat_Transfer_Equipment/Heat_Exchangers>. [9] “Filter Type and Construction.” GlobalSpec. 17 Jan. 2006 < http://fluid-power.globalspec.com/Specifications/Fluid_Power_Components/Hydraulic_Equipment_Components/Hydraulic_Filters>. [10] “Bubble Eliminator Based on Centrifugal Flow.” Patent Counsel, Refer to MSC-22996. Lyndon B. Johnson Space Center, Houston, Texas. Phone: (281) 483-0837, http://www.nasatech.com/Briefs/Aug04/MSC22996.html [11] Y. Tanaka and R. Suzuki. Operation and Typical Application Overview of the Use of Bubble Eliminators for De-aeration of Hydraulic and Turbine Oils. 2003, G. E. Totten & Associates, Inc., Seattle, WA USA http://www.getottenassociates.com/products/bubless.shtml [12] Pease, Dudley A. and Pippenger, John J., 1987, Basic Fluid Power, 2nd Edition. Prentice Hall, Inc. New Jersey. [13] Radhakrishnan, M., 2003, Hydraulic Fluids, A Guide to Selection, Test Methods, and Use. ASME Press. New York. [14] Duan, C.G. and Karelin, V.Y., 2002, Abrasive Erosion & Corrosion of Hydraulic Machinery. Imperial College Press. London. [15] EPA, Andrew Moskalik, [email protected], Phone: 734-214-4719. [16] “Cavitation.” McNally Institute. 10 Feb. 2006 <http://www.mcnallyinstitute.com/01-html/1-3.html>. [17] “Hydraulic Filters”. GlobalSpec. 1 Feb. 2006 < http://fluid-power.globalspec.com/SpecSearch/Suppliers/Fluid_Power_Components/Hydraulic_Equipment_Components/Hydraulic_Filters?SrchItem=1> [18] “High hydraulic fluid temperature - how it causes premature failures.” Hydraulic Supermarket. 1 Feb. 2006. <http://www.insidersecretstohydraulics.com/hydraulic-fluid-2.html>. [19] “Aeration Measuring Device”. FES, Inc. 10 Feb 2006. <http://www.bardyne.com/FES/aeration.htm> [20] “About Cable Extension Linear Postion Sensors.” GlobalSpec. 15 March 2006. http://sensors-transducers.globalspec.com/LearnMore/Sensors_Transducers_Detectors/Displacement_Sensing/Cable_Extension_Linear_Position_Sensors [21] “Wire Sensor Catalog 2006.” Micro-Epsilon. 15 March 2006. http://www.me-us.com/draw-wire [22] Riley, W. F., Leroy, D.S., Morris, D. H. Mechanics of Materials, Fifth Edition. 1999. John Wiley & Sons, Inc., New York, NY. pp. 1, 241. [23] “Nitrile Rubber Sheeting Datasheet.” Novus Sealing PTY, Ltd. 16 March 2006. http://www.novussealing.com.au/data.htm [24] http://www.practicingoilanalysis.com/article_detail.asp?articleid=855&relatedbookgroup=OilAnalysis

56
APPENDIX A.1 QFD for Hydraulic Hybrid Fluid Conditioning System
Customer Requirements Cha
lleng
e X
Min
. siz
e of
filte
red
parti
cles
(-)
Max
tem
p Sy
stem
Rea
ches
(-)
Flow
Rat
e Th
roug
h Sy
stem
(-)
Syst
em S
ize
(-)
Num
ber o
f Com
pone
nts
(-)
Wei
ght o
f Sys
tem
(-)
Pres
sure
Dro
p th
roug
h Sy
stem
(-)
Pow
er C
onsu
mpt
ion
(-)
Tota
l Cos
t for
Com
pone
nts
(-)
Filter out debris 8 9 1 9 9 3
Control Temperature 9 1 9 9 3 1 9 9 3
Handle Flow Rate 8 9 3 9 3 3 9 1 3
Handle Pressure 8 3 3 9 1 3 9 1 3
Minimize Size 4 1 3 3 9 9 3 1 1
Minimize Weight 4 1 3 3 3 3 9 3 1 3
Minimize Cost 5 3 3 3 3 9 3 3 3 9
3-5 150 80 2x2x1.5 3 30 20 500μ °F % . # lb. psi HP $200 176 336 122 150 51 336 120 160
0.121 0.107 0.204 0.074 0.091 0.031 0.204 0.073 0.0972 3 1 6 5 7 1 6 4
Measurement UnitTarget Value
Total
NormalizedImportance Rating
1
3
3
3
3 13
19
9
3
93
1
9
9

57
APPENDIX A.2 QFD for Aeration Detection System
Customer Requirements Cha
lleng
e X
% N
itrog
en D
etec
ted
in O
il (-
)
Syst
em S
ize
(-)
Num
ber o
f Com
pone
nts
(-)
Wei
ght o
f Sys
tem
(-)
Pres
sure
Cap
abilit
y (-
)
Pow
er C
onsu
mpt
ion
(-)
Tota
l Cos
t for
Com
pone
nts
(-)
Offl
ine
Air M
easu
ring
Syst
em
for H
ydra
ulic
Dev
ices
Monitors Air in Oil 9 9 1 3 9 1 4
Handles Required Flow 7 3 1 1 1 1 5
Handles Required Pressure 7 3 1 1 9 5
Small Size 2 1 9 9 3 1 1
Compact 3 1 3 9 1 1
Light Weight 4 1 1 3 9 1 1 4
Low Cost 5 1 1 9 3 1 9 -
100 - 1 10 200 0.1 100% in3 # lb. psi HP $
137 50 125 51 112 81 700.22 0.08 0.2 0.081 0.179 0.129 0.112
1 6 2 6 3 4 5
100% 1260 8 10 2200 0 -Offline Air Measuring System
for Hydraulic Devices
Importance Rating
Target ValueMeasurement Unit
TotalNormalized
13
13
3
93
1
1 9
9
9

58
APPENDIX B.1 Hydraulic System Engineering Analysis with Inclusion of Deaerator A general problem we need to address is the placement of our fluid conditioning system relative to the other hydraulic components. Preferably, the components should be along a flow where it is:
• Low pressure • Uni-directional • The hottest location in the hydraulic system • Unaffected by a pressure drop upstream • Unaffected to cavitations forming upstream
The outlet from the low pressure reservoir to the front pump motor is the ideal location so far for this system because of the low pressure flow in addition to the one directional flow of fluid. Although it is possible to split up the components, it would be best to keep them together since all three of these devices (monitoring system, filter, and cooler) all have the similar issues regarding pressure and flow requirements, pressure drops, and potential to introduce cavitations. For our fluid conditioning system, we determined that there are thirteen logical orders to place the filter, cooler, and fluid monitoring system relative to each other. Table C1 shows the order which we can place the three devices in series, and Table C2 shows all combinations of two devices in parallel with the third device in series. The thirteenth combination, not shown in the tables below, is having all three devices in parallel. Table C1: All Possible Serial Combinations
Inlet Middle Outlet 1 Filter Cooler Deaerator 2 Filter Deaerator Cooler 3 Cooler Filter Deaerator 4 Cooler Deaerator Filter 5 Deaerator Filter Cooler 6 Deaerator Cooler Filter
Inlet Outlet 7 Filter Cooler Deaerator 8 Cooler Filter Deaerator 9 Deaerator Cooler Filter 10 Cooler Deaerator Filter 11 Filter Deaerator Cooler 12 Cooler Filter Deaerator
There are several matters to take into consideration when choosing the best order to place these three components. This includes the interaction between each of them and the requirements for the inlet and outlet of each component (pressure, temperature, cleanliness, etc.).
Table C2: All Possible Parallel/Serial Combinations

59
APPENDIX B.2 Current Deaeration Technology We found several designs for deaeration units for hydraulic flows, ranging from former 450 projects to NASA.
Deaerator Descriptions
Team #13, Fall 2005 ME 450 Project [6]
This device utilizes basic fluid dynamics principles. The hydraulic fluid is subject to a pressure drop, causing the nitrogen to separate from the oil. Then a change in the line allows the air to catch in an area, where it is released by a valve. The deaerated oil is then pumped back into the system to recover the lost pressure drop.
NASA Fluid Bubble Eliminator [10]
Oil is spun into a unit with a permeable membrane at its core. As the oil spins forward, the air is pushed to the center and through the membrane, where it then exits into the surrounding environment. The oil enters a normal flow at the end of spinning.
G.E. Totten’s Bubble Eliminator [11]
Similar to NASA’s design, oil enters the tapered cylinder tangentially creating a centrifugal motion. Air bubbles form in the center of the tube and are pushed back by the fluid pressure and released through a vent vale in the rear.

60
APPENDIX B.3 Deaerator Design Concepts Our designs can be separated into two categories: those using a semi-permeable layer and those not. A semi-permeable layer would allow nitrogen in the oil to escape to atmosphere in the same way the bladders allow nitrogen to enter the oil in the first place. The benefits of using a semi-permeable layer include overall enhanced simplicity, because the need for valves is removed, and oil loss prevention, because only air can escape the layer. Simple Modified Bubble Eliminator Design In this design the concept of G.E. Totten’s Bubble Eliminator is remodeled with a semi-permeable layer instead of the vent valve they currently use. The design functions in the same way as described in section Appendix C.2.
Advantages: Overall a simple design, and allows entrained bubbles to be collected and removed without losing oil. Disadvantages: This design faces the same challenges as GE Totten’s design Modified Bubble Eliminator Design with Helix Groove This is similar to our Design 1, but with a grooved core to guide the swirling flow. The semi-permeable layer would be made to follow the contour of the outer radius to maintain a somewhat constant radius.
Advantages: A more focused circular flow should create larger centripetal forces, thus pushing more air out of the system. Disadvantages: This would be very complex to manufacture and design, and requires more parts than other designs. Hourglass Design In this design the flow is brought in tangentially to create a circular flow, creating a column of air in the center to be pushed out the back through a semi-permeable layer. As it moves forward the radius

61
expands, creating a pressure drop and taking dissolved air out of flow and pushing it out a second semi-permeable layer.
Advantages: Simply constructed, works by the same principle as the Bubble Eliminator. Disadvantages: Hard to prove would work as predicted without building a prototype. Membrane Accumulator This is similar to team 13’s design, but with a semi-permeable membrane used instead of a throttle valve to separate the gas and oil. Also, the needle valve is placed at the entrance of the accumulator.
Advantages: We know this design generally works from past teams’ projects. Disadvantages: Would require an extra pump to repressurize the flow. Also it may not be able to remove the amount of nitrogen necessary. Helix Deaerator This design works off the same principle as NASA’s deaerator by spinning a flow, forcing nitrogen to the middle of the apparatus where it exits through a semi-permeable tube. The differences in this design are the flow enters and exits in line and a vaccum is created through a fan inside the semi-permeable tube.

62
Advantages: This design works according to NASA and additionally has little pressure drop. Disadvantages: This is complex and may not remove dissolved nitrogen. Coiled Tube Here a section of the tubing is made of a semi-permeable material reinforced with a metal mesh and coiled. The coiling of the tube will create a centripetal force to push nitrogen to the middle of the center of the coil and help force it out.
Advantages: There is little pressure drop, the deaerator can be run in line with the rest of the system, and it is simple. Disadvantages: This may not be able to remove air quickly or a lot of it. Semi-permeable Accumulator In this design an accumulator made of semi-permeable material will allow nitrogen out in the same way it came in. The some of the fluid bladder Additionally, the top of this accumulator will be the high point of the hydraulic system to help accumulate nitrogen,

63
Advantages: Very simple design that uses the same principle used for the nitrogen to initially enter the system. Disadvantages: Height requirement, loss of pressure in the hydraulic system, vulnerable to damage. ME450 Fall 2004 Team 13 Design Enhancement This design is based off the previous two ME 450 teams’ designs. The changes include a shorter and wider throttle valve, to accommodate the height restraints associated with a truck chassis. Also, the needle valve is placed at the entry of the accumulator.
Advantages: We know this design generally works from past teams’ projects, and is easy to improve upon. Disadvantages: Would require an extra pump to repressurize the flow. Also it may not be able to remove the amount of nitrogen necessary, and some oil may escape.

APPENDIX C Components Comparisons and Selections APPENDIX C.1 Characteristics of Considered Filters
Company Donaldson Donaldson Donaldson Donaldson Hydrotechnik Norman Parker Parker Parker Parker Western WesternModel HDK06 HDK06 HMK05 HMK05 KF3 30 MF IL8 IL8 CN-40 CN-40 WO61 WO61
Type Low Pressure Low Pressure Spin-On Spin-On Return Line Medium
PressureMedium Pressure
Medium Pressure
Medium Pressure
Medium Pressure
Low Pressure Low Pressure
Maximum Flow Capability (gpm) 100 100 50 50 100 80 150 150 150 150 100 100
MAOP (psi) 350 350 350 350 300 800 500 500 1000 1000 600 600
Bypass Pressures (psi) 25 25 25 25 30 25 25 25 25 25 25 25
Port Size (in) 2.5 3.5 1.25 1.25 1.5 1.5 1.5 1.5 1.5 1.5 1 1
Particle Size (micrometer) 3 9 6 9 3 5 2 5 2 5 3 5
Max Pressure Drop (pisd) 11 2.5 10.5 7 7 25 9 6 30 20 20 16Weight (lbs) 26 26 7.5 7.5 10.5 5.5 40 40 4.5 4.5 7.9 7.9Length (in) 25 25 14.51 14.51 13.12 9.24 17.11 17.11 8.01 8.01 9 9
Head Diameter (in) 6.75 6.75 5 5 6.25 4.63 6.25 6.25 4.8 4.8 4.85 4.85 One could find information on these companies at the following websites:
• Donaldson Co. (MANF): http://www.donaldson.com/en/engine/hydraulics/index.html • Hydrotechnik: http://www.hydrotechnik.co.uk/index.htm • Norman Filters: http://www.normanfilters.com/ • Parker-Heffin: http://www.parker.com/ead/cm1.asp?cmid=475 • Western Filter: http://www.westernfilter.com/ind-products.html

65
APPENDIX C.2 Values Assigned to Ranges of Filter Characteristics
Micrometers 2 3 4 5 6 7 8 9Normalized Particle Size 8 7 6 5 4 3 2 1
Pounds per Square Inch 0-5 6-10 11-15 16-20 21-25 26-30 31-35 36+Normalize Pressure Drop 8 7 5 4 3 2 1 1
Pounds 0-5 6-10 11-15 16-20 21-25 26-30 31-35 36+Normalized Weight 8 7 6 5 4 3 2 1
Inches 7-9 10-12 13-15 16-18 19-21 22-24 25+Normalized Length 7 6 5 4 3 2 1
Inches 4-5 5-6 6-7Normalized Head Diameter 9 6 3
Head Diameter
Particle Size
Max Pressure Drop
Weight
Length

66
APPENDIX C.3 Filter PVA and Results
Company Donaldson Donaldson Donaldson Donaldson Hydrotechnik Norman Parker Parker Parker Parker Western WesternModel HDK06 HDK06 HMK05 HMK05 KF3 30 MF IL8 IL8 CN-40 CN-40 WO61 WO61
Type Low Pressure
Low Pressure Spin-On Spin-On Return Line Medium
PressureMedium Pressure
Medium Pressure
Medium Pressure
Medium Pressure
Low Pressure Low Pressure
Normalized Particle Size 7 1 4 1 7 5 8 5 8 5 7 5
Normalized Pressure Drop 7 8 7.5 7 7 3 7 5 2.5 4 4 4
Normalized Weight 3 3 7 7 6.5 7.5 1 1 8 8 7 7Normalized Length 1 1 5 5 5 6.5 4 4 7 7 7 7
Normalized Head Diameter 3 3 6 6 3 9 3 3 9 9 9 9
Weight Factor0.9 0.225 Particle Size 1.575 0.225 0.900 0.225 1.575 1.125 1.800 1.125 1.800 1.125 1.575 1.1250.9 0.12 Max Pressure Drop 0.840 0.960 0.900 0.840 0.840 0.360 0.840 0.600 0.300 0.480 0.480 0.4800.4 0.0571 Weight 0.171 0.171 0.400 0.400 0.371 0.429 0.057 0.057 0.457 0.457 0.400 0.4000.1 0.02 Length 0.020 0.020 0.100 0.100 0.100 0.130 0.080 0.080 0.140 0.140 0.140 0.1400.1 0.0167 Head Diameter 0.050 0.050 0.100 0.100 0.050 0.150 0.050 0.050 0.150 0.150 0.150 0.150
MAX PVAPVA 2.656 1.426 2.400 1.665 2.936 2.194 2.827 1.912 2.847 2.352 2.745 2.295 2.936
Product Value Assessment
APPENDIX C.4 Characteristics of Considered Coolers
Company Hydac Thermal Transfer Products ASA Hydraulik Oiltech
Model ELD-4 DH-337 ASA 0115 DC LDC
Type DC 12V/24V DC 12V/24V DC 12V/24V DC 12V/24V
Maximum Flow Capability (gpm) 60 70 50
MAOP (psi) 230 300 370 300
Heat dissipation @ 60 GPM (BTU/hr) 55990 45000 43200 13300
Pressure Drop @ 45 GPM (psi) 15 20 16 22
Weight (lbs) 35 20 27 33
Length (in) 19.69 30 16.93 18.34Width (in) 16.57 24 14.17 18Depth (in) 7.37 1.5 6.98 8.62

67
APPENDIX C.5 Values Assigned to Ranger of Cooler Characteristics
BTU / hour 43000-44500 44500-46000 46000-47500 47500-49000 49000-50500 50500-52000 52000-53500 53500+
Normalized Heat Dissipation 1 2 3 4 5 6 7 8
Pounds per Square Inch 15 16 17 18 19 20 21 22Normalize Pressure Drop 8 7 6 5 4 3 2 1
Pounds 0-5 6-10 11-15 16-20 21-25 26-30 31-35 36+Normalized Weight 8 7 6 5 4 3 2 1
Inches 14-17 17-20 20-23 23-26 26-29 29-32 32-35 35+Normalized Length 8 7 6 5 4 3 2 1
Inches 14-17 17-20 20-23 23-26 26-29 29-32 32-35 35+Normalized Length 8 7 6 5 4 3 2 1
Inches 1-2 2-3 3-4 4-5 5-6 6-7 7-8 8-9Normallized Depth 8 7 6 5 4 3 2 1
Heat Dissipation
Max Pressure Drop
Weight
Depth
Width
Length

68
APPENDIX C.6 Cooler PVA and Results
Company HydacThermal Transfer Products
ASA Hydraulik Oiltech
Model ELD-4 DH-337 ASA 0115 DC LDC
Type DC 12V/24V DC 12V/24V DC 12V/24V DC 12V/24V
Normalized Heat Dissipation 8 2 1 1Normalized Pressure Drop 8 3 7 1
Normalized Weight 2 5 3 2Normalized Length 7 3 8 7Normalized Width 8 5 8 7Normalized Depth 2 8 3 1
Weight Factor0.9 0.45 Heat Dissipation 3.600 0.900 0.450 0.450
0.5 0.1667 Pressure Drop 1.333 0.500 1.167 0.167
0.5 0.1 Weight 0.200 0.500 0.300 0.2000.3 0.1 Length 0.700 0.300 0.800 0.7000.3 0.06 Width 0.480 0.300 0.480 0.420
0.3 0.0375 Depth 0.075 0.300 0.113 0.038MAX PVA
a = 0 6.388 2.800 3.309 1.974 6.388
Product Value Assessment

APPENDIX D Programming Script for OOPic Automated Electronic Control ' Declarations Dim Volts As New oA2D 'Transducer voltage Dim Motor As New oPWM 'DC Motor control Dim Aerated As New oByte 'Variable for initial voltage before applying vacuum Dim Deaerated As New oByte 'Variable for final voltage after air pushed out Dim V1 As New oByte 'Variable for finding piston speed Dim V2 As New oByte 'Variable for finding piston speed Dim Sensor As New oDIO1 'Optical sensor Dim Valve As New oDIO1 'Solenoid valve Dim Initial As New oByte 'Variable for top piston position Dim Screen As New oSerial 'Output to monitor ' Main Program Sub Main () ' Activate DC Motor, Transducer, and Solenoid Valve Motor.IOLine = 17 'DC Motor on pin 17 Motor.Operate = 1 'DC Motor power on Volts.IOLine = 1 'Transducer on pin 1 Volts.Operate = 1 'Transducer active Valve.IOLine = 8 'Solenoid Valve on pin 8 Valve.Direction = cvOutput Initial = Volts 'Store top piston position Screen.Baud = cv9600 Screen.Operate = cvTrue ' Step 1: Take inital draw of fluid/air into cylinder Do While Volts > 105 Motor = 255 'Motor runs when transducer is extended Valve = 1 'Valve is open when transducer is extended Loop Motor = 125 'Motor turns off when voltage < 125 Valve = 0 'Valve closes when voltage < 125 Aerated = Volts.Value 'Initial voltage before applying vacuum OOPic.Delay = 300 'Wait 3 seconds before applying vacuum 'Display initial height of aerated fluid onto monitor Screen.String = "Initial Volume: " + Str$(Aerated) Screen.Value = 13 Screen.Value = 10 ' Step 2: Apply vacuum to fluid and stop when motor can't move Do 'Run motor until volts differential over .1 seconds < 10 V1 = Volts.Value Motor = 255 OOPic.Delay = 10

70
V2 = Volts.Value Loop While V1 - V2 > 10 Motor = 125 'Motor turns off and holds for 1 minute OOPic.Delay = 6000 ' Step 3: Push out excess air Sensor.IOLine = 12 'Optical sensor on pin 12 Sensor.Direction = 1 'Optical sensor is an input Valve = 1 'Open valve Do 'Run motor in reverse until optical sensor triggered Motor = 1 Loop Until Sensor.Value = 0 Motor = 125 'Motor turns off Valve = 0 'Valve closes Deaerated = Volts.Value 'Final voltage after pushing out air OOPic.Delay = 300 Valve = 1 'Valve opens after delay 'Display final height of deaerated fluid onto monitor Screen.String = "Final Volume: " + Str$(Deaerated) Screen.Value = 13 Screen.Value = 10 Do 'Return piston to original top position Motor = 1 Loop Until Volts = Initial Motor = 125 End Sub

71
APPENDIX E Functional Decomposition Diagram
Motor
Piston
Energy
Energy
Hydraulic System
Hydraulic Fluid and N2 Gas
Cylinder
Pressure Drop
Hydraulic Fluid and N2 Gas
Solenoid and Directional
Valve Energy
Atmosphere
Hydraulic Fluid
N2 Gas

72
APPENDIX F Schematic of physical interfacing of electronic components
Wire Sensor
5V
GN
D
-15V
+15V
Power Supply
J2
4 5 -Ref
+ Ref
J1
GN
D
-Motor
+HV
+ Motor
1 2 4 5
Amplifier 5V
Motor
1 2 3
Green
Black
Red
GN
D
NL
Solenoid Valve
GN
D G
reen
N B
lack
L Red
Plug (into wall)
Relay
+ -Load
Fluid Level Sensor
Green
Red
Blue
Power
- +
Optional I/O Power
+ MP
GN
DDuel DC Motor I/O
17
I/O
PWR
PIN
GN
D
12
8
1OOPIC
Voltage Divider

73
APPENDIX G Bill of Materials Quantitity Part Description Source Part Number Cost Contact
1 2-1/2"OD x2"ID - 6' Clear Acrylic Extruded Tubing United States Plastic Corp 44554 $43.32 www.usplastic.com1 0.236" x 12" x 12" Acrylic Sheet United States Plastic Corp 44350 $4.64 www.usplastic.com
1Steel 14-1/2 Deg Pressure Angle Gear Rack 24 Pitch, 1/4" Face Width, 1/4" H O'all, 2' Length McMaster-Carr 6295K12 $20.00 www.mcmaster.com
1Steel Plain Bore 14-1/2 Deg Spur Gear 24 Pitch, 12 Teeth, 0.5" Pitch Diameter, 1/4" Bore McMaster-Carr 6325K31 $9.92 www.mcmaster.com
1 1/16" Aluminum plate University of Michigan $0.001 Optical Fluid Sensor EPA Honeywell: LLE102000 $0.001 3-way Ball Valve EPA McMaster: 46095K41 $0.001 Brass Mini Solenoid Valve EPA McMaster: 7994K55 $0.001 Automotive Window motor Auto Salvage Yard Siemens: F87B7827145AA $0.001 Cable Length Transducer Sensor Micro-epsilon MK30 $200.00 www.me-us.com2 Rubber o-ring 2" OD, 1-5/8" ID, 3/16" Width Stadium Hardware $1.002 #4-40x1" machine screws and nuts Home Depot $1.293 1/4"x2"x20 machine screws and nuts University of Michigan $0.004 1/4"x1"x20 machine screws and nuts University of Michigan $0.006 1/4" Washer University of Michigan $0.00
Quantitity Part Description Source Part Number Cost Contact
1 Electronic Relay Digikey Z903-ND $7.38 www.digikey.com1 OOPic University of Michigan $0.00 www.oopic.com1 Power Supply University of Michigan $0.001 Amplifier University of Michigan $0.00

74
APPENDIX H.1 Gantt Chart – January

75
APPENDIX H.2 Gantt Chart – February

76
APPENDIX H.3 Gantt Chart – March

77
APPENDIX H.4 Gantt Chart – April

78
APPENDIX I.1 DesignSafe 3.0 Report

79
APPENDIX I.2 Design Safe 3.0 Report