HUMIDITY CONTROL IN DIFFERENT BUILDING...
47
HUMIDITY CONTROL IN DIFFERENT BUILDING APPLICATIONS; RESTAURANT AND OPERATION THEATRE MOHD SYAFIQ SYAZWAN BIN MUSTAFA A thesis submitted in fulfilment of the requirement for the award of the Degree of Master of Mechanical Engineering TITLE Faculty of Mechanical and Manufacturing Engineering Universiti Tun Hussein Onn Malaysia APRIL 2017
Transcript of HUMIDITY CONTROL IN DIFFERENT BUILDING...

HUMIDITY CONTROL IN DIFFERENT BUILDING APPLICATIONS;
RESTAURANT AND OPERATION THEATRE
MOHD SYAFIQ SYAZWAN BIN MUSTAFA
A thesis submitted in
fulfilment of the requirement for the award of the
Degree of Master of Mechanical Engineering
TITLE
Faculty of Mechanical and Manufacturing Engineering
Universiti Tun Hussein Onn Malaysia
APRIL 2017

For my beloved mother and father

iv
ACKNOWLEDGEMENT
Alhamdulillah, I would like to thank the rest of my family for their insightful
comments, encouragement and support.
I would like to express my sincere gratitude to my supervisor Prof Emeritus Ir
Muhammad Zainal Bin Md Yusof for the continuous support of my master research
study, for his patience, motivation, and immense knowledge. His guidance helped me
in all the time of research and writing of this thesis.
Besides my supervisor, my sincere thanks also goes to co-supervisor Mr.
Chang Choo Khean and Mr. Mohd Azizi Bin Mohd Afandi, who provided me an
opportunity to join their team, and who gave access to the laboratory and research
facilities. Without their precious support it would not be possible to conduct this
research.
I thank my fellow lab mates and colleagues for the stimulating discussions,
for the sleepless nights we were working together before deadlines, and for all the
fun and effort.
v
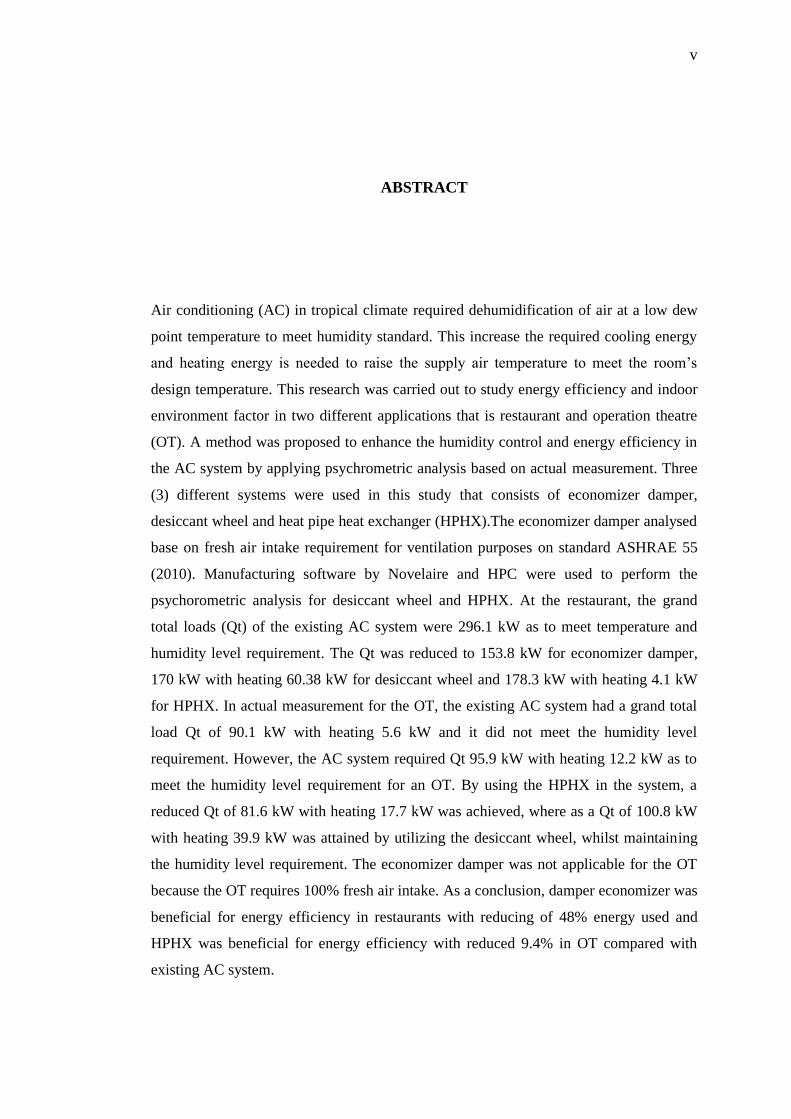
ABSTRACT
Air conditioning (AC) in tropical climate required dehumidification of air at a low dew
point temperature to meet humidity standard. This increase the required cooling energy
and heating energy is needed to raise the supply air temperature to meet the room’s
design temperature. This research was carried out to study energy efficiency and indoor
environment factor in two different applications that is restaurant and operation theatre
(OT). A method was proposed to enhance the humidity control and energy efficiency in
the AC system by applying psychrometric analysis based on actual measurement. Three
(3) different systems were used in this study that consists of economizer damper,
desiccant wheel and heat pipe heat exchanger (HPHX).The economizer damper analysed
base on fresh air intake requirement for ventilation purposes on standard ASHRAE 55
(2010). Manufacturing software by Novelaire and HPC were used to perform the
psychorometric analysis for desiccant wheel and HPHX. At the restaurant, the grand
total loads (Qt) of the existing AC system were 296.1 kW as to meet temperature and
humidity level requirement. The Qt was reduced to 153.8 kW for economizer damper,
170 kW with heating 60.38 kW for desiccant wheel and 178.3 kW with heating 4.1 kW
for HPHX. In actual measurement for the OT, the existing AC system had a grand total
load Qt of 90.1 kW with heating 5.6 kW and it did not meet the humidity level
requirement. However, the AC system required Qt 95.9 kW with heating 12.2 kW as to
meet the humidity level requirement for an OT. By using the HPHX in the system, a
reduced Qt of 81.6 kW with heating 17.7 kW was achieved, where as a Qt of 100.8 kW
with heating 39.9 kW was attained by utilizing the desiccant wheel, whilst maintaining
the humidity level requirement. The economizer damper was not applicable for the OT
because the OT requires 100% fresh air intake. As a conclusion, damper economizer was
beneficial for energy efficiency in restaurants with reducing of 48% energy used and
HPHX was beneficial for energy efficiency with reduced 9.4% in OT compared with
existing AC system.

vi
ABSTRAK
Sistem penyaman udara (AC) di dalam iklim tropika memerlukan udara dikeringkan di
suhu titik embun yang rendah. Ia meningkatkan tenaga sejuk dan pemanasan diperlukan
untuk meningkatkan semula suhu udara. Kajian ini dilakukan untuk mengkaji aspek
kecekapan tenaga dan faktor persekitaran dalaman pada aplikasi yang berbeza.
Penyelidikan ini mencadangkan untuk meningkatkan kawalan kelembapan dan
kecekapan tenaga sistem AC dengan penggunaan analisis psychrometric berdasarkan
pengukuran yang sebenar. Tiga (3) sistem yang berbeza digunakan dalam kajian ini iaitu
penjimat peredam, roda pengering dan penukar haba jenis paip (HPHX), kajian ini
dijalankan ke atas dua (2) aplikasi yang berbeza di restoran dan dewan bedah (OT).
Penjimat peredam menganalisis keperluan pengambilan udara segar untuk orang
berdasarkan standard ASHRAE 55 (2010). Perisian perkilangan dari Novelaire dan HPC
digunakan untuk psychrometic analisis bagi roda pengering dan HPHX. Di restoran,
jumlah beban besar (Qt) sistem AC yang sedia ada adalah 296.1 kW bagi memenuhi
keperluan suhu dan kelembapan. Qt telah dikurangkan kepada 153.8 kW bagi penjimat
perendam, 170 kW dengan pemanasan 60.38 kW bagi roda pengering dan 178.3 kW
dengan pemanasan 4.1 kW bagi HPHX. Sementara itu, sistem AC yang sedia ada pada
OT mempunyai jumlah beban besar Qt 90.1 kW dengan pemanasan 5.6 kW tetapi tidak
memenuhi keperluan tahap kelembapan. Sistem AC memerlukan Qt 95.9 kW dengan
pemanasan 12.2 kW untuk memenuhi keperluan tahap suhu dan kelembapan. Dengan
menggunakan HPHX, Qt dikurangkan kepada 81.6 kW dengan pemanasan 17.7 kW, dan
Qt roda pengering adalah 100.8 kW dengan pemanasan 39.9 kW. Peredam penjimat
tidak boleh diaplikasikan bagi OT kerana OT memerlukan 100% pengambilan udara
segar. Kesimpulannya, peredam penjimat memberi manfaat untuk kecekapan tenaga di
restoran dengan pengurangan sebanyak 48% dari tenaga yang digunakan dan HPHX
memberi manfaat untuk kecekapan tenaga dengan pengurangan sebanyak 9.4% pada OT
berbanding dengan sistem AC yang sedia ada.

vii
TABLE OF CONTENT
TITLE i
DECLARATION ii
ACKNOWLEGEMENT iv
ABSTRACT v
ABSTRAK vi
TABLE OF CONTENTS vii
LIST OF TABLES x
LIST OF FIGURES xi
LIST OF SYMBOLS xvi
LIST OF ABBREVIATIONS xvii
LIST OF APPENDICES xix
1.0 INTRODUCTION 1
1.1 Background of Study 1
1.2 Problem Statement 2
1.3 Objective of Study 3
1.4 Scope of Study 3
1.5 Limitation of Study 5
1.6 Significance of Study 5
2.0 LITERATURE REVIEW 6
2.1 Air-conditioning System 6
2.2 Psychrometric Chart Overview 7
2.2.1 Cooling and Dehumidification Process using
Psychrometric Chart
9
2.2.2 High Latent Loads Process in Psychrometric
Chart
12

viii
2.3 Humidity Control 13
2.3.1 Humidity Control System 14
2.4 Humidity to Indoor Air Quality (IAQ) 17
2.4.1 Health Care Buildings and Hospital 19
2.5 Desiccant Dehumidifier Technology 21
2.5.1 Energy Saving using Desiccant
Dehumidification
23
2.6 Heat Pipe Heat Exchanger (HPHX) Technology for
Dehumidification
24
2.6.1 Energy Saving using Heat Pipe Heat
Exchanger (HPHX) Dehumidifier
25
2.7 Summary of Method 26
3.0 METHODOLOGY 28
3.1 Research Framework 28
3.2 Information Gathering 30
3.3 Walkthrough Inspection 30
3.4 Indoor Air Quality (IAQ) monitoring 30
3.4.1 Sampling Duration 32
3.5 Measurement Tools 32
3.5.1 IAQ Meter 32
3.5.2 Air Velocity Meter 33
3.5.3 Thermocouple Data Logger 34
3.6 AC System Performance Monitoring 35
3.6.1 Airflow Measurement 37
3.7 Data Collection 38
3.8 Data Analysis Strategy 39
3.8.1 Humidity Control Propose 39
4.0 RESULT AND DISCUSSION 45
4.1 Building and System Descriptions Case Study of
Restaurant
45
4.2 Walkthrough Inspection at Restaurant 46
4.3 Indoor Air Quality (IAQ) Monitoring in Restaurant 47
4.3.1 Temperature Monitoring in Restaurant 47

ix
4.3.2 Relative Humidity (%) Monitoring in
Restaurant
48
4.3.3 Carbon Dioxide (CO₂) Monitoring in
Restaurant
49
4.3.4 Carbon Monoxide (CO) Monitoring in
Restaurant
50
4.4 AC System Performance Monitoring for Restaurant 51
4.5 Propose One AHU System for Dehumidification
using Economizer Damper for Restaurant
58
4.6 Propose of using Desiccant Dehumidification Wheel
for Restaurant
62
4.7 Propose using Heat Pipe Heat Exchanger (HPHX) for
Restaurant
66
4.8 Comparison of Total Loads between the Proposed
AC Systems
70
4.9 Building and System Descriptions of Case Study for
Operation Theatre (OT)
71
4.10 Walkthrough Inspection at OT 72
4.11 Indoor Air Quality (IAQ) Monitoring for OT 73
4.11.1 Temperature Monitoring in OT 73
4.11.2 Relative Humidity (%) Monitoring in OT 74
4.11.3 Carbon Dioxide (CO₂) Monitoring in OT 74
4.11.4 Carbon Monoxide (CO) Monitoring in OT 75
4.12 AC System Performance Monitoring for OT 76
4.13 Propose to Meet Desired Humidity and Temperature
for OT
83
4.14 Propose with Desiccant Wheel for OT 87
4.15 Propose with Heat Pipe Heat Exchanger (HPHX) for
OT
92
4.16 Comparison Total Load between Proposed AC
systems for OT
96
5.0 CONCLUSSION 98
5.1 Conclusion 98

x
5.2 Recommendation 99
REFERENCES 100
APPENDICESS 105

xi
LIST OF TABLES
TABLE TITLE PAGE
2.1 Psychrometric Chart Analysis 9
2.2 Latent and sensible heat loads 12
2.3 Recommended relative humidity parameter 14
2.4 Optimized fresh air intake in AC system 16
2.5 Recommended design criteria in health care facilities 20
2.6 Comparison of AC system and design (Murphy, 2006) 21
3.1 The minimum number of sampling points recommended
for IAQ:
32
4.1 Results of AC system monitoring for restaurant 56
4.2 Volume flow rate for specific location 57
4.3 Variable fresh air (FA) intake base on occupants 60
4.4 Ratio of opening damper and the mixing air (MA) 60
4.5 AC system for proper ventilation controlled by damper
economizer
61
4.6 AC system with additional desiccant wheel 64
4.7 AC system with additional HPHX 69
4.8 Results of AC System Monitoring OT 82
4.9 Volume flow rate for specific location 83
4.10 Comparison RA between measurement, requirement and
proposed set point
84
4.11 New cooling process to meet RA set point 86
4.12 AC system with additional desiccant wheel for 91
4.13 AC system with additional HPHX for OT 95
xii
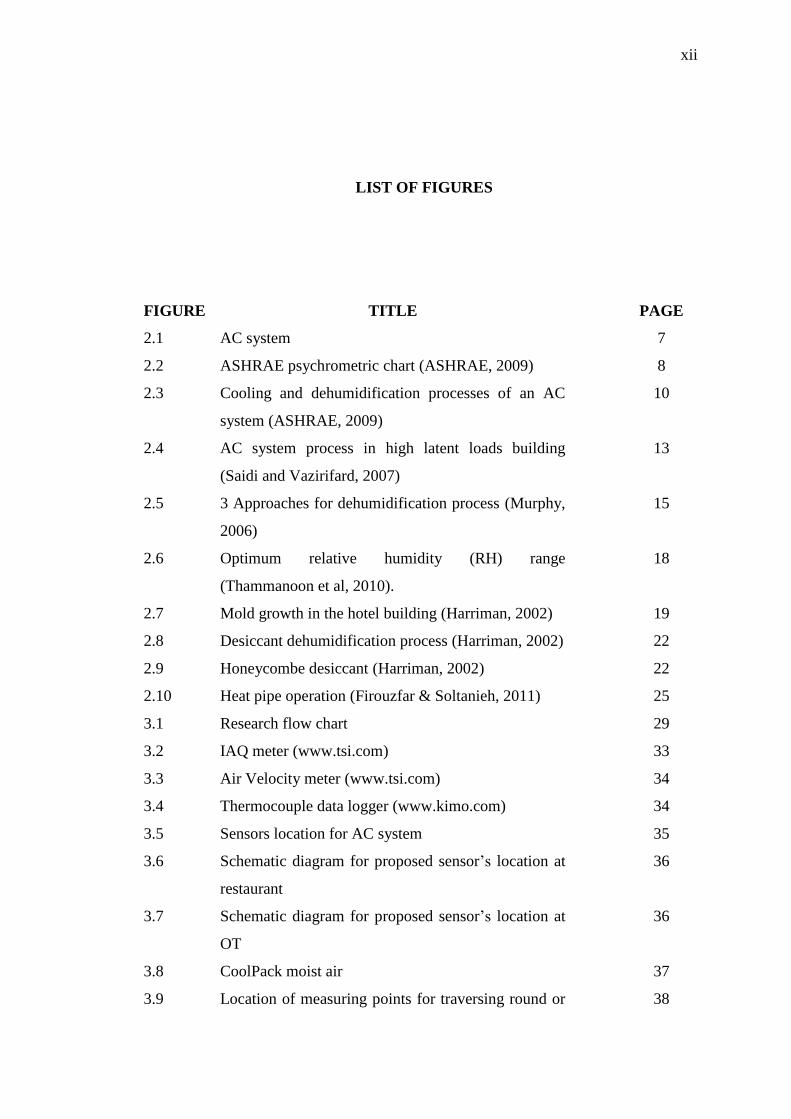
LIST OF FIGURES
FIGURE TITLE PAGE
2.1 AC system 7
2.2 ASHRAE psychrometric chart (ASHRAE, 2009) 8
2.3 Cooling and dehumidification processes of an AC
system (ASHRAE, 2009)
10
2.4 AC system process in high latent loads building
(Saidi and Vazirifard, 2007)
13
2.5 3 Approaches for dehumidification process (Murphy,
2006)
15
2.6 Optimum relative humidity (RH) range
(Thammanoon et al, 2010).
18
2.7 Mold growth in the hotel building (Harriman, 2002) 19
2.8 Desiccant dehumidification process (Harriman, 2002) 22
2.9 Honeycombe desiccant (Harriman, 2002) 22
2.10 Heat pipe operation (Firouzfar & Soltanieh, 2011) 25
3.1 Research flow chart 29
3.2 IAQ meter (www.tsi.com) 33
3.3 Air Velocity meter (www.tsi.com) 34
3.4 Thermocouple data logger (www.kimo.com) 34
3.5 Sensors location for AC system 35
3.6 Schematic diagram for proposed sensor’s location at
restaurant
36
3.7 Schematic diagram for proposed sensor’s location at
OT
36
3.8 CoolPack moist air 37
3.9 Location of measuring points for traversing round or 38

xiii
rectangular ducts using the log-Tchebycheff method
(ASHRAE fundamental 2009)
3.10 Input required when selecting desiccant wheel from
Novel Aire Technology
40
3.11 Desiccant wheel selection from Novel Aire
Technology
40
3.12 Selection heat pipe heat exchanger from S & P Coil
Product Ltd
43
3.13 Heat pipe heat exchanger effectiveness (ASHRAE
fundamental 2009).
44
4.1 Plan layout restaurant (sketch) 46
4.2 Walkthrough inspection view at restaurant from a)
front view and b) rear view
47
4.3 Graph of temperature (°C) versus time 48
4.4 Graph of relative humidity (%) versus time 49
4.5 Graph of carbon dioxide (ppm) versus time 50
4.6 Graph of carbon Monoxide (ppm) versus time 51
4.7 Average fresh air temperature and RH (S1) versus
Day
52
4.8 Average pre-cooled air temperature and RH (S2)
versus Day
52
4.9 Average supply air temperature and RH (S3) versus
Day
53
4.10 Average return air temperature and RH (S4) versus
Day
53
4.11 Cooling process on to ASHRAE psychrometric chart
for restaurant
55
4.12 Results of Cooling Energy Required for AC system
for restaurant
57
4.13 Alternative dehumidification using AHU with Proper
Fresh air intake for restaurant
59
4.14 Ratio of opening FA intake vs the properties of MA 61
4.15 Ratio of opening volume flow rate FA intake (%) vs 62

xiv
Qs, Qt and Grand total (kW)
4.16 Selection of desiccant wheel 63
4.17 Desiccant wheel selected and result 63
4.18 Psychrometric plotted after additional desiccant
wheel for restaurant
65
4.19 Cooling and heating energy with additional desiccant
wheel for restaurant
66
4.20 Selection of heat pipe heat exchanger (HPHX) 67
4.21 Psychrometric plotted after HPHX for restaurant 68
4.22 Cooling energy with heat pipe heat exchanger
(HPHX) for restaurant
70
4.23 Comparison between existing system and proposed
design systems for restaurant
71
4.24 Monitoring location OT no 3 72
4.25 Walkthrough inspection view at OT 72
4.26 Graph of temperature (°C) versus time 73
4.27 Graph of relative humidity (%) versus time 74
4.28 Graph of carbon dioxide (ppm) versus time 75
4.29 Graph of carbon Monoxide (ppm) versus time. 76
4.30 Average fresh air temperature and RH (S1) versus
time
77
4.31 Average after heat wheel air temperature and RH
(S2) versus time
78
4.32 Average supply air temperature and RH (S3) versus
time
79
4.33 Average after heater supply air temperature and RH
(S4) versus time
80
4.34 Cooling process on to ASHRAE psychrometric chart
for OT
81
4.35 Results of Cooling Energy and Heating Required for
AC system OT
83
4.36 Propose cooling process to meet temperature and RH
set point for OT
85

xv
4.37 Results of Cooling Energy and Heating Required AC
system for OT
87
4.38 Selection Desiccant Wheel for OT 88
4.39 Desiccant wheel Selected and Result for OT 88
4.40 Psychrometric plotted after additional desiccant
wheel for OT
90
4.41 Cooling and heating energy with additional desiccant
wheel for OT.
92
4.42 Selection of heat pipe heat exchanger (HPHX). 93
4.43 Psychrometric chart plotted with additional HPHX
after heat wheel (AHW)
94
4.44 Cooling and heating energy with additional HPHX 96
4.45 Comparison between existing system and proposed
design system for OT
97
xvi
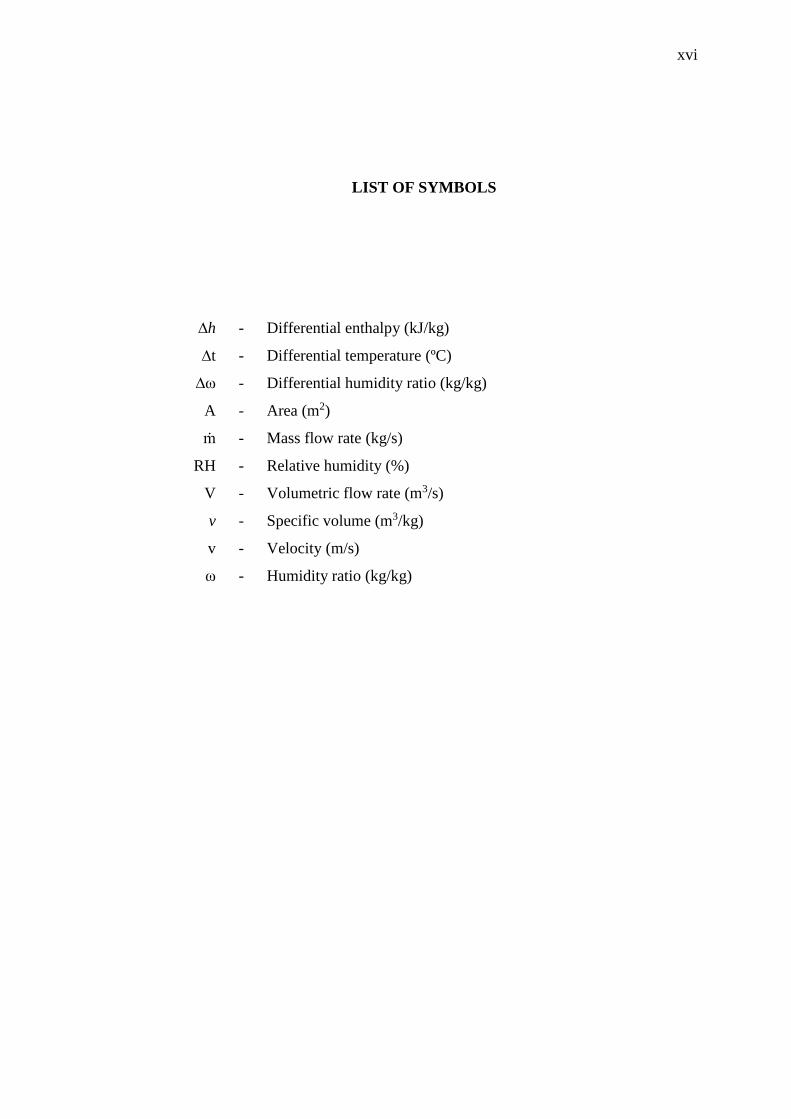
LIST OF SYMBOLS
∆h - Differential enthalpy (kJ/kg)
∆t - Differential temperature (ºC)
∆ω - Differential humidity ratio (kg/kg)
A - Area (m2)
ṁ - Mass flow rate (kg/s)
RH - Relative humidity (%)
V - Volumetric flow rate (m3/s)
v - Specific volume (m3/kg)
v - Velocity (m/s)
ω - Humidity ratio (kg/kg)
xvii
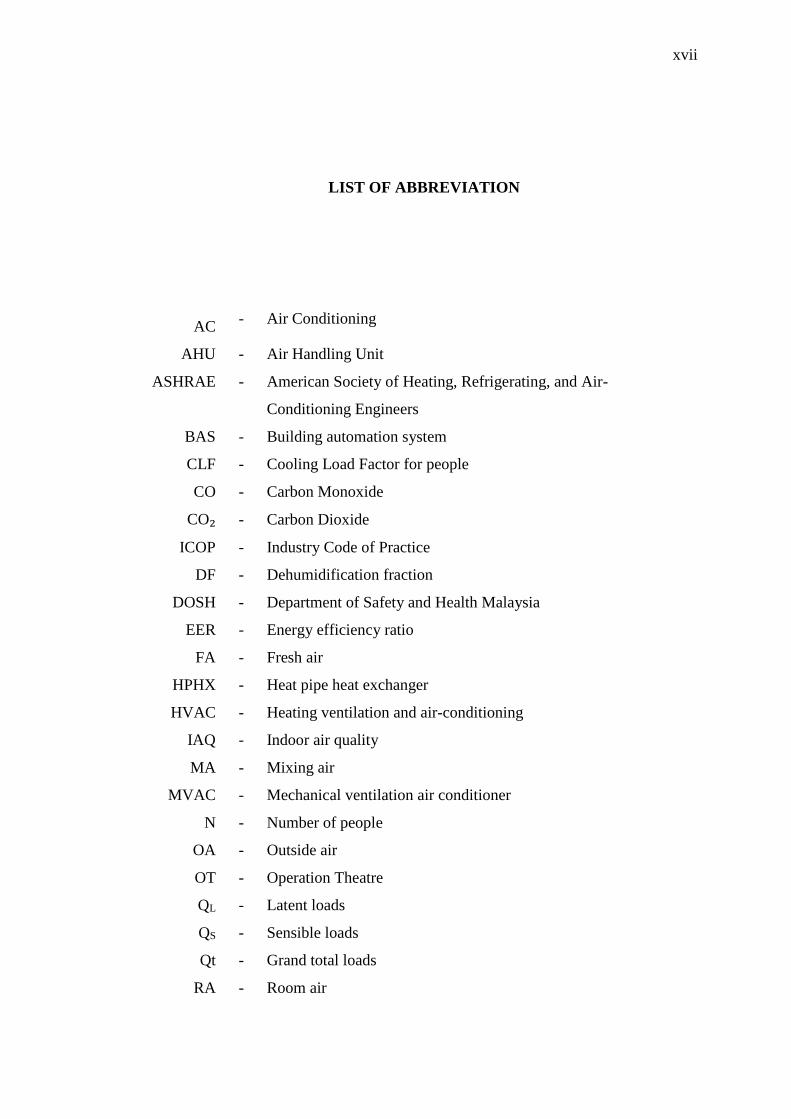
LIST OF ABBREVIATION
AC - Air Conditioning
AHU - Air Handling Unit
ASHRAE - American Society of Heating, Refrigerating, and Air-
Conditioning Engineers
BAS - Building automation system
CLF - Cooling Load Factor for people
CO - Carbon Monoxide
CO₂ - Carbon Dioxide
ICOP - Industry Code of Practice
DF - Dehumidification fraction
DOSH - Department of Safety and Health Malaysia
EER - Energy efficiency ratio
FA - Fresh air
HPHX - Heat pipe heat exchanger
HVAC - Heating ventilation and air-conditioning
IAQ - Indoor air quality
MA - Mixing air
MVAC - Mechanical ventilation air conditioner
N - Number of people
OA - Outside air
OT - Operation Theatre
QL - Latent loads
QS - Sensible loads
Qt - Grand total loads
RA - Room air

xviii
RA’ - Return air
RES - The rate of energy saving
ADW - After desiccant wheel air
SA - Supply air
SA’ - After Heater Supply Air
RSHF - Room sensible heat factor
SHR - Sensible heat ratio
SMACNA - Sheet Metal and Air Conditioning Contractors' National
Association
T&C - Testing and commissioning
VAV - Variable air volume
VC+D - Vapours compression and desiccant
VC+D+EC - Vapours compression, desiccant and direct evaporative
cooler

xix
LIST OF APPENDICES
A Sensor installation and data collection in restaurant 106
B Data collection in OT 123
1
CHAPTER 1
INTRODUCTION
This chapter discusses the background of the research problem. It generally describes
about the air conditioning (AC) systems and the importance of humidity control. This
chapter also highlights the problem statement based on the background provided as
well as the objectives, limitation and the significance of the study.
1.1 Background of Study
Air conditioning (AC) systems typically provides thermal comfort and good indoor
air quality (IAQ) achieved by controlling the temperature, humidity level and
cleanliness of the air distribution. Moreover the design of the AC system involves
calculation of peak cooling loads, specification of system, calculation of annual
performance and calculation of cost (Sekhar and Tan, 2009). On the other hand, the
cooling loads estimation is very important to ensure proper removal of building heat
loads. Building heat loads can be simply defined as internal and external loads.
External loads occur due to heat transfer between the building and its’ surroundings
and it is affected by outdoor conditions whereas internal loads are contributed by
occupants, lighting and appliances. In modern commercial buildings, the leading
sources of cooling loads are internal loads (ASHRAE, 2009; Mcquiston, Parker and
Spitler, 2011).
The AC system was designed with cooling coils and the ability to cool and
dehumidify the air as well as to meet sensible and latent heat loads in typical

2
buildings or rooms. Sensible heat load arises from dry bulb temperature. The sensible
loads gains directly to the conditioned space by conduction, convection and
radiation. Latent loads arises from moisture generated either from internal sources or
from outdoor air ventilation to maintain the IAQ requirement (Burdick, 2011).
Generally, comfortable indoor temperature is between 23 to 26 degree Celsius (°C)
and relative humidity (RH) level is 40% to 70% (Malaysia Standard MS1525, 2010).
1.2 Problem Statement
The AC system typically cools and dehumidifies the air to provide comfortable
indoor environment by removing sensible (temperature) and latent (moisture) loads.
When the latent loads are high due to ventilation, wet surface and occupants,
dehumidifying leads to reheating in order to meet the required indoor temperature
and humidity level for comfort and health. The fresh air ventilation present in the AC
system functions to improve the IAQ in the building and in special rooms, such as
operation theatres and isolation rooms, as it needs 100% fresh air ventilation, a
requirement to prevent microorganisms production in the rooms. It is a challenge for
an engineer to design an AC system with a large outside air intake in tropical
climate. To be specific, it is a common case in Malaysia where the weather is warm
and humid all year-around with the average daily temperature ranging from about
30°C to 35°C and relative humidity (RH) is about 70% to 90% (Kosravi Salman et al,
2010).
The humid air coming from the fresh air ventilation may increase the sensible
and latent load corresponding to the cooling energy consumption. The cooling coil
needs to cool down the air at a lower dew point temperature for moisture removal
and additional heating is required to meet the temperature before it is supplied to the
room. Improper analysis of the dehumidification process for the AC system may lead
to high cooling energy and thus affecting the RH in indoor environment. Cooling
coils in the AC system requires extra energy and this causes inefficiency in the
system. In terms of IAQ, RH must follow the standards for health and comfort
reasons. High RH may lead to uncomfortable and stuffy conditions, while low RH
will lead to the occupants complaints such as dry nose, throat, eyes and skin
(Lstiburek, 2002). High RH levels will also lead to mold and fungus growth and

3
affects the IAQ inside the building. These microorganisms spores travel by air and
cause infectious diseases, allergies and other respiratory irritations to occupants
(SMACNA, 1998). A major concern on energy conservation has led to the
development of energy efficiency of the AC systems while improving indoor air
quality in the buildings.
1.3 Objective of Study
This study concerns about the energy efficiency and indoor environment factor of the
buildings or rooms that had been selected. The objectives are:
i. To investigate optional humidity control in tropical climates to meet the
standard humidity level in two different latent heat loads applications.
ii. To compare cooling energy between the existing design and alternative
supplementary design to maintain humidity standard requirement.
1.4 Scope of Study
The scope of the study began with the identification of high latent heat building or
room. Latent loads are known as moisture loads that comes from outside air
ventilation, humans, infiltration, equipment and appliances. Therefore, indoor
monitoring was conducted in several rooms or buildings and was compared to
Malaysian standard MS1525, Department of Safety and Health (DOSH) Malaysia
and ASHRAE standard 55. Point of samplings followed the guideline from the
Industry Code of Practice (COP) on Indoor Air Quality 2010, DOSH Malaysia. The
minimum number of sampling is 1 point per 500 m2. The indoor monitoring involved
the air temperature, relative humidity (RH), carbon dioxide (CO) and carbon
monoxide (CO₂) in the rooms that needed to be monitored. The information is
required from the building owner in this study in order to understand the cooling load
of the AC system that was installed include:
i. Technical data
ii. Testing and commissioning (T&C) report (if permitted)
iii. Design layout of the AC system
iv. Building automation system (BAS) daily (if any)
4
v. Civil and structure layout
vi. Control system
vii. Schedule maintenance
viii. Indoor air design requirement
The AC system performance was also monitored to identify the average
cooling energy consumption in standard operations. The air flow rate was measured
to obtain the actual total air flow rate of the AHU (field measurement). The
ASHRAE recommendation for measuring air flow rate is at least 25 points for a
rectangular duct (ASHRAE, 2009). The psychrometric chart was used to analyze the
actual cooling energy required and to identify the latent and sensible loads
respectively. The causes of both loads were rectified from the field test measurement
for the AC system and indoor monitoring.
The improvement in dehumidification is a value added to the energy efficiency
for the AC system and would further improve the indoor air quality in the building.
i. Economizer damper
- Utilizing minimum fresh air intake results in huge energy
savings in humid climate. The economizer damper can be useful
in controlling outside air flow rate and to minimize the fresh air
load.
ii. Desiccant Dehumidifier
- Desiccant reacts by attracting and removing moisture from one
stream to another and can be cost-effective because it uses low
grade thermal sources to remove moisture.
iii. Heat pipe heat exchanger (HPHX).
- HPHX is a high performance heat transfer device which works
using evaporation and condensation sections of proper working
fluid in individual closed tubes. Literature review on the studies,
technology and application of desiccant and HPHX dehumidifier
was conducted as supplements to improve the AC system.
The target area for this study was:
i. Restaurant
ii. Hospital Operation Theatre (OT)
5
1.5 Limitation of Study
The limitations of this study occurred due to the following components:
i. Gathering information at the selected buildings or rooms. Some
information cannot be given to a third party because it is private and
confidential to the engineering department of the selected buildings.
ii. Hot and humid climate play an important role in this study for the
cooling and dehumidification process in the AC system. Due to the
changes in the weather cannot be controlled.
1.6 Significance of Study
The comparisons of the proposed methods in the system are beneficial to HVAC
consultants and engineers in order to improve the existing system and to properly
design the air-conditioning system for energy efficiency. Three methods for
improving humidity had widely been studied and used in industry which are for
humidity improvement for good dehumidification, energy saving and healthy indoor
air quality in a tropical climate buildings.

6
CHAPTER 2
LITERATURE REVIEW
In this part of the chapter, it will review the current status of the several studies that
had been carried out on humidity control in different building applications in term of
air-conditioning system, psychrometric chart overview, humidity control, humidity to
indoor air quality (IAQ), desiccant dehumidifier technology that available, heat pipe
heat exchanger (HPHX), the technology for dehumidification. Others operating
conditions that can be used to optimize the performance of the humidity control in
building system as well as additional relevant information of the study are taken as
references.
2.1 Air-conditioning System
The Air-Conditioning (AC) system is a common system providing cooling and
dehumidification process for typical buildings in a tropical climate. It comprises
consists of the circulation air, exhaust and fresh air for air side and blower fan,
motor, filter and cooling coil for mechanical components (Carrier, 1952).
Figure 2.1 shows the air side of the AC system which is known as the air
handling unit (AHU). The cooling coil in the AHU handles the cooling and
dehumidification process. The air contacts with the cooling coil surface and the
moisture was condensate when the air is cooled below the dew point temperature.
The air changed its state from water vapour to liquid water when it contacts with the
cool surface. The liquid water is then drained away for disposal.

7
Figure 2.1: AC system
2.2 Psychrometric Chart Overview
Figure 2.2 shows the ASHRAE psychrometric chart under sea-level pressure of
101.325 kPa. This chart uses thermodynamic properties to analyze and illustrate the
condition and processes involving moist properties. The problem of high latent load,
which is known as a moisture problem, can be analyzed using this chart and solutions
can be made to improve the moisture problem significantly. The following are some
parameters of thermodynamics shown in the psychrometric chart (ASHRAE, 2009).
i. Line “A” is the line of dry bulb temperature. It is measured using dry bulb
thermometer, with the common scale in Celsius (°C) and Fahrenheit (°F).
ii. Line “B” is the humidity ratio. Humidity ratio is the ratio of mass water
vapour per mass dry air conditioned measured in the scale of gram/kilogram
of dry air.
iii. Line “C” is the relative humidity which is defined as the ratio of the mole
fraction of water vapour in a moist air sample to the mole fraction of water
vapour in a saturated moist air sample at the same pressure and pressure. The
unit of relative humidity is percentage (%).
iv. Line “D” is the specific volume of a moist air mixture and is expressed in the
unit of mass of dry air (m3/kg).

8
v. Line “E” is the wet bulb temperature which is the saturation temperature of
moist air at the end of an ideal adiabatic saturation process (S. A. Sherif,
2002).
vi. Line “F” is the moist air specific enthalpy (kJ/kg) where the mixture of
perfect gases equals the sum of the individual partial enthalpies of the
component.
vii. Line “G” is the dew point temperature where the moisture wills condensate
out from the air. When the air reaches the dew point temperature, the dry and
wet bulbs are exactly the same in 100% RH.
viii. Circle “F”, the protractor in the chart shows two scales. They are the
sensible/total heat ratio and the ratio of enthalpy differential to humidity ratio
differential.
Figure 2.2: ASHRAE psychrometric chart (ASHRAE, 2009)
The relationships between temperature, moisture content and energy can be
identified using this chart. The parameters involved include dry bulb temperature,
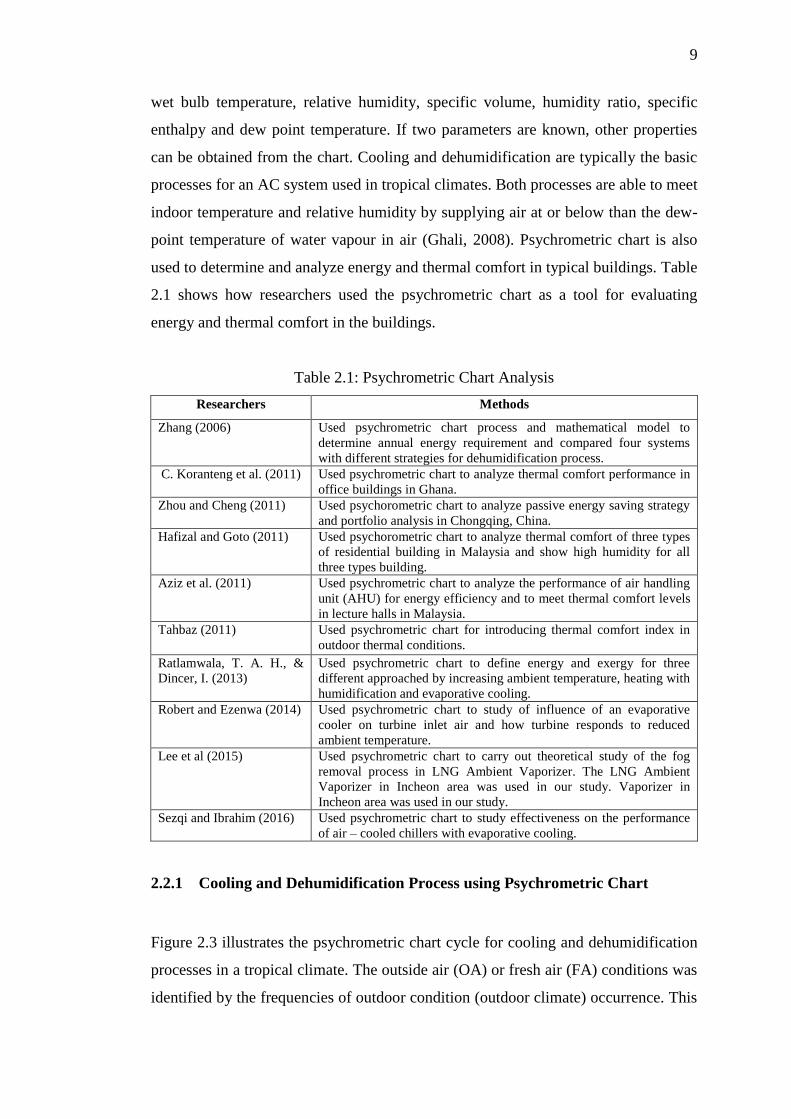
9
wet bulb temperature, relative humidity, specific volume, humidity ratio, specific
enthalpy and dew point temperature. If two parameters are known, other properties
can be obtained from the chart. Cooling and dehumidification are typically the basic
processes for an AC system used in tropical climates. Both processes are able to meet
indoor temperature and relative humidity by supplying air at or below than the dew-
point temperature of water vapour in air (Ghali, 2008). Psychrometric chart is also
used to determine and analyze energy and thermal comfort in typical buildings. Table
2.1 shows how researchers used the psychrometric chart as a tool for evaluating
energy and thermal comfort in the buildings.
Table 2.1: Psychrometric Chart Analysis
Researchers Methods
Zhang (2006) Used psychrometric chart process and mathematical model to
determine annual energy requirement and compared four systems
with different strategies for dehumidification process.
C. Koranteng et al. (2011) Used psychrometric chart to analyze thermal comfort performance in
office buildings in Ghana.
Zhou and Cheng (2011) Used psychorometric chart to analyze passive energy saving strategy
and portfolio analysis in Chongqing, China.
Hafizal and Goto (2011) Used psychorometric chart to analyze thermal comfort of three types
of residential building in Malaysia and show high humidity for all
three types building.
Aziz et al. (2011) Used psychrometric chart to analyze the performance of air handling
unit (AHU) for energy efficiency and to meet thermal comfort levels
in lecture halls in Malaysia.
Tahbaz (2011) Used psychrometric chart for introducing thermal comfort index in
outdoor thermal conditions.
Ratlamwala, T. A. H., &
Dincer, I. (2013)
Used psychrometric chart to define energy and exergy for three
different approached by increasing ambient temperature, heating with
humidification and evaporative cooling.
Robert and Ezenwa (2014) Used psychrometric chart to study of influence of an evaporative
cooler on turbine inlet air and how turbine responds to reduced
ambient temperature.
Lee et al (2015) Used psychrometric chart to carry out theoretical study of the fog
removal process in LNG Ambient Vaporizer. The LNG Ambient
Vaporizer in Incheon area was used in our study. Vaporizer in
Incheon area was used in our study.
Sezqi and Ibrahim (2016) Used psychrometric chart to study effectiveness on the performance
of air – cooled chillers with evaporative cooling.
2.2.1 Cooling and Dehumidification Process using Psychrometric Chart
Figure 2.3 illustrates the psychrometric chart cycle for cooling and dehumidification
processes in a tropical climate. The outside air (OA) or fresh air (FA) conditions was
identified by the frequencies of outdoor condition (outdoor climate) occurrence. This
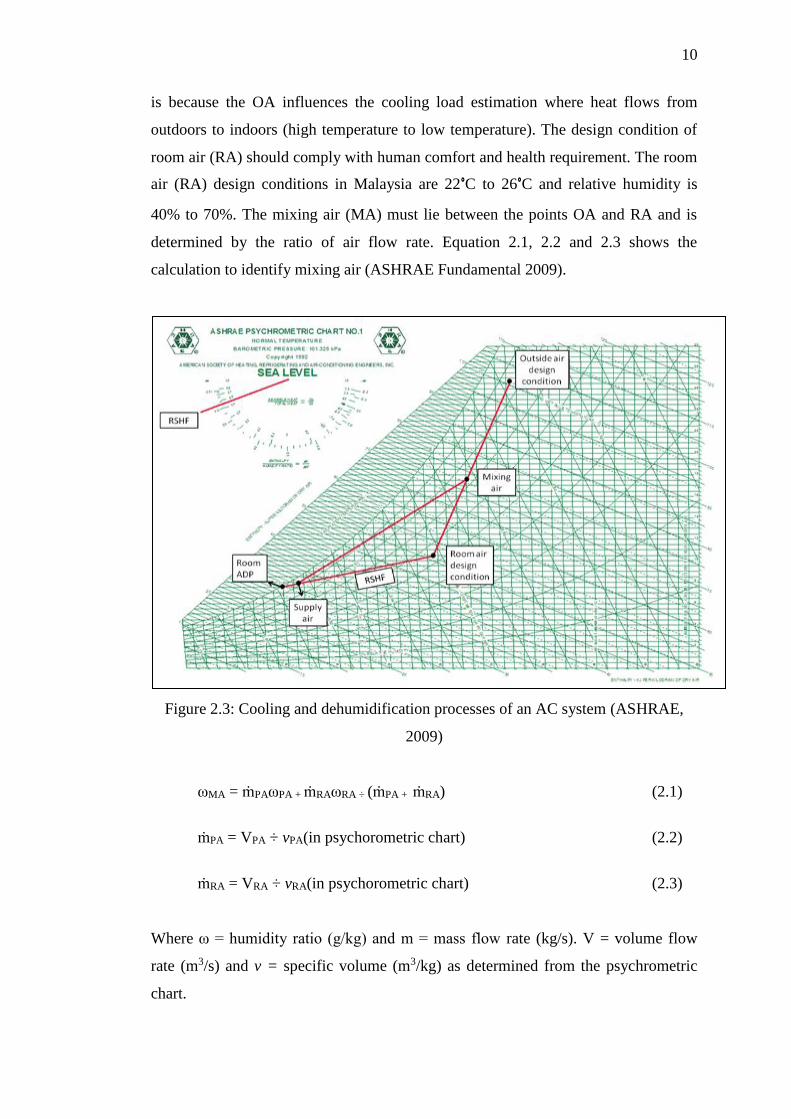
10
is because the OA influences the cooling load estimation where heat flows from
outdoors to indoors (high temperature to low temperature). The design condition of
room air (RA) should comply with human comfort and health requirement. The room
air (RA) design conditions in Malaysia are 22°C to 26°C and relative humidity is
40% to 70%. The mixing air (MA) must lie between the points OA and RA and is
determined by the ratio of air flow rate. Equation 2.1, 2.2 and 2.3 shows the
calculation to identify mixing air (ASHRAE Fundamental 2009).
Figure 2.3: Cooling and dehumidification processes of an AC system (ASHRAE,
2009)
ωMA = ṁPAωPA + ṁRAωRA ÷ (ṁPA + ṁRA) (2.1)
ṁPA = VPA ÷ vPA(in psychorometric chart) (2.2)
ṁRA = VRA ÷ vRA(in psychorometric chart) (2.3)
Where ω = humidity ratio (g/kg) and m = mass flow rate (kg/s). V = volume flow
rate (m3/s) and v = specific volume (m3/kg) as determined from the psychrometric
chart.

11
Sensible and latent loads need to be determined in a cooling load estimation.
Both of the loads are required in order to calculate room sensible heat factor (RSHF).
The RSHF will show how cold and dry the supply temperature needs to be in order
to meet the desired temperature and RH level in the building (ASHRAE, 2009).
RSHF can be expressed using equation 2.4.
RSHF = room sensible heat load / room total heat load (2.4)
The slope of RSHF was plotted on the protractor in psychrometric chart. The line
passing through from RA and parallel to the RSHF line on the protractor was drawn
to intersect with the saturation curve (100% RH). This is known as the apparatus dew
point temperature (ADP) and the supply air must lie somewhere on the RSHF line.
The coil by-pass factor need to be considered because a very small portion of the air
passes through the coil without being cooled or bypassed and this is about 14% of the
supply air (Haines and Myers, 2010). The total cooling energy can also be
determined by taking the heat contents i.e. enthalpies from points MA and SA. After
a complete air-conditioning cycle process, the actual sensible loads (QS), latent loads
(QL) and total loads (QT) can be expressed using equation 2.5, 2.6 and 2.7
(ASHRAE Fundamental 2009):
QS = 1.21 (sensible heat factor) × V × ∆t (2.5)
QL = 3.01 (latent heat factor) × V × ∆ω (2.6)
QT (total load)= QS + QL or 1.2 × V × ∆h (2.7)
Where:
V = Volumetric flow rate (m3/s),
∆t = Differential temperature (ºC)
∆ω = Differential humidity ratio (kg/kg)
∆h = Differential enthalpy (kJ/kg)

12
2.2.2 High Latent Loads Process in Psychrometric Chart
Estimation of cooling loads is the amount of energy needed or must be removed to
meet the comfortable environment required in the building. Building loads can be
simplified into internal and external load. External loads are mainly due to heat
transfer between the building and it’s surrounding which is affected by outdoor
conditions and internal loads are contributed by occupants, lighting and appliances.
There are two types of load to be met under the AC system that are sensible and
latent loads.
Table 2.2 summarizes the factors that influence the sensible and latent loads.
Sensible heat load arises from dry bulb temperature heat transfer. Latent load arises
from moisture generated either from internal sources or from outdoor air ventilation
to maintain the IAQ requirement. Murphy (2006) advocated that the impact of
geographical location and high outside air ventilation in humid climate may give
high indoor relative humidity. Chen et al. (2004) believed high latent loads may
influence roots and mold problem. It can be avoided by proper design and
maintenance of the air-conditioning system. Chong and Low (2006) found the
latent loads occur are due to weather conditions, occupants, wet surface and water
leakages in the building.
Table 2.2: Latent and sensible heat loads
Latent heat load Sensible heat load
Air infiltration through crack, windows and
doors Solar heat gain through walls, roof and windows
Equipment and appliances Equipment and appliances
Occupants Lights
Ventilation Infiltration (hot air)
Weather Occupants
- Ventilation
- Weather
Figure 2.4 illustrates the air conditioning process in high latent loads
buildings. This process requires very low dew point temperature to handle the latent
loads. In this case, a heating system is required to be added. The low dew point
temperature without reheat may lead to over cooling in the building. The

13
recommended level of dew point for a typical office building is between 51°F and
57°F (11°C and 14°C), while the level for libraries and museums is between 46°F
and 54°F (8°C and 12°C) (Saidi and Vazirifard, 2007).
Figure 2.4: AC system process in high latent loads building (Saidi and Vazirifard,
2007)
2.3 Humidity Control
The humidity level in the building is quantified by relative humidity (RH) where RH
was the ratio of the amount of water vapour in the air to the amount of water vapour
air can hold at that temperature (Elovitz, 1999; Mandayo et al., 2015; Standard,
2010).
Table 2.3 shows the recommended relative humidity parameter in the
building. The range of RH is specified for occupied and unoccupied buildings. When
the humidity level is below the range (40%), humidification is required where a

14
water source is used for the humidifying process (Halim and Man, 2006). The wet
surface and dirt can cause the growth of microorganisms and result in poor indoor air
quality (S.K.Wang, 2001). Humidification by injecting steam can be advantageous to
avoid wet surface. While at high humidity levels (>60%), dehumidification process
is necessary. The air is going cooled until the dew point to dehumidify the air.
Table 2.3: Recommended relative humidity parameter (55.1-2010, 2010; Department
of Occupational Safety and Health Ministry of Human Resources)
Standard ASHRAE
standard 55 - 2004
DOSH
(ICOP IAQ) -2010
Malaysia Standard
(MS 1525)-2007
Relative Humidity
(RH) 40 – 60 % 40 - 70 % 40 - 70 %
2.3.1 Humidity Control System
Typically in tropical climates where the weather is warm and humid all year-around,
dehumidification process is required for humidity control. Diekman et al. (2009)
discussed three types of dehumidification approaches in typical AC systems.
Figure 2.5 illustrates the 3 approaches for dehumidification process in the AC
system. The first approach (a) utilized cooling coils to cool and condense the water
vapour. The second approach (b) utilized cooling and hot gas reheating to meet
sensible and latent loads and the third approach (c) utilized heat pipe heat exchanger
where heat pipe transporting pre-cooled and reheat for the AC system. Murphy
(2006) studied the strategies for dehumidification process using the psychrometric
chart based on space dry bulb temperature for constant volume. The strategies
involved in rainy day, fan speed adjustment, face and bypass damper and variable air
volume (VAV) systems. The VAV system is a more effective strategy to control
humidity and if improperly designed and controlled may lead to high humidity level
in a building space.

15
Figure 2.5: 3 Approaches for dehumidification process (Murphy, 2006)
Chua et al. (2007), on the other hand, investigated the control strategies to meet
humidity during part load condition. The comparison of control chilled water flow,
bypass air, variable air volume, run-around coil and low face velocity was made. The
result showed chilled water control strategy gave the highest indoor humidity while
variable air volume (VAV) gave effective dehumidification performance. In addition,
Sekhar and Tan (2009) investigated the indoor humidity control by modulating the
chilled water flow rates. Performance evaluation of various coil selection was
conducted at various operating conditions using simulation. It is shown by increasing
the effective surface area of the coil and reducing air flows (VAV) to improve the
dehumidifying performance.
Due to warm and humid climates, keeping it to a minimum and optimizing
the fresh air intake may control indoor humidity level, indoor air quality and reduce
energy in the building. Table 2.4 showed how the researcher optimized the fresh air
intake to meet the indoor air quality (IAQ) requirement while reducing energy in the
AC system. Thus, it benefits the IAQ and is an energy saving opportunity in typical
buildings.

16
Table 2.4: Optimized fresh air intake in AC system
Year Authors Method Result
1998 Harry J. Saver Outside air economizer damper was
modulated to maintain minimum fresh air
intake using simulation by set point of
supply temperature.
It shows that control of the
economizer damper can
save the amount of energy
and comply to ASHRAE
standard 62.1
1998 George J. Berbari Outside air was controlled and additional
run around coil was used to treat the
outside air intake and analyzed potential
energy saving.
It shows the run around coil
resulted in energy saving in
hot and humid climates and
improved indoor relative
humidity significantly.
2006 Gang Wang and
Ming sheng Liu
Method to optimize the outside air intake
to minimize total cost of mechanical
cooling and steam humidification.
Optimal curve was made
and optimized the outside
intake attaining 27% energy
saving.
2011 Joo et al. Conducted optimum ratio of makeup and
recirculation air in Korea to improve IAQ
and energy saving. Consideration
involved weather condition, mixing air
and IAQ.
Result shows the ratio
between make up to
recirculation air was 1:2 and
met the requirement for
IAQ and reduced energy.
2012 Gang Wang and
Li Song
Steady state energy consumption model
was identified for air handling unit system
(AHU) under economizer damper to meet
temperature and humidity level in the
building.
Optimal supply air
temperature was evaluated
based on modelling and
resulted in energy saving up
to 90% under certain space
load. The economizer may
be controlled using the
temperature sensor.
2014 Ular Palmiste Explored and calculated free cooling
potential of direct airside economizer in
Esonia by conduted temperature bin
weather data
Free cooling presented in
yearly, monthly and hourly.
The highest airside
economizer operation from
October to April
2016 Baojie Mu et al. evaluated of energy efficiency by
experimental using performance of anti-
windup extremum seeking control
towards chilled water and direct
expansion air side economizer
By controlled outdoor air
damper, chilled water
minized the cooling coil
load and direct-expansion
system minimized power
consumption.

17
Table 2.4: Optimized fresh air intake in AC system (continue)
Year Authors Method Result
2016 Bin Yan et al. Investigated the uncertainties of outdoor
air control pattern and mapped to building
performance simulation in term of energy
consumption and ventilation requirement
of a particular HVAC system type.
Simulated results show that
the uncertainty in outdoor
air control can lead to 17%
difference in cooling
consumption and 43%
difference in heating
consumption compared with
using standard outdoor air
control settings in Energy
Plus simulation.
2.4 Humidity to Indoor Air Quality (IAQ)
Relative Humidity (RH) should meet the standard requirement for health and comfort
reasons. RH is related to comfort, mold growth, respiration illness and impact to
occupant’s performance and ability (Bayer et al, 2000 ; Choo et al, 2015).
Figure 2.6 illustrates the optimum relative humidity for every building for
health and comfort reasons. The optimum RH range shown is 30% to 60 %. Low RH
in the building can cause occupants toexperience dryness and irritation of eyes and
airways (Bayer et al., 2000; Ismail and Deros, 2010). In high RH, the occupant may
feel uncomfortable and stuffy (Lstiburek, 2002). Hamimah et al. (2010) highlighted
that high RH gave small effect on thermal sensation but in long term will effect
microbial growth. Morse et al. (2007) defined the causes of high humidity in the
school. High humidity was found due to ventilation and infiltration air, oversized
equipment and improper operation of the AC system. Due to high humidity, the
symptom of mold growth was found during walk-around inspection. This study
found the AC system has difficulty to maintain indoor humidity under the range due
to the climate.

18
Figure 2.6: Optimum relative humidity (RH) range (Thammanoon et al, 2010).
Ghasemkhani and Naseri, (2008) monitored the IAQ for a kitchen in Tehran.
They discovered that 90% of the people felt comfortable with the recommended
range for temperature and RH. RH below 30% resulting in dry air affecting eyes,
skin and mucous membrane while RH above 60% supported the growth of pathogens
or allergens. Marzuki et al. (2010) did monitoring at schools in Malaysia and
highlighted the range of RH did not comply with the standard range (refer Table 2.3)
due to the hot and humid climate.
Additional effect from high RH is condensation. Condensation occurs when
the air cools until the dew point and moisture condenses out from air. Condensation
contributes to a variety of problem such as damaged wood, paper and fabric and steel
can become rusty (Elovitz, 1999). High relative humidity and condensation may lead
to microorganism growth such as mold and fungal. Moulds spores travel through the
air and moulds growth and survives on surfaces are determined by micro
environmental condition of both material and indoor space such as the high humidity,
temperature and, radiation and light (Aibinu et al, 2009; Nematchoua et al, 2015).

19
Figure 2.7 illustrates the mold growth in hotels. Harriman, Lstiburek, &
Kittler (2000) highlighted the American Hotel & Motel Association estimated its
members spending more than USD 68 million each year dealing with mold growth.
This microorganism problem causes infectious diseases, allergies such as rhinitis and
asthma, pneumonias, cancers, immune disorders, mucous membrane inflammation
and other respiratory irritations to occupants (SMACNA, 1998).
Figure 2.7: Mold growth in the hotel building (Harriman, 2002)
2.4.1 Health Care Buildings and Hospitals
Hospital buildings are complex indoor facilities with variable uses and functions.
Therefore, the AC system should be used to keep good IAQ for patients and medical
staff to meet comfort and health reasons. For surgery in operation theatres (OT), the
requirement of fresh air intake is100% and exhaust must also be 100% considering it
is in a critical area (Leung and Chan, 2006).
Table 2.5 shows the recommended design criteria for various places in health
care facilities. The room must also follow the required room pressure control. Room
differential pressure is focused on air balancing, proper maintenance of the AC
system and continuous checking of the filter. It is recommended to add the

20
differential room pressure monitoring (Leung and Chan, 2006). In tropical climates,
the influence of humid air may increase the AC system energy that is required to
remove moisture before it is supplied to the OT. Murphy (2006) discusses how the
temperature and humidity requirements of surgery rooms impact the design of the
HVAC system, and presents system alternatives that can meet both of these
requirements. The design used the rule of thumb which hugely impacts to the energy
and is unable to meet the requirements.
Table 2.5: Recommended design criteria in health care facilities (ASHRAE, 2007)
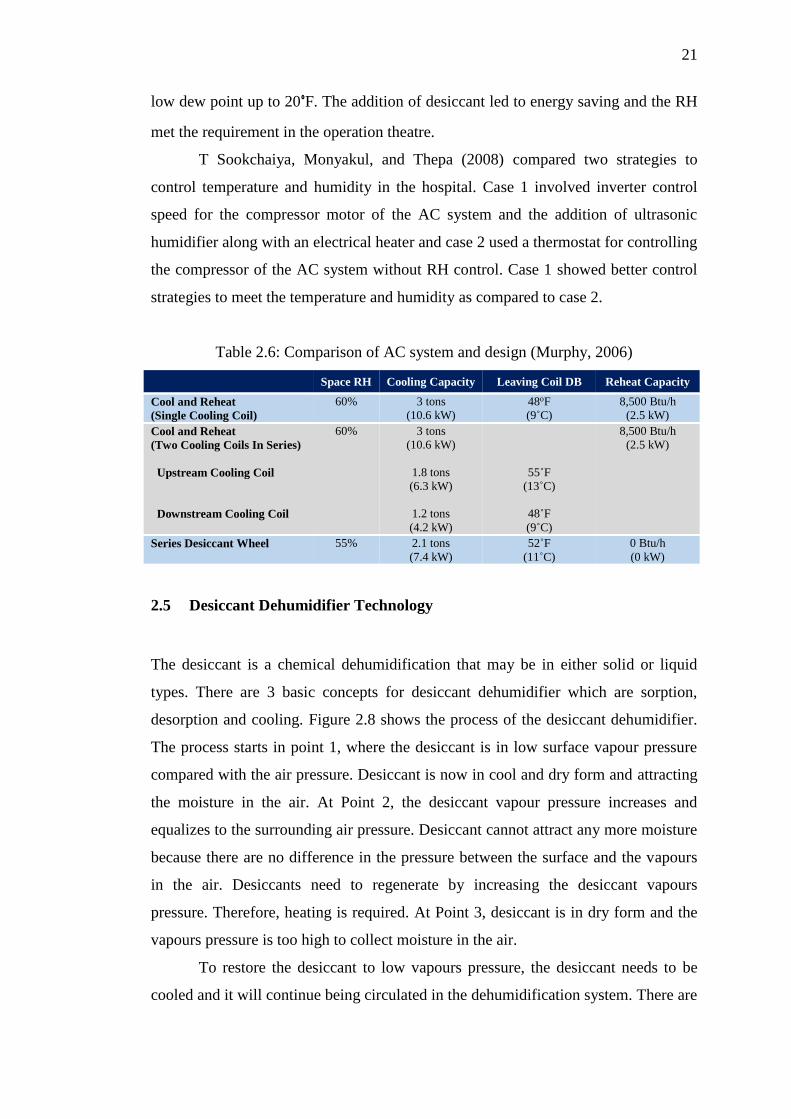
Table 2.6 depicts the result of the comparison that has been proposed. It is
shown that the series of desiccant wheel system is energy saving and the humidity
level in the surgery room. The desiccant system is able to supply the dried air
without lowering the coil temperature. Basic calculation and psychrometric chart
analysis was involved to analyze the system in order to meet the temperature and
humidity level required in the surgery room.
Nunelly et al. (2004) investigated the design of humidity control inside the
operation theatre. The proposed desiccant wheel system was introduced for the
existing air handling unit (AHU). Some benefits include dried AHU and meeting the
Function Space
Pressure
Relation to
Adjacent
Areas
Areasa
Minimum
Air
Changes of
Outside
Air per
Hourb
Minimum
Total Air
Changes
per Hourc
All Air
recirculate
d within
Room
Unitsd
Air
Recirculat
ed Within
Room
Unitsd
Relative
Humidity,n
%
Design
Temperature, oC
Surgery and Critical Care
Operating room (class B and Positive C surgical) Positive 4 20 - No 30 to 60 17 to 27
Operating/ surgical cystoscopic roomse,p,q Positive 4 20 - No 30 to 60 20 to 23
r
Delivary roomp Positive 4 20 - No 30 to 60 20 to 23
Recovery roomp - * 2 6 - No 30 to 60 24 ± 1
Critical or insentive care (burn or intermediate) Positive* 2 6 - No 30 to 60 21 to 24
Newborn intensive care Positive* 2 6 - No 30 to 60 22 to 26
Treatment room5 - * 2 6 - - 30 to 60 21 to 24
Nursery suite Positive 5 12 - No 30 to 60 24 to 27
Trauma roomf,s Positive 5 12 - No 30 to 60 22 to 26
Trauma room (crisis or shock) - 3 15 - No 30 to 60 22 to 26
Anaesthesia gas storage Negative - 8 Yes - - -
GI endoscopyab - 2 6 - No 30 to 60 20 to 23
Bronchoscopyq Negative 2 12 Yes No 30 to 60 20 to 23
Emergency waiting rooms Negative 2 12 Yes - 30 to 60 22 to 26
Triage areas Negative 2 12 Yes - - 21 to 24
Radiology waiting rooms Negative 2 12 Yest - - 21 to 24
Procedure room (class A surgigal) Positive 3 15 - No 30 to 60 21 to 24
21
low dew point up to 20°F. The addition of desiccant led to energy saving and the RH
met the requirement in the operation theatre.
T Sookchaiya, Monyakul, and Thepa (2008) compared two strategies to
control temperature and humidity in the hospital. Case 1 involved inverter control
speed for the compressor motor of the AC system and the addition of ultrasonic
humidifier along with an electrical heater and case 2 used a thermostat for controlling
the compressor of the AC system without RH control. Case 1 showed better control
strategies to meet the temperature and humidity as compared to case 2.
Table 2.6: Comparison of AC system and design (Murphy, 2006)
Space RH Cooling Capacity Leaving Coil DB Reheat Capacity
Cool and Reheat
(Single Cooling Coil)
60% 3 tons
(10.6 kW)
48oF
(9˚C)
8,500 Btu/h
(2.5 kW)
Cool and Reheat
(Two Cooling Coils In Series)
Upstream Cooling Coil
Downstream Cooling Coil
60% 3 tons
(10.6 kW)
1.8 tons
(6.3 kW)
1.2 tons
(4.2 kW)
55˚F
(13˚C)
48˚F
(9˚C)
8,500 Btu/h
(2.5 kW)
Series Desiccant Wheel 55% 2.1 tons
(7.4 kW)
52˚F
(11˚C)
0 Btu/h
(0 kW)
2.5 Desiccant Dehumidifier Technology
The desiccant is a chemical dehumidification that may be in either solid or liquid
types. There are 3 basic concepts for desiccant dehumidifier which are sorption,
desorption and cooling. Figure 2.8 shows the process of the desiccant dehumidifier.
The process starts in point 1, where the desiccant is in low surface vapour pressure
compared with the air pressure. Desiccant is now in cool and dry form and attracting
the moisture in the air. At Point 2, the desiccant vapour pressure increases and
equalizes to the surrounding air pressure. Desiccant cannot attract any more moisture
because there are no difference in the pressure between the surface and the vapours
in the air. Desiccants need to regenerate by increasing the desiccant vapours
pressure. Therefore, heating is required. At Point 3, desiccant is in dry form and the
vapours pressure is too high to collect moisture in the air.
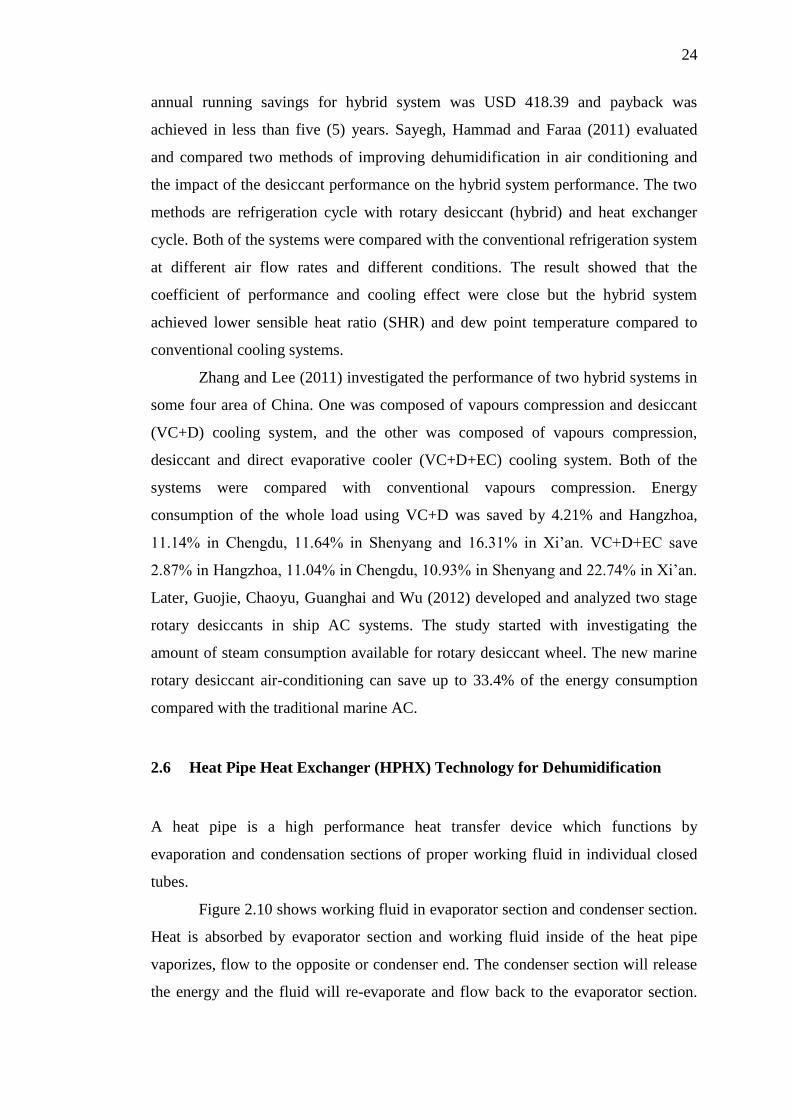
To restore the desiccant to low vapours pressure, the desiccant needs to be
cooled and it will continue being circulated in the dehumidification system. There are
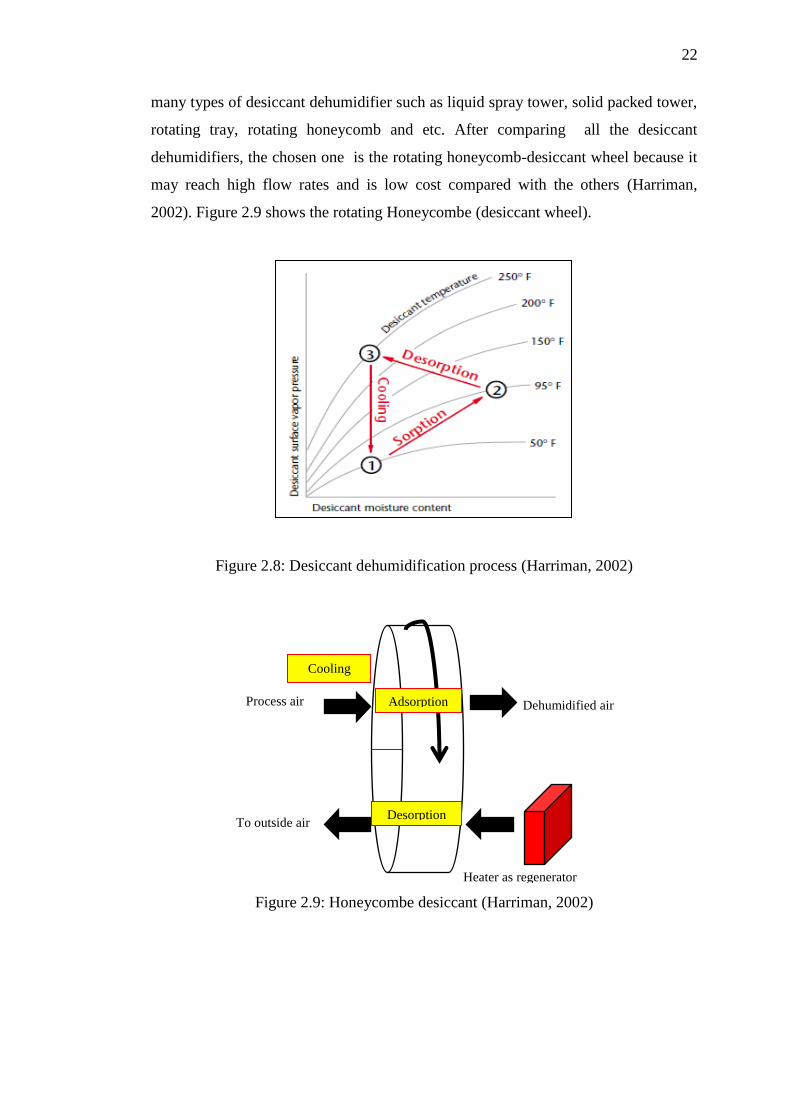
22
many types of desiccant dehumidifier such as liquid spray tower, solid packed tower,
rotating tray, rotating honeycomb and etc. After comparing all the desiccant
dehumidifiers, the chosen one is the rotating honeycomb-desiccant wheel because it
may reach high flow rates and is low cost compared with the others (Harriman,
2002). Figure 2.9 shows the rotating Honeycombe (desiccant wheel).
Figure 2.8: Desiccant dehumidification process (Harriman, 2002)
Figure 2.9: Honeycombe desiccant (Harriman, 2002)
Heater as regenerator
To outside air
Process air Dehumidified air Adsorption
Cooling
Desorption

23
2.5.1 Energy Saving using Desiccant Dehumidification
Several studies have been conducted using desiccant wheel in several place and
countries. Charles (2000) presented the cycle using a desiccant to move moisture
within the air handler system of an AC system. The moisture captured by the
desiccant from the saturated air leaving the cooling coil (supply) and delivered to the
inlet duct (return). Some of the moisture absconds with the exhaust air but most of it
goes back to the coil. The cooling coils will cool the air back and condense as a
moisture removal. This system may reduce 16.4% of energy usage and increases the
moisture removal. Another researcher, Bellia and Mazzei (2000) examined the AC
system with desiccant wheel on an Italian climate. For retail store applications
energy saving obtained was 22% and in theatres was between 23% and 38% when
compared with the conventional AC system.
While Dhar and Singh (2001) studied desiccant hybrid AC system and
compared the performance of four hybrid cycle including a new proposed cycle for
typical hot-dry and hot-humid weather conditions. By lowering heating consumption
and lowering compressor work, energy savings up to 10.63% was possible. Mazzei,
Minichiello and Palma (2002) investigated the summer operating cost between
hybrid desiccant and traditional system using three software codes based on Italian
weather conditions. Operation savings up to 35% was obtained and thermal cooling
was reduced by 52% compared to traditional systems.
In addition, Jia, Dai, Wu, and Wang (2006) studied and experimented
between hybrid desiccant air conditioning system and vapour compression system.
The hybrid desiccant air-conditioning economized 37.5% electricity power and
increased evaporator sensible heat factor. Capozzoli, Mazzei, Minichiello and Palma
(2006) compared a conventional heating ventilation and air-conditioning (HVAC)
system to a hybrid system with chemical dehumidification for supermarket
application. Their study used the simulation and analyzed annual operating cost and
found that the payback period to be about one year. Moreover, operating cost savings
is about 30% compared with existing HVAC systems in Italian supermarkets.
Ghali (2008) had simulated the transient performance of hybrid desiccant
vapours compression system for Beirut ambient conditions. The study compared that
with conventional vapours compression system in the entire cooling season. The
24
annual running savings for hybrid system was USD 418.39 and payback was
achieved in less than five (5) years. Sayegh, Hammad and Faraa (2011) evaluated
and compared two methods of improving dehumidification in air conditioning and
the impact of the desiccant performance on the hybrid system performance. The two
methods are refrigeration cycle with rotary desiccant (hybrid) and heat exchanger
cycle. Both of the systems were compared with the conventional refrigeration system
at different air flow rates and different conditions. The result showed that the
coefficient of performance and cooling effect were close but the hybrid system
achieved lower sensible heat ratio (SHR) and dew point temperature compared to
conventional cooling systems.
Zhang and Lee (2011) investigated the performance of two hybrid systems in
some four area of China. One was composed of vapours compression and desiccant
(VC+D) cooling system, and the other was composed of vapours compression,
desiccant and direct evaporative cooler (VC+D+EC) cooling system. Both of the
systems were compared with conventional vapours compression. Energy
consumption of the whole load using VC+D was saved by 4.21% and Hangzhoa,
11.14% in Chengdu, 11.64% in Shenyang and 16.31% in Xi’an. VC+D+EC save
2.87% in Hangzhoa, 11.04% in Chengdu, 10.93% in Shenyang and 22.74% in Xi’an.
Later, Guojie, Chaoyu, Guanghai and Wu (2012) developed and analyzed two stage
rotary desiccants in ship AC systems. The study started with investigating the
amount of steam consumption available for rotary desiccant wheel. The new marine
rotary desiccant air-conditioning can save up to 33.4% of the energy consumption
compared with the traditional marine AC.
2.6 Heat Pipe Heat Exchanger (HPHX) Technology for Dehumidification
A heat pipe is a high performance heat transfer device which functions by
evaporation and condensation sections of proper working fluid in individual closed
tubes.
Figure 2.10 shows working fluid in evaporator section and condenser section.
Heat is absorbed by evaporator section and working fluid inside of the heat pipe
vaporizes, flow to the opposite or condenser end. The condenser section will release
the energy and the fluid will re-evaporate and flow back to the evaporator section.

100
REFERENCES
ANSI/ASHRAE Standard 62.1-2010, Thermal Environmental Condition for Human
Occupancy. A. S. ASHRAE.
Ahmadzadehtalatapeh, M., & Yau, Y. H. (2011). The application of heat pipe heat
exchangers to improve the air quality and reduce the energy consumption of
the air conditioning system in a hospital ward - A full year model
simulation. Energy and Buildings, 43(9), pp. 2344-2355.
Aibinu, A. M., Salami, M. J. E., Shafie, A., Ali, M., & Bamgbopa, I. A. (2009).
Assessment of Mould Growth on Building Materials using Spatial and
Frequency Domain Analysis Techniques. IJCSNS, 9(7), pp. 154.
Ratlamwala, T. A. H., & Dincer, I. (2013). Efficiency assessment of key
psychometric processes. International journal of refrigeration, 36(3), 1142-
1153.
ASHRAE, S. (2010). Standard 62.1-2010. Ventilation for Acceptable Indoor Air
Quality, A. S. ASHRAE.
ASHRAE. (2000). ASHRAE Handbook: Systems and equipment. American Society
of Heating, Refrigeration and Air-Conditioning Engineers.
ASHRAE. (2007). ASHRAE Handbook: HVAC applications. American Society of
Heating, Refrigerating and Air Conditioning Engineers.
ASHRAE. (2009). ASHRAE Handbook: Fundamentals. American Society of
Heating, Refrigeration and Air-Conditioning Engineers.
Bayer, C., Crow, S., & Fischer, J. (2000). Causes of Indoor Air Quality Problems in
Schools: Summary of Scientific Research.
Bellia, L., Mazzei, P., Minichiello, F., & Palma, D. (2000). Air conditioning systems
with desiccant wheel for Italian climates. International Journal on
Architectural Science, 4, pp. 193-213.
101
Burdick, A. (2011). Strategy guideline: accurate heating and cooling load
calculations. US Department of Energy, Energy Efficiency & Renewable
Energy, Building Technologies Program.
Capozzoli, A., Mazzei, P., Minichiello, F., & Palma, D. (2006). Hybrid HVAC
systems with chemical dehumidification for supermarket applications. Applied
Thermal Engineering, 26(8), pp. 795-805.
Carrer, Paolo, et al. (2015). What does the scientific literature tell us about the
ventilation–health relationship in public and residential buildings?. Building
and Environment, 94, pp. 273-286.
Ingels, M. (1952). Father of Air conditioning. Country Life Press.
Charles, J. (2000). A Unique Air Conditioner Desiccant Cycle to Enhance
Dehumidification and Save Energy. Proceedings of 12th Symposium on
Improving Building. pp. 15–17.
Chong, W. K., & Low, S. P. (2006). Latent building defects: causes and design
strategies to prevent them. Journal of Performance of Constructed
Facilities, 20(3), pp. 213-221.
Choo, C. P., Jalaludin, J., Hamedon, T. R., & Adam, N. M. (2015). Preschools’
Indoor Air Quality and Respiratory Health Symptoms among Preschoolers in
Selangor. Procedia Environmental Sciences, 30, pp. 303-308.
Department of Occupational Safety and Health Ministry of Human Resources, M.
(2010). Industry Code of Practice on Indoor Air Quality.
Dhar, P. L., & Singh, S. K. (2001). Studies on solid desiccant based hybrid air-
conditioning systems. Applied Thermal Engineering, 21(2), pp. 119-134.
Elovitz, K. M. (1999). Understanding what humidity does and why. ASHRAE
journal, 41(4), pp. 84.
Firouzfar, E., Soltanieh, M., Noie, S. H., & Saidi, M. H. (2011). Application of heat
pipe heat exchangers in heating, ventilation and air conditioning (HVAC)
systems. Scientific Research and Essays, 6(9), pp. 1900-1908.
Ghali, K. (2008). Energy savings potential of a hybrid desiccant dehumidification air
conditioning system in Beirut. Energy Conversion and Management, 49(11),
pp. 3387-3390.
Ghasemkhani, M., & Naseri, F. (2008). Comparison of indoor air quality in
restaurant kitchens in Tehran with ambient air quality. Journal of
Environmental Health Science & Engineering, 5(1), pp. 59-64.

102
Guojie, Z., Chaoyu, Z., Guanghai, Y., & Wu, C. (2012). Development of a new
marine rotary desiccant air conditioning system and its energy consumption
analysis. Energy Procedia, 16, pp. 1095-1101.
Haines, R. W., & Myers, M. E. (2010). HVAC systems design handbook. McGraw-
Hill.
Halim, Z. A., & Man, M. S. (2006). Code of practice on energy efficiency and use of
renewable energy for non-residential buildings. 2001, pp. 1525
Harriman, L. G. (2002). The Dehumidification Handbook. Second Edition. Munters
Corporation.
Harriman III, L. G., Lstiburek, J., & Kittler, R. (2000). Improving humidity control
for commercial buildings. ASHRAE journal, 42(11), pp. 24.
Ismail, S. H., Deros, B. M., & Leman, A. M. (2010). Indoor air quality issues for
non-industrial work place. International Journal of Research and Reviews in
Applied Sciences, 5(3), pp. 235-244.
Jia, C. X., Dai, Y. J., Wu, J. Y., & Wang, R. Z. (2006). Analysis on a hybrid
desiccant air-conditioning system. Applied Thermal Engineering, 26(17), pp.
2393-2400.
Lstiburek, J. (2002). Relative humidity. Presented at Healthy Indoor Environments
(Austin TX).
Mandayo, Gemma García, et al.. (2015). System to control indoor air quality in
energy efficient buildings. Urban Climate, 14, pp. 475-485.
Masthiraj, N., Kumar, S., & Karthick, B. (2012). Energy Conservation in Air
conditioners. International Journal of Emerging Technology and Advanced
Engineering, 2(4), pp. 480–484.
Mathur, G. D. (2000). Controlling space humidity with heat-pipe heat exchangers.
In Energy Conversion Engineering Conference and Exhibit, 2000.(IECEC)
35th Intersociety. Vol. 2. pp. pp. 835-842.
Mazzei, P., Minichiello, F., & Palma, D. (2002). Desiccant HVAC systems for
commercial buildings. Applied Thermal Engineering, 22(5), pp. 545-560.
Mcquiston, Parker, & Spitler. (2011). Heating, Ventilating and Air Conditioning
Analysis and Design, 6th Edition. Wiley India Pvt. Limited.
Murphy, J. (2006). Smart dedicated outdoor air systems. ASHRAE Journal, 48(7), pp.
30.

103
Murphy, J. (2006). Temperature & humidity control in surgery rooms. ASHRAE
Journal, 48(6), pp. 18.
Nematchoua, M. K., Tchinda, R., Orosa, J. A., & Andreasi, W. A. (2015). Effect of
wall construction materials over indoor air quality in humid and hot
climate. Journal of Building Engineering, 3, pp. 16-23.
Saidi, M. H., & Vazirifard, S. (2007). Hybrid desiccant cooling systems. ASHRAE
Journal, 49(1), pp. 44.
Sayegh, M. A., Hammad, M., & Faraa, Z. (2011). Comparison of two methods of
improving dehumidification in air conditioning systems: Hybrid system
(refrigeration cycle –rotary desiccant) and heat exchanger cycle. Energy
Procedia, 6, pp. 759–768. Sekhar, S. C., & Tan, L. T. (2009). Optimization of
cooling coil performance during operation stages for improved humidity
control. Energy and Buildings, 41(2), pp. 229–233.
SMACNA, S. M. and A. C. C. N. A. (1998). Indoor Air Quality: A Systems
Approach. 3rd edition. Sheet Metal and Air Conditioning Contractors’ National
Association.
Sookchaiya, T., Monyakul, V., & Thepa, S. (2008). A study and development of
temperature and relative humidity control system in hospital buildings in
Thailand. EDU-COM International Conference Conferences.
Sookchaiya, T., Monyakul, V., & Thepa, S. (2010). Assessment of the thermal
environment effects on human comfort and health for the development of novel
air conditioning system in tropical regions. Energy and Buildings. 42(10). pp.
1692–1702.
Standard, A. S. H. R. A. E. (2010). 90.1 (2013) Energy Standard for Buildings
Except Low-Rise Residential Buildings. ASHRAE.
Yau, Y. H. (2008). The use of a double heat pipe heat exchanger system for reducing
energy consumption of treating ventilation air in an operating theatre—A full
year energy consumption model simulation. Energy and Buildings, 40(5), pp.
917–925.
Yau, Y. H., & Ahmadzadehtalatapeh, M. (2011). Predicting yearly energy recovery
and dehumidification enhancement with a heat pipe heat exchanger using
typical meteorological year data in the tropics. Journal of Mechanical Science
and Technology, 25(4), pp. 847–853.

104
Yau, Y. H., & Ng, W. K. (2011). A comparison study on energy savings and fungus
growth control using heat recovery devices in a modern tropical operating
theatre. Energy Conversion and Management, 52(4), pp. 1850–1860.
Zhang, L., & Lee, W. L. (2011). Evaluating the use heat pipe for dedicated
ventilation of office buildings in Hong Kong. Energy Conversion and
Management, 52(4), pp. 1983–1989.
Zhao, X., Li, Q., & Yun, C. (2006). Performance Test and Energy Saving Analysis of
a Heat Pipe Dehumidifier. HVAC Technologies for Energy Efficiency.
Ratlamwala, T. A. H., & Dincer, I. (2013). Efficiency assessment of key
psychometric processes. International journal of refrigeration, 36(3), 1142-
1153.
Poku, R., & Ogbonnaya, E. A. (2014). Effects of Evaporative Cooling on the
Performance of a Gas Turbine Plant Operating in Bayelsa State,
Nigeria. International Journal of Engineering and Technology, 4(8).
Lee, T., Lee, D., Jeong, H., & Chung, H. (2015). The theoretical analysis of the Fog
removal in the LNG Ambient Vaporizer. In IOP Conference Series: Materials
Science and Engineering Vol. 88(1), pp. 012018
Koçak Soylu, S., Atmaca, İ., & Doğan, A. (2016). Investigation of Evaporative
Cooling Effectiveness on the Performance of Air-Cooled Chillers. Turkish
Online Journal of Science & Technology, 6(3).
Enggsa, Z. M., Rachman, A., Suyono, T., Mehdi, M., Mat, S., & Sopian, K. (2014).
Theoretical and experimental analysis of desiccant wheel performance for solar
hybrid desiccant air-conditioning system. In Advanced Materials Research,
Vol. 875, pp. 1888-1894
Palmiste, Ü., & Voll, H. (2016). Free cooling potential of airside economizer in
Estonia. Science and Technology for the Built Environment, 00-00.
Mu, B., Li, Y., House, J. M., & Salsbury, T. I. (2016). Experimental evaluation of
anti-windup extremum seeking control for airside economizers. Control
Engineering Practice, 50, pp. 37-47.
Yan, B., Li, X., Malkawi, A. M., & Augenbroe, G. (2016). Quantifying uncertainty
in outdoor air flow control and its impacts on building performance simulation
and fault detection. Energy and Building