HUAWEINVETM Huawei Investment & Holding Co., Ltd. · Huawei unveiled the industry’s first 400G...
122
Huawei Investment & Holding Co., Ltd. 2012 Annual Report
Transcript of HUAWEINVETM Huawei Investment & Holding Co., Ltd. · Huawei unveiled the industry’s first 400G...
Copyright © 2013 HUAWEI INVESTMENT & HOLDING CO., LTD. All Rights Reserved.
100%
GENERAL DISCLAIMER
Printed on environmentally friendly paper.
post-consumer content, acid-free & chlorine free paper.
THE INFORMATION IN THIS DOCUMENT MAY CONTAIN PREDICTIVE STATEMENTS INCLUDING, WITHOUT LIMITATION,
STATEMENTS REGARDING THE FUTURE FINANCIAL AND OPERATING RESULTS, FUTURE PRODUCT PORTFOLIO, NEW
TECHNOLOGY, ETC. THERE ARE A NUMBER OF FACTORS THAT COULD CAUSE ACTUAL RESULTS AND DEVELOPMENTS
TO DIFFER MATERIALLY FROM THOSE EXPRESSED OR IMPLIED IN THE PREDICTIVE STATEMENTS. THEREFORE, SUCH
INFORMATION IS PROVIDED FOR REFERENCE PURPOSE ONLY AND CONSTITUTES NEITHER AN OFFER NOR AN
ACCEPTANCE. HUAWEI MAY CHANGE THE INFORMATION AT ANY TIME WITHOUT NOTICE.
HU
AW
EI INV
ESTMEN
T & H
OLD
ING
CO
., LTD.
AN
NU
AL REPO
RT 2012
Huawei Investment & Holding Co., Ltd.
2012 Annual Report
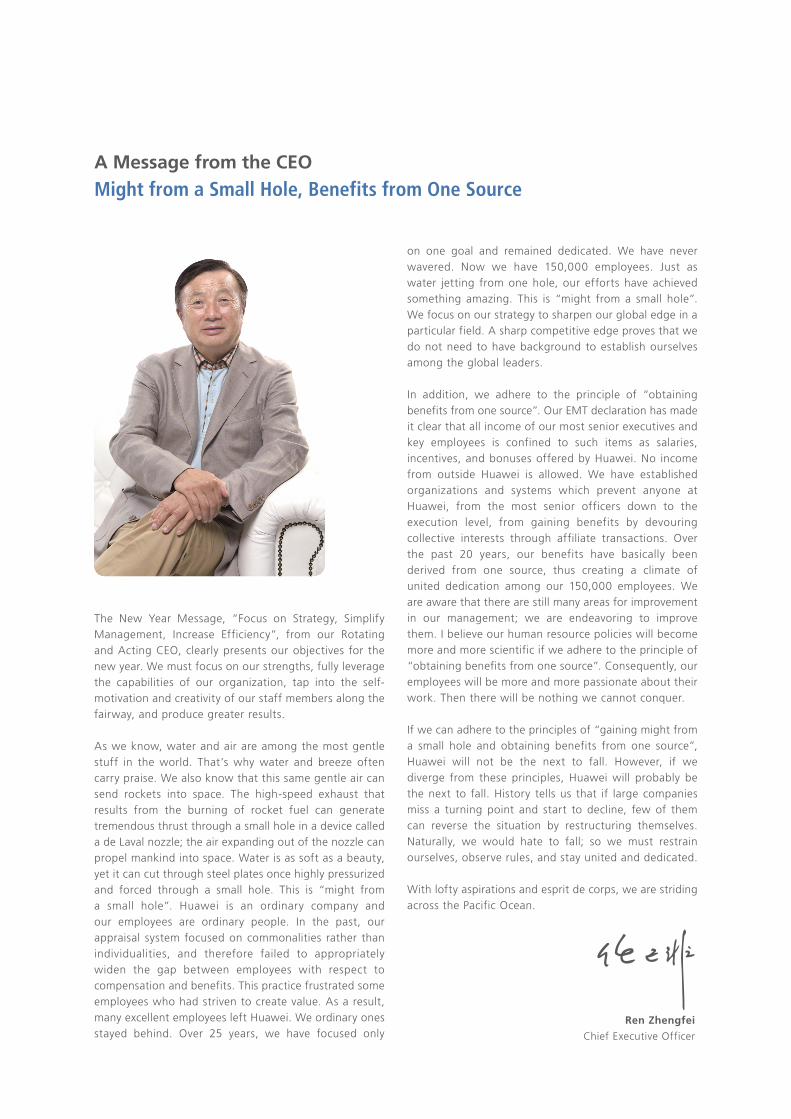
A Message from the CEOMight from a Small Hole, Benefits from One Source
on one goal and remained dedicated. We have never wavered. Now we have 150,000 employees. Just as water jetting from one hole, our efforts have achieved something amazing. This is “might from a small hole”. We focus on our strategy to sharpen our global edge in a particular field. A sharp competitive edge proves that we do not need to have background to establish ourselves among the global leaders.
In addition, we adhere to the principle of “obtaining benefits from one source”. Our EMT declaration has made it clear that all income of our most senior executives and key employees is confined to such items as salaries, incentives, and bonuses offered by Huawei. No income from outside Huawei is allowed. We have established organizations and systems which prevent anyone at Huawei, from the most senior officers down to the execution level, from gaining benefits by devouring collective interests through affiliate transactions. Over the past 20 years, our benefits have basically been derived from one source, thus creating a climate of united dedication among our 150,000 employees. We are aware that there are still many areas for improvement in our management; we are endeavoring to improve them. I believe our human resource policies will become more and more scientific if we adhere to the principle of “obtaining benefits from one source”. Consequently, our employees will be more and more passionate about their work. Then there will be nothing we cannot conquer.
If we can adhere to the principles of “gaining might from a small hole and obtaining benefits from one source”, Huawei will not be the next to fall. However, if we diverge from these principles, Huawei will probably be the next to fall. History tells us that if large companies miss a turning point and start to decline, few of them can reverse the situation by restructuring themselves. Naturally, we would hate to fall; so we must restrain ourselves, observe rules, and stay united and dedicated.
With lofty aspirations and esprit de corps, we are striding across the Pacific Ocean.
Ren Zhengfei
Chief Executive Officer
The New Year Message, “Focus on Strategy, Simplify Management, Increase Efficiency”, from our Rotating and Acting CEO, clearly presents our objectives for the new year. We must focus on our strengths, fully leverage the capabilities of our organization, tap into the self-motivation and creativity of our staff members along the fairway, and produce greater results.
As we know, water and air are among the most gentle stuff in the world. That’s why water and breeze often carry praise. We also know that this same gentle air can send rockets into space. The high-speed exhaust that results from the burning of rocket fuel can generate tremendous thrust through a small hole in a device called a de Laval nozzle; the air expanding out of the nozzle can propel mankind into space. Water is as soft as a beauty, yet it can cut through steel plates once highly pressurized and forced through a small hole. This is “might from a small hole”. Huawei is an ordinary company and our employees are ordinary people. In the past, our appraisal system focused on commonalities rather than individualities, and therefore failed to appropriately widen the gap between employees with respect to compensation and benefits. This practice frustrated some employees who had striven to create value. As a result, many excellent employees left Huawei. We ordinary ones stayed behind. Over 25 years, we have focused only
Contents
Letter from the Rotating and Acting CEO
Business Highlights in 2012
Five-Year Financial Highlights
Letter from the Chairwoman
Brand Promise and Brand Attributes
Management Discussion and Analysis
Market Trends
Independent Auditor’s Report
Consolidated Financial Statements Summary and Notes
Company Information
Risk Factors
Corporate Governance Report
Sustainable Development
Abbreviations, Financial Terminology, and Exchange Rates
1
3
4
5
7
8
32
36
37
80
82
84
104
116
Letter from the Rotating and Acting CEO
Letter from the Rotating and Acting CEO1
The ubiquity of broadband networks and services, the massive number of applications that result in instantaneousness and fragmentation of information, and the demand of device users for a personalized experience combine to present a series of challenges and opportunities to the Information and Communications Technology (ICT) industry. By focusing on the pipe business and effectively improving operations quality, Huawei achieved CNY220.2 billion (US$35.35 billion) in sales revenue and CNY15.38 billion (US$2.47 billion) in net profit in fiscal year 2012, steadily increasing operating performance.
Our Carrier Network Business Group (BG) further consolidated its position in the industry: Our wireless business maintained steady growth. Our fixed network products and solutions have been deployed by most carriers worldwide. Our routers continued to hold an advantage in the carrier market. Additionally, our optical transport and optical access products further established their leadership positions. We launched SoftCOM, the industry’s first software-defined networking (SDN) technology architecture in end-to-end carrier
networks. Our carrier software business continued to grow rapidly. Our SmartCare service redefined industry standards for customer experience management (CEM) and comprehensively enhanced user-experience-driven solution capabilities.
Our Enterprise BG launched competitive data center switches, storage products, panoramic telepresence, and other solutions. Our Consumer BG built a solid foundation on product design, quality, and cost. In the fourth quarter of 2012, we entered the list of the world’s top three smartphone makers for the first time. At present, our products serve more than three billion people around the globe.
As communications become an integral part of life, we believe that demand for communications is not closely related to economic cycles and is only moderately impacted by the financial crisis. The reason is that communications services are characterized by small-money consumptions and the communications market is fully competitive. As pipes carry heavy traffic, we deploy products and solutions by focusing on information transmission,
By focusing on the pipe business and effectively improving operations quality, Huawei achieved CNY220.2 billion (US$35.35 billion) in sales revenue and CNY15.38 billion (US$2.47 billion) in net profit in fiscal year 2012, steadily increasing operating performance.
Letter from the Rotating and Acting CEO 2
forwarding, storage, processing, acquisition, and presentation. Providing user experience characterized by high bandwidths, multiple services, and zero wait time is our mission and responsibility. We will continue to increase strategic investments in the pipe business. Our aim is to make information pipes “wider, faster, and larger” and develop Huawei into one of the great companies that lead the ICT industry.
As we seek effective business growth, we expect that Huawei, a company with 150,000 employees, will continue to be the preferred partner of our customers. “Gaining might from a small hole” is a principle which affirms our customer-centricity and guides us to always focus on external customers for our growth. “Obtaining benefits from one source” is a principle which places focus on high-performing employees, and guides us to adjust internal relationships and determine who we count on for corporate development. By attempting to invert our performance appraisal mechanism in 2012, we delegated the decision-making authority to customer-facing roles and field offices, and allowed them to obtain and share benefits based on their performance, instead of granting benefits top-down. In 2013, we will further simplify management, and encourage outstanding managers and teams to assume greater responsibilities; accordingly, we will provide them with more opportunities and enable them to earn more rewards. In addition, we will continue to reduce internal operating cost and strive to further improve operational efficiency.
Outstanding corporate performance is built on extraordinary leadership and the ability to develop an excellent management team. One of the significant challenges we face is to develop globalization capabilities that are aligned with our global business growth while having the capacity to supervise operations in regional markets. We need more managers who have a global vision, regardless of their nationality or background. To that end, we must establish systems that can identify and deploy talent worldwide. Narrowing
the scope of our strategy and focusing on the pipe business will help improve our global competitiveness.
We fully assume our responsibility globally as a corporate citizen while proactively responding to concerns and needs of all stakeholders, including customers and governments. In 2012, we released Huawei Cyber Security White Paper, which inspires thought and discussion about the nature of cyber security. We will strive to ensure the stable and secure operations of customer networks and businesses. We will further increase openness and transparency, and actively communicate with others. We will integrate more proactively into the local communities in which we operate, create more jobs, and contribute more taxes. All these efforts will help boost the competitiveness, economy, and prosperity of local communities.
The responsibility of our management team is to maintain the health and vitality of our company. In the past year, we encountered many challenges. Our good performance would have been impossible if not for the trust and support from our customers and partners as well as the wisdom and courage of our staff. I would like to express my sincere gratitude to all of them. Looking ahead, we are confident in the prospects of the ICT industry despite much uncertainty in the macroeconomic environment and increasingly intense competition in the industry. We will continue to focus on the information pipe business, simplify internal management, and continuously improve efficiency and performance. In 2013, we will continue to maintain our business growth momentum and create a bright future with our customers and partners around the world!
Guo PingRotating and Acting CEO
Business Highlights in 2012
Business Highlights in 20123
Continuously promoting globalized operations
In 2012, Huawei stepped up its investments in Europe. We invested more in the UK, established a new R&D center in Finland, and set up local boards of directors (BODs) and advisory boards in France and the UK.
Being open and cooperative and innovating continuously
Huawei established the 2012 Laboratories with a focus on making continuous investments in key ICT fields. We are dedicated to providing broader, smarter, and more energy-efficient pipes while working closely with partners from the industry, academia, and research institutes. Our goal is to take the lead in research, innovation, and implementation of future networks.
Focusing on sustainable development
To proactively promote sustainable social and economic development, Huawei focused on implementing four strategies: bridging the digital divide; safeguarding the stable and secure operations of customer networks; promoting environmental protection; and achieving win-win developments.
Laying the foundation for future ultra-broadband transmission with 400G
Huawei unveiled the industry’s first 400G dense wavelength division multiplexing (DWDM) optical transport system, setting a new record for WDM transmission capacity. Huawei also launched its 480G line card that has the industry’s largest capacity in the IP field.
Leading transformations in the cloud era
Huawei partnered with customers in 33 countries in cloud computing and built the world’s largest desktop cloud, which is used by approximately 70,000 employees for work every day. Of the 260 data centers Huawei has delivered, 35 are cloud-based. In addition, Huawei’s storage solutions serve more than 2,000 customers across all industries worldwide.
Delivering the inspired experience in smart devices
Huawei further sharpened its competitive edge in smart devices. In 2012, the sales of Huawei’s middle-range and high-end flagship smartphones, such as the Ascend P1, Ascend D1 Quad, and Honor, soared in developed countries. The company successfully shifted from its role as an original design manufacturer (ODM) to its own brand.
Building service value
Huawei continued to strengthen the competitiveness of its service solutions. Over the past seven years, the compound annual growth rate (CAGR) of Huawei’s managed services exceeded 70%, making Huawei the fastest-growing managed services provider in the world. In the customer experience management (CEM) field, the HUAWEI SmartCare CEM solution was extended from Per Service Per User (PSPU) Service Quality Management (SQM) to holistic customer experience management and continued to strengthen its leadership in the industry.
Five-Year Financial Highlights
Five-Year Financial Highlights 4
CNY Million2012
(USD Million)*2012 2011 2010 2009 2008
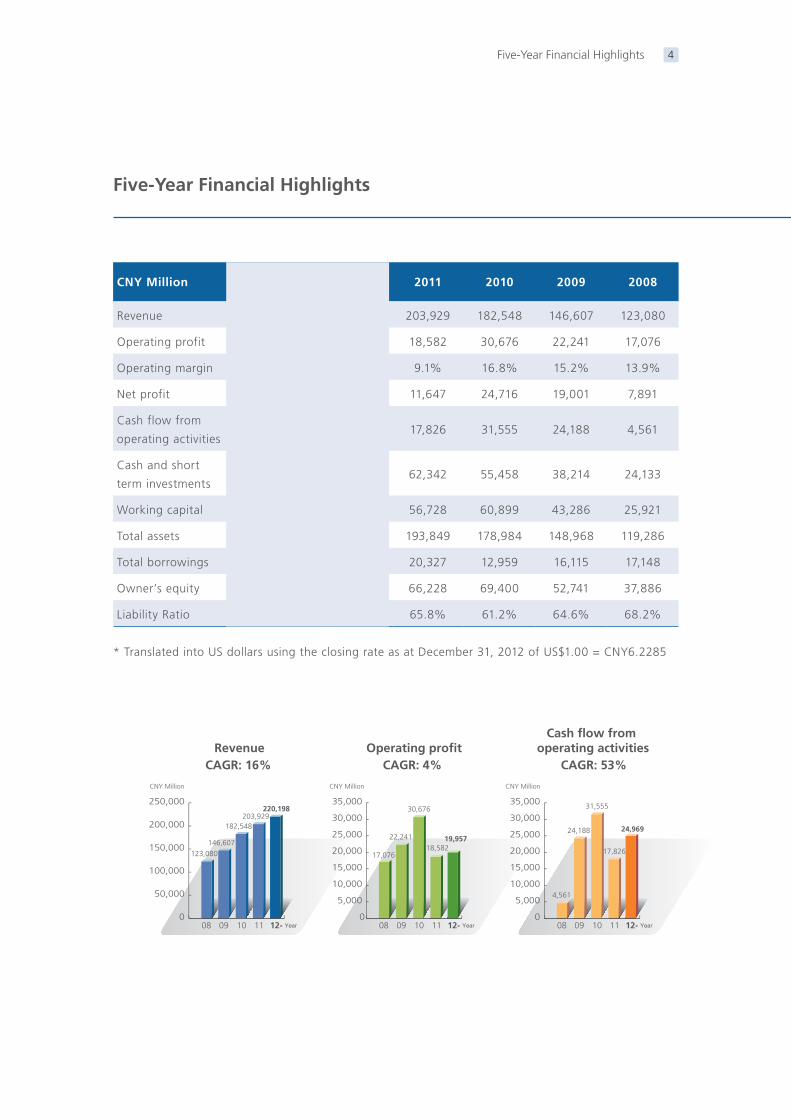
Revenue 35,353 220,198 203,929 182,548 146,607 123,080
Operating profit 3,204 19,957 18,582 30,676 22,241 17,076
Operating margin 9.1% 9.1% 9.1% 16.8% 15.2% 13.9%
Net profit 2,469 15,380 11,647 24,716 19,001 7,891
Cash flow from
operating activities4,009 24,969 17,826 31,555 24,188 4,561
Cash and short
term investments11,503 71,649 62,342 55,458 38,214 24,133
Working capital 10,155 63,251 56,728 60,899 43,286 25,921
Total assets 33,717 210,006 193,849 178,984 148,968 119,286
Total borrowings 3,332 20,754 20,327 12,959 16,115 17,148
Owner’s equity 12,045 75,024 66,228 69,400 52,741 37,886
Liability Ratio 64.3% 64.3% 65.8% 61.2% 64.6% 68.2%
* Translated into US dollars using the closing rate as at December 31, 2012 of US$1.00 = CNY6.2285
CAGR: 16%Revenue Operating profit
Cash flow from operating activities
123,080
146,607
182,548203,929
220,198
CNY Million CNY Million CNY Million
08 09 10 11 12-0
50,000
100,000
150,000
200,000
250,000
CAGR: 4%
17,076
22,241
30,676
18,58219,957
08 09 10 11 12-0
5,000
10,000
15,000
20,000
25,000
30,000
35,000
CAGR: 53%
4,561
24,188
31,555
17,826
24,969
08 09 10 11 12-0
5,000
10,000
15,000
20,000
25,000
30,000
35,000
Letter from the Chairwoman
Letter from the Chairwoman5
The world today is experiencing an unprecedented rate of change. Network connection and information acquisition have become integral to our life and work. The ICT industry is still innovating rapidly. New trends such as mobility, cloud computing, Big Data, and social networking are guiding this industry towards a new landscape. In addition, significant digitalization changes are taking place in the real world. The Internet of Things, e-Commerce, and digital media among others are driving the upgrading and restructuring of traditional industries. Consequently, the deep integration of the data world represented by the ICT industry with the physical world represented by traditional industries is not only energizing global economic development; it has also significantly changed the ways we live and work. A digital society comprised of digital citizens and digital enterprises is taking shape. These trends will surely lead both ICT and social transformations.
Based on our insights into future trends, Huawei is committed to helping customers build an increasingly efficient and integrated information logistics system to connect people to people, people to things, and things to things, thus enabling people to communicate and share ideas freely. Through solid connections between people and things, ideas flourish; we constantly inject vitality into our vision, inspire innovations, promote the continued evolution of scientific technologies, the industry, and the ways people interact with each other, and thus we create a better world.
We know that networks have made it possible for people in different regions to have fair opportunities for development. However, the world has long been dogged by network operations stability and security challenges. All network equipment providers have the ultimate social responsibility of responding quickly to
The ICT industry is still innovating rapidly. New trends such as mobility, cloud computing, Big Data, and social networking are guiding this industry towards a new landscape. In addition, significant digitalization changes are taking place in the real world. The Internet of Things, e-Commerce, and digital media among others are driving the upgrading and restructuring of traditional industries.
Letter from the Chairwoman 6
ensure stable network operations, particularly when disasters such as earthquakes, tsunamis, plagues, radioactive contamination, or military conflicts strike. This is the commitment we have extended to our customers over the years. In 2012, we released Huawei Cyber Security White Paper globally, calling on all stakeholders, including governments and industries, to become aware that cyber security is a global issue and needs to be addressed through risk-based approaches, best practices, and enhanced international cooperation.
As a responsible corporate citizen, we have been cooperating closely with stakeholders. We proactively contribute to sustainable socio-economic development through four initiatives: bridging the digital divide, safeguarding stable and secure network operations, promoting environmental protection, and achieving win-win development. Of particular significance, we continue to strengthen localized operations to help boost local employment and economic development.
Huawei is always open and cooperative, and enthusiastically contributes to industry development. We now hold over 180 positions in more than 150 standards organizations. We respect the intellectual property rights of others while accumulating intellectual property of our own. Every year, we pay about US$300 million in patent royalties to other companies in the industry in exchange for the use of their patented technologies.
In the past year, our Board of Directors (BOD) and its committees reviewed and approved the company’s medium-to-long-term business plan,
the annual business plan and budget, quarterly operational performance reports, corporate governance structure and organization building, business ecosystem building, appointments and compensation policies for senior management, and other major HR and financial policies and activities. In addition, the company fully implemented the rotating CEO system under the leadership of the BOD. As the corporate officer ultimately responsible for operations and crisis management during their tenure, the rotating and acting CEO primarily focuses on the company’s survival, operations, and development. Through a management mechanism covering everything from strategy formulation to strategy execution, the rotating CEO system manages and monitors the company’s business operations. Gradually, the company will shift its focus from the annual business plan to the medium-to-long-term strategic plan.
In closing, I would like to extend my gratitude to all staff members and their loved ones, customers, partners, and industry organizations worldwide. As we move forward, let’s join hands to create a world with infinite opportunities and possibilities.
Sun YafangChairwoman of the Board

Brand Promise and Brand Attributes
Brand Promise and Brand Attributes7
Our Enduring Brand Promise
Enriching life and improving efficiency through a better connected world.
GlobalWe operate on the world stage so that we can provide the best locally. We are actively engaged in communities; we learn from local cultures, recruit and develop local talent, partner with local suppliers, and customize our offerings for local tastes and needs.
OpenWe are active listeners and contributors internally and externally. We always bring a unique point of view, listen to others’ suggestions for how we can improve, and share knowledge and insights to help the industry and key stakeholders evolve and grow.
TrustedWe say what we do and do what we say, delivering on the promises we make to our customers and partners. We respect fair business practices and maintain the highest standards of information integrity and security. As a responsible corporate citizen, we actively promote the sustainable development of society, the economy, and the environment.
Our Brand Attributes
Customer-centricWe keep an unwavering focus on our customers, partnering with them and committing ourselves to meet their goals and needs. We rely on deep customer insights and continuous feedback to guide our priorities and influence the way we work.
DedicatedWe are passionate about the success of our customers, making every effort to meet our commitments. We measure our work against how much value we bring to customers. We strive to continuously improve ourselves, building our capabilities, our knowledge base, and our expertise.
InnovativeWe proactively anticipate future trends and customer needs. Continuous innovation puts us directly on the cutting edge of technology. We generate new value through smart design and the integration of our products, services, and experiences.
Management Discussion and Analysis
Management Discussion and Analysis 8
Agile Innovation
Our Value Propositions
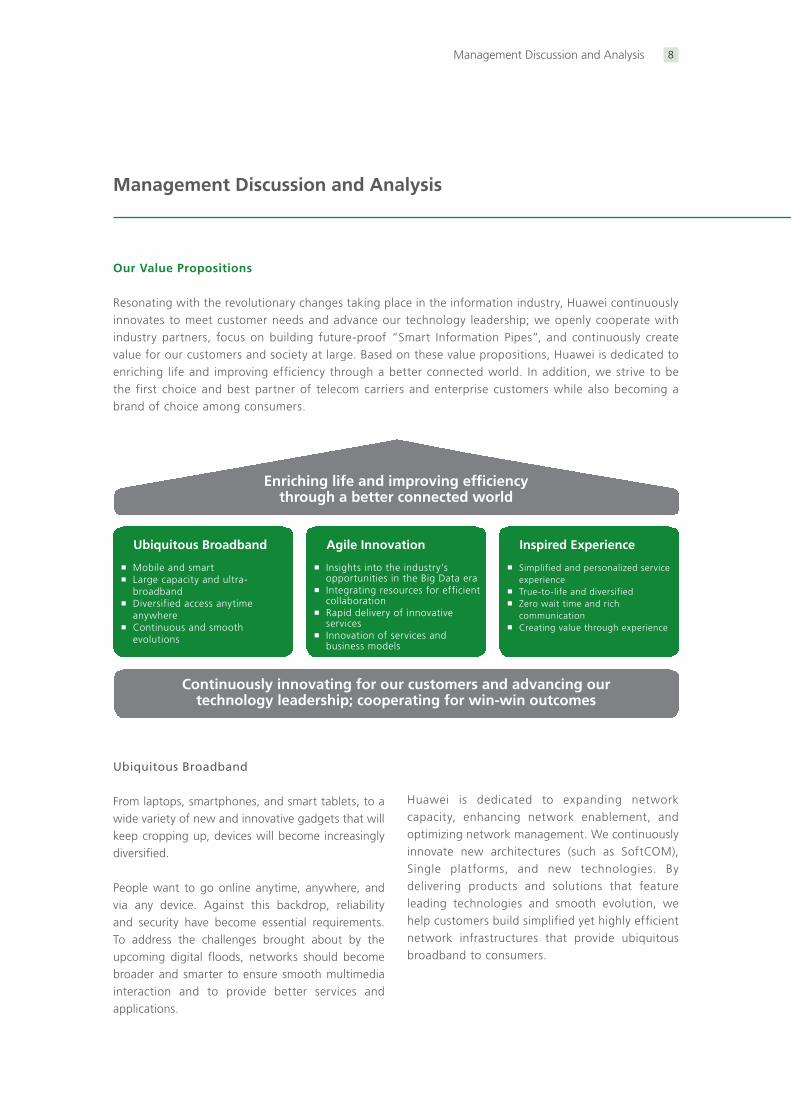
Resonating with the revolutionary changes taking place in the information industry, Huawei continuously innovates to meet customer needs and advance our technology leadership; we openly cooperate with industry partners, focus on building future-proof “Smart Information Pipes”, and continuously create value for our customers and society at large. Based on these value propositions, Huawei is dedicated to enriching life and improving efficiency through a better connected world. In addition, we strive to be the first choice and best partner of telecom carriers and enterprise customers while also becoming a brand of choice among consumers.
Enriching life and improving efficiency through a better connected world
Ubiquitous Broadband
Mobile and smart Large capacity and ultra-
broadband Diversified access anytime
anywhere Continuous and smooth
evolutions
Continuously innovating for our customers and advancing ourtechnology leadership; cooperating for win-win outcomes
Insights into the industry’s opportunities in the Big Data era
Integrating resources for efficient collaboration
Rapid delivery of innovative services
Innovation of services and business models
Simplified and personalized service experience
True-to-life and diversified Zero wait time and rich
communication Creating value through experience
Inspired Experience
Ubiquitous Broadband
From laptops, smartphones, and smart tablets, to a wide variety of new and innovative gadgets that will keep cropping up, devices will become increasingly diversified.
People want to go online anytime, anywhere, and via any device. Against this backdrop, reliability and security have become essential requirements. To address the challenges brought about by the upcoming digital floods, networks should become broader and smarter to ensure smooth multimedia interaction and to provide better services and applications.
Huawei is dedicated to expanding network capacity, enhancing network enablement, and optimizing network management. We continuously innovate new architectures (such as SoftCOM), Single platforms, and new technologies. By delivering products and solutions that feature leading technologies and smooth evolution, we help customers build simplified yet highly efficient network infrastructures that provide ubiquitous broadband to consumers.
Management Discussion and Analysis9
Agile Innovation
The ICT industry is still innovating rapidly. New trends such as mobility, cloud computing, Big Data, and social networking are guiding this industry towards a new landscape. In addition, significant digitalization changes are taking place in the real world. The Internet of Things, e-Commerce, and digital media among others are driving the upgrading and restructuring of traditional industries.
Enterprises in various industries need to strengthen their information analysis capabilities, rapidly gain an insight into opportunities, continuously enhance organizational collaboration, and launch new products and services into the marketplace in a better and faster way.
Huawei provides data center infrastructure solutions based on cloud computing to help customers improve the utilization of their storage and computing resources and provides unified communications and Bring Your Own Device (BYOD) solutions to help customers improve work efficiency and reduce operating costs, thereby achieving operational excellence and continuously making business and service innovations.
Inspired Experience
To learn, work, entertain, and live more conveniently, people expect services to be simple, easy to use, and true to life, with zero wait time.
Huawei will strengthen its research in such areas as video, audio, touch control, image processing, and emotional experience algorithms, promote user centric design (UCD), and provide users with a collaborative and consistent experience across screens. In addition, we will provide high-quality and easy-to-maintain products as well as personalized business support systems (BSSs) and operation support systems (OSSs). We will also build a supply chain that is visible to customers, and enable user-friendly and convenient transaction and delivery processes.
The innovative technologies Huawei introduces allow people around the world to communicate and share more freely, reap the benefits of technological progress, and enjoy the inspired experience.
Management Discussion and Analysis 10
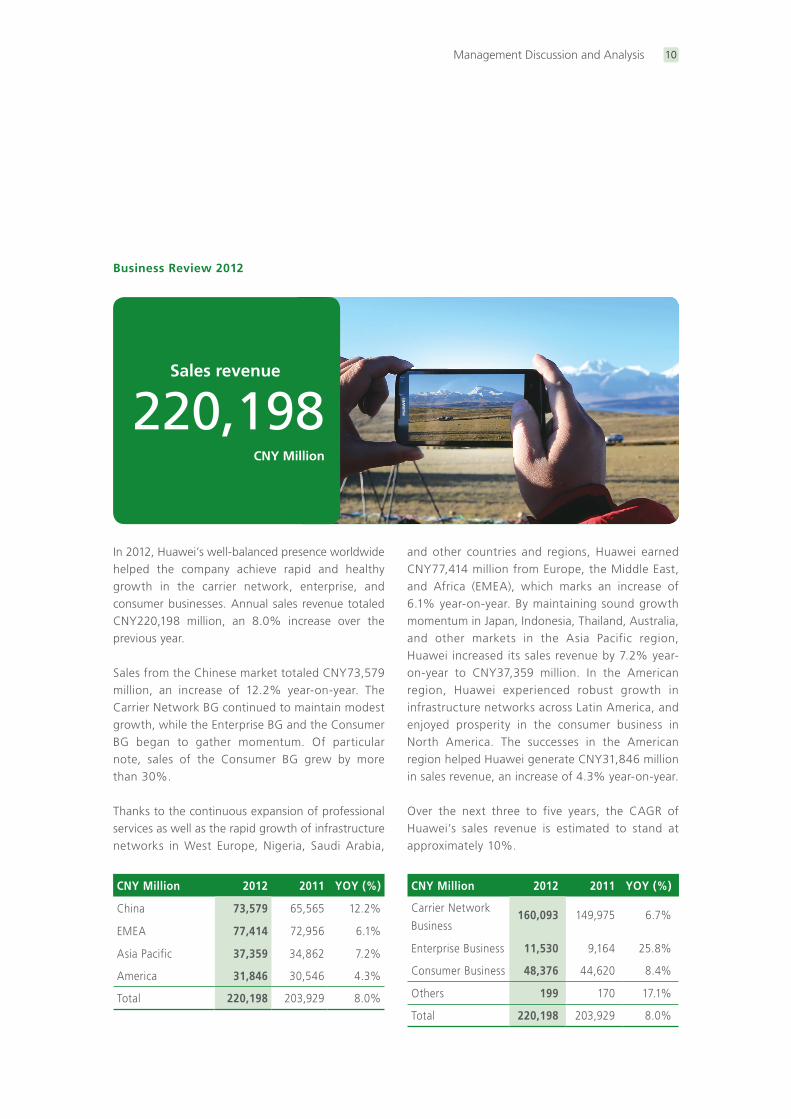
220,198Sales revenue
CNY Million
Business Review 2012
In 2012, Huawei’s well-balanced presence worldwide helped the company achieve rapid and healthy growth in the carrier network, enterprise, and consumer businesses. Annual sales revenue totaled CNY220,198 million, an 8.0% increase over the previous year.
Sales from the Chinese market totaled CNY73,579 million, an increase of 12.2% year-on-year. The Carrier Network BG continued to maintain modest growth, while the Enterprise BG and the Consumer BG began to gather momentum. Of particular note, sales of the Consumer BG grew by more than 30%.
Thanks to the continuous expansion of professional services as well as the rapid growth of infrastructure networks in West Europe, Nigeria, Saudi Arabia,
and other countries and regions, Huawei earned CNY77,414 million from Europe, the Middle East, and Africa (EMEA), which marks an increase of 6.1% year-on-year. By maintaining sound growth momentum in Japan, Indonesia, Thailand, Australia, and other markets in the Asia Pacific region, Huawei increased its sales revenue by 7.2% year-on-year to CNY37,359 million. In the American region, Huawei experienced robust growth in infrastructure networks across Latin America, and enjoyed prosperity in the consumer business in North America. The successes in the American region helped Huawei generate CNY31,846 million in sales revenue, an increase of 4.3% year-on-year.
Over the next three to five years, the CAGR of Huawei’s sales revenue is estimated to stand at approximately 10%.
CNY Million 2012 2011 YOY (%)
China 73,579 65,565 12.2%
EMEA 77,414 72,956 6.1%
Asia Pacific 37,359 34,862 7.2%
America 31,846 30,546 4.3%
Total 220,198 203,929 8.0%
CNY Million 2012 2011 YOY (%)
Carrier Network
Business160,093 149,975 6.7%
Enterprise Business 11,530 9,164 25.8%
Consumer Business 48,376 44,620 8.4%
Others 199 170 17.1%
Total 220,198 203,929 8.0%
Management Discussion and Analysis11
Carrier Network Business
Over the past year, the telecom industry has experienced numerous challenges. Despite these challenges, Huawei maintained its leading market position in the carrier network field, with CNY160,093 million in sales revenue, an increase of 6.7% year-on-year.
Huawei’s share in the wireless network market experienced steady growth, with over 500 carriers worldwide deploying its wireless products. Huawei provides a full portfolio of GSM, UMTS, CDMA, TD-SCDMA, and LTE solutions, and has deployed 170 SingleRAN commercial networks worldwide, all of which support the evolution towards LTE. 139 carriers have launched or will soon launch LTE services into commercial use. In the fixed network field, technological and commercial innovations are being implemented in unison. By unveiling the industry’s first 480G line card for backbone routers, Huawei led the development of routing technologies. Huawei also maintained its leading position in offering broadband network gateway (BNG), LTE, and IP mobile backhaul solutions for multi-service support over metropolitan area networks (MANs). In the transport field, Huawei was awarded more than fifty 100G commercial contracts. Huawei’s market share in the carrier software and core network business has continued to rise. More than 150 mobile broadband (MBB) carriers around the world have adopted Huawei’s Value Growth Solution (VGS). Our BSS solution has been deployed by customers such as Vodafone, H3G in the UK, Telenor, and KPN. Services are heavily emphasized by Huawei in its cooperation with carriers. Huawei’s professional service solutions have been used by 45 of the world’s top 50 carriers and are deployed in more than 140 countries, serving one-third of the world’s population. In the European market, Huawei provides managed services for carriers in the UK, Spain, Germany, Italy, and Switzerland.
The industry constantly strives to reduce equipment and network deployment costs while offering a rich array of new services on a timely basis and innovating profit models. To meet the new requirements and challenges for ICT convergence and transformation, Huawei proposed the SoftCOM strategy geared towards future network architectures. Based on the concepts of network-level cloudization, equipment-level cloudization, Internet-oriented operations, and Network as a Service (NaaS), this strategy incorporates cloud computing and software defined networking (SDN) into telecom networks. From the architecture perspective, our strategy also makes it possible to effectively control costs, rapidly deliver new services, and enable a smooth evolution, thereby ushering in the ICT convergence era.
Wireless Networks
Sales revenue from our wireless network equipment totaled CNY49,837 million in 2012.
People’s lives continue to significantly benefit from the rapid development of mobile communications technologies. Looking at recent trends, Huawei sees that smart device penetration growth is continuing unabated, the diversity of innovative mobile applications is rapidly increasing, and industrywide development towards a thriving machine-to-machine (M2M) ecosystem is helping realize truly ubiquitous global connectivity amid explosive growth in data traffic. Huawei believes the total mobile market will reach US$2 trillion by 2020—more than double the total market in 2012. This is made possible by advances in ultra-broadband technologies that support on-demand customer innovations.
Huawei was the first to propose evolution from distributed base stations to the SingleRAN platform, which is now an industry standard and
helps carriers deploy new network technologies
Management Discussion and Analysis 12
that significantly reduce total cost of ownership
(TCO) while supporting on-demand network
expansion. Originally, Huawei focused only on
reducing TCO, but now with SoftMobile, the focus
has shifted to improving total value of ownership
(TVO) while reducing TCO.
SoftMobile is an end-to-end MBB business solution
based on the commercially successful SingleRAN
platform and provides future mobile networks
with three key features: Broadband, Orchestration,
and On-Demand. SoftMobile delivers new and
innovative business opportunities for mobile
network carriers amid the exponential growth of
smart devices. This is made possible by providing
carriers with the ability to expand broadband
capacity, improve multi-Radio Access Technology
(RAT), multi-band and multi-layer coordination,
and improve user experience while maintaining the
relation between cost and revenue.
By the end of 2012: Huawei had deployed more
than 500 wireless networks, serving more than
two billion subscribers worldwide; Huawei had
won 139 LTE and 80 EPC commercial contracts,
of which 73 LTE and 59 EPC networks had been
commercially launched; Huawei LTE/EPC networks
had been deployed in 68 capital cities worldwide;
Huawei had deployed a total of 270 commercial
UMTS networks, and 39 of the total 270 UMTS
networks have been upgraded to support Dual-
Carrier HSPA+ for peak data rates of 42 Mb/s;
Huawei had deployed 170 commercial SingleRAN
networks worldwide, all of which support
evolution towards LTE.
Huawei has been awarded the most LTE and
LTE-Advanced standard patents. Huawei has
contributed 20% of all approved standards
applications for 3GPP LTE Core Specifications
(RAN1-RAN3). As of Q4 2012, Huawei had
submitted more than 10,884 LTE/EPC standards
applications to 3GPP. Huawei holds chairperson,
vice chairperson, director, and work group
leader positions for more than 150 standards
organizations.
Huawei remains commit ted to the spir it of
innovation, which has driven the development of
cutting-edge solutions, SoftMobile being the most
recent example. Huawei will continue to invest in
forward-looking technologies and standards that
support on-demand, orchestrated, and ocean-like
MBB networks; our aim is to grow and develop
an open, harmonious, and flourishing mobile
ecosystem with our industry chain partners.
Fixed Networks
Sales revenue from our fixed network equipment
totaled CNY48,452 million in 2012.
With rapid developments in cloud computing and
OTT video services, applications are migrating to
the cloud, per capita bandwidth consumption is
swinging upwards, and digital floods are starting
to form huge swells. Huawei advocates a digital
lifestyle characterized by “broadband inclusion
for all” and is dedicated to providing consistent
customer experience on services that require zero
wait time and are available anytime, anywhere.
In addition, Huawei adheres to the Pipe Strategy
and strives to build ubiquitous ultra-broadband
networks as wide as the Pacific Ocean, thereby
enabling connectivity possibilities for the entire
society and considerably enriching life through
communication.
In the next-generation network technology
field, Huawei was the first to propose the E2E
Carrier SDN architecture, for which it has already
unveiled prototypes. These prototypes included
Management Discussion and Analysis13
the industry’s first broad network controller to
control hybrid SDN networking, the industry’s first
SDN-based BNG, the industry’s first optical line
terminal (OLT) integrated with an SDN controller,
and the industry’s first transport network SDN
controller. With the Carrier SDN architecture,
carriers are equipped with a simple, agile, resilient,
and value-added network.
In the carrier IP network field, Huawei unveiled
the industry’s first 480G line card for backbone
routers, demonstrating that the company is
already at the forefront of the IP field in terms
of core routing technologies. In addition, Huawei
launched the world’s first 10GE LTE base station
routers that help carriers successfully deploy
LTE networks and efficiently transport mobile
data services. In the field of optical transport
networks (OTNs), Huawei was the first to release
400G and 2T WDM prototypes, gearing up for
ultra-broadband transmission in the future. The
Petabit Packet Cross Connect (PPXC), an all-optical
switch prototype Huawei demonstrated at the
Optical Fiber Communication (OFC) Conference
and Exposition 2012, was applauded as the
most innovative and outstanding prototype in
the industry. In the microwave field, Huawei’s
second-generation E-Band technology for carrier
LTE bearer networks leads the IP microwave
industry in terms of concept, technology, market
testing, and commercial use. In the FTTx access
network field, Huawei continued to promote the
maturity of 40G TWDM PON and G.fast standards
and lead the way into the GE era. Large-scale
commercial use of Vectoring technology became
a reality. In the optical distribution network
(ODN) field, Huawei established the intelligent
optical distribution network (iODN) industry
and developed the L.64 industry standards on
iODN. These standards were approved at the
Telecommunication Standardization Sector of the
International Telecommunication Union (ITU-T). In
the OSS and service field, Huawei set up the Global
Network Evolution and Experience Center (GNEEC).
The center focuses on ensuring the smooth
evolution of customer networks and showcases
Huawei’s world-leading service experience and
expertise. The recently launched Huawei uTraffic,
a network traffic analysis system, leveraged
innovative technologies and leading platforms to
support traffic and bandwidth operations. This
traffic analysis system is well positioned to help
carriers provide efficient services, increase revenue,
and improve their profitability.
By the end of 2012, Huawei’s fixed network
products and solutions had been deployed by 45 of
the world’s top 50 carriers. Our routers were used
by more than 20 mainstream carriers in Europe,
maintaining a leading market share. We deployed
more than 830 SingleMetro commercial networks
and 240 mobile bearer networks worldwide. In
the transport field, we were awarded more than
fifty 100G commercial contracts and constructed
100G WDM networks totaling more than 100,000
km. Huawei was the only vendor granted the Best
Optical Equipment Product – OTN award of the
Next Generation Optical Awards from the Institute
for International Research (IIR). Huawei was the
first to put second-generation E-Band microwave
technology into commercial use in Europe. In
the access network field, mainstream European
carriers put Huawei’s Vectoring solution into
extensive commercial use. This solution received
the Best Broadband Access Award – Fixed award
from InfoVision at the Broadband World Forum
2012. The ODN solution effectively addresses the
difficulties in optical fiber deployment and O&M.
We have deployed more than 60 iODN commercial
networks worldwide.
Management Discussion and Analysis 14
In the future, the fixed broadband (FBB) network
business faces both opportunities and challenges.
On the one hand, the wide popularity of services
and applications creates higher requirements for
network bandwidth. Broadband networks will
become the infrastructure that drives national
economic development. Therefore, investments in
the bearer networks that support FBB and MBB
will remain stable. On the other hand, diversified
services and the rapid growth of bandwidth
and traffic require that broadband networks be
smarter, more flexible, and more cost-effective.
The Internet industry is also striving to improve
network efficiency by constantly creating
innovative solutions. In the fixed network business
field, Huawei will be dedicated to providing carriers
with value-added, resilient, agile, and ubiquitous
ultra-broadband network solutions that are easy
to operate and maintain and become a strategic
partner that carriers can rely on.
Global Services
In 2012, our revenue from Global Services amounted
to CNY42,913 million.
Today, the ubiquity of MBB networks and services,
the all-IP network evolution, the massive number
of services and applications that result in
instantaneousness and fragmentation of information,
and the demand of device users for a personalized
service experience combine to present a series of
challenges and opportunities to the ICT industry.
Services are heavily emphasized by Huawei in its
collaboration with carriers. Over the past several
years, we have continuously strengthened the
competitiveness of our service solutions and
helped customers transform from developing
its network-centric construction & maintenance
capability to developing the integration and
management capability that centers on end-users
experience. Huawei recorded large-scale growth
in Europe and Asia Pacific among other markets
in its managed services. Huawei was awarded
more than 330 managed service contracts. The
networks managed by Huawei serve more than
310 million subscribers, making Huawei the
fastest-growing managed services provider in the
world. Of particular note, we made large-scale
breakthroughs in developed markets in Europe
by providing managed services to carriers in the
UK, Spain, Germany, Italy, and Switzerland. In the
CEM field, we established joint innovation projects
with Vodafone and Canada-based TELUS for our
SmartCare CEM service. In the service quality
management and assessment system, service
modeling, and service quality optimization fields,
we worked with STC on CEM services and helped
it achieve market success. In the consulting and
system integration field, Huawei had built 19,000
indoor sites for 114 carriers in 63 countries, served
78 carriers in 45 countries, completed more than
260 data center projects, and provided green
energy services for more than 18,000 sites of 310
carriers in more than 150 countries by the end of
2012.
In the network construction and maintenance
field, in 2012, Huawei delivered wireless products
to 430,000 sites, fixed network products to
790,000 sites, and microwave products to 74,000
sites. During the same year, Huawei completed
the planning and design of 81 key projects and
successfully provided network assurance services
to 41 key events, including the London Olympics
and Hajj.
Huawei also continued to strengthen its development
of global service capabilities to globalize, centralize,
and localize service delivery. Huawei has set up a
Global Service Center (GSC) in Romania, a Global
Management Discussion and Analysis15
Network Operation Center (GNOC) in India,
Romania, and Mexico (under construction), and
a Service Operation Center (SOC) in Indonesia.
We also have three centers of expertise (COEs) on
managed services in Germany, India, and China.In
addition, Huawei has established a Global Network
Evolution & Experience Center (GNEEC) in Beijing.
In the consulting and system integration field,
Huawei kept abreast of technology, network,
and service developments and continuously
enriched its service portfolios in collaborative
indoor and outdoor planning and optimization,
TDD/FDD collaborative planning, multi-vendor/
multi-frequency/multi-mode indoor coverage
co-building and sharing, intra-frequency macro and
micro hybrid networks, and GSM/LTE non-standard
bandwidth refarming. All of these initiatives helped
improve Huawei’s competitiveness.
In the managed services field, Huawei invested
in developing E-iNOC (a cross-territory, multi-
network, and multi-vendor OSS management
platform), the Workforce Management (WFM)
system (a field O&M management system that
allows converged O&M of fixed and mobile
networks), a management and troubleshooting
system for home networks and the Last Mile,
the Managed Services Unified Platform (MSUP)
based on Process KPIs, and the Site Intelligent
Management System (SIMS). These systems deliver
superior next-generation managed services with
the optimal Total Value of Ownership (TVO).
In the CEM field, the HUAWEI SmartCare CEM
service solution was further optimized in terms of
customer experience management and consulting,
service modeling, service quality management
process development, E2E demarcation of service
quality, and network optimization capability that
focuses on end users. This move enabled the
overall solution to transform from Per Service Per
User (PSPU) Service Quality Management (SQM) to
holistic customer experience management.
Peering into 2013, the evolution of new
technologies and new network architectures,
management of new services and customer
experience, and innovation in O&M and business
models will bring more profound and dramatic
changes to the entire industry. Huawei Global
Services will focus on telecom carriers and their
vertical customers in specific industries, provide
more valuable and competitive service solutions,
and continuously create value.
Carrier Software & Core Networks
Sales revenue in Huawei’s carrier software and
core network business totaled CNY18,891 million
in 2012.
We focused on strategic transformation towards
“service + product” solutions and were committed
to such fields as BSS, fixed mobile convergence
(FMC), consumers and households, industry-
specific solutions, and data center solutions.
Huawei collaborates extensively with its carrier
customers by addressing different types of
challenges they are facing, such as fluxes in user
behavior, changes in operating environments,
and changes to the competitive landscape.
Huawei takes this collaborative approach to help
carriers transform their business operations, ICT
infrastructure resources, operations support, and
business enablement.
In the BSS field, we officially launched the
Convergent Billing System Release 5 (CBS R5),
which quickly dominated the market and has
been used by such global leading carriers as
Vodafone, KPN, and Telenor. With its mobile
Management Discussion and Analysis 16
payment solution, Huawei has now become
Vodafone’s strategic partner in the mobile money
field for its future platforms. Our managed services
and next-generation business support system
(NGBSS) solutions continued to deepen the IT
transformation and have become the benchmark
for the industrialization of the global telecom IT
industry.
In the consumer and household field, we
constructed large-granular solutions on platforms,
service, and the ecosystem, continuously promoted
revenue growth from value-added services (VAS),
and supported the business transformation of
carriers. Our solution helped XL, an Indonesian
carrier, increase its monthly revenue by 15%.
According to statistics from Gartner, Huawei’s
service delivery platform (SDP) maintained
its leading market share globally for the third
consecutive year and was honored with the
National Science and Technology Progress Award,
the top award in China’s science and technology
arena. In the hybrid video field, Huawei maintained
its leading market share and was granted the Best
Multiscreen TV Solution award at the IP&TV World
Forum 2012.
In the converged communications field, Huawei
Mobile Softswitch served 3 billion subscribers
globally. Huawei has successfully deployed 143 IMS
networks, making it one of the leading players in
this field. Huawei’s SmartPCC has been deployed
by 23 of the world’s top 30 carriers, positioning
Huawei among the top market share players in the
industry. In addition, Huawei won two prestigious
awards at the IMS 2.0 World Forum 2012: Best
New VoLTE Product Launch and Best Innovative
New Service Launch Enabled by IMS.
In the data center solutions field, we launched
telecom private cloud and public cloud solutions
and released high-end storage HVS servers that
helped telecom carriers build rapidly growing
next-generation data centers. The market share
of our telecom cloud computing products grew by
more than 200%, and we started to work in this
area with multiple mainstream carriers worldwide.
In recognition of Huawei’s excellent performance
in this field, we won the Global Excellent Telecom
Cloud Solution Provider of the Year award from
Frost & Sullivan.
In 2012, we ventured into MBB traffic operations
and leveraged our E2E solution advantages to
create more than 100 sales opportunities on
traffic operations and break into many high-value
markets. Our MBB VGS won the Solution
Excellence Award from the TM Forum and the
Best Use of Traffic Management for Improving
Customer Experience award from the Broadband
Traffic Management (BBTM) Congress.
Network Energy
Relying on its penetrating insights into the ICT
industry, Huawei’s power supply solutions are
more suitable for ICT scenarios. These solutions
have been deployed by more than 300 carriers
across 140 countries worldwide. By adhering to a
4S (Saving, Simple, Smart, and Scalable) concept,
Huawei is dedicated to in-depth research in the
fields of site energy and data center energy. By
Management Discussion and Analysis17
doing so, Huawei aims to achieve the following
targets: maximum conversion efficiency, optimal
ICT power supply, and security & reliability,
guaranteeing the secure and reliable operation of
ICT services.
In the site field, Huawei’s full portfolio of efficient
power solutions meet customer needs for power
supply to main equipment rooms; modernizing
energy systems of indoor sites; transformation
of indoor to outdoor sites, and provisioning of
complex power supplies in multiple outdoor
scenarios. Huawei has deployed a total of 1.2
million site power systems worldwide and achieved
volume sales with mainstream carriers such as
British Telecom (BT), Telefonica, America Movil
(AM), MTN, SingTel, and CUCC. In 2012, Huawei
won Certificate of Merit in “Best in Class Site
Design” Beauty Contest organized by Deutsche
Telekom and Green Technology Award at
CommunicAsia 2012, as a result of recognition
from customers and the industry. Huawei also
unveiled the industry’s first high-efficiency and
high-density large-capacity power system.
In the hybrid power field, Huawei fully understands
concerns of carriers in terms of the shortage and
instability of power supplies in emerging markets.
With this understanding, Huawei launched a series
of power supply solutions including diesel, grid,
and solar hybrid, which help to optimize and
conserve of green energy. By doing so, we ensure
optimal TCO and a reduction of the operating
expenditure (OPEX) by 30% to 50% and fulfill
our corporate social responsibility in energy
conservation and emissions reduction by cutting
down or even eliminating the use of fuel. Our new
energy-conserving products have been deployed
by a large number of customers, such as Airtel,
MTN, Etisalat, Ethiopia Telecom, Ufone, Mobilink,
and CMpak, which have helped them save billions
of dollars on energy consumption.
In the data center energy solutions field, Huawei
launched the modular data center and container
data center energy solutions, which can be
deployed in multiple indoor and outdoor data
center scenarios. These solutions feature “smart
and unified management, efficient and reliable
operation, and quick and easy expansion”.
Their design features have placed us among the
pioneers in the next-generation modular data
center industry. In 2012, Huawei won the Data
Center Blueprints award from Datacenter Dynamics
(known as the Oscars of the data center industry)
for the Desktop Cloud Container Data Center
project.
In the uninterruptible power system (UPS) field,
Huawei built next-generation secure, stable, and
energy-saving UPS series, including the UPS8000,
the UPS5000, and the UPS2000, to meet customer
needs for small, middle, and large capacity power
supply scenarios. In 2012, Huawei was among
the first companies globally to be given the
UPS “Energy Star” certification, laying a solid
foundation for further market development.
Enterprise Business
In 2012, Huawei’s enterprise business experienced
stable growth, with its sales revenue reaching
CNY11,530 million, a year-on-year increase of
25.8%. Against the backdrop of a new market
environment and the sluggish global economy,
revenue from the China Region increased steadily.
In addition, we actively developed markets outside
China and made breakthroughs in high-value
regions. The channel business in regions outside
China has taken shape.
Management Discussion and Analysis 18
The influence of innovative ICT technologies,
including cloud computing, Big Data, BYOD mobile
office, SDN, and broadband and wireless LTE,
continues to expand. By taking advantage of these
technologies, enterprises will inevitably revamp
their value creation and business models.
In 2012, Huawei focused on ICT infrastructure
and high-value customers/industries. We adopted
an open and cooperative approach. By adhering
to a strategy of cooperation and integration with
partners, we worked with partners to provide
products, solutions, and services to customers.
Our main products and solutions gained
competitiveness and made breakthroughs in
high-value countries and markets.
In the enterprise networking field, Huawei
released multiple industry-leading flagship
products: CloudEngine 12800 series data center
switches that have the industry’s largest switching
capacity and highest performance, the world’s
first enterprise-grade WLAN access point (AP)
prototype that complies with the IEEE 802.11ac
standard, brand-new S9700 series high-end
switches, the next-generation aggregation router
NE20E-S, the enterprise cloud gateway AR G3,
and a 10GE campus solution. By developing
professional WLAN planning, testing, and network
optimization tools, Huawei further enhanced
the unified network management capability of
eSight, its unified O&M management system for
enterprise ICT. Huawei’s enterprise networking
products have been deployed by large customers in
multiple industries around the world, including the
State Grid Corporation of China, China National
Petroleum Corporation, Sochi 2014 Winter
Olympics, and BovenIJ Hospital in the Netherlands.
In the unified communications and collaboration
(UC&C) field, with a design philosophy of “R&D
driven by experience-oriented design”, Huawei
provides customers with UC&C products and
integrated solutions that feature mobility,
converged video, and cloud collaboration.
In 2012, Huawei launched such new UC&C
products as unified communications (UC) 2.0,
contact center (CC) 2.0, and the world’s first
panoramic telepresence system (a high-definition
videoconferencing system). Our IP phones were
honored with the Germany iF Industrial Design
award, known as the “Oscars” of the product
design field. Huawei also joined international
industry standards organizations in the UC&C
field and has become a member of more than
10 industry organizations, such as the Unified
Communication Interoperability Forum (UCIF) and
the Open Visual Communications Consortium
(OVCC). In addition, we completed cross-product
interoperability testing with 85 vendors in the
industry. Our core products have been deployed by
numerous customers in various industries globally,
including Banco do Nordeste do Brasil (BNB),
Pemex, and the Industrial and Commercial Bank
of China. These core products have also been fully
applied in large cross-territory enterprises to help
customers communicate and collaborate more
efficiently.
In Gartner’s Magic Quadrant 2012, our networking,
UC, and CC products rose to the Challengers
quadrant.
In the IT field, by adhering to the concept of
“Make IT Simple, Make Business Agile”, Huawei
launched innovative IT infrastructure and data
center solutions. These launches included
FusionCube (a converged infrastructure appliance),
the OceanStor HVS series (industry-leading,
high-end enterprise-grade storage products), an
OceanStor UDS mass storage system that can
be expanded to the EB level, and other offerings
Management Discussion and Analysis19
to help customers simplify their IT systems and
improve business agility. Huawei has built more
than 260 data centers for customers around
the globe – 35 of them cloud-based. Huawei
provided storage solutions to more than 2,000
customers across 80 countries, became a partner
of the European Organization for Nuclear Research
(CERN) on storage products, helped build the
China Mobile International Information Port (the
largest data center in the world), and deployed
the world’s largest desktop cloud system at
Huawei. Approximately 70,000 employees use
this cloud system for work every day. Huawei has
consolidated its leading position in the media
information and Internet industries, deepened
its cooperation with such media outlets as China
Central Television, and provided green and efficient
IT infrastructures for Tencent and Baidu. In 2012,
Huawei also made all-around breakthroughs in the
finance and healthcare industries.
In the enterprise wireless broadband field,
Huawei was awarded 12 contracts for network
construction projects, including eWBB LTE
commercial networks and contracts, and our
solutions were widely applied in the transportation,
government, and energy industries. The eWBB
LTE wireless broadband communications network
Huawei deployed for China Southern Power Grid
marked the first application of LTE solutions in the
electric power industry. The eWBB LTE broadband
cluster has also been widely used in the Safe
City, transportation, and many other sectors.
Huawei’s GSM-R solutions cover up to 13,000
km of railways and have been deployed by EKB in
Turkey, North-South Railway of Turkmenistan, and
many other customers.
In keeping with booming expansion of mobile
office technology and based on Huawei’s own
experience in deploying mobile applications,
the company launched the Huawei Enterprise
BYOD Solution. This solution delivers the perfect
combination of security, efficiency, and experience
for mobile workstyles and helps enterprises
improve their work efficiency.
In vertical industries, Huawei recorded multiple
achievements. We provided e-government, public
security, digital education, and digital healthcare
services in 89 countries and regions. Our GSM-R
solution improved operations on the Harbin-Dalian
High-Speed Railway, the world’s first high-speed
railway in areas of deep freeze. We successfully
constructed a flexible and efficient campus
network for Hong Kong Stock Exchange and
offered a productive office collaboration solution
for Saudi Aramco. Phoenix Television adopted
Huawei’s full series of products, including modular
equipment rooms, core switches, storage devices,
and telepresence offerings. Our smart hotel
solution helped the Tengchong Resort & Villas in
Yunnan Province upgrade into a super five-star
modern resort.
Following a strategy of openness and cooperation,
Huawei worked with system integrators (SIs),
Independent Software Vendors (ISVs), and other
partners to bring innovation to products and
solutions. With approximately 1,000 partners, we
leveraged our respective advantages, kept abreast
of customer needs, and provided innovative
services and user experience for all industries.
The channel policy and business processes of
Huawei’s Enterprise BG continued to improve,
and channel partner development is on the right
track. By the end of 2012, Huawei’s Enterprise BG
had more than 2,800 channel partners worldwide.
Additionally, Huawei actively promoted the “Fly
Easy” program in markets outside China and
carried out the Channel Partner Enablement 360
Management Discussion and Analysis 20
Program to enhance the vitality of channel partners
and increase the quality and quantity of channel
partners.
In 2012, we established a regional service channel
partner network and ecosystem supported by six
centers around the world. These centers include
technical assistance center (TAC), spare parts,
training & certification, project management,
channel partner service operations, and authorized
repair centers – fully covering 38 countries. The
network and ecosystem provide better service
support and experience to partners and customers
and accelerate customer business success.
In the information age, enterprise ICT systems
become more than just tools and support systems;
they will be absolutely essential and intrinsic to
nearly every enterprise activity. E2E real-time
systems will be built for enterprises, and the digital
enterprise model will become an organization
norm. The ICT infrastructure is the core driving
force behind enterprise innovation, transformation,
and competitiveness improvement. Huawei
will proactively embrace the opportunities and
challenges in the ICT development era, stay abreast
of technological development trends, and remain
steadfastly customer-centric. In addition, we will
jointly innovate with customers and partners,
focus on competitive enterprise ICT products and
solutions, and continuously create value for the
business success of customers.
By adhering to the transparency, stability,
cooperation, and win-win strategies, we will
continue to stay focused, open, and cooperative,
and provide products for the integration of
partners. We will work with our customers and
partners to jointly embrace ICT transformations,
build an industry ecosystem that fosters
cooperation and win-win results, promote the
sound development of the ICT industry, and
contribute to the ICT development of enterprises
and industries.
Consumer Business
With the rapid development of network
information technologies, consumers demand
network access “anytime and anywhere”.
Ubiquitous access to network services requires
closer connections between smart devices and
networks. Leveraging its expertise accumulated
in communications technologies over the past
two decades, coupled with in-depth insights
into customer needs, network technologies, and
future trends, Huawei is building a powerful brand
image centered on product experience. Huawei is
committed to becoming a leading global brand
in smart devices, offering products and services
that deliver the inspired experience to consumers
everywhere.
In 2012, with the rapidly growing popularity
of smart devices, Huawei’s consumer business
increased steadily, earning global sales revenue
of CNY48,376 million – an increase of 8.4%
year-on-year. Annual shipments totaled 127 million
units, including 32 million smartphones – an
increase of 60% year-on-year.
In 2012, Huawei launched the Ascend lineup of
smartphones and marketed multiple models for
the brand, which marked Huawei’s shift from
the traditional business-to-business (B2B) model
to the business-to-customer (B2C) model; from
its role as an ODM to its own brand; and from
a focus on feature phones to smartphones. Our

Management Discussion and Analysis21
product scope extended from low-end products
to middle-range and high-end products. Thanks
to these transformations, Huawei’s Consumer BG
achieved effective growth.
The Huawei Ascend is made for people of action
who are idealists – challengers who have vision,
initiative, and belief that dreams can be realized
through hard work. Huawei Device strives to
bring the latest technology to consumers so that
everyone can benefit from new technologies. In
product development, Huawei Device adheres to its
quality strategy, attaching the utmost importance
to improving consumer experience. We strive to
break through technical limitations to provide
innovations tailored to consumer requirements.
By doing so, we enable more people from around
the world to reap the benefits of technological
progress and realize their dreams. The Ascend
product lineup includes the D series with the
ultimate technology; the P series with the ultimate
fashion; the G series that offers the best blend
of performance and cost; and the Y series for
ultimate accessibility. Simply put, Huawei tasks
itself with providing consumers with the best
devices in the world.
In 2012, Huawei significantly improved the
competitiveness of its mobile phones. We released
the Ascend P1, the slimmest smartphone in the
world, and the Ascend D1 Quad, the fastest
smartphone in the world. In addition, we launched
the Huawei Emotion User Interface (UI) into
commercial use. Our device cloud service has
also taken shape. Currently, the Ascend P1 is
available in more than 40 countries. The Ascend
D1 Quad has also won high acclaim and was
applauded by Engadget, a well-known science and
technology media outlet, which asserted that the
phone “performs exactly the way you’d expect a
phone with four CPU cores to, and it’s Huawei’s
best phone to date”. Keeping pace with market
requirements, Huawei launched LTE-capable
devices in developed markets. In the US, Huawei
partnered with MetroPCS to launch the M920,
an entry-level LTE-capable phone. In Western
Europe, Huawei and a UK carrier jointly launched
the Ascend P1 LTE. In Japan, the Ascend D1 LTE
from Huawei and NTT Docomo was also launched
during a grand ceremony held in November 2012.
Throughout the year, Huawei maintained its leading
role in the MBB field. In the traditional wireless
data access field, Huawei continuously innovated
product technology, improved appearance, and
delivered enhanced user experience. Huawei also
launched the world’s first full series of LTE Cat4
data devices (including data cards, Mobile Wi-Fi,
and customer premises equipment [CPE]). The
company achieved rapid growth in the consumer
electronics (CE) field and became a mainstream
supplier to HP, Acer, Sony, and other world-known
electronics manufacturers. In the M2M field,
Huawei provided customized solutions for the
automobile, electric power, and other industries,
and tapped into the new Blue Ocean markets.
In the home device field, Huawei strengthened
its investments in connected home solutions
that concentrate on access center, media center,
automation center, open service cloud, and
efficient management cloud. Huawei added
to its momentum in this field with improved
understanding of consumer needs and a series of
connected home devices.
Management Discussion and Analysis 22
Carriers in the US began to extensively use our
innovative fixed wireless stations, helping them
quickly attract new users and reduce O&M costs.
In addition, Huawei’s innovative series of home
routers also won wide acclaim. The MediaPad
10 FHD, the fastest quad-core 10-inch tablet in
the world, was launched at the beginning of the
year and instantly became a hit in Russia, China,
and the Asia-Pacific region among other markets.
The recently unveiled Media Q breaks through
performance limitations in individual device
products and enables multi-screen interaction
among mobile phones, tablets, TVs, and home
computers (AirSharingTM). This device brings
families closer together, allowing every family
member to connect and share using their favorite
media. In the converged Set Top Box (STB) field,
Huawei has entered the UK and other high-end
markets, providing more sources of TV programs,
enhancing interaction, and bringing unprecedented
home entertainment experience.
While continuously delivering product innovations
and breakthroughs, Huawei Device centered on
consumers and stepped up its branding campaigns.
We sponsored the Atletico Madrid Football Club
and the Ski Jumping World Cup in Poland. In
addition, the Ascend P1 was advertised on
Eurosport during the London Olympics. At the
end of 2012, Huawei Device launched sizeable
Christmas and New Year promotional activities
themed “Ascend to New Heights” in 45 countries
worldwide. According to the Global Brand Survey
Report released by IPSOS, the global brand
awareness of Huawei’s mobile phones rose to
25% in 2012.
In 2012, Huawei further accelerated its
development of device channels. While expanding
carrier channels, Huawei Device also fully
developed other channels, including social and
e-commerce channels. We established partnerships
with more than 600 channel partners around the
world. Our total sales in the open market grew by
23% year-on-year. In China, Huawei established
strategic partnerships with such distributors as
Chinatelling and Aisidi as well as retailers, including
Gome, Suning and Dixintong. In Russia, Huawei
carried out in-depth cooperation with core retailers
and our sales revenue in the open market grew by
500% year-on-year in 2012. In Germany, the UK,
and Australia, Huawei established partnerships
with local mainstream distributors to promote the
sales of our products through social channels.
With the rapid development of mobile Internet,
smart devices will become the most important
portal through which consumers access the
Internet. This development will give Huawei’s
consumer business even more room for growth.
Along with ICT convergence, smart mobility will
help enhance Huawei’s competitive edge. By
relying on a proven track record in radio-frequency
technology, low power consumption, high-quality
photography, high-end audio, rapid sharing, and
other core technologies, Huawei will consistently
deliver the inspired experience in smart devices for
consumers worldwide.
Management Discussion and Analysis23
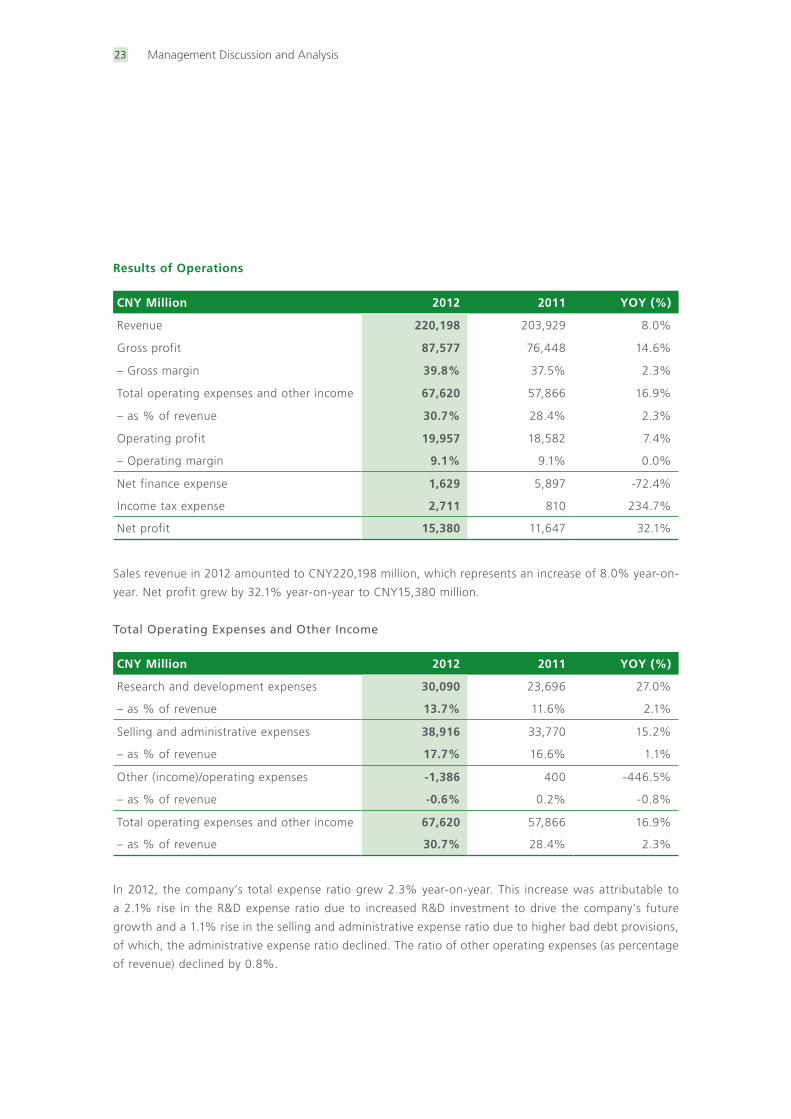
Results of Operations
CNY Million 2012 2011 YOY (%)
Revenue 220,198 203,929 8.0%
Gross profit 87,577 76,448 14.6%
– Gross margin 39.8% 37.5% 2.3%
Total operating expenses and other income 67,620 57,866 16.9%
– as % of revenue 30.7% 28.4% 2.3%
Operating profit 19,957 18,582 7.4%
– Operating margin 9.1% 9.1% 0.0%
Net finance expense 1,629 5,897 -72.4%
Income tax expense 2,711 810 234.7%
Net profit 15,380 11,647 32.1%
Sales revenue in 2012 amounted to CNY220,198 million, which represents an increase of 8.0% year-on-
year. Net profit grew by 32.1% year-on-year to CNY15,380 million.
Total Operating Expenses and Other Income
CNY Million 2012 2011 YOY (%)
Research and development expenses 30,090 23,696 27.0%
– as % of revenue 13.7% 11.6% 2.1%
Selling and administrative expenses 38,916 33,770 15.2%
– as % of revenue 17.7% 16.6% 1.1%
Other (income)/operating expenses -1,386 400 -446.5%
– as % of revenue -0.6% 0.2% -0.8%
Total operating expenses and other income 67,620 57,866 16.9%
– as % of revenue 30.7% 28.4% 2.3%
In 2012, the company’s total expense ratio grew 2.3% year-on-year. This increase was attributable to
a 2.1% rise in the R&D expense ratio due to increased R&D investment to drive the company’s future
growth and a 1.1% rise in the selling and administrative expense ratio due to higher bad debt provisions,
of which, the administrative expense ratio declined. The ratio of other operating expenses (as percentage
of revenue) declined by 0.8%.
Management Discussion and Analysis 24
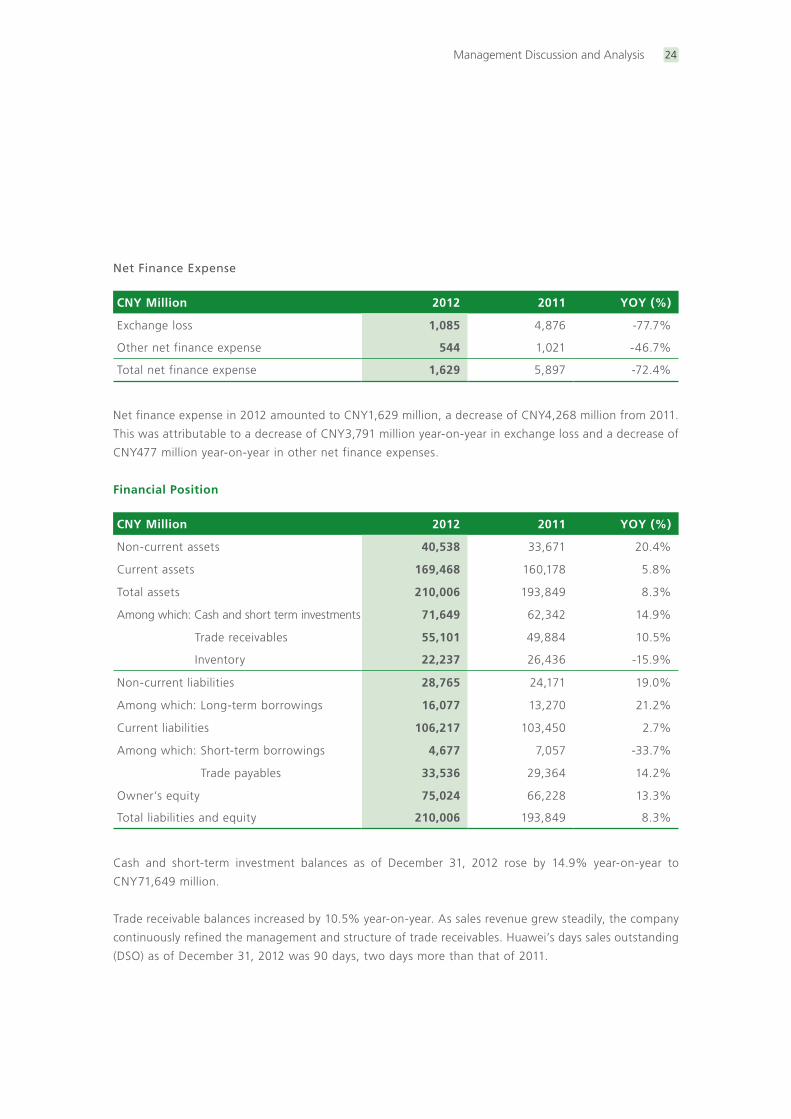
Net Finance Expense
CNY Million 2012 2011 YOY (%)
Exchange loss 1,085 4,876 -77.7%
Other net finance expense 544 1,021 -46.7%
Total net finance expense 1,629 5,897 -72.4%
Net finance expense in 2012 amounted to CNY1,629 million, a decrease of CNY4,268 million from 2011.
This was attributable to a decrease of CNY3,791 million year-on-year in exchange loss and a decrease of
CNY477 million year-on-year in other net finance expenses.
Financial Position
CNY Million 2012 2011 YOY (%)
Non-current assets 40,538 33,671 20.4%
Current assets 169,468 160,178 5.8%
Total assets 210,006 193,849 8.3%
Among which: Cash and short term investments 71,649 62,342 14.9%
Trade receivables 55,101 49,884 10.5%
Inventory 22,237 26,436 -15.9%
Non-current liabilities 28,765 24,171 19.0%
Among which: Long-term borrowings 16,077 13,270 21.2%
Current liabilities 106,217 103,450 2.7%
Among which: Short-term borrowings 4,677 7,057 -33.7%
Trade payables 33,536 29,364 14.2%
Owner’s equity 75,024 66,228 13.3%
Total liabilities and equity 210,006 193,849 8.3%
Cash and short-term investment balances as of December 31, 2012 rose by 14.9% year-on-year to
CNY71,649 million.
Trade receivable balances increased by 10.5% year-on-year. As sales revenue grew steadily, the company
continuously refined the management and structure of trade receivables. Huawei’s days sales outstanding
(DSO) as of December 31, 2012 was 90 days, two days more than that of 2011.
Management Discussion and Analysis25
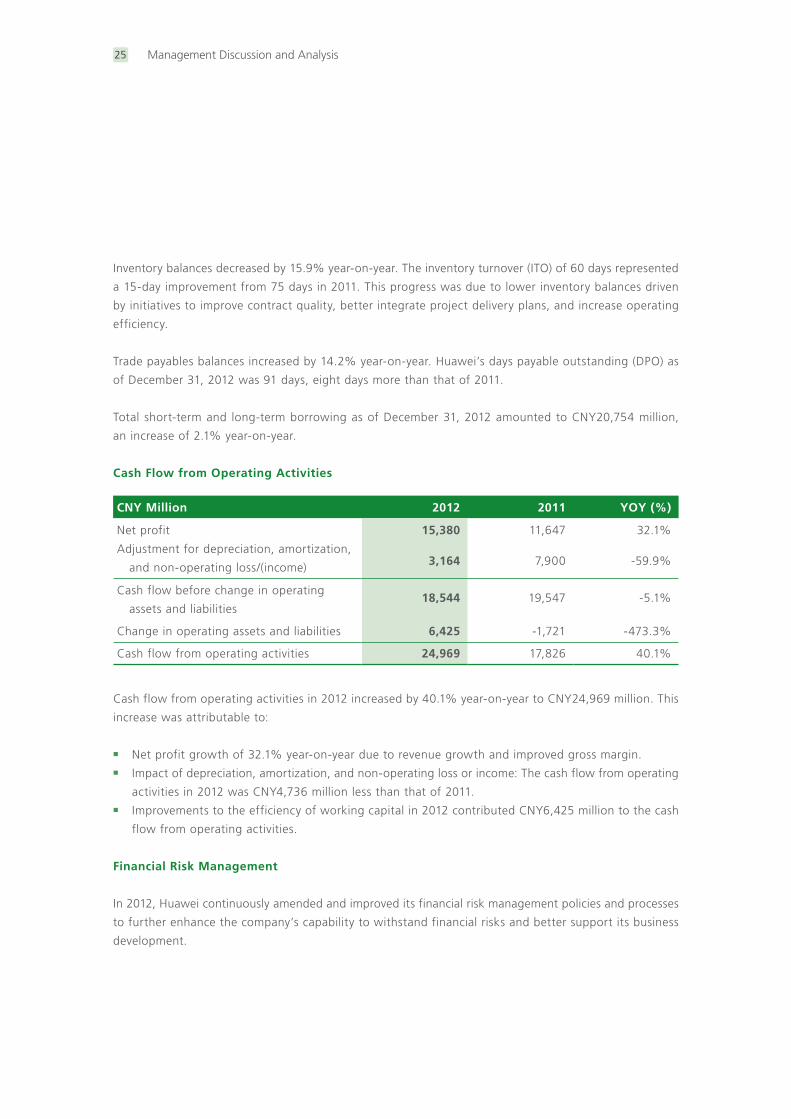
Inventory balances decreased by 15.9% year-on-year. The inventory turnover (ITO) of 60 days represented
a 15-day improvement from 75 days in 2011. This progress was due to lower inventory balances driven
by initiatives to improve contract quality, better integrate project delivery plans, and increase operating
efficiency.
Trade payables balances increased by 14.2% year-on-year. Huawei’s days payable outstanding (DPO) as
of December 31, 2012 was 91 days, eight days more than that of 2011.
Total short-term and long-term borrowing as of December 31, 2012 amounted to CNY20,754 million,
an increase of 2.1% year-on-year.
Cash Flow from Operating Activities
CNY Million 2012 2011 YOY (%)
Net profit 15,380 11,647 32.1%
Adjustment for depreciation, amortization,
and non-operating loss/(income) 3,164 7,900 -59.9%
Cash flow before change in operating
assets and liabilities18,544 19,547 -5.1%
Change in operating assets and liabilities 6,425 -1,721 -473.3%
Cash flow from operating activities 24,969 17,826 40.1%
Cash flow from operating activities in 2012 increased by 40.1% year-on-year to CNY24,969 million. This
increase was attributable to:
■ Net profit growth of 32.1% year-on-year due to revenue growth and improved gross margin.■ Impact of depreciation, amortization, and non-operating loss or income: The cash flow from operating
activities in 2012 was CNY4,736 million less than that of 2011.■ Improvements to the efficiency of working capital in 2012 contributed CNY6,425 million to the cash
flow from operating activities.
Financial Risk Management
In 2012, Huawei continuously amended and improved its financial risk management policies and processes
to further enhance the company’s capability to withstand financial risks and better support its business
development.
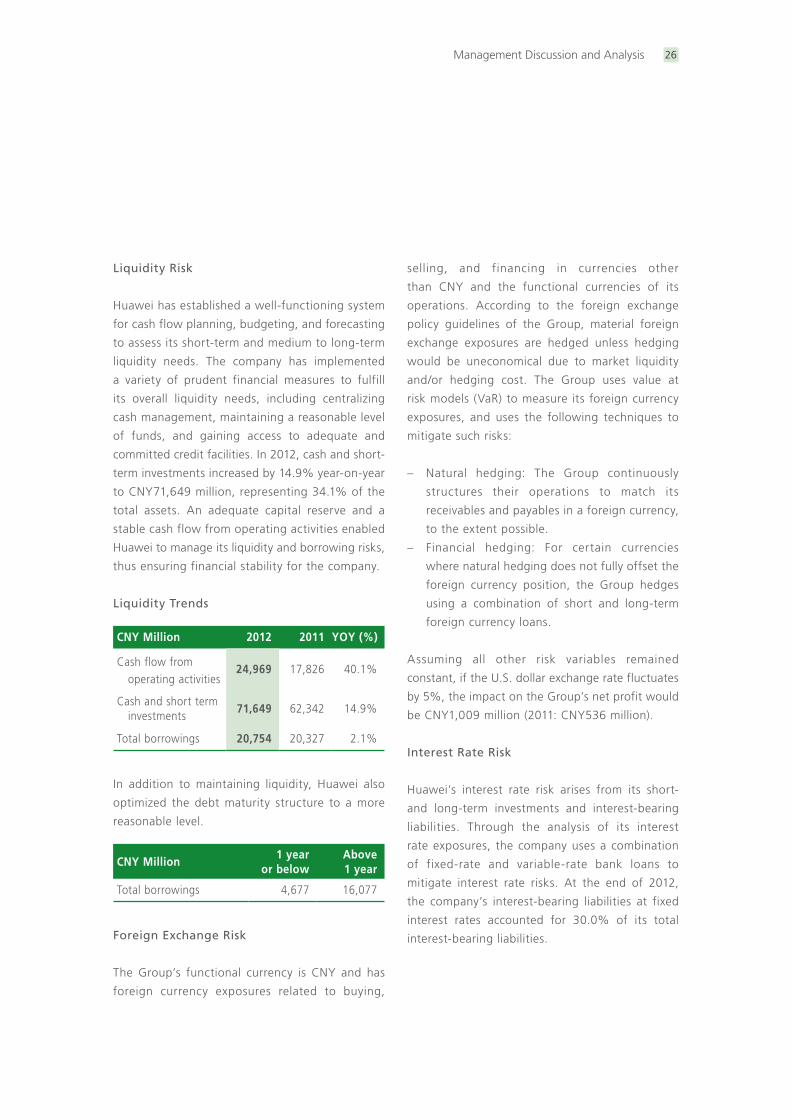
Management Discussion and Analysis 26
Liquidity Risk
Huawei has established a well-functioning system
for cash flow planning, budgeting, and forecasting
to assess its short-term and medium to long-term
liquidity needs. The company has implemented
a variety of prudent financial measures to fulfill
its overall liquidity needs, including centralizing
cash management, maintaining a reasonable level
of funds, and gaining access to adequate and
committed credit facilities. In 2012, cash and short-
term investments increased by 14.9% year-on-year
to CNY71,649 million, representing 34.1% of the
total assets. An adequate capital reserve and a
stable cash flow from operating activities enabled
Huawei to manage its liquidity and borrowing risks,
thus ensuring financial stability for the company.
Liquidity Trends
CNY Million 2012 2011 YOY (%)
Cash flow from operating activities
24,969 17,826 40.1%
Cash and short term investments
71,649 62,342 14.9%
Total borrowings 20,754 20,327 2.1%
In addition to maintaining liquidity, Huawei also
optimized the debt maturity structure to a more
reasonable level.
CNY Million1 year
or belowAbove 1 year
Total borrowings 4,677 16,077
Foreign Exchange Risk
The Group’s functional currency is CNY and has
foreign currency exposures related to buying,
selling, and financing in currencies other
than CNY and the functional currencies of its
operations. According to the foreign exchange
policy guidelines of the Group, material foreign
exchange exposures are hedged unless hedging
would be uneconomical due to market liquidity
and/or hedging cost. The Group uses value at
risk models (VaR) to measure its foreign currency
exposures, and uses the following techniques to
mitigate such risks:
– Natural hedging: The Group continuously
structures their operations to match its
receivables and payables in a foreign currency,
to the extent possible.
– Financial hedging: For certain currencies
where natural hedging does not fully offset the
foreign currency position, the Group hedges
using a combination of short and long-term
foreign currency loans.
Assuming all other risk variables remained
constant, if the U.S. dollar exchange rate fluctuates
by 5%, the impact on the Group’s net profit would
be CNY1,009 million (2011: CNY536 million).
Interest Rate Risk
Huawei’s interest rate risk arises from its short-
and long-term investments and interest-bearing
liabilities. Through the analysis of its interest
rate exposures, the company uses a combination
of fixed-rate and variable-rate bank loans to
mitigate interest rate risks. At the end of 2012,
the company’s interest-bearing liabilities at fixed
interest rates accounted for 30.0% of its total
interest-bearing liabilities.
Management Discussion and Analysis27
Credit Risk
The company has established and implemented
globally consistent credit management policies
and practices, processes, IT systems, and credit
risk assessment tools. In addition, dedicated credit
management organizations have been established
across all regions and business units. The company
has used risk assessment models to determine
customer credit ratings and credit limits. It has also
implemented risk control points over key processes
along the end-to-end sales cycle to manage credit
risks in a closed-loop manner. Huawei’s Credit
Management Dept regularly assesses global credit
risk exposures, estimates potential losses, and
determines bad debt provisions as appropriate.
In the event that a credit risk for a specific
customer or outstanding trade receivable becomes
inappropriately high, a special handling process is
initiated to mitigate the risk.
Sales Financing
With global coverage, Huawei’s sales financing
team maintains close contact with customers to
understand their financing needs and taps into
diversified financing resources around the world.
As a bridge for communication and cooperation
between financial institutions and customers, the
sales financing team provides customers with
professional financing solutions that continuously
contribute to customer success. Third-party
financial institutions engage with Huawei in export
credit, leasing, and factoring activities to obtain
benefits and they bear the associated risks. Huawei
has established systematic financing policies and
project approval processes to strictly control
financing risk exposures.
Research and Development
Huawei has over 70,000 product and solution R&D
employees, comprising more than 45% of our total
workforce worldwide. We have set up 16 R&D
centers in countries that include Germany, Sweden,
the US, France, Italy, Russia, India, and China.
To gain a distinct competitive edge in the future,
we have set up the 2012 Laboratories, which
functions as the innovation, research, and platform
technology development arm of the company.
We focus on making continuous investments in
key technologies, architectures, and standards
in the ICT field and are dedicated to providing
broader, smarter, and more energy-efficient pipes
that require zero wait time, thereby creating a
better experience for users. We work closely
with partners from the industry, academia, and
research institutes. Our goal is to take the lead
in research, innovation, and implementation of
future networks. Huawei has also set up 28 joint
innovation centers with leading carriers to translate
leading technologies into a competitive edge and
business success for customers.
As of December 31, 2012, Huawei had filed 41,948
patent applications in China, 12,453 under the
Patent Cooperation Treaty (PCT), and 14,494
outside China. Among these applications, 30,240
patents have been granted.
As an important contributor to the ICT industry,
Huawei applies standards to the industry in
key standards organizations and key standards
projects, participates in and supports mainstream
international standards, and makes a variety of
positive contributions. At the ITU, for example,
Management Discussion and Analysis 28
Huawei took the initiative to facilitate the
establishment of an organization to research
Carrier SDN. Huawei is a founding member of the
oneM2M global partnership project. By the end of
2012, Huawei had joined more than 150 industry
standards organizations, including the 3GPP, IETF,
IEEE, ITU, BBF, ETSI, ATIS, TMF, WFA, CCSA, and
OMA. In 2012, Huawei submitted more than 5,000
proposals to these standards organizations and
served as a board member for ETSI, ATIS, OMA,
CCSA, WFA, and numerous other organizations.
The company holds more than 180 positions in
international standards organizations.
Huawei’s R&D expenses totaled CNY30,090 million
in 2012, accounting for 13.7% of the company’s
annual revenue. Of the total R&D expenses,
CNY1,300 million was invested in research. Huawei
has cumulatively spent more than CNY130,000
million on R&D over the last decade.
Cyber Security
As a responsible ICT provider, we take our
responsibilities to maintain the availability of our
technologies seriously while protecting them from
any form of damage, including cyber security.
In this context, we believe that such threats will
never cease. As such, we will never let up in
our endeavors to design, develop, and support
technology and solutions that significantly limit the
possibility that our technology could be used for
purposes for which it was never intended.
In 2012, we released a cyber security white paper
titled Cyber Security Perspective: 21st Century
Technology and Security – A Difficult Marriage.
As we point out in this paper, open networks
have encouraged information flow and sharing,
lowered the costs of innovation, and helped
improve the world’s capabilities in producing
technological innovations. The development of
networks has enabled people in different parts
of the world, and within their own countries,
to have a fair opportunity of development, to
promote equal communications among different
cultures, and drive the advancement of civilization.
Technology is fundamentally improving the health,
wealth, and prospects of humanity. However, with
these enormous benefits brought about by the
networked world, we are also facing increasing
cyber security challenges.
Cyber security is a shared global challenge which
is not limited to a particular geographical region,
culture, language, or technology provider. All
stakeholders, including government and industry,
must collaborate to mitigate these risks and reduce
the chances that technology deployment is reduced
due to the fear of cyber crime. To this end, Huawei
is dedicated to closely collaborating, innovating,
and establishing international standards with other
global organizations and governments to ensure
that the integrity and security of the networked
solutions and services we provide meet or exceed
the needs of our customers and provide the
assurance and confidence required by their own
customers.
The Global Cyber Security Committee (GCSC)
is the highest level cyber security management
body at Huawei. John Suffolk is Huawei’s Global
Cyber Security Officer. Mr. Suffolk is tasked with
formulating strategies for the cyber security
assurance system as well as managing and
overseeing the implementation of the system. He
reports directly to the CEO. In 2012, following the
strategies and objectives set out in the Statement
on Establishing a Global Cyber Security Assurance
System, we have continuously incorporated cyber
security elements into our core business processes
(including R&D, supply chain, service delivery,
HR management, supplier management, and
so on) to roll out an end-to-end global cyber
Management Discussion and Analysis29
security assurance system. We have also conducted
effective coordination in an open and transparent
manner with external parties through multiple
platforms, organizations, and channels.
In 2012, we continued to improve the security
management, technical workforce, and
organization building for all teams at different
levels. We carried out systematic cyber security
awareness education for all Huawei staff and
contractors according to laws and regulations
on cyber security and privacy protection. We
strengthened our vulnerability management and
disclosure policies and procedures to match best
practices and adapt to new business requirements.
Our responsible disclosure process was adopted to
coordinate with suppliers, computer emergency
response team (CERT) organizations, and security
researchers in resolving product vulnerabilities.
We participated in and passed supply chain
security management system certification, such
as ISO28000. In addition, we improved supplier
security system qualification and worked together
with our suppliers to effectively reduce potential
risks and security threats and ensure the security
of products and services delivered by Huawei.
In Canada, Spain, and other countries, we
continued to cooperate with third-party testing
organizations to conduct independent security
audits and certifications, such as Common
Criteria, on Huawei products. In the United
Kingdom, we have continued to enhance the
capabilities of our UK Cyber Security Evaluation
Centre (CSEC) to undertake independent security
evaluation of Huawei products. The knowledge
and expertise we learn from those tests and
evaluations are used to optimize all processes,
standards and policies of Huawei to continuously
improve quality and security across all products
in all countries. In addition, we enthusiastically
shared our understanding and experience in cyber
security with the industry during events such
as the Budapest Conference on Cyberspace, the
Worldwide Cybersecurity Summit in New Delhi,
and other international cyber security forums.
We believe our holistic approach to cyber security,
our open and transparent approach, and our
passion for independent testing and verification
is a clear indication to our customers that we will
never stop in our endeavors to ensure that the
greatest level of risk mitigation is applied to our
products and their customers.
Critical Accounting Estimates
The consolidated financial statements, on which
this Management Discussion and Analysis was
based, have been prepared in compliance with
International Financial Reporting Standards (IFRSs).
For details, see note 1(a) to the consolidated
financial statements summary.
The application of IFRSs requires the company
to make judgments, estimates and assumptions
that will directly affect the company’s reporting
of its financial position and operating results. The
accounting estimates and assumptions discussed
in this section are those that the management
considers to be the most critical to the company’s
consolidated financial statements.
Revenue Recognition
The application of accounting principles related
to the measurement and recognition of revenue
requires the company to make significant judgments
and estimates. Even for the same product, the
company often has to determine the appropriate
accounting treatment after analyzing the contract
terms and conditions. When installation, training,
and other services are rendered and sold together
with a product, the company determines whether
Management Discussion and Analysis 30
the deliverables should be treated as separate
units of accounting and recognizes the revenue
accordingly. When there are multiple transactions
with the same customer, the company applies
significant judgments to determine whether
separate contracts are considered as part of
one arrangement based on contracts terms and
conditions. When an equipment that requires
installation is delivered and accepted by a customer
at different stages, the company determines
whether to recognize revenue by stages based on
assessment of whether the completed project is
able to be used by the customer, and whether the
obtained certificate of acceptance would support
payment collections.
Revenue recognition is also impacted by various
factors, including the creditworthiness of the
customer. The company regularly reviews estimates
of these factors to assess its adequacy. If these
estimates were to change, revenue will be impacted
accordingly.
For a construction contract, revenue is recognized
using the percentage of completion (POC) method,
measured according to the percentage of contract
costs incurred to date to the estimated total costs
for the contract. If at any time these estimates
indicate the POC contract will be unprofitable,
the entire estimated loss for the remainder of the
contract is recorded immediately as a cost.
Allowance for Doubtful Accounts
The company’s gross accounts receivable balances
were CNY58,592 million and CNY53,432 million
as of December 31, 2012 and December 31, 2011,
respectively. The allowances for doubtful accounts
were CNY3,491 million, or 6.0% of the gross
accounts receivable balance as of December 31,
2012, and CNY3,548 million, or 6.6% of the
gross accounts receivable balance as of December
31, 2011. The allowances are recorded based
on the collectability of accounts receivable from
customers. The company regularly reviews the
allowances for doubtful accounts by considering
factors such as historical experiences, customer
creditworthiness, the age of accounts receivable
balances, and current economic conditions that
may affect a customer’s ability to pay.
The company’s provisions for doubtful accounts
charged to the income statement were CNY3,416
million and CNY1,481 million for fiscal years ended
December 31, 2012 and December 31, 2011,
respectively. If key customers’ creditworthiness
deteriorates, or if the default risk is higher than the
historical trend, or if other circumstances arise, the
estimates of the recoverability of amounts due to
the company could be overstated, and additional
allowances could be required, which could have an
adverse impact on the company’s profit.
Inventories Write-down
The company’s inventory balances were
CNY22,237 million and CNY26,436 million as
of December 31, 2012 and December 31, 2011,
respectively. Inventories are measured at the lower
of cost or net realizable value. The difference
between the cost of the inventory and the net
realizable value is recorded as inventory provision.
Net realizable value is the estimated selling
price in the ordinary course of business, less the
estimated costs of completion and the estimated
costs necessary to make the sale. The following
factors are considered for the recognition of
net realizable value: purposes of the inventories
held, inventory aging, percentage of inventory
utilization, inventory categories and conditions,
and subsequent events with material influences
on inventory value. The company reviews the
inventory provisions periodically to ensure its
accuracy and reasonableness.
Management Discussion and Analysis31
The company’s inventory provisions charged to
the income statement were CNY17 million and
CNY509 million for fiscal years ended December
31, 2012 and December 31, 2011, respectively.
Provision for Warranties
When recognizing revenue, the company estimates
the possible future liabilities that it may incur
under its product warranty obligations and records
a warranty provision. The warranty provision
balances were CNY2,407 million and CNY1,962
million as of December 31, 2012 and December
31, 2011, respectively. The company’s products
are generally covered by a warranty period of
12 months. The company accrues for warranty
costs as part of cost of sales based on historical
expenditure on material costs, technical support
labor costs, and associated overheads.
The warranty provisions accrued for fiscal years
ended December 31, 2012 and December 31, 2011
were CNY2,844 million and CNY2,449 million,
respectively.
Increases in warranty claims or higher cost of
warranty services will lead to actual warranty
expenses exceeding the accrued warranty
provisions, and will in turn adversely affect the
company’s gross margin.
Income Tax
The company is subject to income taxes in China
and numerous foreign jurisdictions. Significant
judgment is required in determining the consolidated
provision for income taxes.
During the ordinary course of business, there
are many transactions and calculations where
the ultimate tax determination is uncertain. The
company recognizes tax liabilities for anticipated
tax issues based on estimates of whether
additional taxes will eventually be due. The
company adequately accrues for tax liabilities for
all open audit years based on its assessment
of many factors, including past experiences and
interpretations of tax law. Deferred tax assets are
recognized to the extent that future taxable profits
will be available against which the assets can be
utilized.
Assessment of tax exposures and recognition relies
on estimates and assumptions and may involve a
series of complex judgments about future events.
Where the final tax outcome of these future events
is different from the amounts that were initially
recorded, such differences will impact the income
tax and deferred tax provisions for the period in
which such decision is made.
Market Trends
Market Trends 32
Beyond ICT: Embracing the next digital revolution
The history of human social development is, to some extent, the history of human scientific and technological progress. Humanity achieves scientific and technological progress by pushing its physical and mental limits and breaking away from the restrictions of time and space. This has been true in times both ancient and modern. Our ancestors built beacon towers and invented the wheel, while we have ubiquitous Internet connection and vehicles capable of reaching outer space. In the course of our scientific and technological development, two epoch-making inventions have been the steam engine and the computer. The steam engine ushered in the industrial age by providing far more power than what manual labor and beasts of burden could generate. The computer brought us into the information age through data processing capabilities that far outperform the human brain.
The past century has witnessed several waves of progress made possible by information technologies, including those used for communications (telegraphy, telephony, and broadcasting), home entertainment (radio, TV), computing, and the Internet. Information technologies drive economic growth worldwide and reshape the way people live and work. At present, we are evolving from a “society on wheels” to a “society on the network.” However, information systems are still regarded as aid tools and support systems, keeping the digital and physical worlds somewhat parallel and compartmentalized. Now, as the digital and physical worlds begin to merge, the development of the Internet of Things has proven to be an effective catalyst of information-based developments and is sure to bring groundbreaking changes to all of humanity.
Beyond information and communications, the increasing integration of the digital and physical worlds will lead to a new digital revolution
British philosopher Karl R. Popper divides human society into three parts: the physical world, the
mental/psychological world, and the world of products of the human mind (also known as the world of objective knowledge). In the future, the physical world will be married with the digital world to form a new world. This integration will bring tremendous changes to the way we live and work, the way businesses operate, and the way society functions — a new age of digital citizens, digital enterprises, and digital society.
Heavy reliance on networks will usher in an age of digital citizenry.
Nowadays, the ways in which people communicate, acquire information, study, have fun, shop, make friends, and pair-bond are quite different from what we saw just two decades ago. People not only have more means to stay connected and obtain information, but have exceeded the constraints of their physical location or time zone. With the developments in this short time span, rather than waiting days or even months for letters to arrive, people now contact others in real time via email, instant messaging, and social networking. Likewise, people can read the news online anytime, anywhere, rather than clinging to their TVs or radios. Wikipedia and other interactive platforms allow people to easily find answers to their questions, without having to wade through voluminous encyclopedias or wait for office hour-working librarians. Internet users exceeded 2.4 billion in 2012, over 34% of the world’s population, with this figure growing roughly 8% each year. There are also as many as 1.1 billion smartphone subscribers right now, an increase of 42% over 2011. However, this is just the beginning. As digital lifestyles are adopted, digital citizenry will shape the behaviors of next-gen consumers, changing the way people live, and shaking up numerous industries. For example, traditional video sales and rental stores are disappearing, and the 244-year old Encyclopedia Britannica is no longer printed. It is very likely that in the next few decades, children will ask why the word newspaper contains the word paper in much the same way as our children today ask why the media is still referred to as the press.
Market Trends33
The age of digital business is drawing near, as seen by our commercial dependence on networks for production and operations.
Network developments have significant influence on business activities. Which business today can even continue to operate if its network fails? E-commerce is booming and extending its reach into every consumer buying decision, whether involving digital content (e-books and digital music), cars, or home appliances, or even small items like snacks and slippers. In 2012 alone, electronic retail sales worldwide totaled US$1.1 trillion. Information technologies will be further applied to enterprise production and operations. Rather than being tools or support components, ICT will become integral to production, decision-making, customer relationship management, service provisioning, marketing, and logistics. ICT will be employed in the building of end-to-end systems that work in real time, playing a role in each and every link, from idea generation to product conceptualization to precision marketing to efficient operations to on-time delivery. In other words, digitization will become a key characteristic of the future enterprise.
A borderless Internet gives rise to a digital society.
Thanks to the boundary-free nature of the Internet, a large number of borderless virtual communities and societies have come into being. A plethora of these communities will combine to form a digital society that transcends borders, cultures, and races. Facebook is home to over one billion users (or netizens), making it the third largest “citizenry” in the world. This type of digital society, which mirrors while extending beyond the physical world, will undoubtedly impact many aspects of social administration and transformation, including politics, economy, law, culture, news & media, security, and ethics, among others.
As a communications tool and support system, information technologies have signif icantly
changed the way in which people live and work over the past few decades. They also spawn new economies and industries while reshuffl ing tradit ional ones. No doubt, the increasing integration of the physical and digital worlds will have a more tremendous impact on society. Such integration will direct ICT development in a way that can better serve society.
Smart infrastructure presents opportunities for further ICT development
Technologically-speaking, ICT innovations mainly fa l l into f ive groups: mobi l i t y, broadband interconnect iv it y, social networking, cloud comput ing, and b ig data process ing. The objective of these innovations is to transform the physical world into a smart world underpinned by smart ICT infrastructure, making the latter key to advancing information-based development.
From big data to “big” wisdom, the IT systems of carriers and enterprises are evolving from post-processing support systems to real-time business systems. This transition marks a fundamental change in how IT functions.
We are living in what may be the “big bang” of information. In 2012, up to 2.4 zettabytes of data (that’s 2.4 billion terabytes) was generated globally; it would take as many as three trillion DVDs to store all this data. By 2020, the amount of data generated is expected to grow sixteen-fold. This data will have two major sources. The first is from the huge amount of transactions between enterprises and between enterprises and consumers. The second is from countless interactions on the Internet, social networks, enterprise service networks, and the Internet of Things. Social networking will be particularly pervasive; it will be emblematic of all applications, not just for social networking utilities like Facebook. Typically, big data has four characteristics: variety, volume, velocity, and value. Velocity and value are most important.
Market Trends 34
By combining the analytical capabilities of the human brain to determine behavioral patterns and the data processing capabilities of computers, we can quickly analyze big data and leverage digital assets to develop valuable diagrams that show relationships, intentions, consumption patterns, interests, and mobility. From big data to “big” wisdom, IT systems will be capable of understanding not only the present preferences of customers but also their future tendencies. This will make social administration, corporate decision-making, and individual lifestyles smarter and more logical. Therefore, IT systems for both enterprises and carriers shall no longer function as post-processing support systems. Rather, they will become real-time business systems that facilitate business operations, a transition that marks a fundamental change in IT.
As traditional IT enterprise architecture is no longer capable of processing the huge volumes of data being encountered, an Internet-oriented cloud computing architecture is needed. The rebuilding of data centers will prove the basis of supporting big data.
Over the past two decades, most enterprises have applied client-server architecture for their IT. Although these systems were constantly upgraded, their technical architecture was not, making each upgrade repetitive and not transformative. With client-server, the server primarily stores small volumes of enterprise transaction data, leaving most data scattered across employee PCs (clients). As Internet technologies have continued to develop, data has begun its migration from the PC to the cloud, causing a sharp spike in data volume for the latter. The need to store such vast volumes is exactly what is driving innovations in computing and storage architectures, and giving rise to the emergence of cloud computing architectures that feature virtualization, parallel computing, distributed storage, and automation, making for a dramatic change over the traditional architectures. In fact, this new push is considered the third major wave of IT transformation
after those related to the mainframe and client/server architecture. Presently, traditional enterprise IT architectures are no longer capable of processing the voluminous amounts of data that they take in. To answer this need, an Internet-oriented cloud computing architecture is required. This architecture will form the basis of both big data and “big” wisdom.
Low-bandwidth networks are hindering information-based development and user experience improvement. A ubiquitous Gigabit network is a prerequisite for any digital society. To lay the foundation for a Terabit-network society, next-gen research is needed.
As public and private clouds develop, the amount of data they carry is sure to mushroom, as the analysis of data is more effective when its storage is centralized. To drive this migration, ubiquitous networking with greater bandwidth is required to support data upload and data usage. Ubiquitous broadband makes cloud computing accessible. Devices across the entire industry chain, including content creation devices (video cameras), cloud computing devices that process information, and terminals where information is generated and consumed (PCs, tablets, etc.) all now support high-definition video, even smartphones that cost only US$150. However, the global network, which has an average bandwidth of only 3.1Mbps, is still unable to support high-definition video, leading to the aforementioned hindrances to user experience. Therefore, we must accelerate the construction of Gigabit networks to enable seamless ultra-broadband access, the basis for building a digital society. We must also intensify our research into and innovation efforts for technologies such as next-generation mobile access, next-generation digital subscriber line (DSL) access, passive optical network (PON) access, next-generation Internet, and all-optical networking (AON). This focus on future networks will lay a solid foundation for building a Terabit-network society.
Market Trends35
To support evolution from a “hard” pipe to a “soft” pipe, we should develop programmable, scalable, application-agile, automatic, and open intelligent networks. Software-defined networking (SDN) will lead to the development of next-gen network architectures.
Technologies are enablers of network development. In the past two decades, driven by advancements of technologies from time-division multiplexing (TDM) towards all-IP, networks have undergone three different revolutions: analog to digital, fixed to mobile, and narrowband to broadband. At present, All-IP networks are undeniably the mainstay for telco and enterprise networks. However, as networks grow, with information flowing in and out in uncertain directions and technologies being upgraded rapidly, it is important that networks be flexible, intelligent, scalable, and automated. Equally important is a change in how we think about network architectural design. The core concepts for cloud computing development, such as virtualization, software decoupling from hardware, centralized resource pool scheduling, automatic deployment, high scalability, and on-demand service provisioning, provide valuable references for network development. Introduction of these concepts into the design of network architectures and products can form the concepts of SDN, including forwarding and control element separation (FORces) to centralize network control and resource scheduling, software decoupling from hardware to virtualize network functions, network function development of cloud-based architecture to realize automatic deployment and high scalability, and application-aware network development to improve network capabilities, among others. By adopting these concepts, we can lead the developments of next-generation product architectures and network architectures, establish an intelligent application-aware network that can intelligently schedule traffic, improve user experience and network utilization, support traffic-based operations, and generate new revenue streams.
Intelligent terminals will not just be tools for communications; they will become extensions of our own senses. Terminals of the future will be context-aware and have intelligent sensory capabilities.
What makes a terminal intelligent is far more than just its CPUs and operating system – It also relates to its sensory capabilities. By using various sensors (compasses, accelerators, gyroscopes, barometers, global positioning systems, light sensors, microphones, cameras, touch screens, temperature sensors, and infrared instruments), we can extend the human sensory and nervous systems in the form of intelligent terminals, bringing us one-step away from true brain-machine interaction. These intelligent terminals will be context-aware, and able to both sense and predict behavior through features such as auto-completion. By combining cloud-based big data analysis capabilities with context-aware terminals, we can provide personalized and intelligent services that realize true human-machine interaction, enabling a dramatic improvement in the user experience.
To respond to the ICT transformation being driven by the integration of the physical world and digital worlds, Huawei has developed a pipe strategy that covers cloud-based data center infrastructure (used for information storage and processing), infrastructure networks (used for information transmission and delivery), and intelligent terminals (used for information creation and consumption). Huawei has also set up its 2012 Laboratories, dedicated to researching next-generation technologies, while developing a SoftCOM (Software Defined Network + teleCOM) network architecture development strategy. Huawei will openly partner with industry peers to raise our information society to a new level.
Independent Auditor’s Report
Independent Auditor’s Report 36
Independent auditor’s report on the consolidated financial statements summary to the Board of Directors of Huawei Investment & Holding Co., Ltd.
We are the auditor of Huawei Investment & Holding Co., Ltd. and its subsidiaries (the “Group”). We have audited the consolidated financial statements of the Group prepared in accordance with International Financial Reporting Standards (the “audited consolidated financial statements”) for the financial year ended December 31, 2012. We have issued an unqualified audit report dated March 15, 2013 on the audited consolidated financial statements of the Group for the financial year ended December 31, 2012.
Huawei Investment & Holding Co., Ltd. is not a public company and is not required to publish its audited consolidated financial statements under the Company Law of the People’s Republic of China.
The Group publishes a consolidated financial statements summary set out on pages 37 to 79 comprising the consolidated balance sheet as at December 31, 2012, the consolidated income statement, the consolidated statement of cash flow for the year then ended, and an accounting policy summary and other explanatory notes, which is derived from the audited consolidated financial statements of the Group. The audited consolidated financial statements and the consolidated financial statements summary do not reflect the effects of events that occurred subsequent to the date of our report on the audited consolidated financial statements.
The consolidated financial statements summary does not contain all the disclosures required by International Financial Reporting Standards in the preparation of the audited consolidated financial statements of the Group, and that reading the consolidated financial statements summary is not a substitute for reading the audited consolidated financial statements of the Group.
Management’s responsibility for the consolidated financial statements summary
Management is responsible for the preparation of a consolidated financial statements summary on the basis described in Note 1(a).
Auditor’s responsibility
Our responsibility is to express an opinion on the consolidated financial statements summary based on our procedures, which were conducted in accordance with International Standard on Auditing 810, “Engagements to Report on Summary Financial Statements”. Our work included examining, on a test basis, evidence supporting the consistency of the amounts and disclosures in the consolidated financial statements summary to the audited consolidated financial statements of the Group. We have not performed an audit on the consolidated financial statements summary, accordingly, we do not express an audit opinion.
Opinion
In our opinion, the consolidated financial statements summary derived from the audited consolidated financial statements of the Group for the year ended December 31, 2012 are consistent, in all material respects, with those consolidated financial statements, on the basis described in Note 1(a).
KPMG Huazhen (Special General Partnership)Certified Public Accountants9th Floor, China Resources Building5001 Shennan East RoadShenzhen 518001, ChinaMarch 27, 2013
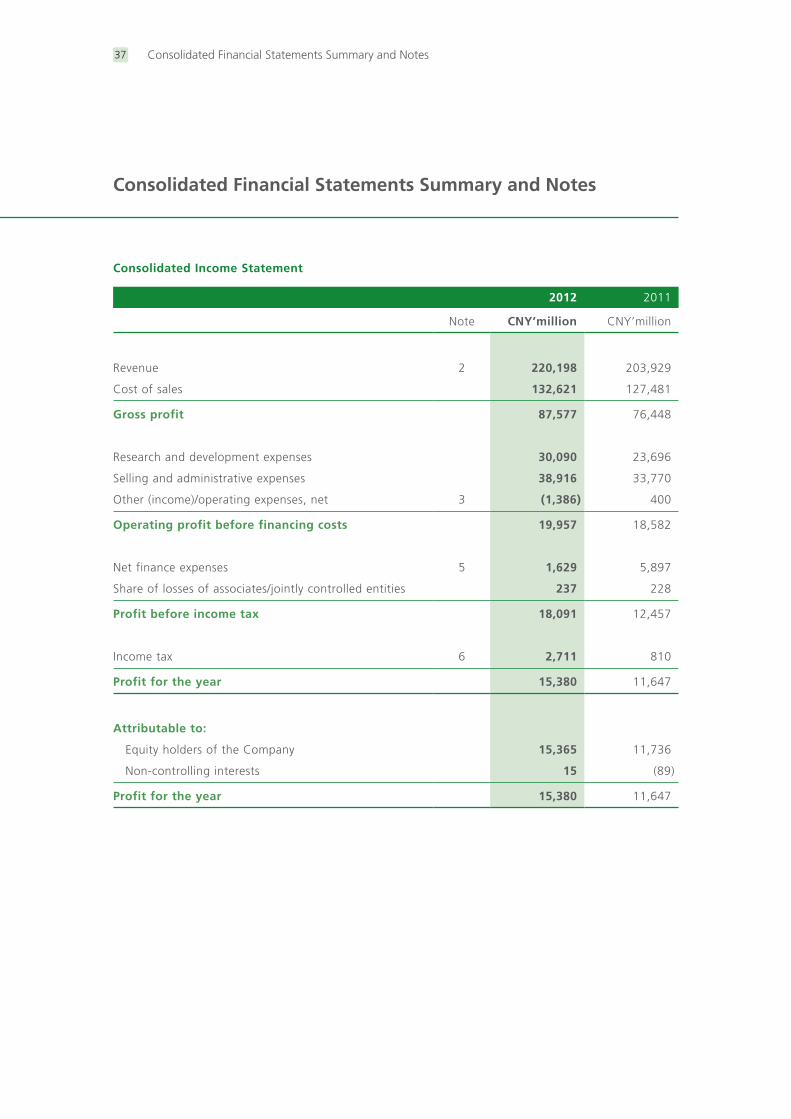
Consolidated Financial Statements Summary and Notes
Consolidated Financial Statements Summary and Notes37
Consolidated Income Statement
2012 2011
Note CNY’million CNY’million
Revenue 2 220,198 203,929
Cost of sales 132,621 127,481
Gross profit 87,577 76,448
Research and development expenses 30,090 23,696
Selling and administrative expenses 38,916 33,770
Other (income)/operating expenses, net 3 (1,386) 400
Operating profit before financing costs 19,957 18,582
Net finance expenses 5 1,629 5,897
Share of losses of associates/jointly controlled entities 237 228
Profit before income tax 18,091 12,457
Income tax 6 2,711 810
Profit for the year 15,380 11,647
Attributable to:
Equity holders of the Company 15,365 11,736
Non-controlling interests 15 (89)
Profit for the year 15,380 11,647
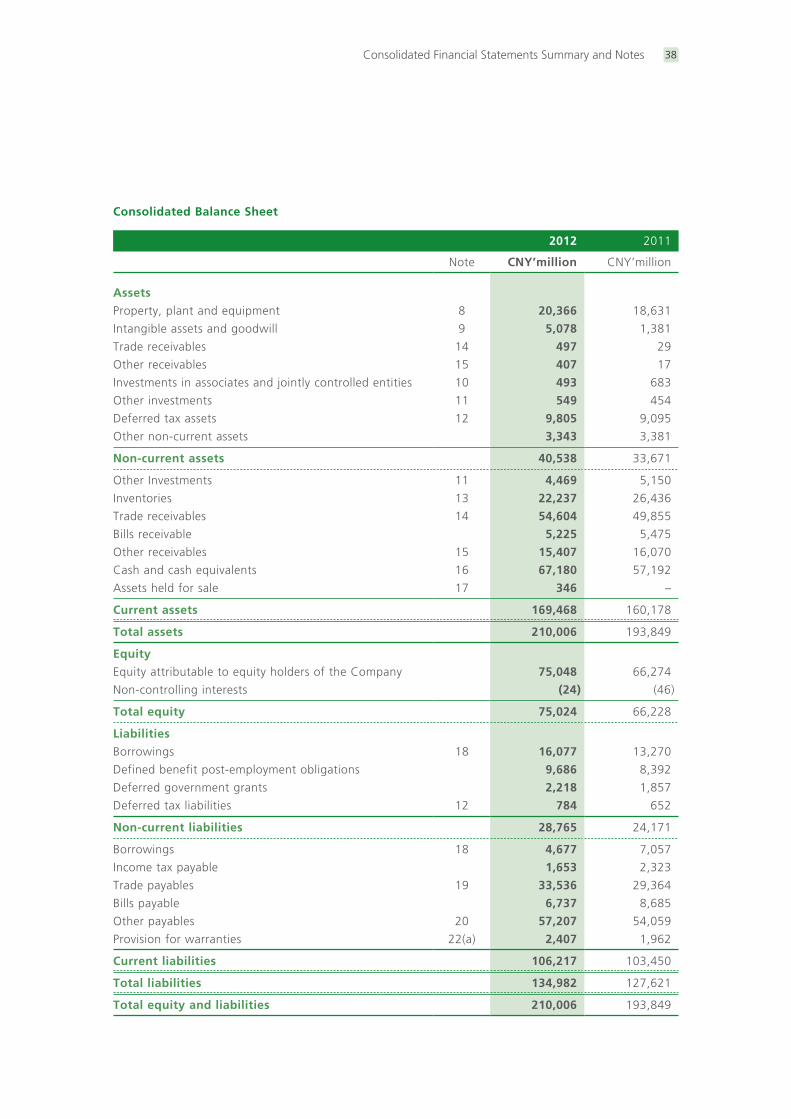
Consolidated Financial Statements Summary and Notes 38
Consolidated Balance Sheet
2012 2011
Note CNY’million CNY’million
Assets
Property, plant and equipment 8 20,366 18,631
Intangible assets and goodwill 9 5,078 1,381
Trade receivables 14 497 29
Other receivables 15 407 17
Investments in associates and jointly controlled entities 10 493 683
Other investments 11 549 454
Deferred tax assets 12 9,805 9,095
Other non-current assets 3,343 3,381
Non-current assets 40,538 33,671
Other Investments 11 4,469 5,150
Inventories 13 22,237 26,436
Trade receivables 14 54,604 49,855
Bills receivable 5,225 5,475
Other receivables 15 15,407 16,070
Cash and cash equivalents 16 67,180 57,192
Assets held for sale 17 346 –
Current assets 169,468 160,178
Total assets 210,006 193,849
Equity
Equity attributable to equity holders of the Company 75,048 66,274
Non-controlling interests (24) (46)
Total equity 75,024 66,228
Liabilities
Borrowings 18 16,077 13,270
Defined benefit post-employment obligations 9,686 8,392
Deferred government grants 2,218 1,857
Deferred tax liabilities 12 784 652
Non-current liabilities 28,765 24,171
Borrowings 18 4,677 7,057
Income tax payable 1,653 2,323
Trade payables 19 33,536 29,364
Bills payable 6,737 8,685
Other payables 20 57,207 54,059
Provision for warranties 22(a) 2,407 1,962
Current liabilities 106,217 103,450
Total liabilities 134,982 127,621
Total equity and liabilities 210,006 193,849
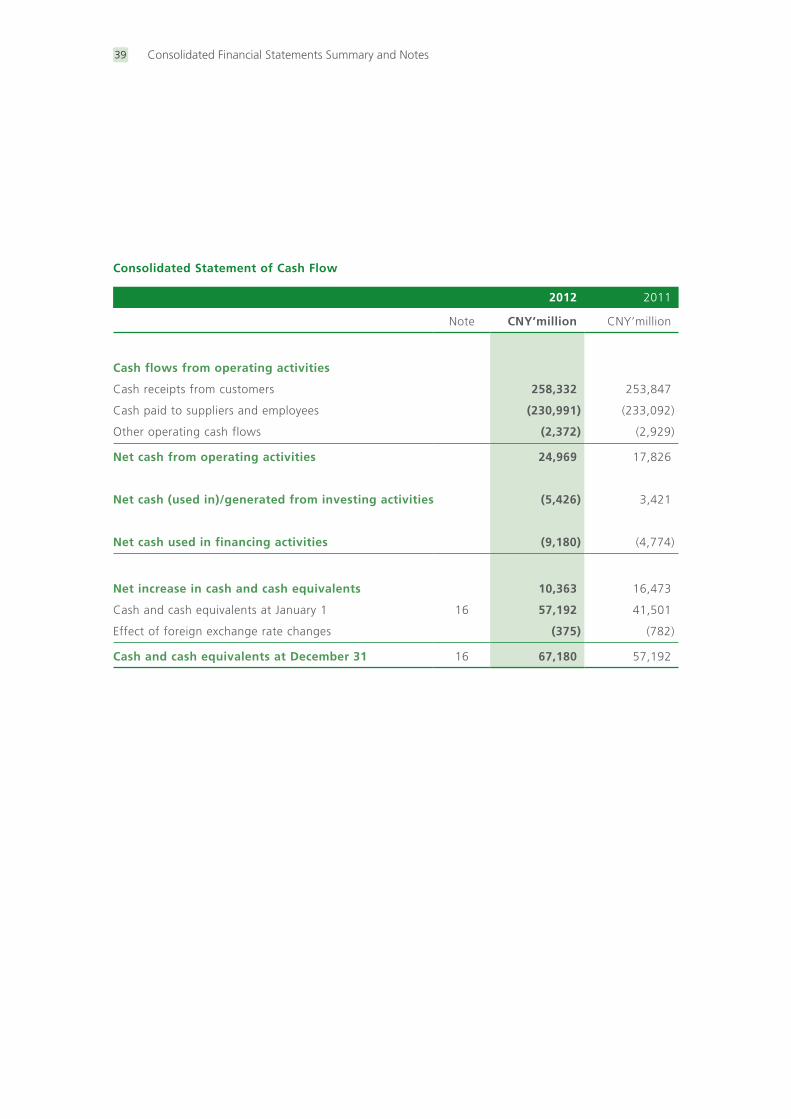
Consolidated Financial Statements Summary and Notes39
Consolidated Statement of Cash Flow
2012 2011
Note CNY’million CNY’million
Cash flows from operating activities
Cash receipts from customers 258,332 253,847
Cash paid to suppliers and employees (230,991) (233,092)
Other operating cash flows (2,372) (2,929)
Net cash from operating activities 24,969 17,826
Net cash (used in)/generated from investing activities (5,426) 3,421
Net cash used in financing activities (9,180) (4,774)
Net increase in cash and cash equivalents 10,363 16,473
Cash and cash equivalents at January 1 16 57,192 41,501
Effect of foreign exchange rate changes (375) (782)
Cash and cash equivalents at December 31 16 67,180 57,192
Consolidated Financial Statements Summary and Notes 40
Notes to the Consolidated Financial Statements Summary
1. Basis of preparation of consolidated financial
statements summary and significant accounting
policies of the Group
(a) Basis of preparation
Huawei Investment & Holding Co., Ltd. (the
“Company”) and its subsidiaries (the “Group”)
have prepared a full set of consolidated
financial statements (“consolidated financial
statements”) for the year ended December 31,
2012 in accordance with International Financial
Reporting Standards (“IFRSs”), which collective
term includes all applicable individual IFRSs,
International Accounting Standards (“IASs”)
and Interpretations issued by the International
Accounting Standards Board (“IASB”).
The consolidated financial statements summary
have been prepared and presented based
on the audited consolidated financial
statements for the year ended December
31, 2012 in order to disclose material
financial and operational information.
The intended users of the consolidated
financial statements summary can obtain
access to the audited consolidated financial
statements for the year ended December
31, 2012 upon consent of the Group’s
Management through the email address,
(b) Functional and presentation currency
All financial information in the consolidated
financial statements summary is presented
in Chinese Yuan (“CNY”), which is the
Company’s functional currency. All financial
information presented in CNY has been
rounded to the nearest million.
(c) Translation of foreign currencies
i) Foreign currency transactions
Transactions in foreign currency during the
year are translated to the respective functional
currencies of group entities at the foreign
exchange rates ruling at the transaction dates.
Monetary assets and liabilities denominated
in foreign currencies at the balance sheet
date are translated to the functional currency
at the foreign exchange rates at that date.
Exchange gains and losses are recognised in
profit or loss.
Non-monetary assets and liabilities that
are measured in terms of historical cost
in a foreign currency are translated using
the foreign exchange rates ruling at the
transaction dates. Non-monetary assets and
liabilities denominated in foreign currencies
that are stated at fair value are translated
using the foreign exchange rates ruling at the
dates the fair value was determined.
ii) Foreign operations
The results of foreign operations, except
for foreign operations in hyperinflationary
economies, are translated into CNY at the
exchange rates approximating the foreign
exchange rates ruling at the dates of the
transactions. Balance sheet items are
translated into CNY at the closing foreign
exchange rates at the balance sheet date.
The resulting exchange differences are
recognised in other comprehensive income
and accumulated separately in equity in the
exchange reserve. However, if the operation
is a non-wholly-owned subsidiary, then the
relevant proportionate share of the translation
difference is allocated to the non-controlling
interest.
Consolidated Financial Statements Summary and Notes41
The results of foreign operations in
hyperinflationary economies are translated
to CNY at the exchange rate ruling at the
balance sheet date. Prior to translating the
financial statements of foreign operations in
hyperinflationary economies, their financial
statements for the current year are restated
to account for changes in the general
purchasing power of the local currency.
The restatement is based on relevant price
indices at the balance sheet date.
When a foreign operation is disposed of
such that control, significant influence or
joint control is lost, the cumulative amount
in the translation reserve related to that
foreign operation is reclassified to profit or
loss as part of the gain or loss on disposal.
When the Group disposes of only part of
its interest in a subsidiary that includes a
foreign operation while retaining control,
the relevant proportion of the cumulative
amount is reattributed to non-controlling
interests. When the Group disposes of only
part of its investment in an associate or joint
venture that includes a foreign operation
while retaining significant influence or joint
control, the relevant proportion of the
cumulative amount is reclassified to profit
or loss.
(d) Business combinations
Business combinations are accounted for using
the acquisition method as at the acquisition
date, which is the date on which control is
transferred to the Group. Control is the power
to govern the financial and operating policies
of an entity so as to obtain benefits from its
activities. In assessing control, the Group takes
into consideration potential voting rights that
currently are exercisable.
The Group measures goodwill at the
acquisition date as:
■ the fair value of the consideration transferred;
plus■ the recognised amount of any non-
controlling interests in the acquiree; plus■ if the business combination is achieved in
stages, the fair value of the pre-existing
equity interest in the acquiree; less■ the net recognised amount (generally fair
value) of the identifiable assets acquired
and liabilities assumed.
When the excess is negative, a bargain
purchase gain is recognised immediately in
profit or loss.
The consideration transferred does not
include amounts related to the settlement
of pre-existing relationships. Such amounts
generally are recognised in profit or loss.
Transactions costs, such as finder’s fee,
legal fees, due diligence fees, and other
professional and consulting fees, that the
Group incurs in connection with a business
combination are expensed as incurred.
Any contingent consideration payable is
measured at fair value at the acquisition
date. If the contingent consideration is
classified as equity, then it is not remeasured
and settlement is accounted for within
equity. Otherwise, subsequent changes in
the fair value of the contingent consideration
are recognised in profit or loss.
Consolidated Financial Statements Summary and Notes 42
(e) Subsidiaries and non-controlling interests
Subsidiaries are entities controlled by the
Group. Control exists when the Group
has the power to govern the financial
and operating policies of an entity so as
to obtain benefits from its activities. In
assessing control, potential voting rights
that presently are exercisable are taken into
account.
An investment in a subsidiary is consolidated
into the consolidated financial statements
from the date that control commences
until the date that control ceases. Intra-
group balances and transactions and
any unrealised profits arising from intra-
group transactions are eliminated in full
in preparing the consolidated financial
statements. Unrealised losses resulting from
intra-group transactions are eliminated in
the same way as unrealised gains but only
to the extent that there is no evidence of
impairment.
Non-controlling interests represent the
equity in a subsidiary not attributable
directly or indirectly to the Company, and
in respect of which the Group has not
agreed any additional terms with the holders
of those interests which would result in
the Group as a whole having a contractual
obligation in respect of those interests that
meets the definition of a financial liability.
For each business combination, the Group
can elect to measure any non-controlling
interests either at fair value or at their
proportionate share of the subsidiary’s net
identifiable assets.
Non-controlling interests are presented
in the consolidated balance sheet within
equity, separately from equity attributable
to the equity holders of the Company. Non-
controlling interests in the results of the
Group are presented on the face of the
consolidated income statement and the
consolidated statement of comprehensive
income as an allocation of the total profit or
loss and total comprehensive income for the
year between non-controlling interests and
the equity holders of the Company.
Changes in the Group’s interests in a subsidiary
that do not result in a loss of control are
accounted for as equity transactions, whereby
adjustments are made to the amounts of
controlling and non-controlling interests within
consolidated equity to reflect the change in
relative interests, but no adjustments are made
to goodwill and no gain or loss is recognised.
When the Group loses control of a subsidiary,
it is accounted for as a disposal of the entire
interest in that subsidiary, with a resulting gain
or loss being recognised in profit or loss. Any
interest retained in that former subsidiary at
the date when control is lost is recognised at
fair value and this amount is regarded as the
fair value on initial recognition of a financial
asset or, when appropriate, the cost on initial
recognition of an investment in an associate or
jointly controlled entity (see note 1(f)).
(f) Associates and jointly controlled entities
An associate is an entity in which the Group
has significant influence, but not control or
joint control, over its management, including
participation in the financial and operating
policy decisions.

Consolidated Financial Statements Summary and Notes43
A jointly controlled entity is an entity which
operates under a contractual arrangement
between the Group and other parties, where
the contractual arrangement establishes that
the Group and one or more of the other
parties share joint control over the economic
activity of the entity.
An investment in an associate or a jointly
controlled entity is accounted for in the
consolidated financial statements under the
equity method. Under the equity method,
the investment is initially recorded at cost,
adjusted for any excess of the Group’s
share of the acquisition-date fair values
of the investee’s identifiable net assets
over the cost of the investment (if any).
Thereafter, the investment is adjusted for
the post acquisition change in the Group’s
share of the investee’s net assets and any
impairment loss relating to the investment
(see note 1(k)). Any acquisition-date excess
over cost, the Group’s share of the post-
acquisition, post-tax results of the investees
and any impairment losses for the year
are recognised in the consolidated income
statement, whereas the Group’s share of
the post-acquisition post-tax items of the
investees’ other comprehensive income is
recognised in the consolidated statement of
comprehensive income.
When the Group’s share of losses exceeds
its interest in the associate or the jointly
controlled entity, the Group’s interest is
reduced to Nil and recognition of further
losses is discontinued except to the extent
that the Group has incurred legal or
constructive obligations or made payments
on behalf of the investee. For this purpose,
the Group’s interest is the carrying amount
of the investment under the equity method
together with the Group’s long-term
interests that in substance form part of the
Group’s net investment in the associate or
the jointly controlled entity.
Unrealised profits and losses resulting from
transactions between the Group and its
associates and jointly controlled entities are
eliminated to the extent of the Group’s
interest in the investee, except where
unrealised losses provide evidence of an
impairment of the asset transferred, in
which case they are recognised immediately
in profit or loss.
When the Group ceases to have significant
influence over an associate or joint control
over a jointly controlled entity, it is accounted
for as a disposal of the entire interest in
that investee, with a resulting gain or loss
being recognised in profit or loss. Any
interest retained in that former investee at
the date when significant influence or joint
control is lost is recognised at fair value and
this amount is regarded as the fair value
on initial recognition of a financial asset
or, when appropriate, the cost on initial
recognition of an investment in an associate.
(g) Investment properties
Investment properties are buildings which
are owned to earn rental income and/or for
capital appreciation.
Investment properties are stated in the
consolidated balance sheet at cost less
depreciation and impairment losses (see
note 1(k)). Rental income from investment
properties is accounted for as described in
note 1(u)(iv).

Consolidated Financial Statements Summary and Notes 44
Depreciation is calculated to write off the cost of buildings, less their estimated residual value (5%), using the straight line method over their estimated useful life of 20 years.
(h) Other property, plant and equipment
i) Recognition and measurementItems of property, plant and equipment are measured in the consolidated balance sheet at cost less accumulated depreciation (see below) and accumulated impairment losses (see note 1(k)). Cost includes expenditure that is directly attributable to the acquisition of the assets. The cost of self-constructed items of property, plant and equipment includes the cost of materials, direct labour, the initial estimate, where relevant, of the costs of dismantling and removing the items and restoring the site on which they are located, and an appropriate proportion of production overheads and borrowing costs (see note 1(v)).
Where parts of an item of property, plant and equipment have different useful lives, the cost is allocated on a reasonable basis between the parts and each part is depreciated separately.
Gains or losses arising from the retirement or disposal of an item of property, plant and equipment, are determined as the difference between the net disposal proceeds and the carrying amount of the item and are recognised in profit or loss on the date of retirement or disposal.
Construction in progress is transferred to other property, plant and equipment when it is ready for its intended use. No depreciation is provided against construction in progress.
ii) Subsequent costsThe cost of replacing part of an item of property, plant and equipment is recognised in the carrying amount of the item if it is probable that the future economic benefits embodied within the part will flow to the Group and its cost can be measured reliably. The carrying amount of the replaced component is derecognised. The costs of the day-to-day servicing of property, plant and equipment are recognised in profit or loss as incurred.
iii) DepreciationDepreciation is calculated to write off the cost of items of property, plant and equipment, less their estimated residual value, if any, using the straight line method over their estimated useful lives as follows:
Estimated useful
lives
Estimated rate of
residual value
Freehold land is not
depreciated
Buildings 20 years 5%
Machinery, electronic
equipment and other
equipment
3 – 10 years 5%
Motor vehicles 5 years 5%
Decoration and leasehold
improvements2 – 5 years Nil
Where parts of an item of property, plant and equipment have different useful lives, the cost or valuation of the item is allocated on a reasonable basis between the parts and each part is depreciated separately. Both the useful life of an item of property, plant and equipment and its residual value, if any, are reviewed annually.
Consolidated Financial Statements Summary and Notes45
(i) Intangible assets
i) Goodwill
Goodwill that arises on the acquisition of
subsidiaries is presented with intangible
assets. For the measurement of goodwill at
initial recognition, see note 1(d).
Goodwill is subsequently measured at cost
less accumulated impairment losses (see
note 1(k)). In respect of equity-accounted
investees, the carrying amount of goodwill
is included in the carrying amount of the
investment, and any impairment loss is
allocated to the carrying amount of the
equity-accounted investee as a whole.
ii) Research and development
Research and development costs comprise
all costs that are directly attributable to
research and development activities or that
can be allocated on a reasonable basis to
such activities. Because of the nature of the
Group’s research and development activities,
the criteria for the recognition of such costs
as assets are generally not met until late
in the development stage of the project
when the remaining development costs are
immaterial. Hence both research costs and
development costs are generally recognised
as expenses in profit or loss in the period in
which they are incurred.
iii) Other intangible assets
Other intangible assets that are acquired
by the Group are stated in the consolidated
balance sheet at cost less accumulated
amortisation (where the estimated useful
life is finite) and accumulated impairment
losses (see note 1(k)).
iv) Amortisation
Amortisation of intangible assets with finite
useful lives is charged to profit or loss on a
straight-line basis over the assets’ estimated
useful lives. The following intangible assets
with finite useful lives are amortised from
the date they are available for use and their
estimated useful lives are as follows:
Software 3 years
Patents 3 – 22 years
Trademark 10 years
Both the period and method of amortisation
are reviewed annually.
Intangible assets are not amortised while
their useful lives are assessed to be
indefinite. Any conclusion that the useful
life of an intangible asset is indefinite is
reviewed annually to determine whether
events and circumstances continue to
support the indefinite useful life assessment
for that asset. If they do not, the change in
the useful life assessment from indefinite to
finite is accounted for prospectively from
the date of change and in accordance with
the policy for amortisation of intangible
assets with finite lives as set out above.
The Group has no intangible assets with
indefinite useful life.
(j) Leased assets
An arrangement, comprising a transaction or
a series of transactions, is or contains a lease
if the Group determines that the arrangement
conveys a right to use a specific asset or assets
for an agreed period of time in return for
a payment or a series of payments. Such a
Consolidated Financial Statements Summary and Notes 46
determination is made based on an evaluation
of the substance of the arrangement and is
regardless of whether the arrangement takes
the legal form of a lease.
i) Classification of assets leased to the Group
Assets that are held by the Group under
leases which transfer to the Group
substantially all the risks and rewards of
ownership are classified as being held under
finance leases. Leases which do not transfer
substantially all the risks and rewards of
ownership to the Group are classified as
operating leases.
ii) Operating lease charges
Where the Group has the use of assets
held under operating leases, payments
made under the leases are charged to
profit or loss in equal instalments over the
accounting periods covered by the lease
term, except where an alternative basis
is more representative of the pattern of
benefits to be derived from the leased asset.
Lease incentives received are recognised
in profit or loss as an integral part of
the aggregate net lease payments made.
Contingent rentals are charged to profit or
loss in the accounting period in which they
are incurred.
(k) Impairment of assets
i) Impairment of investments in debt and
equity securities and others receivables
Investments in debt and equity securities and
other current and non-current receivables
that are stated at cost or amortised cost or
are classified as available-for-sale securities
are reviewed at each balance sheet date
to determine whether there is objective
evidence of impairment. Objective evidence
of impairment includes observable data that
comes to the attention of the Group about
one or more of the following loss events:
■ significant financial difficulty of the
debtor;■ a breach of contract, such as a default
or delinquency in interest or principal
payments;■ it becoming probable that the debtor
will enter bankruptcy or other financial
reorganisation;■ significant changes in the technological,
market, economic or legal environment
that have an adverse effect on the debtor;
and■ a significant or prolonged decline in the
fair value of an investment in an equity
instrument below its cost.
If any such evidence exists, any impairment
loss is determined and recognised as follows:
■ For investments in associates and jointly
controlled entities recognised using
the equity method (see note 1(f)), the
impairment loss is measured by comparing
the recoverable amount of the investment
as a whole with its carrying amount
in accordance with note 1(k)(ii). The
impairment loss is reversed if there has
been a favourable change in the estimates
used to determine the recoverable amount
in accordance with note 1(k)(ii).
Consolidated Financial Statements Summary and Notes47
■ For unquoted equity securities carried
at cost, the impairment loss is measured
as the difference between the carrying
amount of the financial asset and present
value of estimated future cash flows,
discounted at the current market rate of
return for a similar financial asset where
the effect of discounting is material.
Impairment losses for equity securities
are not reversed.
■ For available-for-sale securities, the
cumulative loss that has been recognised
in the fair value reserve is reclassified
to profit or loss. The amount of the
cumulative loss that is recognised in
profit or loss is the difference between
the acquisition cost (net of any principal
repayment and amortisation) and current
fair value, less any impairment loss on
that asset previously recognised in profit
or loss. Impairment losses in respect
of available-for-sale debt securities are
reversed if the subsequent increase in fair
value can be objectively related to an event
occurring after the impairment loss was
recognised. Reversals of impairment losses
in such circumstances are recognised in
profit or loss.
■ For trade and other current receivables and
other financial assets carried at amortised
cost, the impairment loss is measured
as the difference between the asset’s
carrying amount and the present value of
estimated future cash flows, discounted
at the financial asset’s original effective
interest rate (i.e. the effective interest
rate computed at initial recognition
of these assets), where the effect of
discounting is material. This assessment
is made collectively where financial assets
carried at amortised cost share similar risk
characteristics, such as similar past due
status, and have not been individually
assessed as impaired. Future cash flows
for financial assets which are assessed
for impairment collectively are based on
historical loss experience for assets with
credit risk characteristics similar to the
collective group.
If in a subsequent period the amount of
an impairment loss decreases and the
decrease can be linked objectively to an
event occurring after the impairment loss
was recognised, the impairment loss is
reversed through profit or loss. A reversal
of an impairment loss shall not result in
the asset’s carrying amount exceeding
that which would have been determined
had no impairment loss been recognised
in prior years.
Impairment losses are written off against the
corresponding assets directly, except for
impairment losses recognised in respect of
trade debtors and bills receivable included
within trade and other receivables, whose
recovery is considered doubtful but not
remote. In this case, the impairment losses
for doubtful debts are recorded using
an allowance account. When the Group
is satisfied that recovery is remote, the
amount considered irrecoverable is written
off against trade debtors and bills receivable
directly and any amounts held in the
allowance account relating to that debt are
reversed. Subsequent recoveries of amounts
previously charged to the allowance account
are reversed against the allowance account.
Other changes in the allowance account and
Consolidated Financial Statements Summary and Notes 48
subsequent recoveries of amounts previously
written off directly are recognised in profit
or loss.
ii) Impairment of other assets
Internal and external sources of information
are reviewed at each balance sheet date to
identify indications that the following assets
may be impaired or an impairment loss
previously recognised no longer exists or may
have decreased:
■ property, plant and equipment;■ long-term leasehold prepayments;■ other long term deferred assets; and■ intangible assets and goodwill
If any such indication exists, the asset’s
recoverable amount is estimated. In
addition, for intangible assets that are not
yet available for use, goodwill and intangible
assets that have indefinite useful lives, the
recoverable amount is estimated annually
whether or not there is any indication of
impairment.
■ Calculation of recoverable amount
The recoverable amount of an asset is
the greater of its fair value less costs to
sell and value in use. In assessing value
in use, the estimated future cash flows
are discounted to their present value
using a pre-tax discount rate that reflects
current market assessments of time value
of money and the risks specific to the
asset. Where an asset does not generate
cash inflows largely independent of those
from other assets, the recoverable amount
is determined for the smallest group
of assets that generates cash inflows
independently (i.e. a cash-generating
unit). Goodwill acquired in a business
combination is allocated to groups of
cash generating units that are expected
to benefit from the synergies of the
combination.
■ Recognition of impairment loss
An impairment loss is recognised in profit
or loss if the carrying amount of an asset,
or the cash-generating unit to which it
belongs, exceeds its recoverable amount.
Impairment losses recognised in respect
of cash-generating units are allocated
first to reduce the carrying amount of any
goodwill allocated to the cash-generating
unit (or group of units) and then, to
reduce the carrying amount of the other
assets in the unit (or group of units) on
a pro rata basis, except that the carrying
value of an asset will not be reduced
below its individual fair value less costs to
sell, or value in use, if determinable.
■ Reversals of impairment losses
An impairment loss is reversed if there has
been a favourable change in the estimates
used to determine the recoverable
amount.
An impairment loss in respect of goodwill is
not reversed. For other assets, a reversal
of an impairment loss is limited to the
asset’s carrying amount that would have
been determined had no impairment loss
been recognised in prior years. Reversals
of impairment losses are credited to profit
or loss in the year in which the reversals
are recognised.
Consolidated Financial Statements Summary and Notes49
(l) Inventories
Inventories are carried at the lower of cost
and net realisable value.
Cost is calculated using the standard cost
method with periodical adjustments of
cost variance to arrive at the actual cost,
which approximates actual cost on a first-
in first-out basis. The cost of inventories
includes expenditures incurred in acquiring
the inventories and bringing them to their
existing location and condition. In the case
of manufactured inventories and work in
progress, cost includes an appropriate share
of overheads based on normal operating
capacity.
Net realisable value is the estimated selling
price in the ordinary course of business, less
the estimated costs of completion and the
estimated costs necessary to make the sale.
When inventories are sold, the carrying
amount of those inventories is recognised
as an expense in the period in which the
related revenue is recognised. The amount
of any write-down of inventories to net
realisable value and all losses of inventories
are recognised as an expense in the period
the write-down or loss occurs. The amount
of any reversal of any write-down of
inventories is recognised as a reduction in
the amount of inventories recognised as an
expense in the period in which the reversal
occurs.
(m) Construction contracts
Construction contracts are contracts
specifically negotiated with a customer for
the construction of an asset or a group of
assets, where the customer is able to specify
the major structural elements of the design.
The accounting policy for contract revenue
is set out in note 1(u)(ii). When the outcome
of a construction contract can be estimated
reliably, contract costs are recognised as
an expense by reference to the stage of
completion of the contract at the balance
sheet date. When it is probable that total
contract costs will exceed total contract
revenue, the expected loss is recognised
as an expense immediately. When the
outcome of a construction contract cannot
be estimated reliably, contract costs are
recognised as an expense in the period in
which they are incurred.
Construction contracts in progress at the
balance sheet date are recorded in the
consolidated balance sheet at the net amount
of costs incurred plus recognised profit less
recognised losses and progress billings, and
are presented in the consolidated balance
sheet as the “gross amount due from third-
party customers for contract work” (as an
asset) or the “gross amount due to third-
party customers for contract work” (as a
liability), as applicable. Progress billings not
yet paid by the customer are included in the
consolidated balance sheet under “other
receivables”. Amounts received before the
related work is performed are included in
the consolidated balance sheet, as a liability,
as “other payables”.
Consolidated Financial Statements Summary and Notes 50
(n) Trade and other receivables
Trade and other receivables are initially
recognised at fair value and thereafter
stated at amortised cost less impairment
losses for bad and doubtful debts (see
note 1(k)), except where the receivables are
interest-free loans made to related parties
without any fixed repayment terms or the
effect of discounting would be immaterial.
In such cases, the receivables are stated
at cost less impairment losses for bad and
doubtful debts.
(o) Interest-bearing borrowings and corporate
bond
Interest-bearing borrowings and corporate
bond are recognised initially at fair value less
attributable transaction costs. Subsequent
to initial recognition, interest-bearing
borrowings and corporate bond are stated
at amortised cost with any difference
between the amount initially recognised
and redemption value being recognised in
the consolidated income statement over the
period of the borrowings or bond, together
with any interest and fees payable, using the
effective interest method.
(p) Trade and other payables
Trade and other payables are initially recognised
at fair value and subsequently stated at
amortised cost unless the effect of
discounting would be immaterial, in which
case they are stated at cost.
(q) Cash and cash equivalents
Cash and cash equivalents comprise cash
at bank and on hand and call deposits with
banks. Bank overdrafts that are repayable
on demand and form an integral part of the
Group’s cash management are also included
as a component of cash and cash equivalents
for the purpose of the consolidated cash
flow statement.
(r) Employee benefits
i) Short term employee benefits and contributions
to defined contribution retirement plans
Salaries, annual bonuses, paid annual leave
and contributions to defined contribution
retirement plans are accrued in the year in
which the associated services are rendered
by employees. Where payment or settlement
is deferred and the effect would be material,
these amounts are stated at their present
values.
ii) Defined benefit plan obligations
The Group’s net obligation in respect of
defined benefit plans is calculated separately
for each plan by estimating the amount of
future benefit that employees have earned
in return for their service in the current and
prior periods; that benefit is discounted to
determine the present value and the fair
value of any plan assets is deducted. The
discount rate is the yield at the balance
sheet date on high quality corporate bonds
that have maturity dates approximating
the terms of the Group’s obligations. The
calculation is performed by management
using the projected unit credit method.
Consolidated Financial Statements Summary and Notes51
When the benefits of a plan are improved,
the portion of the increased benefit relating
to past service by employees is recognised
as an expense in profit or loss on a straight
line basis over the average period until
the benefits become vested. If the benefits
vest immediately, the expense is recognised
immediately in profit or loss.
In calculating the Group’s obligation in
respect of a plan, any actuarial gain or loss
is recognised in profit or loss immediately.
(s) Provisions and contingent liabilities
i) Provision for warranties
The Group provides warranty on its products
for a period typically covers 12 to 24 months.
The warranty generally includes parts, labour
and service centre support. The Group
estimates the costs that may be incurred
under its warranty obligations and records
a liability in the amount of such costs at
the time revenue is recognised. Factors that
affect the Group’s warranty liability include
the number of installed units, historical and
anticipated rates of warranty claims. The
Group periodically assesses the adequacy of
its recorded warranty liabilities and adjusts
the amounts as necessary.
ii) Other provisions and contingent liabilities
Provisions are recognised for other liabilities of
uncertain timing or amount when the Group
has a legal or constructive obligation arising as
a result of a past event, it is probable that an
outflow of economic benefits will be required
to settle the obligation and a reliable estimate
can be made. Where the time value of money
is material, provisions are stated at the present
value of the expenditure expected to settle
the obligation.
Where it is not probable that an outflow
of economic benefits will be required, or
the amount cannot be estimated reliably,
the obligation is disclosed as a contingent
liability, unless the probability of outflow
of economic benefits is remote. Possible
obligations, whose existence will only
be confirmed by the occurrence or non-
occurrence of one or more future events are
also disclosed as contingent liabilities unless
the probability of outflow of economic
benefits is remote.
(t) Income tax
Income tax for the year comprises current
tax and movements in deferred tax assets
and liabilities. Current tax and movements
in deferred tax assets and liabilities are
recognised in profit or loss except to the extent
that they relate to a business combination
or items recognised in other comprehensive
income or directly in equity, in which case
the relevant amounts of tax are recognised
in other comprehensive income or directly in
equity, respectively.
Current tax is the expected tax payable on
the taxable income for the year, using tax
rates enacted or substantively enacted at
the balance sheet date, and any adjustment
to tax payable in respect of previous years.
Deferred tax assets and liabilities arise
from deductible and taxable temporary
dif ferences respectively, being the
differences between the carrying amounts
Consolidated Financial Statements Summary and Notes 52
of assets and liabilities for financial reporting
purposes and their tax bases. Deferred tax
assets also arise from unused tax losses and
unused tax credits.
All deferred tax liabilities, and all deferred
tax assets to the extent that it is probable
that future taxable profits will be available
against which the asset can be utilised, are
recognised. Future taxable profits that may
support the recognition of deferred tax
assets arising from deductible temporary
differences include those that will arise from
the reversal of existing taxable temporary
differences, provided those differences relate
to the same taxation authority and the same
taxable entity, and are expected to reverse
either in the same period as the expected
reversal of the deductible temporary
difference or in periods into which a tax loss
arising from the deferred tax asset can be
carried back or forward. The same criteria
are adopted when determining whether
existing taxable temporary differences
support the recognition of deferred tax
assets arising from unused tax losses and
credits, that is, those differences are taken
into account if they relate to the same
taxation authority and the same taxable
entity, and are expected to reverse in a
period, or periods, in which the tax loss or
credit can be utilised.
The amount of deferred tax recognised is
measured based on the expected manner
of realisation or settlement of the carrying
amount of the assets and liabilities, using
tax rates enacted or substantively enacted at
the balance sheet date. Deferred tax assets
and liabilities are not discounted.
The carrying amount of a deferred tax asset
is reviewed at each balance sheet date and
is reduced to the extent that it is no longer
probable that sufficient taxable profits will
be available to allow the related tax benefit
to be utilised. Any such reduction is reversed
to the extent that it becomes probable that
sufficient taxable profits will be available.
Current tax balances and deferred tax
balances, and movements therein, are
presented separately from each other and
are not offset. Current tax assets are offset
against current tax liabilities, and deferred
tax assets against deferred tax liabilities, if
the Group has the legally enforceable right
to set off current tax assets against current
tax liabilities and the following additional
conditions are met:
■ in the case of current tax assets and
liabilities, the Group intends either to
settle on a net basis, or to realise the asset
and settle the liability simultaneously; or■ in the case of deferred tax assets and
liabilities, if they relate to income taxes
levied by the same taxation authority on
either:■ the same taxable entity; or■ different taxable entities, which, in
each future period in which significant
amounts of deferred tax liabilities or
assets are expected to be settled or
recovered, intend to realise the current
tax assets and settle the current tax
liabilities on a net basis or realise and
settle simultaneously.
Consolidated Financial Statements Summary and Notes53
(u) Revenue recognition
Revenue is measured at the fair value of
the consideration received or receivable.
Provided it is probable that the economic
benefits will flow to the Group and the
revenue and costs, if applicable, can be
measured reliably, revenue is recognised in
profit or loss as follows:
i) Sales of goods and services rendered
Revenue from sales of goods is recognised
when the significant risks and rewards of
ownership of goods have been transferred
to the buyer. Revenue from provision of
services is recognised at the time when
the services are provided. No revenue
is recognised if there are significant
uncertainties regarding the recovery of the
consideration due, associated costs or the
possible return of goods. Revenue excludes
value added tax or other sales taxes and is
after deduction of any trade discounts.
ii) Contract revenue
When the outcome of a construction
contract can be estimated reliably, revenue
from a fixed price contract is recognised
using the percentage of completion method,
measured by reference to the percentage of
contract costs incurred to date to estimated
total contract costs for the contract.
When the outcome of a construction
contract cannot be estimated reliably,
revenue is recognised only to the extent of
contract costs incurred that it is probable
will be recoverable.
iii) Government grants
Government grants are recognised in the
consolidated balance sheet initially when
there is reasonable assurance that they
will be received and that the Group will
comply with the conditions attaching to
them. Grants that compensate the Group for
expenses incurred are recognised as revenue
in profit or loss on a systematic basis in the
same periods in which the expenses are
incurred. Grants that compensate the Group
for the cost of an asset are recognised
as deferred income and consequently are
effectively recognised in profit or loss on a
systematic basis over the useful life of the
asset.
iv) Rental income from operating leases
Rental income receivable under operating
leases is recognised in profit or loss in equal
instalments over the periods covered by
the lease term, except where an alternative
basis is more representative of the pattern
of benefits to be derived from the use of
the leased asset. Lease incentives granted
are recognised in profit or loss as an integral
part of the aggregate net lease payments
receivable. Contingent rentals are recognised
as income in the accounting period in which
they are earned.
(v) Finance income and expenses
Finance income comprises dividend and
interest income on funds invested (including
available-for-sale financial assets), gains on
the disposal of available-for-sale financial
assets, and changes in the fair value of
financial assets held for trading. Interest
income is recognised as it accrues using the

Consolidated Financial Statements Summary and Notes 54
effective interest method. Dividend income
from listed and unlisted investments is
recognised when the equity holder’s right
to receive payment is established; dividend
income from listed investments is recognised
when the share price of the investment goes
ex-dividend.
Finance costs comprise interest expense on
borrowings, unwinding of the discount on
provisions and impairment losses recognised
on financial assets. Borrowing costs that
are directly attributable to the acquisition,
construction or production of a qualifying
asset which necessarily takes a substantial
period of time to get ready for its intended
use or sale are capitalised as part of the
cost of that asset. Other borrowing costs
are expensed in the period in which they
are incurred.
The capitalisation of borrowing costs as part
of the cost of a qualifying asset commences
when expenditure for the asset is being
incurred, borrowing costs are being incurred
and activities that are necessary to prepare
the asset for its intended use or sale are in
progress. Capitalisation of borrowing costs
is suspended or ceases when substantially
all the activities necessary to prepare the
qualifying asset for its intended use or sale
are interrupted or completed.
Foreign currency gains and losses are
reported on a net basis.
(w) Factoring without recourse
Factoring without recourse constitutes
transfer of trade receivables. The Group
transfers its trade receivables to banks
or financial institutions; the bank or the
financial institutions fully bears the
collection risk without the right to receive
payments from the Group in the event a
loss occurs due to the non-collectibility of
the receivables transferred. The Group’s
customers make payments of the receivables
transferred directly to the bank or the financial
institutions.
In a factoring without recourse, trade
receivables transferred are derecognised
from the consolidated balance sheet. Excess
of carrying amount of trade receivables over
cash received from the banks or financial
institutions arising from factoring without
recourse is included in the “other operating
expenses” of the consolidated income
statement.
(x) Non-current assets held for sale
A non-current asset (or disposal group) is
classified as held for sale if it is highly
probable that its carrying amount will be
recovered through a sale transaction rather
than through continuing use and the asset
(or disposal group) is available for sale in
its present condition. A disposal group is a
group of assets to be disposed of together as
a group in a single transaction, and liabilities
directly associated with those assets that will
be transferred in the transaction.
Immediately before classification as held-for-
sale, the measurement of the non-current
assets (and all individual assets and liabilities
in a disposal group) is brought up-to-date
in accordance with the accounting policies
before the classification. Thereafter, on
initial classification as held for sale until
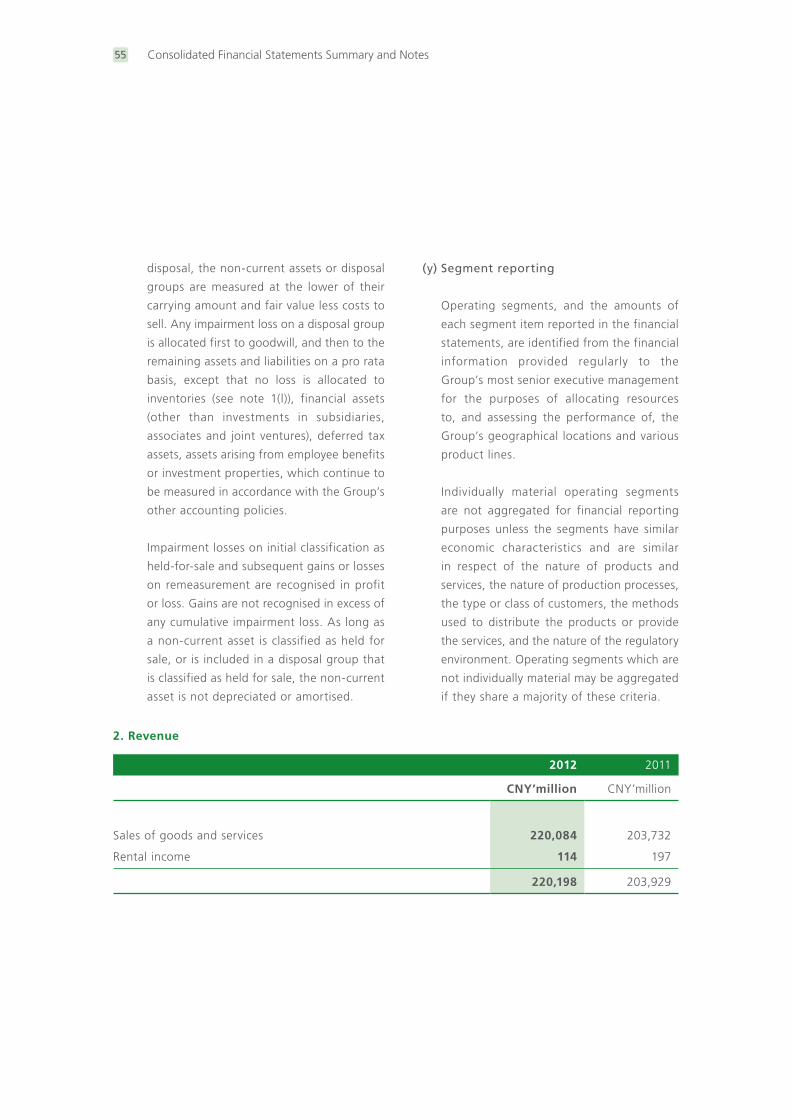
Consolidated Financial Statements Summary and Notes55
disposal, the non-current assets or disposal
groups are measured at the lower of their
carrying amount and fair value less costs to
sell. Any impairment loss on a disposal group
is allocated first to goodwill, and then to the
remaining assets and liabilities on a pro rata
basis, except that no loss is allocated to
inventories (see note 1(l)), financial assets
(other than investments in subsidiaries,
associates and joint ventures), deferred tax
assets, assets arising from employee benefits
or investment properties, which continue to
be measured in accordance with the Group’s
other accounting policies.
Impairment losses on initial classification as
held-for-sale and subsequent gains or losses
on remeasurement are recognised in profit
or loss. Gains are not recognised in excess of
any cumulative impairment loss. As long as
a non-current asset is classified as held for
sale, or is included in a disposal group that
is classified as held for sale, the non-current
asset is not depreciated or amortised.
(y) Segment reporting
Operating segments, and the amounts of
each segment item reported in the financial
statements, are identified from the financial
information provided regularly to the
Group’s most senior executive management
for the purposes of allocating resources
to, and assessing the performance of, the
Group’s geographical locations and various
product lines.
Individually material operating segments
are not aggregated for financial reporting
purposes unless the segments have similar
economic characteristics and are similar
in respect of the nature of products and
services, the nature of production processes,
the type or class of customers, the methods
used to distribute the products or provide
the services, and the nature of the regulatory
environment. Operating segments which are
not individually material may be aggregated
if they share a majority of these criteria.
2. Revenue
2012 2011
CNY’million CNY’million
Sales of goods and services 220,084 203,732
Rental income 114 197
220,198 203,929
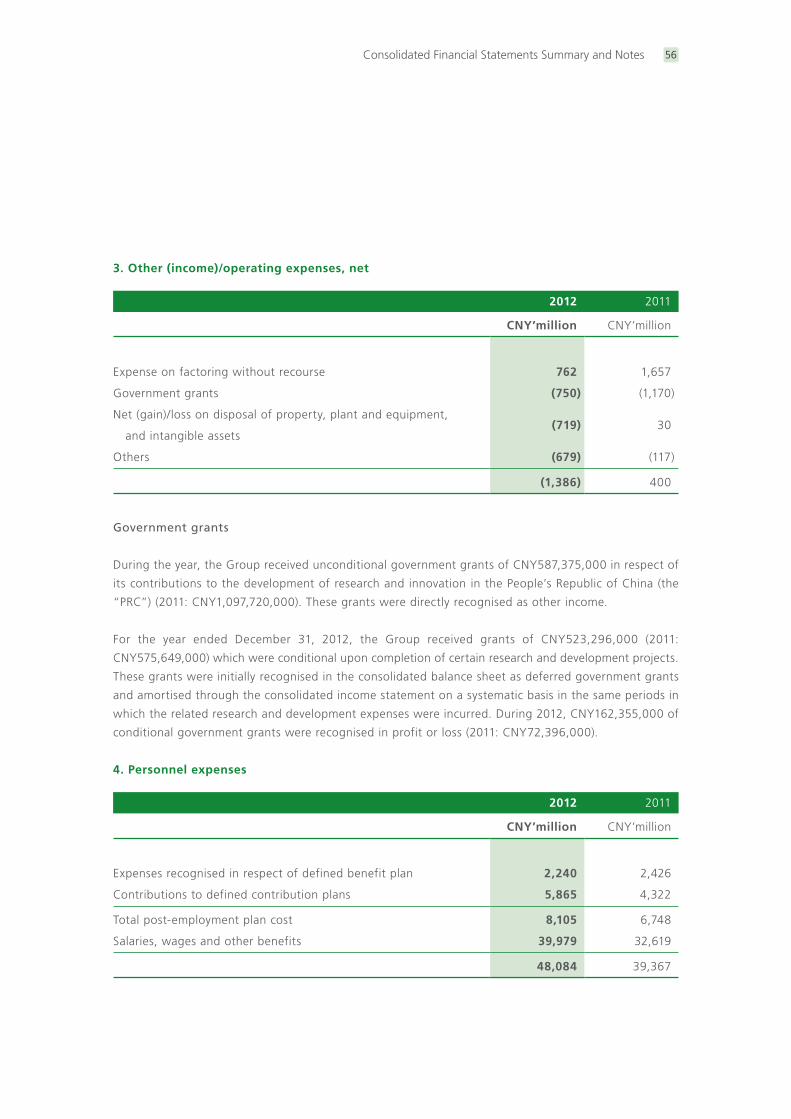
Consolidated Financial Statements Summary and Notes 56
3. Other (income)/operating expenses, net
2012 2011
CNY’million CNY’million
Expense on factoring without recourse 762 1,657
Government grants (750) (1,170)
Net (gain)/loss on disposal of property, plant and equipment,
and intangible assets(719) 30
Others (679) (117)
(1,386) 400
Government grants
During the year, the Group received unconditional government grants of CNY587,375,000 in respect of
its contributions to the development of research and innovation in the People’s Republic of China (the
“PRC”) (2011: CNY1,097,720,000). These grants were directly recognised as other income.
For the year ended December 31, 2012, the Group received grants of CNY523,296,000 (2011:
CNY575,649,000) which were conditional upon completion of certain research and development projects.
These grants were initially recognised in the consolidated balance sheet as deferred government grants
and amortised through the consolidated income statement on a systematic basis in the same periods in
which the related research and development expenses were incurred. During 2012, CNY162,355,000 of
conditional government grants were recognised in profit or loss (2011: CNY72,396,000).
4. Personnel expenses
2012 2011
CNY’million CNY’million
Expenses recognised in respect of defined benefit plan 2,240 2,426
Contributions to defined contribution plans 5,865 4,322
Total post-employment plan cost 8,105 6,748
Salaries, wages and other benefits 39,979 32,619
48,084 39,367
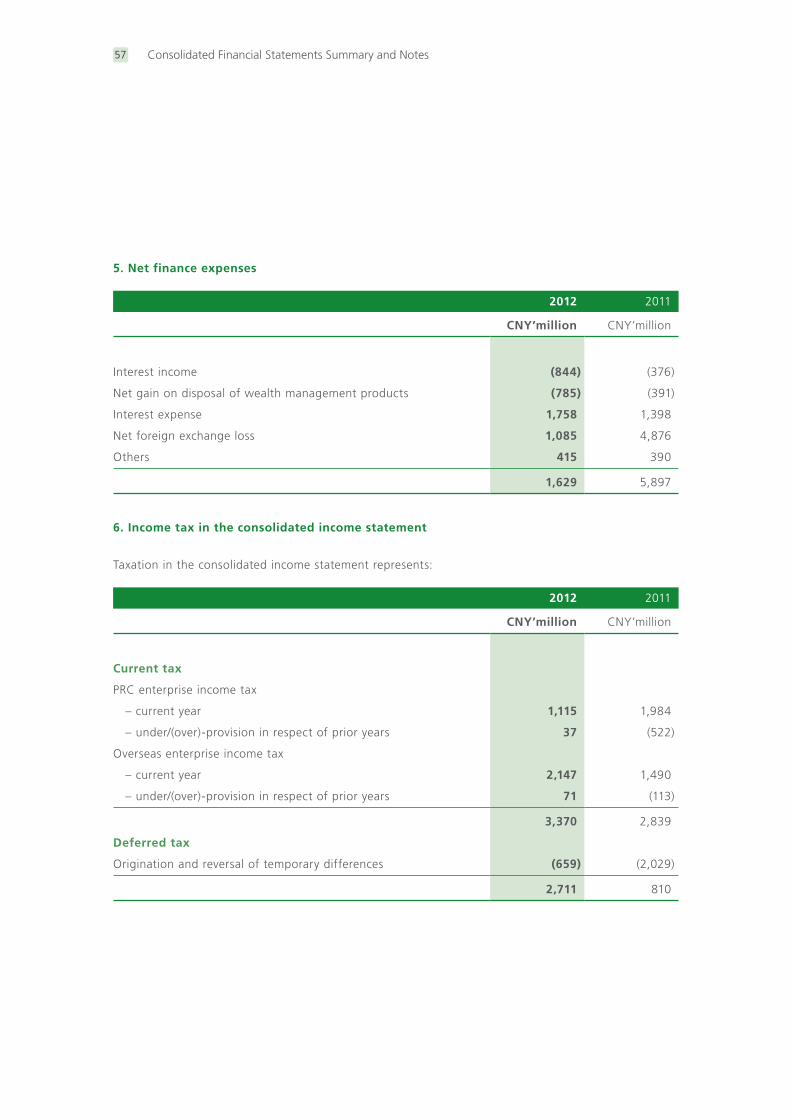
Consolidated Financial Statements Summary and Notes57
5. Net finance expenses
2012 2011
CNY’million CNY’million
Interest income (844) (376)
Net gain on disposal of wealth management products (785) (391)
Interest expense 1,758 1,398
Net foreign exchange loss 1,085 4,876
Others 415 390
1,629 5,897
6. Income tax in the consolidated income statement
Taxation in the consolidated income statement represents:
2012 2011
CNY’million CNY’million
Current tax
PRC enterprise income tax
– current year 1,115 1,984
– under/(over)-provision in respect of prior years 37 (522)
Overseas enterprise income tax
– current year 2,147 1,490
– under/(over)-provision in respect of prior years 71 (113)
3,370 2,839
Deferred tax
Origination and reversal of temporary differences (659) (2,029)
2,711 810
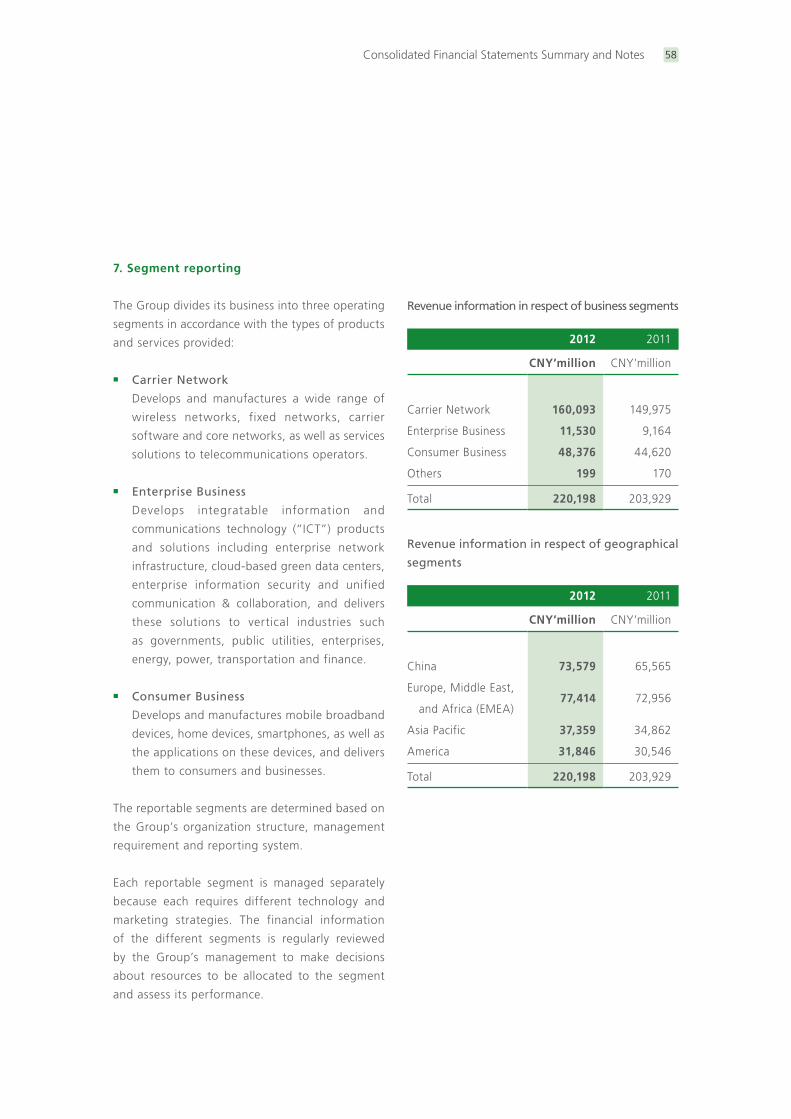
Consolidated Financial Statements Summary and Notes 58
7. Segment reporting
The Group divides its business into three operating
segments in accordance with the types of products
and services provided:
■ Carrier Network
Develops and manufactures a wide range of
wireless networks, fixed networks, carrier
software and core networks, as well as services
solutions to telecommunications operators.
■ Enterprise Business
Develops integratable information and
communications technology (“ICT”) products
and solutions including enterprise network
infrastructure, cloud-based green data centers,
enterprise information security and unified
communication & collaboration, and delivers
these solutions to vertical industries such
as governments, public utilities, enterprises,
energy, power, transportation and finance.
■ Consumer Business
Develops and manufactures mobile broadband
devices, home devices, smartphones, as well as
the applications on these devices, and delivers
them to consumers and businesses.
The reportable segments are determined based on
the Group’s organization structure, management
requirement and reporting system.
Each reportable segment is managed separately
because each requires different technology and
marketing strategies. The financial information
of the different segments is regularly reviewed
by the Group’s management to make decisions
about resources to be allocated to the segment
and assess its performance.
Revenue information in respect of business segments
2012 2011
CNY’million CNY’million
Carrier Network 160,093 149,975
Enterprise Business 11,530 9,164
Consumer Business 48,376 44,620
Others 199 170
Total 220,198 203,929
Revenue information in respect of geographical
segments
2012 2011
CNY’million CNY’million
China 73,579 65,565
Europe, Middle East,
and Africa (EMEA)77,414 72,956
Asia Pacific 37,359 34,862
America 31,846 30,546
Total 220,198 203,929
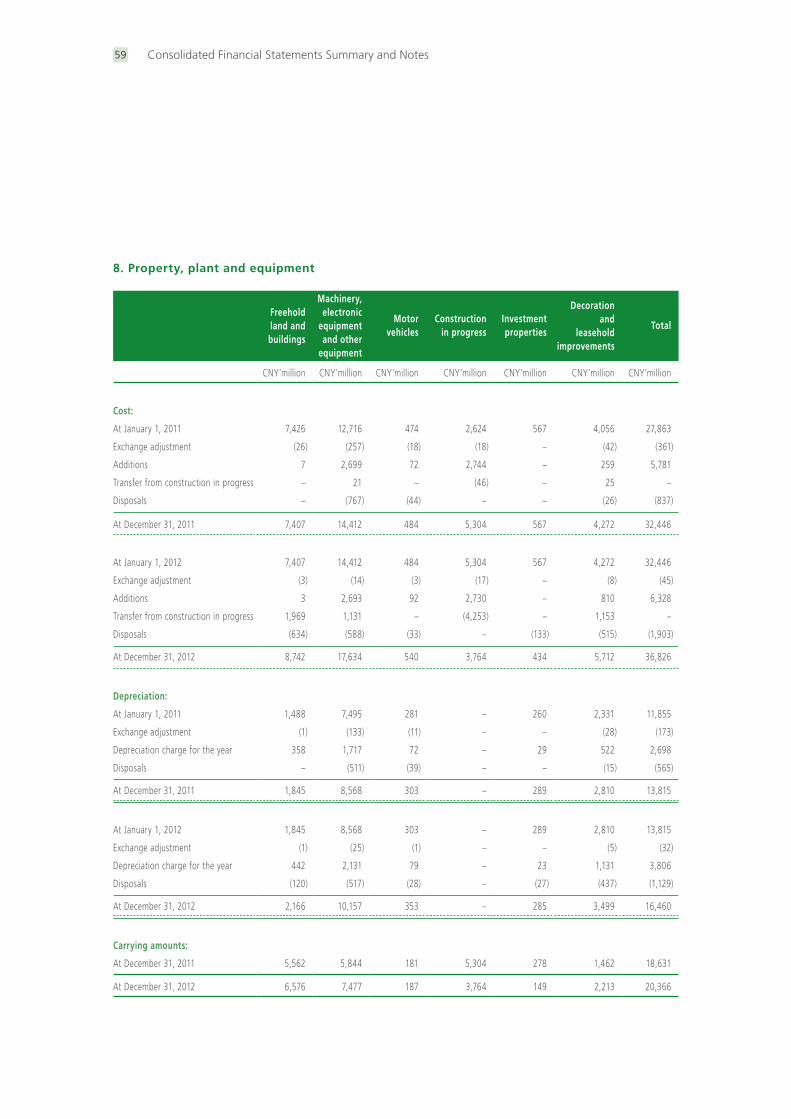
Consolidated Financial Statements Summary and Notes59
8. Property, plant and equipment
Freehold land and buildings
Machinery, electronic
equipment and other
equipment
Motor vehicles
Construction in progress
Investment properties
Decoration and
leasehold improvements
Total
CNY’million CNY’million CNY’million CNY’million CNY’million CNY’million CNY’million
Cost:
At January 1, 2011 7,426 12,716 474 2,624 567 4,056 27,863
Exchange adjustment (26) (257) (18) (18) – (42) (361)
Additions 7 2,699 72 2,744 – 259 5,781
Transfer from construction in progress – 21 – (46) – 25 –
Disposals – (767) (44) – – (26) (837)
At December 31, 2011 7,407 14,412 484 5,304 567 4,272 32,446
At January 1, 2012 7,407 14,412 484 5,304 567 4,272 32,446
Exchange adjustment (3) (14) (3) (17) – (8) (45)
Additions 3 2,693 92 2,730 – 810 6,328
Transfer from construction in progress 1,969 1,131 – (4,253) – 1,153 –
Disposals (634) (588) (33) – (133) (515) (1,903)
At December 31, 2012 8,742 17,634 540 3,764 434 5,712 36,826
Depreciation:
At January 1, 2011 1,488 7,495 281 – 260 2,331 11,855
Exchange adjustment (1) (133) (11) – – (28) (173)
Depreciation charge for the year 358 1,717 72 – 29 522 2,698
Disposals – (511) (39) – – (15) (565)
At December 31, 2011 1,845 8,568 303 – 289 2,810 13,815
At January 1, 2012 1,845 8,568 303 – 289 2,810 13,815
Exchange adjustment (1) (25) (1) – – (5) (32)
Depreciation charge for the year 442 2,131 79 – 23 1,131 3,806
Disposals (120) (517) (28) – (27) (437) (1,129)
At December 31, 2012 2,166 10,157 353 – 285 3,499 16,460
Carrying amounts:
At December 31, 2011 5,562 5,844 181 5,304 278 1,462 18,631
At December 31, 2012 6,576 7,477 187 3,764 149 2,213 20,366
Consolidated Financial Statements Summary and Notes 60
Investment properties
The Group is engaged in the manufacturing, sales
and marketing of telecommunications equipment
and the provision of related services. The Group
leased certain buildings to an ex-subsidiary, an ex-
associate and other third parties. Such buildings
are classified as investment properties.
The carrying value of investment properties as
of December 31, 2012 is CNY149,274,000 (2011:
CNY278,153,000). The fair value of investment
properties as of December 31, 2012 is estimated
by the directors to be CNY273,496,000 (2011:
CNY478,684,000). The fair value is calculated by
management based on the discounted cash flow
analysis.
The fair value of investment property is determined
by the Group internally by reference to market
conditions and discounted cash flow forecasts.
The Group’s current lease agreements, which were
entered into on an arm’s-length basis, were taken
into account.
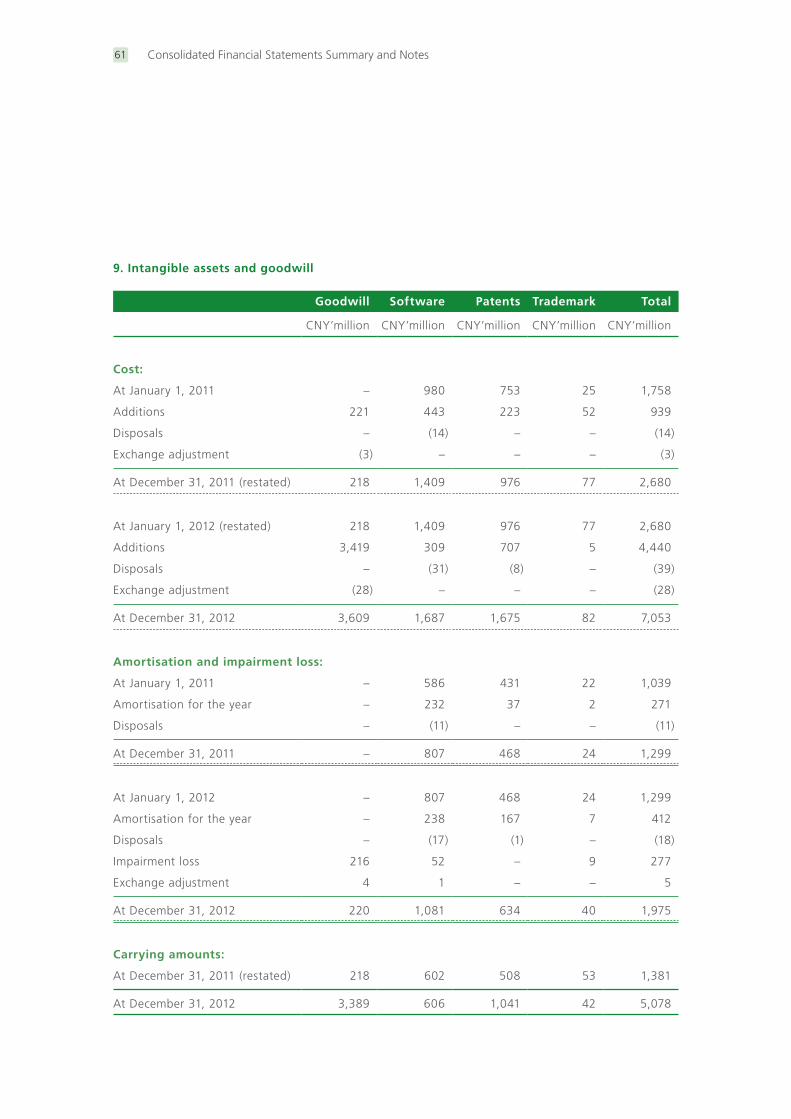
Consolidated Financial Statements Summary and Notes61
9. Intangible assets and goodwill
Goodwill Software Patents Trademark Total
CNY’million CNY’million CNY’million CNY’million CNY’million
Cost:
At January 1, 2011 – 980 753 25 1,758
Additions 221 443 223 52 939
Disposals – (14) – – (14)
Exchange adjustment (3) – – – (3)
At December 31, 2011 (restated) 218 1,409 976 77 2,680
At January 1, 2012 (restated) 218 1,409 976 77 2,680
Additions 3,419 309 707 5 4,440
Disposals – (31) (8) – (39)
Exchange adjustment (28) – – – (28)
At December 31, 2012 3,609 1,687 1,675 82 7,053
Amortisation and impairment loss:
At January 1, 2011 – 586 431 22 1,039
Amortisation for the year – 232 37 2 271
Disposals – (11) – – (11)
At December 31, 2011 – 807 468 24 1,299
At January 1, 2012 – 807 468 24 1,299
Amortisation for the year – 238 167 7 412
Disposals – (17) (1) – (18)
Impairment loss 216 52 – 9 277
Exchange adjustment 4 1 – – 5
At December 31, 2012 220 1,081 634 40 1,975
Carrying amounts:
At December 31, 2011 (restated) 218 602 508 53 1,381
At December 31, 2012 3,389 606 1,041 42 5,078

Consolidated Financial Statements Summary and Notes 62
Amortisation and impairment loss
The amortisation of software, patents and trademark
is included in the “research and development
expenses” and “administrative expenses”. The
impairment loss is included in “other operating
expenses” in the consolidated income statement.
Impairment testing for cash-generating unit
containing goodwill
For the purpose of impairment testing, goodwill
is allocated to the Group’s cash-generating unit
(“CGU”), which is either an operating segment or
at a level not larger than an operating segment,
as follows:
Cash-generating unit
2012 2011
Amount of goodwill allocated
Discount rate
Terminal value
growthrate
Amount of goodwill allocated
Discount rate
Terminal value
growthrate
CNY’million % % CNY’million % %
Enterprise business group 3,229 14.5 10.0 – – –
International Turnkey Systems
Technologies W.L.L.
(“ITS Bahrain”)
220 36.4 4.0 218 38.0 4.0
Beijing Huawei Longshine
Information Technology
Company Limited
(“Beijing Huawei Longshine”)
154 19.1 3.0 – – –
3,603 218
Others 6 – – – – –
3,609 218
Goodwill is allocated to the Group’s CGUs
expected to benefit from the synergies of the
acquisitions. For annual impairment assessment
purposes, the recoverable amount of the CGUs
is based on their value-in-use calculations. The
value-in-use calculations apply a discounted cash
flow model using cash flow projections based on
financial budgets approved by management. The
key assumptions for the computation of value-in-
use include the discount rates and growth rates
applied. The discount rates used are pre-tax rates
and reflect specific risks relating to the respective
CGU. Cash flow projections are based on five-
year, eight-year and six-year financial budgets
approved by management for Enterprise business
group, ITS Bahrain and Beijing Huawei Longshine,
respectively based on their industry expertise. Cash
flows beyond the previous-mentioned approved
financial budget’s periods are extrapolated using
an estimated growth rate. The growth rate does
not exceed the long-term average growth rate for
the business in which the CGU operates.
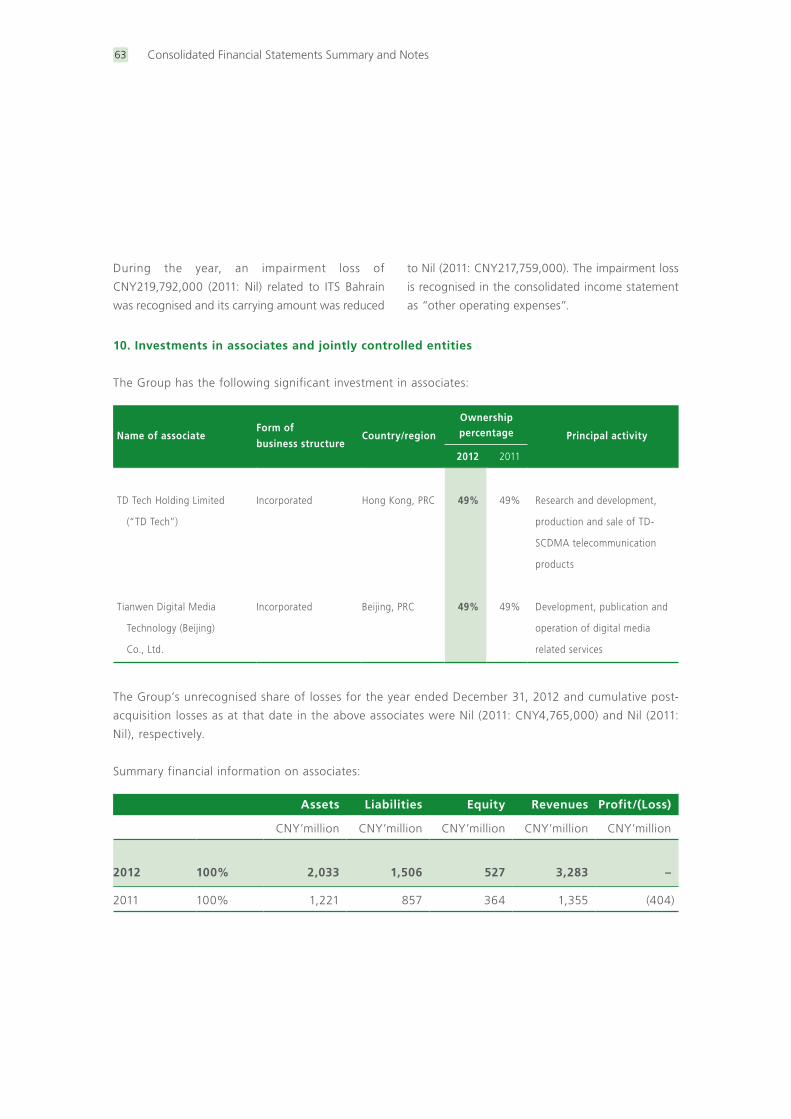
Consolidated Financial Statements Summary and Notes63
During the year, an impairment loss of
CNY219,792,000 (2011: Nil) related to ITS Bahrain
was recognised and its carrying amount was reduced
to Nil (2011: CNY217,759,000). The impairment loss
is recognised in the consolidated income statement
as “other operating expenses”.
10. Investments in associates and jointly controlled entities
The Group has the following significant investment in associates:
Name of associateForm of
business structureCountry/region
Ownership percentage Principal activity
2012 2011
TD Tech Holding Limited
(“TD Tech”)
Incorporated Hong Kong, PRC 49% 49% Research and development,
production and sale of TD-
SCDMA telecommunication
products
Tianwen Digital Media
Technology (Beijing)
Co., Ltd.
Incorporated Beijing, PRC 49% 49% Development, publication and
operation of digital media
related services
The Group’s unrecognised share of losses for the year ended December 31, 2012 and cumulative post-
acquisition losses as at that date in the above associates were Nil (2011: CNY4,765,000) and Nil (2011:
Nil), respectively.
Summary financial information on associates:
Assets Liabilities Equity Revenues Profit/(Loss)
CNY’million CNY’million CNY’million CNY’million CNY’million
2012 100% 2,033 1,506 527 3,283 –
2011 100% 1,221 857 364 1,355 (404)

Consolidated Financial Statements Summary and Notes 64
Details of the Group’s interests in significant jointly controlled entities are as follows:
Name of
jointly controlled entity
Form of
business structureCountry/region
Ownership
percentage Principal activity
2012 2011
Huawei Marine Systems Co.,
Ltd. (“Huawei Marine”)
Incorporated Hong Kong, PRC 51% 51% Construction and operation of
submarine fibres
Chengdu Huawei
Investment Co., Ltd.
(“CD Investment”)
Incorporated Chengdu, PRC 49% 49% Investment, lease of property
and machinery, developments of
high technology products and
provision of related services,
sales of telecommunication and
electronic products
In March 2012, the Group acquired additional
49% and 48% equity interests in Huawei Digital
Technologies (Hong Kong) Co., Limited (“Huawei
Digital HK”) (formerly “Huawei Symantec
Technologies Co., Ltd.”) and Beijing Huawei
Longshine respectively. Subsequent to the acquisition,
Huawei Digital HK and Beijing Huawei Longshine
became wholly-owned subsidiaries of the Group
(see Note 25 (c)).
Summary financial information on jointly controlled entities – Group’s effective interest:
2012 2011
CNY’million CNY’million
Non-current assets 804 532
Current assets 294 1,419
Non-current liabilities (525) (241)
Current liabilities (323) (1,196)
Net assets 250 514
Income 321 2,429
Expenses (358) (2,406)
(Loss)/Profit for the year (37) 23
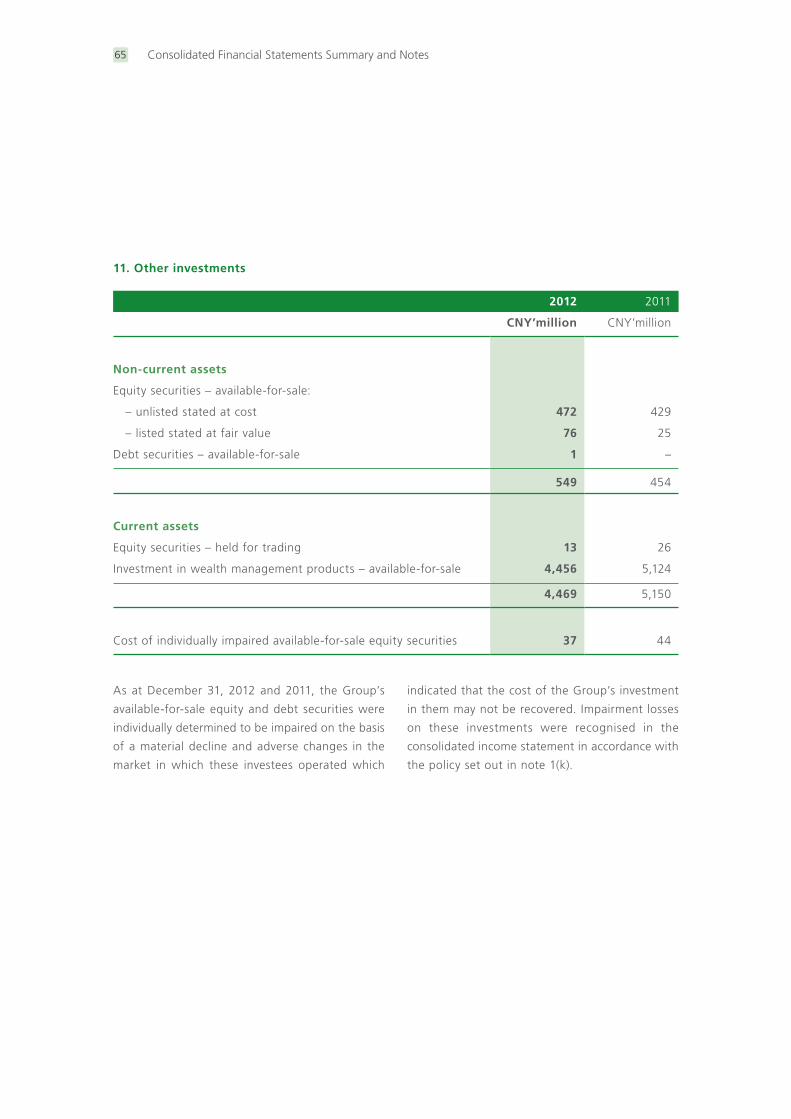
Consolidated Financial Statements Summary and Notes65
11. Other investments
2012 2011
CNY’million CNY’million
Non-current assets
Equity securities – available-for-sale:
– unlisted stated at cost 472 429
– listed stated at fair value 76 25
Debt securities – available-for-sale 1 –
549 454
Current assets
Equity securities – held for trading 13 26
Investment in wealth management products – available-for-sale 4,456 5,124
4,469 5,150
Cost of individually impaired available-for-sale equity securities 37 44
As at December 31, 2012 and 2011, the Group’s
available-for-sale equity and debt securities were
individually determined to be impaired on the basis
of a material decline and adverse changes in the
market in which these investees operated which
indicated that the cost of the Group’s investment
in them may not be recovered. Impairment losses
on these investments were recognised in the
consolidated income statement in accordance with
the policy set out in note 1(k).
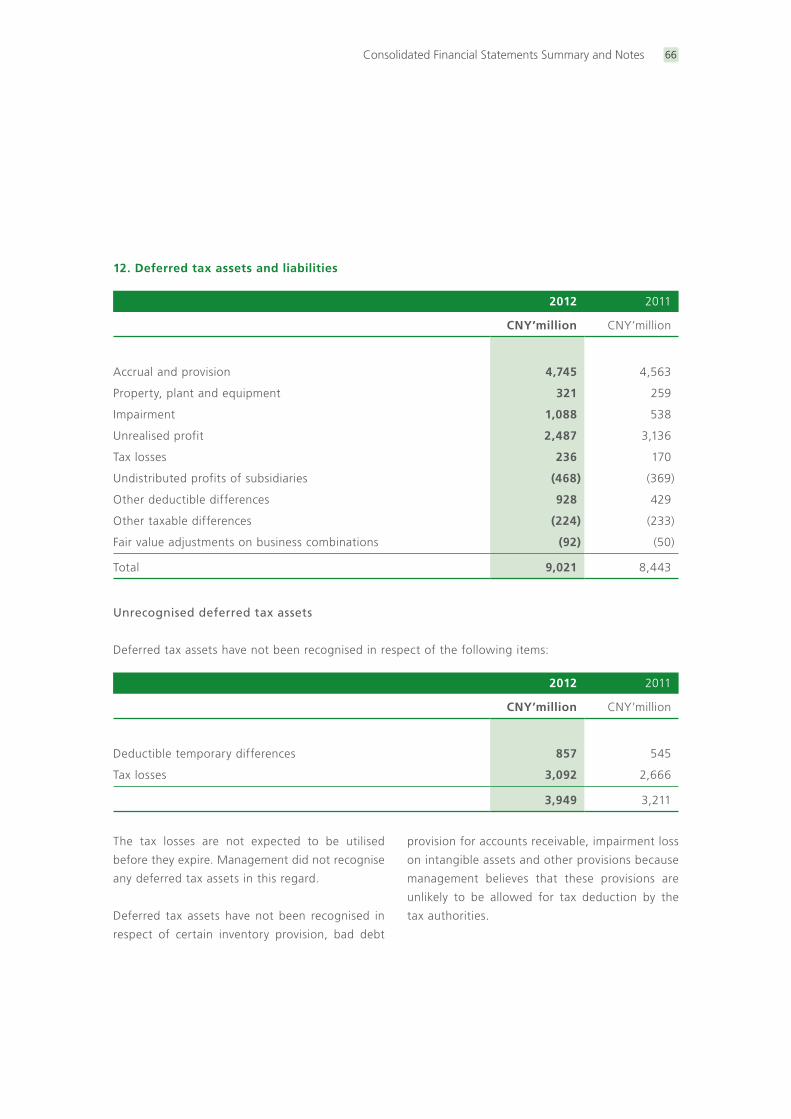
Consolidated Financial Statements Summary and Notes 66
12. Deferred tax assets and liabilities
2012 2011
CNY’million CNY’million
Accrual and provision 4,745 4,563
Property, plant and equipment 321 259
Impairment 1,088 538
Unrealised profit 2,487 3,136
Tax losses 236 170
Undistributed profits of subsidiaries (468) (369)
Other deductible differences 928 429
Other taxable differences (224) (233)
Fair value adjustments on business combinations (92) (50)
Total 9,021 8,443
Unrecognised deferred tax assets
Deferred tax assets have not been recognised in respect of the following items:
2012 2011
CNY’million CNY’million
Deductible temporary differences 857 545
Tax losses 3,092 2,666
3,949 3,211
The tax losses are not expected to be utilised
before they expire. Management did not recognise
any deferred tax assets in this regard.
Deferred tax assets have not been recognised in
respect of certain inventory provision, bad debt
provision for accounts receivable, impairment loss
on intangible assets and other provisions because
management believes that these provisions are
unlikely to be allowed for tax deduction by the
tax authorities.
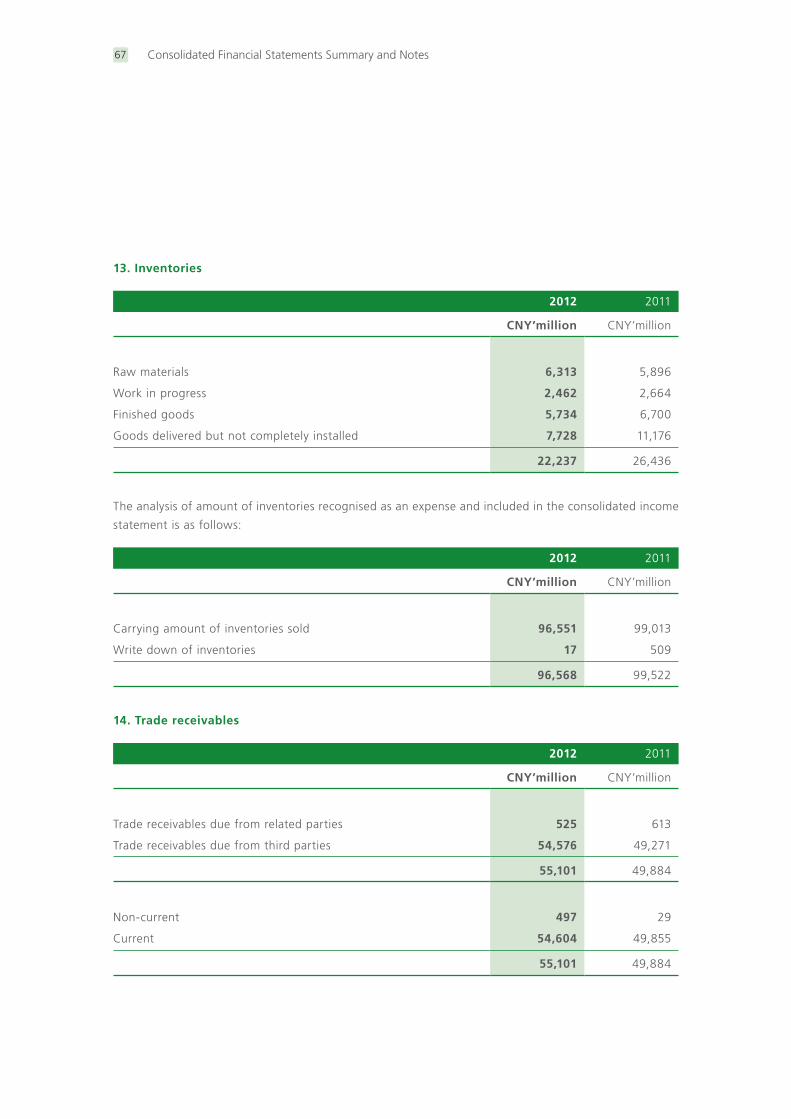
Consolidated Financial Statements Summary and Notes67
13. Inventories
2012 2011
CNY’million CNY’million
Raw materials 6,313 5,896
Work in progress 2,462 2,664
Finished goods 5,734 6,700
Goods delivered but not completely installed 7,728 11,176
22,237 26,436
The analysis of amount of inventories recognised as an expense and included in the consolidated income
statement is as follows:
2012 2011
CNY’million CNY’million
Carrying amount of inventories sold 96,551 99,013
Write down of inventories 17 509
96,568 99,522
14. Trade receivables
2012 2011
CNY’million CNY’million
Trade receivables due from related parties 525 613
Trade receivables due from third parties 54,576 49,271
55,101 49,884
Non-current 497 29
Current 54,604 49,855
55,101 49,884
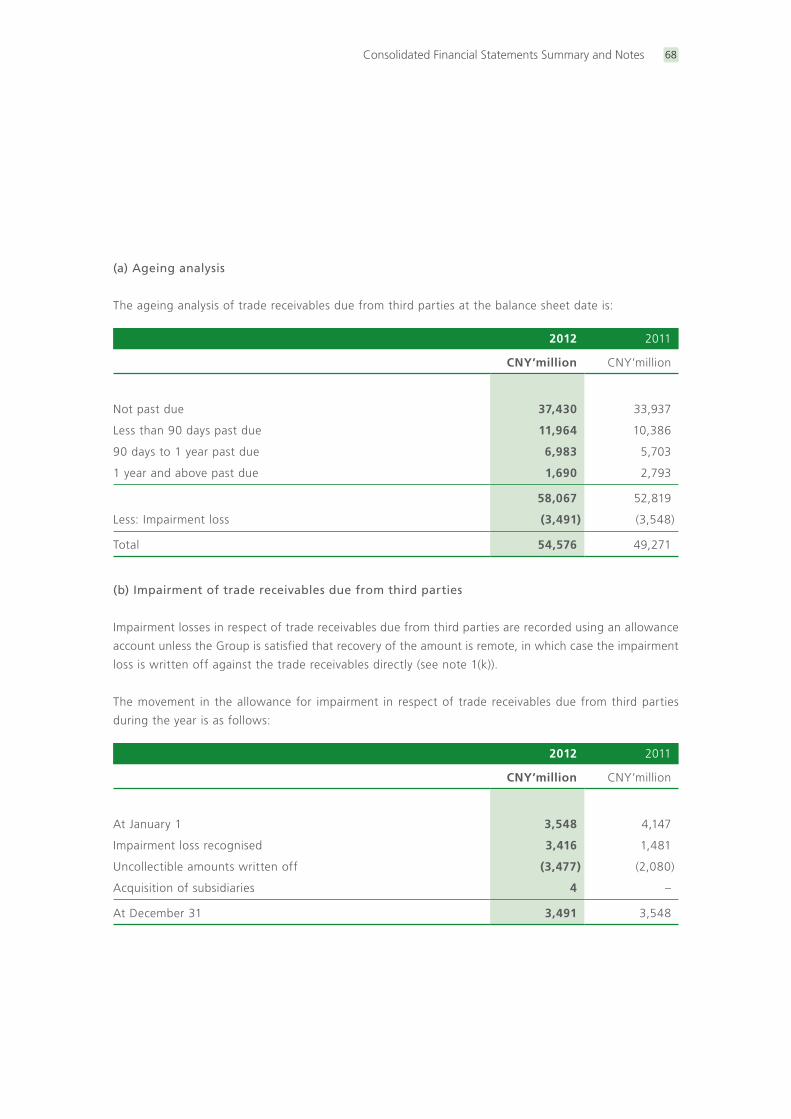
Consolidated Financial Statements Summary and Notes 68
(a) Ageing analysis
The ageing analysis of trade receivables due from third parties at the balance sheet date is:
2012 2011
CNY’million CNY’million
Not past due 37,430 33,937
Less than 90 days past due 11,964 10,386
90 days to 1 year past due 6,983 5,703
1 year and above past due 1,690 2,793
58,067 52,819
Less: Impairment loss (3,491) (3,548)
Total 54,576 49,271
(b) Impairment of trade receivables due from third parties
Impairment losses in respect of trade receivables due from third parties are recorded using an allowance
account unless the Group is satisfied that recovery of the amount is remote, in which case the impairment
loss is written off against the trade receivables directly (see note 1(k)).
The movement in the allowance for impairment in respect of trade receivables due from third parties
during the year is as follows:
2012 2011
CNY’million CNY’million
At January 1 3,548 4,147
Impairment loss recognised 3,416 1,481
Uncollectible amounts written off (3,477) (2,080)
Acquisition of subsidiaries 4 –
At December 31 3,491 3,548
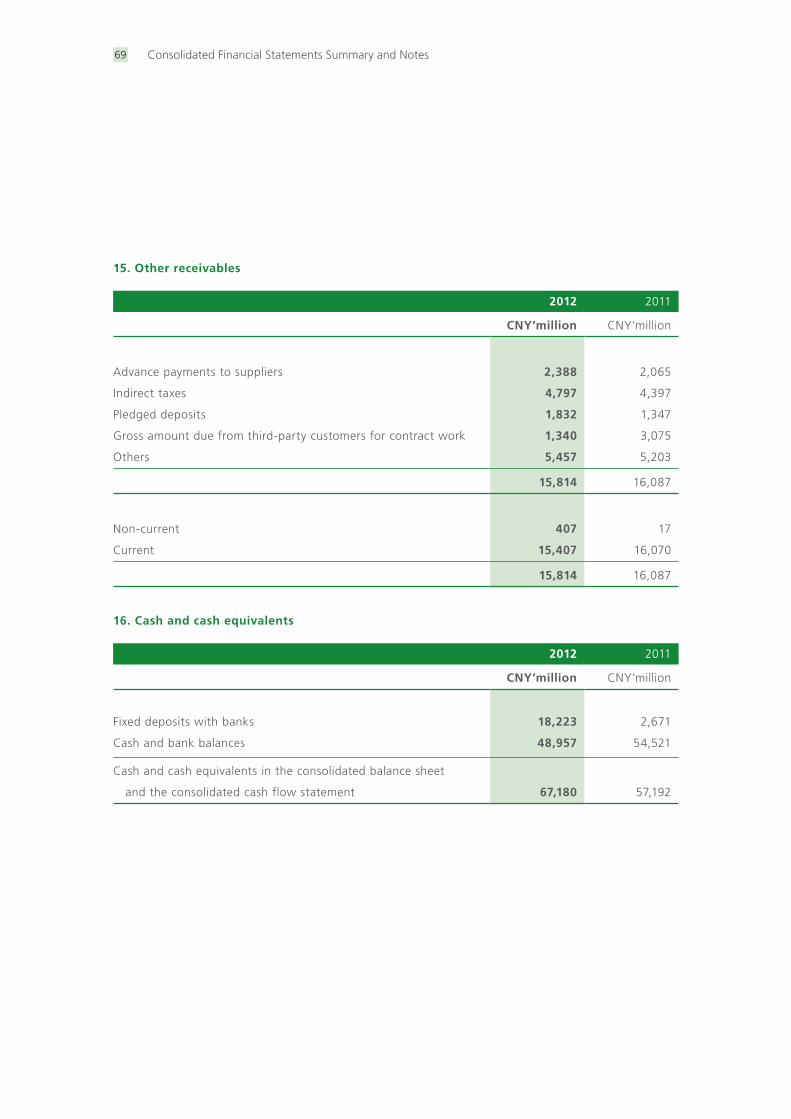
Consolidated Financial Statements Summary and Notes69
15. Other receivables
2012 2011
CNY’million CNY’million
Advance payments to suppliers 2,388 2,065
Indirect taxes 4,797 4,397
Pledged deposits 1,832 1,347
Gross amount due from third-party customers for contract work 1,340 3,075
Others 5,457 5,203
15,814 16,087
Non-current 407 17
Current 15,407 16,070
15,814 16,087
16. Cash and cash equivalents
2012 2011
CNY’million CNY’million
Fixed deposits with banks 18,223 2,671
Cash and bank balances 48,957 54,521
Cash and cash equivalents in the consolidated balance sheet
and the consolidated cash flow statement 67,180 57,192
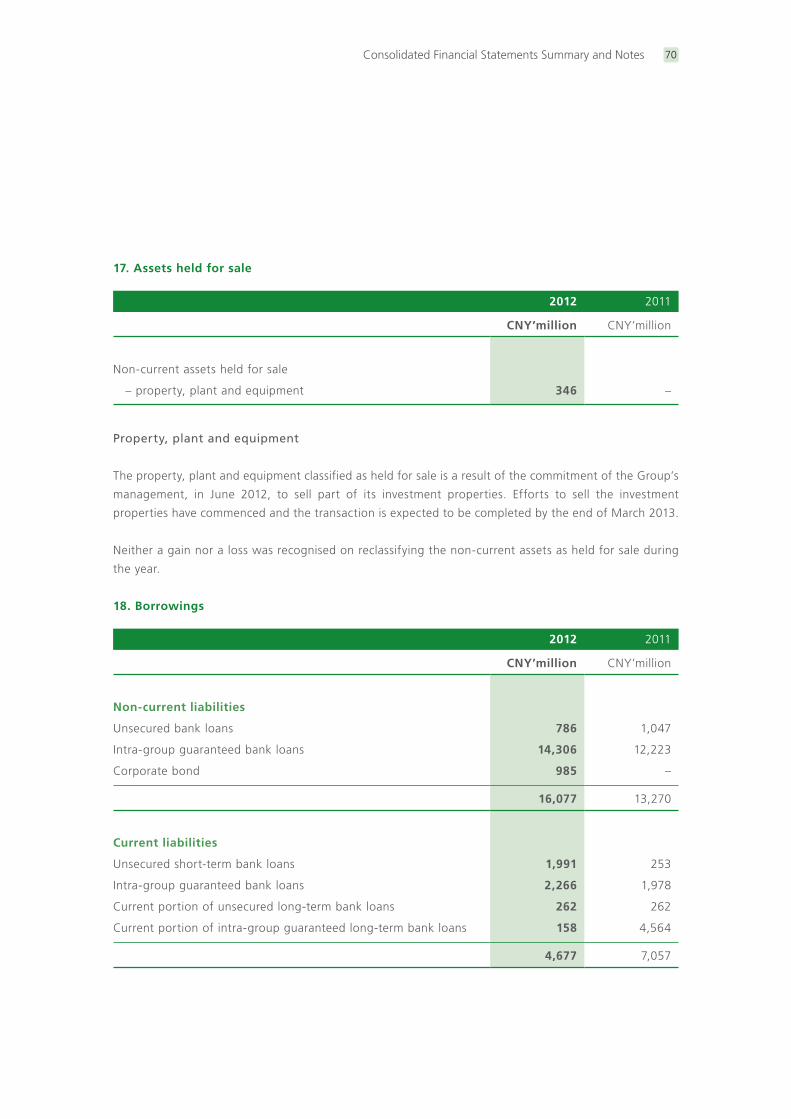
Consolidated Financial Statements Summary and Notes 70
17. Assets held for sale
2012 2011
CNY’million CNY’million
Non-current assets held for sale
– property, plant and equipment 346 –
Property, plant and equipment
The property, plant and equipment classified as held for sale is a result of the commitment of the Group’s
management, in June 2012, to sell part of its investment properties. Efforts to sell the investment
properties have commenced and the transaction is expected to be completed by the end of March 2013.
Neither a gain nor a loss was recognised on reclassifying the non-current assets as held for sale during
the year.
18. Borrowings
2012 2011
CNY’million CNY’million
Non-current liabilities
Unsecured bank loans 786 1,047
Intra-group guaranteed bank loans 14,306 12,223
Corporate bond 985 –
16,077 13,270
Current liabilities
Unsecured short-term bank loans 1,991 253
Intra-group guaranteed bank loans 2,266 1,978
Current portion of unsecured long-term bank loans 262 262
Current portion of intra-group guaranteed long-term bank loans 158 4,564
4,677 7,057
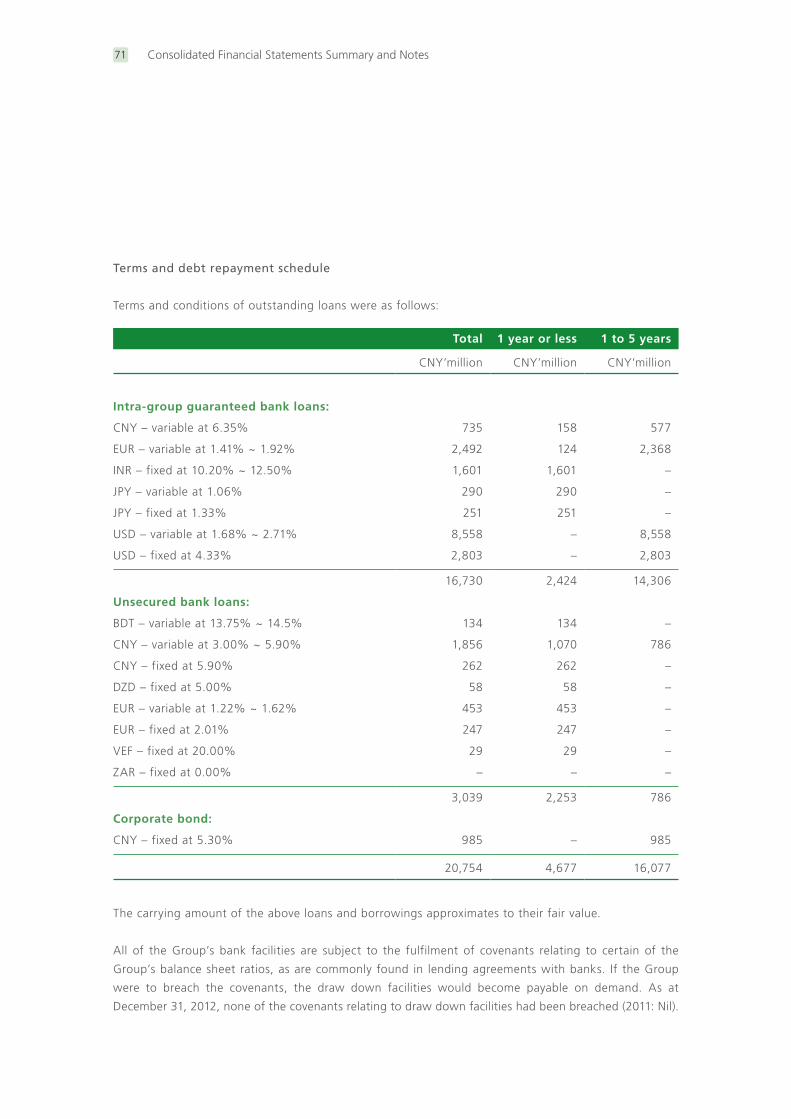
Consolidated Financial Statements Summary and Notes71
Terms and debt repayment schedule
Terms and conditions of outstanding loans were as follows:
Total 1 year or less 1 to 5 years
CNY’million CNY’million CNY’million
Intra-group guaranteed bank loans:
CNY – variable at 6.35% 735 158 577
EUR – variable at 1.41% ~ 1.92% 2,492 124 2,368
INR – fixed at 10.20% ~ 12.50% 1,601 1,601 –
JPY – variable at 1.06% 290 290 –
JPY – fixed at 1.33% 251 251 –
USD – variable at 1.68% ~ 2.71% 8,558 – 8,558
USD – fixed at 4.33% 2,803 – 2,803
16,730 2,424 14,306
Unsecured bank loans:
BDT – variable at 13.75% ~ 14.5% 134 134 –
CNY – variable at 3.00% ~ 5.90% 1,856 1,070 786
CNY – fixed at 5.90% 262 262 –
DZD – fixed at 5.00% 58 58 –
EUR – variable at 1.22% ~ 1.62% 453 453 –
EUR – fixed at 2.01% 247 247 –
VEF – fixed at 20.00% 29 29 –
ZAR – fixed at 0.00% – – –
3,039 2,253 786
Corporate bond:
CNY – fixed at 5.30% 985 – 985
20,754 4,677 16,077
The carrying amount of the above loans and borrowings approximates to their fair value.
All of the Group’s bank facilities are subject to the fulfilment of covenants relating to certain of the
Group’s balance sheet ratios, as are commonly found in lending agreements with banks. If the Group
were to breach the covenants, the draw down facilities would become payable on demand. As at
December 31, 2012, none of the covenants relating to draw down facilities had been breached (2011: Nil).
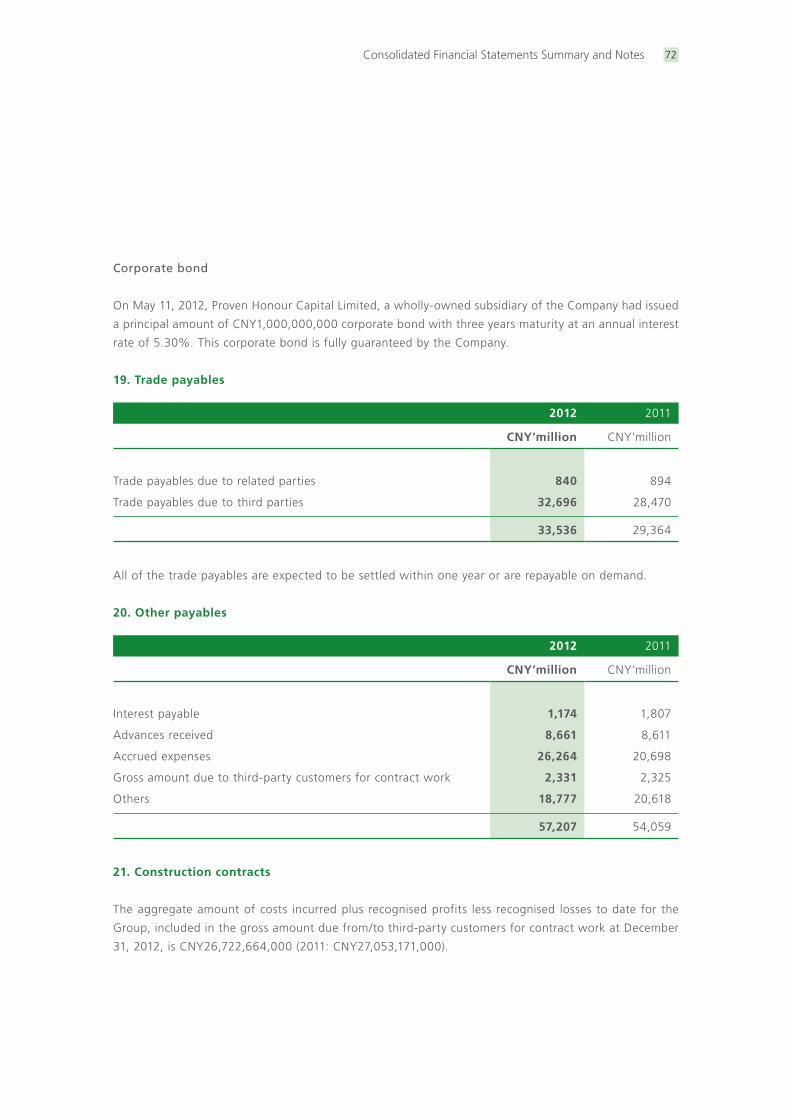
Consolidated Financial Statements Summary and Notes 72
Corporate bond
On May 11, 2012, Proven Honour Capital Limited, a wholly-owned subsidiary of the Company had issued
a principal amount of CNY1,000,000,000 corporate bond with three years maturity at an annual interest
rate of 5.30%. This corporate bond is fully guaranteed by the Company.
19. Trade payables
2012 2011
CNY’million CNY’million
Trade payables due to related parties 840 894
Trade payables due to third parties 32,696 28,470
33,536 29,364
All of the trade payables are expected to be settled within one year or are repayable on demand.
20. Other payables
2012 2011
CNY’million CNY’million
Interest payable 1,174 1,807
Advances received 8,661 8,611
Accrued expenses 26,264 20,698
Gross amount due to third-party customers for contract work 2,331 2,325
Others 18,777 20,618
57,207 54,059
21. Construction contracts
The aggregate amount of costs incurred plus recognised profits less recognised losses to date for the
Group, included in the gross amount due from/to third-party customers for contract work at December
31, 2012, is CNY26,722,664,000 (2011: CNY27,053,171,000).
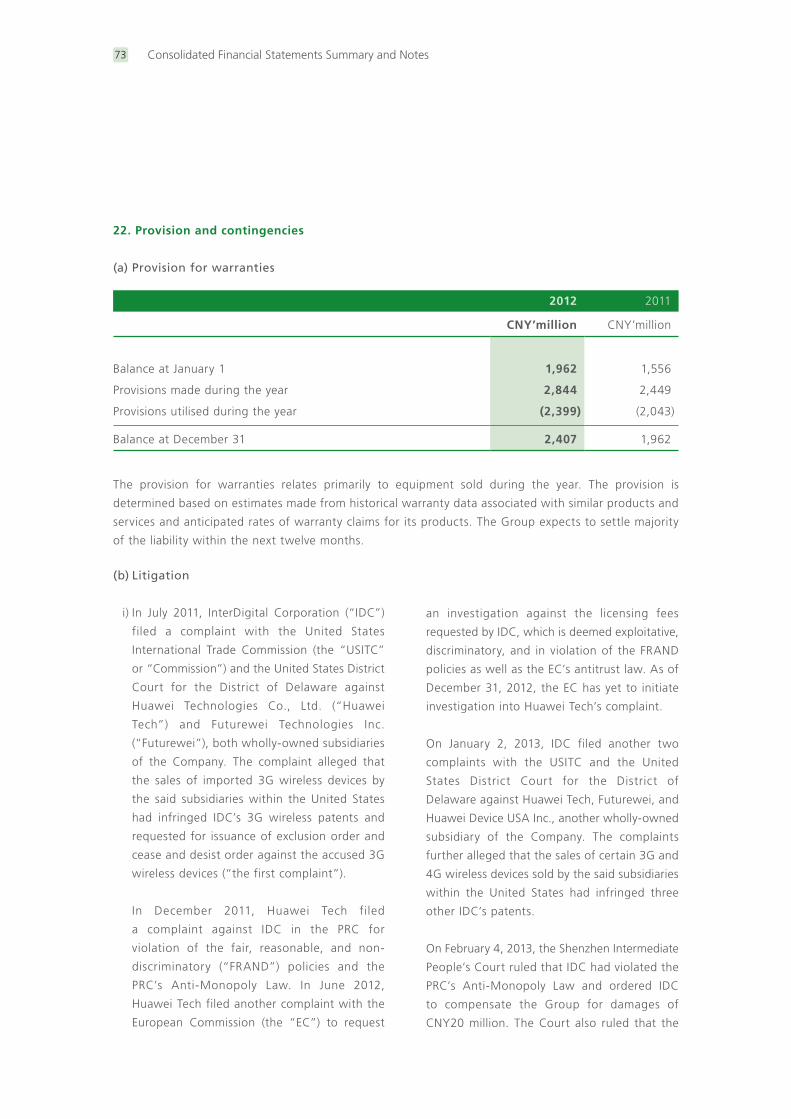
Consolidated Financial Statements Summary and Notes73
22. Provision and contingencies
(a) Provision for warranties
2012 2011
CNY’million CNY’million
Balance at January 1 1,962 1,556
Provisions made during the year 2,844 2,449
Provisions utilised during the year (2,399) (2,043)
Balance at December 31 2,407 1,962
The provision for warranties relates primarily to equipment sold during the year. The provision is
determined based on estimates made from historical warranty data associated with similar products and
services and anticipated rates of warranty claims for its products. The Group expects to settle majority
of the liability within the next twelve months.
(b) Litigation
i) In July 2011, InterDigital Corporation (“IDC”)
filed a complaint with the United States
International Trade Commission (the “USITC”
or “Commission”) and the United States District
Court for the District of Delaware against
Huawei Technologies Co., Ltd. (“Huawei
Tech”) and Futurewei Technologies Inc.
(“Futurewei”), both wholly-owned subsidiaries
of the Company. The complaint alleged that
the sales of imported 3G wireless devices by
the said subsidiaries within the United States
had infringed IDC’s 3G wireless patents and
requested for issuance of exclusion order and
cease and desist order against the accused 3G
wireless devices (“the first complaint”).
In December 2011, Huawei Tech filed
a complaint against IDC in the PRC for
violation of the fair, reasonable, and non-
discriminatory (“FRAND”) policies and the
PRC’s Anti-Monopoly Law. In June 2012,
Huawei Tech filed another complaint with the
European Commission (the “EC”) to request
an investigation against the licensing fees
requested by IDC, which is deemed exploitative,
discriminatory, and in violation of the FRAND
policies as well as the EC’s antitrust law. As of
December 31, 2012, the EC has yet to initiate
investigation into Huawei Tech’s complaint.
On January 2, 2013, IDC filed another two
complaints with the USITC and the United
States District Court for the District of
Delaware against Huawei Tech, Futurewei, and
Huawei Device USA Inc., another wholly-owned
subsidiary of the Company. The complaints
further alleged that the sales of certain 3G and
4G wireless devices sold by the said subsidiaries
within the United States had infringed three
other IDC’s patents.
On February 4, 2013, the Shenzhen Intermediate
People’s Court ruled that IDC had violated the
PRC’s Anti-Monopoly Law and ordered IDC
to compensate the Group for damages of
CNY20 million. The Court also ruled that the
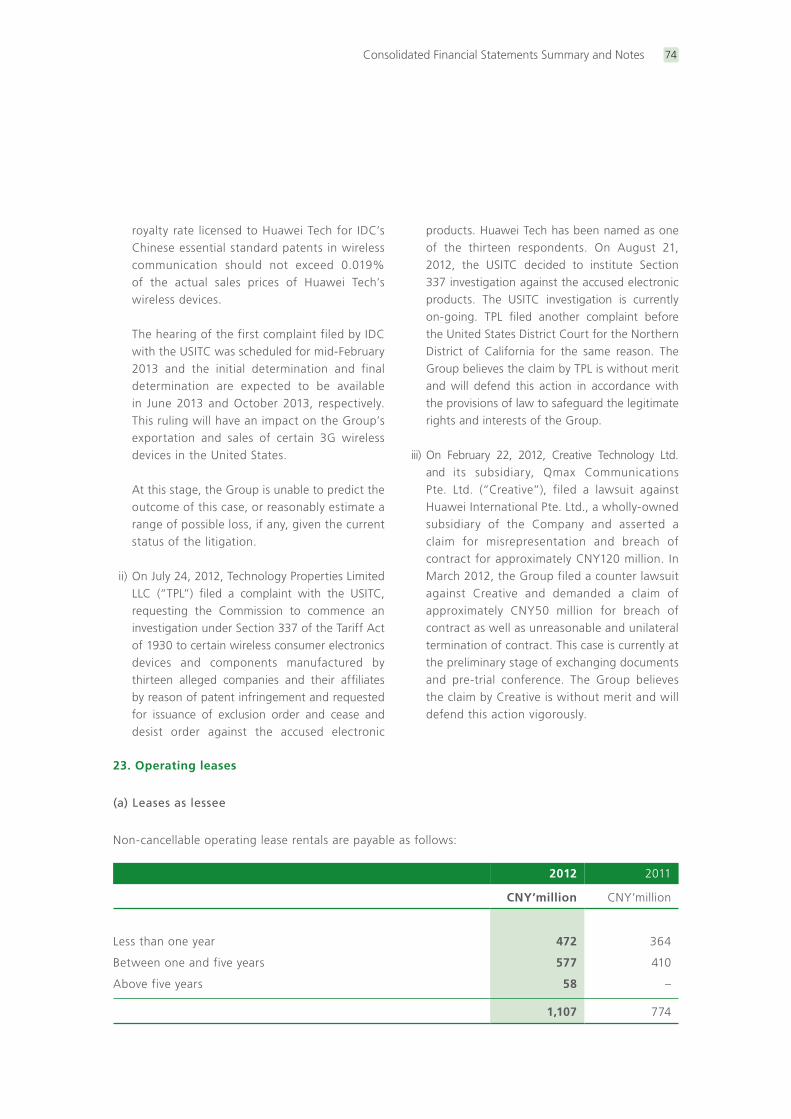
Consolidated Financial Statements Summary and Notes 74
royalty rate licensed to Huawei Tech for IDC’s Chinese essential standard patents in wireless communication should not exceed 0.019% of the actual sales prices of Huawei Tech’s wireless devices.
The hearing of the first complaint filed by IDC with the USITC was scheduled for mid-February 2013 and the initial determination and final determination are expected to be available in June 2013 and October 2013, respectively. This ruling will have an impact on the Group’s exportation and sales of certain 3G wireless devices in the United States.
At this stage, the Group is unable to predict the outcome of this case, or reasonably estimate a range of possible loss, if any, given the current status of the litigation.
ii) On July 24, 2012, Technology Properties Limited LLC (“TPL”) filed a complaint with the USITC, requesting the Commission to commence an investigation under Section 337 of the Tariff Act of 1930 to certain wireless consumer electronics devices and components manufactured by thirteen alleged companies and their affiliates by reason of patent infringement and requested for issuance of exclusion order and cease and desist order against the accused electronic
products. Huawei Tech has been named as one of the thirteen respondents. On August 21, 2012, the USITC decided to institute Section 337 investigation against the accused electronic products. The USITC investigation is currently on-going. TPL filed another complaint before the United States District Court for the Northern District of California for the same reason. The Group believes the claim by TPL is without merit and will defend this action in accordance with the provisions of law to safeguard the legitimate rights and interests of the Group.
iii) On February 22, 2012, Creative Technology Ltd. and its subsidiary, Qmax Communications Pte. Ltd. (“Creative”), filed a lawsuit against Huawei International Pte. Ltd., a wholly-owned subsidiary of the Company and asserted a claim for misrepresentation and breach of contract for approximately CNY120 million. In March 2012, the Group filed a counter lawsuit against Creative and demanded a claim of approximately CNY50 million for breach of contract as well as unreasonable and unilateral termination of contract. This case is currently at the preliminary stage of exchanging documents and pre-trial conference. The Group believes the claim by Creative is without merit and will defend this action vigorously.
23. Operating leases
(a) Leases as lessee
Non-cancellable operating lease rentals are payable as follows:
2012 2011
CNY’million CNY’million
Less than one year 472 364
Between one and five years 577 410
Above five years 58 –
1,107 774
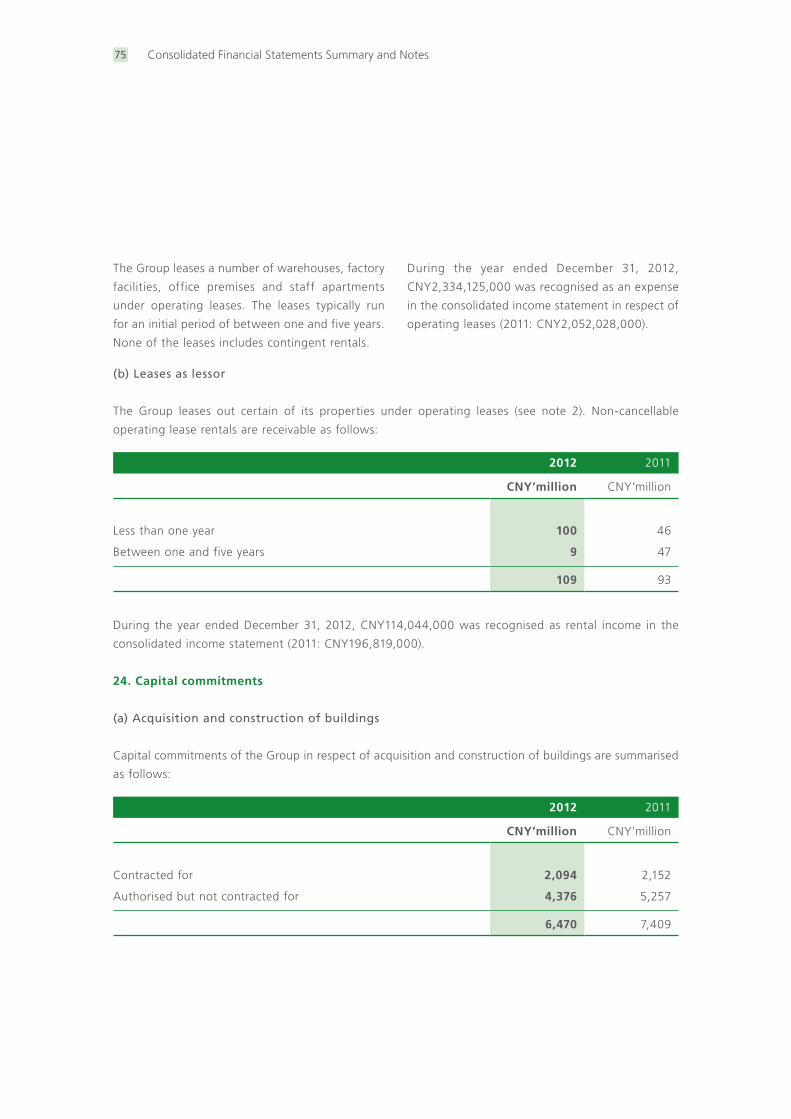
Consolidated Financial Statements Summary and Notes75
(b) Leases as lessor
The Group leases out certain of its properties under operating leases (see note 2). Non-cancellable
operating lease rentals are receivable as follows:
2012 2011
CNY’million CNY’million
Less than one year 100 46
Between one and five years 9 47
109 93
During the year ended December 31, 2012, CNY114,044,000 was recognised as rental income in the
consolidated income statement (2011: CNY196,819,000).
24. Capital commitments
(a) Acquisition and construction of buildings
Capital commitments of the Group in respect of acquisition and construction of buildings are summarised
as follows:
2012 2011
CNY’million CNY’million
Contracted for 2,094 2,152
Authorised but not contracted for 4,376 5,257
6,470 7,409
The Group leases a number of warehouses, factory
facilities, office premises and staff apartments
under operating leases. The leases typically run
for an initial period of between one and five years.
None of the leases includes contingent rentals.
During the year ended December 31, 2012,
CNY2,334,125,000 was recognised as an expense
in the consolidated income statement in respect of
operating leases (2011: CNY2,052,028,000).
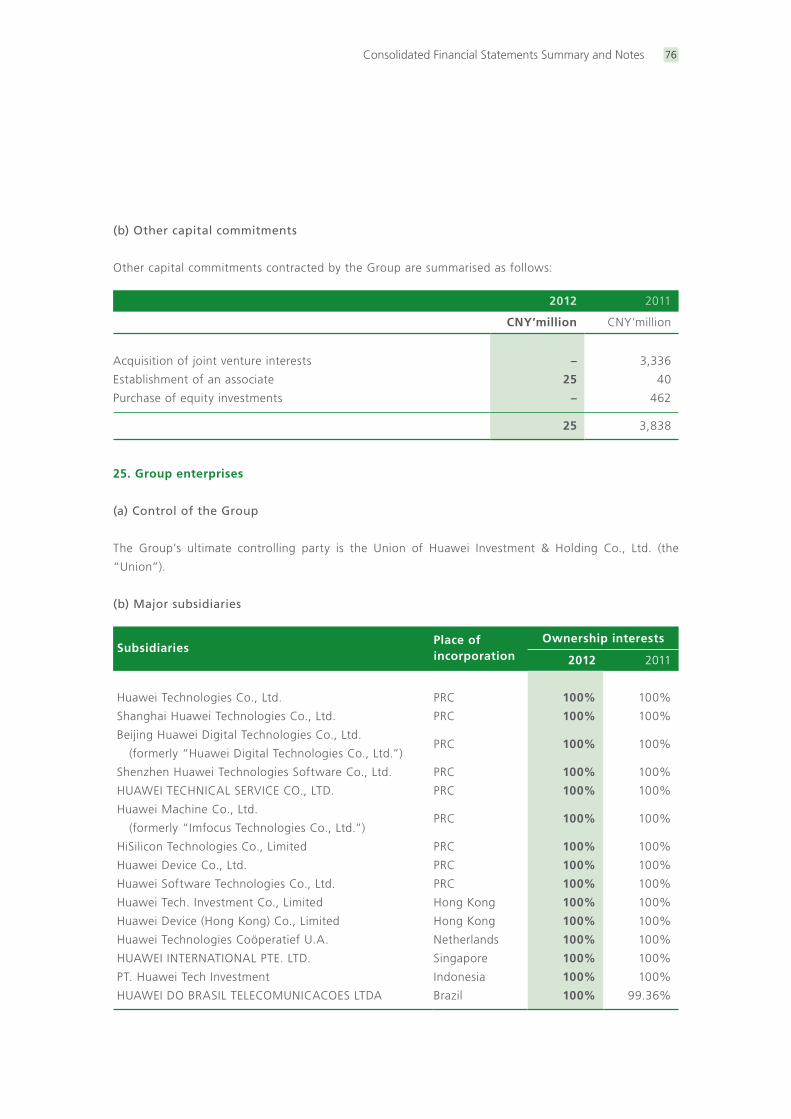
Consolidated Financial Statements Summary and Notes 76
(b) Other capital commitments
Other capital commitments contracted by the Group are summarised as follows:
2012 2011
CNY’million CNY’million
Acquisition of joint venture interests – 3,336
Establishment of an associate 25 40
Purchase of equity investments – 462
25 3,838
25. Group enterprises
(a) Control of the Group
The Group’s ultimate controlling party is the Union of Huawei Investment & Holding Co., Ltd. (the
“Union”).
(b) Major subsidiaries
SubsidiariesPlace of incorporation
Ownership interests
2012 2011
Huawei Technologies Co., Ltd. PRC 100% 100%
Shanghai Huawei Technologies Co., Ltd. PRC 100% 100%
Beijing Huawei Digital Technologies Co., Ltd.
(formerly “Huawei Digital Technologies Co., Ltd.”)PRC 100% 100%
Shenzhen Huawei Technologies Software Co., Ltd. PRC 100% 100%
HUAWEI TECHNICAL SERVICE CO., LTD. PRC 100% 100%
Huawei Machine Co., Ltd.
(formerly “Imfocus Technologies Co., Ltd.”)PRC 100% 100%
HiSilicon Technologies Co., Limited PRC 100% 100%
Huawei Device Co., Ltd. PRC 100% 100%
Huawei Software Technologies Co., Ltd. PRC 100% 100%
Huawei Tech. Investment Co., Limited Hong Kong 100% 100%
Huawei Device (Hong Kong) Co., Limited Hong Kong 100% 100%
Huawei Technologies Coöperatief U.A. Netherlands 100% 100%
HUAWEI INTERNATIONAL PTE. LTD. Singapore 100% 100%
PT. Huawei Tech Investment Indonesia 100% 100%
HUAWEI DO BRASIL TELECOMUNICACOES LTDA Brazil 100% 99.36%
Consolidated Financial Statements Summary and Notes77
(c) Acquisition of subsidiaries
i) On March 30, 2012, Huawei Tech. Investment Co., Limited (“Huawei Tech Investment”), a wholly-owned subsidiary of the Company, acquired the remaining 49% stake in Huawei Digital Technologies (Hong Kong) Co., Limited (formerly “Huawei Symantec Technologies Co., Ltd.”) (“Huawei Digital HK”) from Symantec Hardware Holding LLC (“Symantec Hardware”) for a consideration of USD530,000,000 (equivalent to CNY3,336,767,000). As a result of this acquisition, the Group’s equity interest in Huawei Digital HK increased from 51% to 100% and Huawei Digital HK became a wholly-owned subsidiary of Huawei Tech Investment, which in turn is a wholly-owned subsidiary of the Company.
Huawei Digital HK is a Hong Kong-based joint venture established by Huawei Tech Investment and Symantec Hardware in 2008. Huawei Digital HK is principally engaged in research and development, production and sale of network storage and security products.
In the post acquisition date to December 31, 2012, Huawei Digital HK contributed revenue of CNY3,224,747,000 and loss of CNY68,801,000 to the Group’s results. If the acquisition had occurred on January 1, 2012, Management estimates that consolidated revenue would have been CNY4,289,369,000, and consolidated loss for the year would have been CNY375,091,000. In determining these amounts, Management has assumed that the fair value adjustments that arose on the acquisition date would have been the same if the acquisition had occurred on January 1, 2012.
ii) On March 31, 2012, Huawei Software Technologies Co., Ltd. (“Huawei Software Tech”), a wholly-owned subsidiary of the Company, acquired the remaining 48% stake in Beijing Huawei Longshine Information Technology Company Limited (“Beijing Huawei Longshine”) from Longshine Information Technology Company
Limited (“Longshine Information”) for a consideration of CNY115,966,000. As a result of this acquisition, the Group equity interest in Beijing Huawei Longshine increased from 52% to 100% and Beijing Huawei Longshine became a wholly-owned subsidiary of the Company.
Beijing Huawei Longshine is a China-based company established in 1996. Beijing Huawei Longshine is principally engaged in production and sale of network communications products, computer hardware and software and provision of related services.
In the post acquisition date to December 31, 2012, Beijing Huawei Longshine contributed revenue of CNY130,140,000 and profit of CNY12,577,000 to the Group’s results. If the acquisition had occurred on January 1, 2012, Management estimates that consolidated revenue would have been CNY130,288,000, and consolidated loss for the year would have been CNY9,487,000. In determining these amounts, Management has assumed that the fair value adjustments that arose on the acquisition date would have been the same if the acquisition had occurred on January 1, 2012.
iii) On October 30, 2011, Huawei Technologies Coöperatief U.A., a wholly-owned subsidiary of the Company, acquired 100% equity interest in International Turnkey Systems Technologies W.L.L. (“ITS Bahrain”) for a cash consideration of USD81,031,000 (equivalent to CNY472,237,000). The cash consideration has been determined on a provisional basis in the initial accounting due to the working capital of ITS Bahrain does not meet the conditions stipulated in the Sales and Purchase Agreement (“SPA”) which is USD10,000,000.
The consideration was finalised and determined at USD72,262,000 (equivalent to CNY419,492,000) subsequent to the issue of 2011 consolidated

Consolidated Financial Statements Summary and Notes 78
financial statements but before the end of the measurement period on October 17, 2012. As a result of this measurement period adjustment, the comparative information presented in the 2012 consolidated financial statements had been restated.
ITS Bahrain is a company incorporated in Bahrain and principally engaged in providing integrated information technology solutions and software services.
The above acquisition had the following effect on the Group’s assets and liabilities on the acquisition date:
Recognised values on acquisition
2012 2011
Huawei Digital HK
Beijing Huawei Longshine
ITS Bahrain
CNY’million CNY’million CNY’million
(restated)
Note 25(c)(i) Note 25(c)(ii) Note 25(c)(iii)
Property, plant and equipment 88 2 7
Available-for-sale investments 26 – –
Intangible assets 375 92 251
Trade and other receivables 509 62 65
Inventories 543 16 –
Cash and cash equivalents 1,025 33 31
Trade and other payables (1,629) (24) (103)
Interest-bearing loans (170) (63) –
Defined benefit post-employment plans (313) – –
Deferred tax liabilities (61) (14) (53)
Total net identifiable assets 393 104 198
Acquisition-related costs 28 – 4
Consideration, satisfied by cash 3,337 116 419
Cash acquired (1,025) (33) (30)
Net cash outflow 2,312 83 389
The trade and other receivables comprise gross contractual amounts due of CNY576,364,000 (2011:
CNY64,912,000), of which CNY4,584,000 (2011: Nil) was expected to be uncollectible at the acquisition date.
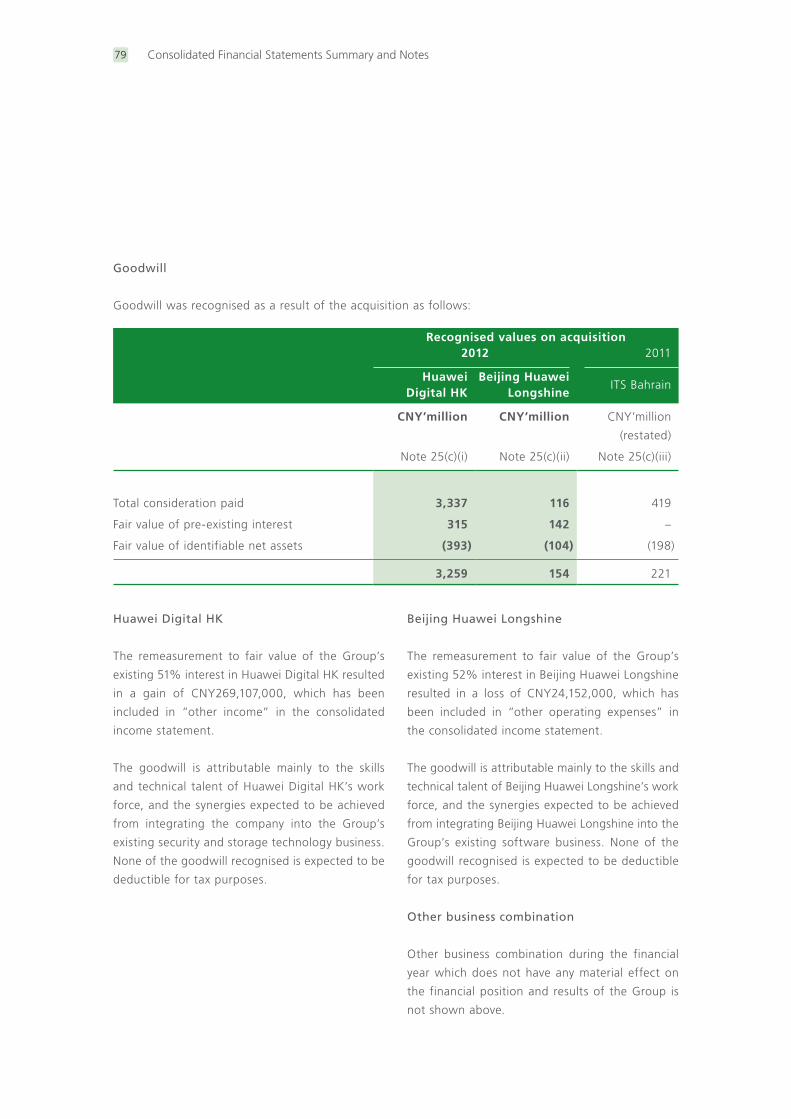
Consolidated Financial Statements Summary and Notes79
Goodwill
Goodwill was recognised as a result of the acquisition as follows:
Recognised values on acquisition2012 2011
Huawei Digital HK
Beijing Huawei Longshine
ITS Bahrain
CNY’million CNY’million CNY’million
(restated)
Note 25(c)(i) Note 25(c)(ii) Note 25(c)(iii)
Total consideration paid 3,337 116 419
Fair value of pre-existing interest 315 142 –
Fair value of identifiable net assets (393) (104) (198)
3,259 154 221
Huawei Digital HK
The remeasurement to fair value of the Group’s
existing 51% interest in Huawei Digital HK resulted
in a gain of CNY269,107,000, which has been
included in “other income” in the consolidated
income statement.
The goodwill is attributable mainly to the skills
and technical talent of Huawei Digital HK’s work
force, and the synergies expected to be achieved
from integrating the company into the Group’s
existing security and storage technology business.
None of the goodwill recognised is expected to be
deductible for tax purposes.
Beijing Huawei Longshine
The remeasurement to fair value of the Group’s
existing 52% interest in Beijing Huawei Longshine
resulted in a loss of CNY24,152,000, which has
been included in “other operating expenses” in
the consolidated income statement.
The goodwill is attributable mainly to the skills and
technical talent of Beijing Huawei Longshine’s work
force, and the synergies expected to be achieved
from integrating Beijing Huawei Longshine into the
Group’s existing software business. None of the
goodwill recognised is expected to be deductible
for tax purposes.
Other business combination
Other business combination during the financial
year which does not have any material effect on
the financial position and results of the Group is
not shown above.
Company Information
Company Information 80
Corporate Profile
Huawei is a leading global ICT solutions provider.
Through our dedication to customer-centric
innovation and strong partnerships, we have
established end-to-end capabilities and strengths
across the carrier network, enterprise, consumer,
and cloud computing fields. We are committed
to creating maximum value for telecom carriers,
enterprises and consumers by providing
competitive ICT solutions and services. Our
products and solutions have been deployed in
over 140 countries, serving more than one third
of the world’s population.
Huawei’s vision is to enrich life through
communication. By leveraging our experience and
expertise in the ICT sector, we help bridge the
digital divide by providing opportunities to enjoy
broadband services, regardless of geographic
locations. Contributing to the sustainable
development of society, the economy, and the
environment, Huawei creates green solutions that
enable customers to reduce power consumption,
carbon emissions, and resource costs.
Awards and Honors
On December 12, 2012, Huawei won the Data
Center Blueprints award from Datacenter
Dynamics (known as the Oscars of the data
center industry) for the Desktop Cloud
Container Data Center project at the first
Datacenter Dynamics Greater China Awards.
On November 21, 2012, Huawei won the Best
Use of Traffic Management for Improving
Customer Experience award for our VGS at
the 2012 annual summit of the BBTM Congress.
This is the second such prestigious award for
Huawei after the company was presented with
the Award for Most Innovative Service Launch
Enabled by Traffic Management in 2011 along
with MegaFon, the second largest carrier in
Russia.
On November 13, 2012, Huawei received
the Global Excellent Telecom Cloud Solution
Provider of the Year award from Frost &
Sullivan at the Global Community of Growth,
Innovation, and Leadership 2012. This is the
only award in the global telecom cloud market.
Company Information81
On October 19, 2012, Huawei was honored
at the Broadband World Forum 2012 with the
Best Broadband Access Award – Fixed from
InfoVision for our Vectoring solution, which
boasts the world’s highest capacity.
On September 26, 2012, Huawei won the Best
Cloud Contact Center Solution award at the
2012 China Best Customer Contact Center and
CRM Awards. This honor demonstrates the
industry’s recognition of Huawei’s efforts to
boost the development of the contact center
and customer service industries.
On September 21, 2012, Huawei was
granted the Best Unified Communications
and Collaboration Solutions Provider award
at the 2012 China Enterprise Networking &
Communications Conference and the China
Enterprise Networking and Communications
Awards (CENA).
On July 18, 2012, Huawei was presented
with the Green Technology Award for its
integrated green and energy-conserving
outdoor site solution for network energy at
CommunicAsia 2012. As a barometer of the
communications industry in Asia Pacific, this
award demonstrates the industry’s recognition
of Huawei’s green energy solutions.
On June 21, 2012, Huawei was the only vendor
granted the Best Optical Equipment Product
– OTN award of the Next Generation Optical
Awards from the Institute for International
Research (IIR) at the WDM and Next Generation
Optical Networking Forum in Monaco. This
is another top industry innovation award for
the Huawei OTN solution after winning the
InfoVision award, 2009 Top Picks award from
Light Reading (an authoritative international
communications media agency), and R&D 100
Award (known as the Oscar for scientific and
technological innovation).
On June 14, 2012, Huawei received a
prestigious award for the Best Cloud Platform
for Africa for our Galax Cloud Platform at the
awards dinner of the Cloud Africa Summit
hosted by Informa Telecom.
On May 23, 2012, Huawei won the Best LTE
Commercial Performance and Best LTE Core
Network Element awards at the 2012 LTE World
Summit. This is the third consecutive year for
Huawei to win these awards.
On May 22, 2012, Huawei was granted the
Solution Excellence Award from TMF for our
VGS solution. This is the second time Huawei
has won this award.
On May 1, 2012, acknowledging the company’s
exceptional commitment to the Middle
East technology landscape, Huawei was
distinguished as Managed Services Provider of
the Year in Telecoms during the Network World
Middle East Awards 2012.
On April 10, 2012, Huawei won Certificate of
Merit for excellent site solution designs in “Best
in Class Site Design” Beauty Contest organized
by Deutsche Telekom.
On January 30, 2012, Huawei won the Best
Backhaul Solution for Africa award for our
outstanding contributions to the construction
of IP backhaul networks in South Africa, which
raised Africa’s communications technology level
to international standards.
Risk Factors
82Risk Factors
All risk factors mentioned in this Annual Report,
particularly those outlined in this section, refer to
key future uncertainties that could have a material
effect on the company’s business objectives. They
were identified from the company’s strategic
planning, business model, external environment,
and financial system. Major risk factors are events
that will significantly impact the company’s
competition landscape, reputation, financial
conditions, operating results, and long-term
prospects within the next 18 months. Hereinafter,
all risk factors refer to major risk factors.
Huawei’s Risk Management System
Based on the Committee of Sponsoring
Organizations of the Treadway Commission (COSO)
framework and in line with our organizational
structure and operating model, Huawei designed
and implemented an enterprise risk management
(ERM) system with a corresponding ERM policy. The
ERM system consists of three major organizations/
roles and an operational mechanism:
The Finance Committee (FC) makes routine
decisions on corporate risk management.
All business executives are responsible for risk
management of their assigned domains.
The Enterprise Risk Mgmt Dept assists the
FC and all business executives in controlling
corporate-level risks.
Huawei has incorporated risk management factors
into its strategic planning and business planning
processes. Through strategic planning, all domains
systematically identify and assess their risks. In
the 2012 business plan, all domains developed
countermeasures against key risks, thereby giving
priority to risk monitoring and reporting in daily
operations. The company ensures the continuity
of business operations by taking risks into account
during strategic decision making and planning,
while also preemptively controlling risks in business
plans and execution.
Strategic Risks
Intense competition: The markets in which
Huawei operates are highly competitive in terms
of price, functionality, and service quality, as
well as the timing of new product and service
development. In certain geographical markets,
our main competitors may offer more attractive
prices, products, services, or other incentives. The
rapid development of science and technology, and
changes in alternative technologies or industry
standards will lead to shorter product lifecycles
and may attract more new entrants into the
markets in which we operate.
In this market context, the ability to fully
understand and satisfy customer needs is a
prerequisite as technologies change rapidly and
competition intensifies. To stay competitive
and secure our expected operating results, we
must constantly introduce new products and
functionalities into the market while reducing the
total costs for our customers.
83 Risk Factors
External Risks
Economic environment: The global economic
downturn could cause telecom carriers to postpone
investments or initiate other cost-cutting measures
to improve their financial conditions. These factors
could result in reduced demand for network
infrastructures and services, which would in turn
affect Huawei’s operating results.
Country-specific risks: Huawei conducts business
in more than 140 countries. Operating in these
countries involves certain risks, such as civil unrest,
economic and political instability, imposition of
exchange controls, nationalization of private
assets, and debts. All these risks require Huawei
to have a high aptitude for risk management. In
addition, there may be uncertainties in the legal
environment in certain regions. Although we strive
to comply with all such laws and regulations,
unintentional violations could have material
adverse effects on our business.
Trade barriers: Today, the complex international
economic and financial conditions along with
increasingly fierce industry competition may
challenge Huawei with different types of trade
barriers in the countries it operates. Measures
resulting in trade barriers have become more
complicated and include trade investigations,
the imposing of large amounts of anti-dumping
and anti-subsidy duties, and setting special
product quality and technical specifications and
requirements. All of these measures may impact
the import of Huawei products. Although we
proactively respond to mitigate risks from such
trade barriers, these barriers may still adversely
affect Huawei’s operating results.
Natural disasters: Earthquakes, floods, and other
natural disasters may impact the company’s supply
chain operations, and slow down or even prevent
delivery in a certain region or even all regions.
Operational Risks
Business continuity: Although Huawei strives to
avoid single-source supplier solutions, it is not
always possible. Finding an alternative supplier
or redesigning products may be time-consuming.
As such, supply and delivery of our products
to our customers could be disrupted if any of
our single-source suppliers were to meet with
difficulties. To mitigate this risk, we periodically
assess and conduct audits on our suppliers, and
initiate product replacements or redesign.
Rising labor costs: Increasing labor costs in China
may offset the company’s efforts to improve
efficiency and ultimately affect our profitability.
Information security: While Huawei has judiciously
adopted information security measures to protect
our intellectual property rights, they may not be
adequate to prevent infringement or improper
use of our information, patents, or licenses.
Misappropriations of this nature will cause losses
to Huawei even though we may be protected to
some extent by intellectual property law.
Financial Risks
For further information on financial risks, see
“Financial Risk Management” on pages 25 to 27
of this Annual Report.
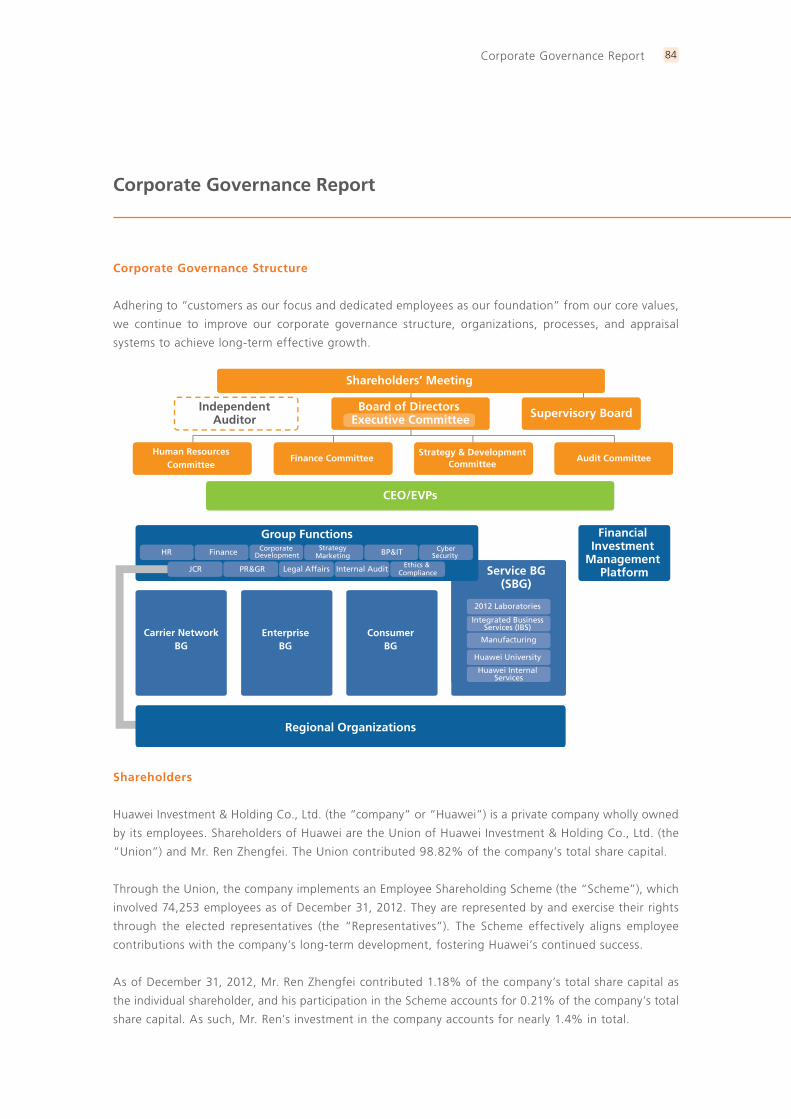
Corporate Governance Report
84Corporate Governance Report
Corporate Governance Structure
Adhering to “customers as our focus and dedicated employees as our foundation” from our core values,
we continue to improve our corporate governance structure, organizations, processes, and appraisal
systems to achieve long-term effective growth.
Shareholders’ Meeting
Independent Auditor Supervisory Board
Human Resources Committee
Finance Committee
CEO/EVPs
Strategy & Development Committee
Audit Committee
Financial Investment
Management PlatformService BG
(SBG)
Carrier Network BG
Enterprise BG
Consumer BG
2012 Laboratories
Board of Directors Executive Committee
Group FunctionsHR Corporate
DevelopmentFinance Strategy Marketing BP&IT Cyber
Security
JCR PR&GR Legal Affairs Internal Audit Ethics & Compliance
Integrated Business Services (IBS)
Manufacturing
Huawei University
Huawei Internal Services
Regional Organizations
Shareholders
Huawei Investment & Holding Co., Ltd. (the “company” or “Huawei”) is a private company wholly owned
by its employees. Shareholders of Huawei are the Union of Huawei Investment & Holding Co., Ltd. (the
“Union”) and Mr. Ren Zhengfei. The Union contributed 98.82% of the company’s total share capital.
Through the Union, the company implements an Employee Shareholding Scheme (the “Scheme”), which
involved 74,253 employees as of December 31, 2012. They are represented by and exercise their rights
through the elected representatives (the “Representatives”). The Scheme effectively aligns employee
contributions with the company’s long-term development, fostering Huawei’s continued success.
As of December 31, 2012, Mr. Ren Zhengfei contributed 1.18% of the company’s total share capital as
the individual shareholder, and his participation in the Scheme accounts for 0.21% of the company’s total
share capital. As such, Mr. Ren’s investment in the company accounts for nearly 1.4% in total.
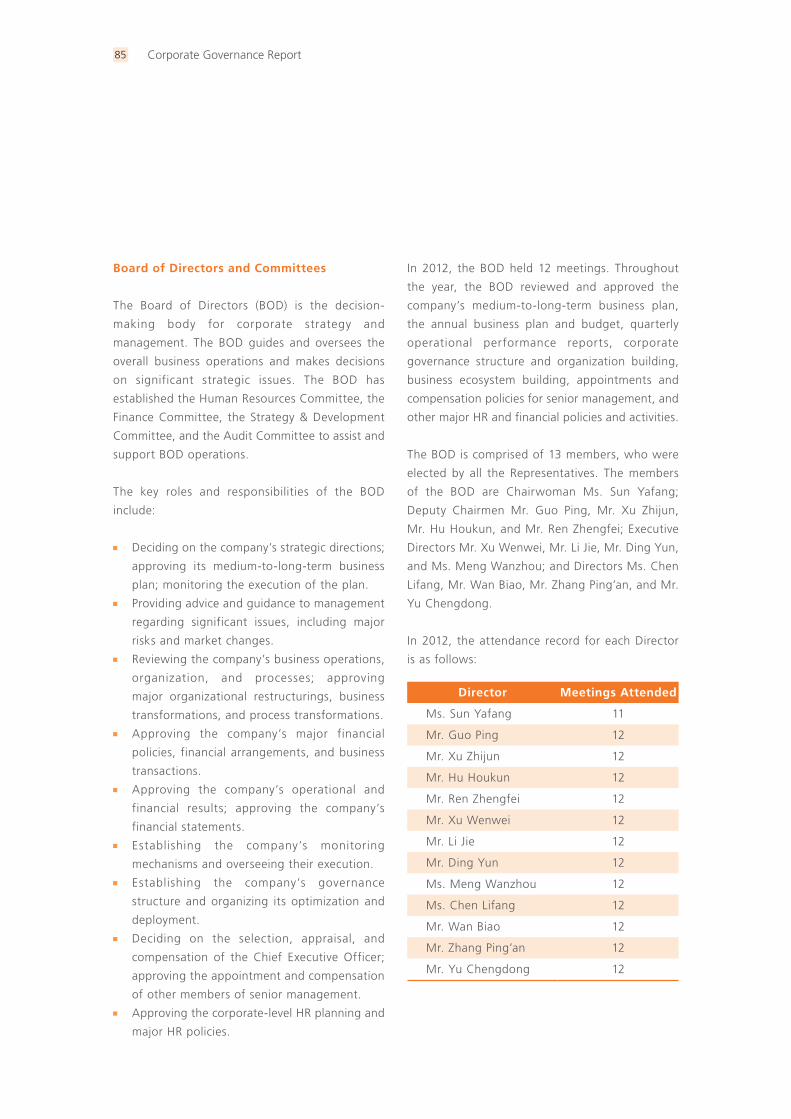
85 Corporate Governance Report
Board of Directors and Committees
The Board of Directors (BOD) is the decision-
making body for corporate strategy and
management. The BOD guides and oversees the
overall business operations and makes decisions
on significant strategic issues. The BOD has
established the Human Resources Committee, the
Finance Committee, the Strategy & Development
Committee, and the Audit Committee to assist and
support BOD operations.
The key roles and responsibilities of the BOD
include:
Deciding on the company’s strategic directions;
approving its medium-to-long-term business
plan; monitoring the execution of the plan.
Providing advice and guidance to management
regarding significant issues, including major
risks and market changes.
Reviewing the company’s business operations,
organization, and processes; approving
major organizational restructurings, business
transformations, and process transformations.
Approving the company’s major financial
policies, financial arrangements, and business
transactions.
Approving the company’s operational and
financial results; approving the company’s
financial statements.
Establishing the company’s monitoring
mechanisms and overseeing their execution.
Establishing the company’s governance
structure and organizing its optimization and
deployment.
Deciding on the selection, appraisal, and
compensation of the Chief Executive Officer;
approving the appointment and compensation
of other members of senior management.
Approving the corporate-level HR planning and
major HR policies.
In 2012, the BOD held 12 meetings. Throughout
the year, the BOD reviewed and approved the
company’s medium-to-long-term business plan,
the annual business plan and budget, quarterly
operational performance reports, corporate
governance structure and organization building,
business ecosystem building, appointments and
compensation policies for senior management, and
other major HR and financial policies and activities.
The BOD is comprised of 13 members, who were
elected by all the Representatives. The members
of the BOD are Chairwoman Ms. Sun Yafang;
Deputy Chairmen Mr. Guo Ping, Mr. Xu Zhijun,
Mr. Hu Houkun, and Mr. Ren Zhengfei; Executive
Directors Mr. Xu Wenwei, Mr. Li Jie, Mr. Ding Yun,
and Ms. Meng Wanzhou; and Directors Ms. Chen
Lifang, Mr. Wan Biao, Mr. Zhang Ping’an, and Mr.
Yu Chengdong.
In 2012, the attendance record for each Director
is as follows:
Director Meetings Attended
Ms. Sun Yafang 11
Mr. Guo Ping 12
Mr. Xu Zhijun 12
Mr. Hu Houkun 12
Mr. Ren Zhengfei 12
Mr. Xu Wenwei 12
Mr. Li Jie 12
Mr. Ding Yun 12
Ms. Meng Wanzhou 12
Ms. Chen Lifang 12
Mr. Wan Biao 12
Mr. Zhang Ping’an 12
Mr. Yu Chengdong 12
86Corporate Governance Report
The BOD has established the Executive Committee,
which acts as the executive body of the BOD while
the BOD is adjourned. Members of the Executive
Committee include Mr. Guo Ping, Mr. Xu Zhijun,
Mr. Hu Houkun, Mr. Xu Wenwei, Mr. Li Jie, Mr.
Ding Yun, and Ms. Meng Wanzhou. In 2012, the
Executive Committee of the BOD held 18 meetings.
Human Resources Committee
The Human Resources Committee manages and
improves organizational capabilities such as
organization, talent, and culture. This committee
establishes key HR management policies under
the authorization of the BOD and oversees
the execution of these policies. To support the
company’s business development, the committee
ensures that HR policies reflect the company’s HR
management philosophy while also considering the
business characteristics and management models
of regions, BGs, and functional departments.
The key roles and responsibilities of the Human
Resources Committee include:
Managing the succession plans, allocation
schemes, and matters related to managerial
appointments or removals, performance
appraisals, compensation, and incentives for key
managers and talent under the authorization of
the BOD.
Managing overall incentive policies, policies
related to social security benefits, the
compensation structure, and job matching.
Managing policies for organizational
development and optimization; managing the
HR budget and headcount planning for each
budgetary unit.
Managing the policies and providing guidance
for employee learning and development at all
levels.
Setting policies related to employee compliance
with internal regulatory requirements and
managing disciplinary actions against major
violations.
Providing routine guidance on policies related
to the occupational health and safety of
employees.
Managing the strategic HR plans and key HR
transformation activities.
The Human Resources Committee meets on a
monthly basis and convenes special sessions
whenever needed. At the invitation of the
committee, business executives and field-specific
experts may attend the meetings as non-voting
participants. The Human Resources Committee
held 12 meetings in 2012 to meet the requests
of the BOD and globalized business development
needs of multiple business groups. The subjects
discussed included but were not limited to the
following: HR strategy planning which focused
on talent, organization, incentive, culture,
and other managerial elements; selection and
development of staff members for key managerial
and professional positions; optimization of the
company’s compensation and incentive structure;
review and approval of organizational restructuring
proposals; development of a governance
mechanism for flexible headcount budgeting;
employee discipline and compliance management;
development of HR policy frameworks and policies;
key implementation decisions; supervision of policy
implementation.
87 Corporate Governance Report
The Human Resources Committee is comprised
of 19 members, including BOD members, senior
business executives, and senior HR experts. The
Chairman of the committee is Mr. Hu Houkun. The
members include Mr. Guo Ping, Mr. Xu Zhijun, Mr.
Xu Wenwei, Mr. Li Jie, Mr. Ding Yun, Ms. Meng
Wanzhou, Mr. Li Jian, Mr. Zha Jun, Ms. He Tingbo,
Mr. Zhang Ping’an, Mr. Yu Chengdong, Mr. Liang
Hua, Mr. Peng Zhiping, Mr. Li Yingtao, Mr. Wan
Biao, Mr. Tian Feng, Mr. Li Shanlin, and Mr. Peng
Bo.
Finance Committee
The Finance Committee is positioned as the
overall enterprise value integrator of the company.
Under the authorization of the BOD, the Finance
Committee exercises macro-control over the
company’s business operations, investment
activities, and enterprise risks, helping to strike
a dynamic balance between opportunities and
resources. This facilitates the company’s effective
growth.
The key roles and responsibilities of the Finance
Committee include:
Aligning resources with business needs based
on the company’s resources and resource
acquisition capabilities.
Setting financial objectives for the growth
and investment projects of the company
and responsibility centers; determining the
standards, structure, and pace for resource
investments.
Measuring the monetary value of key strategies,
conducting forward-looking forecasts and
analysis, and submitting proposals to the BOD.
Reviewing the company’s annual budgeting
plan, approving the annual budget for each
responsibility center, and ensuring closed-
loop management of the corporate-level
plan, budget, accounting, and performance
appraisals.
Reviewing the capital structure plan; making
proposals for major financing activities, the
asset structure, and profit distribution.
Reviewing the company’s key financial policies,
annual financial statements, and issues related
to information disclosure.
Reviewing capital operations and strategic
cooperation projects, submitting proposals
to the BOD, and periodically assessing the
execution of such projects.
Reviewing the company’s risk management
framework, advising on trade compliance
issues, and establishing a business continuity
management system.
The Finance Committee meets on a monthly basis
and convenes special sessions whenever needed.
Based on business needs and requests of the
BOD, the Finance Committee held 12 meetings in
2012. At the meetings, the committee reviewed
such items as the company’s medium-to-long-term
business plan, annual budgeting plan, operational
management, capital operations projects, the
capital structure, enterprise risk management,
and subsidiary and joint venture management.
The Finance Committee discussed and established
relevant financial policies and systems, reviewed
and decided on relevant activities, and monitored
the execution of these activities.
88Corporate Governance Report
The Finance Committee is comprised of 20
members, including BOD members and financial
experts. The Chairman of the committee is Mr.
Guo Ping. The members include Mr. Xu Zhijun, Mr.
Hu Houkun, Mr. Xu Wenwei, Mr. Li Jie, Mr. Ding
Yun, Ms. Meng Wanzhou, Mr. Liang Hua, Mr. Wan
Biao, Mr. Peng Zhiping, Mr. Tian Feng, Mr. Fang
Weiyi, Mr. Song Liuping, Mr. Yao Fuhai, Mr. Jiang
Xisheng, Mr. Li Jin’ge, Mr. Peng Qiu’en, Mr. Yi
Xiang, Mr. Yang Yuefeng, and Mr. Qiao Nengdong.
Strategy & Development Committee
The Strategy & Development Committee (SDC)
considers, sets, and executes the company’s
strategic directions. The SDC gains insight into
major trends concerning the industry, technologies,
and customer needs; and identifies opportunities
and paths for the company’s development.
Through macro-management of industrial
investments, technologies, business models,
and transformations, the SDC ensures that the
company continues to achieve effective growth
through concerted efforts.
The key roles and responsibilities of the SDC
include:
Managing the company’s medium-to-long-term
strategic plan, significant annual targets, and
the top priorities of the year.
Managing the company’s brand strategy,
architecture, and characteristics, as well as
the publicity strategy and direction of the
company.
Managing the company’s strategy for strategic
partnerships and alliances, as well as the
selection of strategic partners and allies.
Managing the company’s business portfolios
and scope.
Managing the company’s pricing policies,
commercial authorization principles, and actual
pricing of key strategic products.
Managing the company’s medium-to-long-
term technology development plan, standards
and patent strategy, and major technology
investments.
Managing the company’s medium-to-long-term
business transformation strategy, process and
management system structure, and quality
policies.
Reviewing the company’s business portfolios
frequently to ensure investments are made in
the strategic domains.
The SDC held 12 meetings in 2012 and a four-
day strategy and development workshop in
September. In accordance with the positioning
and responsibility determined by the BOD, the SDC
focuses on the company’s strategy formulation
and direction. By setting the business positioning
and directions of related industries, the SDC
has enabled the company’s core business to be
focused on the targeted carrier, enterprise, and
consumer customers so that BGs can develop
and operate based on the characteristics of their
specific customers and industries. Through strategy
planning and execution, the SDC established a
closed-loop strategy management system to help
the company achieve business objectives.
89 Corporate Governance Report
The SDC is comprised of 23 members, including
BOD members, senior business executives, and
field-specific senior experts. The Chairman of the
committee is Mr. Xu Zhijun. The members include
Mr. Guo Ping, Mr. Hu Houkun, Mr. Xu Wenwei,
Mr. Li Jie, Mr. Ding Yun, Ms. Meng Wanzhou, Mr.
Hou Jinlong, Mr. Zhang Ping’an, Mr. Li Yingtao,
Mr. He Gang, Mr. Zha Jun, Mr. Tang Qibing, Mr.
Zhang Xinyu, Mr. Peng Bo, Mr. Deng Biao, Mr. Yu
Chengdong, Mr. Wang Tao, Mr. Liang Hua, Mr.
Zheng Yelai, Mr. Wu Qinming, Ms. He Tingbo, and
Mr. Peng Zhongyang.
Audit Committee
The Audit Committee oversees internal controls
under the authorization of the BOD. The oversight
responsibilities include monitoring the internal
control system, internal and external audits, and
corporate processes, as well as compliance with
laws and regulations and the Business Conduct
Guidelines (BCG).
The key roles and responsibilities of the Audit
Committee include:
Approving the internal audit plan of the year;
reviewing the scope of the internal audit plan,
resources required for its execution, and the
results of the execution.
Approving corporate policies related to internal
control management; approving the company’s
internal control development plan and key
milestones; regularly assessing the company’s
overall internal control posture.
Overseeing the effectiveness of the ethics
and compliance function, and the company’s
compliance with legal and regulatory
requirements as well as corporate policies.
Reviewing the selection of external auditors;
reporting the change of external auditors to
the BOD for approval, and approving all related
fees; assessing the effectiveness of external
auditors’ performance.
Supervising the integrity, completeness, and
legal compliance of the company’s financial
statements; reviewing accounting policy
compliance and application as well as disclosure
of financial statements.
The Audit Committee approves the control
KPIs at the beginning of each year, and has the
right to summon Global Process Owners (GPOs)
and business executives to report their control
work.
The Audit Committee meets on a quarterly basis
and convenes special sessions whenever needed.
At the invitation of the Audit Committee, business
executives and field-specific experts may attend
the meetings as non-voting participants. The
Audit Committee held four meetings in 2012.
Focusing on topics such as risk management and
internal control construction, the Audit Committee
reviewed and approved the annual internal audit
planning and the updated three-year roadmap for
global process control construction, and listened
to the internal control maturity trend reports,
the Semi-Annual Control Assessment (SACA)
reports, and the control improvement work reports
presented by GPOs. The Audit Committee also
improved employee compliance with Huawei’s
BCG by publicizing major audit findings and non-
compliance cases. In addition, the Audit Committee
discussed the management improvement proposal
with the external auditor.
90Corporate Governance Report
The Audit Committee is comprised of 9 members,
including members of the Supervisory Board, BOD
members, and field-specific experts. The Chairman
of the committee is Mr. Liang Hua. The members
include Mr. Peng Zhiping, Mr. Ren Shulu, Mr.
Tian Feng, Mr. Li Jie, Mr. Chen Zhaohui, Mr. Peng
Zhijun, Mr. Hui Chun, and Mr. Zhou Daiqi.
Supervisory Board
Pursuant to the requirements of the Company
Law of the People’s Republic of China, Huawei
has established a Supervisory Board. The key
roles and responsibilities of the Supervisory
Board include overseeing the company’s financial
and operational performance, monitoring the
responsibility fulfillment of BOD members and
senior management, as well as the standardization
of BOD operations. Members of the Supervisory
Board attend BOD meetings as non-voting
participants.
In 2012, the Supervisory Board held one
meeting, reviewing and assessing the financial
performance of the company, and conducting
training sessions and workshops regarding
its roles and responsibilities for financial
supervision. Throughout the year, members of
the Supervisory Board attended 12 meetings of
the BOD as non-voting participants, monitoring
the financial performance of the company, the
responsibility fulfillment of BOD members and
senior management, and the standardization of
BOD operations.
The Supervisory Board is comprised of 5 members,
who were elected by all the Representatives. The
members of the Supervisory Board are Chairman
Mr. Liang Hua, and members Mr. Peng Zhiping,
Mr. Ren Shulu, Mr. Tian Feng, and Mr. Deng Biao.
Rotating CEOs
Huawei implements the rotating CEO system
under the leadership of the BOD. Acting as the
primary person of the company’s operations and
crisis management during his tenure, the rotating
and acting CEO is responsible for the company’s
survival and development.
The rotating and acting CEO is responsible for
convening and chairing the meetings of the
Executive Committee of the BOD. During routine
management decision making, the rotating and
acting CEO apprises members of the BOD and the
Supervisory Board of his responsibility fulfillment
in a timely manner.
Three Deputy Chairmen take turns to act as the
rotating and acting CEO for a tenure of six months.
In 2012, the acting tenures for the three rotating
CEOs are as follows:
Mr. Hu Houkun: October 1, 2011 – March 31, 2012
Mr. Xu Zhijun: April 1, 2012 – September 30, 2012
Mr. Guo Ping: October 1, 2012 – March 31, 2013
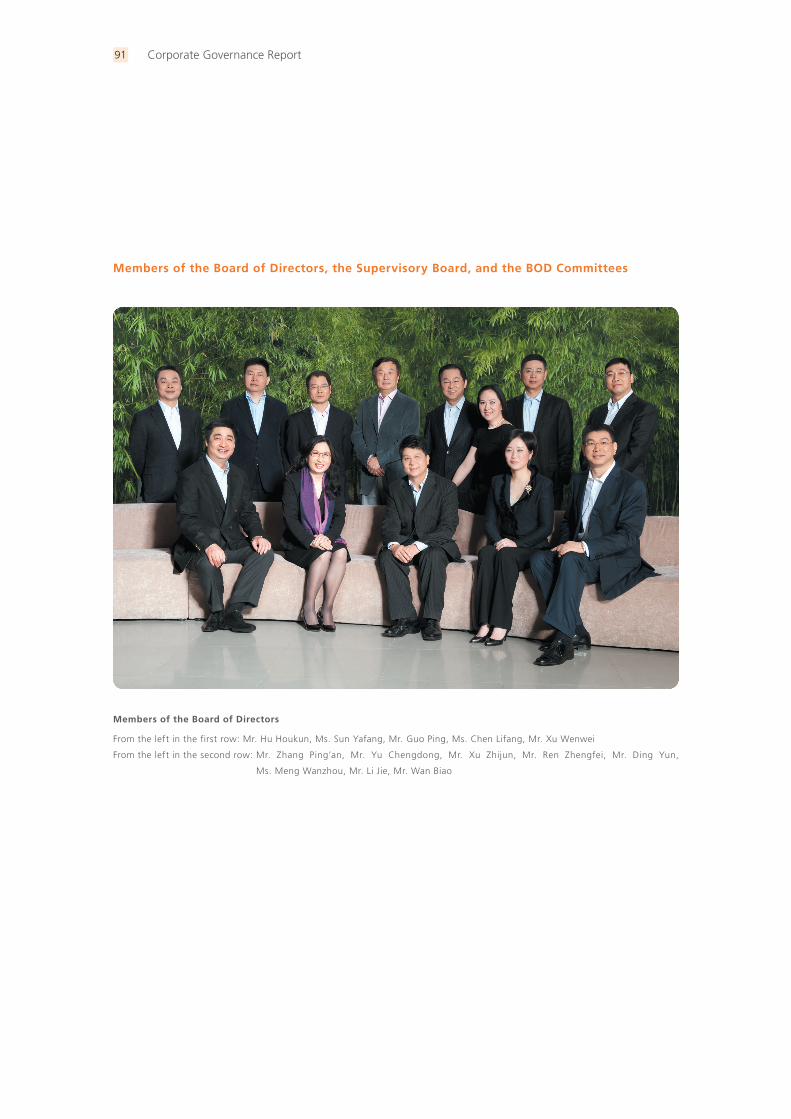
91 Corporate Governance Report
Members of the Board of Directors, the Supervisory Board, and the BOD Committees
Members of the Board of Directors
From the left in the first row: Mr. Hu Houkun, Ms. Sun Yafang, Mr. Guo Ping, Ms. Chen Lifang, Mr. Xu Wenwei
From the left in the second row: Mr. Zhang Ping’an, Mr. Yu Chengdong, Mr. Xu Zhijun, Mr. Ren Zhengfei, Mr. Ding Yun,
Ms. Meng Wanzhou, Mr. Li Jie, Mr. Wan Biao
92Corporate Governance Report
Director Biographies
Ms. Sun Yafang
Ms. Sun joined Huawei in 1989, and had served as an engineer of the Marketing & Sales Dept, Director of the Training Center, President of the Procurement Dept, General Manager of Wuhan Office, President of the Marketing & Sales Dept, Chair of the Human Resources Committee, Chair of the Business Transformation Executive Steering Committee (BT-ESC), Chair of the Strategy and Customer Standing Committee, and President of Huawei University. Since 1999, Ms. Sun has been the Chairwoman of the Board.
Prior to joining Huawei, Ms. Sun worked as a technician at the state-owned Xinxiang Liaoyuan Radio Factory in 1982, a teacher at China Research Institute of Radio Wave Propagation in 1983, and an engineer at Beijing Research Institute of Information Technology in 1985.
Ms. Sun was born in 1955, and graduated in 1982 with a bachelor’s degree from Chengdu University of Electronic Science and Technology.
Mr. Guo Ping
Born in 1966, Mr. Guo holds a master’s degree from Huazhong University of Science and Technology. Mr. Guo joined Huawei in 1988 and has served as an R&D project manager, General Manager of Supply Chain, Director of Huawei Executive Office, Chief Legal Officer, President of the Business Process & IT Mgmt Dept, President of the Corporate Development Dept, Chairman and President of Huawei Device, Corporate EVP, and Chairman of the Finance Committee.
Mr. Xu Zhijun (Eric Xu)
Born in 1967, Mr. Xu holds a doctorate degree from Nanjing University of Science & Technology. Mr. Xu joined Huawei in 1993 and has served as President of the Wireless Product Line, Chief Strategy & Marketing Officer, Chief Products & Solutions Officer, Chairman of the Investment
Review Board, Corporate EVP, and Chairman of
the SDC.
Mr. Hu Houkun (Ken Hu)
Born in 1967, Mr. Hu holds a bachelor’s degree
from Huazhong University of Science and
Technology. Mr. Hu joined Huawei in 1990 and has
served as President of the Marketing & Sales Dept
in China, President of the Latin America Region,
President of the Global Sales Dept, Chief Sales &
Service Officer, Chief Strategy & Marketing Officer,
Chairman of the Corporate Global Cyber Security
Committee, Chairman of the BOD of Huawei
USA, Corporate EVP, and Chairman of the Human
Resources Committee.
Mr. Ren Zhengfei
Born on October 25, 1944 into a rural family
where both parents were school teachers, Mr.
Ren Zhengfei spent his primary and middle school
years in a remote mountainous town in Guizhou
Province. In 1963, he studied at the Chongqing
Institute of Civil Engineering and Architecture.
After graduation, he was employed in the civil
engineering industry until 1974 when he joined
the military’s Engineering Corps as a soldier tasked
to establish the Liao Yang Chemical Fiber Factory.
Subsequently, Mr. Ren had taken positions as a
Technician, an Engineer, and was lastly promoted
as a Deputy Director, which was a professional
role equivalent to a Deputy Regimental Chief, but
without military rank. Because of his outstanding
performance, Mr. Ren was invited to attend the
National Science Conference in 1978 and the
12th National Congress of the Communist Party
of China in 1982. Mr. Ren retired from the army
in 1983 when the Chinese government disbanded
the entire Engineering Corps. He then worked in
the logistics service base of the Shenzhen South
Sea Oil Corporation. As he was dissatisfied with his
job, he decided to establish Huawei with a capital
of CNY21000 in 1987. He became the CEO of
Huawei in 1988 and has held the title ever since.
93 Corporate Governance Report
Mr. Xu Wenwei (William Xu)
Born in 1963, Mr. Xu holds a master’s degree from
Southeast University. Mr. Xu joined Huawei in 1991
and has served as President of the International
Technical Sales & Marketing Dept, President of
the European Area, Chief Strategy & Marketing
Officer, Chief Sales & Service Officer, President of
the Joint Committee of Regions, and CEO of the
Enterprise BG.
Mr. Li Jie (Jason Li)
Born in 1967, Mr. Li holds a master’s degree from
Xi’an Jiaotong University. Mr. Li joined Huawei
in 1992 and has served as Regional President,
President of the Global Technical Service Dept,
President of the Human Resource Mgmt Dept, and
President of the Joint Committee of Regions.
Mr. Ding Yun (Ryan Ding)
Born in 1969, Mr. Ding holds a master’s degree
from Southeast University. Mr. Ding joined Huawei
in 1996 and has served as Product Line President,
President of the Global Solution Sales Dept,
President of the Global Marketing Dept, Chief
Products & Solutions Officer, and CEO of the
Carrier Network BG.
Ms. Meng Wanzhou (Cathy Meng)
Born in 1972, Ms. Meng holds a master’s degree
from Huazhong University of Science and
Technology. Ms. Meng joined Huawei in 1993.
She obtained her M.A. in 1998. Ms. Meng has
served as Director of the International Accounting
Dept, CFO of Huawei Hong Kong, President of
the Accounting Mgmt Dept, President of the Sales
Financing & Treasury Mgmt Dept, and currently,
CFO of Huawei.
Ms. Chen Lifang
Born in 1971, Ms. Chen graduated from Northwest
University in China. Ms. Chen joined Huawei in
1995 and has served as Chief Representative of
the Beijing Representative Office, Vice President of
the International Marketing Dept, Deputy Director
of the Domestic Marketing Management Office,
President of the Public Affairs and Communications
Dept, and Corporate Senior Vice President.
Mr. Wan Biao
Born in 1972, Mr. Wan holds a bachelor’s degree
from the University of Science and Technology of
China. Mr. Wan joined Huawei in 1996 and has
served as Director for the UMTS RAN System,
President of the UMTS Product Line, President of
the Wireless Product Line, and CEO of Huawei
Device.
Mr. Zhang Ping’an (Alex Zhang)
Born in 1972, Mr. Zhang holds a master’s degree
from Zhejiang University. Mr. Zhang joined Huawei
in 1996 and has served as Product Line President,
Senior Vice President, Vice President of Strategy &
Marketing, Regional Vice President, Vice President
of the Global Technical Service Dept, CEO of
Huawei Symantec, COO of the Enterprise BG, and
President of the Carrier Software & Core Network
Business Unit.
Mr. Yu Chengdong (Richard Yu)
Born in 1969, Mr. Yu holds a master’s degree
from Tsinghua University. Mr. Yu joined Huawei in
1993 and has served as 3G Product Director, Vice
President of the Wireless Technical Sales Dept,
President of the Wireless Product Line, President
of the European Area, Chief Strategy & Marketing
Officer, Chairman of Huawei Device, and CEO of
the Consumer BG.
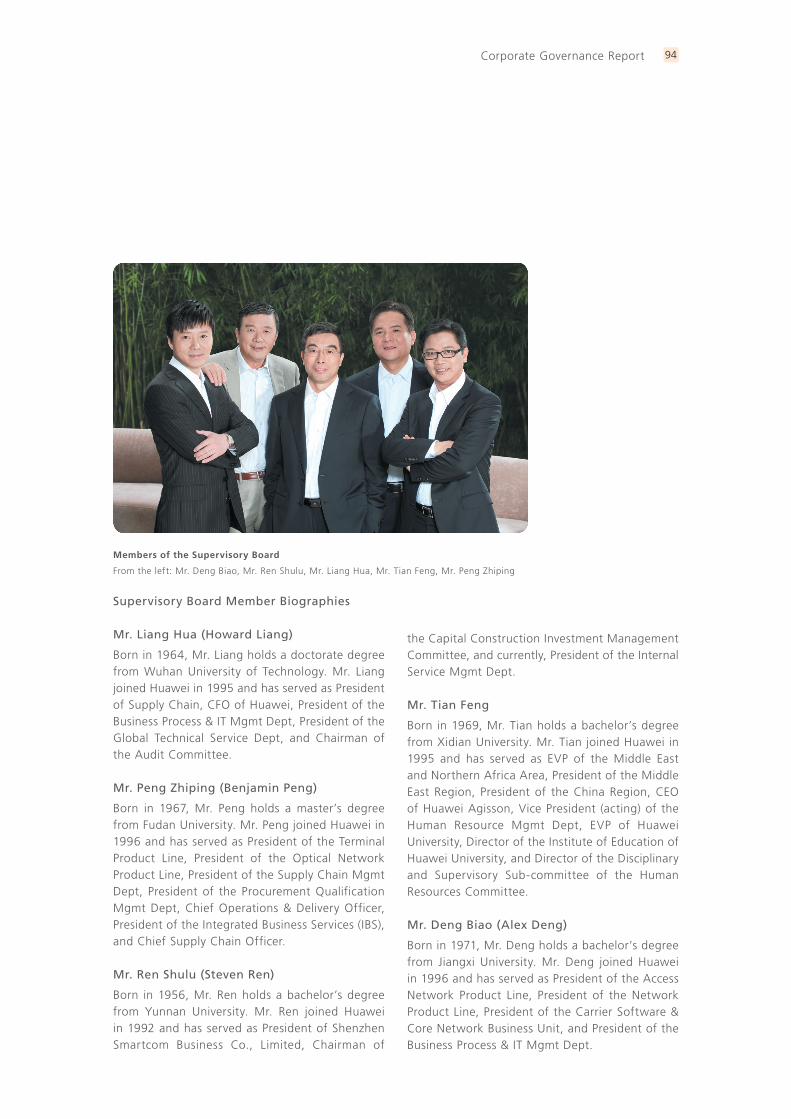
94Corporate Governance Report
Supervisory Board Member Biographies
Mr. Liang Hua (Howard Liang)
Born in 1964, Mr. Liang holds a doctorate degree from Wuhan University of Technology. Mr. Liang joined Huawei in 1995 and has served as President of Supply Chain, CFO of Huawei, President of the Business Process & IT Mgmt Dept, President of the Global Technical Service Dept, and Chairman of the Audit Committee.
Mr. Peng Zhiping (Benjamin Peng)
Born in 1967, Mr. Peng holds a master’s degree from Fudan University. Mr. Peng joined Huawei in 1996 and has served as President of the Terminal Product Line, President of the Optical Network Product Line, President of the Supply Chain Mgmt Dept, President of the Procurement Qualification Mgmt Dept, Chief Operations & Delivery Officer, President of the Integrated Business Services (IBS), and Chief Supply Chain Officer.
Mr. Ren Shulu (Steven Ren)
Born in 1956, Mr. Ren holds a bachelor’s degree from Yunnan University. Mr. Ren joined Huawei in 1992 and has served as President of Shenzhen Smartcom Business Co., Limited, Chairman of
the Capital Construction Investment Management Committee, and currently, President of the Internal Service Mgmt Dept.
Mr. Tian Feng
Born in 1969, Mr. Tian holds a bachelor’s degree from Xidian University. Mr. Tian joined Huawei in 1995 and has served as EVP of the Middle East and Northern Africa Area, President of the Middle East Region, President of the China Region, CEO of Huawei Agisson, Vice President (acting) of the Human Resource Mgmt Dept, EVP of Huawei University, Director of the Institute of Education of Huawei University, and Director of the Disciplinary and Supervisory Sub-committee of the Human Resources Committee.
Mr. Deng Biao (Alex Deng)
Born in 1971, Mr. Deng holds a bachelor’s degree from Jiangxi University. Mr. Deng joined Huawei in 1996 and has served as President of the Access Network Product Line, President of the Network Product Line, President of the Carrier Software & Core Network Business Unit, and President of the Business Process & IT Mgmt Dept.
Members of the Supervisory Board
From the left: Mr. Deng Biao, Mr. Ren Shulu, Mr. Liang Hua, Mr. Tian Feng, Mr. Peng Zhiping
95 Corporate Governance Report
Mr. Fang Weiyi
Born in 1965, Mr. Fang holds a master’s degree
from the Aeronautics Computing Technique
Research Institute. Mr. Fang joined Huawei in
1995 and has served as an engineer, Director of
the Intelligent Network Product Line, Director
of the Strategy and Planning Dept, President of
the Finance Mgmt Dept, President of the Sales &
Delivery Finance Mgmt Dept, and currently, CFO
of the Carrier Network BG and member of the
Finance Committee.
Mr. Jiang Xisheng
Born in 1966, Mr. Jiang holds a bachelor’s degree
from Xidian University. Mr. Jiang joined Huawei
in 1989 and has served as Vice President of the
Marketing & Sales Dept, General Manager of the
General Procurement Dept, Vice President and
CFO of Huawei Electric, Director of the Investment
Mgmt Dept, Vice President of the Finance Dept,
Chief Secretary of the BOD, and member of the
Finance Committee.
Mr. Tang Qibing
Born in 1970, Mr. Tang holds a master’s degree
from the University of Electronic Science and
Technology of China. Mr. Tang joined Huawei
in 1996 and has served as Vice President of the
Global Technical Sales Dept, Vice President of the
Middle East and Northern Africa Area, General
Manager of the Turkey Representative Office,
President of the Central Asia Region, President of
the Global Sales Dept under the Enterprise BG, and
member of the SDC.
Mr. Li Jian (James Lee)
Born in 1973, Mr. Li holds a master’s degree from
Xidian University. Mr. Li joined Huawei in 2001
and has served as General Manager of the Nigeria
Representative Office, President of the Western
Africa Region, Special Assistant to Chief Sales
& Service Officer, President of the Accounts and
Regions Business Mgmt Dept, President of the CEE
& Nordic Region, President of the Latin America
Area, Vice President of the Joint Committee of
Regions, and member of the Human Resources
Committee.
Mr. Li Shanlin
Born in 1968, Mr. Li holds a master’s degree from
Beijing University of Aeronautics and Astronautics.
Mr. Li joined Huawei in 1996 and has served as
an R&D project manager, Department Manager at
Huawei Technologies India Private Limited, Deputy
Chief of the Beijing Research Center, Director
of the R&D Dept of the Data Communications
Product Line, Deputy Director of the HR Branch of
Products & Solutions, Vice President of the Human
Resource Mgmt Dept, and member of the Human
Resources Committee.
Mr. Li Jin’ge
Born in 1968, Mr. Li holds a bachelor’s degree from
Beijing University of Posts and Telecommunications.
Mr. Li joined Huawei in 1992 and has served
as Regional Vice President, Regional President,
President of the Global Technical Sales Dept,
President of the Sub-Sahara Area, member of the
Joint Committee of Regions, and member of the
Finance Committee.
Committee Member Biographies
Only the biographies of committee members not listed in “Director Biographies” or “Supervisory Board
Member Biographies” are included in this section. (The order in which the biographies are provided
is based on the number of strokes needed to complete the Chinese character that corresponds to the
member’s surname.)

96Corporate Governance Report
Mr. Li Yingtao
Born in 1969, Mr. Li holds a doctorate degree
from Harbin Institute of Technology. Mr. Li joined
Huawei in 1997 and has served as Chief of the
Sweden Research Center, Director of the Product
Mgmt Dept of Wireless Marketing, Director
of the Research Dept of Products & Solutions,
Director of the General Technology Office of
Products & Solutions, President of the Central
Research & Development Unit, President of the
2012 Laboratories, Director of the Integrated
Technology Management Team, member of the
Human Resources Committee, and member of
the SDC.
Mr. Yang Yuefeng
Born in 1971, Mr. Yang holds a master’s degree
from Huazhong University of Science and
Technology. Mr. Yang joined Huawei in 1996 and
has served as an engineer in the Hardware Dept,
Director of the Multimedia Product Line, President
of the Fixed Terminal Product Line, Vice President
& CFO of Huawei Device, and member of the
Finance Committee.
Mr. Wu Qinming
Born in 1972, Mr. Wu holds a bachelor’s degree
from Peking University. Mr. Wu joined Huawei
in 1996 and has served as General Manager of
the Router Product Line, General Manager of the
Software Dept at the Beijing Research Center,
Director of the Enterprise Product Line, Deputy
Director of the Marketing Dept of the Optical
Network Product Line, Director of the Strategic
Development Dept, and currently, President of
the Investment Mgmt Dept, Vice President of the
Corporate Development Dept, and member of
the SDC.
Mr. He Gang
Born in 1973, Mr. He holds a master’s degree
from Xidian University. Mr. He joined Huawei in
1998 and has served as a GSM hardware engineer,
President of the GSM Product Line, President of
the GSM&UMTS Product Line, Director of the
Global Wireless Solution Sales Dept, President of
the Handset Product Line of Huawei Device, and
member of the SDC.
Ms. He Tingbo (Teresa He)
Born in 1969, Ms. He holds a master’s degree from
Beijing University of Posts and Telecommunications.
She joined Huawei in 1996 and has since served
as ASIC engineer/senior engineer/chief engineer,
R&D Director of HiSilicon, President of HiSilicon,
Vice President of the 2012 Laboratories, member
of the Human Resources Committee, and member
of the SDC.
Mr. Wang Tao (David Wang)
Born in 1972, Mr. Wang holds a master’s degree
from Xi’an Jiaotong University. Mr. Wang joined
Huawei in 1997 and has served as PDT Manager of
the PS Core Network Product Line, Chief Engineer
in the UMTS Technical Sales Dept, Director
of the Wireless Product Line in the European
Area, Director of the Technical Sales Dept in
the European Area, General Manager of the
subsidiaries in Italy/Switzerland, President of the
Wireless Network Business Dept, and member of
the SDC.
Mr. Song Liuping
Born in 1966, Mr. Song completed his postdoctoral
research at Beijing Institute of Technology. Mr.
Song joined Huawei in 1996 and has served
as Manager of the Product Strategy Planning
Office, Director of the Intellectual Property Rights
Dept, Director of the External Cooperation Dept,
President of the Legal Affairs Dept, Chief Legal
Officer, ST member of Products & Solutions,
AT Deputy Director of the Standard & Patent
Dept under the Research Dept, Chairman of the
Patent Review Board, and member of the Finance
Committee.
97 Corporate Governance Report
Mr. Zhang Xinyu (Bill Zhang)
Born in 1972, Mr. Zhang holds a master’s degree
from Nanjing University. Mr. Zhang joined
Huawei in 1997 and has served as Director of the
Marketing Dept under the Core Network Product
Line, Director of the Marketing Dept in the Asia-
Pacific Region, Vice President of the Northern
Latin America Region, Vice President of the Carrier
Network BG, and member of the SDC.
Mr. Chen Zhaohui (Edward Chen)
Born in 1967, Mr. Chen holds a master’s degree
at China Institute of Atomic Energy in Beijing.
Mr. Chen joined Huawei in 1994 and has served
as General Manager of the UK Representative
Office, President of Huawei Device, Chairman of
the CSR Committee, Vice President of the Business
Process & IT Mgmt Dept, and member of the Audit
Committee.
Mr. Yi Xiang (Steven Yi)
Born in 1975, Mr. Yi holds a bachelor’s degree
from Wuhan University. Mr. Yi joined Huawei in
1998 and has served as Director of the Sales Mgmt
Dept in the Asia-Pacific Area, General Manager of
the Pakistan Representative Office, President of
the Middle East Region, President of the Sales &
Delivery Finance Mgmt Dept, and member of the
Finance Committee.
Mr. Zhou Daiqi
Born in 1947, Mr. Zhou graduated from Xidian
University. Mr. Zhou joined Huawei in 1994 and
has served as an ATM product manager, Chief
Engineer and General Manager at the Multimedia
Dept, Director of the Hardware Dept, Chief of the
Xi’an Research Center, Director of the HR Branch of
Products & Solutions, and currently, Director of the
Corporate Committee of Ethics and Compliance,
and member of the Audit Committee.
Mr. Zheng Yelai (Leif Zheng)
Born in 1973, Mr. Zheng holds a master’s degree
from Northwestern Polytechnical University. Mr.
Zheng joined Huawei in 1999 and has served as
Product Manager of the Wireless Product Line,
OM SPDT Director of the Wireless Product Line,
President of the Wireless OSS&Service Product
Line, President of the IT Product Line, and member
of the SDC.
Mr. Zha Jun
Born in 1971, Mr. Zha holds a master’s degree
from Zhejiang University. Mr. Zha joined Huawei in
1997 and has served as an R&D product manager,
Director of the IMS Product Line, President of
the Router and Network Security Product Line,
President of the Network Product Line, President
of the Fixed Network Business Unit, member of
the Human Resources Committee, and member
of the SDC.
Mr. Hou Jinlong
Born in 1970, Mr. Hou holds a bachelor’s degree
from Shanghai Jiaotong University. Mr. Hou joined
Huawei in 1996 and has served as an R&D project
manager, Director of the Wireless Technical Sales
Dept, Vice President of the Marketing Dept,
Director of the Wireless Marketing Dept, CEO of TD
Tech Ltd., President of the Energy & Infrastructure
Product Line, President of the Network Energy
Product Line, and member of the SDC.
Mr. Yao Fuhai
Born in 1968, Mr. Yao holds a bachelor’s degree
from the University of Electronic Science and
Technology of China. Mr. Yao joined Huawei
in 1997 and has served as Director of the
Pricing Center, Vice President of the Business
Process & IT Mgmt Dept, Vice President of the
Strategy Cooperation Dept, Vice President of
the Global Technical Sales Dept, President of
the Global Technical Service Dept, President of
the Procurement Qualification Mgmt Dept, and
member of the Finance Committee.
98Corporate Governance Report
Mr. Peng Bo (Vincent Peng)
Born in 1976, Mr. Peng holds a bachelor’s degree
from Harbin Institute of Technology. Mr. Peng
joined Huawei in 1999 and has served as an
account manager of the Customer Relationship
Mgmt Dept, an account manager of the Hong
Kong Office, Director of the Vodafone Account
Dept, Vice President of the Western European
Region, President of the Global Sales and Key
Accounts Dept, President of the Global Sales Dept
of the Carrier Network BG, member of the EMT
for the Carrier Network BG, member of the Human
Resources Committee, and member of the SDC.
Mr. Peng Zhongyang
Born in 1968, Mr. Peng holds a bachelor’s
degree from Huazhong University of Science and
Technology. Mr. Peng joined Huawei in 1997 and
has served as a transmission product engineer
in the Technical Service Dept in the South China
Area, Transmission Product Project Manager
and a business expansion engineer at the Russia
Representative Office, Transmission Product Project
Manager at the Yemen Representative Office,
Account Manager at the Yemen Representative
Office, General Manager of the Yemen
Representative Office, President of the North
Africa Region, and President of the China Region.
Mr. Peng Zhijun (Peter Peng)
Born in 1969, Mr. Peng holds a master’s degree
from Shanghai University of Finance and
Economics. Mr. Peng joined Huawei in 1997 and
has served as Director of the Investment Mgmt
Dept, CFO of the Latin America Area, Director of
the Tax Mgmt Dept, Vice President of the Finance
Mgmt Dept, Deputy Director of the Business
Control and Enterprise Risk Mgmt Dept, and
currently, Chief Risk Review Officer, and member
of the Audit Committee.
Mr. Peng Qiu’en (Ted Peng)
Born in 1971, Mr. Peng holds a master’s degree
from Zhongnan University of Economics and Law.
Mr. Peng joined Huawei in 1997 and has served as
Director of the Budget & Cost Mgmt Dept, Director
of the Financial Planning & Analysis Dept, Vice
President of the Sales & Delivery Finance Mgmt
Dept, CFO of the India Region, President of the
Finance Mgmt Dept, and member of the Finance
Committee.
Mr. Hui Chun (Clark Hui)
Born in 1963, Mr. Hui holds a master’s degree from
Huazhong University of Science and Technology.
Mr. Hui joined Huawei in 1989 and has served as
President of the Procurement Qualification Mgmt
Dept, Vice President of Finance & President of
the Business Control Dept, Vice President of the
Business Process & IT Mgmt Dept, and currently,
Director of the Engineering Inspection Dept and
member of the Audit Committee.
Mr. Qiao Nengdong (Joe Qiao)
Born in 1973, Mr. Qiao holds a master’s degree
from Nankai University. Mr. Qiao joined Huawei
in 1998 and has served as Vice President of the
Accounting Mgmt Dept, CFO of the Northern
Africa Region, CFO of the Enterprise BG, and
member of the Finance Committee.
99 Corporate Governance Report
Independent Auditor
An independent auditor is responsible for auditing
a company’s annual financial statements. In
accordance with applicable accounting standards
and audit procedures, the independent auditor
expresses an opinion as to whether the financial
statements are true and fair.
The scope of the financial audit and the annual
audit results are subject to review by the Audit
Committee. Any relationship or service that may
potentially affect the objectivity and independence
of the independent auditor can be discussed with
the Audit Committee. The independent auditor
may discuss any issues identified or any difficulties
encountered during the course of the financial
audits with the Audit Committee.
KPMG has been Huawei’s independent auditor
since 2000.
Business Structure
The company has established three BGs: the Carrier
Network BG, the Enterprise BG, and the Consumer
BG. Each BG is a responsibility center for the end-
to-end operations in a particular customer domain.
BGs are the main driving force behind Huawei’s
operations. Each BG is responsible for ensuring
effective growth and improving efficiency for the
company as well as achieving business objectives
and ensuring customer satisfaction for its business
domain.
Each BG has established an executive management
team (EMT) to manage its operations. The CEO of
each BG is also the head of that BG’s EMT.
The CEO of the Carrier Network BG is Mr. Ding
Yun.
The CEO of the Enterprise BG is Mr. Xu Wenwei.
The CEO of the Consumer BG is Mr. Yu
Chengdong.
Service BGs (SBGs) are responsibility centers that
provide end-to-end support and services for BGs.
SBGs shall continuously increase efficiency and
reduce operating costs. Huawei has established five
SBGs: the 2012 Laboratories, Integrated Business
Services (IBS), Manufacturing, Huawei University,
and Huawei Internal Services. The President
of the 2012 Laboratories is Mr. Li Yingtao; the
President of IBS is Mr. Peng Zhiping; the President
of Manufacturing is Mr. Li Jianguo; the President
of Huawei Internal Services is Mr. Ren Shulu.
The Group Functions provide BGs with support,
services, and supervision. They are positioned
to offer accurate, timely, and effective services
to field offices and strengthen supervision while
delegating sufficient authority to field offices.
Acting as the company’s special commissioner, the
Joint Committee of Regions (JCR), under the Group
Functions, coordinates and monitors authority, and
manages managers on behalf of the Company. The
JCR organizes the development of the company’s
regional strategies worldwide and supervises
their execution. The JCR also manages regional
platform building and organizational operations.
The President of the JCR is Mr. Li Jie.
The Financial Investment Management Platform is
responsible for the profits and losses of financial
investments. This platform oversees finance and
business operations.
Continuous Improvement of Management
Systems
Huawei established global management systems
to promote and pass down our corporate culture
100Corporate Governance Report
while achieving effective business management.
The aim is to:
Advocate customer centricity and further
enable customer success.
Ensure risks are controlled and business
continuity is guaranteed.
Shoulder corporate social responsibilities (CSR)
to promote sustainable social development.
Huawei’s management systems are based on
ISO9001 (an international standard for quality
management systems) and TL9000 (an international
standard for quality management systems of the
telecom industry). Through continuous evolutions,
Huawei has developed the capabilities of making
frequent self-assessments and improvements
to continuously meet the requirements and
expectations of customers and other stakeholders.
We fulfilled the requirements of our management
systems in accordance with our corporate strategy
and strengthened the building of customer-
centric and process-based management systems
to effectively support business development and
continuous improvement. In order to streamline
processes end-to-end, Huawei incorporated
requirements associated with quality, internal
controls, Environment, Health, and Safety (EHS),
cyber security, and CSR into marketing, R&D,
supply chain, procurement, delivery, service, and
other business domains. Huawei also promoted
continuous improvements through quality
measurement in accordance with best practices
of the industry.
To ensure that the products and services we
provide to our customers are effective and
reliable, we had our systems certified by multiple
independent third parties. Additionally, Huawei
obtained certification in ISO9001/TL9000 (quality),
ISO14001 (environment), OHSAS18001 (health
and safety), and ISO27001 (information security).
Huawei also obtained certification in SA8000 (CSR)
in the device domain.
Huawei has also successfully passed the
comprehensive audits, regular assessments, and
stringent reviews conducted by 22 of the world’s
top 50 carriers. The items covered include financial
stability, quality management, delivery, supply
chain management, knowledge management,
project management, information and cyber
security, risk management, EHS, CSR, and business
continuity. We enjoy wide recognition from our
customers in these key domains, as evidenced by
their choice of Huawei as a strategic partner.
Strategy to Execution
Huawei launched its “Develop Strategy to Execute
(DSTE)” closed-loop management system to
gradually shift to the business operating model
in which business planning, budgeting, and
performance appraisal are driven by strategy. This
action aims to ensure that the medium-to-long-
term strategic objectives of the company and
each business unit are taken into account in the
annual plan and budgets, thus helping ensure that
business units are well coordinated. This action also
aims to establish stable and sustainable business
systems and assist the company in achieving its
strategic and business objectives.
During the annual business planning and
budgeting, Huawei utilizes balanced scorecards to
measure its organizational performance. Corporate
strategic objectives are broken down into
organizational performance objectives at all levels.
At Huawei, work reports are conducted level-by-
level, personal business commitments (PBCs) are
managed for employees, and the applications
of organizational and individual performance
results are strengthened. These approaches ensure
101 Corporate Governance Report
that organizational and individual objectives are
aligned with the company’s objectives and that the
company’s strategy is effectively understood and
implemented across the organization.
Management Transformations
In 2012, Huawei made further management
improvements and implemented a variety of
transformation programs to improve customer
satisfaction and internal operational efficiency
and reduce operating risks. These transformations
included:
Customer Relationship Management (CRM)
Transformation: Huawei developed customer-
centric marketing, sales, and service strategies
to ensure that we remain focused on
customer expectations/requirements, improve
efficiency, and reduce costs while creating
maximum value for customers to enable their
success and eventually Huawei’s success.
Huawei developed the Develop and Manage
Customer Relationship Plan, Manage Customer
Expectation and Satisfaction, and Lead to Cash
(LTC) processes, and constructed and deployed
the IT system that supports the LTC process.
Customer Issue Management Transformation:
This transformation aims to ensure that issues
raised by customers are resolved in accordance
with contracts in a timely and effective manner
to protect service continuity and cyber security
of customer equipment and networks. This
initiative also drives the company to improve its
products and management to ensure customer
satisfaction. Through the release and use of the
Issue to Resolution (ITR) process system, issues
raised by customers are handled effectively and
managed in a closed loop.
Continuous Integrated Financial Services (IFS)
Transformation: Huawei is building a global
financial management system to facilitate the
company’s sustainable and profitable growth
through data-based management. To date,
Huawei has nearly finished streamlining
financial and business processes and data
at the transaction level. Currently, Huawei
is developing and enhancing comprehensive
financial capabilities related to operations and
decision making.
Continuous Optimization of the Integrated
Product Development (IPD) Process: Huawei
continues to optimize the structured processes,
heavyweight teams, governance systems, and
IT enablers in the IPD domain to constantly
improve IPD operational efficiency and product
competitiveness. Huawei also develops products
designed for marketing, manufacturing,
procurement, servicing, and other purposes
to boost end-to-end operational efficiency.
Additionally, Huawei is transforming its service
IPD process to meet the requirements of
new industries, a move instrumental to the
development and transformation of the service
industry.
Project Management and Knowledge
Management Transformations: Huawei is
building a management culture focused on
project operations. The aim is to change related
processes, organizations, resource allocation
mechanisms, and appraisal mechanisms so that
projects are treated as independent operating
units. To improve organizational efficiency,
Huawei also deploys a resource buy-and-sell
mechanism that enables project teams to buy
resources from Group Functions. In addition,
Huawei deploys knowledge and document
management, and establishes knowledge
communities to enhance knowledge and
experience sharing, thus improving employees’
efficiency.
102Corporate Governance Report
Organizational Capabilities
Business departments widely adopt the shared
service model to consolidate global resources.
Huawei has established 12 Centers of Expertise
(COEs) and 22 Shared Service Centers (SSCs)
across 13 countries to support the company’s
globalization strategy and operational excellence.
Huawei is operating and improving its COEs and
SSCs in terms of finance, service resource delivery,
and procurement fulfillment worldwide. Huawei
has also established HR, IT, and bidding SSCs to
better provide quality and efficient services for BGs
and regional organizations, enabling them to focus
more on customers. While reasonably allocating
resources around the globe, Huawei created 3,500
jobs in the countries (excluding China) in which the
COEs and SSCs are located, boosting employment
and economic development in local communities.
Establishment of the Internal Control System
Huawei has designed and implemented an
internal control system based on its organizational
structure and operational model. The internal
control framework and its related management
system apply to all business and financial processes
of the company and its subsidiaries and business
units. This internal control system is based on
COSO model, which consists of five components:
Control Environment, Risk Assessment, Control
Activities, Information & Communication, and
Monitoring. The internal control system also
includes internal controls for financial statements
to ensure that the financial statements are true,
complete, and accurate.
Control Environment
A control environment is the foundation for an
internal control system. Huawei is dedicated
to maintaining a corporate culture of integrity,
placing a high value on business ethics, and strictly
complying with laws and regulations. Huawei
has established its BCG to define the company’s
standards for acceptable conduct. Huawei also
provides training programs, requires all employees
to acknowledge their understanding of and
commitment to complying with the BCG, and asks
all employees to sign the BCG on a regular basis.
Huawei has a well-established governance structure
with clear authorizations and accountabilities.
The governance structure is comprised of the
BOD, its committees, Group Functions, and multi-
level administrative teams. Huawei has clearly
defined roles and responsibilities for its teams to
ensure checks and balances. The CFO of Huawei
is in charge of internal control management.
The Business Control Dept identifies areas for
improvement and reports improvements made in
terms of internal controls to the CFO and assists the
CFO in building the internal control environment.
The Internal Audit Dept independently monitors
and assesses the effectiveness of internal controls
for all operational activities.
Risk Assessment
Huawei has established a dedicated risk
management department to regularly assess
risks related to all business processes around
the globe. This department identifies, manages,
and monitors the significant risks, forecasts
potential risks caused by changes in both the
internal and external environments, and submits
risk management strategies along with mitigating
measures for decision making.
All process owners are responsible for identifying,
assessing, and managing different types of
risks and related internal control measures. The
assessment factors include the likelihood of
negative events and potential impact.
103 Corporate Governance Report
Control Activities
Huawei has established the Global Process
Management System (GPMS) and the Business
Transformation Management System (BTMS),
released the global Business Process Architecture
(BPA), and appointed Global Process Owners
(GPOs) based on the BPA. As the role responsible
for process and internal control building, GPOs
identify Key Control Points (KCPs) and the
Separation of Duties Matrix for each process and
apply them to all regions, subsidiaries, and business
units. GPOs organize monthly compliance tests on
the KCPs to continuously monitor the effectiveness
of internal controls and publish test reports. GPOs
optimize processes and internal controls based
on business pain points to improve operational
efficiency and help achieve business objectives.
In addition, GPOs perform SACAs to assess the
effectiveness of the overall process design and
executional effectiveness of each business unit and
then report the results to the Audit Committee.
Information & Communication
The company has established information
and communication channels to ensure timely
acquisition of information related to customers
and suppliers, as well as other information. Huawei
has established an online forum that provides a
channel for employees to communicate with each
other.
Corporate management holds regular meetings
with departments at all levels to help them with
operational issues and ensure that management
decisions are effectively implemented. All
business policies and processes are available on
the company’s intranet. Managers and process
owners regularly organize training programs on
business processes and internal controls to ensure
that all the up-to-date information is available
to all employees. The company has established
a mechanism for process owners at all levels to
regularly communicate with one another, review
the executional effectiveness of internal controls,
and follow up on resolving internal control issues.
Monitoring
The company has established an internal complaint
channel, an investigation mechanism, and an
accountability system. We have clearly defined
guidelines in the Agreement on Honesty and
Integrity, which stipulates that, suppliers can
report any improper conduct concerning Huawei
employees through the channels provided in the
agreement.
The Internal Audit Dept independently assesses
the internal control effectiveness of the company
and investigates any suspected violations of the
BCG. The Internal Audit Dept reports the audit and
investigation results to the Audit Committee and
senior management.
Huawei has established an internal control
appraisal and accountability system for GPOs and
regional managers. The Audit Committee regularly
reviews the internal control effectiveness of the
company and considers reports on action plans
for internal controls and the progress of plan
execution. The Audit Committee has the right
to request that the GPOs or top management
of each business unit provide explanations for
identified internal control issues and, if necessary,
take corrective actions. The Audit Committee may
also suggest that the Human Resources Committee
take disciplinary action when necessary.
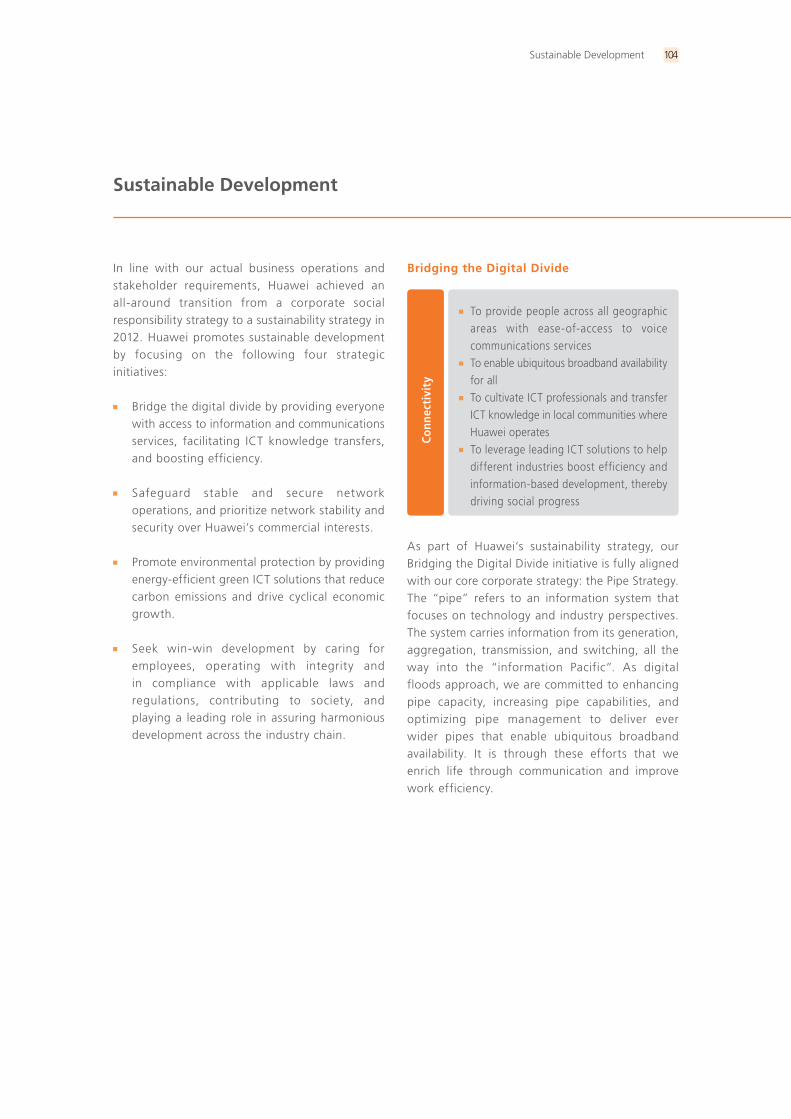
Sustainable Development
Sustainable Development 104
In line with our actual business operations and stakeholder requirements, Huawei achieved an all-around transition from a corporate social responsibility strategy to a sustainability strategy in 2012. Huawei promotes sustainable development by focusing on the following four strategic initiatives:
Bridge the digital divide by providing everyone with access to information and communications services, facilitating ICT knowledge transfers, and boosting efficiency.
Safeguard stable and secure network operations, and prioritize network stability and security over Huawei’s commercial interests.
Promote environmental protection by providing energy-efficient green ICT solutions that reduce carbon emissions and drive cyclical economic growth.
Seek win-win development by caring for employees, operating with integrity and in compliance with applicable laws and regulations, contributing to society, and playing a leading role in assuring harmonious development across the industry chain.
Bridging the Digital Divide
Conn
ecti
vity
To provide people across all geographic areas with ease-of-access to voice communications services
To enable ubiquitous broadband availability for all
To cultivate ICT professionals and transfer ICT knowledge in local communities where Huawei operates
To leverage leading ICT solutions to help different industries boost efficiency and information-based development, thereby driving social progress
As part of Huawei’s sustainability strategy, our Bridging the Digital Divide initiative is fully aligned with our core corporate strategy: the Pipe Strategy. The “pipe” refers to an information system that focuses on technology and industry perspectives. The system carries information from its generation, aggregation, transmission, and switching, all the way into the “information Pacific”. As digital floods approach, we are committed to enhancing pipe capacity, increasing pipe capabilities, and optimizing pipe management to deliver ever wider pipes that enable ubiquitous broadband availability. It is through these efforts that we enrich life through communication and improve work efficiency.

Sustainable Development105
Case: Huawei’s 2T WDM prototype supports voice
calls for two billion people at the same time.
In July 2012, Huawei launched the world’s first
2T Wavelength Division Multiplexing (WDM)
prototype with a capacity as high as 56 Tbit/s.
Compared to the 100 Gbit/s per channel data rate
offered by industry peers’ commercial systems, our
prototype increases the rate by twenty-fold to 2
Tbit/s and expands the fiber capacity to 56 Tbit/s,
which means it is possible for two billion people
to communicate simultaneously through just one
pair of fibers.
Case: Huawei connects the blue planet using
100G WDM networks with a total length
longer than the circumference of the Earth.
As of September 2012, Huawei deployed top-
of-the-class 100G networks for more than 40
customers in over 30 countries and regions,
including Europe, the Middle East, Latin America,
and the Asia Pacific. Spanning over 50,000
kilometers – longer than the circumference of the
Earth – these 100G networks connect people at
high speeds.
Paris Berlin
London
Istanbul
Moscow
Case: Telecom Seeds for the Future Program
As a key Huawei ICT talent development project, the Telecom Seeds for the Future Program aims to cultivate ICT talent for local communities, transfer knowledge, develop people’s understanding of and interest in the telecom industry, and encourage local countries and regions to play a part in building digital communities. To date, the program has granted scholarships to thousands of students from 50 universities across 14 countries.
Case: Huawei’s education cloud solution ensures balanced development in education in urban and rural areas under the jurisdiction of Guangzhou City.
Huawei’s education cloud solution provides an education cloud platform for the Guangzhou Bureau of Education, enabling educational resource sharing among all schools across the city. After connecting to the metropolitan area network (MAN) of Guangzhou Digital Education
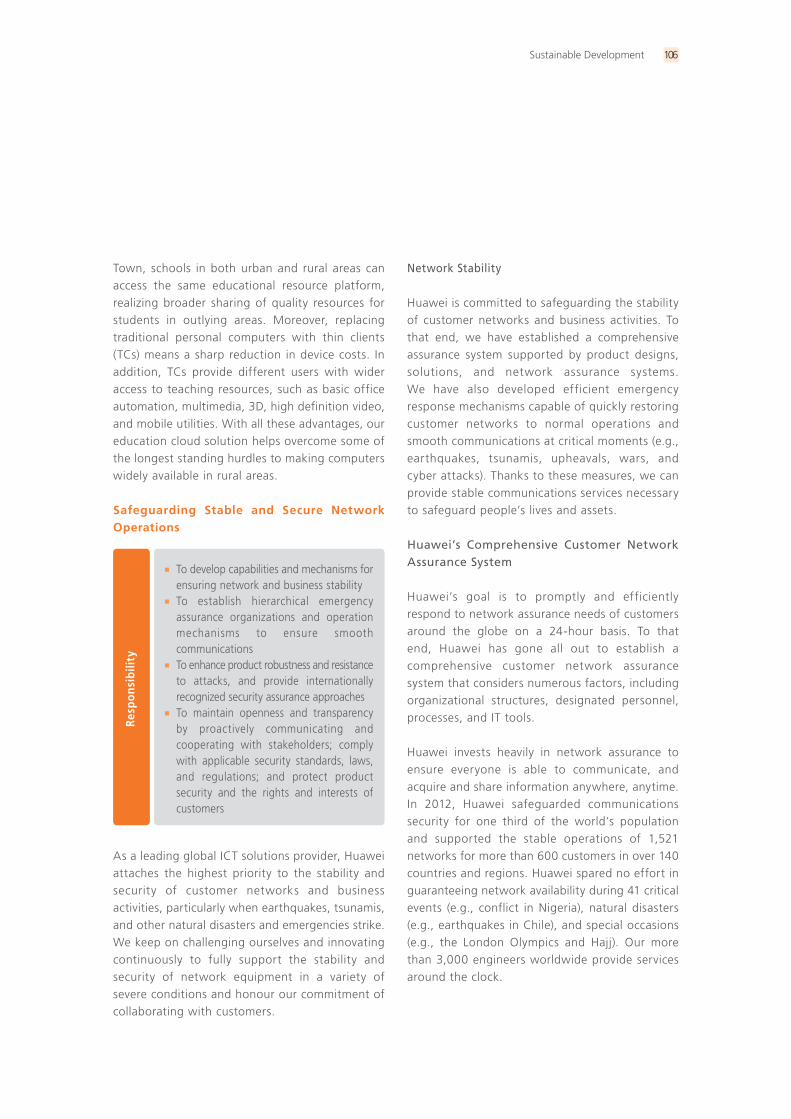
Sustainable Development 106
Town, schools in both urban and rural areas can access the same educational resource platform, realizing broader sharing of quality resources for students in outlying areas. Moreover, replacing traditional personal computers with thin clients (TCs) means a sharp reduction in device costs. In addition, TCs provide different users with wider access to teaching resources, such as basic office automation, multimedia, 3D, high definition video, and mobile utilities. With all these advantages, our education cloud solution helps overcome some of the longest standing hurdles to making computers widely available in rural areas.
Safeguarding Stable and Secure Network Operations
Resp
onsi
bilit
y
To develop capabilities and mechanisms for ensuring network and business stability
To establish hierarchical emergency assurance organizations and operation mechanisms to ensure smooth communications
To enhance product robustness and resistance to attacks, and provide internationally recognized security assurance approaches
To maintain openness and transparency by proactively communicating and cooperating with stakeholders; comply with applicable security standards, laws, and regulations; and protect product security and the rights and interests of customers
As a leading global ICT solutions provider, Huawei attaches the highest priority to the stability and security of customer networks and business activities, particularly when earthquakes, tsunamis, and other natural disasters and emergencies strike. We keep on challenging ourselves and innovating continuously to fully support the stability and security of network equipment in a variety of severe conditions and honour our commitment of collaborating with customers.
Network Stability
Huawei is committed to safeguarding the stability of customer networks and business activities. To that end, we have established a comprehensive assurance system supported by product designs, solutions, and network assurance systems. We have also developed efficient emergency response mechanisms capable of quickly restoring customer networks to normal operations and smooth communications at critical moments (e.g., earthquakes, tsunamis, upheavals, wars, and cyber attacks). Thanks to these measures, we can provide stable communications services necessary to safeguard people’s lives and assets.
Huawei’s Comprehensive Customer Network Assurance System
Huawei’s goal is to promptly and efficiently respond to network assurance needs of customers around the globe on a 24-hour basis. To that end, Huawei has gone all out to establish a comprehensive customer network assurance system that considers numerous factors, including organizational structures, designated personnel, processes, and IT tools.
Huawei invests heavily in network assurance to ensure everyone is able to communicate, and acquire and share information anywhere, anytime. In 2012, Huawei safeguarded communications security for one third of the world’s population and supported the stable operations of 1,521 networks for more than 600 customers in over 140 countries and regions. Huawei spared no effort in guaranteeing network availability during 41 critical events (e.g., conflict in Nigeria), natural disasters (e.g., earthquakes in Chile), and special occasions (e.g., the London Olympics and Hajj). Our more than 3,000 engineers worldwide provide services around the clock.
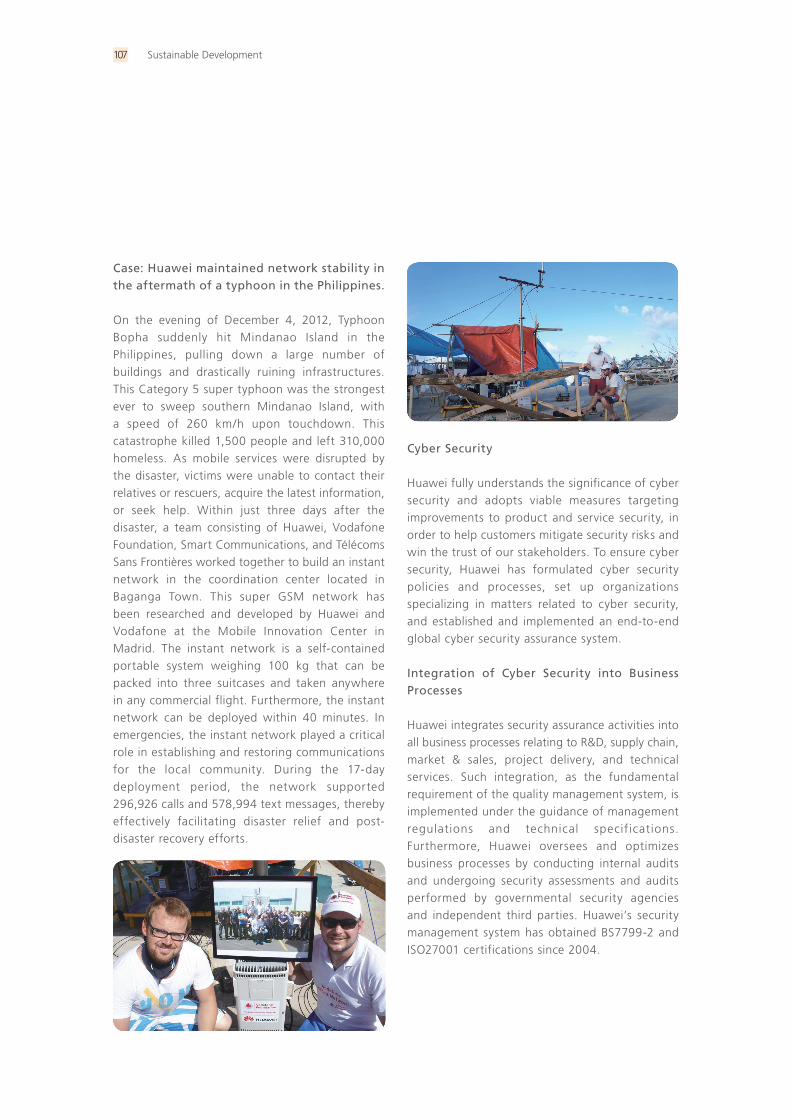
Sustainable Development107
Case: Huawei maintained network stability in the aftermath of a typhoon in the Philippines.
On the evening of December 4, 2012, Typhoon Bopha suddenly hit Mindanao Island in the Philippines, pulling down a large number of buildings and drastically ruining infrastructures. This Category 5 super typhoon was the strongest ever to sweep southern Mindanao Island, with a speed of 260 km/h upon touchdown. This catastrophe killed 1,500 people and left 310,000 homeless. As mobile services were disrupted by the disaster, victims were unable to contact their relatives or rescuers, acquire the latest information, or seek help. Within just three days after the disaster, a team consisting of Huawei, Vodafone Foundation, Smart Communications, and Télécoms Sans Frontières worked together to build an instant network in the coordination center located in Baganga Town. This super GSM network has been researched and developed by Huawei and Vodafone at the Mobile Innovation Center in Madrid. The instant network is a self-contained portable system weighing 100 kg that can be packed into three suitcases and taken anywhere in any commercial flight. Furthermore, the instant network can be deployed within 40 minutes. In emergencies, the instant network played a critical role in establishing and restoring communications for the local community. During the 17-day deployment period, the network supported 296,926 calls and 578,994 text messages, thereby effectively facilitating disaster relief and post-disaster recovery efforts.
Cyber Security
Huawei fully understands the significance of cyber security and adopts viable measures targeting improvements to product and service security, in order to help customers mitigate security risks and win the trust of our stakeholders. To ensure cyber security, Huawei has formulated cyber security policies and processes, set up organizations specializing in matters related to cyber security, and established and implemented an end-to-end global cyber security assurance system.
Integration of Cyber Security into Business Processes
Huawei integrates security assurance activities into all business processes relating to R&D, supply chain, market & sales, project delivery, and technical services. Such integration, as the fundamental requirement of the quality management system, is implemented under the guidance of management regulations and technical specifications. Furthermore, Huawei oversees and optimizes business processes by conducting internal audits and undergoing security assessments and audits performed by governmental security agencies and independent third parties. Huawei’s security management system has obtained BS7799-2 and ISO27001 certifications since 2004.
Sustainable Development 108
Huawei’s Global Cyber Security Platform for Information Sharing and Mutual Assistance
As a global company, Huawei is committed to cooperating closely with stakeholders and building a platform for sharing and mutual assistance. Based on this platform, Huawei pursues continuous innovations and sets standards together with industry peers. In so doing, we ensure that the integrity and security of our network solutions and services reach or exceed customer needs, and help customers build confidence in serving their own clients.
Huawei continuously plays an active role in setting security standards in conjunction with the ITU Telecommunication Standardization Sector (ITU-T), the 3rd Generation Partnership Project (3GPP), the Internet Engineering Task Force (IETF), and other international telecom standards organizations. Huawei has joined security organizations, such as the Forum for Incident Response and Security Teams (FIRST), in addition to collaborating with mainstream security companies. Through these initiatives, we aim to contribute to a more robust industry and effectively ensure cyber security for our customers worldwide.
Promoting Environmental Protection
Gre
en
To prioritize environmental protection requirements during production, service, and business activities
To minimize negative environmental impacts throughout product lifecycles
To drive low-carbon and cyclical economic growth
To push forward green initiatives with partners, and increase positive influence on the industry chain
Huawei prioritizes environmental protection requirements during production, service, and business activities. In this regard, we integrate carbon reduction and environmental protection ideas into products lifecycles and continuously innovate technologies to boost the energy efficiency of our products and solutions. As part of our drive to reduce waste and greenhouse gas emissions, we continue to improve resource utilization in our operations. While adopting green initiatives on our own, we assist other industries in transitioning into a low-carbon economy. We aim to fuel social sustainability and achieve the goals of “Green Communications”, “Green Huawei”, and “Green World”.
Green Communications
Huawei is committed to providing leading green
ICT solutions.
Green Huawei
Huawei promotes energy conversation, emission reduction,
and clean production initiatives.
Green World
Huawei contributes to a green world.
Case: Huawei’s high-efficiency power supply equipment facilitated China Telecom’s Hubei Branch in upgrading power supply.
Huawei’s Network Energy Product Line provided China Telecom Hubei Branch with a solution of TP-series high-efficiency switching power supply equipment for its subsidiary sites in Wuhan, Huangshi, Jingzhou, and Yichang in Hubei Province. This marks the first occasion the Hubei Branch has adopted new-generation high-efficiency power supply systems on such a large scale. This event also marks the beginning of the widespread application of high-efficiency power supply products in China. As a result, Huawei’s energy-saving solution helped the customer reduce equipment energy consumption by as much as 60%.
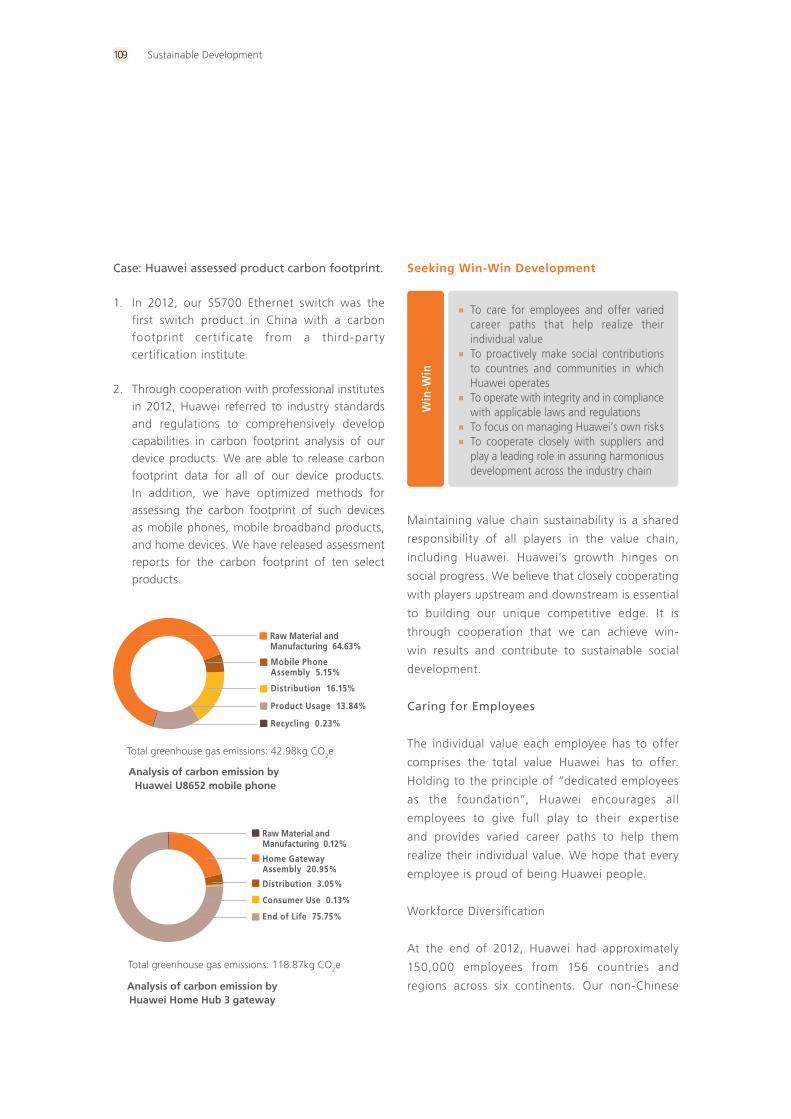
Sustainable Development109
Case: Huawei assessed product carbon footprint.
1. In 2012, our S5700 Ethernet switch was the first switch product in China with a carbon footprint certificate from a third-party certification institute.
2. Through cooperation with professional institutes in 2012, Huawei referred to industry standards and regulations to comprehensively develop capabilities in carbon footprint analysis of our device products. We are able to release carbon footprint data for all of our device products. In addition, we have optimized methods for assessing the carbon footprint of such devices as mobile phones, mobile broadband products, and home devices. We have released assessment reports for the carbon footprint of ten select products.
Total greenhouse gas emissions: 42.98kg CO2e
Raw Material and Manufacturing 64.63%
Mobile Phone Assembly 5.15%
Distribution 16.15%
Product Usage 13.84%
Recycling 0.23%
Analysis of carbon emission by Huawei Home Hub 3 gateway
Total greenhouse gas emissions: 118.87kg CO2e
Home Gateway Assembly 20.95%
Distribution 3.05%
Consumer Use 0.13%
End of Life 75.75%
Raw Material and Manufacturing 0.12%
Seeking Win-Win Development
Win
-Win
To care for employees and offer varied career paths that help realize their individual value
To proactively make social contributions to countries and communities in which Huawei operates
To operate with integrity and in compliance with applicable laws and regulations
To focus on managing Huawei’s own risks To cooperate closely with suppliers and
play a leading role in assuring harmonious development across the industry chain
Maintaining value chain sustainability is a shared
responsibility of all players in the value chain,
including Huawei. Huawei’s growth hinges on
social progress. We believe that closely cooperating
with players upstream and downstream is essential
to building our unique competitive edge. It is
through cooperation that we can achieve win-
win results and contribute to sustainable social
development.
Caring for Employees
The individual value each employee has to offer
comprises the total value Huawei has to offer.
Holding to the principle of “dedicated employees
as the foundation”, Huawei encourages all
employees to give full play to their expertise
and provides varied career paths to help them
realize their individual value. We hope that every
employee is proud of being Huawei people.
Workforce Diversification
At the end of 2012, Huawei had approximately
150,000 employees from 156 countries and
regions across six continents. Our non-Chinese

Sustainable Development 110
R&D 45.36%
Sales 10.51%
Delivery and Service 22.81%
Others 13.40%
Manufacturing and Supply Chain 7.76%
Strategy Marketing 0.16%
Workforce Allocations to Each Operational Area
employees numbered approximately 30,000, which
have increased each year from 2010 to 2012. On
China’s mainland, as many as 4,000 employees
represent 36 out of China’s 56 minority ethnic
groups. Our diversification strategy brings together
a diversified workforce, inclusive of all ethnicities,
languages, and belief systems.
Employee Benefits Worldwide
Huawei has established a comprehensive employee benefits system. In addition to providing mandatory insurance, Huawei offers a series of commercial insurance plans for employees, including personal accident insurance, critical illness insurance, life insurance, medical insurance, and business travel insurance.
Investment in global employee benefits in 2012: CNY5.81 billion
Case: Huawei helped ease employee stress.
Huawei treats employees as our most valuable assets and strives to help them achieve a work-life balance. To that end, Huawei utilizes a variety of means to ease the stress of employees. For example, Huawei organized several self-check activities to measure stress, attracting approximately 70,000 participants as of the end of December 2012. While promoting these activities, we handed out brochures with useful physical and mental tips, inspiring employees to take care of themselves and others. We also encouraged employees to carry out our “3+1” campaign (make a friend, join in a sports activity, take up a hobby, and read a thought-provoking book), which proved good for their physical and mental health.
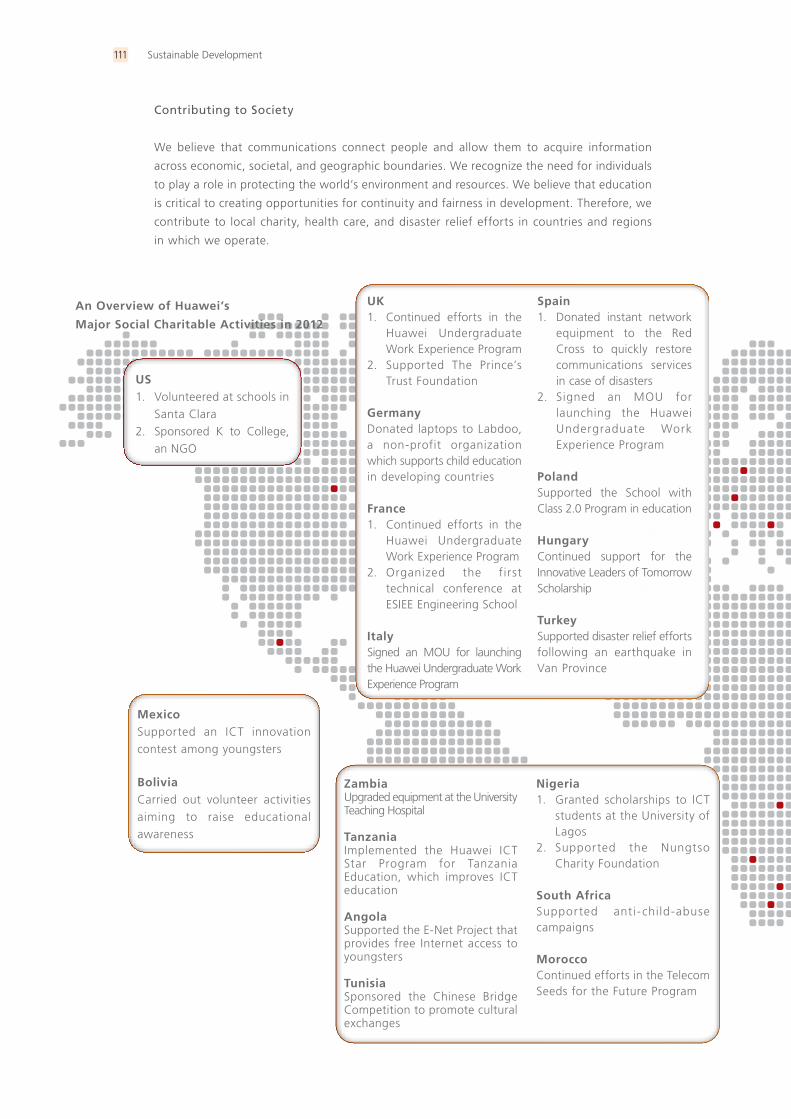
Sustainable Development111
An Overview of Huawei’s
Major Social Charitable Activities in 2012
US1. Volunteered at schools in
Santa Clara2. Sponsored K to College,
an NGO
UK1. Continued efforts in the
Huawei Undergraduate Work Experience Program
2. Supported The Prince’s Trust Foundation
GermanyDonated laptops to Labdoo, a non-profit organization which supports child education in developing countries
France1. Continued efforts in the
Huawei Undergraduate Work Experience Program
2. Organized the first technical conference at ESIEE Engineering School
ItalySigned an MOU for launching the Huawei Undergraduate Work Experience Program
Spain1. Donated instant network
equipment to the Red Cross to quickly restore communications services in case of disasters
2. Signed an MOU for launching the Huawei Undergraduate Work Experience Program
PolandSupported the School with Class 2.0 Program in education
HungaryContinued support for the Innovative Leaders of Tomorrow Scholarship
TurkeySupported disaster relief efforts following an earthquake in Van Province
MexicoSupported an ICT innovation contest among youngsters
BoliviaCarried out volunteer activities aiming to raise educational awareness
ZambiaUpgraded equipment at the University Teaching Hospital
TanzaniaImplemented the Huawei ICT Star Program for Tanzania Education, which improves ICT education
AngolaSupported the E-Net Project that provides free Internet access to youngsters
TunisiaSponsored the Chinese Bridge Competition to promote cultural exchanges
Nigeria1. Granted scholarships to ICT
students at the University of Lagos
2. Supported the Nungtso Charity Foundation
South AfricaSupported anti-child-abuse campaigns
MoroccoContinued efforts in the Telecom Seeds for the Future Program
Contributing to Society
We believe that communications connect people and allow them to acquire information
across economic, societal, and geographic boundaries. We recognize the need for individuals
to play a role in protecting the world’s environment and resources. We believe that education
is critical to creating opportunities for continuity and fairness in development. Therefore, we
contribute to local charity, health care, and disaster relief efforts in countries and regions
in which we operate.
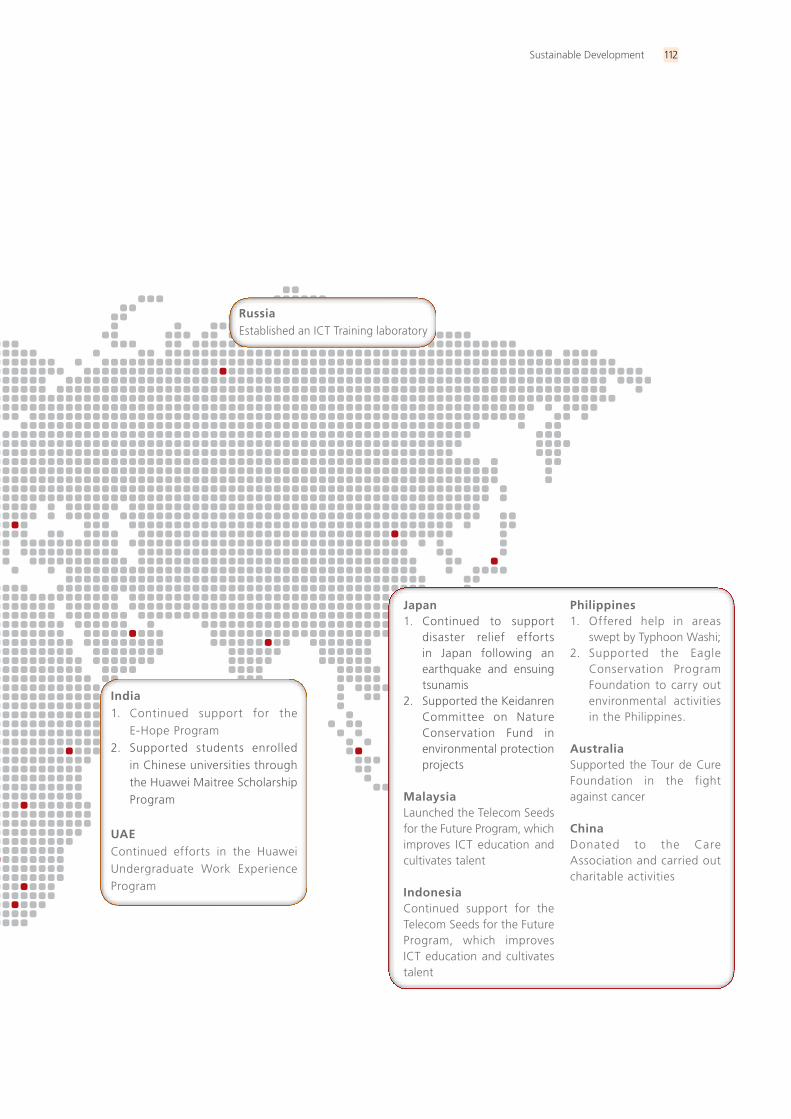
Sustainable Development 112
RussiaEstablished an ICT Training laboratory
India1. Continued support for the
E-Hope Program2. Supported students enrolled
in Chinese universities through the Huawei Maitree Scholarship Program
UAEContinued efforts in the Huawei Undergraduate Work Experience Program
Japan1. Continued to support
disaster relief efforts in Japan following an earthquake and ensuing tsunamis
2. Supported the Keidanren Committee on Nature Conservation Fund in environmental protection projects
MalaysiaLaunched the Telecom Seeds for the Future Program, which improves ICT education and cultivates talent
IndonesiaContinued support for the Telecom Seeds for the Future Program, which improves ICT education and cultivates talent
Philippines1. Offered help in areas
swept by Typhoon Washi;2. Supported the Eagle
Conservation Program Foundation to carry out environmental activities in the Philippines.
AustraliaSupported the Tour de Cure Foundation in the fight against cancer
ChinaDonated to the Care Association and carried out charitable activities
Sustainable Development113
Operations in Compliance with Applicable Laws and Regulations
Huawei abides by ethical business practices, conforms to international conventions as well as laws of local countries, and operates with integrity. We adhere to the Huawei Business Conduct Guidelines, implement “transparent procurement” and “transparent sales”, and oppose bribery and corruption. In addition, we advocate fair competition and obey antidumping and antitrust laws and regulations defined by local countries, thereby creating a harmonious business ecosystem.
We have incorporated compliance management into every business scenario. Our Legal Affairs Dept provides legal guidance in export control, cyber security, trade competition, human resource management, and anti-bribery and anti-corruption tasks. The department also identifies, assesses, and warns internal and external legal risks, and assists other business departments in ensuring legal compliance during operations. To mitigate risks related to intellectual property rights (IPR), the department protects our own IPR while respecting the rights of other intellectual property holders and ensures that Huawei complies with international IPR regulations.
Export Control
Huawei strictly abides by all applicable export control laws and regulations enforced by Chinese and international authorities. We effectively fulfill our export control responsibilities and obligations, and prioritize these obligations over Huawei’s commercial interests.
To better honour our commitment to trade compliance, Huawei has set up the Trade Compliance & Customs Compliance Committee and the Trade Compliance Office led by the Chief Legal Affairs Officer. These organizations approve and oversee the implementation of Huawei’s trade compliance policies and ensure legal compliance to the greatest extent possible in terms of policies, organizations, and processes. Regarding projects involving export control, we have established a standard export control process in which we carry out many export control measures, including customer reviews, checks on ultimate purposes, and investigations into risky factors. Through these measures, we ensure our Internal Control Program (ICP) is effectively implemented across the company.
Huawei’s Trade Compliance Office
The Trade Compliance Office is tasked with formulating and revising Huawei’s export control policies; establishing the standard operations procedures for export control; archiving documents and information concerning export control; carrying out publicity and training activities regarding export control regulations and systems; performing internal and external audits; and supervising and guiding other business departments to meet export control requirements in their business activities.
Focus on Managing Huawei’s Own Risks
Huawei has established a sustainability management system to manage sustainability risks in a more standard way. Through systematic assessments
Sustainable Development 114
and by studying stakeholder concerns, we have identified several types of sustainability risks and developed appropriate control measures. For example, Huawei has always attached great importance to employee health and safety management. With increasing investments in employee health and safety, we develop processes and guides and adopt improved measures to prevent safety incidents. We also spare no efforts to provide secure products to customers and consumers. Centered on customer needs, we remain committed to providing quality products and services while lowering operating costs. In addition, we insist on ensuring that product and service sustainability is integrated into every routine task across the company, thereby protecting consumer rights and improving customer satisfaction.
Case: Prevention of Electromagnetic Radiation.
Huawei has many R&D departments and professional laboratories engaged in researching, testing, and assessing electromagnetic radiation technologies for a variety of products, such as mobile phones, data cards, tablets, fixed stations, wireless access points (APs), wireless routers, and wireless base stations. These departments partner with product security certification organizations in key countries and regions around the world to ensure that our products meet all laws and regulations related to health and safety in each locale.
1. We developed the first LTE TDD mobile phone of the industry, for which testing standards are not in place yet. To gain market entry
for this product, we communicated with supervisory agencies in the US, namely, the Federal Communications Commission (FCC) and the Telecommunication Certification Body (TCB). After multiple rounds of rigorous reviews, we were granted FCC certification, thereby signifying a product entry permission issued by the country with the most stringent electromagnetic radiation controls in the world.
2. With its power-reducing technology for hot spots, our LTE TDD mobile phone can automatically adjust the radiant power of its Wi-Fi transmitter or 3G transmitter based on application scenarios. This feature allows this mobile phone to meet the FCC’s multiple legal requirements on usage of a mobile phone as a wireless router.
3. The wireless APs, wireless routers, and other equipment we launched for the enterprise market were tested in the most severe conditions to measure the electromagnetic radiation emitted by the built-in Wi-Fi transmitters. The testing results verified that the electromagnetic radiation emitted by such devices is well within safe ranges provided the equipment is used as intended.
4. We developed a hearing-aid compatibility (HAC) assessment mechanism for devices used by those with hearing impediments. With this mechanism, users can safely and conveniently use mobile phones.
Sustainable Development115
Supply Chain Management
We believe that the success of a supplier will benefit the supplier itself, Huawei, and Huawei’s customers. Therefore, apart from managing our own sustainability and proactively fulfilling our social responsibilities, we require our suppliers to incorporate a comprehensive sustainability strategy into their core operations and routine business activities. This requirement is essential to ensuring supply chain sustainability, establishing Huawei as a role model in supply chain sustainability, and building up the confidence of customers around the globe.
The United Nations Global Compact China Network granted the “2012 CSR Best Practice” award to Huawei in recognition of our management initiatives in supply chain sustainability.
Supplier Localization
As a global company, Huawei gives preference to suppliers from the local communities in which we operate. Our choice aims to support local companies in the supply chain and contribute to local social-economic and environmental development.
Proportions of suppliers in key regions in 2012
North America 8.71%
China (including Hong Kong, Macao, and Taiwan) 13.77%
Asia 26.06%Europe 22.62%
Africa 13.33%
South America 12.74%Oceania 1.14%
Other regions 1.63%
Case: 2012 Huawei Global Supplier Sustainability Conference
On October 18, 2012, Huawei hosted the 2012 Global Supplier Sustainability Conference, which attracted more than 360 attendees, including international CSR experts, NGO members, and representatives from 170 suppliers and five carrier customers (British Telecom, Deutsche Telekom, Vodafone, France Telecom, and China Mobile).
The conference was themed “Climate Change: Important for Us and for Future Generations”. Topics included cyclical economies, energy efficiency, innovative solutions, and other sustainability-related items.
For details, please see Huawei 2012 Corporate
Sustainability Report.

Abbreviations, Financial Terminology, and Exchange Rates
116Abbreviations, Financial Terminology, and Exchange Rates
Abbreviations
Abbreviations Full name
ATIS The Alliance for Telecommunications Industry Solutions
ATM Asynchronous Transfer Mode
BG Business Group
BNG Broadband Network Gateway
BP Business Plan
BPO Business Process Owner
BSS Business Support System
BYOD Bring Your Own Device
CAGR Compound Annual Growth Rate
CDMA Code Division Multiple Access
CRM Customer Relationship Management
CSR Corporate Social Responsibility
DSL Digital Subscriber Line
DSTE Development Strategy to Execution
DWDM Dense Wavelength Division Multiplexing
EHS Environment, Health and Safety
EMT Executive Management Team
EPC Evolved Packet Core
ETSI European Telecommunications Standards Institute
FBB Fixed Broadband
FMC Fixed Mobile Convergence
FTTH Fiber To The Home
GPS Global Position System
GSM Global System for Mobile communications
HSPA High-Speed Packet Access
IAS International Accounting Standards
IASB International Accounting Standards Board
ICP Internal Control Program
ICT Information and Communications Technology
IDC Internet Data Center
IEEE Institute of Electrical and Electronics Engineers
IFRS International Financial Reporting Standard
IFS Integrated Financial Services
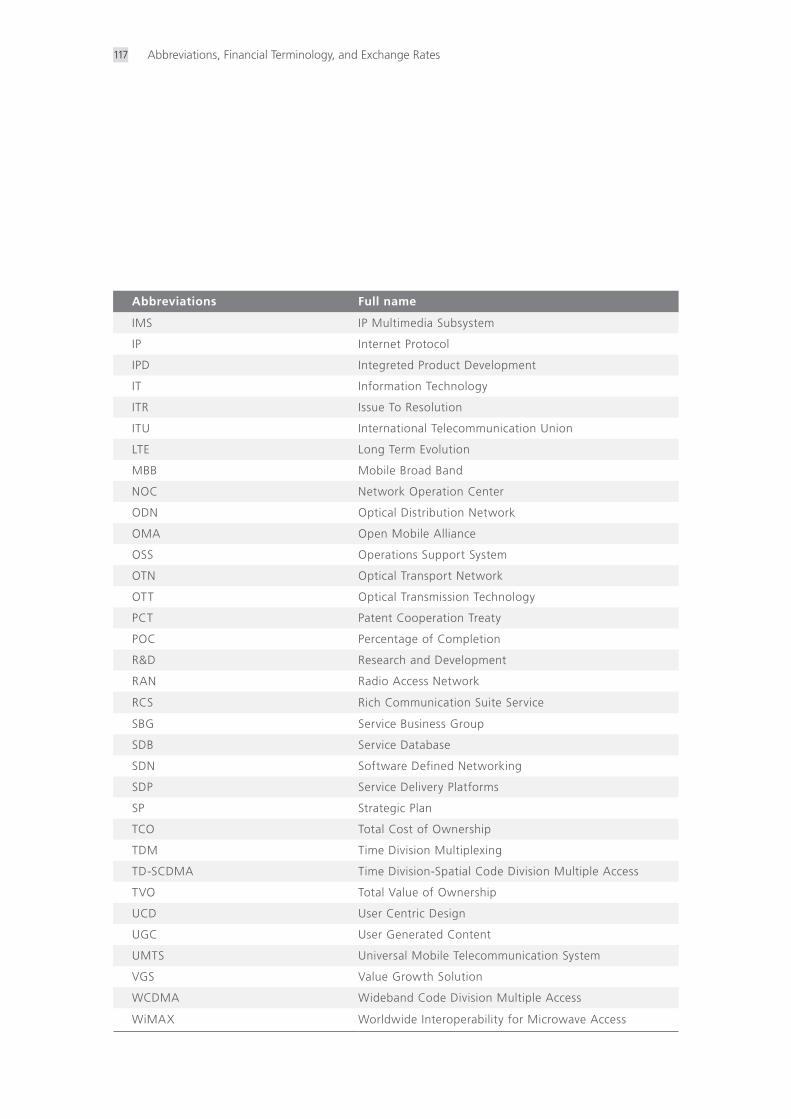
117 Abbreviations, Financial Terminology, and Exchange Rates
Abbreviations Full name
IMS IP Multimedia Subsystem
IP Internet Protocol
IPD Integreted Product Development
IT Information Technology
ITR Issue To Resolution
ITU International Telecommunication Union
LTE Long Term Evolution
MBB Mobile Broad Band
NOC Network Operation Center
ODN Optical Distribution Network
OMA Open Mobile Alliance
OSS Operations Support System
OTN Optical Transport Network
OTT Optical Transmission Technology
PCT Patent Cooperation Treaty
POC Percentage of Completion
R&D Research and Development
RAN Radio Access Network
RCS Rich Communication Suite Service
SBG Service Business Group
SDB Service Database
SDN Software Defined Networking
SDP Service Delivery Platforms
SP Strategic Plan
TCO Total Cost of Ownership
TDM Time Division Multiplexing
TD-SCDMA Time Division-Spatial Code Division Multiple Access
TVO Total Value of Ownership
UCD User Centric Design
UGC User Generated Content
UMTS Universal Mobile Telecommunication System
VGS Value Growth Solution
WCDMA Wideband Code Division Multiple Access
WiMAX Worldwide Interoperability for Microwave Access
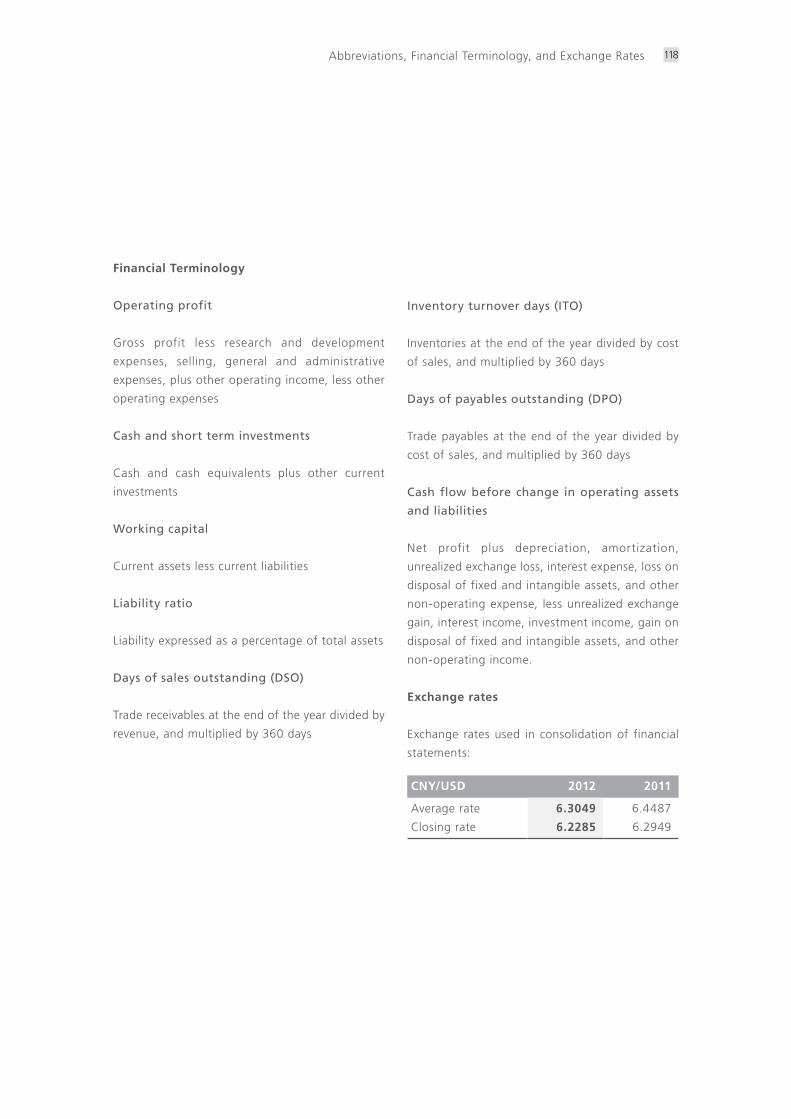
118Abbreviations, Financial Terminology, and Exchange Rates
Financial Terminology
Operating profit
Gross profit less research and development
expenses, selling, general and administrative
expenses, plus other operating income, less other
operating expenses
Cash and short term investments
Cash and cash equivalents plus other current
investments
Working capital
Current assets less current liabilities
Liability ratio
Liability expressed as a percentage of total assets
Days of sales outstanding (DSO)
Trade receivables at the end of the year divided by
revenue, and multiplied by 360 days
Inventory turnover days (ITO)
Inventories at the end of the year divided by cost
of sales, and multiplied by 360 days
Days of payables outstanding (DPO)
Trade payables at the end of the year divided by
cost of sales, and multiplied by 360 days
Cash flow before change in operating assets
and liabilities
Net profit plus depreciation, amortization,
unrealized exchange loss, interest expense, loss on
disposal of fixed and intangible assets, and other
non-operating expense, less unrealized exchange
gain, interest income, investment income, gain on
disposal of fixed and intangible assets, and other
non-operating income.
Exchange rates
Exchange rates used in consolidation of financial
statements:
CNY/USD 2012 2011
Average rate 6.3049 6.4487
Closing rate 6.2285 6.2949

Copyright © 2013 HUAWEI INVESTMENT & HOLDING CO., LTD. All Rights Reserved.
100%
GENERAL DISCLAIMER
Printed on environmentally friendly paper.
post-consumer content, acid-free & chlorine free paper.
THE INFORMATION IN THIS DOCUMENT MAY CONTAIN PREDICTIVE STATEMENTS INCLUDING, WITHOUT LIMITATION,
STATEMENTS REGARDING THE FUTURE FINANCIAL AND OPERATING RESULTS, FUTURE PRODUCT PORTFOLIO, NEW
TECHNOLOGY, ETC. THERE ARE A NUMBER OF FACTORS THAT COULD CAUSE ACTUAL RESULTS AND DEVELOPMENTS
TO DIFFER MATERIALLY FROM THOSE EXPRESSED OR IMPLIED IN THE PREDICTIVE STATEMENTS. THEREFORE, SUCH
INFORMATION IS PROVIDED FOR REFERENCE PURPOSE ONLY AND CONSTITUTES NEITHER AN OFFER NOR AN
ACCEPTANCE. HUAWEI MAY CHANGE THE INFORMATION AT ANY TIME WITHOUT NOTICE.
HU
AW
EI INV
ESTMEN
T & H
OLD
ING
CO
., LTD.
AN
NU
AL REPO
RT 2012
Huawei Investment & Holding Co., Ltd.
2012 Annual Report