Howard Weil Conference Presentation
18
1 I HOWARD WEIL CONFERENCE 3/24/2015 HOWARD WEIL CONFERENCE March 24 th , 2015
-
Upload
chesapeake-energy-corporation -
Category
Investor Relations
-
view
11.073 -
download
0
Transcript of Howard Weil Conference Presentation
1 I HOWARD WEIL CONFERENCE 3/24/2015
HOWARD WEIL CONFERENCE March 24th, 2015

2 I HOWARD WEIL CONFERENCE 3/24/2015
FORWARD-LOOKING STATEMENTS
• This presentation includes "forward-looking statements” within the meaning of Section 27A of the Securities Act of 1933 and Section 21E of the Securities Exchange Act of 1934. Forward-looking statements are statements other than statements of historical fact that give our current expectations or forecasts of future events. They include production forecasts, estimates of operating costs, assumptions regarding future natural gas and liquids prices, planned drilling activity, anticipated asset sales and related adjustments, reductions in leverage, estimates of future capital expenditures, estimates of recoverable resources, projected rates of return and expected efficiency gains, as well as projected cash flow, inventory levels and capital efficiency, business strategy and other plans and objectives for future operations. Although we believe the expectations and forecasts reflected in the forward-looking statements are reasonable, we can give no assurance they will prove to have been correct. They can be affected by inaccurate or changed assumptions or by known or unknown risks and uncertainties.
• Factors that could cause actual results to differ materially from expected results include those described under "Risk Factors” in Item 1A of our annual report on Form 10-K and any updates to those factors set forth in Chesapeake's subsequent Quarterly Reports on Form 10-Q or Current Reports on Form 8-K (available at http://www.chk.com/investors/sec-filings). These risk factors include: the volatility of oil, natural gas and NGL prices; write-downs of our oil and natural gas carrying values due to declines in prices; the availability of operating cash flow and other funds to finance reserve replacement costs; our ability to replace reserves and sustain production; uncertainties inherent in estimating quantities of oil, natural gas and NGL reserves and projecting future rates of production and the amount and timing of development expenditures; our ability to generate profits or achieve targeted results in drilling and well operations; leasehold terms expiring before production can be established; commodity derivative activities resulting in lower prices realized on oil, natural gas and NGL sales; the need to secure derivative liabilities and the inability of counterparties to satisfy their obligations; adverse developments or losses from pending or future litigation and regulatory proceedings, including royalty claims; the limitations our level of indebtedness may have on our financial flexibility; charges incurred in response to market conditions and in connection with actions to reduce financial leverage and complexity; drilling and operating risks and resulting liabilities; effects of environmental protection laws and regulation on our business; legislative and regulatory initiatives further regulating hydraulic fracturing; our need to secure adequate supplies of water for our drilling operations and to dispose of or recycle the water used; federal and state tax proposals affecting our industry; potential OTC derivatives regulation limiting our ability to hedge against commodity price fluctuations; impacts of potential legislative and regulatory actions addressing climate change; competition in the oil and gas exploration and production industry; a deterioration in general economic, business or industry conditions; negative public perceptions of our industry; limited control over properties we do not operate; pipeline and gathering system capacity constraints and transportation interruptions; cyber attacks adversely impacting our operations; and interruption in operations at our headquarters due to a catastrophic event.
• Disclosures concerning the estimated contribution of derivative contracts to our future results of operations are based upon market information as of a specific date. These estimates and underlying market prices are subject to significant volatility. Our production forecasts are dependent upon many assumptions, including estimates of production decline rates from existing wells and the outcome of future drilling activity. Expected asset sales may not be completed in the time frame anticipated or at all. References to “EUR” (estimated ultimate recovery) and “resources” include estimates of quantities of natural gas, oil and NGL we believe will ultimately be produced, but that are not yet classified as “proved reserves,” as defined in SEC regulations. Estimates of unproved resources are by their nature more speculative than estimates of proved reserves and accordingly are subject to substantially greater risk of actually being realized by Chesapeake. We believe our estimates of unproved resources are reasonable, but our estimates have not been reviewed by independent engineers. Estimates of unproved resources may change significantly as development provides additional data, and actual quantities that are ultimately recovered may differ substantially from prior estimates.
• We caution you not to place undue reliance on our forward-looking statements, which speak only as of the date of this presentation, and we undertake no obligation to update any of the information provided in this presentation, except as required by applicable law.

3 I HOWARD WEIL CONFERENCE 3/24/2015
FLEXIBLE & FOCUSED
• TRACK RECORD OF PERFORMANCE
˃ 40 – 65% improvement in capital efficiency in major assets
˃ Industry-leading cash costs
˃ Balance sheet improvements
• CHESAPEAKE SPEED – A STRATEGIC STRENGTH
˃ Ability to ramp up or down in response to commodity pricing
˃ Current budget anticipates free cash flow neutral by YE 2015
˃ 2015 CAPEX further reduced by $500 million
˃ 2015 production guidance revised to 1 – 3% adjusted growth
• 2015 CAPITAL PROGRAM IS BASED ON LONG-TERM VALUE
˃ Industry-leading capital efficiency
˃ Asset quality and portfolio strength
˃ Managing short-term cash obligations, protecting liquidity
• CONTINUOUSLY EVALUATING ACQUISITION OPPORTUNITIES

4 I HOWARD WEIL CONFERENCE 3/24/2015
LOWERING 2015 CAPEX AND ACTIVITY
Note: Data above based on Outlook issued 3/23/2015
024681012141618
0
50
100
150
200
250
300
1Q'15 2Q'15 3Q'15 4Q'15
Frac
Cre
ws
Wel
l Cou
nt
Completion Activity
TIL Frac Crews
0
10
20
30
40
50
60
$0.0
$0.2
$0.4
$0.6
$0.8
$1.0
$1.2
$1.4
1Q'15 2Q'15 3Q'15 4Q'15
Rig
Coun
t
D&
C CA
PEX
($ in
bill
ions
)
D&C Capex & Rig Count
D&C Capex Reduction Rigs
• ~45% reduction in total capex vs. 2014; >30% reduction in D&C capex • Additional $500 MM capex cuts since Feb’15 Outlook to maximize value and
preserve liquidity • ~$6 billion of liquidity at YE’15 with a combination of cash on balance sheet and an
undrawn credit facility

5 I HOWARD WEIL CONFERENCE 3/24/2015
Utica 3 – 5 3 – 5 2 – 3
REDUCED ACTIVITY LEVELS
2015E Avg.Op Rigs
(2/25 Outlook)
Eagle Ford 12 – 14 8 –10 2 – 4
Haynesville 7 – 8 5 – 6 2 – 4
PRB: Niobrara & Upper Cretaceous 3 – 4 2 – 3 1 – 2
Mississippian Lime 7 – 8 5 – 6 2 – 4
Mid-Continent South 1 – 2 1 – 2 0 – 1
Marcellus 1 – 2 1 – 2 0 – 1
Other(1) 1 – 2 0 – 1 –
Total 35 – 45 25 – 35 9 – 19
(1) Other includes Cleveland Tonkawa, Barnett
2015E Avg.Op Rigs
(3/23 Outlook)
YE 2015 Op. Rigs
(3/23 Outlook)

6 I HOWARD WEIL CONFERENCE 3/24/2015
~$6B AVAILABLE LIQUIDITY BY YE 2015
1) Operating expenses include production cost, taxes and G&A. 2) Strip prices as of 3/20/2015 ($51.31/bbl and $2.94/mcf).
0
10
20
30
40
50
60
70
1Q'15 2Q'15 3Q'15 4Q'15
Production (mmboe) Base Wedge
$4.0 $4.0 $4.0 $4.0
$3.4 $2.5 $2.1 $2.0
$0.0
$1.0
$2.0
$3.0
$4.0
$5.0
$6.0
$7.0
$8.0
1Q'15 2Q'15 3Q'15 4Q'15
$ in
bill
ions
Liquidity RevolverCash - strip price
$0.0
$0.5
$1.0
$1.5
$2.0
$2.5
1Q'15 2Q'15 3Q'15 4Q'15
$ in
bill
ions
Uses of Cash D&C CapexOther CapexInterestDividendOperating Expense(1)
(2)

7 I HOWARD WEIL CONFERENCE 3/24/2015
EAGLE FORD MATCHING ACTIVITY TO COMMODITY PRICING
• Accelerating rig drops to reflect current commodity price environment
• Driving performance through further capital cost reductions
• Evaluating downspacing tests with additional coverage in core area
$8.1
$6.9
$6.1 $5.5
2012 2013 2014 2015
Well Cost ($ in MM)
0
5
10
15
20
25
J F M A M J J A S O N D
2015 Eagle Ford Rig Count
2015 Target

8 I HOWARD WEIL CONFERENCE 3/24/2015
HAYNESVILLE NEW WELL DESIGNS ENHANCE PERFORMANCE
• Increasing lateral length and enhancing stimulation techniques
˃ Expect EUR to double with 42% cost reduction per completed foot
˃ 50% improvement in capital efficiency
• Enhanced stimulation design in lower rock quality significantly increases economic locations
7
9.3
14
4,500 5,000
7,500
0
2
4
6
8
10
12
14
16
0
1,000
2,000
3,000
4,000
5,000
6,000
7,000
8,000
Traditional Well Modern Well Modern ExtendedLateral
EUR (BCF)
Lateral Length (ft)
8,500 7,500
8,250
1,900 1,500 1,100
10
15
18
-15
-10
-5
0
5
10
15
20
-1,000
1,000
3,000
5,000
7,000
9,000
11,000
13,000
15,000
Traditional Well Modern Well Modern ExtendedLateral
Total Well Cost ($M)Well Cost / Lateral FtIP Rate (MMCFPD)

9 I HOWARD WEIL CONFERENCE 3/24/2015
MISSISSIPPIAN LIME REDUCING COSTS & EXPANDING OUR POSITION
• 45% capital reduction expected over a 3-year period
• 20% improvement in EUR since 2012
• Well efficiency improvements and field delineation expand economic locations
(1) Assumes capital cost of $2.5MM
Core Core Core Core
Core Expansion
Core Expansion
Tier 2
0
500
1,000
1,500
2,000
$50/$3.00 $65/$3.50 $75/$3.75 $85/$4.00
$4.6
$3.5
$3.1
$0.22 $0.18
$0.20 $2.5
2012 2013 2014 2015
Supply Chain
Efficiency Gains Design
Improvements
Miss Lime CAPEX per Well (MM$) Inventory with Positive PV10(1)
E

10 I HOWARD WEIL CONFERENCE 3/24/2015
0
5,000
10,000
15,000
20,000
25,000
30,000
35,000
0 100 200 300 400 500 600 700 800
65% Decrease in drilling days (2014 vs. 2011)
NORTHERN MARCELLUS PERFORMANCE THEN & NOW – FRANCLAIRE PAD
Gross Gas Production, Mmcf/d
2014 Enhanced Completion 2011 Standard Completion
2011 2014
No. of Wells 2 3
Lateral Length 6,500’ 7,300’
Average IP 6 Mmcf/d 22 Mmcf/d
Drilling Days 33 days 12 days
Well Cost $10.8 MM $7.3 MM
265% Increase in average IP rate (2014 vs. 2011)
30% Decrease in capex per well (2014 vs. 2011)
11 I HOWARD WEIL CONFERENCE 3/24/2015
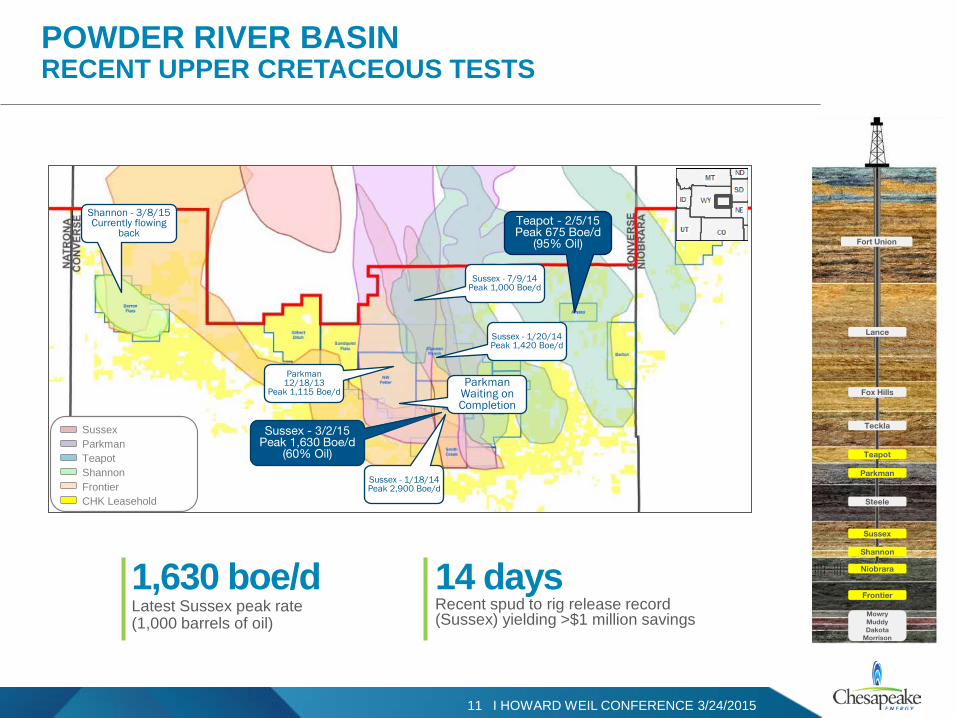
POWDER RIVER BASIN RECENT UPPER CRETACEOUS TESTS
Fort Union
Lance
Fox Hills
Teckla
Teapot
Parkman
Steele
Sussex
Shannon
Niobrara
Frontier
Mowry Muddy Dakota
Morrison
Shannon - 3/8/15 Currently flowing
back Teapot - 2/5/15 Peak 675 Boe/d
(95% Oil)
Parkman 12/18/13
Peak 1,115 Boe/d
Sussex - 3/2/15 Peak 1,630 Boe/d
(60% Oil)
Sussex - 1/18/14 Peak 2,900 Boe/d
Sussex - 1/20/14 Peak 1,420 Boe/d
Sussex - 7/9/14 Peak 1,000 Boe/d
Parkman Waiting on Completion
1,630 boe/d Latest Sussex peak rate (1,000 barrels of oil)
14 days Recent spud to rig release record (Sussex) yielding >$1 million savings
Sussex Parkman Teapot Shannon Frontier CHK Leasehold

12 I HOWARD WEIL CONFERENCE 3/24/2015
UTICA TAILORED CLUSTER SPACING
• Completion customized to reservoir and maturity
• Evolution driven by rigorous core analysis and supported by extensive field testing
• Reduced cluster spacing in east (implemented early 2014)
• Ultra reduced cluster spacing in west (implemented mid-year 2014)
CHK Operated CHK Leasehold Oil Window Wet Gas Window Dry Gas Window
Ultra Reduced Cluster Spacing
Reduced Cluster Spacing
~25% Increase in EUR Ultra Reduced Cluster Spacing
~50% Increase in IP rates Ultra Reduced Cluster Spacing

13 I HOWARD WEIL CONFERENCE 3/24/2015
UTICA TAILORED FIELD DEVELOPMENT
• Leveraging >600 square miles of 3D seismic and >5,300 feet of core to optimize development
• Redefining targeting to yield 15% higher EUR/ft
• Adjusting well spacing to optimize field recovery
500’ Well Spacing
700’ Well Spacing
1000’ Well Spacing
CHK Operated CHK Leasehold Oil Window Wet Gas Window Dry Gas Window
~800 locations Incremental locations added vs. original 1000’ spacing

14 I HOWARD WEIL CONFERENCE 3/24/2015
WHAT TO EXPECT…
• Flexibility and value focus
• Outstanding liquidity
• Strength of our portfolio provides stability in a low price environment
• Driving capital efficiency throughout the organization
• Free cash flow neutral by year-end 2015

15 I HOWARD WEIL CONFERENCE 3/24/2015
APPENDIX

16 I HOWARD WEIL CONFERENCE 3/24/2015
CAPTURING MORE FOR LESS NORTHERN DIVISION
Marcellus North: 39% Improvement Utica: 53% Improvement
Powder River Basin: 46% Improvement
(1) (1)
(1)
Note: Capex / EUR is defined as net drilling and completion (D&C) costs per well divided by net estimated ultimate reserves booked per well (1) 2014 estimated D&C costs per well and net reserves booked per well are as of 12/31/2014

17 I HOWARD WEIL CONFERENCE 3/24/2015
CAPTURING MORE FOR LESS SOUTHERN DIVISION
Haynesville: 67% Improvement Eagle Ford: 38% Improvement
Mississippian Lime: 47% Improvement
Note: Capex / EUR is defined as net drilling and completion (D&C) costs per well divided by net estimated ultimate reserves booked per well (1) 2014 estimated D&C costs per well and net reserves booked per well are as of 12/31/2014
(1) (1)
(1)

18 I HOWARD WEIL CONFERENCE 3/24/2015
DRILLING AND SERVICES COMMITMENTS
• Commitments roll off through 2015 – CHK has chosen to pay some penalties due to current market conditions and desire to lower overall spending
51 Rigs
45 Rigs
51 Rigs
65 Rigs
71 Rigs
$0
$25
$50
$75
$100
$125
$150
Q1 2015 Q2 2015 Q3 2015 Q4 2015
Tota
l Com
mitm
ent (
$ in
milli
ons)
PTL Commitment FulfilledDrill Commitment FulfilledDrill Commitment Penalty