How trees and people can co-adapt to climate · PDF fileHow trees and people can co-adapt ......
152
WORLD AGROFORESTRY CENTRE How trees and people can co-adapt to climate change Reducing vulnerability in multifunctional landscapes EDITORS MEINE VAN NOORDWIJK MINH HA HOANG HENRY NEUFELDT INGRID ÖBORN THOMAS YATICH
Transcript of How trees and people can co-adapt to climate · PDF fileHow trees and people can co-adapt ......

WORLD AGROFORESTRY CENTRE
How trees and
people can co-adapt
to climate changeReducing vulnerability in multifunctional landscapes
EDITORS
MEINE VAN NOORDWIJK
MINH HA HOANG
HENRY NEUFELDT
INGRID ÖBORN
THOMAS YATICH


How trees and people
can co-adapt to
climate change
Reducing vulnerability in multifunctional landscapes
EDITORS
MEINE VAN NOORDWIJK
MINH HA HOANG
HENRY NEUFELDT
INGRID ÖBORN
THOMAS YATICH

Citation
Disclaimer and copyright
ISBN
Cover image
Design and layout
Van Noordwijk M, Hoang MH, Neufeldt H, Öborn I, Yatich T, eds. 2011. How trees and
people can co-adapt to climate change: reducing vulnerability through multifunctional
agroforestry landscapes. Nairobi: World Agroforestry Centre (ICRAF).
The World Agroforestry Centre (ICRAF) holds the copyright to its publications and web pages but encourages duplication, without alteration, of these materials for non-commercial purposes. Proper citation is required in all instances. Information ownedby others that requires permission is marked as such. The information provided by the Centre is, to the best of our knowledge, accurate although we do not guarantee the information nor are we liable for any damages arising from use of the information.
Website links provided by our site will have their own policies that must be honoured.The Centre maintains a database of users although this information is not distributedand is used only to measure the usefulness of our information. Without restriction,please add a link to our website www.worldagroforestrycentre.org on your website or publication.
978-979-3198-56-9
World Agroforestry CentreUnited Nations Avenue, GigiriPO Box 30677, Nairobi 00100, KenyaTel: +(254) 20 722 4000Fax: +(254) 20 722 4001Email: [email protected]
Southeast Asia Regional OfficeJl. CIFOR, Situ Gede, Sindang Barang, Bogor 16115PO Box 161 Bogor 16001, IndonesiaTel: +(62) 251 8625 415Fax: +(62) 251 8625 416Email: [email protected]/sea
Four months after the devastating December 2004 tsunami in Aceh, Indonesia, the exchange of local coconut germplasm symbolised the resilience of people and trees.(Front cover photo: Meine van Noordwijk)
(Back cover photo: Johanna Liljenfeldt)
Tikah Atikah
2011

The focus of this book is represented by the blue star
The co-adaptation wheel. Co-adapt means: A adapts to B + environment, while B adapts to A + environment, and the environment adapts to A + B


Climate changes, especially increased variability, affect landscapes, human livelihoods and trees in many ways. They are the consequence of a wider set of global change issues, including population increase, more consumption per capita and trade globalisation. Both people and trees can adapt to change at various time scales, but the current rate of change implies that pro-active planning as part of integrated rural development is needed. Lessons learnt from 'best practices' of ruraldevelopment and natural resources management in the tropics suggest development strategiesthat can be shared more widely in the field and relevant research to support their refinement. In the current climate-change debates, 'trees' have received surprisingly little attention, while the issues of sustainable forest management are only beginning to appear on the agenda. Wherenational adaptation plans are made for developing countries, trees and forests both deserve full attention. Jointly, they are part of 'multifunctional landscapes'.
This book focuses on the relationship between climate-change adaptation, rural development and the roles of trees and agroforestry. Rewards' schemes for environmental services (RES) in multifunctional landscapes, which provide incentives for maintaining or restoringmultifunctionality, will contribute to a likely reduction in vulnerability to climate change. Rewardsmay well be an efficient and fair way of investing international funds in climate-change adaptation.The voluntary, conditional and pro-poor aspects of RES will also help to bring the voice of grass-roots stakeholders into international and national decision-making processes on how to deal with climate change. That can ensure realism and efficiency in climate-change adaptation, which is yetanother strand to be integrated in rural development programs. The argument for such an approach is built on the underlying concepts of climate change, rural livelihoods and multifunctionality of landscapes, as well as the specific roles of trees and farmers as providers of environmental services in agricultural landscapes. However, trees themselves are vulnerable toclimate change and co-adaptation is needed and is possible.
The emerging experience and findings of on-going action research in Asian and African countrieson climate change, agroforestry and rewards or payments for environmental services (RES/PES) areintroduced in the book to highlight these arguments. The experience that RES/PES can createeffective, efficient and fair incentives for enhancement of the environment is used to explore how climate-change adaptation funds could be channelled to support local initiatives, within realistic,conditional, voluntary and pro-poor incentive mechanisms.
Priority areas for action and hypotheses for further research are identified, involving the roles of trees in modifying micro- and mesoclimates, refining the operational rules for use of climate-change adaptation funds, institutional expansion of the (already tested) rapid appraisal methods that acknowledge multiple knowledge systems and perceptions, analysing the risks to locallivelihoods in ecological and environmental economics frameworks posed by climate change and trade globalisation and new approaches to integrate the space-time dynamics of landscapefunctions in socio-ecological-political-economy systems.
Abstract
iiiREDUCING VULNERABILITY IN MULTIFUNCTIONAL LANDSCAPES


v
Preface ix
Acknowledgements xi
A summary of how trees and people co-adapt to climate change 1
Section I. Climate change, climate variability and adaptation options 15
Section II. Rural livelihoods in changing, multifunctional landscapes 37
1
Intermezzo 1. Practical support to farmers to obtain carbon revenues for treeplanting -- Ylva Nyberg 12
A. Climate change and climate variability 15
The climate system and the greenhouse gas effect 16Anthropogenic climate change 17Climate variability 19
Intermezzo 2. Climate variability, consequences and responses by farmers in thePhilippines 25
Intermezzo 3. Climate variability, land use and climate change interact on riverflow 26
B. Adaptation options for climate change 27
Adaptation in the context of mitigation 27
Adaptation concepts 28
Responses to climate change at international to local levels 30
Intermezzo 4. Home and forest gardens reducing vulnerability in Central Vietnam 34
Intermezzo 5. Current climate maps assume that there are no trees in the landscape 35
C. Rural livelihoods in changing landscapes 37
Millennium Development Goals 38
A history of change 38
Rural livelihoods and pressures at current climate variability 40
Intermediate stage vulnerability hypothesis 41
Sustainable livelihoods: operationalising a concept 42
Range of options to include in climate-change adaptation and sustainagility analysis 43
The politics of adaptation-resource allocation 44
Free and prior informed consent 44
Rights and resources: the tragedy of the commons 45
The editors
Henry Neufeldt, Isabel van de Sand, Johannes Dietz, Minh Ha Hoang, Thomas Yatich, Rodel Lasco and Meine van Noordwijk
Meine van Noordwijk, Leah Onyango, Antoine Kalinganire, Laxman Joshi, Minh HaHoang, Nestry Ndichu and Ramni Jamnadass
Table of Contents
REDUCING VULNERABILITY IN MULTIFUNCTIONAL LANDSCAPES

Intermezzo 6. Fruit tree portfolios in southern Africa 46
Intermezzo 7. Bioenergy, fuelwood, charcoal and Jatropha 47
D. Multifunctional landscapes and dynamic livelihoods 49
Dynamic mosaics and gradients 49
Lateral flows, filters, complex causation 50
Landscape institutions, rules and definitions 51
Intensification gradients 52
Tree cover on agricultural lands 52
Tree-cover transitions 54
What part of ‘forest functions’ can be realistically expected from mixed landscapes? 57
Is segregation of functions better than ‘integration’ to achieve overall societal goals? 57
Does the segregate–integrate perspective change in the face of climate change? 58
Intermezzo 8. Sustainability analysis in West Africa 60
E. Trees as providers of environmental services in multifunctional landscapes 63
Trees for goods and services 64
Farmers plant trees for their products 64
Trade-offs between goods and environmental services 65
The role of species’ diversity and genetic variation in ecosystem function 65
Domestication for value chains can support tree diversity 66
Challenges in realising benefits 66
Intermezzo 9. The Eucalyptus debate on tree water use 66
Intermezzo 10. Shade, litter, nematodes, earthworms, termites and companion trees in coffee agroforestry in Indonesia in relation to climate resilience 68
F. Tree growth and dependence on climate 69
Broad patterns: current relations, zones 69
Tree resilience from physiology to population level 70
Trees as keepers of climate history records 70
Challenges of climate variability for trees 72
Challenges and opportunities of climate variability for people dealing with trees 74
Intermezzo 11. Tree–climate matching: use of existing databases 75
Intermezzo 12. LAAMAs in rural Africa? 76
Chapter G. Supporting multifunctionality: Pluralistic approaches, trust building andmultilevel institutional reforms 80
Section III. Trees as providers of environmental services in multifunctional landscapes
are vulnerable to climate change 63
Section IV. Supporting multifunctionality through realistic, conditional and voluntary
actions to enhance trees as source of environmental services 79
Ramni Jamnadass, Aster Gebrekirstos, Henry Neufeldt, Catherine Muthuri, Ian Dawson,Roeland Kindt, Ylva Nyberg, Johannes Dietz, Jules Bayala, Shem Kuyah, Chin K. Ong, Carmen Sotelo Montes, John Weber, Kurniatun Hairiah and Meine van Noordwijk
Beria Leimona, Meine van Noordwijk, Laxman Joshi, Delia Catacutan, Thomas Yatich,Johannes Dietz, Hosea Mwangi, John Mwangi Gathenya, Catherine Muthuri, Fergus Sinclair,Sanjeeb Bhattarai, Leah Onyango, Suyanto, Antoine Kalinganire, Qureish Noordin, Jules Bayala,Aster Gebrekirstos, Karen Tscherning and Caroline Duque-Piñon
vi HOW TREES AND PEOPLE CAN CO-ADAPT TO CLIMATE CHANGE

Beyond the symptoms: dealing with issues at driver level 81
Pluralistic approaches 82
Building trust as the basis 83
Multiscale links in mitigating and adapting to climate change 84
Intermezzo 13: The negotiation support system as the basis for forestlandstewardship in Indonesia 87
H. Adopt, evaluate and learn in combining carrots, sticks and sermons 89
Instruments to influence individual decision-making in managing public goods 89
Components enhancing the provision of environmental goods and services 90
Intermezzo 14. RUPES River Care scheme: a contract to reduce river sedimentation 93
Intermezzo 15. Green tea and clean water: Incentive for environmentally and socially responsible tea-farm management in Kenya 94
I. Balancing fairness and efficiency in rewarding environmental services’ providers 95
Multiple knowledge systems under a ‘realistic’ principle 97
Local and public ecological knowledge 98
Modellers’ ecological knowledge 99
Baseline study 100
Tools for spatially explicit assessment of ecosystem services 101
Ecological modelling of buffers and filters 102
Multiple levels of conditionally in rewarding environmental services 104
Ensuring participation and transparency for a voluntary approach 106
Pro-poor: access, design and outcome 108
Intermezzo 16: The Rio conference and Reshaping the international Order in relation to forests, trees and agroforestry 110
Intermezzo 17: The altruism puzzle resolved: George Price’s equation in a humandevelopment context 112
J. Increasing resilience and sustainagility by support of social and ecological buffers 113
Buffers/filters as a unifying concept 113
Responsiveness requires pressure 115
Ecosystem-based adaptation and sustainagility 116
K. Research priorities 117
117The Editors
References 123
List of contributors and their institutional affiliation 132
Glossary of terms and acronyms 134
viiREDUCING VULNERABILITY IN MULTIFUNCTIONAL LANDSCAPES


Rising sea levels will affect all coastal land use and communities; shifts in rainfall amount, timing, pattern or predictability may affect nearly all land; and changes in temperature will shift the current distribution of crops, pests, parasites, disease vectors and organisms, pollinators,symbionts and wild plants and animals. Ignoring the issue or refusing to adapt to a changing climate is no longer possible for governments, communities and anyone planning investment inland-use systems. The issues are even more pronounced when considering trees because the climate in which a tree will grow and mature is likely to be quite different from the one in which it was planted. Perhaps surprisingly, trees have received little attention in discussions of climatechange adaptation, while issues of sustainable forest management are only beginning to appear on the agenda. Trees and forests can both adapt, but in different ways.
Trees in the landscape, in various forms and under various types of management, play a criticalrole in reducing vulnerability to uncertain and shifting climates. Trees can buffer microclimates,modulate water flows, store carbon, provide habitat for plants and animals in protected areas and corridors, and provide food for people. Where 'national adaptation plans' are made for developingcountries, trees and forests deserve full attention. Jointly, they are part of 'multifunctional landscapes', a concept that is gaining appreciation as a unifying perspective on the provision of goods and services for local livelihoods as well as stakeholders at greater distance: within the same watershed or within the same carbon-shed (that is, planet Earth).
We will explore how multifunctionality of landscapes plays a role in reducing vulnerability and supporting adaptation of rural livelihoods. The multifunctionality, however, is under pressure fromforces that lead to simplification, specialisation and spatial segregation of landscapes. There are
1many words, names and concepts of multifunctionality, including satoyama , agroforestry,community forest management, kebun lindung. Many of them now are now receiving recognitionafter a period of neglect where they were seen as backward.
Current policies and market forces may need corrections to shift from exclusive attention on tradable commodities to appreciation for environmental services and their roles in human wellbeing. In fact, some pioneering work has started on all tropical continents on the waysincentives, rewards or payments for environmental services can become a cornerstone supporting multifunctionality. If 'rewards for environmental services' (RES) support multifunctionality and multifunctionality in turn supports climate-change adaptation, we may find that there is a two-wayrelationship between climate-change adaptation and RES: RES halting loss of multifunctionality canavoid an increase in rural vulnerability; and reduce the need for other forms of climate-changeadaptation.
Therefore, part of the global funds now committed for climate-change adaptation (reflecting the responsibility of the main greenhouse gas emitters for their impacts on all human beings) can be channelled through RES to promote tree-based options that reduce (or avoid increase of) human
ix
Preface
1 http://en.wikipedia.org/wiki/Satoyama
REDUCING VULNERABILITY IN MULTIFUNCTIONAL LANDSCAPES

vulnerability to climate variability and change. Furthermore, such a two-way relationship can reflect a form of synergy or 'co-investment' that is much needed, both from the perspective of 'efficiency' (limited climate-change adaptation funds have to go a long way) and 'fairness' (the most vulnerable need priority attention, many of whom are rural poor in depleted landscapes).
In this book we explore this line of argument, using examples of research and development effortsin Asia and Africa. We hope that our introduction to the various aspects that need to come together to achieve this new synergy can help raise interest from researchers, practitioners and policymakers. Academics will need to blend multiple disciplines to appreciate and contribute to an emerging practice. Practitioners need to appreciate the many pitfalls that can be avoided.Policymakers will need to think outside of the 'boxes' into which institutions and their policies split any issue.
This book is the outcome of a meeting between researchers and practitioners involved in the Rewarding Upland Poor for the Environmental Services they provide (RUPES) project in Asia, the Pro-poor Rewards for Environmental Services in Africa (PRESA) project and the internationalresearch centres and universities that support new approaches to sustainability science. In planning this overview we developed sections aimed at 'understanding' and those aimed at 'action'.
The idea for this book was warmly welcomed by the group of researchers and practitioners in the RUPES and PRESA networks and many agreed to contribute their experience and perspectives. Wehope the text and its presentation can help to gain recognition for linking knowledge with action in adaptation to climate change through support for landscape multifunctionality. Trees, livelihoodsand current and future climate variability are closely linked.
In the design of the book, we decided to illustrate the general flow of the argument with'intermezzi' that derive from case studies or ongoing work in specific landscapes. We saw that our target audience would be
1) Policy-shapers interested in long-term solutions for reducing vulnerability to climatechange;
2) Researchers and NGO staff interested in linking knowledge with action; and3) Advanced undergraduate/graduate students.
Nairobi, Bogor, Hanoi, UppsalaThe editors
x HOW TREES AND PEOPLE CAN CO-ADAPT TO CLIMATE CHANGE

A number of external reviewers provided feedback on the final draft and helped to improve it: Dr Aissétou Dramé Yayé (Executive Secretary of the African Network for Agriculture, Agroforestry and Natural Resources Education, Kenya), Kees van Dijk (Tropenbos, The Netherlands), Prof Dr Ragnhild Lund (Norwegian University of Science and Technology), Dr Mohamed Bakar (Global EnvironmentFacility secretariat) and Dr Marian de los Angeles (World Bank Institute, USA).
Further feedback was provided by participants in the Trees in Multi-use Landscapes in SoutheastAsia (TUL-SEA) project synthesis workshop in Malang, Indonesia, in February 2010, and participants of a workshop in Chiapas, Mexico, in November 2010. Responsibility for remaininginconsistencies rests with authors and editors. Robert Finlayson assisted with editing and TikahAtikah designed the book.
We are grateful for the funding contribution to the workshop and printing costs from the SwedishResearch Council for Environment, Agricultural Sciences and Spatial Planning and the SwedishMinistry for Foreign Affairs as part of its special allocation on global food security, and from the International Fund for Agricultural Development (IFAD) under their climate-change mitigation and adaptation strategy. Assistance was also provided through IFAD for the Rewarding Upland Poor forthe Environmental Services They Provide (RUPES) project and the Pro-poor Rewards forEnvironmental Services in Africa (PRESA) project. Support also came from the Norwegian Agencyfor Development Cooperation for the ASB Partnership for the Tropical Forest Margins and the Reducing Emissions from All Land Uses project. Without our partners in research-for-developmentthis book and the extensive research upon which it is based would not have been possible. AfricanNetwork for Agriculture, Agroforestry and Natural Resources Education (ANAFE) agreed to assist in distribution of the book among Africa universities.
xi
Acknowledgements
REDUCING VULNERABILITY IN MULTIFUNCTIONAL LANDSCAPES


The editors
This book tries to bring together two important things that have been separated in the way people and their institutions deal with lives and landscapes.
1A. ‘Trees’ were lost when the world started to focus on ‘forests’ as part of the climate debate.
2A. Efforts to avoid the negative impacts of climate change on human beings and ecosystems weresegregated into ‘mitigation’ (reducing greenhouse gas emissions) and ‘adaptation’ (reducingvulnerability) domains, with separate funding, negotiations and responsibilities.
In both cases there is an alternative perspective which receives less attention in public debate.
1B. Dynamic landscapes can lose and gain in tree cover over time, with consequences for a rangeof ‘goods’ and ‘services’, but there is no single clear distinction that separates the continuuminto a forest and a non-forest part. The landscape can be more easily understood if it is seen as an agriculture–forestry (agroforestry) continuum. Institutionally, ‘forest’ is a construct that has historical roots, but it is not a sound basis for developing policies where landscape multifunctionality is a must.
2B. Many actions that people can take in the landscape support both adaptation (ensuring that the land cover can deal with likely climate changes without major loss of function) and mitigation(reducing net emissions by enhancing terrestrial carbon storage). Institutional support for the
2combination (‘mitigadaptation’) is appropriate .
A summary of how trees and people
co-adapt to climate change
Figure O.1 Mitigation and adaptation are inseparable: people, trees and local climate are closely linked
2 As miti in kiSwahili refers to ‘tree’, the concept of ‘mitigadaptation’ may have extra appeal
1REDUCING VULNERABILITY IN MULTIFUNCTIONAL LANDSCAPES

The main hypothesis that we test in this book is that ’agroforestry is a key component of mitigadaptation’ or, in more detail, ‘investment in institutionalising rewards for the environmentalservices that are provided in multifunctional landscapes with trees is a cost-effective and fair wayto reduce vulnerability of rural livelihoods to climate change and to avoid larger costs of specific “adaptation” while enhancing carbon stocks in the landscape’.
Through a series of underlying concepts of rural livelihoods in multifunctional landscapes with trees, we review evidence supporting this hypothesis, or showing that it is, at least, consistent withcurrent understanding of the complex, interlinked nature of landscapes, livelihoods and governance systems. There is, however, a remaining uncertainty and a need for further research to close critical knowledge gaps. In acknowledgement of the level of confidence in the hypothesis, weformulated ‘no regrets’, ‘consequences for policy’ and ‘consequences for practice’, in which wepropose a logical sequence of steps that can identify location-specific interventions to reducehuman vulnerability to climate change through removal of bottlenecks to the realisation of trees’potential.
Section I (chapters A and B) provides an introduction to basic concepts of climate-changevulnerability, adaptation and mitigation, followed by basic concepts of rural livelihoods,multifunctional landscapes and their pathways of change and transformation in section II (chaptersC and D). Section III (chapters E and F) delves deeper into what we know about the way trees in the landscape provide essential environmental services, but are themselves vulnerable to climatechange. Section IV (chapters G–J) combines the three previous steps in a discussion of the waymultifunctionality of landscapes with trees can be enhanced or maintained by linking economicincentives and investment to the effective provisioning of environmental services, which has been a major focus of natural resource management research and development in the past decade. Chapters H, I and J present current understanding of what it takes to make such investment inmultifunctionality work.
Finally, chapter K presents critical knowledge gaps and research imperatives.
Parts of this emerging knowledge are ‘ready for use’ at policy and practical level, while a number of critical uncertainties should be topics of focussed research. In this synthesising chapter, policy recommendations are framed as ‘no regrets’ actions, based on what we think we know wellenough to promote in practical application.
1. There are ‘limits to adaptation’ which define globally appropriate mitigation action
Limits to adaptation. The 1972 Limits to Growth report to the Club of Rome by Donella and Dennis Meadows et al. focussed on the consequences of a rapidly growing worldpopulation and finite resource supplies. It provided evidence that the pattern of global resource use was not sustainable and that adjustment was needed. This message took timeto become part of mainstream thought but we can now trace the ideas discussed in the book to the current debate on climate change. Many of the specific predictions of resourcedepletion proved, luckily, to be too pessimistic: partially because new mining resources and techniques emerged, partially because some adaptation did take place and resource-usepatterns shifted, However, the real transition to low carbon flux, high carbon stock
Underlying concepts
What we think we know well enough to promote in application (‘policy
recommendations’)
2 HOW TREES AND PEOPLE CAN CO-ADAPT TO CLIMATE CHANGE
economies has yet to occur. Growth is possible, but it has limits. Similarly, adaptation is possible, but it has limits. Limits to adaptation (Kandji et al. 2006, Adger et al. 2009) areprobably real, although it is hard to define their exact location. Human inventiveness mayhave no bounds but the resource base for implementing inventions may run out nevertheless.
3Two things are unlimited : the number of generations we should feel res¬ponsible for and our inventiveness. The first provides us with a challenge: to feed and provide for not only the presentbut all future generations from the Earth’s finite flow of natural resources. The second, our inventiveness, may create ideas and policies that will contribute to meeting that challenge.
Jan Tinbergen, First Nobel Laureate in Economics (Schultink 2007)
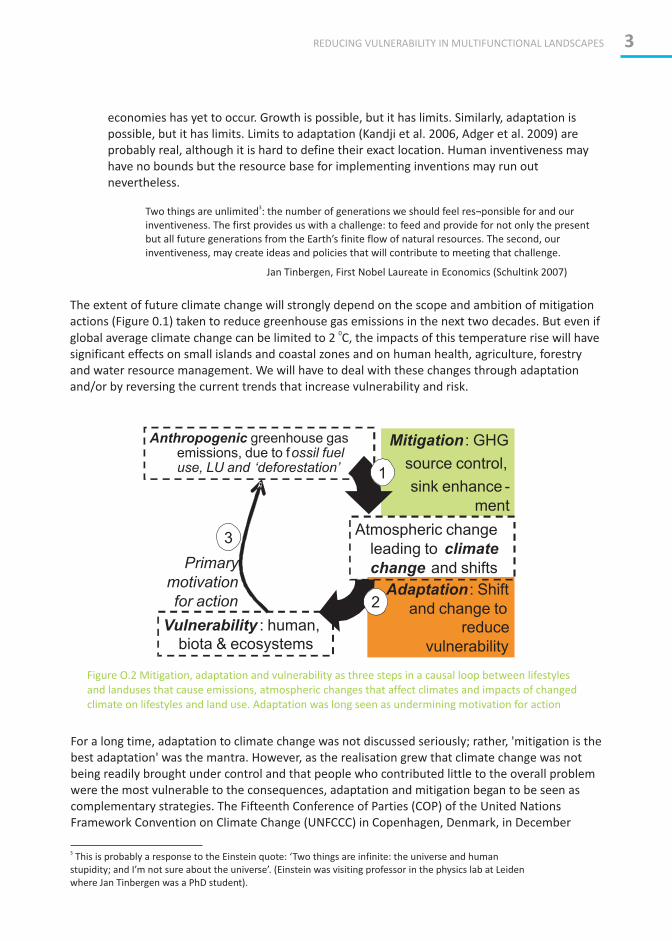
The extent of future climate change will strongly depend on the scope and ambition of mitigationactions (Figure 0.1) taken to reduce greenhouse gas emissions in the next two decades. But even if
0global average climate change can be limited to 2 C, the impacts of this temperature rise will havesignificant effects on small islands and coastal zones and on human health, agriculture, forestryand water resource management. We will have to deal with these changes through adaptationand/or by reversing the current trends that increase vulnerability and risk.
Anthropogenic greenhouse gasemissions, due to fossil fueluse, LU and ‘deforestation’
Vulnerability : human,
biota & ecosystems
Adaptation : Shift
and change to
reduce
vulnerability
Mitigation : GHG
source control,
sink enhance -
ment
Atmospheric change
leading to climate
change and shiftsPrimary
motivation
for action
1
3
2
Figure O.2 Mitigation, adaptation and vulnerability as three steps in a causal loop between lifestylesand landuses that cause emissions, atmospheric changes that affect climates and impacts of changed climate on lifestyles and land use. Adaptation was long seen as undermining motivation for action
For a long time, adaptation to climate change was not discussed seriously; rather, 'mitigation is the best adaptation' was the mantra. However, as the realisation grew that climate change was not being readily brought under control and that people who contributed little to the overall problemwere the most vulnerable to the consequences, adaptation and mitigation began to be seen as complementary strategies. The Fifteenth Conference of Parties (COP) of the United NationsFramework Convention on Climate Change (UNFCCC) in Copenhagen, Denmark, in December
3REDUCING VULNERABILITY IN MULTIFUNCTIONAL LANDSCAPES
3
stupidity; and I’m not sure about the universe’. (Einstein was visiting professor in the physics lab at Leiden where Jan Tinbergen was a PhD student).
This is probably a response to the Einstein quote: ‘Two things are infinite: the universe and human

2009, agreed on fund allocation for adaptation but not on clear targets for emission reductions.The sixteenth COP in Cancun, Mexico, in 2010, reiterated the relevance of nationally appropriatemitigation actions (NAMA), reducing emissions from deforestation and forest degradation plus conservation (REDD+) and adaptation, but left numerical targets for the next steps in the multi-year negotiation marathon.
Knowing the limits to global adaptation is the key to defining globally appropriate mitigationactions (GAMA) and negotiating between countries until the sum of NAMAs add up to GAMA. Rockström et al. (2009) summarised the current understanding of planetary boundaries and the safe operating space for humanity. Between global boundaries and national and local action thereis a huge gap.
The early position was that climate change had to be avoided, assuming that there was no space for adaptation. Talking about adaptation was seen as undermining the platform for mitigation.Being clear on 'limits to adaptation' and its consequences for GAMA can help us move beyondstatements such as 'mitigation is the only valid form of adaptation'.
Among the developing countries that declared their NAMA, Indonesia has been one of the trendsetters with its announcement of a targeted 26% emission reduction below a 'business as usual' scenario for 2010 through unilateral NAMA plus a further 15% reduction if bilateral co-investment occurred and even further reduction if private carbon-market funding takes off based on global agreements.
At a national scale this is expected to be feasible through major contributions from the forestsector and peatland management (agriculture and forestry) and smaller contributions fromtransport and urban and industrial energy sectors. As of early 2011, however, the total had not yetbeen translated into targets for different provinces and districts. The NAMA is not based on locallyappropriate adaptation and mitigation actions (LAAMA).
Globally Appropriate Mitigation Actions (GAMA)
Nationally Appropriate Mitigation Actions (NAMA)
Locally Appropriate Adaptation & Mitigation Actions
(LAAMA)
Landscape
approaches to
adaptation +mitigation
Figure O.3. Relationship of appropriate actions to mitigate climate change and adapt to the consequences at local, national and global levels
4 HOW TREES AND PEOPLE CAN CO-ADAPT TO CLIMATE CHANGE

In the initial rounds of the climate change debate, emphasis was on ‘mitigation’, stopping the growth of, and eventually reducing, net emissions owing to human activity and avoiding the need for adaptation. Now that it is clear that mitigation efforts are too slow and too little to stop, or revert, climate change, we need to discuss adaptation. But any form of adaptation that does not have ‘mitigation co-benefits’ will not achieve the overall goal.
Climate and weather
Everyone's talking about the weather but nobody's doing anything about it.
Mark Twain
Everyone's talking about the climate but nobody's doing anything about it.
UNFCCC COP observer
2. Enhancing terrestrial carbon storage at local level requires an understanding of adaptation
needs
At the local level, actions to mitigate climate change by enhancing carbon storage need to be closely matched with actions to adapt and reduce vulnerability to climate change (LAAMA). The adaptation side of LAAMA deserves more attention, while the number of projects and actors who chase the relatively small 'mitigation carbon market' is probably based on hype and hope ratherthan reality.
The example of Intermezzo 1 (see below) provides a good example of project designs where treesrather than a 'carbon market' generate the primary benefit for farmers, with the advisory and collective action costs paid through a form of (informal) off-set.
A focus on adaptation implies several activities.
1. The choice of tree germplasm and its diversity (between and within species) needs to be adjusted to the likely future range of local climate variability. Species will probably be more vulnerable to change at the edges of their distribution range than in their coredomain. If climate-change models agree among multiple global circulation models of climate dynamics and scenarios, specific targets for tree provenances can be formulated.Otherwise, if there is to be a trade-off between genetic diversity (robustness) and 'high performance on specifically desirable traits' (peak performance), it's probably wise to err on the robust side of genetic diversity and to forego part of maximum yields under favourable circumstances.
2. A multifunctionality and mixture of trees in a landscape needs to be ensured. Treespecialisation based on what is currently most profitable may not serve us well in the future.
3. Policy barriers to the use of trees on farms, including the rights to future harvests, need tobe removed and strong incentives established. Roshetko et al. (2008) and van Noordwijk et al. (2008) discussed barriers with marketing smallholder timber. In the European Union, the use of trees on agricultural land was 'illegal' up until recently, while current subsidyschemes for meadows and grazing land still set limits to tree density that entice farmers to remove their trees in order to obtain subsidies, while others require subsidies in order toplant.
5REDUCING VULNERABILITY IN MULTIFUNCTIONAL LANDSCAPES

3. Engineering approaches to technical infrastructure are expensive relative to tree-based
'green infrastructure' and enhancement of social capital
Analysis of the national adaptation plans of action (NAPA) lists presented in Figure 0.4 suggestthat engineering projects to deal with climate-change adaptation in specific areas can easily costtens of millions of dollars. The most expensive to date has been the USD 700 million investmentsin irrigation in Ethiopia. Tree-based 'green infrastructure' projects may cost between USD 0.5 and 2 million to cover substantially larger areas, while social capital projects have costs at even lowerlevels. This NAPA list is probably only indicative and a deeper economic analysis is needed, but green and social infrastructure need to be taken seriously in adaptation debates.
Engineering solutions
Green infrastructure
Land use adaptation
Est
imate
dp
roje
ct
co
st,M
$
Figure O.4. Estimated costs of projects proposed as part of national adaptation plans of action, October 2009, categorised by their focus on engi-neering solutions, green infrastructure and/oradaptation of broader land-use patterns
4. Current tree diversity in agricultural landscapes is a form of risk insurance. The precautionary
principle should shift the burden of proof to those who propose increasing the risk by reducing
diversity
Agricultural intensification and associated reduction of tree cover and tree diversity in landscapes is continuing. Enhanced vulnerability to climate change is not usually included in the formalenvironmental impact assessment of such programs. To do so would be likely to reduce the internal rates of return and adversely affect the cost/benefit analysis. In the absence of agreedmethodologies, a precautionary principle is justified that shifts the burden of proof to those who propose radical change rather than those who propose a more gradual adjustment.
5. Conflicts over 'ownership' of land may be hard to resolve. Other approaches are feasible that
share responsibility for maintaining local and global environmental services
Analyses by many of the partners in the Rights and Resources Initiative have brought togethercompelling evidence for a dysfunctional level of conflict over land ownership and use rights. However, there are currently 'rights-based approaches' that seek a principled resolution of conflicts (Colchester and Lohman 1993, Adger et al. 2001, Adger 2006, Gready and Ensor 2005, Fayand Michon 2005) as well as a more pragmatic approach to reduce the level of conflict to the point that workable solutions can emerge (Suyanto et al. 2004, Kusters et al. 2007, Akiefnawati et al. 2010). The challenge is to find ways to do the latter without compromising longer term, morefundamental solutions.
6 HOW TREES AND PEOPLE CAN CO-ADAPT TO CLIMATE CHANGE
6. The institutional tendency to segregate issues makes attribution a key concern and creates
obstacles for multi-functionality
There is little gain to be expected from seeking clear distinctions between 'current climatevariability' and 'climate change' or reducing current versus future vulnerability. Public funding for'adaptation' and 'poverty reduction' may well have to be pooled to be successful in either. Yet,current policy frameworks require the distinctions to be made.
When national and multinational administrators begin to regulate and implement policies thathave been set in global arenas, issues that straddle two or more policy 'boxes' tend to be avoidedrather than welcomed for contributing to overall efficiency. The manager of one policy area will say, 'That issue is fine, but the other policy area can pay for it'. The creation of adaptation funds in the global arena of the UNFCCC has lead to the separation of 'adaptation development' from'regular development' and of 'climate change' from 'current climate variability and extremeevents'. The administrative needs to continue to split issues into these kinds of thematic areas will likely lead to more debate rather than action. Rather, somehow we need to ensure that climateadaptation becomes a part of holistic poverty-reduction strategies rather than treating it as a separate area.
7. Current public focus on 'forest' still ignores the trees in the rest of the landscape. More
integrated approaches to the landscape and livelihoods issues are needed
The discussion about 'reducing emissions from deforestation and forest degradation' (REDD) has gradually expanded its scope, with a 'plus' (REDD+) now referring to forest restoration, but it is stilldependent on the concept and definition of 'forest'. Scientifically, more holistic carbon accountingand the inclusion of whole landscapes is needed, which will also help avoid perverse incentivesand achieve fairness (Suyanto et al. 2009, Ekadinata et al. 2010, van Noordwijk et al. 2010). Often,governments' rulings about 'forest', or all land managed by forestry authorities, are at odds with actual tree cover on the land. There are many 'empty forests' but also many 'trees outside forest'.Realistic, field-corroborated assessments of tree cover and changes to the cover often revealconditions on the ground that are quite different from those shown in official maps.
8. Although the relevant policy issue is climate change, the issue that is open to empirical
analysis and direct relevance is climate variability
In dealing with local and public perceptions, climate change and climate variability are hard to separate. Socio-ecological systems (some may prefer the more comprehensive ‘socio-ecological-political-economy systems’) that are robust under current levels of variability (can deal with 'extreme' dry as well as wet years) are probably able to deal with most of the predicted climatechanges, while those systems that cannot deal with current variability need to become morerobust, regardless of climate change.
Current focus is on climate change yet the current issue is climate variability, so if you can deal with present extremes of climate variability you're on the right track for climate change in the future; if you can't, your priority issue is the current extremes.
9. Climate change should be integrated into the curricula of tertiary agricultural and forestry
institutions as a matter of urgency
As summarised by Chakeredza et al. (2009), concrete scientific data based on African and Asian experience needs to be included in the curricula of tertiary institutions teaching agriculture and forestry. Suggested areas of emphasis follow.
7REDUCING VULNERABILITY IN MULTIFUNCTIONAL LANDSCAPES

�The implications of climate change for local people's livelihoods and the world economy
�The causes of global warming and projections for change under different scenarios
�The need to maintain agro-biodiversity in a changing climate
�Agro-biodiversity adaptation options
�Approaches for putting adaptation strategies into practice in research, extension and policy implementation
�Bio-energy and the need for reduced carbon emissions through alternative static and mobile bio-energy production that includes socio-economic considerations
�Options available to different groups of people to adapt to the adverse effects of climatechange
�Current thinking on climate-change mitigation strategies
�Geo-engineering concepts and practices for reduction of carbon emissions
�Global policy on climate change and global policy frameworks
The material can be set as a separate subject or integrated into the various agricultural and naturalresources management subjects. The intention should be to build a cadre of academics and researchers with knowledge and skills related to the key agroforestry climate-change issues who can advise policy makers, educational institutions and practitioners.
10. Rewards for environmental services will usually require appropriate national legislation to
clarify rights and responsibilities. A range of paradigms is now available for reference
A number of countries have started legislation on 'rewards for environmental services', 'biofuel' and/or 'reducing emissions from deforestation', without clarifying the relationship between these 'new' issues and the existing rules around resource access. National legislation and traditional,local rules are often in conflict over resource management. To be fully effective, the broadersystemic connections between climate change and existing institutions have to be carefullymapped.
The agroforestry and mitigadaptation hypothesis may need to be split into unitary statements, as indicated by the colour coding, to review the evidence.
Evidence supporting the hypothesis
Investment in institutionalising rewards for
the environmental services that are provided
in multifunctional landscape s with trees is a
cost-effective and fair way to reduce
vulnerability of rural livelihoods to climate
change and to avoid larger costs of specific
‘adaptation’, while enhancing carbon stocks
in the landscape.
Figure O.5. Colour-coding the agroforestry and mitigadaptation hypothesis into discrete elements
8 HOW TREES AND PEOPLE CAN CO-ADAPT TO CLIMATE CHANGE

The hypothesis as a whole requires confirmation of all eight statements (A–G) to be true, not only in general or on average, but for any specific situation where the hypothesis is to be used as the basis for policy decisions. The following summary of evidence may require the reader to first readthe explanatory chapters for details of the terminology used.
Overall, the hypothesis has received qualified support from existing evidence, but virtually all sub-statements require site- and context-specific verification to test that generalisations apply.
Chapter K provides a discussion of the main knowledge gaps and critical uncertainties. The relevance of tree diversity (between and within species) emerged as a topic where reasonableinference can be made at a general level but which requires a lot of local detail on the trade-offs to be specified. Methods for downscaling global climate predictions exist but they provide statisticalprobability distributions rather than certainty. We also saw that new approaches to maintain and enhance multifunctionality of landscapes exist but that they require local-level learning. Tools,methods and approaches exist to do so, while a number of landscapes in the tropics are ahead of the general learning curve in trying out these ideas. Thus, four priority areas can be indentifiedthat we need to test and disseminate more widely but which have a credible concept and replicable methods.
1. Cost-effective methods and local capacity-building for site-specific appraisals.
2. Operational rules for use of climate-change adaptation funds and their relationship with payments for environmental services' mechanisms.
3. Cross-border movement of tree germplasm within the rules set by the Convention on Biological Diversity, which protect national ownership rather than stimulate use.
4. High carbon-stock livelihoods options for the LAAMA–NAMA frontier.
‘Critical uncertainties’ that deserve a focussed research effort
Figure O.6. Unitary statements drawn from the agroforestry and mitigadaptation hypothesis
9REDUCING VULNERABILITY IN MULTIFUNCTIONAL LANDSCAPES
A. Multifunctional landscape mosaics with trees provide environmental services
B. Rewards for environmental services can enhance multifunctional landscapes with trees
providing such services
C. Rewards for environmental services require institutionalising and funding
D. Vulnerability of rural livelihoods to climate change needs to be reduced
E. Specific ‘adaptation’ is costly when compared to overall vulnerability reduction
F. Carbon stocks in the landscape can be enhanced through multifunctional landscapes
with trees
G. Investment in institutionalising is a cost-effective and fair way to achieve goal
D (relative to its alternative as mentioned in E)

Statement Evidence Approaches to local verification
A. Multifunctionallandscapes with treesprovide environ-mental services
Generally true, butand type of environmental service, thelocal relevance of that service and causallinks with trees; some trade-offs amongenvironmental services
specific to the context A suite of rapid appraisal tools isready for use and a synthesis ofenvironmental services' deliveryby specific agroforestry systems isunderway
B. Rewards for theenvironmentalservices can enhancemultifunctionallandscapes with treesproviding suchservices
In many cases, environmentally friendlyagroforestry systems have competitors thatare less friendly to environmental servicesbut more profitable, so basic ‘additionality’criteria are met (that is the environmentalservices cannot be taken for granted) butactual enhancement depends oninstitutional design (point C). Crowding outof social norms is a valid concern.
Basic economic analysis and trade -offs between alternative land -useoptions across environmentalservices and returns to land andlabour use mainstream agriculturaleconomics and standardisedenvironmental services’ protocols.Early warning signs on the risk of‘crowding out’ are needed
C. Rewards forenvironmentalservices requireinstitutionalising andfunding
Three alternative paradigms —CES, COS andCIS—have been framed (van Noordwijk andLeimona 2010) , with consequences forinstitutionalisation. Context-specificchoices need to be made
‘Decision trees’ for matching theinstitution to context are availablefor testing and use
D. Vulnerability ofrural livelihoods toclimate change needsto be reduced
Actual evidence is not strong but thestatement is generally held to be true; if‘change’ is taken to include ‘variability’there is evidence from many situations
Retrospective studies of responsesto past variability and ‘extremeevents’ can combine recalls withharder data, includingdendrochronology
E. Specific ‘adaptation’is costly whencompared to equalvulnerability reduction
For many situations, including publichealth, the claim that prevention is lesscostly than cure is supported b y data; inclimate response there is less evidence oncosts, but analysis of NAPAs suggest ten-fold lower project cost s
While the costs of preventionactions are generally clear, theavoided costs are a challenge;insurance companies have ways tofind numbers they use for chargingpremiums and still make a profit
F. Carbon stocks in thelandscape can beenhanced throughmultifunctional land-scapes with trees
Strongly supported by data, unless thecomparator land cover (for example‘degraded carbonforest’) has higherstocks than is normally acknowledged
In restoration contexts, theexpected carbon stocks are readilypredictable once tree growth dataand tree–site matching details areknown
G. Investment ininstitutionalising is acost-effective and fairway to achieve goal D(relative to itsalternative asmentioned in E)
The start-up costs of institutions aregenerally higher than acknow ledged orexpected and there is uncertainty of scaling(fixed versus variable cost structures).Transaction costs can be contained if hypeis avoided and institutions are carefullymatched with context
Tools for obtaining and comparingperspectives on fairness versusefficiency exist (FERVA method) andhave been field test ed. Lessons arebeing learnt on ‘prototypes’ butpath dependency is important forexpansion
Table O.1. Assessment of unitary statements drawn from the agroforestry and mitigadaptation hypothesis
10 HOW TREES AND PEOPLE CAN CO-ADAPT TO CLIMATE CHANGE

There are several frontiers where we can begin to see the emergence of a science of agile sustainability (‘sustainagility’).
1. ‘Insurance risk’ can be used as argument for maintaining and expandingmultifunctionality rather than continuing to create short-term, specialised landscapes.
2. New approaches are needed to integrate the space-time dynamics of landscape functions in socio-ecological systems nested within global change in markets and climate.
3. A more detailed functional interpretation is needed of tree diversity in dynamic landscapes, quantifying the trade-off between selection targeting greater short-termbenefit (‘fitness or adaptability’) versus the costs of losing adaptability.
4. The practicality of combining, with nested scales, the three paradigms of co-investmentand risk sharing (CIS), offsetting opportunity costs (COS), and optimal threat theory forcommoditised environmental services (CES) needs to be tested.
5. Opportunities for enriching public perceptions of climate–landscape–livelihoodscausality and the actual levels of choice beyond current stereotypes of ‘deforestation’and ‘eco-agriculture’.
1. Shift the burden of proof: intensification options that are based on simplification of landscapes, coarsening of the patterns and removals of trees should be considered to increase human vulnerability to climate change until or unless a site-specific case has been made that proposed interventions are safe. Programmatic and project-basedenvironmental impact assessments, where these exist and are used, may need to be adjusted to location-specific, climate-change forecasts.
2. As time-consuming, costly and inefficient as they may appear to be, multistakeholderdialogues, consultations and negotiations are needed for decisions about landscape-scale changes, especially with current understanding of mitigation and adaption options still incomplete.
3. Removing economic and institutional (‘permits’) barriers to the active use of trees on farms and elsewhere in the landscape is likely to serve both mitigation and adaptationgoals, except in areas where low rainfall necessitates caution if considering increasingtree cover.
4. Re-evaluation of the functionality of existing institutions that use the ‘forest’ concept as their primary identity and that may create unnecessary dichotomies and hurdles in a functional perspective on the landscape as a whole and the goods and services it provides.
5. Support the synergy of mitigation and adaptation policies and relax ‘additionality’ rules that reduce overall efficiency.
1. Know your landscape, its historical roots and its current trees.
2. Appreciate the goods and services the landscape provides and their trade-offs.
3. Challenge perceptions of ‘natural’ disasters and ‘extreme events’ and quantify risks.
4. Explore how downstream stakeholders in landscape function can become co-investors.
5. Understand strengths/weaknesses/opportunities/threats across multiple, interactingstakeholders and consequences this has for branding, bargaining and negotiation.
‘No-regrets’ consequences for policy: multiscale institutional answers to
mitigadaptation
‘No-regrets’ consequences for practice: a logical sequence of steps
11REDUCING VULNERABILITY IN MULTIFUNCTIONAL LANDSCAPES

Practical support to farmers to obtain carbon revenues for tree
planting Ylva Nyberg
The Kagera River Basin in East Africa contributes a third of the water that flows into LakeVictoria. It is under pressure from over-grazing, agriculture and fires that cause land degradation. Within the Basin, in Nyaishozi Ward in Tanzania, 24 smallholders are piloting a carbon finance project called ‘Trees sustain life’, which was developed and implemented by
3the Vi Agroforestry Programme . The farmers choose between four agroforestry systems in which to establish trees: woodlots, dispersed inter-planting, fruit orchards and boundary plantings. Farmers receive payments for carbon sequestration based on a contract that specifies plot size, the number of trees planted and the species cultivated.
4 Vi Agroforestry is a Swedish NGO working with smallholder farmers in the Lake Victoria Basin. Their mission is to make agroforestry and enterprise development engines for economic growth and poverty reduction. For further information, please contact [email protected] or see www.viskogen.se
Of the revenue obtained from carbon sequestration, 60% will go directly to farmers, 30% pays for agroforestry advisory services provided to farmers through Vi Agroforestry and the remainder is used to advertise to buyers the availability of investment options in carbon storage as well as for a certification fee. Carbon credits will be marketed on the voluntarymarket, especially targeting companies in Sweden that want to compensate for their emissions, beyond compliance to national emission reduction commitments. Farminghouseholds will receive their payments in five instalments over a 10-year period. The first
Table O.2. Summary of the agroforestry systems promoted by Vi Agroforestry in the Lake Victoria Basin
Agroforestrysystem
Benefits of system Tree species Spacing
Boundary planting Land demarcation,windbreak, soil erosioncontrol, shade/shelter,poles and firewood
Markhamia lutea, Maesopsis eminii,Casuarina equisetifolia, Albizia lebbeck,Grevillea robusta, Acacia polyacanthaOther indigenous tree species likeKhaya nyasica and Albizia spp.
Staggered rows withspacing of 3 x 2 m.Thinning between yrs 4–15and harvest in yrs20–25
Dispersedinterplanting
Production of firewood,medicine and other non-timber forest products.Improved soil fertility, soiland water conservationand enhancedbiodiversity
Markhamia lutea, Maesopsis eminii,Albizia lebbeck, Albizi a coriara, Acaciapolyacantha, Acacia nilotica,Acrocarpus fraxinifolius
Plant 200 trees/ha. Growto maturity and harvestafter 30 years. Pruningand weeding required
Fruit orchard Fruits for consumptionand sale. Soil and waterconservation andenhanced biodiversity
Mangifera indica, Citrus limon, Perseaamericana
Mango and avocadoestablished at23 trees/ha, lemon at156 trees/ha. Pruning andweeding required
Woodlot Production of timber,firewood, medicine andfodder. Soil and waterconservation, enhancedbiodiversity
Maesopsis eminii, Casuarinaequisetifolia , Podocarpus spp.,Markhamia lutea, Acacia nilotica,Albizia lebbeck, Acacia polyacantha,Cedrela odorata
Spacing 3 x 3 m or 4 x 4 m(depending on species).Thinning betweenyrs 6–10 and harvest inyrs 12–18
Intermezzo 1.
12 HOW TREES AND PEOPLE CAN CO-ADAPT TO CLIMATE CHANGE

payment, 30%, is an upfront payment to invest in seedlings and labour, whereas the further payments are delivered after the first, third, fifth and tenth years in connection tomonitoring of tree development. Contracts can be bought and sold between farmers, with buyers then bound by the same conditions. Losses through disease, flooding, storm, fireand other events are possible and are factored in through a 20% buffer in expected storagecapacity.
The carbon sequestered in the project will be certified through the Plan Vivo system,which also takes 4% for certification. An example of a farmer currently benefiting from the project is Anna, 60, her husband and their extended family. They have set aside half of their 3 hectare of land for intercropping with Maesopsis eminii. In another case, Evan and his wife, who have 6 hectare of land, have assigned over a hectare for planting a woodlotof Acrocarpus fraxinifolius, Cedrela odorata and Maesopsis eminii. When Evan is paid forthe carbon, he wants to give his children a better education and to hire more labour forthe farm. In three years time it is planned that around a tenth of households in Nyaishozi(around 900 families) will be part of the project and will benefit from carbon revenues.
REDUCING VULNERABILITY IN MULTIFUNCTIONAL LANDSCAPES 13
Figure O.7 The degraded hills in Kagera region, Tanzania. Photos: Johanna Liljenfeldt(left) and Bo Lager (both on the right)


This section introduces some basic concepts surrounding the climate system, climate change and climate variability. We will provide some insights into the challenges of climate modelling and whatthe inherent uncertainty really means for us, before exploring the way adaptation has so far been discussed and institutionalised (Figure A.1).
Climate change, climate variability and
adaptation options
Section I
Henry Neufeldt, Isabel van de Sand, Johannes Dietz, Minh Ha Hoang, Thomas Yatich,
Rodel Lasco and Meine van Noordwijk
Figure A.1. The co-adaptation wheel: climate quadrant
A. Climate change and climate variability
Chapter summary
• Climate change is happening and will require strong mitigation action to achieve the 0goal of keeping average global warming to 2 C above pre-industrial levels. Agriculture,
forestry and land-use change contribute to climate change with about 25% of totalemissions of greenhouse gases. But while reduction of deforestation rates is an effectivemitigation mechanism, controversy arises regarding biofuels and reduction of emissions from agricultural lands.

• Climate change is already detectable through statistical analysis of long-term weatherpatterns, but no single weather event, no matter how extreme, can be associated with climate change as it is a fundamental characteristic of the climate system to show variation. Climate variability can, with sufficient accuracy, be linked to a few large-scaleclimate patterns that may change in the future and hence affect climate variability.
• Modelling efforts have by now reached a level of complexity that allows us to say much about changes of the climate in the future although all of the global circulation models also show significant deviations in their simulations. While temperature changes arefairly evident across the range of models, changes in precipitation are still very difficult to foresee. Another challenge is downscaling of the global model results to scales thatare useful for land-use planning at local and regional levels.
The Earth’s climate system is essentially driven by the sun’s radiation. It is a complex, interactivesystem consisting of the atmosphere including clouds, the land surface, oceans, snow and ice, and other factors. About one third of the energy that arrives at the top of the atmosphere is reflectedback to space (albedo). Most of the albedo is caused by clouds and aerosols as well as snow, ice and other light-coloured surfaces. The energy that is not reflected is absorbed and causes the Earth to heat up. The Earth itself thus radiates, but mostly in the infrared (whereas most of the radiation of the sun is in the ultraviolet to visible range). Over the long run the same amount of energy that is absorbed by the Earth’s surface is also released again through various processes(Figure A.2).
The climate system evolves over time, either through internal or external factors (called forcings).Examples of external forcing are: a) changes in the Earth’s orbit that alter the incoming solar radiation; b) volcanic eruptions that change the albedo; or c) burning of fossil fuels that change the chemical composition of the atmosphere. These forcings can change the Earth’s climate for periods lasting from days (for example, particles in the troposphere) to millennia (orbital changes) and canhave profound effects on life on Earth. During the ice ages, which were mainly caused by regularorbital changes (the so-called Milankovitch cycles), for instance, global average temperatures were
0about 5–6 C below current average temperatures and sea levels were 80–120 m below present. A 0large volcanic eruption can reduce the global temperature by about 0.5 C for as much as a year or
more.
The ‘greenhouse gas effect’ is vital for the development and maintenance of life on Earth: without 0it temperatures on Earth would be on average 19 C below freezing point. In summary, the
greenhouse gas effect can be explained like this: some of the sun’s short-wave radiation is absorbed by the surface of the Earth and reemits mostly in the infrared band. This radiation is captured by water molecules as well as carbon dioxide and other trace gases, which are
0collectively called greenhouse gases, thereby heating up the Earth’s atmosphere to about 14 C on a global average. Owing to the similarity with the heating effect inside a greenhouse (though by different physical processes), this additional warming is called the greenhouse gas effect. Human action has increased the amount of greenhouse gases in the atmosphere, in particular, carbon dioxide. The additional warming caused by these emissions is called the ‘anthropogenicgreenhouse gas effect’ and is the cause of the climate change we are currently dealing with.
The climate system and the greenhouse gas effect
16 HOW TREES AND PEOPLE CAN CO-ADAPT TO CLIMATE CHANGE

Anthropogenic climate change
The fourth assessment report of the Intergovernmental Panel on Climate Change (IPCC 2007a) presented further evidence that current climate change is to a large extent due to human activityand will profoundly alter the living conditions for all humans, flora, fauna and ecosystems.
The main sectors and gases contributing to the changing climate through ‘anthropogenic’greenhouse gases are depicted in Figure A.3. It shows that carbon-dioxide-equivalent (CO e)2
concentrations have been rising over the past decades and that carbon dioxide (CO ) emissions, 2
mainly from fossil fuels and deforestation, contribute to over three quarters of all emissions.
Figure A.2. Estimate of the Earth's annual and global mean energy budget. Source: Kiehl and Trenberth (1997)
Figure A.3. Global anthropogenic greenhouse gas emissions (GHG): a) Global annual emissions of anthropogenic GHGs from 1970 to 2004; b) Share of differentanthropogenic GHGs in total emissions in 2004 in terms of carbon dioxide equivalents (CO e); c) Share of 2
different sectors in total anthropogenic GHG emissions in 2004 in terms of Co e (forestry includes 2
deforestation). Source: IPCC 2007b
REDUCING VULNERABILITY IN MULTIFUNCTIONAL LANDSCAPES 17
b)
c)

Methane and nitrous oxide (N O) together are responsible for most of the remaining radiative
forcing. Although emissions are produced through non-land-use-related sectors (energy supply,industry, transport and buildings), agriculture and forestry (including land-use change) together
5add up to over 30% of current emissions .
Future greenhouse gas emissions will continue to rise as long as no effective mitigation policies are0put into place. In order to stabilise global average temperatures at no more than 2 C above pre-
6 7industrial levels with greater than 70% chance of success , current projections indicate that the 8total greenhouse gas concentration of the atmosphere must be stabilised at below 400 ppm Co e .v 2
Achieving such an ambitious target is technically feasible and economically viable, but will requireforceful and internationally coordinated action in the next few years (Knopf et al. 2010). However,current emissions are at the upper end of all projections and continuation of such a ‘business-as-
0usual’ trajectory would likely lead to 3–4 C above pre-industrial levels (Figure A.4).
While agriculture and forestry are vulnerable to climate changes, these sectors also contributestrongly to climate change. Within these sectors, major emissions occur from clearing forests forother land uses, use of nitrogen-based fertilisers, senescence of peat soils used for agriculture,topsoil degradation and erosion, methane emissions from livestock and rice production as well as energy-related emissions such as irrigation, heating, fertiliser production and feed. Owing to strongdrivers like population growth, a rising share of animal products in the diet and continued demand for forest products, the emissions from land-use-based sectors will continue to rise in a business-as-usual scenario. In order for agriculture and forestry to effectively contribute to climate-changemitigation, deforestation must be reduced and eventually stopped (while meeting the demands forforest products), productivity must rise (relative to land use and emissions), biofuel productionmust increase (without competing for agricultural and forest lands) and land degradation must be stopped. Next to technological advances such as plant breeding and bioenergy conversion,improved management options such as conservation agriculture, minimum tillage, drip irrigationor agroforestry systems can significantly contribute to greenhouse gas emission reductions.However, to achieve emission reduction while raising food security and reducing its climatevulnerability an integrated approach is needed to address the multiple complexities.
2
5 Recent recalculations have reduced the contribution of emissions from forestry to around forestry 12% (Canadell et al.2007), such that overall emissions from agriculture, forestry and land-use change add up to 25.5%. Reasons for this reassessment are rising emissions from developing countries, particularly China, and a reduction of deforestation rates,mainly in Brazil.6 0 0 When referring to the 2 C stabilisation target, we refer to a global average temperature that is less than 2 C above pre-
0industrial levels (normally 1860). Considering that we are currently already nearly 0.8 C above that value and arecommitted to something in the order of another 0.6 °C through past emissions that are not yet apparent owing to the considerable inertia of the global climate system, the temperature increase related to future emissions may not be higher
0than another 0.6 C over the course of this century.7 According to Hare and Meinshausen (2006), there is about a 70% chance of achieving the target for a 400 ppm CO e, a v 2
50% chance with 450 ppm CO e and a 25% chance with 500 ppm CO e.v 2 v 2
8 The chance of reaching the 2 °C target falls with increasing GHG concentrations in the atmosphere. The totalconcentration of greenhouse gases can be expressed in terms of the radiative forcing (RF) of all gases as if it was caused by CO alone (the so-called ‘CO -equivalent concentration’ or CO e). The current net RF of the atmospheric components is 2 2 2
highly uncertain but probably similar to the current CO concentration, that is, 386 ppm (IPCC 2007). 2 v
18 HOW TREES AND PEOPLE CAN CO-ADAPT TO CLIMATE CHANGE

Climate variability
Climate is usually characterised as the ‘average weather’ of a specific place, that is, mean and variability of temperature, precipitation, wind and other relevant parameters and is normally measured over a period of 30 years. Anthropogenic greenhouse gas emissions are causing the climate to change over time.
However, in the short term, climate variability will by far outweigh climate-change effects. This is because the variability of the climate covers the full range of deviations from the mean state of the climate, including very hot or cold and very wet or dry periods. Individual weather events,including extreme events like floods or droughts, will also likely be affected by future climatechange and could become more frequent and more intense. Current weather extremes can sometimes give us a glimpse of the possible future, such that a season that is untypically hot now will be the average in the future. And, of course, atypically hot seasons then will be much hotterthan they are today.
Climate variability is defined as the variation of the mean state and other statistics (for example,standard deviation and the occurrence of extremes) of the climate on all spatial and temporalscales beyond that of individual weather events and may be due to natural processes within the climate system or to anthropogenic external forcing (IPCC 2007b). The climate variability of the future may be similar to that of today, but it could also change significantly. So even if the projection is for the future climate to be hotter and wetter, a season, a year or even a decade may
Figure A.4. Solid lines are multi-model global averages of surface warming for the scenarios A2, A1B and B1, shown as continuations of the 20th century simulations. Shading denotes ± 1 standard deviation rangeof individual model annual averages. The orange line shows the temperature evolution with year 2000 forcing held constant. The grey bars at the right indicate the best estimate (solid line) and the likely rangeassessed for six Special Report on Emissions Scenarios marker scenarios. Source: IPCC 2007b
REDUCING VULNERABILITY IN MULTIFUNCTIONAL LANDSCAPES 19

be cooler and drier than today. And even if the average amount of rain in a region does not change, climate change could lead to fewer but heavier rains and thus longer dry spells or to a change in the spatial distribution with more rain falling over the sea than over the land.
To a significant extent, climate variability can be described by fluctuations of a fairly small number of climate patterns, such as El Niño Southern Oscillation, North Atlantic Oscillation, ArcticOscillation, Northern Annular Mode, Southern Annular Mode, Pacific-North American Pattern and Pacific Decadal Oscillation. Changes in the fluctuations of these climate patterns will likely haveeffects on the distribution and extent of the monsoonal rains, a decrease of subtropicalprecipitation due to the poleward movement of the transition zone and possibly more and stronger tropical storms. The extent to which these patterns can be described accurately with today’s generation of climate models is limited and remains an area of intense research, but
thseveral 20 century changes can be viewed as alterations of these distinct climate patterns (IPCC 2007b).
Figure A.5. Temperature patterns in the Indian (IOD) and Pacific (El Niño) oceans that affect rainfall in the adjacent land areas. Source: http://www.jamstec.go.jp/frcgc/research/d1/iod/ogcm1.html
Another distinction to be made is related to the frequency and intensity of extreme weatherevents, such as droughts or floods. Extreme weather events are responsible for the majority of direct climate impacts and can have disastrous effects on human health and wellbeing and on the economy. No individual extreme event can be directly attributed to climate change because thereis limited knowledge (records generally date back no more than 150 years) about how extremeweather events have occurred in the past, but in some cases it is possible to assign the probabilitywith which an event has been affected by climate change. Figure A.7 illustrates how a fairly small shift could affect weather events at the upper and lower end of the probability distributionfunction.
20 HOW TREES AND PEOPLE CAN CO-ADAPT TO CLIMATE CHANGE

Box A.1
Teleconnections and repetitive patterns
The El Niño/La Niña effect, technically known as the El Niño Southern Oscillation (ENSO), which is linked to the temperature difference across the Pacific Ocean between the west coast of Peru and Southeast Asia, has become part of common understanding of climate variability. Yet there are similar temperature anomalies in other oceans. The temperature difference across the Indian Ocean, known technically as Indian Ocean Dipole (IOD), influences the South Asian monsoon as well as weather in East Africa and the western part of Indonesia. In the ‘IOD+’ mode there are abnormally warm sea surface temperatures in the western Indian Ocean, with long dry seasons in Indonesia and heavy rainfall over East Africa. When the ENSO and IOD patterns coincide, which is not always the case, extreme droughts and flooding may be the result, as in the 1997/8 period. There is reason to believe that global warming effects on the western Indian Ocean have increased IOD variability and that this may have replaced the ENSO as the major driver of climate patterns over the Indian Ocean region.
While a process-based understanding of ‘teleconnections’ is slowly emerging, empirical tools to pick signals and explain rainfall variability relative to global phenomena are critical. One such approach is the ‘wavelet analysis’that has been used to show links between climatic variability to IOD and ENSO, among other factors (Jevrejeva et al. 2003, Grinsted et al. 2004). For the Nyando and Yala river basins, evidence emerged for repetitive cycles at quasi bi-annual scale, the ENSO time series and the solar cycle. Using rainfall data for the March–April–May and June–July–August periods (Figure A.6), repetitiveness of the different cycles was found at a level of 2–3, 5–7 (attributed to ENSO) and 11 years (attributed to the solar cycle).
Figure A.6. Wavelet power spectrum (Morlet Wavelet) factors influencing March–April–May (MAM) and June–July–August (JJA) rainfall at the Bondowaterclimate station in Kenya. Source: Yatich (in preparation)
REDUCING VULNERABILITY IN MULTIFUNCTIONAL LANDSCAPES 21

Figure A.7. Schematic showing the effect on extreme temperatures when the mean temperature increases, for a normal temperature distribution. Source: IPCC 2007b
Climate models, scenarios and downscaling
Future climate is nowadays projected by a host of different general circulation models (GCMs). These vary in their degree of sophistication from simple climate models that allow rapidestimation of climate responses to a wide range of emission scenarios through Earth-systemmodels of intermediate complexity and eventually to the most comprehensive atmosphere–oceangeneral circulation models (AOGCMs) that describe atmospheric, oceanic and land surfaceprocesses, as well as sea ice and other components, with a high level of spatial and temporalaccuracy (IPCC 2007b). There are over 20 AOGCMs and whilst comparable in their large-scaleddynamics, differences in their structure and the need to parameterise some processes lead todiverging climate projections. In addition, considerable uncertainties exist regarding net radiativeforcing of atmospheric components (there are warming and cooling agents and the processes of some agents are poorly understood) and particularly uncertainty of the climate sensitivity (essentially the temperature response of doubling radiative forcing), which is likely to be in the
0range of 1.5 C to 4.5 C with a best estimate value of about 3 C. This means that whilst aiming for0 02 C we should be prepared for 4 C (Figure A.4).
Scenarios of climate change have been defined to account for different potential developmentswith impact particularly on the emission pattern of greenhouse gases. In 2000, the IPCC definedsix future emission scenarios to be used in modelling activities for the third and fourth assessment reports (IPCC 2000). The distinction of the scenarios rests on assumptions of future global political,demographic, socioeconomic and technological developments, for example, the integration or division of the world, population growth and the ecological orientation of policies culminating in different greenhouse gas emission patterns (Table A.1).
Given their complexity and the uncertainties and different scales of input parameters, global circulation models are associated with a significant degree of uncertainty and hence projectionsalso differ between models (Figures A.8 and A.9). Current models’ projections can reach a spatialresolution of up to 1 degree ( km). This is sufficient at the global level but too coarse forregional climate projections and hence insufficient for regional impact studies. To obtain estimates
0 0
22 HOW TREES AND PEOPLE CAN CO-ADAPT TO CLIMATE CHANGE

of changes in climate at some particular location of interest, a model’s outputs are downscaled and may reach a spatial resolution of up to 5 km grids.
A wide variety of downscaling procedures exist but all require additional input data for calibration,such as long-term historic climate records or fine-scale digital elevation models. Owing to the limited availability of such data, the availability of downscaling and other regionally focusedstudies remains uneven geographically, particularly for extreme weather events.
A1: a more integrated world
� Rapid economic growth� Global population reaches 9 billion in 2050 before it gradually declines� New and efficient technologies spread quickly� Income and way of life converge between regions� Extensive social and cultural interactions worldwide
It is subdivided based on emphasis on technology and energy sources:
A1FI: emphasis on fossil fuels A1B: balanced emphasis on all energy sources
A1T: emphasis on non-fossilenergy sources
A1: a more integrated world
� Nations are self-reliant and operate independently� Population continues to increase� Regionally oriented economic development� Slower and more fragmented technological changes and improvements to per capita income
B1: a more integrated and more ecologically friendly world
� Rapid economic growth (A1), but with rapid changes towards a service and information economy� Global population reaches 9 billion in 2050 before it gradually declines (A1)� Material intensity reduced and clean and resource-efficient technologies introduced� Emphasises global solutions to economic, social and environmental stability
B2: a more divided but more ecologically friendly world
� Population increases continuously, but more slowly than A2� Emphasises local rather than global solutions to economic, social and environmental stability� Intermediate levels of economic development� Less rapid and more fragmented technological change than in A1 and B1
Table A.1. Assumptions of global development underlying the definition of the Special Report
on Emission Scenarios. Source: IPCC 2000
Figure A.8 shows that agreement between different models regarding precipitation change (that is,more or less rain) is lowest for the inner tropics. Hence, it is important to close the knowledge gap,especially for vulnerable regions in the tropics where long-term climate records are scarce. A promising approach is to resort to climate proxies reflecting historical climate (events). These include, among others, tree-ring analysis showing more or less favourable growth conditions, farmers’ accounts and newspaper articles of extreme weather events, lake sediment cores and prevalence of disease occurrences.
REDUCING VULNERABILITY IN MULTIFUNCTIONAL LANDSCAPES 23
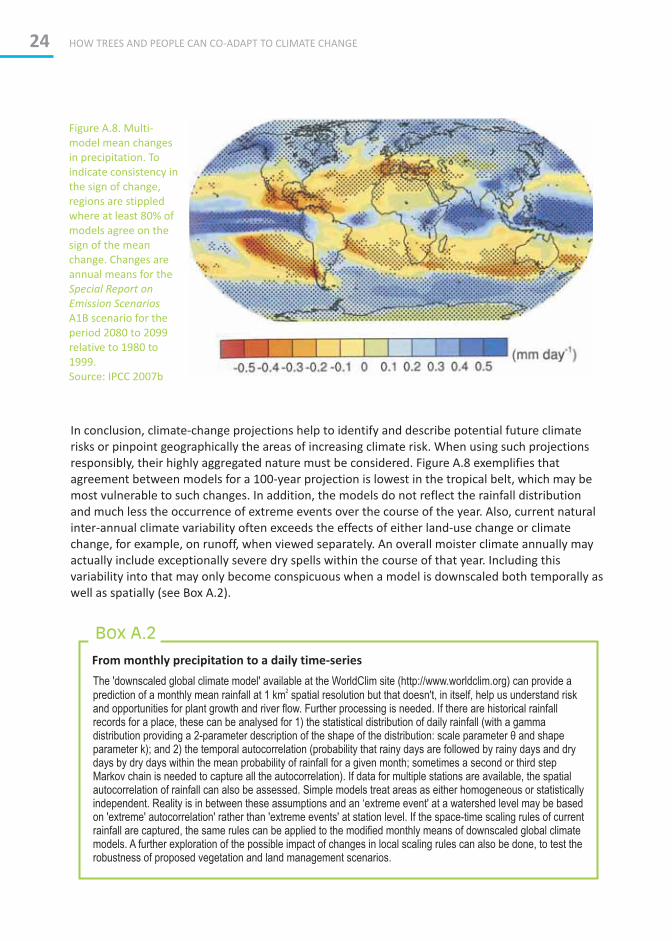
Figure A.8. Multi-model mean changes in precipitation. Toindicate consistency in the sign of change, regions are stippledwhere at least 80% of models agree on the sign of the mean change. Changes areannual means for the Special Report on
Emission Scenarios
A1B scenario for the period 2080 to 2099 relative to 1980 to1999.Source: IPCC 2007b
In conclusion, climate-change projections help to identify and describe potential future climaterisks or pinpoint geographically the areas of increasing climate risk. When using such projectionsresponsibly, their highly aggregated nature must be considered. Figure A.8 exemplifies thatagreement between models for a 100-year projection is lowest in the tropical belt, which may be most vulnerable to such changes. In addition, the models do not reflect the rainfall distributionand much less the occurrence of extreme events over the course of the year. Also, current naturalinter-annual climate variability often exceeds the effects of either land-use change or climatechange, for example, on runoff, when viewed separately. An overall moister climate annually mayactually include exceptionally severe dry spells within the course of that year. Including this variability into that may only become conspicuous when a model is downscaled both temporally as well as spatially (see Box A.2).
Box A.2
From monthly precipitation to a daily time-series
The 'downscaled global climate model' available at the WorldClim site (http://www.worldclim.org) can provide a 2
prediction of a monthly mean rainfall at 1 km spatial resolution but that doesn't, in itself, help us understand risk and opportunities for plant growth and river flow. Further processing is needed. If there are historical rainfall records for a place, these can be analysed for 1) the statistical distribution of daily rainfall (with a gamma distribution providing a 2-parameter description of the shape of the distribution: scale parameter è and shape parameter k); and 2) the temporal autocorrelation (probability that rainy days are followed by rainy days and dry days by dry days within the mean probability of rainfall for a given month; sometimes a second or third step Markov chain is needed to capture all the autocorrelation). If data for multiple stations are available, the spatial autocorrelation of rainfall can also be assessed. Simple models treat areas as either homogeneous or statistically independent. Reality is in between these assumptions and an ‘extreme event' at a watershed level may be based on 'extreme' autocorrelation' rather than 'extreme events' at station level. If the space-time scaling rules of current rainfall are captured, the same rules can be applied to the modified monthly means of downscaled global climate models. A further exploration of the possible impact of changes in local scaling rules can also be done, to test the robustness of proposed vegetation and land management scenarios.
24 HOW TREES AND PEOPLE CAN CO-ADAPT TO CLIMATE CHANGE

Climate variability, consequences and responses by farmers in the
Philippines
Intermezzo 2.
METHODOLOGY
Field observation
Household survey
Surveys were made of farmers’ experience with climate variability and extremes in Lantapan,Bukidnon (the Philippines). They reported the following as most important to them.
REDUCING VULNERABILITY IN MULTIFUNCTIONAL LANDSCAPES 25
Climatic event Frequency Percent
Prolonged rains 120 29
El Niño 115 28
Delayed onset of rainy season 91 22
Early onset of rainy season 60 14
La Niña 29 7
Early start of rains Response options
Increased yield for many farmers (+) Use of fertilisers and chemicals
Early cropping (+) Loan
No need to irrigate crops (+) Prepare for early cropping
Favourable in some crops like abaca and banana (+) Crop diversification
Appearance of blight and fungi (-)
Increased pests and diseases (-) Construct temporary drainage canal
Crops rot easily (-) Do nothing
Decreased yield for some farmers (-)
Late start of rains Response options
Crops dry up (-) Ask for help from government
Decreased yield (-) Water crops
Crops produced are of poor quality (-) Use early-maturing crops
Delayed planting (- ) Wait for rain
Short period of time that farmers can plant (-) Apply fertiliser and chemicals
Engage in off-farm work
Crop diversification
Pray

Figure A.9. Predicted cumulative frequency of watershed buffering relative to rainfall patterns in the Keji watershed in Southwest China, for a range of IPCC scenarios (compare Table A.1), time period and land-use change scenarios (only the highest and lowest three lines are shown). Source:Ma Xing et al. 2010
Intermezzo 3.
Climate variability, land use and climate change interact on river
flow
Global climate change will likely increase temperature and variation in precipitation in the Himalayas, modifying both supply of, and demand for, water. A recent study by Ma Xing etal. (2010) assessed the combined impacts of land-cover and climate changes on hydrological processes and a rainfall-to-streamflow buffer indicator of watershed function, using the Soil Water Assessment Tool, in the Keji watershed of the eastern Himalayas. The Hadley Centre Coupled Model Version 3 (HadCM3) was used for two IPCC emissionscenarios (A2 and B2) for 2010–2099. Four land-cover-change scenarios increased forest,grassland, crops or urban land use, respectively, reducing degraded land. The SWAT model predicted that downstream water resources would decrease in the short term but increasein the long term. Afforestation and expansion of cropland would probably increase actual evapotranspiration and reduce annual streamflow but would also, through increasedinfiltration, reduce the overland flow component of streamflow and increase groundwaterrelease. An expansion of grassland would decrease actual evapotranspiration, increaseannual streamflow and groundwater release, while decreasing overland flow. Urbanisationwould result in increases in streamflow and overland flow and reductions in groundwaterrelease and actual evapotranspiration. In the short and middle terms, land-cover change produced more effect on streamflow than climate change. The predicted changes in bufferindicator for land-use and climate-change scenarios reached up to 50% of the current (and future) range of inter-annual variability. Dealing with current climate variability remainsthe immediate target for climate-change adaptation in this catchment.
26 HOW TREES AND PEOPLE CAN CO-ADAPT TO CLIMATE CHANGE

B. Adaptation options for climate change
Summary
Adaptation in the context of mitigation
• The impact of climate change will mostly be negative and require adaptation in addition to measures against existing constraints of environmental degradation, poverty and food insecurity, lack of education, health issues and lack of functioning governancesystems and institutions.
• Adaptation to climate change is here understood as a broad concept to increaseresilience to climate variability and change through reducing vulnerability, targetedaction to be prepared for directional change and increasing adaptive capacity. Climate-change impacts will mostly be local but responses need to take place at local, nationaland international levels to address the challenges involved with equity, fairness,economic efficiency and environmental effectiveness.
• One option for achieving such resilience, especially among rural populations, is todiversify their cropping systems within, or between, farms leading to multifunctional landscapes. But farmers, government agencies and development organisations requiretraining to help them adopt these practices. By increasing woody biomass in the system,multifunctional landscapes also contribute to mitigation efforts and thereby provide a good example for synergies between adaptation and mitigation.
The extent of future climate change will strongly depend on the scope and ambition of mitigationactions undertaken to reduce greenhouse gas emissions in the next two decades. But even if
0global average temperature rise can be limited to 2 C, the impact of this will be great on smallislands and coastal zones and on human health, agriculture, forestry and water resources. We will have to deal with these changes through adaptation and/or by reversing the current trends that increase vulnerability and risk.
For a long time, adaptation to climate change was not talked about, rather, it was argued that ‘mitigation is the best adaptation’. However, as the realisation grows that climate change is not being readily brought under control and that people who contribute little to the overall problemare the most vulnerable, adaptation and mitigation are seen as complementary strategies.
Whilst the need for adaptation is clear, implementing adaptation in practice is complex because there is disagreement on how, when and where to act (Hulme 2009). First, because of uncertainties about local forms of the changes and their interaction with ongoing developmentefforts, the way to respond is highly disputed, including the roles of the public, private and informal sectors. Second, there may be as many perspectives on what to do when and where as there are scientific disciplines, even when the analysis of current trends is based on the same scientific evidence. Finally, local responses to global climate change depend on context and place, and include winners and losers. At which level, and how, to respond will affect lives and ecosystems and may lead to undesirable effects. These questions need to be taken into account to avoid a situation where adaptation efforts lead to greater harm than good. This has led to the idea of ‘no regrets’ options: things that have other reasons and rationales beyond climate change. To be effective, adaptation strategies for rural livelihoods need to be robust in the face of considerableand often unquantifiable uncertainties.
REDUCING VULNERABILITY IN MULTIFUNCTIONAL LANDSCAPES 27

The term ‘adaptation’ can refer to a process of continued change, and to ‘adaptedness’ as a state, based on features that were derived from adaptive processes. Adaptedness (whether a system ‘is adapted’) can be empirically assessed for a given set of conditions and their patterns of variability. Adaptation as a process can only be assessed in hindsight, but preconditions and predictors are known and refer to three steps: 1) Lifecycle and demographic shift per generation (implying microbes adapt faster than trees, which may yet be faster than elephants); 2) Levels of genetic diversity as substrate for selection (the more the better); 3) Predictability and continuity of environmental selection pressure (the more the better). The latter points to ambiguity in the relation between adaptedness and adaptation: higher genetic diversity due to variable selection pressures may reduce average ‘adaptedness’ of current generations but provide a better basis for future change. Natural history is full of examples of ‘over-adapted’ or ‘over-specialised’ species that became extinct whereas more basic forms had a chance to ‘radiate out’ under new conditions.
Box B.1
Adaptation concepts
Working Group 2 of the IPCC defines adaptation as ‘adjustment in natural or human systems in response to actual or expected climatic stimuli or their effects, which moderates harm or exploitsbeneficial opportunities’ (IPCC 2007b). Adaptation may include reducing and transferring risks, as well as building the capacity to make such changes in the future (see Table B.1). Adaptation toclimate change has been conceptualised as a continuum with activities ranging from a vulnerabilityfocus that addresses the underlying drivers of vulnerability to a more impact-oriented focus that includes measures or actions that reduce the impacts of climate change or takes advantage of them (such as dikes or irrigation measures) (McGray et al. 2007) (Figure B.1). Learning is an important aspect as it is required to respond to climate stimuli with the right measures or actions. Other important distinctions to be made in the context of adaptation are planned versus reactiveand public versus private adaptation.
Figure B.1. Adaptation as a continuum. Source: Klein (2008) adapted from McGray et al. 2007
Addressing Drivers
of Vulnerability
Activities seek to reducepoverty and other non-climatic stressors that make people vulnerable
Building Response
Capacity
Activities seek to build robust systems forproblem-solving
Managing Climate
Risk
Activities seek toincorporate climateinformation intodecision-making
Confronting
climate change
Activities seek toaddress impacts associated exclusivelywith climate change
Vulnerability focus Impacts focus
How high the local risk to climatic stimuli is and hence how strong the response has to be depends on three factors—hazard, exposure and vulnerability—and is often illustrated as a ‘risk triangle’ (Figure B.2a). A hazard is a climatic stimulus, such as increased frequency of drought or flood. However, for a hazard to become problematic, one must be exposed to it directly or indirectly. The climate risk rises with exposure to the hazard, for example, if people don’t live in the pathway of mudflows and landslides, they may not suffer; cities built on floodplains are vulnerable to flooding.
9Finally, those who are similarly exposed to any hazard will likely be differently vulnerable to its effects, for example, depending on the level of socio economic development (including quality of houses and buildings) and the sensitivity of the ecosystem. Hence, the climate risk will likely rise with growing vulnerability.
9 'Vulnerability' is in itself a fuzzy concept and difficult to define because it includes a number of indicators that are not necessarily evident; there are a range of definitions in use by different scientific communities, for example, vulnerability has also been conceptualised in terms of exposure, sensitivity and adaptive capacity (Adger 2006).
28 HOW TREES AND PEOPLE CAN CO-ADAPT TO CLIMATE CHANGE

Vulnerability to climate impacts depends on many factors. It can be conceptualised as an n-dimensional index, covering, for instance, ecosystem stability, livelihoods and institutions (FigureB.2b); other dimensions are likelihood of violent conflict (for example, Diamond 2005). The multi-dimensional index is particularly valuable to measure vulnerability over time and at differentspatial, social and political scales.
Table B.1. Differentiation of adaptation by response type. Source: Stern (2006) (modified)
Type of response to climate change
Autonomous (private) Policy-driven (public)
Short-run (reactive) �Spreading the loss, for example, pooling risk through insurance
�Retaining diversity in crops, plantingdates and other management decisionsto spread risk
�Making short-term adjustments forexample, crop planting datesstaggered
�Developing greater understanding of climate risks, for example, researching risks and carrying out a vulnerabilityassessment
�Improving emergency response, for example, early-warning systems
�Stimulating collective action andinsurance schemes
Long-run (planned) �Investing in directional adjustments if future effects are relatively well understood and benefits are easy to capture fully, for example, localised irrigation on farms
�Investing in climate resilience through planned diversity where direction and magnitude of future effects remains uncertain
�Investing to create or modify major infrastructure, for example, large reservoir storage, increased drainage capacity, higher sea-walls
�Avoiding the impacts, for example,land use planning to restrict development in areas of increasing aridity
floodplains or in
Which responses are taken depends strongly on the 'adaptive capacity' of those who areexperiencing the impacts. Lack of adaptive capacity is included in some definitions of vulnerability.In the context of land management, diversity can reduce vulnerability, for example, when farmerswith income from tree products in addition to crops may have a better ability to cope with climatestresses than farmers who rely on one crop for their living. Diversity can also enhance other aspects of adaptive capacity as it maintains options for change in the landscape. The adaptive
REDUCING VULNERABILITY IN MULTIFUNCTIONAL LANDSCAPES 29
Figure B.2a. The risk triangle shows risk as the product of hazard × exposure × vulnerability. Source: Crichton (1999)
Figure B.2b. Vulnerability to climate change framework. Source: Fraser (2007) (modified)

capacity and resource base for adaptation is influenced by the farmers' assets, the human and social capital in the community in which the farmer lives, the ecological resilience (or sensitivity) of the natural capital and by presence/absence of appropriate laws and institutions.
In the context of climate change, the term 'resilience' is commonly used to characterise an individual or a community's ability to cope with climate impacts and other external stressors.Frequently, resilience rises with adaptive capacity but it is expressed relative to targets and expectations. A low productivity crop may be able to cope with drought whereas a high productivity variety cannot. Given the need for crop improvements to satisfy growing foodproduction requirements, a high-resilience, low-productivity crop can be considered a form of mal-adaptation. But from the individual farmer's perspective, a drought-resistant, low productivity cropmay be the preferred survival strategy. This problem illustrates the need to design strategies whereprivate and public adaptation measures complement each other.
Finding the best responses to climate impacts is often a result of learning by doing. However, as climate impacts are mostly experienced locally, responses must be tailored to match the needs at the scale and time of impact and cannot be designed in a 'one size fits all' manner. Depending on the type of adaptation to climate change, that is, reactive or planned and public or private,responses will differ in scale and timing and can have strong distributional effects with implicationsfor equity and fairness as opposed to efficiency and effectiveness. Effective adaptation requiresdifferent approaches within a comprehensive and integrated framework, where bottom-up meetstop-down at international, regional, national, sub-national and community levels and where public and private sectors collaborate to achieve emission reduction and economic growth.
Table B.2 describes typical adaptation practices that people in rural areas rely on (Agrawal and Perrin 2008). The practices can be broadly classified as mobility, storage, diversification, communal pooling and market exchange. While the UNFCCC database shows no example of mobility as a strategy to cope with climate impacts, this has been used by herders and nomads in dry areas forcenturies, whereby conditions that cannot be tolerated are avoided. Storing follows a differentstrategy in the sense that otherwise unbearable conditions are bridged through the stored foodand water. Diversification is a totally different strategy and often goes hand in hand with marketexchange wherein rural populations attempt to hedge against the loss of one product by pursuingthe production (and marketing) of others. Finally, communal pooling can be considered a risk-sharing approach and makes use of the fact that the community can support the individual in difficult times (although there are limits to this kind of support depending on the extent of the extreme event and the number of community members affected). The database also showed that local institutions played crucial roles in enabling conditions that allowed households to deploy specific adaptation measures. It is clear from this that without functioning local institutions,adaptation measures become much more difficult to pursue. Finally, the database allows us to conclude that in rural, poor environments public and civic institutions are much more importantfor adaptation actions than private and market-based institutions (Agrawal and Perrin 2008).
International
Adaptation responses at the international level have been slow to develop compared to mitigationefforts, although adaptation has become more important over time. There are currently severalfunding mechanisms introduced under the climate-change regime (Global Environment FacilityTrust Fund; Least Developed Country Fund; Special Climate Change Fund; Adaptation Fund) and there are expectations of new funds. The aggregate value of the funds is only likely to cover the
Responses to climate change at international to local levels
30 HOW TREES AND PEOPLE CAN CO-ADAPT TO CLIMATE CHANGE
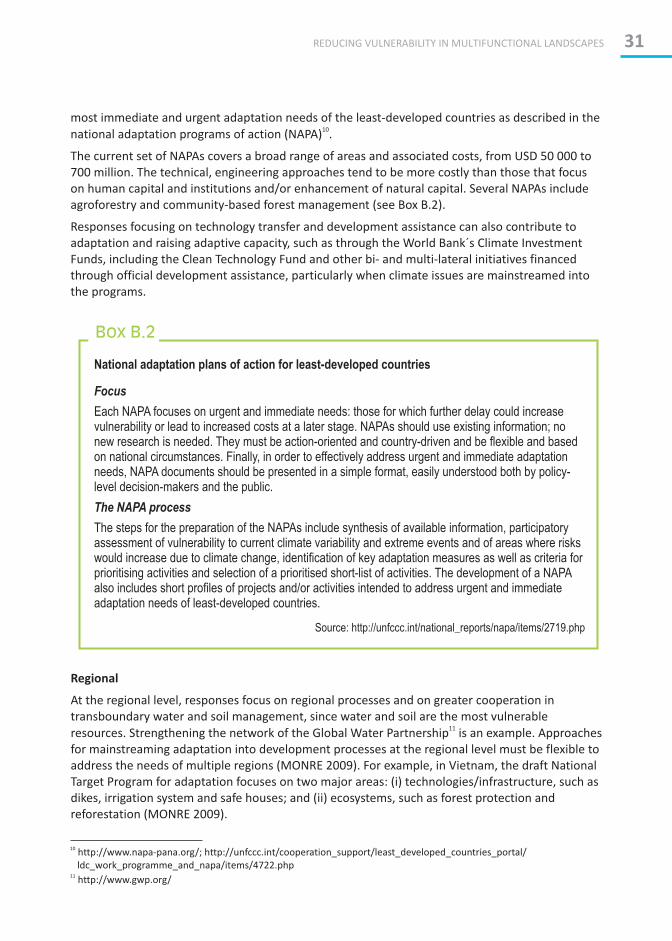
most immediate and urgent adaptation needs of the least-developed countries as described in the 10national adaptation programs of action (NAPA) .
The current set of NAPAs covers a broad range of areas and associated costs, from USD 50 000 to700 million. The technical, engineering approaches tend to be more costly than those that focuson human capital and institutions and/or enhancement of natural capital. Several NAPAs include agroforestry and community-based forest management (see Box B.2).
Responses focusing on technology transfer and development assistance can also contribute toadaptation and raising adaptive capacity, such as through the World Bank´s Climate InvestmentFunds, including the Clean Technology Fund and other bi- and multi-lateral initiatives financed through official development assistance, particularly when climate issues are mainstreamed intothe programs.
10 http://www.napa-pana.org/; http://unfccc.int/cooperation_support/least_developed_countries_portal/ ldc_work_programme_and_napa/items/4722.php11 http://www.gwp.org/
Box B.2
National adaptation plans of action for least-developed countries
Focus
Each NAPA focuses on urgent and immediate needs: those for which further delay could increase vulnerability or lead to increased costs at a later stage. NAPAs should use existing information; no new research is needed. They must be action-oriented and country-driven and be flexible and based on national circumstances. Finally, in order to effectively address urgent and immediate adaptation needs, NAPA documents should be presented in a simple format, easily understood both by policy-level decision-makers and the public.
The NAPA process
The steps for the preparation of the NAPAs include synthesis of available information, participatory assessment of vulnerability to current climate variability and extreme events and of areas where risks would increase due to climate change, identification of key adaptation measures as well as criteria for prioritising activities and selection of a prioritised short-list of activities. The development of a NAPAalso includes short profiles of projects and/or activities intended to address urgent and immediate adaptation needs of least-developed countries.
Source: http://unfccc.int/national_reports/napa/items/2719.php
Regional
At the regional level, responses focus on regional processes and on greater cooperation in transboundary water and soil management, since water and soil are the most vulnerable
11resources. Strengthening the network of the Global Water Partnership is an example. Approachesfor mainstreaming adaptation into development processes at the regional level must be flexible toaddress the needs of multiple regions (MONRE 2009). For example, in Vietnam, the draft NationalTarget Program for adaptation focuses on two major areas: (i) technologies/infrastructure, such as dikes, irrigation system and safe houses; and (ii) ecosystems, such as forest protection and reforestation (MONRE 2009).
REDUCING VULNERABILITY IN MULTIFUNCTIONAL LANDSCAPES 31

Table O.1. Examples of NAPA project titles linked to agriculture, with tentative classification into threestrategies: technical engineering, green infrastructure and adaptive land-use. Source: http://unfccc.int/files/cooperation_support/least_developed_countries_portal/napa_project_database/ (October 2009)
through appropriate tech-
Engineering solutions to
quantified climate change
Green infrastructure for reducing
vulnerability
Reducing vulnerability of
land use
Realising food security throughmulti-purpose, large-scalewater development project inGenale Dawa Basin in Ethiopia
Reduction of climate changehazards through coastalafforestation with communityparticipation in Bangladesh
Continue the slash-and-burneradication program andpermanent job creationprogram in Lao PDR
Reducing the vulnerability ofcoastal urban areas (Monrovia,Buchanan) to erosion, floods,siltation and degradedlandscapes in Liberia
Promotion of on-farm andhomestead forestry andagroforestry practices in arid,semi-arid and dry sub-humidparts of Ethiopia
Improving food security indrought-prone areas bypromoting drought-tolerant crops in Tanzania
Development and improvementof community irrigationsystems in Cambodia
Climate-change adaptation throughparticipatory reforestation on MtKilimanjaro in Tanzania
Promoting drought/cropinsurance program inEthiopia
Implementation of technicalinfrastructure for protection ofthe coastal region in Senegal
Production of bio-pesticides inCambodia
Construction of flood shelterand information andassistance centre to copewith enhanced recurrentfloods in major floodplainsin Bangladesh
Rehabilitation of Upper Mekongand provincial waterways inCambodia
Environmental conservation andbiodiversity restoration innorthern Kordofan as a copingmechanism for rangelandprotection under conditions ofincreasing climate variability inSudan
Development andimprovement of small-scaleaquaculture ponds inCambodia
Rehabilitation of aquaculturesites in Mali
Eradication of invasive alien speciesin Zambia
Promoting the use ofmeteorological informationto improve agriculturalproduction and contributeto food security in Mali
Enhance adaptive capacity tomanage climate change-relatedrisks to fresh-water availability
nologies and improved storagefacilities in Maldives
Rehabilitation, sustainablemanagement of naturalvegetation and enhancement ofnon-timber forest products in theeastern region in Burkina Faso
Implementation ofcommunicationinfrastructure in areas ofhigh potential productioncapacity to increaseexchange and trade inMadagascar
Artificial lowering of Lake Thor-thomi in Bhutan
Restoration of mangrove vegetationin Senegal
Promote secondaryprofessions in order toimprove the livelihoods offarmers affected by naturaldisasters induced byclimate change in Lao PDR
Improving agricultural productionunder erratic rains andchanging climatic conditions inMalawi
Reforestation of coastal sites inSenegal
Reorganisation of thecommunities adverselyaffected by climate changein Mauretania
Implementation of alternativemeasures to the exploitation ofcoastal sand in Senegal
Reforestation of rural areas withtheir specific reforestation plansbased on locally appropriatespecies in Madagascar
Implementation ofinstitutional measures forprotection of the coastalregion in Senegal
32 HOW TREES AND PEOPLE CAN CO-ADAPT TO CLIMATE CHANGE

Local
At the local level, responses depend very much on the kind of climate impacts to be expected,
such as sea-level rise and storm surge in coastal areas, floods owing to heavy rains or droughts.
The responses can consist of reducing exposure to the hazards or raising the adaptive capacity
and/or reducing climate vulnerability. In the context of land-use management, measures could
include water-harvesting techniques and erosion protection such as dikes and water pans, but also
improved irrigation systems or more drought- or salt-tolerant crop varieties. They could also
include integrating trees into agricultural systems because trees have many features that can help
reduce vulnerability to climate impacts. Involving all stakeholders, appropriate monitoring and
enforcement are paramount to developing appropriate adaptation strategies at community level.
REDUCING VULNERABILITY IN MULTIFUNCTIONAL LANDSCAPES 33
Table B2. Frequency distribution of major classes of adaptation practices that people in rural areas rely on as
reported by Agrawal and Perrin, 2008 (118 cases studied)
Class of adaptation
practice
Corresponding adaptation strategies Fre-quency
I. Mobility � Agropastoral migration
� Wage labour migration
� Involuntary migration
II. Storage � Water storage
� Food storage (crops, seeds, forest products)
� Animal live storage
� Pest control
11
III. Diversification � Asset portfolio diversification
� Skills and occupational training
� Occupational diversification
� Crop choices
� Production technologies
� Consumption choices
� Animal breeding
33
IV. Communal
pooling
� Forestry
� Infrastructure development
� Information gathering
� Disaster preparation
29
V. Market
exchange
� Improved market access
� Insurance provision
� New product sales
� Seeds, animals and other input purchases
1
Combination
strategies:
II + III
II + IV
II + V
III + IV
III + V
4
4
6
4
26

34 HOW TREES AND PEOPLE CAN CO-ADAPT TO CLIMATE CHANGE
Intermezzo 4.
Home and forest gardens reducing vulnerability in Central Vietnam
Vietnam, with its long coastline and high population density in river deltas, is one of the most exposed countries to global warming and climate change. Understanding how farmers have responded to past environmental change provides important insights forfuture action. To this end, a participatory appraisal of vulnerability and tree-basedsolutions was carried out in two villages in Cam My commune in Central Vietnam. This is an area with high annual rainfall concentrated in only two months of the year; it facesboth floods and drought. The two villages shared the problem of lack of access toirrigation water and fully depended on rainfall, but they responded in different ways. One focused on trees, the other on livestock.
Through village sketches, transect walks and participatory geographic information systemmapping the researchers began to understand local knowledge and responses about vulnerable areas in the local socio-ecological landscape. It became clear that access toland, water and markets were key factors in determining vulnerability and adaptivecapacity. In focus groups it was found that villagers often lost half of their crop yields owing to variable weather events. Furthermore, harvesting tree products in one village and raising cattle in the other were local adaptation strategies.
Through an in-depth analysis of resilience, home and forest gardens in particular wereidentified as important to help farmers to adapt to climatic variability and to ensure foodsecurity through income security. The home gardens were diverse combinations of fruit trees, herbaceous (crop) species and animals on a small area around homes. Forestgardens were usually a mixture of trees, crops and livestock on land classified as forest and allocated to households. All 188 households surveyed in the two villages made use of treesin such gardens, especially when rice and rain-fed crops failed. Thirteen tree species in these gardens, in particular, were found to be less sensitive to climate variability than crops, while providing multiple benefits besides cash income and food. More than half (55%) of households in villages grew acacia, eucalypt, tea, rattan and jackfruit and these trees survived and provided products even during multiple flooding events in 2007 and severe, prolonged cold in 2008. A range of species that responded differently to variousenvironmental pressures were found to be suitable for combining in garden systems toincrease local resilience to climate variability.

REDUCING VULNERABILITY IN MULTIFUNCTIONAL LANDSCAPES 35
Existing climate maps and climate change projections are based on data (and models calibrated on such data) that refer to 'landscapes without trees' because the standardinstruction for synoptic World Meteorological Organization (WMO) weather stations is toavoid locations where tree effects influence the results. Climate-change projectionspredict shifts in daily average temperature, day-night temperature differential, humidity and wind speed that are likely to affect crop growth and yield. The microclimate effect of trees, however, can influence these same properties and probably over at least as wide a range as the next 30 years of climate change. Micro- and mesoclimatic effects need to be explicitly added to climate maps as a basis for discussing climate-change adaptationoptions based on changing tree cover. Micro- and mesoclimatic effects of trees and forests can be approached by process-level models of radiation, water balance and wind speed (Stigter et al. 2005, Stigter 2010), compared to compilations of data for synopticWMO weather stations and measurements with various degrees of tree cover.
Modifying tree cover in agricultural landscapes to adjust micro-climates for crops has a long history: in the parklands of the Sahel, trees protect grain crops from excessive heatand maintain crop-zone soil moisture in critical periods; in the coastal zones of SoutheastAsia, intercropping under coconut has a long tradition; on the mountain slopes wherecoffee, cocoa or tea provide farmers' income, manipulating 'shade trees' depending on elevation and local climate is relatively well studied but its use for vegetables and local food crops is less well understood (Beer et al. 1997). None of this has yet made it intonational climate-adaptation planning. Acknowledging farmers' ecological and climaticknowledge and response options, and testing the limits, will provide a good platform forextending new global climatic findings to local farming communities.
Active management of tree cover can buffer the initial local effects of global climatechange but is no substitute for efforts to reduce the drivers of the changes. Recognitionof the opportunities and limitations of these effects and respect for local knowledgesystems that relate to this can lead to more locally appropriate adaptation planning, replacing top-down 'reforestation' targets that are insensitive to local needs and preferences.
While the current debate on trees, forests and climate is overly 'carbonised' and linkedto global climate feedbacks via atmospheric concentrations of greenhouse gasses, the more immediate benefits (and potential negative effects) of enhancing tree cover in landscapes can increase synergies in global climate action.
Current climate maps assume that there are no trees in the landscape
Intermezzo 5.


The main argument in this section is that changing (or 'transforming') landscapes and lives aremutually dependent on each other, as they are closely linked in time and space. Within the landscape continuum, the roles of landscape elements in supplying goods and services to locallivelihoods, however, shift with the stage of development and substitution of traded and importedgoods and services for those provided locally and potentially used as sources of income.
Rural livelihoods in changing,
multifunctional landscapes
Section II
Meine van Noordwijk, Leah Onyango, Antoine Kalinganire, Laxman Joshi,
Minh Ha Hoang, Nestry Ndichu and Ramni Jamnadass
C. Rural livelihoods in changing landscapes
Livelihoods are dynamic and involve on-farm, off-farm-within-landscape and out-of-landscapeways of earning a living, often as part of a risk-sharing (reducing vulnerability) family network.
There are several key questions at the interface of livelihoods and climate change to be assessed in every local context.
1. Can development goals to end global poverty be combined with the required level of global net emission reduction to sustain life as we know it?

2. What are the causes, magnitude and characteristics of local climatic variability?
3. What affects and influences current local capacity to deal with climate variability?
4. What are the dimensions of, and constraints to, adaptive capacity (based on natural,human, social, physical and financial assets)?
5. Are short-term coping strategies conflicting with long-term adaptation?
Adaptation and mitigation are both closely linked with the Millennium Development Goals (MDGs). Goals numbers 1 to 6 probably require greater global resource use and access for the rural poor. Numbers 7 and 8 seek to achieve progress through 'sustainable development' (FigureC.1). Climate change can be interpreted as a symptom of the dominance of unsustainabledevelopment pathways: a high carbon-flow economy addicted to fossil fuels as energy sourceswhile transforming landscapes from high to low carbon-stock conditions.
Millennium Development Goals
1. EradicateExtremePoverty and Hunger
2. Achieve Universal Primary Education
3. Promote Gender Equalityand Empower Women
4. Reduce Child Mortality5. Improve Maternal Health6. Combat HIV/AIDS, Malaria and Other
Diseases
7. Ensure EnvironmentalSustainability
8. Develop a Global Partnership forDevelopment
Figure C.1. The relationships between the eight Millennium Development Goals (http://www.mdgmonitor.org) and the challenge of climate change
A history of change
Since the peak of the last Ice Age, 20 000 years ago, human beings have by and large benefittedfrom global warming and have successfully adapted to an ever-changing and ever-variable climate(Figure C.2). They moved around, claiming nearly every type of habitat on earth and finding waysto use local resources. They brought their favoured plants and animals along, many of which
38 HOW TREES AND PEOPLE CAN CO-ADAPT TO CLIMATE CHANGE

'naturalised' and became as invasive an exotic species as Homo sapiens proved to be. The one constant in the subsequent history of human success in conquering the world is change: plus ca
change, plus c'est la même chose. Why be concerned about the current acceleration of climatechange? Haven't we been able to deal with worse conditions and more rapid change? Yes, wehave, but that response included substantial human migration and colonisation of previouslysparsely populated continents. Now there is nowhere left to go and there is no Planet B. If a couple of small-island states disappear below sea level this will hardly affect humankind at largebut it will cause political upheavals in a world carved into nation states. Previously, pastoralistscould roam over large areas, looking for green pastures or sources of water; now all land within each country is divided by tribal, state-claimed or private property rights and social, economic and political upheaval follows transgressive mobility.
If there is anything remarkable about the last 12 000 years, which the geologists call 'Holocene' in contrast to the preceding Pleistocene, it is the stability of the climate. According to some, we'renow entering the 'Anthropocene', the first geological period where climate is dominated by the activity of a single species. Starting with 'global warming' we may well get back to the climatic yo-yo of the Pleistocene.
Figure C.2. Global temperature profile of the last 100 000 years with its various ice ages, as derivedfrom the oxygen-18 isotope concentration in polar ice cores (based on Gaffney 2009)
Previously crops, trees and domesticated animals were the basis of integrated farming systems,involving considerable spreading of risk, with social networks of exchange and stockpiling as safetynets. Intensification and specialisation of agriculture increased the yields but also meant that markets and insurance schemes had to replace the old safety nets. Exposure to risk and the response options are very different now from what worked before. Many countries, regions and groups of people have been left behind while others increased their consumption per capita and draw on resources in a process called 'development'. Those left behind want to catch up but find that the resource base is already stretched and their political bargaining power to get a fairer shareof the limited pie is small, regardless of past discourse, discussion, verbal commitments and evolving agreements. In other words: there is no risk of extinction for Homo sapiens from currentand projected rates of climate change and at species level our adaptive capacity is fine. But thereare countries and people within them that already are on, or over, the edge of 'carrying capacity'
REDUCING VULNERABILITY IN MULTIFUNCTIONAL LANDSCAPES 39

of their ecosystems at current technology and patterns of resource use and yet they want moreresources, justified by the globally agreed Millennium Development Goals.
A 'livelihood' comprises the capabilities, assets (including
both material and social resources) and activities
required for a means of living (Carney 1998, Bebbington
1999). A livelihood is consideredto be sustainable if it can cope
with, and recover from, stressesand shocks and maintain or enhance its capabilities and assets, both now and in the
future, while not undermining the natural resource base for
further change.
In terms of vulnerability, small-island states and coastalzones (Dasgupta et al. 2009) plus farmers and pastoralistsin areas of high variability in rainfall stand out. One option for them is to move to cities and/or to countries that enjoy higher standards of living. At individual level this probablyis the preferred intergenerational adaptation strategy forthe majority of the rural poor. While rich countries build higher walls at their borders and restrict migration, theyrealise that they have to support the emergence of localsolutions in the rural areas affected, for reasons of self interest, justified by reference to moral standards. Climate-change adaptation cannot really be separated fromconcerns about, and approaches to deal with, currentissues of health, exposure to natural hazards and loss of ecosystem services. Tinkering with a complex systemwithout fully understanding it means that we have to be ready for surprises and be careful not to compartmentalise
the issue for bureaucratic efficiency, with the risk of losing sight of reality.
This chapter will cover the impact of climate change and climate variability on rural livelihoods.Using examples, issues of sustainability will be covered and the need to incorporate 'sustainagility'(retaining/enhancing the resource base for, and ability of farming communities to adapt to,change). While there are many aspects of rural livelihoods, factors that are important tosustainable livelihoods in relation to climate change and climate variability will be highlighted.
The UK Government's Department for International Development's 'livelihoods analysis' concepthas effectively mainstreamed a perspective that livelihoods can best be understood on the basis of access to five or six types of assets: human capital, natural capital, financial capital, social capital(sometimes differentiated into 'within group' bonding and 'between group' bridging or politicalcapital) and physical capital or infrastructure (Figure C.3, Carney 1998, Bebbington 1999, DFID 1999).
Poverty can be interpreted as a critical shortage of at least one of these assets. The livelihoods'paradigm differs from an economically driven one and from poverty definitions that refer toincome (for example, 'USD 1 per person per day') by recognising that exchange between capitaltypes can be slow and poorly reversible. That is, you can convert natural capital to money but it's not so easy the other way round: you can eat the chicken that laid golden eggs, but golden eggs don't hatch into the same type of chicken; access to clean drinking water can become reliant on technical infrastructure instead of on natural capital, but at considerable cost; social capital and trust can be rapidly destroyed, but only slowly rebuilt.
Rural livelihoods and pressures at current climate variability
40 HOW TREES AND PEOPLE CAN CO-ADAPT TO CLIMATE CHANGE
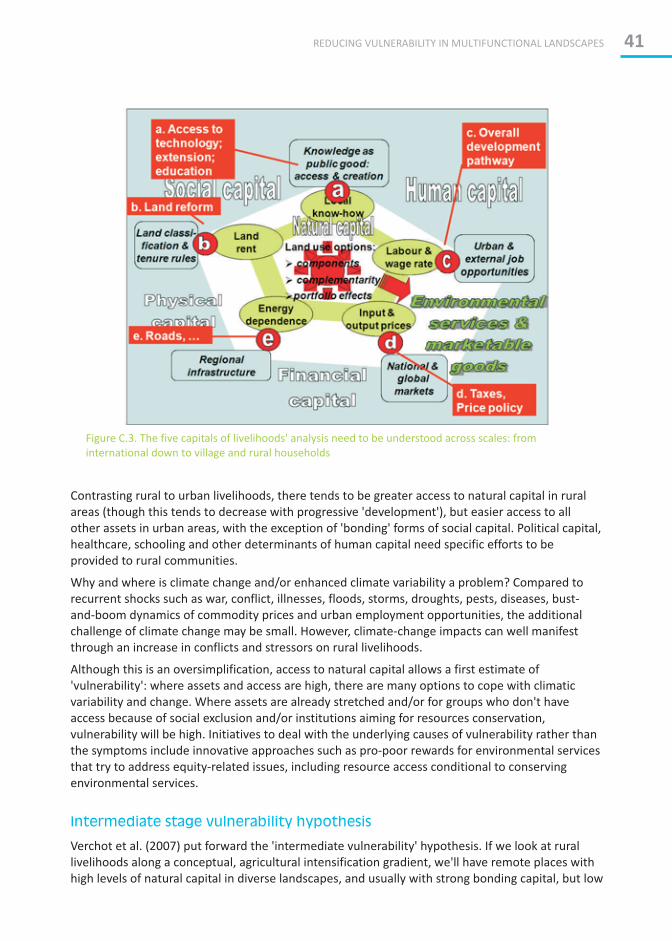
Contrasting rural to urban livelihoods, there tends to be greater access to natural capital in ruralareas (though this tends to decrease with progressive 'development'), but easier access to all other assets in urban areas, with the exception of 'bonding' forms of social capital. Political capital,healthcare, schooling and other determinants of human capital need specific efforts to be provided to rural communities.
Why and where is climate change and/or enhanced climate variability a problem? Compared torecurrent shocks such as war, conflict, illnesses, floods, storms, droughts, pests, diseases, bust-and-boom dynamics of commodity prices and urban employment opportunities, the additional challenge of climate change may be small. However, climate-change impacts can well manifestthrough an increase in conflicts and stressors on rural livelihoods.
Although this is an oversimplification, access to natural capital allows a first estimate of 'vulnerability': where assets and access are high, there are many options to cope with climaticvariability and change. Where assets are already stretched and/or for groups who don't haveaccess because of social exclusion and/or institutions aiming for resources conservation,vulnerability will be high. Initiatives to deal with the underlying causes of vulnerability rather than the symptoms include innovative approaches such as pro-poor rewards for environmental services that try to address equity-related issues, including resource access conditional to conserving environmental services.
Verchot et al. (2007) put forward the 'intermediate vulnerability' hypothesis. If we look at rurallivelihoods along a conceptual, agricultural intensification gradient, we'll have remote places with high levels of natural capital in diverse landscapes, and usually with strong bonding capital, but low
Intermediate stage vulnerability hypothesis
Figure C.3. The five capitals of livelihoods' analysis need to be understood across scales: frominternational down to village and rural households
REDUCING VULNERABILITY IN MULTIFUNCTIONAL LANDSCAPES 41
levels of access to other assets, including lack of voice in political forums. By most interpretationssuch people are poor, but they may not be specifically vulnerable to climate change, as theirenvironment is diverse and offers multiple under-explored options. On the other end of the intensification spectrum we'll see intensive farms of low diversity in highly specialised landscapes.They may be relatively well off in terms of income and access to health, education and other services; they may also be part of insurance schemes to buffer them from risk, as their portfolio of options is very thin. They can afford low genetic diversity on farm and in the landscape becausethey have access to a 'germplasm delivery system' that has access to the diversity of manylandscapes and is operated as a public/private partnership that matches supply and demand. A shift between crop varieties costs money but can be done quickly; a switch to another crop maylead to loss of capital in specialised machinery but maybe this can be resold to the farmers forwhom the crop that is abandoned at one place becomes a new option. On both sides of this intensification continuum there are few reasons for specific concerns for vulnerability to climatechange. Between the 'old' solution of local diversity and the 'modern' one of externalised sourcesof new options, there is a large domain where neither solution can be relied on. In landscapes where diversity has diminished, social institutions are stretched, resources of water overusedand/or polluted, and market access and research/extension links are limited, climate change maybe the straw that breaks the camel's back.
Sustainability has many dimensions, all of which are important to a sustainable livelihoodsapproach. According to the Department for International Development's analysis (DFID 1999), livelihoods are sustainable when they a) are resilient in the face of external shocks and stresses; b) are not dependent upon external support (or if they are, this support itself should be economicallyand institutionally sustainable); c) maintain the long-term productivity of natural resources; and d) do not undermine the livelihoods of, or compromise the livelihood options open to, others.
Another way of conceptualising the many dimensions of sustainability is to distinguish betweenenvironmental, economic, social and institutional aspects of sustainable systems.
�Environmental sustainability is achieved when the productivity of life-supporting naturalresources is conserved or enhanced for use by future generations.
�Economic sustainability is achieved when a given level of expenditure can be maintainedover time. In the context of the livelihoods of the poor, economic sustainability is achieved if a baseline level of economic welfare can be achieved and sustained. (The economic baseline is likely to be situation-specific, though it can be thought of in terms
12of the `dollar-a-day' of the International Development Targets ).
�Social sustainability is achieved when social exclusion is minimised and social equity maximised.
�Institutional sustainability is achieved when prevailing structures and processes have the capacity to continue to perform their functions over the long term (IPCC 2001).
Sustainable livelihoods: operationalising a concept
12 http://mdgs.un.org/unsd/mdg/Host.aspx?Content=Indicators%2fOfficialList.htm
42 HOW TREES AND PEOPLE CAN CO-ADAPT TO CLIMATE CHANGE

Range of options to include in climate-change adaptation and sustainagility
analysis
The description of livelihoods as combining different assets needs to be linked with a broaderperspective on the dynamics of land use, economic transformations reducing dependence on primary production and increasing jobs and value-addition service sectors (including foodprocessing) and the back-and-forth shifts that can occur in a rural–urban continuum. Vulnerabilityimplies not having options. Vulnerability assessments thus need to look across all options. Such options range from a new genotype for existing crops of farm animals to migration to another country. In between these extremes are switches to other crops, other cropping or husbandry systems, other ways of combining enterprises in a farming system, other ways of organizingagriculture-based value chains, and greater dependence on the urban side of integrated familynetworks. We can now describe each of these levels of response options as aspects of an integrated 'sustainagility' concept (Figure C.4, Verchot et al. 2007, Jackson et al. 2010) thatcomplements a view on sustainability that is focused on persistence, on the ability to keep doing what has been done. The two concepts meet in the relevance of resource conservation.Sustainagility, however, will tend to put more weight on 'diversity' and sustainability more on resources such as soil and water.
Figure C.4A. Basic rule for relating sustainagility and sustainability across system scales
Figure C.4B. Multiple levels of adjustment that link ‘persistence’ and ‘options for change’ to higher levels forms of sustainability (Source: Verchot et al. 2007 )
REDUCING VULNERABILITY IN MULTIFUNCTIONAL LANDSCAPES 43

The politics of adaptation-resource allocation
Free and prior informed consent
The global debate on climate change went through the familiar stages of an ‘environmental issue cycle’ (Tomich et al. 2005): mavericks starting to talk, some non-governmental organizationspicking up the early leads, governments and private sector in denial, while scientists in manydifferent disciplines had their various theories and partially conflicting observations about separate aspects. The decision early on to establish an inter-governmental panel on climatechange (IPCC) proved to be strategic: it provided a platform for the many different strands of science to be woven into fairly cohesive and compelling evidence that a) there was indeed a problem; b) that it had multiple causes but could be clearly linked to greenhouse gas emissions from use of fossil fuels and land-use and land-cover changes; and c) that it posed a great risk tocurrent human welfare and development pathways. Then the phase of ‘whodunit?’ (who is the perpetrator?) started, as a lead up to the ‘who pays?’ debate. Developing countries were seen as the primary and innocent victims, not contributing much to the cause of the problem. Financial transfers, a form of compensation, were slowly put in place, alongside small steps to mitigate or reduce the severity of the issue (see the NAPA list in Table O.1). Since then, the ‘victim’ role has appeared attractive to many countries and groups within a country, as a way to ask for or demand part of the ‘compensation’. Yet, many countries and groups asking for such may well aspire to the high-emission lifestyles that caused the problem. Climate-change adaptation became part of the politics of resource allocation familiar within the development debate. The dichotomy betweenvillains (industrialised countries) and victims (developing countries) became untenable, as major developing countries rapidly increased emissions, partially through ‘outsourcing’ of the industrieswith high-emission levels. New arguments of ‘fairness’ based on ‘per capita emission rights’ came into the debate and attained moral, but no direct political, acceptance. While there is broadconsensus that ‘least developed countries’ and small-island states are most worthy of support foradaptation, there is no clear sense of direction about which parts of their societies should be supported. ‘Coming up with a good story’ is still a major path to success in getting a piece of the pie. The examples of NAPAs in Table O.1 may give a sense of being selected on the basis of projects‘ready to go’, rather than on an inclusive process of prioritisation.
Given their high per hectare carbon stocks and generally low population densities, forests and peatlands have become the primary topic for carbon-stock emission debates. As land ownership,government-regulated tenure and resource access are often most contested for forests, the debate on who has the right to enhance, avoid or decrease emissions came to be at the centre of the REDD discussion. Interestingly, the standards currently proposed for involving local communities’ ‘free and prior informed consent’ on efforts to reduce emissions have not generallybeen applied to activities that enhance emissions.
After wide public consultation, a list of standards for REDD+ programs has been developed, thatwill consist of principles, criteria and indicators that define the issues of concern and the required
13levels of social and environmental performance . It so far provides eight principles—the ‘intent’level of a standard—that elaborate on the objectives of the standard and define the scope. They are fundamental statements about the desired outcome and are not designed to be verified. They are each linked to about five criteria, which set out the conditions which need to be met in order
13 http://www.climate-standards.org/REDD+/docs/REDD+SE_Standards_draft_01-15-09_for_comments.pdf
44 HOW TREES AND PEOPLE CAN CO-ADAPT TO CLIMATE CHANGE

to deliver a principle. The criteria are further elaborated by, on average, two indicators, which arequantitative or qualitative parameters that can be achieved and verified.
Principle 1: Rights to lands, territories and resources are recognised and respected by the REDD+ program.
Principle 2: The benefits of the REDD+ program are shared equitably among all relevant rightsholders and stakeholders.
Principle 3: The REDD+ program improves long-term livelihoods’ security and well being of indigenous peoples and local communities with special attention to the mostvulnerable people.
Principle 4: The REDD+ program contributes to broader sustainable development and good governance objectives.
Principle 5: The REDD+ program maintains and enhances biodiversity and ecosystem services.
Principle 6: All relevant rights holders and stakeholders participate fully and effectively in the REDD+ program.
Principle 7: All rights holders and stakeholders have timely access to appropriate and accurateinformation to enable informed decision-making and good governance of the REDD+ program.
Principle 8: The REDD+ program complies with applicable local and national laws and internationaltreaties, conventions and agreements.
Much of the emissions and sequestration issues relate to land. And access to land (with or without forest cover) is hotly contested in many countries: between the state and local communities,between different communities that have historical claims on the same land, between households within each of those communities and even between household members in some cases. Withexpectations of new economic value linked to the maintenance, avoided disappearance or restoration of terrestrial carbon stocks, the issues of control over land obtained a new dimension. Especially where groups have unequal access to information, forms of speculation came into play,with some actors promising good prices to local governments and communities for unclear and poorly understood carbon rights: similar to logging rights and/or the expansion of supposedly promising tree crops and other plantations.
The atmosphere and the oceans, two key components in the interlinked Earth system that jointlydominate the carbon cycle and climate, are the ultimate ‘commons’, with benefits enjoyed by all but management effort by none. They can only be managed globally (Hare and Meinshausen 2006), by agreement on ‘globally appropriate mitigation actions’ (GAMA; see Figure C.5).
Rights and resources: the tragedy of the commons
Globally Appropriate Mitigation Actions (GAMA)
Nationally Appropriate Adaptation and Mitigation Actions (NAAMA)
Locally Appropriate Adaptation and Mitigation Actions (LAAMA)
Figure C.5. Three interacting levels of climate-change adaptation and mitigation of emissions
REDUCING VULNERABILITY IN MULTIFUNCTIONAL LANDSCAPES 45

Nutritional concerns are heightened under climate change as food security decreases. This, however, provides an opportunity to make more use of indigenous fruit trees that areavailable for consumers and farmers to plant in the environments around them. If the right mix (or ‘portfolio’) of fruit trees can be cultivated then the availability of the key nutrientsthat fruits provide can be sustained throughout the year. An example of what a portfoliocan look like—in this case for a range of mostly indigenous fruits found in Zambia—is shown in Figure C.6. Research on the propagation of these species, and their adoption by farmers, is the subject of ongoing work in southern Africa, and similar projects areunderway in other parts of the continent such as Central and West Africa. What is neededis a strategic approach across countries in order to project the changes under climaticalteration in regional distributions of particular nutritional challenges (for example, vitaminA deficiency). Portfolios can then be tailored accordingly with the right species with the correct nutrient profiles at a local level.
Spreading production throughout the year is not only beneficial for the health of consumers, but for the businesses of farmers and processors, as it allows more efficientuse of land and capital, and more regular and stable income. Portfolios can also be tailoredin order that labour requirements focus on the times of year when farmers are not busytending other crops. In addition, portfolios can be designed so that farmers are better able to service international markets. African smallholders should, for example, be encouragedto grow fresh fruit for export when other sources of the same fruit from alternativeproducers—such as large plantation growers in Brazil or Costa Rica—are unavailablebecause of seasonal differences of geography.
Intermezzo 6.
Fruit tree portfolios in southern Africa
Oct Nov Dec Jan Feb Mar Apr May Jun Jul Aug Sep
Annona
AzanzaAdansoniaFlacourtia
ParinariStrychnosSyzygium
UapacaVangueria
VitexZiziphus
Figure C.6. A range of fruit trees found in Zambia that produce fruit in different seasons (indicated by green shading). Growing a diversity of species can provide a balanced nutrientsupply year round
46 HOW TREES AND PEOPLE CAN CO-ADAPT TO CLIMATE CHANGE
The current ‘biofuel’ debate is rooted in the concerns over global warming and the need tosubstitute current fossil-fuel use with renewable energy sources. With the relatively low net energy production per hectare of current technologies, once the production costs areaccounted for, the contribution to the ecological footprint may be more than is affordable,while it already competes with the use of land for food production and provision of other ecological services.
The current debate on bio-energy is focused on ‘biofuels’ that can substitute for currentuse of fossil fuels. It pays little attention to the rural economies that have not got used tohigh fossil-fuel use and still largely rely on woody biomass to provide energy for household needs. The irony is that substitution of firewood and charcoal by subsidised fossil fuels has been (and still is?) part of environmental protection programs. Subsidised substitution of fossil fuels by ‘new’ forms of bioenergy is rapidly becoming part of ‘climate change’ policies.
Global warming can be seen as the ‘spill-over’ effect of human resource use that exceedsthe capacity of planet Earth, or as the consequence of the ecological footprint that exceedsthe size of land available. A breakdown of the components of ecological footprint in relation to the Human Development Index (HDI) at national scale shows that the arearequired for fuelwood production decreases with HDI (Figure C.7). At the same time, the land required to compensate for the fossil-fuel emissions increases, along with the arearequired to support the food and forest fibre products consumed. In balance, the ecological footprint rises exponentially with HDI and there are no current country-scalerole models for sustainable development if we interpret the latter as achieving HFD > 0.8 as a globally affordable ecological footprint (a criterion that has been proposed for MDG number 7).
There are various terminologies in use as to ‘generations’ of bioenergy and biofuel. One version is:
Generation 1: Firewood/charcoal, manure and agricultural waste use for small-scale, static,energy use in cooking, heating and/or power generation. Firewood and charcoal have a long history as sources of bioenergy, with issues of ‘overharvesting’ largely owing tobreakdown of local regulations in resource access and replacement by ineffective nationalauthorities. Historical experience with wood-based electricity in periods and places of high fossil-fuel prices has raised concerns over nutrient depletion and/or loss of energy benefitswhen nutrient replacement is part of the system. Integrated systems in a plantationcontext are feasible.
Generation 2: Methane digestion of organic wastes for small-scale, static, energy use in cooking, heating and/or power generation. This has found application mostly where dairy cattle or pigs provide easily digestible manure, supported by ‘appropriate technology’groups. Total energy substitution has remained low.
Intermezzo 7.
Bioenergy, fuelwood, charcoal and Jatropha
REDUCING VULNERABILITY IN MULTIFUNCTIONAL LANDSCAPES 47

Generation 3: Ethanol and biodiesel for mobile engines—substituting for gasoline and diesel—based on sugarcane, cassava, sweet sorghum, maize, soybean and other cropsconverted to ethanol, and oil-rich seeds (oil palm, coconut, jatropha, ponghamia and others) converted to biodiesel. Marketed as modern biofuels, the first decade of the 21stcentury saw a boom/bust cycle of public interest, with reality checks setting in after a hypephase. The low energy-efficiency of such fuels will lead to large area requirements and interference with global food supply, while productivity on ‘degraded soils’ is inherentlylow.
Generation 4: Large-scale, industrial, generic, biomass conversion to various fuel sourcesfor static and/or mobile power use. Enzymatic digesters and various forms of biotechnology are in development to convert lower grade biomass, rather than starch/sugars and oils, into usable energy. The ecological consequences may be similar tofirst-generation bioenergy, in that large areas may be depleted of biomass without effective nutrient recycling. Whole-system approaches to see this as part of total land use are still scarce.
While any biomass can be used as fuel, woody perennials offer a number of advantagesover annual crops: much lower energy and financial cost of establishment and maintenance and, in many climates, more resilience against variable rainfall patterns and co-benefits in soil protection. Wood has much lower nutrient content than leaves, fruits, seeds or tubers, and nutrient mining is less of a problem where wood is harvested (while other plant components are retained on site) than when energy is harvested through other plant components. Perennial grasses (‘hay’) may be second best in this respect.
Figure C.7. Relationship betweencomponents of the total ecologicalfootprint and the HDI (upper panel), and the total ecological footprint byHDI per geographical grouping of countries (lower panel)
48 HOW TREES AND PEOPLE CAN CO-ADAPT TO CLIMATE CHANGE

D. Multifunctional landscapes and dynamic livelihoods
The main points covered in this section are that landscapes have a biophysical basis, includingclimate and biological richness, interacting with human management (‘land use’) by multiple actors. Some of the processes operating at landscape scale can be understood from the spatial distribution of landscape elements interacting through ‘filters’ on the lateral flows of water, soil, fire or plants and animals, such as riparian zone strips of vegetation intercepting sediment beforeit reaches the streams and making water quality less dependent on in-field erosion. Importantother aspects of landscapes may be better seen as ‘emergent behaviour’, in the form of ‘ecosystemservices’ that are the result of complex interactions that cannot be fully understood as yet. Land-use change tends towards specialisation and reduction of landscape complexity. But a turning point can be reached, beyond which there is a return to a more multifunctional optimisation.Rather than only providing harvestable goods, multifunctional landscapes are also buffers againstclimate change. The broad concept of ‘ecosystem services’ has to be teased apart into its variousservices and functions, however, to make management more rational and to open the experienceup for more detailed analysis and progress of our understanding. Access, use and management of ecosystems and their associated services are often limited by the policies and the legislation that nations pursue. A good example is the impacts of the Sahelian Forestry Codes on the access, use and management of protected indigenous tree species (see Intermezzo 8).
The word ‘landscape’ refers to an area of land that is interconnected in its functioning through the lie of the land, the flows of water, the patterns in vegetation, the movements of animals, human livelihoods and systems of governance. There is no fixed size, but a landscape normally involvesvariation in height, geological substrate and soil types, multiple ‘habitats’ or ‘vegetation types’,multiple streams or rivers and multiple villages with variation in farming and other lifestyles, but connected through local markets, social networks, institutions and some of the lower levels of the nested systems of governance. The word came into use in English through ‘landscape paintings’and has maintained an association with harmonious diversity, visualisation and beauty. Landscapes can change through the influence of many actors, reacting and responding to each other, with a relatively weak level of ‘orchestration’. Yet, the interconnectedness makes the landscape a validsystem-level of study and an important level between individual households and nation states.
Landscapes can be viewed as ‘mosaics’, internally homogeneous elements, and as ‘gradients’,gradual changes that reach across ‘units’. Similar to the ‘wave’ and ‘particle’ duality of light in physics, both views may seem to be contradictory, but both add to our understanding of the patterns and process (Figure D.1). Ecologists can distinguish the ‘arena’ (conditions) from the ‘actors’ (organisms) and both are a target for conservation (Beier and Brost 2010).
Dynamic mosaics and gradients
REDUCING VULNERABILITY IN MULTIFUNCTIONAL LANDSCAPES 49

Figure D.1. A visualisation of a landscape in northern Sumatra, Indonesia, as a gradient from open agricultural patches through a village and its surrounding agroforest, grading into natural forest.Orangutan that live in the forest come down to the agroforest zone of the landscape and people who live in the village and manage the parts of the landscape. The picture was created based on discussions with villagers. Artist: Wiyono
Lateral flows, filters, complex causation
A landscape gets its coherence from ‘lateral flows’; from things, organisms and influences thatmove. Water and animals move, very fast in the air, rapidly over the soil surface and/or slowly through the soil. Soil moves slowly at geological time scales, eroding from hill slopes and aggradingalong rivers and in floodplains (van Noordwijk et al. 2004c). Soil movement is slowed by vegetation, with roots holding the soil and groundcover reducing the direct splash impact of raindrops on soil. Removal of vegetation ‘causes’ erosion, but only in as much as it was a ‘filter’before. Filters separate the materials transported from their carrier. For example, soil litter as a filter allows soil particles to become sediment while the water flows on; a wetland plant filterremoves the nutrients from a water flow; and a windbreak or urban tree removes dust from air flows. Where filter functions are involved, the concept of causation becomes complicated:enhancing a filter reduces the impact of a ‘primary cause’ on its ‘impact’, but only as long as the filter lasts and isn’t saturated. In human terms, the filter starts to share responsibility for the presence or absence of the ‘final effect’ of the ‘primary cause’. When a filter is saturated or full, a breakthrough may occur that has more impact in a short time than the original flow might havehad. This applies to the vegetation filter holding soil on steep slopes until a landslide occurs; it mayapply to beaver or debris dams in a stream; or to vegetation temporarily storing carbon trapped
50 HOW TREES AND PEOPLE CAN CO-ADAPT TO CLIMATE CHANGE

(filtered) from the air, but released at the next wildfire. The role natural forests areas play in reducing flood risks appears to be restricted to relatively small catchments and riparian wetlandsfurther downstream (van Dijk et al. 2009). Managing landscapes may often entail enhancing filterfunctions, but this shifts responsibility from the primary agents to those that control the fate and future of the filter, in a complex system with feed-backs and feed-forwards. Where complexitybecomes too high it may be easier to describe and analyse the higher-level system on the basis of its emergent and more aggregate properties. Instead of a number of trees, we can start to see a forest.
Figure D.2. The biophysical and institutional interpretation of landscape represent two sides of the same coin in the case of landscape-level water flows: institutional responses, and the public debate,attach a high importance to 'forest' as the only way to achieve good watershed functions and blame upland farmers for floods and droughts
Landscape institutions, rules and definitions
Where human beings settled, lateral flows of ‘harvested goods’ towards the settlement led toaccumulation of nutrients in a few places and depletion over a large area: repeating on a largerscale what many savannah trees do in creating islands of fertility in an impoverished surrounding.Harvest of biomass as food, fuel and fibre tended to create concentric rings of modification of the vegetation around each settlement, the more so as more people lived together. The emergentpattern started to form a ‘typical landscape’. Wildlife and large trees tended to become restrictedto places far from the villages. With the emergence of higher levels of political and military power,and associated state institutions, the concept of ‘forest’ arose: land controlled by the king or the state, for purposes of hunting, and later also for retaining the large trees needed for ships and marine power. The word ‘forest’ still refers to a boundary that was delineating the sphere of influence of the village, not necessarily to woody vegetation.
REDUCING VULNERABILITY IN MULTIFUNCTIONAL LANDSCAPES 51
Control over parts of the landscape—regulating rights to use, harvest, modify or convert—havetransformed the gradients into mosaics, with political struggle, negotiations and agreements. In 1215, when King John of England had to accommodate the ambitions of the local nobility to avoidbeing overthrown, he agreed to the Magna Carta, which includes a clause that substantial areaswere to be ‘deforested’, that is, taken out of the royal hunting reserve and returned to local control(the 1297 version, had the long title (originally in Latin) of The Great Charter of the Liberties of
14England and of the Liberties of the Forest ).
The word ‘forest’, then, had political as well as environmental meanings, and has shifted these days more towards a description of woody vegetation, although much of the politics remains.Many local governance systems use multiple terms for different parts of the landscape that crudely translate to ‘forest’ in English. For example, there are more than 10 terms for forest in Northern Thailand, in the Karen language, that describe various functions such as protectingsprings, modulating water flow into rice fields, acting as the umbilical cords and burials that mark the human cycle, as well as regulating hunting and use of tree products.
The term ‘forest’ can refer to a continuum (gradient) in tree cover or to an institutional dichotomy:‘yes’ or ‘no’ under the control of ‘forest authorities’. Much of current debate on trees, forests and climate is focused on the issue of political control versus observable and quantifiable processes. A broad view on the gradual intensification of land use may start with natural vegetation with minormodification of the natural succession by forming gaps and/or local fire events that allow pioneer plants (natural or planted) to grow and become domesticated as staple crops. From there on the domestication of ‘commodities’ and specialisation in fewer components, along with strongermodification of the environment (nutrient and water supply, control of other organisms that became labelled as pests, weeds and diseases), determined the trajectory of ‘agriculture’. Parallelefforts in animal husbandry focussed on the animals as part of integrated farming but then branched off towards separate production systems. For trees, early domestication took placealongside that of annual crops and in a context of agriculture, with olives, coconut, coffee, cacao,tea, rubber, oil palm and a broad range of fruit or medical trees (including the cinchona thatallowed human populations without genetic resistance to expand into malaria areas). The laterdomestication of timber trees took place mostly in an institutional context of ‘forestry’. The current definitions of ‘forest’ span the full ‘domestication’ range, while terms for crop and animal husbandry focus on the endpoint of the intensification trajectory, seeing the more mixed and less specialised (more integrated) forms that include trees, as ‘backward’. Coining the term‘agroforestry’ for such systems in the late 1970s has lead to a solid research interest and gradualpolicy recognition of the relevance of such systems within ‘agriculture’, while forest authorities had to come to grips with ‘community-based forest management’ for similar forms of land use within the forest institutional domain (Figure D.3).
While global land-use statistics have accepted the ‘forest’ versus ‘0-forest’ dichotomy, data on treecover on what are considered to be ‘agricultural’ lands (Figure D.4) show that globally 50% of such lands contain at least 10% tree cover and, in Southeast Asia and Central America, 50% contain at least 30% tree cover (Zomer et al. 2009).
Intensification gradients
Tree cover on agricultural land
14 Source: http://en.wikipedia.org/wiki/Magna_Carta
52 HOW TREES AND PEOPLE CAN CO-ADAPT TO CLIMATE CHANGE

Figure D.4. Tree cover in what are classified as ‘agricultural lands’ in global databases.Source: Zomer et al. 2009
Figure D.3. Schematic interpretation of land use along a vertical axis of ‘intensification’ of land use and domestication of plant and animal resources, and a gradual differentiation into ‘animal’ and ‘plant’husbandry; a similar gradient is found within the ‘forest’ institutional domain; the centre of the graph can be labelled as ‘multifunctional agriculture’, ‘agroforestry’ or ‘community-based forest management’,depending on perspective
REDUCING VULNERABILITY IN MULTIFUNCTIONAL LANDSCAPES 53
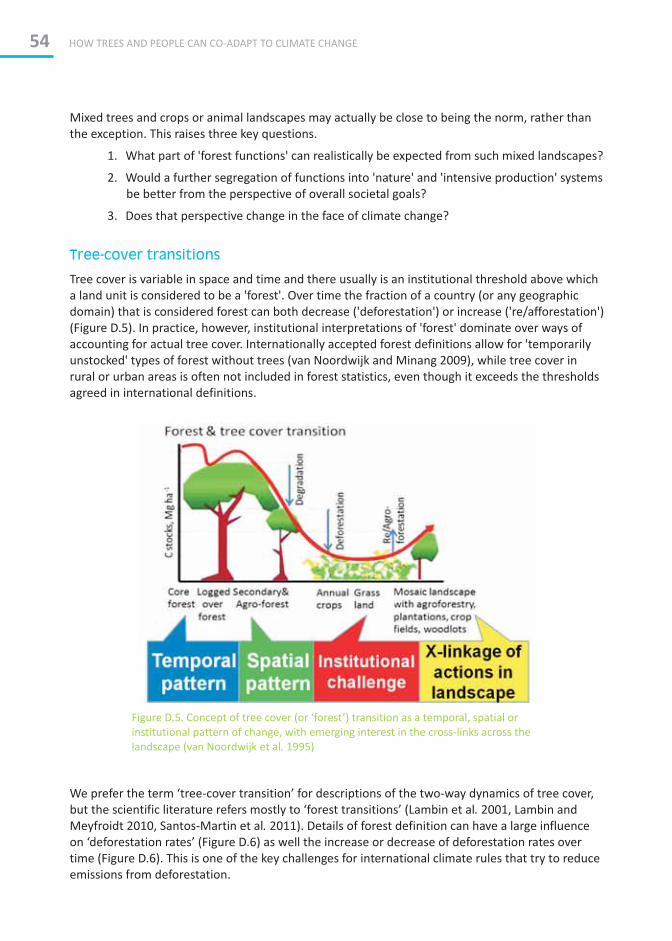
Mixed trees and crops or animal landscapes may actually be close to being the norm, rather than the exception. This raises three key questions.
1. What part of 'forest functions' can realistically be expected from such mixed landscapes?
2. Would a further segregation of functions into 'nature' and 'intensive production' systemsbe better from the perspective of overall societal goals?
3. Does that perspective change in the face of climate change?
Tree cover is variable in space and time and there usually is an institutional threshold above which a land unit is considered to be a 'forest'. Over time the fraction of a country (or any geographicdomain) that is considered forest can both decrease ('deforestation') or increase ('re/afforestation')(Figure D.5). In practice, however, institutional interpretations of 'forest' dominate over ways of accounting for actual tree cover. Internationally accepted forest definitions allow for 'temporarilyunstocked' types of forest without trees (van Noordwijk and Minang 2009), while tree cover in rural or urban areas is often not included in forest statistics, even though it exceeds the thresholdsagreed in international definitions.
Tree-cover transitions
Figure D.5. Concept of tree cover (or ‘forest’) transition as a temporal, spatial or institutional pattern of change, with emerging interest in the cross-links across the landscape (van Noordwijk et al. 1995)
We prefer the term ‘tree-cover transition’ for descriptions of the two-way dynamics of tree cover,but the scientific literature refers mostly to ‘forest transitions’ (Lambin et al. 2001, Lambin and Meyfroidt 2010, Santos-Martin et al. 2011). Details of forest definition can have a large influenceon ‘deforestation rates’ (Figure D.6) as well the increase or decrease of deforestation rates overtime (Figure D.6). This is one of the key challenges for international climate rules that try to reduceemissions from deforestation.
54 HOW TREES AND PEOPLE CAN CO-ADAPT TO CLIMATE CHANGE
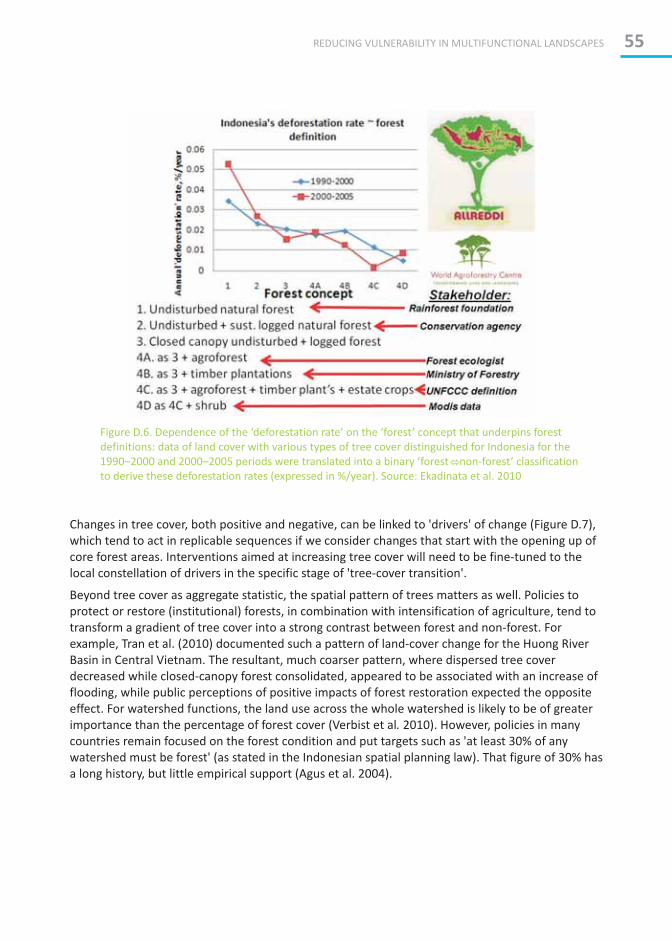
Changes in tree cover, both positive and negative, can be linked to 'drivers' of change (Figure D.7),which tend to act in replicable sequences if we consider changes that start with the opening up of core forest areas. Interventions aimed at increasing tree cover will need to be fine-tuned to the local constellation of drivers in the specific stage of 'tree-cover transition'.
Beyond tree cover as aggregate statistic, the spatial pattern of trees matters as well. Policies toprotect or restore (institutional) forests, in combination with intensification of agriculture, tend to transform a gradient of tree cover into a strong contrast between forest and non-forest. Forexample, Tran et al. (2010) documented such a pattern of land-cover change for the Huong RiverBasin in Central Vietnam. The resultant, much coarser pattern, where dispersed tree coverdecreased while closed-canopy forest consolidated, appeared to be associated with an increase of flooding, while public perceptions of positive impacts of forest restoration expected the oppositeeffect. For watershed functions, the land use across the whole watershed is likely to be of greaterimportance than the percentage of forest cover (Verbist et al. 2010). However, policies in manycountries remain focused on the forest condition and put targets such as 'at least 30% of anywatershed must be forest' (as stated in the Indonesian spatial planning law). That figure of 30% has a long history, but little empirical support (Agus et al. 2004).
Figure D.6. Dependence of the ‘deforestation rate’ on the ‘forest’ concept that underpins forestdefinitions: data of land cover with various types of tree cover distinguished for Indonesia for the 1990–2000 and 2000–2005 periods were translated into a binary ‘forest non-forest’ classificationto derive these deforestation rates (expressed in %/year). Source: Ekadinata et al. 2010
�
REDUCING VULNERABILITY IN MULTIFUNCTIONAL LANDSCAPES 55

Figure D.7. Typical sequencing of 'drivers' of tree-cover change (compare with Figure D.5) that typically lead to reduced natural tree cover and its replacement byplanted trees, selected for direct human utility
Figure D.8. Enhancement of buffer and filter functions that shield external stakeholdersfrom negative impacts of land-use practices that affect environmental services may be more politically attractive than 'root cause' approaches, but the long-term effective-ness depends on buffer and filter dynamics. Source: van Noordwijk et al. 2004c
Dispersed trees in the landscape and strips of perennial vegetation in-between cropped fields can influence the overland flow of water and sediments and act as a ‘filter’ that protects downstreamstakeholders from the direct impacts of land use in areas upstream (Figure D.8; van Noordwijk et al. 2004c). Inversely, if downstream stakeholders want to increase their supply of environmentalservices, it may be tempting to increase buffer functions, rather than seek solutions at ‘root cause’ level, as the latter may be more costly.
56 HOW TREES AND PEOPLE CAN CO-ADAPT TO CLIMATE CHANGE

What part of 'forest functions' can be realistically expected from mixed
landscapes?
Ecosystem Services: The benefits people obtain
from ecosystems:
RegulatingBenefits obtained from
regulation of ecosystemprocesses
• climate regulation
• flood & droughtregulation, water quality
• disease regulation
ProvisioningGoods produced or
provided by
(agro)ecosystems
• food (plants, animals)• fresh water
• fuel wood, fibre• genetic resources for
domestication
CulturalNon-material benefits
from ecosystems
• spiritual
• recreational
• aesthetic
• inspirational
• educational
Supporting Services necessary for (re)production of other
ecosystem services: • Soil formation, • Nutrient cycling, • Primary
production
Innovation options genetic and landscape resources
necessary for innovation and long-term survival of external change
Goods + Environmental Services
Figure D.9 Ecosystem and environmental services. Modified from MA 2005, van Noordwijket al. 2004a and van Noordwijk 2005
Since the Millennium Ecosystem Assessment (MA 2005, Reid et al. 2010), the benefits that people obtain from ecosystems are conventionally discussed under four headings: 1) provisioning (or the supply of goods); 2) regulating; 3) cultural; and 4) supporting services. The first of these, the provisioning of goods, includes all agriculture and forestry and has readily developed markets and policies. The other groups are 'environmental services' that tend to be underrated in marketvaluation and to be treated as 'externalities' to decision making (Tomich et al. 2004, van Noordwijk2005). Within the group of 'supporting' services, the maintenance of innovation options(sustainagility) is of specific relevance for adaptation to climate change. It depends more clearly on genetic diversity and landscape resources that may not currently have much utility but may proveto be crucial in the future. This group of 'services' requires specific attention, as it is poorly reflected in short-term utilitarian approaches. It can be treated as embedded in the 'inherentvalue' of nature.
When we compare agro-ecosystems with 'nature', we see clear trade-offs where managementoptions that increase 'provisioning services' tend to reduce the others, especially the diversity that supports future innovation. Many of the regulating services can, in fact, still be provided by agro-ecosystems that are managed as multifunctional landscapes with trees.
The aggregated term 'ecosystem services' may suggest that they all belong together. But within the landscape, with its gradients and spheres of human influence, the functions tend to be spread.Primary plant production takes place throughout the green space and regulation of water flows is
Is segregation of functions better than 'integration' to achieve overall
societal goals?
REDUCING VULNERABILITY IN MULTIFUNCTIONAL LANDSCAPES 57

needed throughout the landscape. Biodiversity functions, however, may be provided by maintenance of biodiversity-rich habitats on only part of the land. Strips and patches of naturalvegetation and tree lines may harbour the birds that regulate, but also those that are, pests. Insect pollinators may nest in such patches, while the bat pollinators needed for several fruit trees can serve trees throughout a landscape as long as their caves or some dense groves of trees areretained intact. Depending on the scale and mode of movement of organisms, a distance from one metre to several kilometres may be critical in what still is a 'contiguous' landscape for them. Hence, overall ecosystem functions tend to vary along gradients of 'connectedness', usually without clear thresholds.
Agroforest Homegardens Simple agroforestry
Wilderness
Natural forestLogged/over-logged forest
Fastwood & tree
crop plantations
Cropped
fields
Secondary forest, Bush fallow, Planted fallowRangeland Pastures
Biodiversity in landscape mosaics includes wild ( ),
managed/semidomesticated ( ),
domesticated species ( ),
& introduced and invasive exotics ( ).
I. Inventory and recognition for role of agroforests/try
II. Domestication of high-value trees
IIIA. Intensification of Ag production
IIIB. Land sparing (segregation)
IV. Multifunctional integration where biodiversity pays
Figure D.10. Schematic representation of the species’ richness across a gradient fromwilderness to cropped fields, classifying the plants and animals as native to the original habitat and area, semi-domesticated, fully domesticated and introduced (invasive exotics)
Biodiversity functions are likely to be the most ‘delicate’ and dependent on the presence of at leastsome ‘undisturbed’ habitats. Many plants and animals, but not all, can survive in habitats that areused for low intensities of harvest and extraction and/or for recreational or religious functions. Many can still live in agroforest-type habitats, where planted and/or managed trees (for example,rubber, tea, coffee, durian, cacao) share the space with spontaneously established trees, in vegetation that retains some of the processes of a natural forest, including patch-levelregeneration. A substantial loss of biodiversity occurs when such mixed agroforests are replaced by more intensively managed plantations of one or just a few species.
At a rather high level of abstraction, seen from a greater distance, we can understand landscapes as evolving in a two-dimensional space, determined by the level of goods, biodiversity and closely related ecosystem services that they provide. A natural forest is low on the first and high on the second axis while an intensively managed agro-ecosystem may be the reverse (Figure D.11).
Does the segregate–integrate perspective change in the face of climate
change?
58 HOW TREES AND PEOPLE CAN CO-ADAPT TO CLIMATE CHANGE

The type of intensification of agriculture through specialisation in one or a few commodities that became known as the ‘green revolution’ has had to substitute for the loss of several ecosystemservices. Chemical fertilisers rather than landscape-scale nutrient cycling became the primary source of plant nutrients, pesticides rather than reliance on natural predators and parasitesbecame the main way to fend off organisms that have the same food preference as human beings. In the short run, this type of intensification seemed profitable, but with experience there also grewthe awareness of its costs: financial as well as loss of natural capital and flexibility. Moreknowledge-intensive and integrated systems of managing pests and nutrients have since emerged,relying on better monitoring and advisory schemes based on extensive experimental data.
Climate change will change the opportunities for rapidly moving pest and disease organisms fasterthan those for their predators and control agents. It is a reasonable hypothesis to expect that morediverse and less intensively used landscapes have a greater resilience and more opportunity to deal with climate change than intensive agriculture. But this is as yet a hypothesis, and further criticaldata collection and synthesis is needed.
Figure D.11. Relationship between agricultural productivity and biodiversity and associatedecosystem services across the main diagonal from natural forest to intensive agriculture,with degraded lands in the lower left corner. This figure is used by the Agrobiodiversity
15group of Diversitas for analysing the plausible trajectories of specific benchmark sites
15 Diversitasscience, linking biological, ecological and social disciplines in an effort to produce socially relevant new knowledge; 2) to provide the scientific basis for the conservation and sustainable use of biodiversity. Source: http://www.diversitas-
is an international program of biodiversity science with a dual mission: 1) to promote an integrative biodiversity
REDUCING VULNERABILITY IN MULTIFUNCTIONAL LANDSCAPES 59

To make progress on the actual management of a landscape requires ‘boundary work’ that linksmultiple types of knowledge and multiple approaches to action (Clark et al. 2011) because the knowledge-based interpretations of reality are as often as contested as the actions they interpret,justify or see as culprits (Villamor and van Noordwijk 2011).
A number of recent studies have articulated the economic value of ecosystem services as a justification of the public policy interest in maintaining the landscapes that provide them (Leemans et al. 2009, TEEB 2010). Translating the theoretical value into action, however, is more easily said than done (Kosoy and Corbera 2010, Kumar et al. 2010, Pascual et al. 2010). What is commonly framed as ‘payment for environmental services’ (PES) (Wunder 2005), can be conceptualised in multiple ways (van Noordwijk et al. 2004b, van Noordwijk and Leimona 2010).
Intermezzo 8.
Sustainability analysis in West Africa
Sustainability appraisals promote planning and decision-making that makes local livelihoods more robust. It is an integrated assessment of environmental, social and economic effects of proposed actions at all levels of decision-making, from policy to plans to projects. It is undertaken under a national or international framework of sustainabilityprinciples, indicators or strategies (Dalal-Clayton and Sadler 2005). In many countriesenvironmental impact assessment systems have been established to analyse developmentprojects as part of the legal decision and approval process. The potential environmentalimpacts of policies, laws and plans, however, deserve a similar type of scrutiny. We can, therefore, say that sustainability appraisals try to link ‘upstream’ and ‘downstream’ parts of the decision cycle through integration of environmental objectives and considerations in natural resource policies and legislation at a strategic level. Such appraisals can be used in facilitating the review of policies through participatory assessment of the impacts of existing policies and legislation. They enable objectives pursued by different sectors to be assessed and reconciled. They also help to realise good governance of natural resourcesand promote inter-institutional relations in order to define priorities and build public trustand confidence.
It must, however, be noted that sustainability appraisal still remains a ‘frontier’ challenge in agroforestry. Scientists applied it for the first time in Mali and Niger to access the impacts of the Sahelian Forestry Codes on access, use and management of protected native treespecies, using a three-point criteria with several basic aims and objectives. The sustainability criteria were 1) preservation of the environment; 2) social cohesion betweenthose governing resource use and users at the local level; and 3) income generation. Undereach criterion, basic aims and objectives were formulated with corresponding indicators as well as performance measures ranging from 1 to 5 with 1 being ‘no relationship’ and 5 being ‘strongly supportive’. The reasons, issues or areas of improvement explaining the level of performance assigned to each basic aim or objective was recorded in a sustainability test record sheet. Each of the criterion was further sub-divided into a total of 15 basic objectives: 1) vegetation conserved and improved; 2) degraded land rehabilitated;3) sustainable wood fuel harvesting; 4) achieving carrying capacity (balancing livestocknumbers to available pastures); 5) promoting community cohesion; 6) improving health and wellbeing; 7) empowering women and vulnerable groups; 8) job creation;
60 HOW TREES AND PEOPLE CAN CO-ADAPT TO CLIMATE CHANGE

9) promoting secure access to land; 10) promoting participation; 11) reducing vulnerabilityand risks; 12) increased incomes to farmers; 13) improved local economic conditions; 14) increased investment; and 15) improved agricultural production.
Closely examining the codes was the first step. This involved identification of the provisionsof the codes that were conflicting and had the potential to work against the aims and objectives formulated to guide the sustainability appraisals. In order to determine the degree to which different policies/provisions of the codes supported or worked againsteach other at the local level, a compatibility analysis was undertaken using a compatibilitymatrix. This was accompanied by compatibility analysis record sheets (used as a record of all issues and reasons explaining either incompatibility or compatibility). In the Malian case, there were five incompatible provisions of the Forestry Codes that were subjected tothe three-point criteria test.
i) Current use of protected indigenous native tree species.
ii) On-farm protection of native tree species.
iii) Compliance with access, use and management rules.
iv) Use of police to enforce the law.
v) State ownership of land and protected indigenous tree species.
Foresters and other resource persons were trained on the sustainability matrices as well as in building a consensus on the significant determinants they considered as structuring the current forestry policy in Mali, Niger and Senegal. With resource persons and foresters, the researchers isolated the critical factors that seemed to have greater impacts on naturalresources management, socio-cultural cohesion and local economic conditions.
To complement the sustainability appraisal other tools are also recommended. In the Sahelian case, researchers used participatory action research to: 1) enable communities to develop geospatial perceptions of landscapes by capturing geophysical features, locatingdifferent land uses, delineating access rights and defining their relationship to particularnatural resources; 2) understanding the links between the provisions of the forestry law,practice and impacts on natural resource utilisation and management; 3) identifying rolesthrough understanding the rights, responsibilities and benefits of different stakeholdersand their relationships; and 4) establishing the potential or existing impacts of the criticalprovisions identified through the compatibility analysis. The participatory action researchwas useful in re-thinking, negotiating and re-evaluating the law.
REDUCING VULNERABILITY IN MULTIFUNCTIONAL LANDSCAPES 61


E. Trees as providers of environmental services in
multifunctional landscapes
There are several main points in this chapter.
�Farmers plant trees primarily for their products and see environmental services as a ‘co-benefit’
�Trade-offs between the provision of goods and environmental services need to be acknowledged and, where possible, quantified
Trees as providers of environmental services in multifunctional landscapes
are vulnerable to climate change
Section III
Ramni Jamnadass, Aster Gebrekirstos, Henry Neufeldt, Catherine Muthuri, Ian Dawson, Roeland Kindt, Ylva Nyberg, Johannes Dietz, Jules Bayala, Shem Kuyah, Chin K. Ong,
Carmen Sotelo Montes, John Weber, Kurniatun Hairiah and Meine van Noordwijk
In this section we provide a more in-depth look at the role trees play in the provision of goods and services in multifunctional landscapes. Tree growth is, however, vulnerable to climate variability,depending on the physiological properties of the tree and characteristics of the site. A further quantification of climate variability and climate change is needed to advise on what types of treescan be grown where, to be ready for the likely local climate-change during their lifetime. This leads to a discussion of the two-way relationship between climate change adaptation and rewards forenvironmental services in multifunctional landscapes as a way to reduce vulnerability to climatechange.

�Species’ diversity and genetic variation support ecosystem functions
�Domestication for value chains can support tree diversity
�Challenges exist in realising the benefits trees can provide: as germplasm exchange is restricted; the harvesting of trees on farm faces rules designed for protecting forests;and economy-of-scale effects disadvantage smallholders
Trees provide important environmental services in a wide range of forest and farm landscapes. These services include soil, spring, stream and watershed protection, soil fertility replenishment,biodiversity conservation, storing of carbon, and cultural values and aesthetic qualities, among other functions. For example, trees in streambeds slow water flows, reduce ‘flash floods’ downstream, and may enhance the functioning of local floodplains for water and sedimentretention; nitrogen fixation by perennial legumes fertilises soil; ‘safety-net’ roots below the main crop root zone can intercept nutrients otherwise leaching out of the system; while deep rootsimprove soil structure and allow ‘mining’ of nutrients well below the soil surface.
It is estimated that, worldwide, approximately 560 million people live in agricultural ecosystemswith more than 10% tree cover (Figure D.4, Zomer et al. 2009). When an active tree retentionand/or planting culture exists in such communities, hundreds of tree species can be found in agricultural landscapes that form important reservoirs of biodiversity. Perceptions of their influence on water flows vary with context and ownership of the trees. The same farmland treesalso play a role in promoting forest integrity under climate change. This is because they can help maintain the connectivity between the natural forest fragments that remain in the landscape,thereby enhancing gene flows and hence the ability of wild tree stands to adapt to environmentalalterations. How effective farmland trees are in this regard depends on the particular locations,overall census numbers and sources of specific species in the agricultural landscape. Common trees that are more evenly dispersed will be more effective in ensuring connectivity.
Although trees provide valuable environmental services, these functions are not generally the primary reason why farmers retain, manage and/or plant them. Rather, the impetus for cultivationis the value of the other products trees can provide, such as timber, food, medicines and energy,products with immediate and clearly apparent benefits to farmers’ livelihoods. A wide diversity of several thousand trees species are cultivated for such products, as illustrated by the WorldAgroforestry Centre’s Agroforestree Database (www.worldagroforestry.org), which lists the roles of many of the trees commonly planted or retained by smallholders.
Many species are grown by farmers for a number of different uses and the particular use depends on specific household needs and the availability of markets for particular products. This in turn determines the specific traits needed in planting material and the particular ways in which trees
16are managed on farms. Rarely will a single tree ‘ideotype’ be available that fulfils a broad range of functions of a tree optimally, because such combinations of traits simply do not exist in nature and most trees are semi-domesticated at best. Unfortunately, in most developing countries, there arevery few concerted efforts on tree improvement. This highlights the need for attention on selection and breeding that may result in significant productivity gains for specific functions.
Trees for goods and services
Farmers plant trees for their products
16 The idealised appearance of a plant variety
64 HOW TREES AND PEOPLE CAN CO-ADAPT TO CLIMATE CHANGE
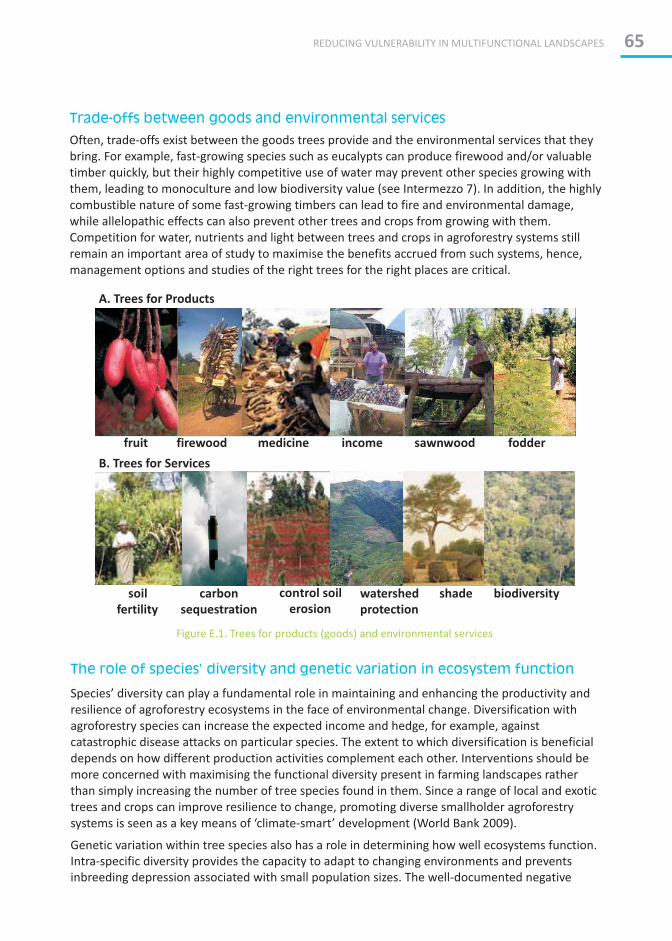
Trade-offs between goods and environmental services
Often, trade-offs exist between the goods trees provide and the environmental services that they bring. For example, fast-growing species such as eucalypts can produce firewood and/or valuabletimber quickly, but their highly competitive use of water may prevent other species growing with them, leading to monoculture and low biodiversity value (see Intermezzo 7). In addition, the highly combustible nature of some fast-growing timbers can lead to fire and environmental damage,while allelopathic effects can also prevent other trees and crops from growing with them. Competition for water, nutrients and light between trees and crops in agroforestry systems stillremain an important area of study to maximise the benefits accrued from such systems, hence, management options and studies of the right trees for the right places are critical.
Figure E.1. Trees for products (goods) and environmental services
fruit firewood medicine income sawnwood fodder
A. Trees for Products
B. Trees for Services
carbon
sequestration
control soil
erosion
watershed
protection
shade biodiversitysoil
fertility
The role of species’ diversity and genetic variation in ecosystem function
Species’ diversity can play a fundamental role in maintaining and enhancing the productivity and resilience of agroforestry ecosystems in the face of environmental change. Diversification with agroforestry species can increase the expected income and hedge, for example, againstcatastrophic disease attacks on particular species. The extent to which diversification is beneficialdepends on how different production activities complement each other. Interventions should be more concerned with maximising the functional diversity present in farming landscapes ratherthan simply increasing the number of tree species found in them. Since a range of local and exotictrees and crops can improve resilience to change, promoting diverse smallholder agroforestrysystems is seen as a key means of ‘climate-smart’ development (World Bank 2009).
Genetic variation within tree species also has a role in determining how well ecosystems function. Intra-specific diversity provides the capacity to adapt to changing environments and preventsinbreeding depression associated with small population sizes. The well-documented negative
REDUCING VULNERABILITY IN MULTIFUNCTIONAL LANDSCAPES 65

effects of inbreeding in trees include low seedling vigour, poor growth form and high risks of population and/or species extinction: both productivity and conservation concerns for landscapes as a whole therefore follow. Maintaining high genetic variation in tree species is an importantconcern under climate change, especially as anthropogenic warming may negatively affect the pollinators that are responsible for allowing the mating between trees that maintain geneticdiversity in agricultural landscapes.
Tree domestication and diversification tends to focus on bringing useful and profitable tree species into cultivation. Within the context of climate change, this can mean exploring the new marketopportunities that global warming presents. The cultivation of biofuel trees to mitigate climatechange is one such opportunity (FAO 2008). Candidate species include the small tree Jatropha
curcas (jatropha), from which biodiesel can be extracted from seed. This tree originated in Latin America, but has been planted as a medicinal tree for many centuries. The sudden increase in interest in this biofuel source has not been matched by appropriate tree germplasm and yields have remained below expectation. Realising greater mitigation benefits and higher revenues forfarmers will require coordinated international exchange of higher-performing germplasm and the same can be expected for other ‘bioenergy’ trees like Thevetia peruviana (yellow oleander) and Croton megalocarpus. Climate change challenges of human disease and malnutrition, while clearly unwelcome, can provide further market opportunities for smallholders. This will be the case if farmers are able to grow medicinal trees such as Warburgis ugandensis and Azadirachta indica to treat increased disease incidence and also cultivate appropriate fruit trees to enhance consumption of nutritious foods, thereby combating micronutrient deficiencies in affected areas.Planting of these trees can be motivated by cultural factors and hence contribute to a realisation of cultural ecosystem services.
More efficient ways to get planting material to farmers—appropriately adapted and well-suited forfunction–is the key in responding to the challenge of climate change. Unless germplasm deliverysystems are improved from their current poor performance, farmers will be unwilling to grow new
Domestication for value chains can support tree diversity
Challenges in realising benefits
66 HOW TREES AND PEOPLE CAN CO-ADAPT TO CLIMATE CHANGE
Intermezzo 9.
Eucalyptus is a fast-growing tree and is popular as a cash crop with many smallholders in EastAfrica. The dilemma over the use of eucalyptus for social, economic and environmental purposes is a matter of great concern in the region (Ong 2003). On the one hand, it is highly productive with a high value in local markets. It grows fast and is resilient in diverse agro-ecological zones. Eucalyptushas multiple uses providing both goods and services, for example, timber, fuel and medicinal products such as eucalyptus essential oil. On the other hand, there are public concerns thatwidespread planting of eucalyptus might deplete water resources (Figure E.2), reduce stream flow and, in some instances, lead to the drying of rivers owing to high water consumption (Smettemand Harper 2009). Eucalyptus trees also compete with crops for water and nutrients and mayinhibit the germination and growth of certain crops (Jagger and Pender 2003). Other concernsinclude reduction in biodiversity and increased flooding through modified soil conditions. In addition, there is slow litter decomposition, hence, failure to produce humus, reduced penetrationof water to the soil, and occurrence of pests, for example, Blue Gum Chalcid in Kenya.
The eucalyptus debate on tree water use

REDUCING VULNERABILITY IN MULTIFUNCTIONAL LANDSCAPES 67
Figure E.2. Time course of water deficits of threeEucalyptus clones—Cordia africana and Grevillearobusta—between October 2005 and March 2006 in semi-arid (Thika) Kenya. Source: Shem et al. 2009
In Kenya and South Africa, the introduction of hybrid or cloned eucalypts with evenfaster growth rates has raisednew concerns. Therefore, thereis an urgent need to criticallyassess how hard the evidence is, particularly with regard to water use. Preliminary resultsfrom studies of six months-old seedlings of different treespecies, including eucalyptus,(Figure E.3) indicated that eucalyptus had a lower but insignificantly different water-use efficiency (WUE), that is, the ratio of water used per dry matter produced, compared tothe other species under study.Similar findings were reportedin South Africa (Dye and Gush 2008), where the WUE of eucalyptus plantations weresimilar to the indigenous species but the sap flow of the latter was relatively low.
These studies raise the issue of trade-offs between eucalyptus' water use and biomass and where in the landscape to plant it. The South African study recommended that 'indigenous species' would have a low impact on catchments' water yields. This has resulted in the mass removal of eucalyptus trees from water catchments. The same trend is happening in Kenya where there is a directive to cut down eucalypts in the riparian zone in order toincrease stream flow. Ecologically speaking, the presumed difference between'indigenous' and 'exotic' depends on the practice of introducing fast-growing exotics ratherthan slow-growing ones; growth rate and associated water use is the issue, not the biogeographic origin of a tree.
The sharing of scientific information and perceptions of various stakeholders is critical forthe wise use of a potentially useful species in a region which has undergone a dramaticdecline in forest cover and is facing a growing deficit in wood energy and production.Research on alternative trees with comparative growth rates to eucalyptus but moreconservative water use is critical in view of climate change (Ong et al. 2006).
Figure E.3. Water-use efficiency (WUE) of six months-old potted seedlings from different tree species grown in Juja, Kenya. Source: Muthuri et al. 2008

Intermezzo 10.
Coffee agroforestry systems are intermediate between forest and monoculture coffee in many aspects of above- and belowground biodiversity and related functions. For the farmer,however, the balance of positive and negative aspects of diversity needs to be understood in relation to key processes such as nutrient and water uptake, slope and topsoil integrity and harvestable yield. Climate variability affects water availability, modulated by the pattern of infiltration and water-holding capacity of the soil, but also through pest and disease relationships that influence root functions in water uptake. In the Way Besai catchment(Sumberjaya, Lampung, Indonesia) that has seen a rapid transformation towards coffee in the past three decades, researchers surveyed earthworm, nematode and termite diversityprofiles of forest, coffee agroforestry, simple shade-tree plus coffee mixtures, and coffeemonocultures. The soil-fauna studies were combined with measurement of soil macroporosity, surface runoff and coffee yields. Four relatively large-bodied nativeearthworms were lost upon forest conversion, with six exotic and smaller-bodied wormsreplacing them. The nematode fauna shifted towards plant-parasitic genera, especially wherea grass/weed understory was present. Shade trees depress ground vegetation through litter,reducing plant parasitic nematodes, but enhancing earthworms. Gliricidia sepium, a favouritenitrogen-fixing companion tree of coffee, is toxic for earthworms as well as plant parasiticnematodes, while banana stimulates the nematodes and provides direct yields to the farmer.Termites can shift from beneficial to pest status depending on the availability of woodydebris in the system. Overall, the multispecies coffee agroforestry systems are more robustto climate variability, partially through these biotic interactions with soil fauna. Farmerknowledge tends to focus on what is visible aboveground and rationalises the benefits and negative impacts of various companion trees in terms of 'hot' or 'cold' soil properties.Although these terms do not directly relate to temperature, management towards 'cold' components can buffer them against the effects of global warming.
68 HOW TREES AND PEOPLE CAN CO-ADAPT TO CLIMATE CHANGE
species to service new markets or will simply be unable to do so (Graudal and Lillesø 2007). Lack of experience and clarity, at least in the public domain, on the introduction and implications of newly introduced tree species like Prosopis juliflora could work against the introduction of high-quality germplasm. In developing any new market, the danger is that this will be coupled with over-exploitation of existing resources, agricultural intensification and a tendency to monoculture,which may in turn decrease the diversity and, hence, resilience of landscapes. In other words,when developing new markets to combat the effects of climate change, the result mayparadoxically be that agricultural landscapes end up being less adaptable to environmentalalterations. This is unless appropriate actions are taken to more effectively combine livelihoods’development with environmental concerns.
Finally, much remains unknown about how the environmental services realised by trees arethemselves dependent on climate. The impacts of climate change on most trees of interest to smallholders are little researched, including issues such as how change will influence above- and belowground growth, affect the ability to sequester carbon, change phenology (for example, leaf fall, flowering, fruiting) and determine persistence. The impact of climate on these factors will determine the environmental benefits that can be realised through tree cultivation in the future.
Shade, litter, nematodes, earthworms, termites and companion trees in coffee agroforestry in Indonesia relation to climate resilience

F. Tree growth and dependence on climate
The main point of this chapter is that trees exhibit a range of growth responses and adaptivestrategies to differences in environmental factors. A changing climate alters an individual tree’sliving conditions, recruitment, survival and competitive abilities and through this brings about changes in the composition and dynamics of ecosystems. At the same time, tree species can cope with environmental change by migrating through seed dispersal to new habitats where siteconditions are more favourable and can persist at given locations during extreme weather eventssuch as droughts. The resilience of tree species to fast and extreme climate change is, however, not well understood. Identifying the impact of climate variability on tree growth, therefore, has greatimportance for understanding the reaction of trees to anthropogenic climate change and the contribution of trees to the global carbon cycle.
The geographic distribution of trees is influenced by environmental conditions such as temperatureand rainfall (Table F.1). Global warming will have profound effects on the world’s biota throughinfluencing these factors. This will cause large-scale redistribution of the growth domains in which particular trees and forest assemblages can thrive. In fact, drastic changes in floral distributionhave been a feature of past natural climate change and were experienced during the quaternaryice age. Fossil pollen records and molecular genetic studies, for example, demonstrate that temperate species such as American beech (Fagus grandifolia) and red maple (Acer rubrum)expanded in distribution from ‘refugia’ at a rate of around 100 m per year after the Last Glacial Maximum (LGM). In tropical regions, fewer pollen records are available to assess past migrations,but molecular genetic studies suggest, for example, that the important and threatened African medicinal tree, red stinkwood (Prunus africana), expanded rapidly in range after the LGM,although certain geographic features (such as the dry Rift Valley in Kenya) acted as barriers to migration in particular regions.
Broad patterns: current relations, zones
REDUCING VULNERABILITY IN MULTIFUNCTIONAL LANDSCAPES 69
Figure E.4. Interactionsbetween coffee and companion trees involvemany separate processesfor scientists (numbersrefer to chapter titles in van Noordwijk et al. 2004)

Tree resilience from physiology to population level
Trees as keepers of climate history records
Trees respond to changing environmental conditions at different temporal scales, down to within a few minutes of an alteration. The sum of those activities of a tree, that is, its physiologicalprocesses, are expressed in a very complex way in its structure. The basic pattern of cell distribution and cell size is genetically determined, however, it is influenced by external factors to the extent that a large structural variation occurs. Acclimatisation (as an aspect of phenotypic plasticity) is evident in the variation of cell wall thickness, cell size, length and shoots, needles and ring width, but also in the overall shape and architecture a tree attains. Impacts on growthexpressed through ring-width series can allow the reconstruction of inter-annual and even multi-decadal climatic variation.
Future climate variability will determine the success or failure of trees already established or planted now. We can learn from the ways trees responded to past variability through the study of ‘growth rings’ in trees or ‘dendrochronology’. Time-keeping by trees (that is, dendrochronology)with modern techniques of analysis (Cook and Kairiukstis 1990) has wide application in environmental research (dendroecology), hydrology, glaciology, tectonics/volcanism,geomorphology, in forestry sciences and in climate-change research.
Trees grow radially by adding new layers of wood cells on the inner side of the ‘cambium’. The size,type and cell-wall thickness of wood cells can be modified by external factors. The factors that exert direct or indirect influence on the width and appearance of the annual rings include radiation, temperature, availability of mineral nutrients, water supply and duration of photoperiod(Larcher 2003). A cross section of Acacia tortilis wood (Figure F.2) shows variation in vessel sizesand wood density, reflecting seasonal and inter-annual changes in growth conditions marked by tangential parenchyma bands.
In order to interpret growth rings as a reflection of climate variability, sites need to be selectedwhere other sources of variation on tree growth are small or well understood. For time series analysis, replicate tree samples (about 15 per site) are needed, with visual and statisticalapproaches to guarantee correct cross-dating. Visual techniques utilise pointer years (extremelywide or narrow rings), which can be used to recognise missing or additional (‘false’) rings. Longertime series can be made using archaeological and fossil wood. Similarity of individual curves canbe tested statistically with computer programs such as Tree-Ring Chronology Quality ControlAnalysis (COFECHA) or Time Series Analysis and Presentation (TSAP). Corrections for growthpatterns along the typical lifecycle of a tree are needed to interpret correlation with climate data.
12 13Isotope analysis of wood (C /C ratio) can be used to recognise water stress at the time of wood formation.
Trees forming annual growth rings are found in many regions of the world. With the strong climateseasonality in temperate climates, growth-ring patterns are used as a climate proxy to reconstructclimate for the past 10 000 years. It has been widely assumed that tropical trees do not formannual rings, but many authors have succeeded in using tree rings in tropical trees to determinetree age, understand growth dynamics and to carry out ecological and climate studies (Worbes1999). In climates with at least two arid months, growth boundaries are usually visible, although distinct bi-modal dry seasons can cause two rings per year. For example, Gebrekirstos et al. (2008, 2011) found for the savannah woodlands of Ethiopia that there was a strong link between tree-ring width and precipitation records (Figure F.1). Furthermore, the co-occurring species (Acacia
70 HOW TREES AND PEOPLE CAN CO-ADAPT TO CLIMATE CHANGE

senegal, A. seyal, A. tortilis and Balanites aegyptiaca) showed similar responses to external climateforcing, which confirms the formation of one tree-ring per year. Narrow rings correlatedremarkably well with past El Niño events and drought/famine periods. Spectral analysis of the mean tree-ring chronology indicated occurrences of periodic drought events, which fell within the spectral peak of the ENSO cycle of 2–8 years. Once calibrated, trees can be used to understandpast climate variability in locations where other climate data are scarce (Figure F.1).
Figure F.1. Mean chronology of four co-occurring tree species from semi-arid woodlands in Ethiopiaand rainy season precipitation (June to September). Arrows indicate pointer years (narrow rings), which are correlated with El Niño events and drought/famine periods in Ethiopia. Source:Gebrekirstos et al. 2008
Figure F.2. Cross-section of Acacia tortilis. Arrows indicateannual growth boundaries characterised by tangentialparenchyma bands
REDUCING VULNERABILITY IN MULTIFUNCTIONAL LANDSCAPES 71

Challenges of climate variability for trees
Climate change also influences the phenology of tree species, including the timing of leafemergence, flower initiation and growth, and this varies between different trees. Trees oftendemonstrate a range of features that can be expected to facilitate adaptive responses to a varietyof challenges including climate change, large populations, out crossing, high seed production and high genetic variation in morphology and physiology. All these factors favour the establishment of genotypes containing novel allelic combinations that may be better suited to new conditions.
For example, mangroves have high reproductive output and high rates of seedling establishment,which might lead to the assumption that fecundity can compensate for intense harvesting.Coppicing, the ability to produce new shoots from the cut stump or 'stool', is a key element of resilience to disturbance in savannah and Miombo woodlands where successful regeneration byseed is highly susceptible to rainfall seasonality and frequent fire. Trees that produce deep rootscan access soil moisture at greater depths than other plants, allowing them to extend their growing period and persist through drought conditions when other plants die. The time taken fordieback of adult trees owing to drought should, however, not be over-estimated and should be considered in periods of months or at most a few years rather than decades. In an experiment in Amazonian forest in which rain through-fall was restricted, Nepstad et al. (2007) demonstrated a lag of three years before the onset of increased mature tree mortality owing to water limitation.
Table F.1: The most important limiting climatic factors for tree growth in major climate zones
Subpolar and borealzones
Humid temperatezone
Arid/subtropical zone Humid/tropicalzone
Upper treeline Coniferous forest
Warm/dry conditionsare favourable
Coniferous forest
Warm/dry conditionsare favourable
Coniferous forest ordeciduousbroadleaved forest
Warm winters/ moistsummer conditionsare favourable
Evergreen forest
Warm/dryconditions arefavourable
Central region Coniferous forest/deciduousbroadleaved forest
Warm/dry conditionsare favourable
Deciduousbroadleaved forest
Warm/humidconditions arefavourable
Evergreen ordeciduous
Cool /humidconditions arefavourable
Evergreenbroadleaved forest
Cool/humidconditions arefavourable
Lower tree limit Not existing Not existing Savannas
Limitation by drought
If existing(savannas),cool/humidconditions arefavourable
water availability
72 HOW TREES AND PEOPLE CAN CO-ADAPT TO CLIMATE CHANGE

An essential trait of plants adapted to low-resource environments is that they grow slowly evenwhen an optimal supply of resources is provided. A study on water relations of co-occurring savannah trees coupled with long-term climate growth analysis by Gebrekirstos et al. (2006, 2008) revealed that Acacia senegal and Acacia seyal showed a marked growth reduction during droughtyears and recovered to a favourable growth during wet years, which is consistent to their droughtsensitivity and opportunistic water-use strategy. In contrast, the drought-tolerant and conservativewater users Acacia tortilis and Balanites aegyptiaca seemed to exhibit relatively small growthreduction and increase in response to drought and wet years, respectively. In addition, slow-growing trees invest more in defence against herbivores and pathogens and allocate a higher proportion of their assimilate in a large root system and higher wood density, thus increasing their survival chances in uncertain environments.
Legend: Solid arrows: material flows (water in left part, carbon in the right); broken line arrows: influences; solid boxes: main fluxes of interest
* indicates potential interest as harvestable product
Figure F.3. Relationship between water and carbon fluxes and pools in tree growth in relation toclimate (rainfall pattern, evaporative demand), soil (water flow pathways, storage)
As noted above, tree species can migrate as a response to climate change, by seed dispersal. The speed at which migration is possible depends on the reproductive biology of the species in question and can vary greatly. In general, however, the rate of movement required to combatanthropogenic climate change is greater than the natural dispersal rate in both temperate and tropical regions. At the same time, opportunities for natural migration have been reduced throughhuman activities such as logging and agriculture that result in disjunctions in natural distributions.
Conditions for plant establishment, growth and yield in arid and semi-arid areas are harsh owing tonatural and anthropogenic stresses. Of these stresses, drought and soil salinity are the main
2limiting factors. The area of arid lands worldwide, of around 45 million km , could be better used for production if these constraints could be overcome. Site–species matching and the deployment
of improved germplasm (for example, drought and salinity tolerant) could play significant roles in increasing productivity in such areas. Changes in pollinator abundance and behaviour caused byclimate change may result in reduced tree seeding in agroforestry systems and inbreeding in the
REDUCING VULNERABILITY IN MULTIFUNCTIONAL LANDSCAPES 73

seed that is produced. For trees that are specifically grown by smallholders for their fruit and nut products, reduced pollination may have significant direct impacts on production. In such cases, losses in productivity could be very large and active management interventions such as introductions of animal vectors (for example, through promoting bee-keeping) may be required.
Climate change effects on tree pest and disease prevalence will often be of most concern. A stronglink between infestation and stress of some sort, often related to drought, has been observed in Africa. Warmer and drier climates may exacerbate stress in trees resulting in more areas being predisposed to insect pest attack. Devastating attacks on lodgepole pine (Pinus contorta) forests in Canada by the mountain pine beetle (Dendroctonus ponderosae) are attributed to milder wintersowing to global warming. In this instance, higher winter temperatures have resulted in lowermortality in over-wintering stages of the insect and significant economic losses in timberproduction have resulted. Conventional breeding approaches to address these new threats arelikely to be unsuccessful because the time scales involved in breeding are too long.
In the case of planted trees, human translocation of well-adapted germplasm across sites to matchfuture climate is an option, presuming that climate-change models can, with some certainty,predict how the environment will alter at given locations at given time scales, in order to allow forproper matching. To date, actual examples where 'climate-change matching' has been put intopractice for agroforestry species are limited, but one good case is provided by Prosopis africana in the semi-arid West African Sahel. Based on an analysis of growth, survival and wood density in field trials in relation to regional rainfall patterns, it was recommended that germplasm transfersof this species should be undertaken in one direction only: from drier to wetter zones/countries(Weber et al. 2008). This advice is in response to drying in the region over the last few decades. A similar distribution strategy for other tree species in Burkina Faso, Guinea, Mali, Niger and Senegalwas adopted in a recent International Fund for Agricultural Development project to rebuild and diversify parkland agroforestry systems.
Current centralised models for delivering tree germplasm to smallholders have failed to meet the demand of farmers for tree seed and seedlings. To combat this constraint, in recent decades a participatory approach to tree domestication has been promoted, in which farmers areencouraged to collect and bring into cultivation the genetic resources of indigenous tree species that they find in the landscapes immediately around them. But in the context of rapidenvironmental change that results in significant geographic shifts in planting domains, it is evidentthat local sourcing will no longer be an adequate response for germplasm sourcing, because the scale of change will be too great. So there needs to be a revitalisation of national tree seed programs to facilitate the long-distance germplasm transfers that are needed to cope with climatechange and a renewed engagement of these programs with local communities so that they can access newly-introduced material.
More wide-ranging international trials are needed to evaluate the characteristics of a broader set of tree species for factors that relate to climate-change responses (such as water-use efficiency,salt tolerance and resistance to key pests and diseases). However, between-country transfer of tree seed for research is becoming more difficult and costly as nations seek to protect their own resources under the Convention on Biological Diversity. There appears to be a lack of collectiveaction, with no one benefitting other than the regulators and managers of the bureaucracy of
Challenges and opportunities of climate variability for people dealing with
trees
74 HOW TREES AND PEOPLE CAN CO-ADAPT TO CLIMATE CHANGE

permits. Future success in addressing climate-change challenges will require recognition by the global community that more effective systems for facilitating germplasm exchange for researchpurposes are required.
Intermezzo 11.
Tree–climate matching: use of existing databases
Like any other plant, tree species occur in biogeographically distinct areas that are based on the history of dispersal opportunities. Anthropogenic dispersal may have turned them into‘invasive exotics’ in new areas. Within their biogeographical range, trees and other plants only grow in places where they can at least tolerate the abiotic conditions (such as temperature and water availability that depend in turn on climate and soil) and survive the biotic interactions with other species such as seed dispersers, pollinators, microsymbionts,competitors and diseases (Guisan and Thuiller 2005, Soberón and Peterson 2005). Climatechange directly affects only part of this complex of factors.
The WorldClim site (http://www.worldclim.org) provides current and IPCC scenario data at a 1 km resolution. A crude first approach could be to combine the climatic rangeinformation, for example, of the Agroforestree tree database, with future climate for anyplace of interest. This approach, however, ignores the biotic interactions and the associated‘management cost’ of growing a desired tree in a given place. For natural vegetation this will not be sufficient. A number of modelling approaches, including the ‘maximum entropy’approach of the MAXENT model (Phillips et al. 2006) or boosted regression trees (Friedman et al. 2000) have outperformed more established methods of species suitability mapping (Elith et al. 2006). Where less than 30 occurrence records exist, no model can do well (Wiszet al. 2008).
In the ‘Vegetation and climate change in Eastern Africa’ project, a high resolution digitalmap will be prepared for seven countries in Eastern and Southern Africa (Kenya, Ethiopia,Uganda, Rwanda, Tanzania, Malawi and Zambia). The purpose is 1) to identify the main zones of transitions that influence agricultural potential; 2) to predict potential (current and future) distributions of indigenous species in the agricultural landscapes and predictpossible genetic variation across distributional ranges; 3) to assist choice of indigenous and exotic tree species for specified purposes in specific locations.
REDUCING VULNERABILITY IN MULTIFUNCTIONAL LANDSCAPES 75

Intermezzo 12.
LAAMAs in rural Africa?
Figure C.5 introduced the concept of Locally Appropriate Adaptation and Mitigation Actionor LAAMA. What sort of beasts are these LAAMAs? What can they look like in practice?How much diversity can we expect among them? The rationale for adaptation planning is the concern that climate change will further exacerbate current climatic risks from naturalclimate variability. The rural population in Africa is expected to be among the mostexposed, as about 80% depend predominately on small-scale agriculture. Rainfedagriculture is one of the most vulnerable sectors to climate change. A good understandingof the agricultural systems embedded in a landscape is crucial to identifying climate-changeimpacts that farmers need to adapt to strategically. Two projects in which the WorldAgroforestry Centre cooperates with partners in Germany and with national and localinstitutions in Tanzania and Burkina Faso serve as examples of reconciling the uniqueness of each landscape system with a generalised approach for viable climate-changeadaptation.
Two scales of trans-disciplinary approaches are suggested to analyse, model and finally integrate all relevant components of agro-landscapes. Land-use functions, aggregatingindicators from the three pillars of sustainability, allow for reducing complexity to a reasonable measure.
1) The project striving for Resilient Agro-landscapes to Climate Change in Tanzania operatesat a sub-national watershed level, with a focus on socio-economic preconditions and constraints in a region that has already experienced frequent failures of at least one of the rainy seasons. 2) In Burkina Faso, the Adaptation of Land-Use to Climate Change in sub-Saharan Africa project covers a gradient of increasing aridity on a nation-wide grid of observation and trial sites.
Both projects aim to support adaptation planning based on modelled scenarios of possible futures. They test a nested multifunctional landscape approach to cater for the complexityof agro-landscapes and their inhabitants. Both projects have similar aims.
�Use modeling to improve the understanding of climate variability in the studyregion and their impacts on current land-use systems and respectiveenvironmental, social and economic pressures.
�Assess smallholder constraints and opportunities with regard to scenario-basedpotential climate-change impacts on agriculture and land-use functions.
�Identify a range of suitable good practices in terms of adapted land-use systemsfor improving the overall adaptive capacity of rural households.
�Make model outputs from different disciplines meaningful for local decision-makers by mirroring them with farmers’ perceptions and needs.
The projects identified five essential components for reasonable adaptation planning in the African smallholder context. As these components are interdependent (Figure G.6), the projects aim at feeding the (modelled) projections from one component as input to a directly related other component. This mutual feedback mechanism is expected to improvethe validity of these projections and the applicability of their recommendations:
76 HOW TREES AND PEOPLE CAN CO-ADAPT TO CLIMATE CHANGE

�Records of past and current climate are compiled to understand currentconstraint and common climate variability. Alternative data sources—such as dendrochronological assessments or drought-relief records—can enhance these data. Historic climate data is also required to calibrate models that allow down-scaling of global circulation models to a fine spatial and temporal scale.
�Remote sensing of vegetation structure and patterns of land-use change and geographic information systems' approaches allow for subsequent upscaling of local model outputs. Vegetation models provide spatially explicitrecommendations, for example, for the choice of tree species suitable for futureclimate scenarios.
�Hydrological models need to be validated on a sub-catchment level and subsequently expanded to water basin scale. These models, in turn, depend on land-use change data and scenarios as well as adequate soil data to providereliable projections of the larger-scale water budget under each climate-changescenario.
�Soil-crop-tree interactions and plants' competition for space, light, water and nutrients is simulated using adequate and locally validated models (for example,Soil-Vegetation-Atmosphere Transfer (SVAT), Decision Support System forAgrotechnology Transfer (DSSAT), Water, Nutrient and Light Capture in Agroforestry Systems (WaNuLCAS). These models deliver the future distributionof vegetation types and optimised cropping systems based on their habitatrequirements and climate scenarios.
�Farmers' participation essentially provides an understanding of locally appliedadaptation measures and the socio-economic constraints of smallholder farmersin the study regions. Stakeholder meetings, workshops and interviews are an important tool for feedback and for validating the acceptance and adoption of proposed adaptation strategies among stakeholders.
Figure G.6. Modular scheme of an interdisciplinary approachto assess climate-changeimpacts and developadaptation options forstakeholders
REDUCING VULNERABILITY IN MULTIFUNCTIONAL LANDSCAPES 77

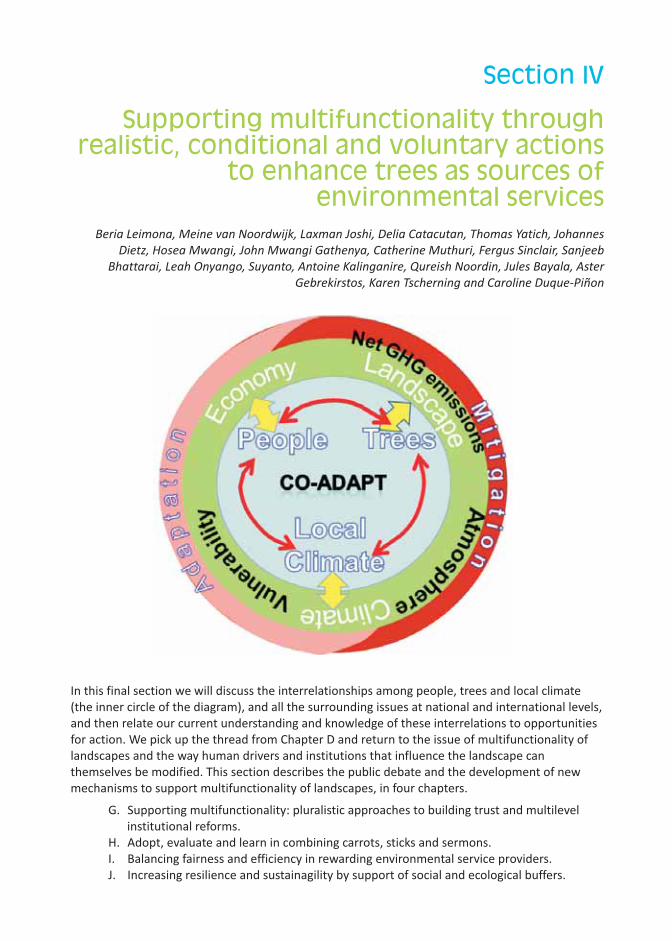
In this final section we will discuss the interrelationships among people, trees and local climate(the inner circle of the diagram), and all the surrounding issues at national and international levels,and then relate our current understanding and knowledge of these interrelations to opportunities for action. We pick up the thread from Chapter D and return to the issue of multifunctionality of landscapes and the way human drivers and institutions that influence the landscape canthemselves be modified. This section describes the public debate and the development of new mechanisms to support multifunctionality of landscapes, in four chapters.
G. Supporting multifunctionality: pluralistic approaches to building trust and multilevelinstitutional reforms.
H. Adopt, evaluate and learn in combining carrots, sticks and sermons.I. Balancing fairness and efficiency in rewarding environmental service providers.J. Increasing resilience and sustainagility by support of social and ecological buffers.
Supporting multifunctionality through realistic, conditional and voluntary actions
to enhance trees as sources of environmental services
Section IV
Beria Leimona, Meine van Noordwijk, Laxman Joshi, Delia Catacutan, Thomas Yatich, Johannes
Dietz, Hosea Mwangi, John Mwangi Gathenya, Catherine Muthuri, Fergus Sinclair, Sanjeeb
Bhattarai, Leah Onyango, Suyanto, Antoine Kalinganire, Qureish Noordin, Jules Bayala, Aster
Gebrekirstos, Karen Tscherning and Caroline Duque-Piñon

Realising win-win solutions and balancing livelihoods and ecological functions will requireinnovative approaches. These, however, are still in the early stages of learning, although they havebeen tested in various contexts. Implementation at larger scale will require human and financial resources as well as political will. Solutions will have to transcend current sectoral approaches that distinguish forests from the rest of the landscape and see the forestry, agriculture and processingsectors as separate, with the planning of physical infrastructure such as roads independent of their likely environmental impacts. Effective cross-sectoral institutions that pursue innovativeapproaches to achieve win-win solutions will build on, review and reform existing institutions. In reversing the trend of current loss and rebuilding multifunctionality as part of climate-changeadaptation, the following steps are needed.
1. Create awareness of, and the capacity to do something about, these issues.
2. Explore synergies among various mechanisms and instruments for supporting multifunctionality.
3. Implement innovative incentive schemes.
4. Adopt, evaluate and learn.
It is important at this stage that systems for monitoring, reporting, evaluation and verification(MREV) look at the objectively verifiable impacts on environmental services, as well as on the social and economic processes that have been put in place. Fossilisation of institutions is one risk; constant change and lack of clarity for investors is another. So far, the global institutions for climatechange have not provided the stability needed for actors to plan their best course of action. Hopefully, global learning and building consensus will finally match the scale and urgency of the issues at stake.
The main point of this chapter is to create awareness multifunctionality and increase our capacity to appreciate pluralism. In reversing the trend of current loss and rebuilding multifunctionality as part of climate-change adaptation, such understanding can be supported by new institutionalperspectives and reform that is able to achieve several goals.
• Bridge multiple perspectives on the cause-effect relationship in providing environmentalservices and enhancing livelihoods and the implications for legality and contestedrights.
• Build trust among stakeholders as the fundamental effort in sustaining any institutionalreforms.
• Understand institutional relationships at different scales and priorities. This relates tothe previously discussed LAAMA, NAMA and GAMA in section C.
Figure G.1 shows local livelihoods and their deficits, usually indicated as ‘poverty’, as being positioned between the opportunities and demands of a national economy (itself interacting with international markets) and a local environment that is a source of tradable goods, extracted or produced, and non-tradable services. The outcome generally is that environmental services are squeezed, potentially to the level that they affect local productivity and human welfare. The reduction of natural capital (increase of biodiversity and carbon-stock deficits), that has loss of environmental services as a symptom, can be noticed by ‘downstream’ stakeholders who often see
G. Supporting multifunctionality: pluralistic approaches, trust
building and multilevel institutional reforms
80 HOW TREES AND PEOPLE CAN CO-ADAPT TO CLIMATE CHANGE

themselves as rights holders. In the resulting dynamic between downstream and upstream actors,trade-offs between local livelihoods and the interests of external environmental services’ beneficiaries play a key role. They indicate the degree to which local communities may have tosacrifice opportunities for economic gain in providing environmental services for externalbeneficiaries. However, there may also be trade-offs among different types of environmentalservices at various spatial and temporal levels. For example, a monoculture plantation with highwood density might sequester more carbon than a multispecies landscape with high biodiversityvalue. Environmental services’ beneficiaries outside the landscape can try to influence local actorsin various ways, using regulatory, incentive and facilitating approaches.
Figure G.1. Schematicrepresentation of locallivelihoods,environmental services, external beneficiariesand trade-offs among those elements
Various approaches have all attempted to promote institutional reforms for effective naturalresource management, with apparent successes and failures. Any one, or a combination of, these approaches can be more effective in institutionalising reforms in the short term but the mostimportant aspect is making the reform process itself dynamic (agile) and based on evidence, to suit the changing conditions. In this sub-chapter, we present an overview of innovative approachesused in instilling institutional reforms. Approaches have evolved from command-and-controlthrough bottom-up then to an attempt at integration. Different countries are at different stages of institutional review and reforms to mainstream climate adaptation and mitigation. The questionwe want to answer is how pluralistic, multi-objective and dynamic does institutional review and reform need to be? Herein is a synthesis of some of the innovative approaches.
A major challenge for any systematic approach to addressing governance issues is the gradation of symptoms, agents and underlying causes or ‘drivers’. For immediate visual effect it may be sufficient to focus on the symptoms, but the problem may quickly re-emerge in slightly modified form if the agents don’t change behaviour. To change the behaviour of all relevant agents, thedrivers and underlying causes must be addressed and changed.
Beyond the symptoms: dealing with issues at driver level
REDUCING VULNERABILITY IN MULTIFUNCTIONAL LANDSCAPES 81

In issues of land use and its effect on ecosystem functions, there have been many approaches to attribute measurable land-cover change to agents and drivers, potentially involving intermediatesteps and categories. The ‘response options’ can be grouped into four.
A. The direct consequences of modifying land cover for the benefit of the land user.
B. Land-use planning and the set of rules that clarify which agents are allowed to do what and where in the landscape, usually interacting with varying concepts of ownership and tenurial rights. An important element in this in most countries is the separate treatmentfor ‘forest’ categories of land cover.
C. Agent-specific payments or rewards for environmental services that are meant to shift voluntary decisions of land users towards larger benefits for external stakeholders
D. Changes in the rules and incentives for economic activities that apply to all potentialland users and that may make socially desirable land-use decisions better aligned with private optimisation of land use. An example can be found in the analysis by Martin et al. (2011): at current prices a shift to inclusion of high-value native timber species on maize farms in the Philippines is just about neutral in terms of farmer benefits but its value for Philippines’ society would be twice as high; a change in the tax (farm-growntimber is taxed as if it is a forest product) and subsidy (maize prices and fertiliser aresubsidised) could be for the benefit of all and might be sufficient to achieve greater treeplanting with multiple additional benefits for society.
Figure G.2. Feedbackloops in the logicalchain of drivers,agents, land-coverchange and consequences. Source:van Noordwijk et al. 2011a
Pluralistic approaches
The current approach in natural resource management has extended from a single administrative,regulation-based, command-and-control instrument to more pluralistic environmental policies. The need for win-win solutions for complex issues, such as conflicting interests of variousstakeholders, drives this process. Participatory approaches, decentralisation of power, recognitionof different perceptions and negotiations characterise pluralistic policy instruments. These instruments, practised in developing countries in Asia and Africa, range from creating grass-rootsinstitutions through recognising local by-laws or laws made by a non-sovereign body to applying negotiation support systems.
Negotiation support systems differ from decision support systems in that they recognise thatmultiple decision-makers interact and need to negotiate (van Noordwijk et al. 2001). To do so, a joint understanding is needed of how a landscape functions and what the consequences are for a
82 HOW TREES AND PEOPLE CAN CO-ADAPT TO CLIMATE CHANGE

range of performance indicators if there are landscape-level changes in land use, creation or closure of channels and/or filters.
Landscape models can only be used for such type of negotiation if they combine three quality criteria (Clark et al. 2011). They need to address the key questions of stakeholders (‘salience’),match observed response of the landscape to historical change and extreme events (‘credible’)and need to be perceived to be free from bias, representing the knowledge of all stakeholders(‘legitimacy’). Once such a model has been developed and tested, it can be used for negotiationsabout land-use change, clarifying the stakes involved for all. The negotiation may well involveintermediaries who establish trust with the various parties before bringing them together in directnegotiation sessions. Intermezzo 13 provides an example.
Further experience with negotiation support systems was obtained by the World AgroforestryCentre in Sahelian and East African countries, where contests over land and tree tenure betweencommunities and the state lead to continued destruction of native tree species. To ensure reformand review of these policies and legislation, policy makers need solid evidence of the impacts thatcan be expected if local communities obtain legal rights to use and manage natural resources. Pre-implementation studies of the likely impact of new policy and/or legislation are usually needed before policy change will happen. Researchers can only do so effectively if they have earned the trust of the various contestants.
Creating any initiatives to enhance both conservation and livelihoods is challenging in areas wheretensions and perception gaps exist between actors, including policy makers and local stakeholders.For example, it is more difficult to engage local stakeholders in coercive military or authoritativestates where freedom of expression and choice is inherently absent or restricted compared to a peaceful, democratic condition. Even so, in democratic states, the exercise of freedom of choice can be limited owing to lack of options or presence of threats. The biggest challenge that remainsis in educating and building the capacity of local stakeholders, balancing power and removingasymmetric information so that they are able to take their place at the negotiation table without fear of social, political or economic subjugation. Building trust requires the fundamental rights of expression and choice and underlying attributes of participation, representation, transparency and effective communication.
Figure G.3 describes the iterative steps facilitated by an intermediary to remove barriers by overcoming negative power influences. An initial condition mostly starts with unequal powerrelations with subliminal conflict between poorly organized upland communities and more solid and powerful downstream stakeholders. Better organization of the upland communities can bring the conflicts into the open. When all actors realise that the actual source of conflict is differentperceptions of how environmental services are generated and can be protected then it can bring the two sides closer. This condition is conducive for negotiation and trust-building. Further, it has the potential to develop sustainable rewards for environmental services that are based on mutual self-interest and reciprocity.
Building trust as the basis
REDUCING VULNERABILITY IN MULTIFUNCTIONAL LANDSCAPES 83

The proposed iterative steps aim to enhance trust among actors, as described above. However, wecaution that merely following the steps will not work; the facilitator must consciously ensureeffective participation and representation of all actors, transparency of negotiations and effectivecommunications.
Dealing with the vagaries of climate change and increased variability will mainly depend on existing institutional capacity and harmonisation of the implementation of climate-changeresponses at different scales. Currently, the global response to climate change is polarised at the international level with disconnection between local- and national-level responses. According toBlaikie et al. (1994) and Ribot (1995), adaptation to climate change has to be localised, given that the impacts are inevitably local. But, ultimately, adequate responses at both levels are needed.
Figure G.4 conceptualises the relationships between different policy domains horizontally and vertically and shows how nested climate-change adaptation could be addressed throughinteractions between action institutions and knowledge systems. This diagram was created for an African context but may be relevant to other developing areas.
As shown by Figure G.4, in the case of institutional analysis of climate-change adaptation, differentpolicy domains, transfers of knowledge, subsequent learning and action across scales are critical.Institutional review and reform across these scales (horizontally and vertically) and policy domains is imperative. At the horizontal level, there are sector-based policy domains (for example,agriculture, forestry, energy, water and wildlife) that relate to climate-change adaptation in different ways. The vertical relationship is limited planning and governance systems pursued by
Multiscale links in mitigating and adapting to climate change
Figure G.3. Schematic description of five stages in the relationship between groups of stakeholders
84 HOW TREES AND PEOPLE CAN CO-ADAPT TO CLIMATE CHANGE

different institutions. These domains operate vertically and lack cross-sectoral coordination yetclimate change is a cross-sectoral issue. Scientific knowledge is passed through institutions and policy domains. Factors such as levels of income, property rights, extension services provision,governance, levels of education, state of market infrastructure and proximity to urban centresdetermine the rate of adoption and expansion of agricultural innovations linked to provision of environmental services.
Institutions at the national level are charged with policy formulation and facilitatingimplementation. Lower level sub-units are mainly responsible for translating policy provisions intoactions with lessons and experiences feeding into national-level policy formulation. In the case of climate change, national-level lessons and experiences feed into regional- and international-levelnegotiations and decisions. Policies, plans, projects and programs’ implementation in differentregime structures are often not informed by research undertaken by different organizations.Implementation is affected by complexities associated with multilevel governance systems.Regional-level initiatives influence, and are shaped by, what is happening at national levels.Discussions at the international level on several policy areas and collective learning and action initiatives influence what is happening at the national and country levels. Climate-changeadaptation or any other large-scale environmental problems are then nested in different levels of governance providing opportunities of learning lessons across the different levels.
The Rewarding Upland Poor for the Environmental Services they provide (RUPES) project, Pro-poorRewards for Environmental Services in Africa (PRESA) project and REDD+ schemes are learning opportunities. These learning cycles have shown that the long-term goals are clear but the approaches at different nested levels—local, national and global—will have to evolve on the basis of experiences, some trial and error, and system analysis. Positive feedback loops betweeninternational, regional, national and community-level responses to climate change and variabilitycan be possible through institutional review and reform at national levels. Such a learning process
FORESTRY
WATER
ENERGY
TRANSPORT
AGRICULTURE
LEGEND
Figure G.4. The concept of various nested policy, knowledge and action domains in climate-change mitigation and adaptation(CAA) in the African context. Source: Yatich et al. 2008
can speed up the understanding of all involvedand, at the end, actual on-the-ground progress can be reached.
REDUCING VULNERABILITY IN MULTIFUNCTIONAL LANDSCAPES 85

Figure G.5. The 2007 Nobel Peace prize awarded to the Intergovernmental Panel on ClimateChange reflects the relationship between climate change and conflict as well as the belief and hope that an evidence-based approach can bring solutions
86 HOW TREES AND PEOPLE CAN CO-ADAPT TO CLIMATE CHANGE

Intermezzo 13.
The negotiation support system helped solved a land tenure conflict between farmers and Government in Indonesia, in the Sumberjaya watershed, Lampung province. In this area,violence flared repeatedly as the Government removed poor, squatter families from State-owned protection forests with the idea that eviction would protect the watershed.However, research conducted by the World Agroforestry Centre showed that multistratacoffee farms provided more livelihoods alternatives for these local people and also controlled erosion similar to natural forest (Verbist et al. 2010). The multistrata systemprovided a complex canopy that protected the soil surface from heavy raindrops thatcaused erosion. It also created tree litter that helped weaken the erosive force of the falling water (Hairiah et al. 2006).
At the start of the Centre's involvement, the primary impact pathway was expected toturn a negative downward spiral of conflict, environmental degradation and poverty into a positive, upward spiral of landscape co-management.
By empowering farmers' groups and by bringing science into the negotiations, the districtforestry services and farmers' groups reached an agreement on 'conditional land tenure',a unique form of Indonesian community-forestry (Hutan Kemasyarakatan/HKm) permit. The Sumberjaya permit guaranteed conditional land tenure, with more specific performance criteria compared to general HKm permits in other areas of Indonesia: permit holders must a) contribute to watershed health by practising coffee agroforestry,planting a minimum 400 trees in their coffee gardens; and b) protecting the remainingareas of natural forest. The conditional land tenure permits granted land rights to farmersfor a five-year trial period, with possible extension of up to 35 years and beyond.
Establishing trust, raising awareness on conservation issues, building capacity,strengthening local institutional capacity and identifying champions among negotiationsupport system stakeholders are the steps that initiate the NSS process. The process also has to maintain regular dialogues and policy formulation at the district and provinciallevels while linking efforts with national negotiation processes. In places where the Government owns major forest tracts, community forestry permits based on conditional land tenure can offer a path to both improved livelihoods and protection of forestservices. The Indonesian regulation mentions that this approach applies to both production and protection forests recovering from deforestation.
Monitoring activities
The forestry office of West Lampung has a guideline for monitoring HKm performance.There are several lists of indicators with a scoring system up to 100 points. The scoringsystem incorporates concerns related to institutional criteria (development of the groupto manage the permit area), conservation performance (planting trees and conservationpractices in coffee gardens) and overall impact as measured by various social, economicand ecological indicators. An assessment team gives each HKm area a score, which is used to determine whether and for how many years the HKm permit could be extended.
The negotiation support system as the basis for forestland
stewardship in Indonesia
REDUCING VULNERABILITY IN MULTIFUNCTIONAL LANDSCAPES 87

1. 35 permit is revoked2. 36–45 permit extended for one year and then re-evaluated3. 46–65 permit extended for five years and then re-evaluated4. 66 permit is extended for 35 years
Results so far
�In 2005, the criteria and indicators for HKm were approved by the localgovernment. A local policy was issued, outlining the steps for acquiring the 35-year conditional land right.
�In July 2006, 18 farmer groups received community forestry permits for a five-yeartrial. This increased the area covered from 1367 ha to 11 633 ha (70% of the protection forest now covered by conditional land tenure permits). Nearly 6400 farmers received permits.
�In December 2007, the Ministry of Forestry granted conditional land right permits for 35 years to five farmers' groups in Sumberjaya, covering an area of 1367 ha. These were the first 35-year HKm permits issued to farmers' groups in Indonesia.
Myth perceptions of forests as sole providersof watershed services
�Eviction policies for 'squatters' who had developed coffee agroforestry
�Short-term management perspectiveslead to monoculture coffee as economic optimum
�Suboptimal watershed management�Reconfirmation of forest perceptions
Persistence of rural poverty
Downward spiral of conflict
Evidence that well-managed coffeeagroforestry can provide essential watershedservices
�Eviction policies for 'squatters'replaced by negotiated land-use agreements
�Long-term management perspectivesfavour multistrata coffee agroforestrysystems as economic optimum
�Improved watershed management�Reconfirmation of positive
agroforestry perceptions
Reduction in rural poverty
Upward spiral of co-management
Figure G.6. Landscape mosaic in Sumberjaya(Lampung, Indonesia) one of the pilot sites for the RUPES project. Photo: Meine van Noordwijk
Source:http://www.worldagroforestrycentre.org/Sea/Publications/file
s/leaflet/LE0083-08.PDF
88 HOW TREES AND PEOPLE CAN CO-ADAPT TO CLIMATE CHANGE

H. Adopt, evaluate and learn in combining carrots, sticks and
sermons
There are two main points in this chapter.
�A combination of instruments—administration and regulation, incentive and disincentive, public persuasion—is needed to influence individual decision-making in managing public goods, such as environmental services produced by a multifunctional landscape.
�Environmental services’ provision and poverty alleviation are beyond a mereenvironmental services’ market transaction but stem from an interrelationship in the landscape that supports livelihoods’ systems and a wide range of actors such as environmental services’ providers (mostly local communities) and environmentalservices’ beneficiaries (private companies, their customers and government institutions,including international conventions and green development pathways and conservation).
Governance regimes and institutions for collectively managing public goods have three types of instruments to persuade or coerce their members, citizens or subordinates to comply with naturalresource management. These three instruments we call ‘carrots, sticks and sermons’. Togetherthey define disincentives and incentives for aligning individual decisions with external goals and interests (Figure H.1).
Instruments to influence individual decision-making in managing public
goods
Figure H.1. Cartoon of carrots,sticks and sermons as ways toinduce compliance with external goals
Sticks Regulatory approaches to land use, for example, by enforcing top-down land-use planning. These can often become policy impediments since they provide morebenefits for external stakeholders than for the local community.
Carrots One-off or recurrent incentives to start voluntary environmental conservation. The incentives can refer to any of the ‘five livelihoods’ framework of sustainabledevelopment (Chambers and Conway 1992): 1) natural capital (access to resources);2) human capital (support for education, health, political career opportunities); 3) social capital (standing within the community, institutional growth); 4) physical
REDUCING VULNERABILITY IN MULTIFUNCTIONAL LANDSCAPES 89

capital (road access, irrigation infrastructure); or 5) finance (direct payments,microcredit, taxation or tax-deductibles, trust funds).
Sermons Altruistic behaviour influence that fundamentally exists in any human culture.
A combination of the three types of instruments is usually needed: enforceable rules set the framewithin which voluntary actions can be rewarded. Some constraints exist in applying only a single instrument. The regulatory or administrative policy instrument, or ‘stick’, is often ignored, as wesee in the forms of illegal logging and encroachment on protected areas in many countries.Furthermore, the international conventions (international ‘stick’) might be disconnected fromnational law. For example, protecting a globally threatened IUCN Red List species does not necessary link to protection of its habitat or home range in the national protection areas. Other cases show that the application of incentive mechanisms without clear regulations can create a chaotic situation that may lead to further environmental degradation.
Local norms, or ‘sermons’, in maintaining landscape multifunctionality often exist as part of local wisdom in conserving nature. There is linguistic evidence for this in that there are many local names for agroforestry systems, such as tembawang, repong, pekarangan (Indonesian local languages), satoyama (Japanese) and taungya (Philippines). However, economic competition and population pressures shift the value of these ‘old rules’. New perspectives to combine localdevelopment and negotiation of the ‘old rules’ need to be found and deployed. In addition, ‘sermons’ mismatch at the national and global levels: the new global norms, such as genderequality, universal human rights and specific attention to indigenous peoples, have not been part of the formation of many nation states. This situation results in a fluctuation in agreement on how to do justice to the complex issue of environmental conservation and development. However, overtime, norms of behaviour with respect to environmental services are expected to shift, so that maintaining landscape multifunctionality will have to be further internalised through effectivesermons.
In conclusion, the next step in the development of institutional support for landscape multifunctionality will have to be a combined review of existing incentives (carrots), rights, de factobehaviours (sermons) and regulatory and institutional capacity for change (sticks).
Over the last decade, many ‘carrot’-type instruments or incentives have been developed under the banner of ‘payments for environmental services’ (PES). The language used to describe these mechanisms is largely derived from economics, using market terms such as ‘buyers’, ‘sellers’ and ‘brokers’ to identify key elements of the system. The appeal of free, voluntary engagementbetween providers and beneficiaries of services is considered more effective than other forms. This ‘environmental-services market’ concept assumes that without a government bureaucracyimposing rules and with compliance to market mechanisms there will be reduced market failuresand less likelihood of regulatory instruments capturing the total value of environmental services. In practice, however, the role of governance in making or breaking such ‘free market’ mechanisms has been underestimated.
As shown in Figure H.2, there are at least four major components of a system that tries to enhance environmental services, along with the provision of goods, through positive incentives.
Components enhancing the provision of environmental goods and services
90 HOW TREES AND PEOPLE CAN CO-ADAPT TO CLIMATE CHANGE
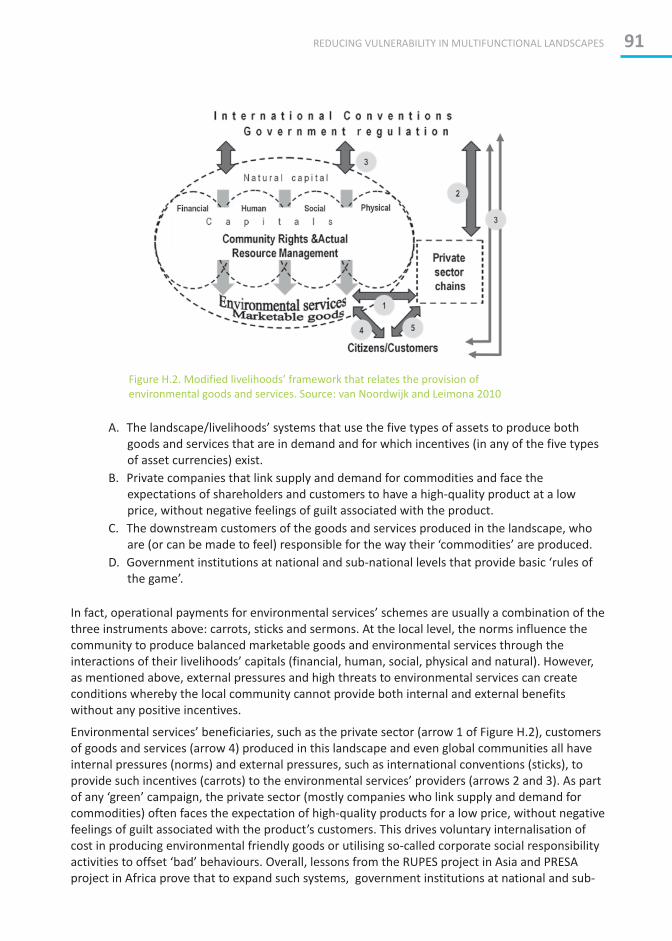
Figure H.2. Modified livelihoods’ framework that relates the provision of environmental goods and services. Source: van Noordwijk and Leimona 2010
REDUCING VULNERABILITY IN MULTIFUNCTIONAL LANDSCAPES 91
A. The landscape/livelihoods’ systems that use the five types of assets to produce both goods and services that are in demand and for which incentives (in any of the five types of asset currencies) exist.
B. Private companies that link supply and demand for commodities and face the expectations of shareholders and customers to have a high-quality product at a lowprice, without negative feelings of guilt associated with the product.
C. The downstream customers of the goods and services produced in the landscape, who are (or can be made to feel) responsible for the way their ‘commodities’ are produced.
D. Government institutions at national and sub-national levels that provide basic ‘rules of the game’.
In fact, operational payments for environmental services’ schemes are usually a combination of the three instruments above: carrots, sticks and sermons. At the local level, the norms influence the community to produce balanced marketable goods and environmental services through the interactions of their livelihoods’ capitals (financial, human, social, physical and natural). However,as mentioned above, external pressures and high threats to environmental services can createconditions whereby the local community cannot provide both internal and external benefitswithout any positive incentives.
Environmental services’ beneficiaries, such as the private sector (arrow 1 of Figure H.2), customersof goods and services (arrow 4) produced in this landscape and even global communities all haveinternal pressures (norms) and external pressures, such as international conventions (sticks), toprovide such incentives (carrots) to the environmental services’ providers (arrows 2 and 3). As part of any ‘green’ campaign, the private sector (mostly companies who link supply and demand forcommodities) often faces the expectation of high-quality products for a low price, without negativefeelings of guilt associated with the product’s customers. This drives voluntary internalisation of cost in producing environmental friendly goods or utilising so-called corporate social responsibilityactivities to offset ‘bad’ behaviours. Overall, lessons from the RUPES project in Asia and PRESAproject in Africa prove that to expand such systems, government institutions at national and sub-
national levels have to provide basic ‘rules of the game’ plus generic or specific rules formaintaining environmental services.
REDD+ is a form of PES global mechanism to reduce emissions from deforestation and forestdegradation, and encourage forest restoration, with the principle that rich countries can pay forthese terrestrial emission reductions in poorer countries, and thus achieve a cost-effective way of reducing the global problem of climate change. In practice, however, the carrots, sticks and sermons of these REDD+ mechanisms have proved to be more complex than originally imagined. With reference to Figure H.2, some points have to be considered.
�In a landscape, rights over resources and land are usually contested within communities,between neighbouring communities, between communities and state-sanctionedoperators and between the communities and the state. Concepts of ‘fairness’ clash with those seeking ‘efficiency’.
�For consumers, their degree of flexibility (and use of ‘offsets’ to meet commitments) is unclear and the additionality of greater net emission reduction through the REDD+ mechanism has not been resolved.
�For the private sector, their existing ‘rights to emit’ are challenged, while the rules of the game in offsetting their emissions keep changing. These situations make investmentdecisions difficult.
�For the governments, the ‘sermon’ of the victim role (that is, developing countries havenot enjoyed wealth but currently have to somehow decrease their economic activities, especially forestry business, owing to global commitments to climate-changemitigation), has to be balanced with ‘national sovereignty’ and the advantages of a pro-active role on the world stage.
92 HOW TREES AND PEOPLE CAN CO-ADAPT TO CLIMATE CHANGE

Intermezzo 14.
RUPES River Care scheme: a contract to reduce river sedimentation
A World Agroforestry Centre team implemented a River Care project in Gunung Sari andBuluh Kapur, Lampung province, Indonesia. River Care is a voluntary collective action forreducing and monitoring sedimentation in a river by constructing simple physical erosionretention devices combined with soil and water conservation in coffee gardens. Paymentswere categorised: a 5000 watt microhydropower electricity unit for more than 30% sedimentreduction and monetary payment for less than 30%.
A contract included agreements on activities to be carried out, rules, monitoring andevaluation, and sanctions. The community decided most of the terms of the contract throughnegotiation coordinated by the River Care administrator. The contract value allocated USD
171111 for operational costs and environmental services’ payments were stratified accordingto sedimentation reduction.
Sedimentation reductionactivities at erosionhotspots
�Construct and maintain dams to retain sediments fromforest, coffee gardens, paddy fields, footpaths
�Divert waterways and construct limited ridging andsediment pits on coffee gardens to prevent erosion
�Plant grass strips along potential landslide hotspots incoffee gardens
�Install water channels and PVC pipes to stabilise waterflows
Payment schedule ofoperational cost
In total, USD 1111: 50% at start; 50% at two months,contingent on performance
Payment as reward for environmental services
Reducing sediment up to:�30%: in cash: USD 2222 (Gunung Sari) or a
microhydropower plant (5000 watt) of similarmonetary value to the Gunung Sari payment (BuluhKapur)
�21 to 29%: USD 833�10 to 20%: USD 555�less than 10%: USD 278
Duration and monitoring One year with monitoring every three months;termination if 50% contracted activities not completed bymidterm monitoring date
�Cancellation or non-compliance activities (resulting in ineligibility for secondpayment)
o purposively destroying public propertyo friction and conflict among community memberso corruption
Force majeure provision in the event of natural disaster17 USD 1 = IDR 9000
At the end of the contract, in Buluh Kapur the hydropower company provided the reward of amicrohydropower unit to the local community regardless of their compliance insedimentation reduction. In this case, the company evaluated performance based on thecommunity’s effort and perseverance. This made the River Care scheme even moreinteresting for researchers. The shifting paradigm from commoditisation of environmentalservices to shared responsibility in maintaining a healthy ecosystem was very apparent.
Source: Pasha and Leimona 2011
REDUCING VULNERABILITY IN MULTIFUNCTIONAL LANDSCAPES 93

Intermezzo 15.
Green tea and clean water: Incentive for environmentally and
socially responsible tea-farm management in Kenya
The Kapingazi River is one of the tributaries of the Tana River. It originates from the easternslopes of Mount Kenya. Downstream of Kapingazi, on the Tana, are located a series of reservoirs for hydropower generation responsible for nearly 70% of the electricity producedin Kenya. The Kapingazi supplies 20% of the water consumed in the town of Embu. It also supplies six community projects for domestic and irrigation water, institutions and factories(mainly coffee and tea).
Following the drought of 2000, the river dried up completely. During the rainy season, the river becomes heavily polluted with sediment from farms, roads, footpaths, river banks and bare areas. Soil erosion leads to decline in farming yields. Sediment transporteddownstream into the reservoirs reduces their capacity and raises the maintenance costs of the turbines. Rural poverty results from low yields and poor access to markets. Domesticwater users in Embu and other users relying on the water from the river were also concerned about the water quality and sustainability of flows, especially during the dry season.
Initiatives in solving the problems by involving local communities in this area came fromvarious institutions and funding agencies, including the Government of Kenya, InternationalFund for Agricultural Development, Global Environmental Facility and the Pro-poor Rewardsfor Environmental Services in Africa (PRESA) project of the World Agroforestry Centre.Livelihoods’ enhancement initiatives included promoting more effective use of naturalresources, improving access to water and introducing more sustainable farming and watermanagement. These initiatives linked to the development of ‘rewards for environmentalservices’ schemes and the existing ecocertification scheme in the catchment. The potentialbuyers of the environmental services included the Kenya Electricity Generation Companyand irrigation projects on the lower Tana River. To set up the system, the PRESA project is working in the Kapingazi watershed to facilitate fair and effective agreements betweenstewards and beneficiaries of environmental services. The major challenge is to combine the various initiatives in the area, including the rewards scheme for watershed conservation and already existing ecocertification.
Eco-labelled tea produced in Kapingazi catchment, Kenya, promises farmers a price that is three-to-four times higher than ordinary tea, if farmers comply with the conditions for ‘goodagricultural practices’ monitored and certified by the Rainforest Alliance under its
18Agriculture Certification scheme . The Rainforest Alliance follows the Sustainable19 TMAgriculture Network (SAN) standards in awarding their Rainforest Alliance Certified seal
of approval. This certification assures the production of socially and environmentally benign branded tea as demanded by its consumers. The general compliance of the SAN system is that farms must comply with at least 80% of all applicable criteria and 50% of each principle’s criteria to obtain and maintain certification. The SAN’s ten principles are:
94 HOW TREES AND PEOPLE CAN CO-ADAPT TO CLIMATE CHANGE
18
19 http://www.rainforest-alliance.org/agriculture.cfm?id=standards
http://www.rainforest-alliance.org/agriculture.cfm?id=tea

1. Social and environmental management system
2. Ecosystem conservation
3. Wildlife protection
4. Water conservation
5. Fair treatment and good working conditions for workers
6. Occupational health and safety
7. Community relations
8. Integrated crop management
9. Soil management and conservation
10.Integrated waste management
The requirements emphasise a system (agroforestry) performance or Level 2 conditionalitythat must be accomplished by the environmental services’ providers. Some articles under this principle are general, such as Article 2.1: ‘The farm must maintain the integrity of aquatic or terrestrial ecosystems inside and outside of the farm and must not permit their destruction or alteration as a result of management or production activities on the farm’.This criterion only states a general objective in ecosystem integrity that must be achieved by the project. An eco-labelling scheme can be interpreted as benefit-risk sharing. The failureof a project to fulfil its certification causes lower prices with the risks borne by farmers while the buyers suffer from limited supply for production.
Source: Firmian et al. 2011
I. Balancing fairness and efficiency in rewarding environmental
services’ providers
The main point of this chapter is to discuss lessons from the implementations of action researchsites in Asia and Africa that reinforce the need to balance both fairness and efficiency in environmental services’ rewards schemes. There are four principles of fair and efficient schemes (van Noordwijk and Leimona 2010).
1. Realistic: based on shared understanding of the relationship between land-use practicesand the provision of environmental services, at the level required and with similar expectations.
2. Conditional: the incentives and rewards must be outcome-based to the degree possible, rather than prescribing a strict definition of PES.
3. Voluntary: within the constraints of collective action, evolving norms of behaviour and existing regulation.
4. Pro-poor: in the design, access, decision making and outcomes; and recognise the needto be inclusive of social and gender stratifications; both for reasons of ‘fairness’(achievement of moral equity objectives) and ‘efficiency’ (working against global norms simply can raise transaction costs in the long run).
In the next section, we will discuss the methods that have so far emerged to deal operationallywith these four principles through emerging experiences of creating efficient and fair incentives forenhancement of environmental services in Asian and African countries (Leimona 2011).
REDUCING VULNERABILITY IN MULTIFUNCTIONAL LANDSCAPES 95

Part of the literature on the topic uses a ‘3E framework’ (Table I.1), emphasising effectiveness,efficiency and equity as the three primary characteristics in establishing a sustainable scheme. The framing in terms of ‘fairness and efficiency’ may, however, be more comprehensive than this, as the ‘fairness’ concept extends beyond objectively measurable equity and ‘efficient’ is a precondition for effectiveness (Table I.1).
Effectiveness Efficiency Equity
Efficiency Efficiency equals Effectiveness per unitinvestment
Fairness Fairness implies an objectivelymeasurable 'equity' concept plus
a subjective perception of proportionality
Table I.1. Defining efficiency and fairness versus effectiveness, efficiency and equity
Table I.2 extends the fairness and efficiency concepts to the four principle of a RES scheme: realistic, conditional, voluntary and pro-poor principles. Each cell in this table highlights implicationof the fairness and efficiency when they are connected to each principle. For example, the realisticprinciple mostly enhances the efficiency of the scheme. However, the fairness element can also be added by giving attention to multiple knowledge systems and the need to shared understandingabout 'real' environmental services performance and the conservation costs. In the case of the pro-poor principle, a purely efficient PES scheme mostly excludes this principle since it can reducethe efficiency. However, since this principle is avoidable for any implementation of PES in developing countries, a fair PES under the pro-poor principle should minimally remove any policy instruments that make the poor worse off. The next section will discuss this aspect in more in detail.
Table I.2. The terms ‘fairness’ and ‘efficiency’ reach across the four realistic-conditional-voluntary-pro-poorcharacteristics
Focus on 'real' environmentalservices, clear performancestandards, appraisal of opportunity, implementationand transaction costs
Investment linkedto achievement of performancestandards
Compliance likely to be higher, monitoring costslower whereagreements aregenuinely agreed
Ignoring poor and disadvantaged groupscannot be efficient in the longer run
Efficiency
Attention to multiple knowledge systems and needs for shared understanding
Negotiatedperformancestandards
Contracts that meet freeand prior informedconsent standards for all stakeholders
'Do no harm' as minimum standard; self-determination and focuson process as well as results and outcomes
Fairness
R = Realistic C = Conditional V = Voluntary P= Pro-poor
96 HOW TREES AND PEOPLE CAN CO-ADAPT TO CLIMATE CHANGE

Multiple knowledge systems under a ‘realistic’ principle
In a genuine PES scheme, where PES is treated as a commoditisation of environmental services, the principle of a realistic scheme is defined as strong links between land-use practice and provision of tangible and measureable environmental services. This principle is considered as one of the elements for enhancing the effectiveness of such schemes. However, in reality, perspectives on ‘realistic’ relations between land-use practices and provision of environmental services differbetween stakeholders. For example, the popular perception that only forests can providewatershed functions has been challenged by scientific studies indicating that mosaics of forestpatches, agroforests and other agricultural uses can also provide a regular flow of water of low sediment load, depending on rainfall regime.
20There are at least three major stakeholders whose ecological knowledge and perceptions areimportant: 1) local people; 2) general public represented by the policy makers; and 3) the scientificcommunity. In order to connect the stakeholders and their ecological knowledge, we mustrecognise the three main ecological knowledge systems: local, public/policy and scientificmodellers’ (LEK, PEK and MEK, respectively).
20
the ecosystem and the interrelationship between them.Joshi et al. (2003) defined ‘ecological knowledge’ as the understanding of the components and processes within
Figure I.1. Major knowledge systems require 'reconciliation' to achieve realistic and successful rewards' mechanisms for improved environmental services
Fair and efficient environmental services’ rewards schemes articulate all ecological knowledgesystems to address the ‘realistic’ principle. We also can consider how PES is a follow-on from the negotiation support system discussed earlier. Realistic expectations of agreed quantitativeindicators for an historical baseline, the current situation and plausible future scenarios may help in the negotiation process leading to an environmental services’ contract. Shorter negotiation time and less conflict reduces transactions costs. Tomich et al. (2010) emphasised that the framing and language of ‘ecosystem’ or ‘environmental services’ is not value-free and that alternativeperspectives need to be at least acknowledged (Tomich et al. 2010, Ash et al. 2010).
Further, the acknowledgement of the three ecological knowledge systems should consider analysing the severity of issues, their presumed causes and options to deal with them (including constraints to any solutions). Science-based understanding of the landscape and issues can build on, complement and contrast with local and public/policy knowledge and usually provide morequantification of risks and likely impacts. In relation to climate-change adaptation, the variability of rainfall and the way landscapes provide buffering of water flows are key issues open toquantitative analysis. As a last step in the assessment, the different perspectives can be used to
REDUCING VULNERABILITY IN MULTIFUNCTIONAL LANDSCAPES 97

define what the best common ground for action is, at what spatial and temporal scales and which issues need further clarification before action will be broadly supported and understood.
Local people’s ecological knowledge (LEK) is normally embedded in their social and ecologicalenvironments. Rural people living in areas that are of environmental importance generally depend on natural resources for their livelihoods. LEK is often descriptive and usually stems from local people’s observations, active experimentation and external sources (Joshi et al. 2003). The long-term sustainable use of resources, along with the associated ecosystem functions, depends on their LEK, activities and ability to maintain and utilise the resources. The LEK shapes their decisions and actions, which in turn influence the potential for environmental services from their system.Local people’s decisions and actions may also be influenced by their cultural perceptions and values as well as their resource endowments (Joshi et al. 2003).
Public ecological knowledge (PEK) is the common understanding of the general public of how the ecosystem functions. The policy makers, representing the public, often make policies that mayinfluence the access and use of natural resources by local and external people. Their knowledge is often categorical and influenced by their educational background and the public media.
Generally LEK and PEK surveys can be conducted along with spatial and landscape studies. ExistingLEK about natural resource management (such as soils, water, forests, agroforests) among local communities can be explored using tools commonly used in Rapid Rural Appraisal and Participatory Rural Appraisal methods. The aim of a LEK survey is to explore and articulate local people’s understanding (whether correct or incorrect) of the major issues, problems, their causesand effect, experience and perceptions related to the environmental services under consideration.Local people are the primary source of knowledge. Direct observations, individual and groupinterviews with a preset checklist are the key methods for knowledge acquisition for LEK. Keyinformants are the main source of knowledge and information. For PEK, key policy makers areselected for interview. The checklist can be structured using ‘digging’ questions such as ‘what, why,how, by whom and when’ (see Box I.1). The steps recommended in the exploration of LEK aredetailed in Jeanes et al. (2006).
Local and public ecological knowledge
Box I.1
Key questions during exploration of LEK and PEK
1. Is there a real and important problem?
2. What is the problem and since when did it manifest?
3. What is causing the problem?
4. Who is causing the problem?
5. Who is affected?
6. How bad is it for those affected?
7. What can be done to stop or reduce the problem?
8. How do we know that this will work?
9. What effort and cost does this solution require from whom?
10. Why hasn’t this solution been implemented yet?
11. Why do we think it will work this time?
12. Who will have to contribute to the cost?
98 HOW TREES AND PEOPLE CAN CO-ADAPT TO CLIMATE CHANGE

For policy makers, the degree of synergy across ecosystem services is an important point of consideration (Box I.2).
Box I.2
Can carbon stocks be a proxy for all ecosystem services?
Figure G.1 showed carbon stocks (C), watershed functions (W) and biodiversity (B) as three parallel parts of the ecosystem services complex. To the degree that these functions respond in parallel to degradation impacts and restoration efforts, any of the three can be used as a ‘proxy’ for the other, and managing for of the three services will have positive ‘co-benefits’ for the others. The degree of coupling among B, C and W, however, is relatively low.Watershed functions depend on strategically placed tree cover rather than forests across the watershed; biodiversity depends on conservation of natural vegetation; carbon stocks may be maximised in plantations of high-value timber that have low B and W functionality (Xu 2011).
At international level, the issue of emission reduction has received more attention and potential funding streams than biodiversity conservation. There is a risk of ‘carbonisation’ of landscape management, where maximising carbon stocks leads to reductions of B and W functionality. In this regard, the choice of emission reduction schemes has an interesting set of consequences for the ‘co-benefit’ debate (Table I.4).
Emission reduction
scheme
Consequences for biodiversity value Consequences for watershed functions
RED = Reducing
emissions from
deforestation
Untouched natural forest generally has high
biodiversity value, but there also are low carbon
stock, high biodiversity habitats that require
conservation
Natural forest is generally a source of clean
water with buffered flows, but is not in
itself a guarantee for downstream
watershed functions
REDD = the same, plus
emissions from forest
degradation (loss of
forest carbon stock)
Logging if done in accordance with the rules can
reduce carbon stock with little impact on
biodiversity, until thresholds are reached
Logging roads can have a disproportionately
negative effect on water quality by affecting
riparian buffers
REDD+ = the same, plus
carbon capture in
restored/increased
forest carbon stock
Plantation forestry generally has low biodiversity
value and ‘forest improvement’ on ‘degraded
lands’ from a tree production perspective can
have negative impacts on biodiversity
Plantation forestry can have negative
effects on water yield
REDD++ = REALU =
reducing emissions
from all land uses,
independent of
operational forest
definition
Managing biodiversity at landscape scale and
from a long-term ecological perspective may
require ecological corridors between protected
areas; this can synergise with watershed
functions rather than carbon optimisation
Additional focus on dispersed trees and
maintaining soil organic matter in
agriculture can synergise with infiltration,
buffers and maintenance of watershed
functions
Table I.4. Consequences for biodiversity values and watershed functions of the choice of accounting base for rewarding reduction of land-based emissions. Modified from van Noordwijk et al. 2009
Modellers’ ecological knowledge
The ecological knowledge of the scientific community develops through a more formal researchprocess of replicated experimentation and analysis. The researchers’ ecological knowledgedevelops into generic ‘models’ of understanding and application. Hence, the modellers’ ecologicalknowledge (MEK) is also descriptive and process-based, similar to LEK.
The predictive ability of models under MEK is an important aspect that can be used as a management tool. Models try to answer ‘what if?’ questions. For models to be used correctly, the scientific modeller needs to understand the biophysical system being studied and how the model
REDUCING VULNERABILITY IN MULTIFUNCTIONAL LANDSCAPES 99

operates. Models require scientific understanding of the dynamics of environmental services, both in their development and use, especially during the parameterisation, calibration and validationphases of using the model.
The value of a model for non-technical users may be quite different from the statistical validityevaluated by modellers (Lusiana et al. 2011). As models tend to (over)simplify, they are particularly challenged in dealing with diversity (Villamor et al. 2011). Participatory modelling (Johnson 2009) can link MEK with LEK and/or PEK. Participants selected across the different stakeholder groupsshould be involved in the problem definition, model selection (or development), application and output evaluation. The model should be friendly to non-modellers and it is also important toensure that stakeholder participation is continuous, transparent and representative. Gathering of data and inputting to the model may take some time. The modeller should be aware that such delays may make the participants lose interest, hence, this should be handled carefully. The participants’ views, values and knowledge should be incorporated in the modelling process. This can be achieved, for example, through simulation runs of scenarios that would reflect a proposedchange in the watershed and together evaluate the model outputs. At the end of the participatorymodelling process, the model results should influence watershed management decisions.
A baseline study is the analysis of the current situation to identify the starting point for a project:in this case, a PES mechanism. The baseline survey is a benchmark for monitoring and evaluation.It helps to assess a PES project. It should focus mostly on the environmental services in question and anything that would affect the ecosystem in providing the services. This would requirecollecting relevant data from various sources for the study. Some of the relevant data sourcescould be, for example, satellite imagery, aerial photos and water quality assessment data. External parameters that may also affect the reward mechanism, such as climate variability, would also be an important component of baseline surveys. Global patterns of land-cover change (Figure I.2)suggest a dramatic increase of pasture and a continuous increase of cropland, more at the cost of ‘other land’ categories than forest, but the baselines at national and eco-regional scales can be quite different.
Baseline study
Figure I.2 Historical estimation of global land-use changes. Source: Goldewijk and Battjes 1997, Lambin et al. 2001
100 HOW TREES AND PEOPLE CAN CO-ADAPT TO CLIMATE CHANGE

Tools for spatially explicit assessment of ecosystem services
In addition to scenario development and prediction of trends of ecosystem services through models on the basis of accumulated information (for example through LEK, MEK, PEK), for effectiveand realistic policies and mechanisms, such as PES, an assessment of the existing and potentialstates of ecosystem services needs to be done spatially. Trees, for instance, are generally large and long-lived vegetative components within any landscape; they have profound and multiple spatial environmental impacts on water flow and quality, soil erosion, carbon storage and biodiversityconservation as well as productivity, welfare of domestic animals and landscape aesthetics. The impact of tree cover on ecosystem services is influenced by the location of the trees. This requiresplanning in a spatially explicit context, so that trees may be strategically located for greaterecosystem benefits. Hence, within a PES framework, farmers enhancing and maintaining tree coverat critical ecosystem points should receive higher rewards than others. In this context, GIS tools likePolyscape (Box I.3) can be applied to explore spatially explicit trade-offs amongst ecosystemservices inherent in tree placement within landscapes. Such tools are crucial for engagingstakeholders, fostering participatory approaches to landscape management, negotiating land-use changes and implementing policies and practices across sectors at a landscape scale (Sinclair et al.2009).
Box I.3
Polyscape for negotiations
A key problem with using any geographic information system (GIS) tools and techniques in developing countries is that major information such as soil maps and land-use data often exist at a very low resolution (or out of date, inaccurate or non-existent). To partly overcome this, the Polyscape GIS toolbox was designed to incorporate local stakeholders' (or experts') ecological knowledge into the tool's output. This provides two key benefits: first, the data is improved cheaply and efficiently; and second, consultation with local people generally increases their participation in the intervention, which is often critical to success.
Figure I.3. Toolbar of Polyscape toolbox
TM TMPolyscape runs in ESRITM ArcMap 9.2 (or 9.3) with Spatial Analyst extension. Polyscape currently comes with six tools (Figure I.3). The first four tools use simple rules to explore where opportunities exist to modify land use to increase a particular ecosystem service and where the existing land use is already providing important benefits to the landscape. The ecosystem services currently treated are agricultural productivity (tractor icon), flood mitigation (raindrop icon), erosion and sediment transfer to streams (dirt/water icon), and habitat connectivity (ladybug icon). The fifth tool provides algorithms to explore where mutual opportunities and/or trade-offs exist. The sixth tool provides a facility for allowing stakeholders to correct erroneous land-use and/or soil data, create scenarios of land-use change and add in their own specifications as to what land they consider valuable/not valuable and/or non-negotiable (Jackson et al. 2009). The requirements of data for application of Polyscape vary according to the ecosystem services under consideration.
Polyscape produces spatially explicit outputs in the form of maps showing areas where different ecosystem services either show a trade-off or have synergies at landscape scale. Figure I.4 shows a typical trade-off layer derived from the application of Polyscape in Sasumua watershed (one of PRESA's research sites) in upland Kenya. The trade-offs shown explore two separate ecosystem services (flood mitigation and farm productivity). The research interest here was to explore where best to place trees in the landscape. There are small areas
REDUCING VULNERABILITY IN MULTIFUNCTIONAL LANDSCAPES 101

where tree planting meets all criteria (shown as light green); areas where a single ecosystem service is good and other ecosystem services are neutral (shown as dark green). The areas coloured red or maroon show where new trees are either not desirable or would require large incentives to promote. Large areas are dominated by trade-offs amongst these environmental services or low impact (shown as orange).
Figure I.4. Polyscape output for PRESA’s Sasumua watershed study area, trading-off flood mitigation and agricultural productivity services
Ecological modelling of buffers and filters
Hydrological models have traditionally focussed on the prediction of the temporal patterns of riverflow, using hydrographs or flow records as the primary source of tests of model validity. In order toget a close match between 'modelled' and 'measured', such models usually require a large number of input data; where these input data are spatially explicit, the number of 'degrees of freedom'tends to increase rapidly and there are many opportunities for 'getting the right result for the wrong reasons'. That weakens the case for using the model to predict responses to possible futureconditions that may well be outside of the validity range of the model. Rather than focussing on precision, model developers might focus on 'robustness' or the ability of a model to givereasonable answers under a wide range of conditions. In many situations, the properties of the probability distribution of future flow regimes is more interesting than the day-by-day precision in the predicted hydrograph. In the context of 'watershed services' as discussed here, the concept of 'buffering' emerges as an important intermediary between externally induced fluctuations in rainfall and the type of variation in stream flow that is the result. Box I.4 describes the technicalaspects of quantifying the degree of flow persistence and buffering.
102 HOW TREES AND PEOPLE CAN CO-ADAPT TO CLIMATE CHANGE

Box I.4
Buffering and flow persistence
The counterpart concept to ‘climate variability’ is ‘buffering’. The greater the buffering, the more the ‘mean conditions’ rather than ‘daily variability’ will determine the outcome of climate change in a given location. Sensitivity to climate variability can be greatly decreased by enhanced buffering. Your house and clothes provide examples, protecting your body temperature from the air temperature recorded in a weather station. Increased variability of rainfall may lead to increased demand for buffering as an ‘ecosystem service’ (regulatory function).
In terms of water flows (streams, rivers), the degree of buffering can be quantified by the daily ‘flow persistence’parameter (van Noordwijk et al. 2011b).
Q = p Q + t+1 t
Where Q and Q refer to the river flow at day t and t+1, respectively, p is the flow persistence parameter and is a t+1 t
random variable for increases in flow reflecting recent rainfall. If p = 1 the add-o parameter must be zero and we have a perfectly buffered watershed without any variation in flow. If p = 0 there is no temporal autocorrelation of river flow and has the same statistical properties as Qt. The empirical value of p depends on the position in the landscape: the further along a river, the higher p and the more stable a river flow is. Empirical scaling rules for maximum flow of rivers differ from those for average flow. When large areas are considered, the low spatial autocorrelation of rainfall is a major stabilising effect on daily river flow, as peaks in rainfall at sub-catchment level are likely to occur on different days. For smaller areas, the flow pathway of water is a major determinant of the p parameter because for overland flow p may be zero (all such water reaches the stream within one day) while for groundwater flow it may be less than 0.05 (with less than 5% of the groundwater stock flowing into the stream in a single day) and for ‘interflow’ or ‘soil-quick-flow’ the p-value may be about 0.5. The condition of the soil, vegetation and drainage systems affects the flow pathways, aggregate p value and hence ‘buffering’. Rather than the generic ‘forest’ versus ‘non-forest’ of popular hydrology, these determinants of the flow pathways allow for a location-specific understanding of buffering and the options to increase it. Climate-vegetation-soil-landscape models now exist (compare with intermezzo 3) that can tease apart the relative contributions of land-use change and climate change to predicted change in buffering, and the degree to which land-cover configurations can compensate for predicted climate change as a form of adaptation.
�
�
�
�
Enabling or disabling criteria for realistic output
To ensure that the anticipated results are plausible with an envisaged reward mechanism, the following checklist is useful.
• All major stakeholders are clearly identified, including their roles and responsibilities in provisioning, monitoring, accessing and using (and misusing) environmental services.
• All stakeholder groups agree (or nearly agree) on what the environmental service is, how important and valuable the service is and to whom this is important.
• There is broad consensus among the stakeholders on what the problem is and how intensive this is.
• In general, all groups are clear on what is causing the problem, who is being affectedand who is benefitting, if any, from the root problem.
• It is clear what needs to change (for example, farming practices, pesticide use, resourceexploitation, mismanagement).
• There is general agreement on the potential solutions to solve the problem/s and what is the ‘cost’ of such change.
• It is clear who are the beneficiaries of the environmental service.
• It should also be clear if the beneficiaries are willing to pay for the environmentalservices they are benefitting from.
REDUCING VULNERABILITY IN MULTIFUNCTIONAL LANDSCAPES 103

Multiple levels of conditionality in rewarding environmental services
A payment and reward for environmental services’ contractual agreement contains conditionality that should be fulfilled by all parties. The conditions of an environmental payments or rewards’scheme is that the conditions are agreed in a transparent manner and imposed in a conservationcontract (Box I.5). When a PES scheme focuses only on its efficiency, the conditionality only refersto ‘you get what you for pay’ principle, that is, environmental services’ providers only get the payment if they can provide an increase in measurable environmental services. Less environmentalservices equals less payment, resulting in less cost for conservation activities.
In reality, this type of condition does not work, at least in action research sites of RUPES and PRESAin Asia and Africa. In this sub-chapter, we present multiple levels of conditionality for these schemes that can be applied in different situations, depending upon the local context. The broaderunderstanding of conditionality leads to the inclusion of the fairness element in a scheme.
Box I.5
Components of a PES contract
Stakeholders involved and their specific roles (providers, buyers, intermediaries and other parties)Definition of terms that might create confusion, such as, 'carbon sequestration'Rights and obligations of each stakeholderTerms of paymentSchedule of verificationSellers' guaranteeConflict resolution mechanismPeriod of the contractHandling changes and innovation in the contract that might occur in the future ('change and risk management strategy')Force majeureMap of locationSignatures of all parties
�
�
�
�
�
�
�
�
�
�
�
�
A conditional scheme should dynamically connect environmental services provision with rewardsor compensation in such a way that there is effective and transparent implementation of the scheme. Van Noordwijk and Leimona (2010) introduced five levels of conditionality (Figure I.5). It is less likely that all four levels of conditionality are instantly available to make a comprehensivescheme, hence, it is more practical to use a 'tier' approach, depending on the level of conditionality available. This will give room for observation of a particular scheme at a given level of conditionality and for identifying/analysing opportunities for more improved pro-poormechanisms. Constructing mixed strategies within different levels of conditionality is possible to achieve effective and transparent schemes. For example, a contractual agreement is made toguarantee a certain amount of payments for conservation activities (third level) with a bonus payment, such as a share in net benefit, if environmental services' providers can show a certainagro-ecosystem condition (second level) or increase in measurable environmental services (firstlevel).
104 HOW TREES AND PEOPLE CAN CO-ADAPT TO CLIMATE CHANGE

At Level I, the contractual relationship is based on the establishment of a set of criteria and indicators of actual delivery of anticipated environmental services. For example, for watershedfunction, the basis of payment is per cubic metre of clean water from a watershed, the amount of electricity produced from a hydroelectric scheme or the level of sedimentation reduced. ‘Pay forwhat you get’ (and no more) is attractive for environmental services’ buyers. Ideally, the parameter(s) should be easy to measure and agree upon by the sellers and the buyers. However,there may be substantial costs and complications involved in measurement. Environmentalservices’ baselines are debatable and the level of provision is often strongly influenced by externalfactors, such as ‘year-to-year’ variation in rainfall, extreme natural events and processes of global change. Payments, mostly of the financial type, are usually divided by the term of the contract and spread over time as more environmental services are being provided. However, time-lag in supplying such services might constrain the achievement of the desired service level.
To fully implement the conditionality at Level I may not be fair, especially for poor environmentalservices’ providers who have little capacity to absorb risks. The RUPES River Care case studyoutlined the course of an agreement between a community living in a village in a riparian zone and a hydropower company (Intermezzo 16). The case described the Level I conditionality where the percentage of sedimentation reduction determined the amount of payment received by the community. Just a month before the contract ended, when the community had fulfilled about 80% of the activities committed to in the contract, a landslide occurred in an upstream forest. The natural disaster increased the level of sedimentation in the river but, since it did not directly occur in the village area, the article of force majeure could not be applied. In this case, with Level I conditionality, the provider was very resilient but had no control over the terms of the contract.Subsequently, they only received about USD 278 because sediment reduction was less than 10%.
At Level II, the contractual relationship is based on the actual status of the agro-ecosystem; this is known as a stock-based approach. It has potential advantages over flow-based accounting of
Figure I.6. Five levels of conditionality for agreements on environmental services’ rewardsschemes between local and external actors. Source: van Noordwijk and Leimona 2010
REDUCING VULNERABILITY IN MULTIFUNCTIONAL LANDSCAPES 105

environmental services at Level I because it is easier to observe and measure. Many sophisticatedtechniques are available to monitor ecosystem conditions, such as remote sensing. However, the cost of these types of monitoring is high; imagery may not be complete; and the procedures arenot free from errors.
At Level III, providers receive rewards if they perform conservation activities based on their contractual agreement, regardless of whether environmental services’ benefits are obtained or not. Buyers will adjust their willingness to pay if they clearly understand that activities carried out by the providers will contribute to improving the supply of environmental services. This may makesense for risk-averse, poor providers, but this practice is almost similar to common public investment projects, where governments pay farmers at or below local minimum wages. Reflectingon the River Care case, the situation would be different if the contract was based at Level III conditionality or was an activity-based agreement. The River Care group members would receivefull payment if they accomplished all agreed activities.
The focus of Level IV conditionality is the overall management approach that strengthens the scheme: this relies on community-scale decision and control processes. The contractual agreementat Level IV is broadly defined as a management plan developed by all stakeholders in a participatory manner. The management plans might indicate specific actions and desired level of incremental improvement in environmental services but those indicators do not influence the levelof payments. Risk-sharing among the actors involved in the scheme characterises these levels of conditionality. The conditionality takes a further step back and is expressed in terms of trust.Conditionality based on trust obviously requires mechanisms for evaluating if previous trust has been justified. Beyond that, this type of conditionality may form the basis for a long-term and more equitable relationship. The implication is that support and trust for mutually agreedobjectives become the main bases of the scheme.
The eco-labelled tea production in Kenya provides an interesting case for analysing these conditionality levels (Intermezzo 17). The Sustainable Agriculture Network standard combines the criteria of Levels II, III and IV conditionality. For example, under its ‘Ecosystem conservation’principle (Article 2.8), it states that an agroforestry system’s structure must meet some requirements, such as:
a. the tree community on the cultivated land consists of minimum 12 native species per hectare on average;
b. the tree canopy comprises at least two strata or stories; and
c. the overall canopy density on the cultivated land is at least 40%.
Overall, the role of environmental services’ intermediaries acting as ‘honest brokers’ is importantin assisting local communities meet the conditions of their contract. Basic steps are to constantlyrecognise community rights, provide links for risk-sharing between all stakeholders and facilitateconflict resolution. Externally, it is important to correct policies that promote environmentallyharmful practices or/and discriminate against poorer farmers.
The concept of rewarding people for the environmental services they provide suggests a straightforward relationship between at least one seller and one buyer over a well-definedenvironmental service. However, in reality, such schemes are multifaceted, involving multiple stakeholders in a complex transactional process that involves negotiations over goals and means of developing schemes. A scheme is considered ‘voluntary’ when participation of landowners is based
Ensuring participation and transparency for a voluntary approach
106 HOW TREES AND PEOPLE CAN CO-ADAPT TO CLIMATE CHANGE

on personal decision, even in a collective action setting, and willingness to cooperate both forprivate and public benefit. Although such willingness often signifies an acceptable level of payment, that is, the payment offered exceeds the opportunity costs of current practices, there areother motivational factors for participation of landowners, such as social pressure to protect the environment.
In any case, the engagement of sellers of environmental services must be based on free choice rather than on being the object of regulation, and both seller and buyer must voluntarily agree on the contractual scheme. However, this is not easy when the bargaining power of stakeholders is unequal and information shared among actors is asymmetric. Sellers, who are in many cases poor upland dwellers, have less bargaining power compared to their lowland counterparts, the buyers,who are often educated urban dwellers. Can the bargaining power of sellers and buyers be completely equal?
Our experience in applying the procurement auction for sedimentation reduction in Indonesia (BoxI.6) suggests the auction process can embrace both efficiency and fairness in a voluntaryconservation contract with some considerations in its implementation (Leimona et al. 2009). The procurement auction mainly aims to increase the efficiency of a scheme by better allocation of contracts to farmers with lower opportunity costs. However, in this case study, the auction wascarefully designed to be biased towards marginalised participants, ensuring the fairness element it was emphasised.
A procurement auction becomes more transparent in contract allocation compared to a top-downselection process by intermediaries or buyers. Participants openly know who the winners are and why. In addition to that, contract allocation can be based on various factors to emphasise efficiency(that is, targeting participants with land with higher quality environmental services’ provision) or fairness (that is, targeting participants with low income). Trade-off of efficiency and fairness in this procurement auction is clearly described by Jack et al. (2008).
Box I.6
Efficiency and fairness in procurement auctions for environmental services
An environmental services’ contract procurement auction is an alternative policy mechanism to extract from the providers the information on level of payments or incentives that at least cover all their costs in joining a conservation program (Latacz-Lohmann and Schilizzi 2005, Ferraro 2004). It is defined as ‘a process through which a buyer of environmental services invites bids (tenders) from suppliers of environmental services for a specified contract and then buys the contracts with the lowest bids’ (Ferraro 2008). Procurement auctions for conservation contract have been successfully implemented in the United States, Australia and Europe. Theaward of contracts on the basis of competitive bidding is a method frequently used in procuring commodities for which there are no well-established markets, such as in markets for environmental services.
The World Agroforestry Centre conducted an experimental procurement auction for watershed services (Leimona et al. 2009) (Table I.1). The setting of this study was a watershed in Lampung, Indonesia, where soil erosion had broad potential for on-site and off-site damage. The most direct on-site effect was the loss of top soil from coffeefarmlands that dominated the watershed and low agricultural productivity in the long term. The off-site effectsincluded siltation, water flow irregularities, reduction of irrigation, water pollution and agrochemical run-off. Thesoil sediments could reduce the capacity of a reservoir located downstream of the watershed, hence, adversely affecting irrigated agriculture and hydroelectricity generation.
REDUCING VULNERABILITY IN MULTIFUNCTIONAL LANDSCAPES 107

The auction in Indonesia was designed using a uniform price rule for fairness reasons. Theliterature on auction design finds that uniform pricing is more likely to reveal farmers' true opportunity costs because bidders only determine the chance of winning. However,uniform pricing is relatively less cost-effectivecompared to the discriminative price rule.
The auction was a multiple contest consisting of eight rounds with a last binding round. Thebenefit of multiple rounds was that farmers learned from the rounds of the auction. However, the announced last round may have introduced forms of strategic behaviour.Concealing the number of rounds gives participants higher uncertainty because they have their own subjective probability distribution about the chance of it being the last round. By announcing the last round, the
Table I.. Characteristics of reverse auction design
Characteristic Implementation
Auction type One-sided, sealed bid,procurement auction
Bidding units Willingness to accept
Budget limit Predetermined, concealed
Number of rounds 7 provisional, 1 binding
Announcement of
provisional winners
By ID number
Bid timing Simultaneous
Pricing rule Uniform, lowest rejectedprice
Tie-breaking rule Random in determining
tied winners
Bidder number Known, fixed
Activities contracted Determined in advance
Pro-poor: access, design and outcome
In reforming institutions to create an enabling environment, the rural poor and socially marginalised groups must be directly involved. Obtaining ‘buy-in’ through their recognition and participation will foster ‘co-investment’ for sustained provision of ecosystem services. This will reduce negative externalities as well as the backlash associated with enforcement of stringentpolicies and laws. This is achievable by ensuring that financing mechanisms like carbon credits do not harm the poor or differentially benefit them. This also addresses social justice issues.
Identifying rewards that match with people’s needs and expectations is one particularly importantaspect of pro-poor approaches (Leimona 2011). The findings from focus groups at the differentsites in Asia suggest that there is a substantial variation among communities concerning povertyconcepts and reward preferences, which provides important insights into the various dimensions that well-targeted reward schemes need to address. Our analysis concluded that rewards in the forms of human capital, social capital and physical capital—referred to as non-financial
benefits from farmers' learning on the previous round and the advantages of a one-shot auction for the last round were combined.
The rate of accomplishment at the final monitoring was moderate. The reasons for this were various, ranging from lack of leadership and coordination among farmers' group members, difficulty in finding grass seedlings to accomplish the contract, and coincidence with the coffee harvest. In this specific case, a private contract tends to be more successful compared to a collective contract when leadership is lacking or there is no 'champion' in the community. Institutional aspects and contract flexibility might influence the accomplishment of conservation efforts. Analysis showed that there were no significant differences in level of understanding, complexity and competitiveness and conservation awareness between compliant and non-compliant farmers.
The design of an experimental auction should fit the overall objectives of a conservation program. In this case, the challenge was to design and administer a fair auction for farmers with low formal education, prone to social conflicts, and influenced by power structures within their community.
Source: Jack et al. 2008, Leimona et al. 2009
108 HOW TREES AND PEOPLE CAN CO-ADAPT TO CLIMATE CHANGE

incentives—are very often the most preferred and possible types of rewards. Contribution to non-financial incentives such as strengthening social capital can increase levels of social cohesion and trust within a community and with its external links, which in the end can lower transaction costs.In other cases, the rural poor may prefer direct payments rather than in-kind rewards, but their coming together promotes collective action and learning. However, the pro-poor dimension is often constrained by policies and legislation that limit access, use and management of specificresources.
As described at the beginning of this chapter, the level of conditionality that an environmentalservice rewards contract can achieve is variable. It ranges from tangible benefits for the providersthat are linked to the actual enhanced delivery of environmental services (Level I), throughmaintenance of agro-ecosystems in a desirable state (Level II) and performance of agreed actions to enhance environmental services (Level III) to the development and implementation of management plans to enhance environmental services with respect for local sovereignty in conserving the environment for both local and external benefits (Level IV). Based on these levels of conditionality, three paradigms have been distinguished: commoditisation of environmentalservices (CES); compensation for opportunities skipped (COS); and co-investment in environmentalstewardship (CIS) (Box I.7, van Noordwijk and Leimona 2010).
Box I.7
Paradigms in rewards for environmental services: CES, COS and CIS
Paradigms refer to a way of thinking, a mindset that is used to analyse and interpret the world around us. Language matters, as it influences the emotional values and expected repertoires of action (Swallow et al. 2009, Kosoy and Corbera 2010). The most commonly used label, ‘payments for environmental (or ecosystem) services’, refers to a buyer/intermediary/seller perspective of markets. It is most closely associated with:
CES = Commoditisation of environmental services: if these services can be ‘repackaged’ into marketable entities or commodities, the efficiency of markets as institutions can be expected to balance supply and demand and provide incentives for a level of ‘environmental services production’ that matches demand, at least in theory.
In practice, however, government agencies and/or private sector entities regulated by government have been the primary ‘buyers’ because collective action is needed. Demand is thus regulated, but also the supply, as the measurement of environmental services is too complex and costly and land-use types such as ‘forest’ are used as proxies:
COS = Compensation for Opportunities Skipped: standardised price levels applicable over large areas are used for inducing voluntary restrictions of land use to increase the environmental service level and/or to compensate rights holders for involuntarily accepting such restrictions. A Costa Rican PES innovation and many programs that followed it were essentially using a COS paradigm, even though they used CES language.
In practice, however, contested rights prevent the effective use of a COS paradigm and a third paradigm covers most of the current practices in Asia and Africa:
CIS = Co-Investment in Stewardship of natural capital as a basis for future environmental services flows: sharing responsibility, risk and resources in the form of ‘co-investment’ also implies respect and recognition for the roles, rights and responsibilities of the various parties involved. The use of proxies is acceptable, as long as these are regularly evaluated and revised.
Modified from van Noordwijk and Leimona 2010
REDUCING VULNERABILITY IN MULTIFUNCTIONAL LANDSCAPES 109
Co-investing in ecosystem management with communities will promote collective learning and action through enhancement of social capital. Devolution, decentralisation and negotiationsupport approaches ensure the participation of the poor in the design and implementation of schemes. Co-investment also ensures social justice, cohesiveness and improved livelihoodsthrough alternative streams of income from transfer schemes for environmental services. There are opportunities for phased strategies. After creating a basis of respect and relationship throughthe paradigm of CIS, there may be more space for specific follow-ups in the paradigm of CES foractual delivery of environmental services to meet conservation and service additionality objectives.
Intermezzo 16.
Fifteen years before the 1992 Rio conference that established global governancemechanisms for environmental issues, the third report to the Club of Rome was published under the title Reshaping the International Order (RIO) (Tinbergen 1976). This report,formulated by a group of about 20 experts from developing as well as developed countries,reflected the way the ‘West’, ‘East’ and ‘South’ were seen at the time in the context of the poverty–environment nexus. It followed the ‘limits to growth’ debate of the first report tothe Club of Rome.
Now that we look back on 20 years after Rio, we can reflect on whether or not Rio has contributed to RIO. We may note that the triangular relationship of the 1970s was foldedinto a dichotomy in 1992, with ‘Annex-I’ and ‘Non-Annex-I’ countries as a fundamentalconcept in the UNFCCC and the Convention on Biological Diversity. Lack of progress in achieving the goals of the UNFCCC can be attributed to a considerable degree to the discrepancy between this dichotomy and a world in which ‘emerging economies’ became more prominent year by year, reaching the status of the Number 1 emitter of greenhousegases, in the case of China, around 2009. Breaking out of a black-or-white language of victims-and-villains and addressing the realities of the environmental challenge is needed to break the current deadlock in negotiations.
Two other dichotomies are equally limiting the emergence of efficient and fair solutions:
1) The way ‘forest’ was segregated from the rest of the landscape and singled out as the environmental policy target turned a quantitative gradient of tree coverand resulting functions into an ‘in-or-out’ challenge for definitions. The term‘forest’ did not, and even until now does not, have an operational definition that allowed its use as identifier of policy domains. A lot of energy was wasted on ‘afforestation/reforestation’ ideas that could not be applied within the ‘institutional forest’ areas because being ‘temporarily unstocked’ did not mean they were ‘deforested’ (van Noordwijk et al. 2008). Similarly, controversy overthe scope of REDD+ in relation to plantation forestry and tree crop plantationshas cooled the initial enthusiasm of efforts to protect forests. With separaterules being negotiated for ‘agriculture’ and ‘forests’ we are still a long way from‘reducing emissions from all land uses’ (REALU, van Noordwijk et al. 2009).
The Rio conference and Reshaping the International Order in relation to
forests, trees and agroforestry
110 HOW TREES AND PEOPLE CAN CO-ADAPT TO CLIMATE CHANGE

2) The way the ‘mitigation’ issue was segregated from ‘adaptation’, with separatepolicy frameworks and funding streams created a strong path dependency in the debate, with negative incentives for activities such as agroforestry that can clearly contribute to both (Verchot et al. 2007, Neufeldt et al. 2009). Adaptationdiscussions were for long seen as undermining the case for deep cuts in emissions and mitigation efforts. The ‘limits to adaptation’ debate (Kandji et al. 2006) canreconcile the two. Actions on the ground can be much more salient, credible and legitimate if the two concepts can be combined into ‘mitigadaptation’ but nationalpolicies and international debates in the UNFCCC maintain separate agendas.
We can conclude that in both cases the framing of issues in the Rio agreement has hinderedthe emergence of evidence-based mechanisms that address the problems of rural povertyand environmental degradation and that regularly revisiting the key underlying assumptionsof environmental policy is essential for making progress. The role of agroforestry research in challenging the myth perceptions and false dichotomies of environmental governance is a ‘louse in the pelt’ of forest-based institutions but it may help to achieve the overallMillennium Development Goals of poverty reduction and environmental sustainability(Garrity 2004).
REDUCING VULNERABILITY IN MULTIFUNCTIONAL LANDSCAPES 111
Figure I.6. Agroforestry sits at the nexus of three UnitedNations (UN) conventions—BiologicalDiversity (CBD), ClimateChange (UNFCCC) and Combating Desertification(UNCCD)—and is central to achieving the Millennium Development Goals

Intermezzo 17.
Charles Darwin was aware that the social insects—bees, ants and termites—were a serious challenge to the mechanism that he perceived to drive the continuous process of adaptation in biological evolution. Individuals appear to readily sacrifice themselves for the greater good of the group, undermining the mechanisms for ‘survival of the fittest’. With greater understanding of the mechanisms of genetic inheritance and the DNA coding of life, the issue remained and most of the ‘group selection’ concepts that were posed as explanations fell short of what ‘selfish genes’ were understood to do. In mathematicalterms, however, George Price solved the problem with a very elegant equation in 1970 (Figure I.7).
The altruism puzzle resolved: George Price’s equation in a human
development context
Figure I.7. Simplified version of the George Price’s equation that relates the net effects of individual behaviour on the costs and benefits of all other individuals to the private costs and benefits via a matrix of 'relatedness' or 'social cohesion'; the carrots, sticks and sermons of Figure H.1 addressdifferent terms of this equation and can work against each other or in synergy
The same concept can be used to understand the role of ‘carrots’, ‘sticks’ and ‘sermons’ in attempts to modify land-users behaviour towards greater group benefits. Expectations of individual rewards (carrots) or law enforcement (sticks) interact with the knowledge of perceived costs and benefits for others, modulated by the degree of relatedness or social cohesion.
Of specific current interest is the idea of ‘crowding out’ social cohesion by emphasis on individual payments. It seems likely that shifts from ‘pro-social’ to ‘individual’ behavior can be induced by promising relatively small financial benefits and that the return to ‘pro-social’ domains is relatively slow. There may (further evidence from the field is needed) be a risk that small payments targeting individuals have a negative overall effect: they reducesocial cohesion while not providing sufficient incentive to replace and exceed the social motivation levels to care for environmental services.
112 HOW TREES AND PEOPLE CAN CO-ADAPT TO CLIMATE CHANGE
J. Increasing resilience and sustainagility by support of social
and ecological buffers
There are five key points in this chapter.
1. Resilience requires focus on the process of adaptation rather than the result of adaptedness.
2. Buffers exist in ecological, social and economic senses and reduce the short-term need for adaptation.
3. Increased vulnerability can be as much due to loss of filter functions as to increasedexternal sources of variability and stress.
4. Ecosystem-based adaptation operates at landscape scale and needs to link the social dimensions of human behaviour to the dynamics of ecological buffers and filters.
5. Sustainagility is a key concept in ensuring that future options are not compromised by sustainability (persistence) measures.
The real challenge for any governance system is to govern as little as necessary, but no less. Mostrules induce human beings to try and circumvent them, not because the rules are void of anypublic rationale and advantage but because the immediately perceived negative impact on the individual seems disproportionate to the public gains.
In the final analysis, ‘adaptation’ is not about providing a set of solutions that increase‘adaptedness’ (Box B.1), as important as such solutions may be in the short term, rather, it is about:
1) increasing the ability to recognise problems early enough;
2) access to resources that allow different solutions to be feasible;
3) the ingenuity of individuals or small groups to create new solutions; and
4) the social and governance context that supports the spread of innovations once theypass tests of consistency and undesired side-effects.
Climate-change adaptation has to be open ended, with a focus on the processes of innovation and ‘sustainagility’ for the longer run.
Throughout the preceding chapters we have used a terminology of buffers and filters, providingquantitative definitions for specific buffer functions (for example, Box B.1) and a conceptual,qualitative understanding for others. Buffer effectiveness can be defined in a generic way on the basis of the ratio of variance of a quantitative property after and before (or with or without) the entity that buffers. Filters, similarly, are measured by the reduction of the mean of a specific signal. In many cases, buffer and filter functions are linked and they can be treated as a group. The concept applies to physical properties (such as radiation, wind speed, humidity, temperature(minimum, maximum or mean over a specified time period)), biological properties (dispersal and migration of organisms, such as pest and disease or pollinators/seed dispersal agents), economic properties (financial flows, financial transactions linked to extreme events and pressure points such as insurance mechanisms) and social properties (with psychological stress as a measurablequantity, for example) (Fig. J.1).
Buffers/filters as a unifying concept
REDUCING VULNERABILITY IN MULTIFUNCTIONAL LANDSCAPES 113

This representation suggests a number of important conclusions that may require further scrutinyand should be seen as hypotheses at this stage.
1) The combined impact on human livelihoods of the various sources of variability,pressure and stresses on the five assets under direct control of an individual or household defines poverty and human wellbeing, with coping and adaptation/innovation approaches based on exchanges between asset types.
2) From an internal observers’ perspective it is hard to distinguish between ‘loss of buffer/filter functions’ and ‘increased external variability’ causation of increased stress;the ‘local climate change’ perception could as well be caused by ‘loss of buffer/filtereffects’ as by global climate change; the increased price fluctuations can be due to
21changes in global markets and/or losses of intermediate buffer functions .
3) From an overall system health perspective the buffers and filters are the ‘endogenous’part of a system that can be managed, protected and enhanced, while external sourcesof variability cannot be controlled; optimising buffer/filter management requiresunderstanding of the cross-links of buffers, for example, the substitution of social safety-nets by more individualistic financial insurance mechanisms connects social and
Figure J.1. Human livelihoods at the centre of the graph and surrounded by the five capital types (N = natural, H = human, S = social, F = financial, P = physical infrastructure) can be shielded from the external sources of variability and stresses through social networks, economic insurance mechanisms and/or ecological buffers and filters at landscape scale; buffers and filter also influence the opportunities for change through resource access and innovation support, as aspects of sustainagility
21
had become too tightly linked and lost the partial independence needed for risk reduction; the global economy paid the price where individuals had benefited from ‘efficiency gains’ that consisted of reducing buffer and filter effects
The ‘financial crisis’ of 2008 was triggered by the linking of insurance mechanisms that collectively failed because they
114 HOW TREES AND PEOPLE CAN CO-ADAPT TO CLIMATE CHANGE

financial filter functions; climate change may imply a greater future relevance of buffersand filters of all types.
The idea of optimising buffers and filters has to deal with two types of challenge.
1. Buffer functions are linked across scales: while building higher dykes along a river is a good way of reducing the local risks of flooding it increases the risks downstream. It has taken engineers and governance agencies a long time to understand that maintainingriparian wetlands and allowing overflow areas may be a better way to protectdownstream areas than increasing the number or size of dykes; similarly, it took time tounderstand that building higher chimneys to reduce the local negative impacts of air pollution was effectively displacing and spreading the problem rather than dealing with it. Less popularly understood is the relationship between control of industrial sulphur dioxide (SO ) pollution and the more rapid increase of global temperatures after the 2
1970s: SO served as a cooling gas and filter of incoming global radiation rather than as a 2
greenhouse gas and its reduction allowed the increase in atmospheric CO to be directly2
expressed in temperature increases. Control of atmospheric So pollution had many2
advantages in reducing ‘acid rain’ effects but it aggravated global warming.
2. Biological and human systems require clear signals that there is a problem before action is taken (Figure J.2). As long as buffers and filters are effective, there is no selectiveadvantage in dealing with the underlying problem. In an ‘evidence-based’ world,
Responsiveness requires pressure
Figure J.2. Nested layers of sub-system properties that reduce the impact of external variability (or increases in variability) on the wellbeing of individuals/households: buffers and filters reduce exposurewhile part of the resultant variation can be handled within the coping range or at least the resiliencedomain that prevents long-term damage; adaptive responses normally need a trigger that suggests a selection advantage of new ways of reducing actual vulnerability
REDUCING VULNERABILITY IN MULTIFUNCTIONAL LANDSCAPES 115

politicians and the general public that elects or supports them need to be shown the evidence that a problem is serious before they are likely to act. We may need todistinguish here between buffers and filters that act in an ‘outer shell’ before ‘exposure’is measured and the internal properties of a regulated system that allow it to ‘cope’ bytolerating variability and/or internally absorbing it, followed by the ‘resilience’ (or bouncing back) properties that imply that short-term pressures do not lead to long-termnegative consequences. True vulnerability starts where the resistance, tolerance and resilience responses are insufficient. However, such vulnerability may trigger adaptiveresponses that go beyond ‘bouncing back’ but imply a longer-term change in the systemproperties.
3. Adaptive responses require triggers (selection pressure), adaptive capacity (innovationsand variations being tried) and underutilised resources that can be used in new ways.
Potentially the ‘intelligent’ use of adaptive capacity in humans can be one step ahead of biological adaptive responses that need the selective pressure to be actually expressed. Rationality might, in theory, lead humans to listen to early warning signals and respond before the precipice is reached(Rockström et al. 2009). One needs to be an optimist to recognise such rationality in the reality of political processes and international negotiations regarding climate change.
Current understanding of the role of landscape buffers and filters in reducing human vulnerabilityto global climate change can be summarised in the statements that
1) Landscape-scale interactions between external variability and landscape elements, via buffer and filter effects, have historically reduced human vulnerability;
2) Agricultural intensification and the simplification of landscapes for large-scalemechanised land uses has lead to a reduction of buffer and filter functions, partially replaced by technical substitutes; and
3) Current ‘ecosystem-based adaptation’ may need to restore lost buffer/filter functions and enhance them, based on a good understanding of how they work and what their limits are.
A major function of landscape buffers and filters may well be that they allow ecological corridorfunctionality for otherwise vulnerable biota. Maintaining the biological resource base of life on the planet is probably the most relevant ‘insurance premium’ that we should be rationally inclined topay, even though we may never know what parts of it will actually be used in the sustainagilityresponses of future generations. Current pressures of climate change are still such that maintainingthe basis of future adaptation as a process is more urgent than increasing adaptedness in the hereand now.
The design of current global programs for the way agriculture and food systems can respond to climate change suggests that this insight is not yet widely shared. It remains easier to track the definition and spread of specified technologies than it is to assess farmer capacity to innovate and to increase farmer access to resources that allow new approaches to emerge. Throughout this book we argue that diversity and multifunctionality provide opportunities for change and futureuse beyond what we can currently foresee and predict. Trees, as all other biota, have the capacity to self-adapt and human adaptation strategies should aim to synergise with the biological processof adaptation, rather than try to engineer and design solutions that can then be expandedfollowing the management styles of the corporate sector.
Ecosystem-based adaptation and sustainagility
116 HOW TREES AND PEOPLE CAN CO-ADAPT TO CLIMATE CHANGE

K. Research priorities
The editors
Our review of the evidence on how trees and people can co-adapt to climate change has provideda reasonable basis to act now, in support of multifunctionality of landscapes. Multifunctionality is worthy of support from the perspective of environmental service provision. We found a considerable level of support for the hypothesis that ‘Investment in institutionalising rewards forthe environmental services that are provided in multifunctional landscapes with trees is a cost-effective and fair way to reduce vulnerability of rural livelihoods to climate change and to avoidlarger costs of specific “adaptation”, while enhancing carbon stocks in the landscape.’ (Figure K.1).
Figure K.1. Overviewof the precedingquestions, leading to current understandingof the variouselements of the overarchinghypothesis
In the first chapter we summarised the content of this book and listed ten points that were readyfor direct action, even if details of the underlying science will continue to be refined. We herepresent further issues where research may need to clarify the options before widespread use.
Ideas for further research
�Combine ecological and environmental economics frameworks to analyse the risks to local livelihoods posed by climate change and globalisation of trade
�Explore new approaches to integrate the space-time dynamics of landscape functions in socio-ecological systems that acknowledge the political economy as well
�Elaboration of adaptive options that also maintain ‘high carbon-stock livelihoods’ on the LAAMA–NAMA and NAMA–GAMA frontiers
�Investigate a more detailed functional interpretation of tree diversity in dynamic landscapes in representative ecological zones in various stages of tree cover transition
�Research ways of enriching public perceptions of causality and choice of options beyondcurrent stereotypes of forest, climate, floods and economic growth
�Reflect on how multiple knowledge systems, multiple stakeholders and multiple action perspectives can be effectively combined
REDUCING VULNERABILITY IN MULTIFUNCTIONAL LANDSCAPES 117
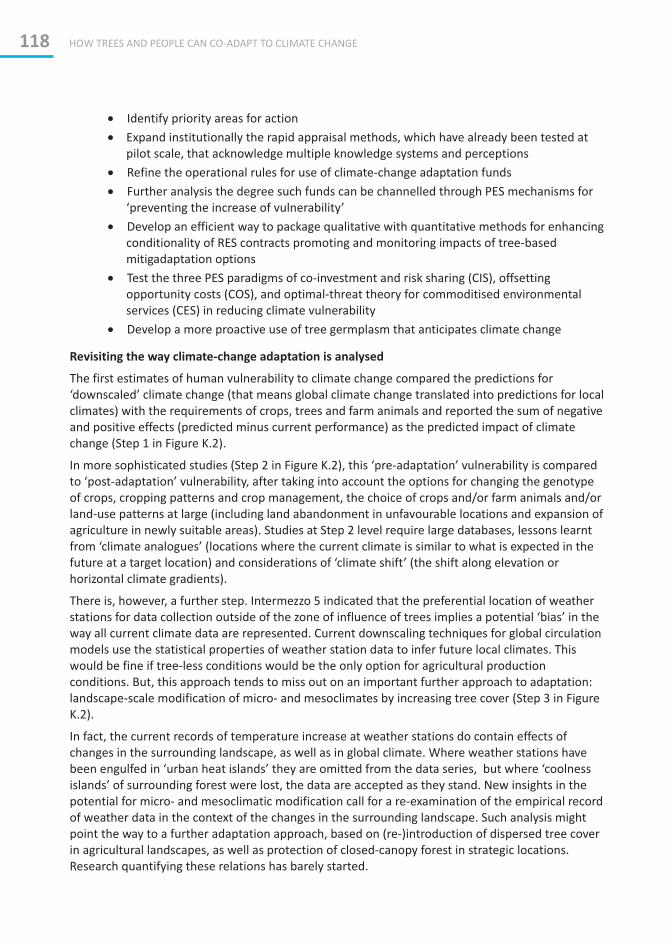
�Identify priority areas for action
�Expand institutionally the rapid appraisal methods, which have already been tested at pilot scale, that acknowledge multiple knowledge systems and perceptions
�Refine the operational rules for use of climate-change adaptation funds
�Further analysis the degree such funds can be channelled through PES mechanisms for‘preventing the increase of vulnerability’
�Develop an efficient way to package qualitative with quantitative methods for enhancing conditionality of RES contracts promoting and monitoring impacts of tree-basedmitigadaptation options
�Test the three PES paradigms of co-investment and risk sharing (CIS), offsettingopportunity costs (COS), and optimal-threat theory for commoditised environmentalservices (CES) in reducing climate vulnerability
�Develop a more proactive use of tree germplasm that anticipates climate change
Revisiting the way climate-change adaptation is analysed
The first estimates of human vulnerability to climate change compared the predictions for‘downscaled’ climate change (that means global climate change translated into predictions for local climates) with the requirements of crops, trees and farm animals and reported the sum of negativeand positive effects (predicted minus current performance) as the predicted impact of climatechange (Step 1 in Figure K.2).
In more sophisticated studies (Step 2 in Figure K.2), this ‘pre-adaptation’ vulnerability is comparedto ‘post-adaptation’ vulnerability, after taking into account the options for changing the genotype of crops, cropping patterns and crop management, the choice of crops and/or farm animals and/orland-use patterns at large (including land abandonment in unfavourable locations and expansion of agriculture in newly suitable areas). Studies at Step 2 level require large databases, lessons learntfrom ‘climate analogues’ (locations where the current climate is similar to what is expected in the future at a target location) and considerations of ‘climate shift’ (the shift along elevation or horizontal climate gradients).
There is, however, a further step. Intermezzo 5 indicated that the preferential location of weatherstations for data collection outside of the zone of influence of trees implies a potential ‘bias’ in the way all current climate data are represented. Current downscaling techniques for global circulationmodels use the statistical properties of weather station data to infer future local climates. This would be fine if tree-less conditions would be the only option for agricultural productionconditions. But, this approach tends to miss out on an important further approach to adaptation:landscape-scale modification of micro- and mesoclimates by increasing tree cover (Step 3 in FigureK.2).
In fact, the current records of temperature increase at weather stations do contain effects of changes in the surrounding landscape, as well as in global climate. Where weather stations havebeen engulfed in ‘urban heat islands’ they are omitted from the data series, but where ‘coolnessislands’ of surrounding forest were lost, the data are accepted as they stand. New insights in the potential for micro- and mesoclimatic modification call for a re-examination of the empirical recordof weather data in the context of the changes in the surrounding landscape. Such analysis mightpoint the way to a further adaptation approach, based on (re-)introduction of dispersed tree coverin agricultural landscapes, as well as protection of closed-canopy forest in strategic locations.Research quantifying these relations has barely started.
118 HOW TREES AND PEOPLE CAN CO-ADAPT TO CLIMATE CHANGE
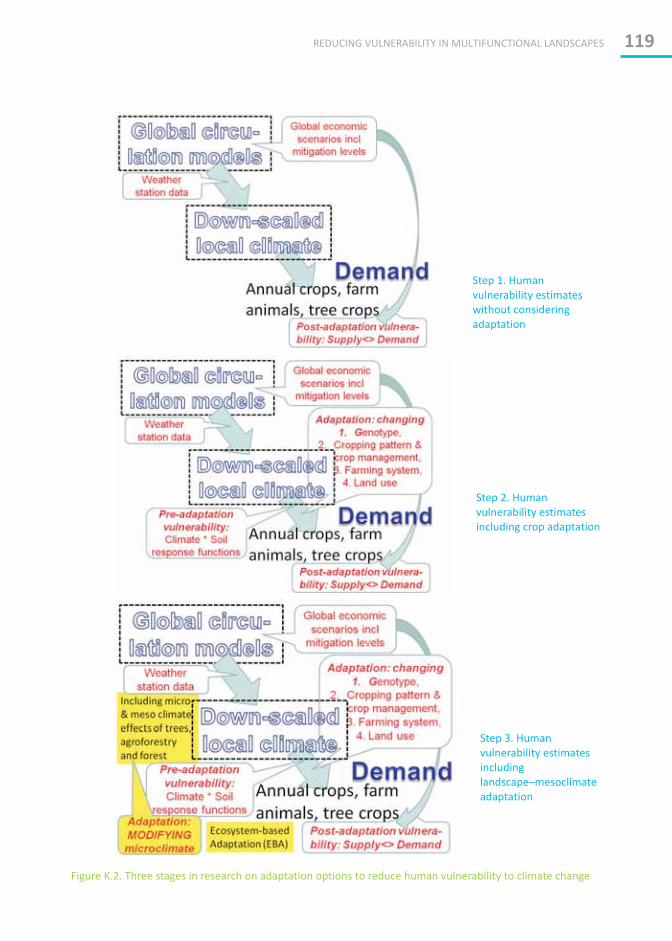
Step 3. Human vulnerability estimatesincludinglandscape–mesoclimateadaptation
Step 2. Human vulnerability estimatesincluding crop adaptation
Figure K.2. Three stages in research on adaptation options to reduce human vulnerability to climate change
Step 1. Human vulnerability estimateswithout considering adaptation
REDUCING VULNERABILITY IN MULTIFUNCTIONAL LANDSCAPES 119

What are the frontiers of the emerging sustainagility science?
1. The ecological and environmental economics frameworks are recommended foranalysing the risks to local livelihoods posed by climate change and trade globalisation.This is needed to test the 'rationality' of insurance premiums obtained from maintainingmultifunctionality.
2. Current cross-scale approaches may be overly detailed and sensitive to poorly quantified parameters. New approaches are needed to integrate the space-time dynamics of landscape functions in socio-ecological systems, nested within global change in marketsand climate.
3. While the language of a 'low carbon (flow) economy' has been common parlance, theneed for options that are adaptive but also maintain 'high carbon-stock livelihoods'requires further elaboration on the LAAMA–NAMA and NAMA–GAMA frontiers.
4. A more detailed functional interpretation is needed of tree diversity in dynamic landscapes. The suggested interpretation includes quantifying the trade-off betweenselections for greater short-term benefit ('fitness') versus the costs of losing adaptability.The wide variation in tree life histories that come with the pollination (including dioeciousness) and seed dispersal strategies needs to be better reflected in the analysisof vulnerability of tree genetic diversity to domestication and other selection pressures.
5. Opportunities for enriching public perceptions of causality and choice of options beyondcurrent stereotypes.
6. Reflection on the way multiple knowledge systems, multiple stakeholders and multiple action perspectives can be effectively combined.
7. At the local level, strategies for adaptation and mitigation have almost no distinction:local people use different means and strategies to cope with seasonal variability and adapt to established patterns of change in relation to changes in geopolitical and economic structures, opportunities and constraints, in an integrated fashion.Smallholders do not operate single-handedly: within their immediate environments a sustainable livelihoods and rural development framework for climate-change adaptationand mitigation becomes important for communication, financing and research.
What we need to test more widely, but has a credible concept and replicable methods
1. Appraisal methods and local capacity building: few generalisations in the sphere of natural resource management and environmental services hold true regardless of context and cost-effective rapid appraisal methods that acknowledge the multiple knowledge systems and perceptions are now available for site-specific appraisals. They have been transferred with success to some users beyond the method developers, but only where basic awareness of the approaches already exists. Further institutionalexpansion is needed, along with mainstreaming in generic education programs.
2. The operational rules for use of climate-change adaptation funds are still being refined.Further analysis is needed to what degree such funds can be channelled through PES mechanisms for 'preventing the increase of vulnerability' that might be the result of intensification/specialisation and loss of multifunctionality of landscapes. The level of site-specific detail needed of to 'make the case' needs to be tested.
3. While the rapid appraisal methods (see topic 1 above) seem to be very relevant in understanding issues and options from various perspectives, it is still a challenge todevelop an efficient way to package the tools with more quantitative methods for
120 HOW TREES AND PEOPLE CAN CO-ADAPT TO CLIMATE CHANGE

enhancing conditionality of rewards for environmental services (RES) contractspromoting and monitoring impacts of tree-based mitigadaptation options.
4. The practicality of the three PES (payment for environmental services) paradigms of co-investment and risk sharing (CIS), offsetting opportunity costs (COS), and optimal-threattheory for commoditised environmental services (CES) needs to be tested in reducingclimate vulnerability.
5. The Convention on Biological Diversity constrains the cross-border movement of germplasm while protecting national ownership claims of biological diversity whereasclimate change does not respect these borders and expands the natural range of some species in the long run. A more proactive use of tree germplasm that anticipates climatechange may need to break the institutional deadlock on germplasm exchange (GSF = germplasm sans frontiers).
REDUCING VULNERABILITY IN MULTIFUNCTIONAL LANDSCAPES 121


Adger WN. 2006. Vulnerability. Global Environmental Change 16(3): 268–281.
Adger WN, Benjaminsen TA, Brown K, Svarstad H. 2001. Advancing a political ecology of global environmental discourses. Development and Change 32: 681–715.
Adger WN, Dessai S, Goulden M, Hulme M, Lorenzoni I, Nelson DR, Naess LO, Wolf J, Wreford A. 2009. Are there social limits to adaptation to climate change? Climatic Change 93: 335–354.
Agrawal A, Perrin N. 2008. Climate adaptation, local institutions and rural livelihoods. IFRI WorkingPaper W081-6. Ann Arbor, USA: International Forestry Resources and Institutions Program, School of Natural Resources and Environment, University of Michigan.
Agus F, Farida, van Noordwijk M, eds. 2004. Hydrological impacts of forest, agroforestry and upland
cropping as a basis for rewarding environmental service providers in Indonesia. Proceedings of a workshop in Padang and Singkarak, West Sumatra, Indonesia, 25–28 February 2004. Bogor,Indonesia: World Agroforestry Centre (ICRAF) Southeast Asia Regional Program.
Akiefnawati R, Villamor GB, Zulfikar F, Budisetiawan I, Mulyoutami E, Ayat A, van Noordwijk M. 2010. Stewardship agreement to reduce emissions from deforestation and degradation (REDD): Lubuk Beringin's Hutan Desa, Jambi Province, Sumatra as the first formal and operational 'village forest'in Indonesia. International Forestry Review 12: 349–360.
Arnold JG, Srinivasan R, Muttiah RS, Williams JR. 1998. Large area hydrologic modeling and assessmentPart I: model development. Journal of the American Water Resources Association 34 (1): 73–89.
Arnold JG, Fohrer N. 2005. SWAT2000: current capabilities and research opportunities in applied watershed modelling. Hydrological Processes 19: 563–572.
Ash N, Blanco H, Brown C, Garcia K, Henrichs T, Lucas N, Raudsepp-Hearne C, Simpson RD, Scholes R, Tomich TP, Vira B, Zurek M, eds. 2010. Ecosystems and human well-being: a manual for
assessment practitioners. Washington, DC: Island Press. p. 71–114.
Dalal-Clayton B, Sadler B. 2005. Strategic environmental assessment: a sourcebook and reference guide
to international experience. London: Earthscan.
Bebbington A. 1999. Capitals and capabilities: a framework for analyzing peasant viability, rurallivelihoods and poverty. World Development 27: 2021–2044.
Beer J. 1987. Advantages, disadvantages and desirable characteristics of shade trees for coffee, cacaoand tea. Agroforestry Systems 5: 3–13.
Beer J, Muschler R, Kass D, Somarriba E. 1997. Shade management in coffee and cacao plantations.Agroforestry Systems 38: 139–164.
Beier P, Brost B. 2010. Use of land facets to plan for climate change: conserving the arenas, not the actors. Conservation Biology 24: 701–710.
Blaikie PM, Cannon T, Davis I, Wisner B. 1994. At risk: natural hazards, people's vulnerability, and
disasters. London: Routledge.
Canadell JG, Le Quéré C, Raupach MR, Field CB, Buitenhuis ET, Ciais TJ, Conway P, Gillett NP, HoughtonRA, Marland G. 2007. Contributions to accelerating atmospheric CO growth from economic 2
References

activity, carbon intensity, and efficiency of natural sinks. Proceedings of the National Academy of
Sciences (USA) 104: 18866–18870.
Carney D. 1998. Implementing the sustainable rural livelihoods approach. Sustainable rural livelihoods:
what contribution can we make? London: Department for International Development. p. 3–23.
Chakeredza S, Temu AB, Yaye A, Mukingwa S, Saka JDK. 2009. Mainstreaming climate change into
agricultural education: challenges and perspectives. ICRAF Working Paper 82. Nairobi: WorldAgroforestry Centre (ICRAF).
Clark WC, Tomich PT, van Noordwijk M, Guston D, Catacutan D, Dickson NM, McNie E. 2011. Boundary work for sustainable development: natural resource management at the Consultative Group on International Agricultural Research (CGIAR). Proceedings of the National Academy of Sciences.DOI 10.1073/pnas.0900231108.
Colchester M, Lohmann L, eds. 1993. The struggle for land and the fate of the forests. London: ZedBooks.
Cook ER, Kairiukstis LA. 1990. Methods of dendrochronology. Boston, Mass: Kluwer Academic Press.
Crichton D. 1999. Natural disaster management. London: Tudor Rose.
Dasgupta S, Laplante B, Meisner C, Wheeler D, Yan J. 2009. The impact of sea level rise on developingcountries: a comparative analysis. Climatic Change 93:379–388.
[DFID] Department for International Development. 1999. Sustainable livelihoods guidance sheets.London: Department for International Development.
Diamond J. 2005. Collapse: how societies choose to fail or succeed. New York: Viking Press.
Dye PJ, Gush MB. 2008. Water use efficiency studies of South African Eucalyptus plantations and
indigenous tree species. International workshop: Ecohydrology and ecophysiology of plants in water-limited environments, 15–19 September 2008. Perth, Australia: The University of WesternAustralia. p. 22.
Ekadinata A, van Noordwijk M, Dewi S, Minang PA. 2010. Reducing emissions from deforestation, inside
and outside the 'forest'. ASB Policybrief 16. Nairobi: ASB Partnership for the Tropical ForestMargins.
Elith J, Graham CH, Anderson RP, Dudík M, Ferrier S, Guisan A, Hijmans RJ, Huettmann F, Leathwick JR, Lehmann A, Li J, Lohmann LG, Loiselle BA, Manion G, Moritz C, Nakamura M, Nakazawa Y,Overton JMcCM, Townsend Peterson A, Phillips SJ, Richardson K, Scachetti-Pereira R, Schapire RE, Soberón J, Williams S, Wisz MS, Zimmermann NE. 2006. Novel methods improve prediction of species' distributions from occurrence data. Ecography 29: 129-151.
[FAO] Food and Agriculture Organization of the United Nations. 2008. The state of food and agriculture.
biofuels: prospects, risks and opportunities. Rome: Food and Agriculture Organization of the United Nations.
Fay C, Michon G. 2005. Redressing forestry hegemony: when a forestry regulatory framework is replacedby an agrarian one. Forest, Trees and Livelihoods 15(2): 193–209.
Ferraro PJ. 2008. Asymmetric information and contract design for payments for environmental services. Ecological Economics 65: 810–821.
Ferraro PJ. 2004. Direct payment to protect endangered ecosystems and experimental methods to
estimate payment costs. Twenty-first biannual workshop of Economy and Environment Programfor Southeast Asia (EEPSEA), 16–20 May 2004. Ottawa: International Development ResearchCentre.
Fraser E. 2007. Travelling in antique lands: using past famines to develop an adaptability/resilienceframework to identify food systems vulnerable to climate change. Climatic Change 83: 495–514.
Friedman J, Hastie T, Tibshirani R. 2000. Additive logistic regression: a statistical view of boosting. The
Annals of Statistics 28(2).
124 HOW TREES AND PEOPLE CAN CO-ADAPT TO CLIMATE CHANGE

Gaffney O. 2009. A planet on the edge. Global Change 74. Available fromhttp://www.igbp.net/5.1b8ae20512db692f2a680003122.html.
Gebrekirstos A, Teketay D, Fetene M, Mitlöhner R. 2006. Adaptation of five co-occurring tree and shrub species to water stress and its implication in restoration of degraded lands. Forest Ecology and
Management 229: 259–267.
Gebrekirstos A, Teketay D, Mitlöhner R, Worbes, M. 2008. Climate–growth relationships of the dominanttree species from semi-arid savannah woodland in Ethiopia. Trends in Ecology and Evolution 22: 631–641. DOI 10.1007/s00468-008-0221-z.
Giannini A, M Biasutti, Held IM, Sobel AH. 2008. A global perspective on African climate. Climatic
Change 90: 359–383. DOI 10.1007/s10584-008-9396-y.
Goldewijk K, Battjes JJ. 1997. A hundred year database for integrated environmental assessments.Bilthoven, Netherlands: National Institute of Public Health and the Environment.
Gouyon A. 2003. Rewarding the upland poor for environmental services: a review of initiatives from
developed countries. RUPES Working Paper 2003-6. Bogor, Indonesia: World Agroforestry Centre(ICRAF) Southeast Asia Program.
Graudal L, Lillesø J-PB. 2007. Experiences and future prospects for tree seed supply in agricultural
development support — based on lessons learnt in Danida supported programmes, 1965–2005.Copenhagen: Ministry of Foreign Affairs of Demark.
Gready P, Ensor J. 2005. Reinventing development? Translating rights-based approaches from theory
into practice. London: ZED Books.
Grinsted A, Moore JC, Jevrejeva S. 2004. Application of the cross wavelet transform and waveletcoherence to geophysical time series. Nonlinear Processes in Geophysics 11: 561–566. DOI 10.5194/npg-11-561-2004.
Guisan A, Thuiller W. 2005. Predicting species distribution: offering more than simple habitat models. Ecology Letters 8: 993–1009. DOI 10.1111/j.1461-0248.2005.00792.x
Hairiah K, Sulistyani H, Suprayogo D, Widianto, Purnomosidhi P, Widodo RH, van Noordwijk M. 2006. Litter layer residence time in forest and coffee agroforestry systems in Sumberjaya, WestLampung. Forest Ecology and Management 224: 45–57.
Hare B, Meinshausen M. 2006. How much warming are we committed to and how much can be avoided? Climatic Change 75: 111–149.
Harrison GW, List JA. 2004. Field experiments. UCF Economics Working Paper 03-12. Orlando, USA: University of Central Florida. Available from SSRN: http://ssrn.com/abstract=698961
Hulme M. 2009. Why we disagree about climate change: understanding controversy, inaction and
opportunity. Cambridge, UK: Cambridge University Press.
[IPCC] Intergovernmental Panel on Climate Change. 2007a. Climate change 2007: the physical science
basis. Working Group I Report. Solomon S, Qin D, Manning M, Chen Z, Marquis M, Avery KB,Tignor M, Miller HL, eds. Cambridge, UK: Cambridge University Press.
[IPCC] Intergovernmental Panel on Climate Change. 2007b. Climate change 2007: impacts, adaptation
and vulnerability. Working Group II Report. Parry ML, Canziani OF, Palutikof JP, van der Linden PJ,Hanson CE, eds. Cambridge, UK: Cambridge University Press.
[IPCC] Intergovernmental Panel on Climate Change. 2001a. Climate Change 2001: impacts, adaptation
and vulnerability: summary for policymakers. Working Group II Report. Cambridge, UK:Cambridge University Press.
[IPCC] Intergovernmental Panel on Climate Change. 2001b. Technical summary of the Working Group II
report. Report accepted by Working Group II but not approved in detail. Geneva:Intergovernmental Panel on Climate Change.
REDUCING VULNERABILITY IN MULTIFUNCTIONAL LANDSCAPES 125

[IPCC] Intergovernmental Panel on Climate Change. 2000. Emissions scenarios. Nakicenovic N, Swart R, eds. Cambridge, UK: Cambridge University Press.
Jackson BM, Pagella T, Orellana B, Dangwal S. 2009. Draft Polyscape manual. Quoted in Bhattarai S. Spatially explicit assessment of tradeoffs and synergies amongst key ecosystem services in Sasuma watershed, Kenya. Thesis. Gwynedd, UK: School of Environment, Natural Resources and Geography, Bangor University. Available from http://www.presa.worldagroforestry.org/WP-CONTENT/.../Sanjeeb_THESIS.pdf.
Jackson LE, van Noordwijk M, Bengtsson J, Foster W, Lipper L, Pulleman M, Said M, Snaddon J, VodouheR. 2010. Biodiversity and agricultural sustainagility: from assessment to adaptive management.Current Opinion in Environmental Sustainability 2: 80–87.
Jagger P, Pender J. 2003.The role of trees for sustainable management of less-favored lands: the case of eucalyptus in Ethiopia. Forest Policy and Economics 5: 83–95.
Jakeman AJ, Hornberger GM. 1993. How much complexity is warranted in a rainfall-runoff model? Water Resources Research 29(8): 2637–2649.
Jakeman AJ, Littlewood IG, Whitehead PG. 1990. Computation of the instantaneous unit hydrograph and identifiable components flows with application to the small upland catchments. Journal of
Hydrology 117: 275–300.
Jevrejeva S, Moore JC, Grinsted A. 2003. Influence of the Arctic Oscillation and El Nino-Southern Oscillation (ENSO) on ice conditions in the Baltic Sea: the wavelet approach. Journal Geophysical
Research 108(D21): 4677. DOI 10.1029/2003JD003417.
Johnson MS. 2009. Public participation and perceptions of watershed modeling. Society and Natural
Resources 22: 79–87.
Joshi L, Wibawa G, Beukema HJ, Williams SE, van Noordwijk M. 2003. Technological change and biodiversity in the rubber agroecosystems. In: Vandermeer JH, ed. Tropical agroecosystems: new
directions for research. Boca Raton, USA: CRC Press. p. 133–157.
Kandji ST, Verchot LV, Mackensen J, Boye A, van Noordwijk M, Tomich TP, Ong CK, Albrecht A, Palm CA. 2006. Opportunities for linking climate change adaptation and mitigation through agroforestrysystems. In: Garrity DP, Okono A, Grayson M, Parrott S, eds. World agroforestry into the future.Nairobi: World Agroforestry Centre (ICRAF). p. 113–121.
Kerr J, Meinzen-Dick R, Pender J, Suyanto S, Swallow BM, van Noordwijk M. 2005. BASIS brief: property
rights, environmental services and poverty in Indonesia. Madison, USA: Department of Agricultural and Applied Economics, University of Wisconsin.
Kiehl JT, Trenberth KE. 1997. Earth's annual global mean energy budget. Bulletin of the American
Meteorological Society 78: 197–208.
Klein RJT, Huq S, Denton F, Downing TE, Richels RG, Robinson JB, Toth FL. 2007. Inter-relationshipsbetween adaptation and mitigation. In: Parry ML, Canziani OF, Palutikof JP, van der Linden PJ,Hanson CE, eds. Climate Change 2007: impacts, adaptation and vulnerability. Contribution of
Working Group II to the Fourth Assessment Report of the Intergovernmental Panel on Climate
Change. Cambridge, UK: Cambridge University Press. p. 745–777.
Knopf B, Edenhofer O, Barker T, Bauer N, Baumstark L, Chateau B, Criqui P, Held A, Isaac M, Jakob M, Jochem E, Kitous A, Kypreos S, Leimback M, Magné B, Mima S, Schade W, Scrieciu S, Turton H, vanVuuren D. 2010. The economics of low stabilisation: implications for technological change and policy. In: Hulme M, Neufeldt H, eds. Making climate change work for us: European perspectives
on adaptation and mitigation strategies. Cambridge, UK: Cambridge University Press.
Kosoy N, Corbera E. 2010. Payments for ecosystem services as commodity fetishism. Ecological
Economics 69: 1228–1236.
126 HOW TREES AND PEOPLE CAN CO-ADAPT TO CLIMATE CHANGE
Kumar P, Brondizio E, Elmqvist T, Gatzweiler F, Gowdy J, de Groot D, Muradian R, Pascual U, Reyers B,Smith RB-W, Sukhdev P. 2010. Lessons learned and linkages with national policies. In: the
economics of ecosystems and biodiversity: ecological and economic foundations. London: Earthscan.
Kusters K, de Foresta H, Ekadinata A, van Noordwijk M. 2007. Towards solutions for state vs. localcommunity conflicts over forestland: the impact of formal recognition of user rights in Krui,Sumatra, Indonesia. Human Ecology 35: 427–438.
Lambin EF, Meyfroidt P. 2010. Land use transitions: Socio-ecological feedback versus socio-economic change. Land Use Policy 27: 108–118.
Lambin EF, Turner BL, Geist HJ, Agbola SB, Angelsen A, Bruce JW, Coomes OT, Dirzo R, Fischer G, Folke C, George PS, Homewood K, Imbernon J, Leemans R, Li X, Moran EF, Mortimore M, Ramakrishnan PS, Richards JF, Skånes H, Steffen W, Stone GD, Svedin U, Veldkamp TA, Vogel C, Xu J. 2001. The causes of land-use and land-cover change: moving beyond the myths. Global Environmental
Change 11: 261–269.
Larcher W. 2003. Physiological plant ecology; ecophysiology and stress physiology of functional groups.London: Springer.
Latacz-Lohmann U, Schilizzi S. 2005. Auction for conservation contracts: a review of the theoretical and
empirical literature. Edinburgh, UK: Scottish Executive Environment and Rural Affairs Department.
Leemans R, Asrar G, Canadell JG, Ingram J, Larigauderie A, Mooney H, Nobre C, Patwardhan A, Rice M, Schmidt F, Seitzinger S, Virji H, Vörösmarthy C, Yuoung O. 2009. Developing a common strategyfor integrative global environmental change research and outreach: the Earth System Science Partnership (ESSP). Current Opinion in Environmental Sustainability 1(1): 4–13.
Leimona B, Jack BK, Lusiana B, Pasha R. 2010. Designing a procurement auction for reducing
sedimentation: a field experiment in Indonesia. Research Paper. Singapore: Economy and Environment Program for Southeast Asia.
Leimona B, Joshi L, van Noordwijk M. 2009. Can rewards for environmental services benefit the poor? Lessons from Asia. International Journal of the Commons 3: 82–107.
Lusiana B, van Noordwijk M, Suyamto D, Joshi L, Cadisch G. 2011. Users' perspectives on validity of a simulation model for natural resource management. International Journal of Agricultural
Sustainability 9(2): 364–378.
[MA] Millennium Ecosystem Assessment. 2005. Ecosystems and human well-being: synthesis.Washington DC: Island Press. Available fromhttp://www.millenniumassessment.org/documents/document.356.aspx.pdf.
Ma X, Xu J, van Noordwijk M. 2010. Sensitivity of stream flow from a Himalayan catchment to plausible changes in land-cover and climate. Hydrological Processes 24: 1379–1390.
McGray H, Bradley R, Hammil A. 2007. Weathering the storm: options for framing adaptation and
development. Washington, DC: World Resources Institute. Available fromhttp://www.wri.org/publication/weathering-the-storm.
[MONRE] Ministry of Natural Resources and Environment. 2009. Dialogue on climate change
adaptation for land and water management. Regional workshop, Hanoi, 19–21 January 2009. Hanoi: Ministry of Natural Resources and Environment, Socialist Republic of Vietnam; Copenhagen: Ministry of Foreign Affairs, Government of Denmark.
Muthuri C, Ong CK, Black CR. 2008. Gas exchange and water use efficiency of trees and crops in
agroforestry systems in semi-arid Kenya. International workshop: Ecohydrology and ecophysiology of plants in water-limited environments, 15–19 September 2008. Perth, Australia:The University of Western Australia. p. 35–36.
REDUCING VULNERABILITY IN MULTIFUNCTIONAL LANDSCAPES 127

Nadarajah S. 2005. Extremes of daily rainfall in west central Florida. Climatic Change 69(2–3): 325–342. DOI 10.1007/s10584-005-1812-y.
Neitsch SL, Arnold JG, Kiniry JR, Williams JR, King KW. 2002. Soil and water assessment tool theoretical
documentation. Ver. 2000. Temple, USA: Grassland, Soil and Water Research Laboratory,Agricultural Research Service. Available fromhttp://swatmodel.tamu.edu/media/1290/swat2000theory.pdf.
Nepstad DC, Tohver IM, Ray D, Moutinho P, Cardinot G. 2007. Mortality of large trees and lianas following experimental drought in an Amazon forest. Ecology 88: 2259–2269.
Ong CK. 2003. The Eucalyptus dilemma: friend or foe? Presented at RELMA-Sida workshop: EucalyptusDilemma Forum, Nairobi, Kenya, 5 June 2003.
Ong CK, Black CB, Muthuri CW. 2006. Modifying forestry and agroforestry to increase water productivityin the semi-arid tropics. CAB Reviews: Perspectives in Agriculture, Veterinary Science, Nutrition
and Natural Resources 2006/1/065.
Pascual U, Muradian R, Brander L, Gómez-Baggethun E, Martín-López B, Verma M, Armsworth P, ChristieM, Cornelissen H, Eppink F, Farley J, Loomis J, Pearson L, Perrings C, Polask S. 2010. The economics of valuing ecosystem services and biodiversity. In: The Economics of Ecosystems and
Biodiversity: Ecological and Economic Foundations. London: Earthscan.
Phillips SJ, Dudik M. 2008. Modeling of species distributions with Maxent: new extensions and a comprehensive evaluation. Ecography 31: 161–175.
Reid WV, Chen D, Goldfarb L, Hackmann H, Lee YT, Mokhele K, Ostrom E, Raivio K, Rockström J,Schellnhuber HJ, Whyte A. 2010. Earth system science for global sustainability: grand challenges. Science 330: 916–917.
Ribot J. 1995. The causal structure of vulnerability: Its application to climate impact analysis. GeoJournal
35: 119–22.
Rockström J, Steffen W, Noone K, Persson Å, Chapin III FS, Lambin E, Lenton TM, Scheffer M, Folke C, Schellnhuber H, Nykvist B, De Wit CA, Hughes T, van der Leeuw S, Rodhe H, Sörlin S, Snyder PK, Costanza R, Svedin U, Falkenmark M, Karlberg L, Corell RW, Fabry VJ, Hansen J, Walker B, LivermanD, Richardson K, Crutzen P, Foley J. 2009. Planetary boundaries: exploring the safe operatingspace for humanity. Ecology and Society 14(2): 32. Available fromwww.ecologyandsociety.org/vol14/iss2/art32/.
Roshetko JM, Snelder DJ, Lasco RD, van Noordwijk M. 2008. Future challenge: a paradigm shift in the forestry sector. In: Snelder DJ, Lasco RD, eds. Smallholder tree growing for rural development and
environmental services: lessons from Asia. Advances in Agroforestry Vol. 5. Berlin: Springer. p. 451–483.
Santos-Martýn F, Bertomeu M, van Noordwijk M, Navarro-Cerrillo RM. 2011. Understanding foresttransition in the Philippines: main farm-level factors influencing smallholders’ capacity and intention to plant native timber trees. Small-scale Forestry. DOI 10.1007/s11842-011-9166-y.
Schultink G. 2007. Sustainable land use and urban growth management: demand-supply factors and strategic planning considerations. Journal of Agricultural, Food and Environmental Sciences 1(1). Available from www.scientificjournals.org/journals2007/articles/1030.htm.
Shem K, Muthuri CW, Ong CK. 2009. Gas exchange responses of Eucalyptus, C. africana and G. robusta to varying soil moisture content in semi-arid (Thika) Kenya. Agroforestry Systems 75: 239–249.
Sinclair FL, Pagella T, Jackson B. 2009. Agroforestry: new ways of visualising how trees can enhance
ecosystem functions in farmed landscapes. Joensuu, Finland: European Forest Institute. Availablefrom http://www.efi.int/files/attachments/events/ac2008/keynote-sinclair.pdf.
128 HOW TREES AND PEOPLE CAN CO-ADAPT TO CLIMATE CHANGE

Smettem K, Harper R. 2009. Using trees to manage local and regional water balances. In: Nuberg I, George B, Reid R, eds. Agroforestry for natural resource management. Melbourne, Australia:CSIRO Publishing.
Soberón J, Peterson AT. 2005. Interpretation of models of fundamental ecological niches and species' distributional areas. Biodiversity Informatics 2: 1–10.
Stern N. 2007. The economics of climate change: the Stern review. Cambridge, UK: Cambridge UniversityPress.
Stigter K, ed. 2010. Applied Agrometeorology. Berlin: Springer.
Stigter CJ, Dawei Z, Onyewotu LOZ, Xurong M. 2005. Using traditional methods and indigenoustechnologies for coping with climate variability. Climatic Change 70: 255–271.
Suyanto S, Permana RP, Khususiyah N, Joshi L. 2004. Land tenure agroforestry adoption and reduction of fire hazard in a forest: a case study from Lampung, Sumatra Indonesia. Agroforestry Systems
65(1): 1–11.
Suyanto S, Muharrom E, van Noordwijk M. 2009. Fair and efficient? How stakeholders view investments
to avoid deforestation in Indonesia. ICRAF Policy Brief 8. Bogor, Indonesia: World AgroforestryCentre (ICRAF) Southeast Asia Regional Program.
Swallow BM, Kallesoe MF, Iftikhar UA, van Noordwijk M, Bracer C, Scherr SJ, Raju KV, Poats SV, KumarDuraiappah A, Ochieng BO, Mallee H, Rumley R. 2009. Compensation and rewards forenvironmental services in the developing world: framing pan-tropical analysis and comparison. Ecology and Society 14(2): 26. Available fromhttp://www.ecologyandsociety.org/vol14/iss2/art26/.
[TEEB] The Economics of Ecosystems and Biodiversity. 2010. The economics of ecosystems and
biodiversity: mainstreaming the economics of nature: a synthesis of the approach, conclusions
and recommendations of TEEB. Geneva: The Economics of Ecosystems and Biodiversity, UnitedNations Environment Programme. Available fromhttp://www.teebweb.org/TEEBSynthesisReport/tabid/29410/Default.aspx.
Tomich TP, Kenneth CK, Francisco H, Izac AM, Murdiyarso D, Ratner B, Thomas DE, van Noordwijk M. 2004. Asking the right questions: policy analysis and environmental problems at different scales.Agriculture, Ecosystems and Environment 104: 5–18.
Tomich TP, Cattaneo A, Chater S, Geist HJ, Gockowski J, Kaimowitz D, Lambin EF, Lewis J, Ndoye O, PalmC, Stolle F, Sunderlin WD, Valentim JF, van Noordwijk M, Vosti SA. 2005. Balancing agriculturaldevelopment and environmental objectives: assessing tradeoffs in the humid tropics. In: Palm CA, Vosti SA, Sanchez PA, Ericksen PJ, Juo ASR, eds. Slash and burn: the search for alternatives. New York: Columbia University Press. p. 415–440.
Tomich TP, Argumedo A, Baste I, Camac E, Filer C, Garcia K, Garbach K, Geist H, Izac AM, Lebel L, Lee M, Nishi M, Olsson L, Raudsepp-Hearne C, Rawlins M, Scholes R, van Noordwijk M. 2010. Conceptual frameworks for ecosystem assessment: their development, ownership, and use. In: Ash N, Blanco H, Brown C, Garcia K, Henrichs T, Lucas N, Raudsepp-Hearne C, Simpson RD, Scholes R, Tomich TP,Vira B, Zurek M, eds. Ecosystems and human well-being: a manual for assessment practitioners.
Washington, DC: Island Press. p. 71–115.
Tran P, Marincioni F, Shaw R. 2010. Catastrophic flood and forest cover change in the Huong river basin, central Viet Nam: a gap between common perceptions and facts. Journal of Environmental
Management 91: 2186–2200.
[UNFCCC] United Nations Framework Convention on Climate Change. 2007. Investment and financial
flows to address climate change. Bonn, Germany: United Nations Framework Convention on Climate Change Secretariat.
REDUCING VULNERABILITY IN MULTIFUNCTIONAL LANDSCAPES 129

Van Dijk AIJM, van Noordwijk M, Calder IR, Bruijnzeel LA, Schellekens Chappell JNA. 2009. Forest-floodrelation still tenuous. Comment on: Bradshaw CJA, Sodi NS, Peh KSH, Brook BW. Global evidence that deforestation amplifies flood risk and severity in the developing world. Global Change
Biology 15: 110–115.
Van Noordwijk M. 2005. RUPES typology of environmental service worthy of reward. RUPES WorkingPaper. Bogor, Indonesia: World Agroforestry Centre (ICRAF) Southeast Asia Regional Program.
Van Noordwijk M, Leimona B. 2010. Principles for fairness and efficiency in enhancing environmentalservices in Asia: payments, compensation, or co-investment? Ecology and Society 15(4): 17. Available from http://www.ecologyandsociety.org/vol15/iss4/art17.
Van Noordwijk M, Minang PA. 2009. If we cannot define it, we cannot save it. ETFRN NEWS 50: 5–10.
Van Noordwijk M, Tomich TP, Winahyu R, Murdiyarso D, Partoharjono S, Fagi AM, eds. 1995. Alternatives
to slash-and-burn in Indonesia: summary report of Phase 1. ASB Indonesia Report 4. Bogor,Indonesia: World Agroforestry Centre (ICRAF) Southeast Asia Regional Program; Nairobi: ASB Partnership for the Tropical Forest Margins.
Van Noordwijk M, Cadisch G, Ong CK, eds. 2004a. Belowground interactions in tropical agroecosystems.Wallingford, UK: CAB International.
Van Noordwijk M, Chandler F, Tomich TP. 2004b. An introduction to the conceptual basis of RUPES:
rewarding upland poor for the environmental services they provide. Bogor, Indonesia: WorldAgroforestry Centre (ICRAF) Southeast Asia Regional Program.
Van Noordwijk M, Poulsen J, Ericksen P. 2004c. Filters, flows and fallacies: quantifying off-site effects of land use change. Agriculture, Ecosystems and Environment 104: 19–34.
Van Noordwijk M, Leimona B, Emerton L, Tomich TP, Velarde SJ, Kallesoe M, Sekher M, Swallow BM. 2007. Criteria and indicators for environmental service compensation and reward mechanisms:
realistic, voluntary, conditional and pro-poor. ICRAF Working Paper 37. Bogor, Indonesia: WorldAgroforestry Centre (ICRAF) Southeast Asia Regional Program.
Van Noordwijk M, Roshetko JM, Murniati, Angeles MD, Suyanto, Fay C, Tomich TP. 2008. Farmer tree-planting barriers to sustainable forest management. In: Snelder DJ, Lasco RD, eds. Smallholder
tree-growing for rural development and environmental services: lessons from Asia. Advances in Agroforestry vol. 5. Berlin: Springer. p. 427–449.
Van Noordwijk M, Agus F, Dewi S, Ekadinata A, Tata HL, Suyanto, Galudra G, Pradhan UP. 2010. Opportunities for reducing emissions from all land uses in Indonesia: policy analysis and case
studies. Nairobi: ASB Partnership for the Tropical Forest Margins.
Van Noordwijk M, Lusiana B, Villamor G, Purnomo H, Dewi S. 2011a. Feedback loops added to fourconceptual models linking land change with driving forces and actors. Ecology and Society 16(1): r1. Available from http://www.ecologyandsociety.org/vol16/iss1/resp1.
Van Noordwijk M, Widodo RH, Farida A, Suyamto D, Lusiana B, Tanika L, Khasanah N. 2011b. GenRiver
and FlowPer: Generic River and Flow Persistence models. User manual version 2.0. Bogor,Indonesia: World Agroforestry Centre (ICRAF) Southeast Asia Regional Program.
Verbist B, Poesen J, van Noordwijk M, Widianto, Suprayogo D, Agus F, Deckers J. 2010. Factors affectingsoil loss at plot scale and sediment yield at catchment scale in a tropical volcanic agroforestrylandscape. Catena 80: 34–46.
Verchot LV, van Noordwijk M, Kandji S, Tomich TP, Ong CK, Albrecht A, Mackensen J, Bantilan C, Anupama KV, Palm CA. 2007. Climate change: linking adaptation and mitigation throughagroforestry. Mitigation and Adaptation Strategies for Global Change 12: 901–918.
Villamor GB, Van Noordwijk M. 2011. Social role play games versus individual perceptions of conservation and PES agreements for maintaining rubber agroforests in Jambi (Sumatra),Indonesia. Ecology and Society. In press.
130 HOW TREES AND PEOPLE CAN CO-ADAPT TO CLIMATE CHANGE

Villamor GB, van Noordwijk M, Le QB, Lusiana B, Mathews R. 2011. Diversity deficits in modelled landscape mosaics. Ecological Informatics 6: 73–82.
Weber JC, Larwanou M, Abasse TA, Kalinganire A. 2008. Growth and survival of Prosopis africanaprovenances tested in Niger and related to rainfall gradients in the West African Sahel. Forest
Ecology and Management 256: 585–592.
Wisz MS, Hijmans JL, Peterson, Graham CH, Guisan A. 2008. Effects of sample size on the performanceof species distribution models. Diversity and Distributions. DOI 10.1111/j.1472-4642.2008.00482.x.
Worbes M. 1999. Annual growth rings, rainfall dependent growth and long–term growth patterns of tropical trees from the Forest Reserve Caparo in Venezuela. Journal of Ecology 87: 391–403.
World Bank. 2009. World Development Report 2010: development and climate change. Washington, DC: World Bank.
Wunder S. 2005. Payments for environmental services: some nuts and bolts. CIFOR Occasional Paper 42. Bogor, Indonesia: Center for International Forestry Research.
Xu J .2011. China's new forests aren't as green as they seem. Nature 477: 371.
Yatich T, Akinnifesi FK, Minang PA, Ajayi OC. 2008. Positioning agricultural research for effective
contribution to climate change in sub-Saharan Africa: enhancing 'knowledge to action' and 'action
to knowledge'. Second African Network for Agriculture, Agroforestry and Natural Resourcesinternational symposium: Mainstreaming Climate Change into Agricultural and Natural ResourcesManagement Education: Tools, Experiences and Challenges, 28 July–1 August 2008, University of Malawi, Lilongwe, Malawi.
Zomer RJ, Trabucco A, Coe R, Place F. 2009. Trees on farm: analysis of global extent and geographical
patterns of agroforestry. Working Paper 89. Nairobi: World Agroforestry Centre (ICRAF).
REDUCING VULNERABILITY IN MULTIFUNCTIONAL LANDSCAPES 131

List of contributors and
their institutional affiliation
Henry NeufeldtWorld Agroforestry Centre (ICRAF)Nairobi, [email protected]
Hosea MwangiJomo Kenyatta University of Agriculture and TechnologyNairobi, [email protected]
Ian DawsonWorld Agroforestry Centre (ICRAF)Nairobi, [email protected]
Ingrid Öborn Swedish University of Agricultural SciencesUppsala, [email protected]
Isabel van de SandDeutsches Institut für EntwicklungspolitikGerman Development Institute, Bonn, [email protected]
Johannes DietzWorld Agroforestry Centre (ICRAF)Lima, [email protected]
John Mwangi GathenyaJomo Kenyatta University of Agriculture and TechnologyNairobi, [email protected]
John WeberWorld Agroforestry Centre (ICRAF)Bamako, [email protected]
Jules BayalaInstitut de l’Environnement et de RechercheAgricole
Antoine KalinganireWorld Agroforestry Centre (ICRAF)Bamako, [email protected]
Aster GebrekirstosWorld Agroforestry Centre (ICRAF)Nairobi, [email protected]
Beria LeimonaWorld Agroforestry Centre (ICRAF)Bogor, [email protected]
Carmen Sotelo MontesWorld Agroforestry Centre (ICRAF)Bamako, [email protected]
Caroline Duque-PiñonWorld Agroforestry Centre (ICRAF)Los Baños, The [email protected]
Catherine MuthuriJomo Kenyatta University of Agriculture and Technology and World Agroforestry Centre (ICRAF)Nairobi, [email protected]
Chin K. Ong 16 Willow Poole LaneSutton Bonington, Leics, [email protected]
Delia CatacutanWorld Agroforestry Centre (ICRAF)Nairobi, [email protected]
Fergus SinclairWorld Agroforestry Centre (ICRAF)Nairobi, [email protected]

Qureish NoordinWorld Agroforestry Centre (ICRAF)Nairobi, [email protected]
Ramni JamnadassWorld Agroforestry Centre (ICRAF)Nairobi, [email protected]
Rodel Lasco World Agroforestry Centre (ICRAF) Los Baños, The [email protected]
Roeland Kindt World Agroforestry Centre (ICRAF)Nairobi, [email protected]
Sanjeeb BhattaraiAsia Network for Sustainable Agriculture and BioresourcesKathmandu, [email protected]
Shem KuyahWorld Agroforestry Centre (ICRAF)Nairobi, [email protected]
SuyantoWorld Agroforestry Centre (ICRAF)Bogor, [email protected]
Thomas YatichWorld Agroforestry Centre (ICRAF)Nairobi, Kenya, andProgram Manager (Environment)European Union DelegationNairobi, [email protected]@yahoo.com
Ylva NybergTechnical Programme Adviser,Vi AgroforestryPO BOX 3160 40100 Kisumu, [email protected]
Ouagadougou, Burkina Faso, andWorld Agroforestry Centre (ICRAF)Bamako, [email protected]
Karen TscherningLeibniz Centre for Agricultural Landscape ResearchMüncheberg, [email protected]@hotmail.com
Kurniatun HairiahUniversity of Brawijaya, Faculty of AgricultureMalang, [email protected]@gmail.com
Laxman JoshiWorld Agroforestry Centre (ICRAF)Bogor, Indonesia, andInternational Centre for Integrated [email protected]
Leah OnyangoMaseno University, [email protected]
Meine van NoordwijkWorld Agroforestry Centre (ICRAF)Bogor, [email protected]
Minh Ha HoangWorld Agroforestry Centre (ICRAF)Hanoi, Vietnam, andSwedish University of Agricultural SciencesUppsala, [email protected]
Nestry NdichuMinistry of water and irrigationMount Kenya East pilot project for Naturalresources management (MKEPP-NRM)P.O. Box 542 Embu, [email protected]
Nguyen Hoang QuanWorld Agroforestry Centre (ICRAF)Hanoi, [email protected]
REDUCING VULNERABILITY IN MULTIFUNCTIONAL LANDSCAPES 133

Glossary of terms and acronyms
Permanence
PES
PRESA
REDD+ (REDD plus)
REDD++ (REALU)
RES
RUPES
UNFCCC
Value chain
or temporal leakage refers to futureemissions (beyond project accounting period)
Payments for environmental (or ecosystem)services
Pro-Poor Rewards for EnvironmentalServices, network of learning landscapes in Africa
Reducing emissions fromdeforestation and forest degradation plus forestrestoration
Reducing emissions from all land uses
Rewards for environmental (or ecosystem)services
Rewarding Upland Poor for the Environmental Services they provide, a network of learning landscapes in Asia
United Nations Framework Convention on Climate Change
is a representation of a sequence of actions that transform raw materials (or land-use-enhancing carbon sequestration) into marketableproducts (certified emission reduction) that an end user could buy
Adaptation
Additionality
CES
CIS
COP
COS
Effectiveness
Efficiency
Fairness
GAMA
GHG
IPCC
LAAMA
Mitigation
MRV
NAMA
NAPA
is adjustment to changing conditions
refers to the emission reductionachieved in comparison to a ‘business as usual’ development pathway
Commoditized environmental services
Co-investment in stewardship of environmentalservices
Conference of Parties, the regular meetings held under international conventions such as the UNFCCC
Compensation (offsetting costs) foropportunities skipped
means success or achieving the results that you want (targets)
means effectiveness (achieving targets)per unit invested focusing on areas to reduceemission
means meeting moral and ethicalstandards of distributional effects of programimplementation
Globally appropriate mitigation actions
greenhouse gas
International Panel on Climate Change, the science/policy boundary organization that reviewsevidence on climate change in a five-year cycle of reporting
Locally appropriate adaptation and mitigation actions
is reducing the unintended, negativeeffects of human activity
Monitoring, reporting and verification
Nationally appropriate mitigation action
National adaptation plan of action