
How to not be a power expert, but act like one...Visibility, Reliability and Predictability
24
How to not be a power expert, but act like one... Visibility, Reliability and Predictability
-
Upload
digitallibrary -
Category
Technology
-
view
664 -
download
2
Transcript of How to not be a power expert, but act like one...Visibility, Reliability and Predictability
How to not be a power
expert, but act like one...
Visibility, Reliability and
Predictability
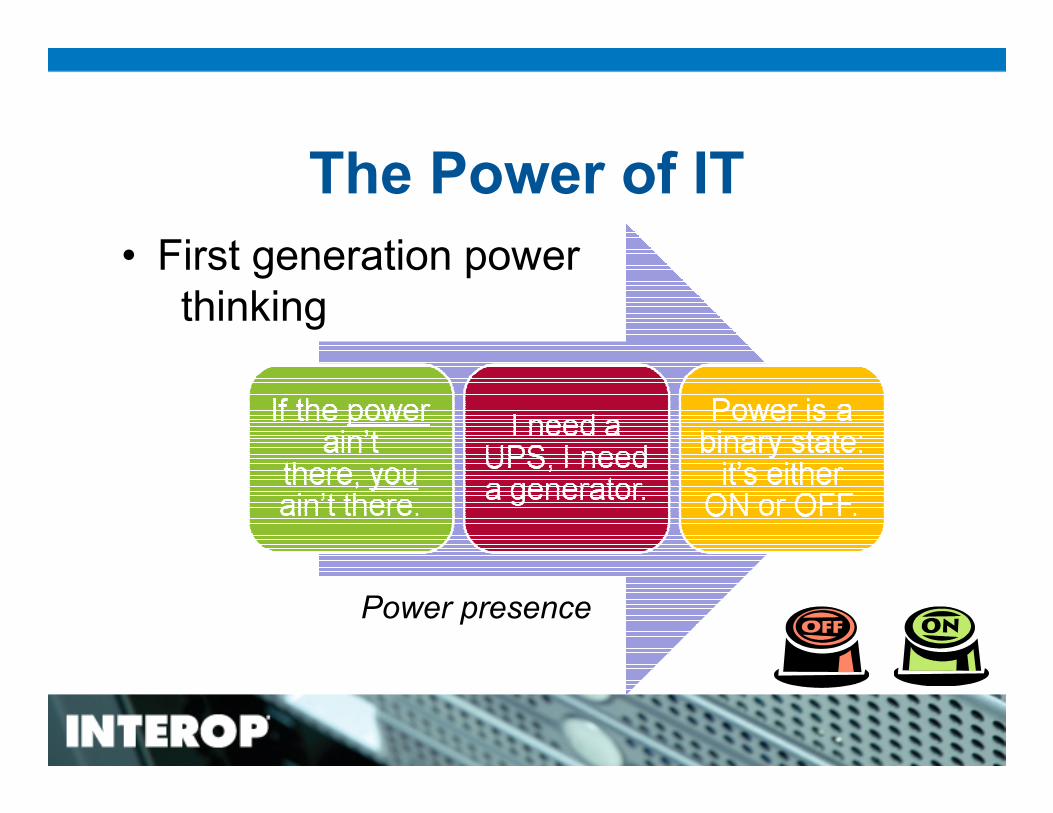
The Power of IT
• First generation power
thinking
Power presence

Real Power• Just because you have power, doesn’t
mean you’ve got good power. It’s only
the beginning.
• Power is not a binary thing.
Difference between reacting to a
catastrophe and preventing a
catastrophe.
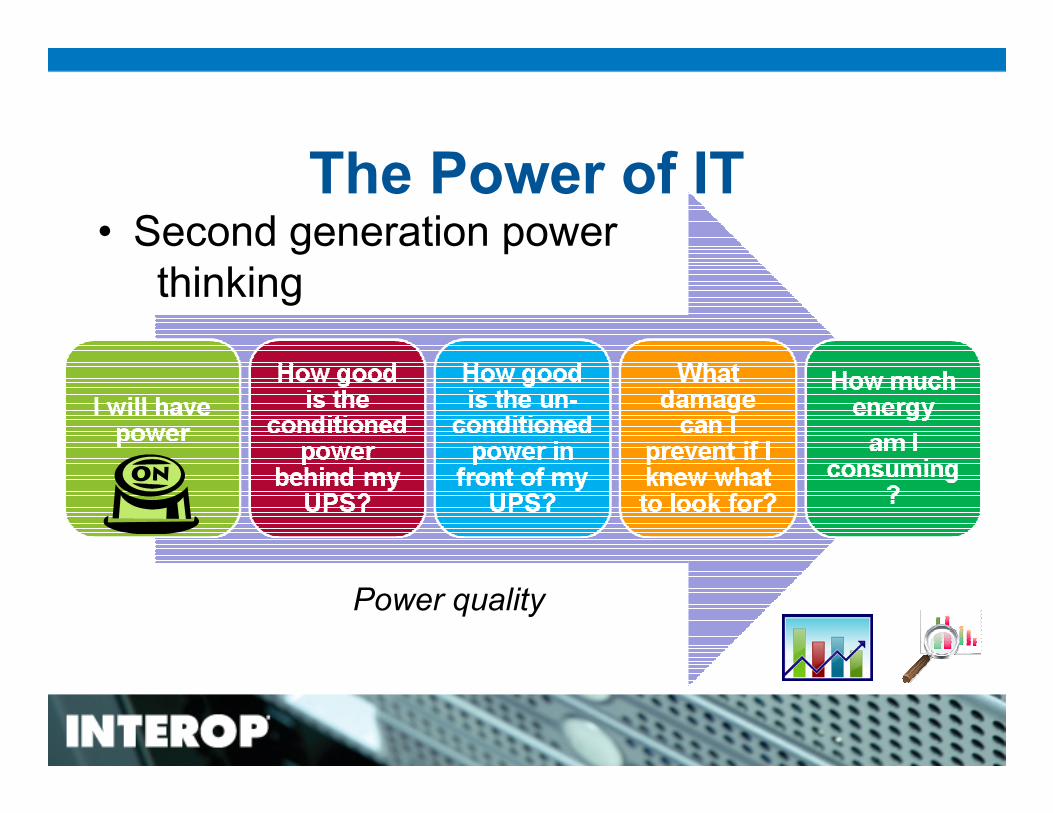
The Power of IT• Second generation power
thinking
Power quality
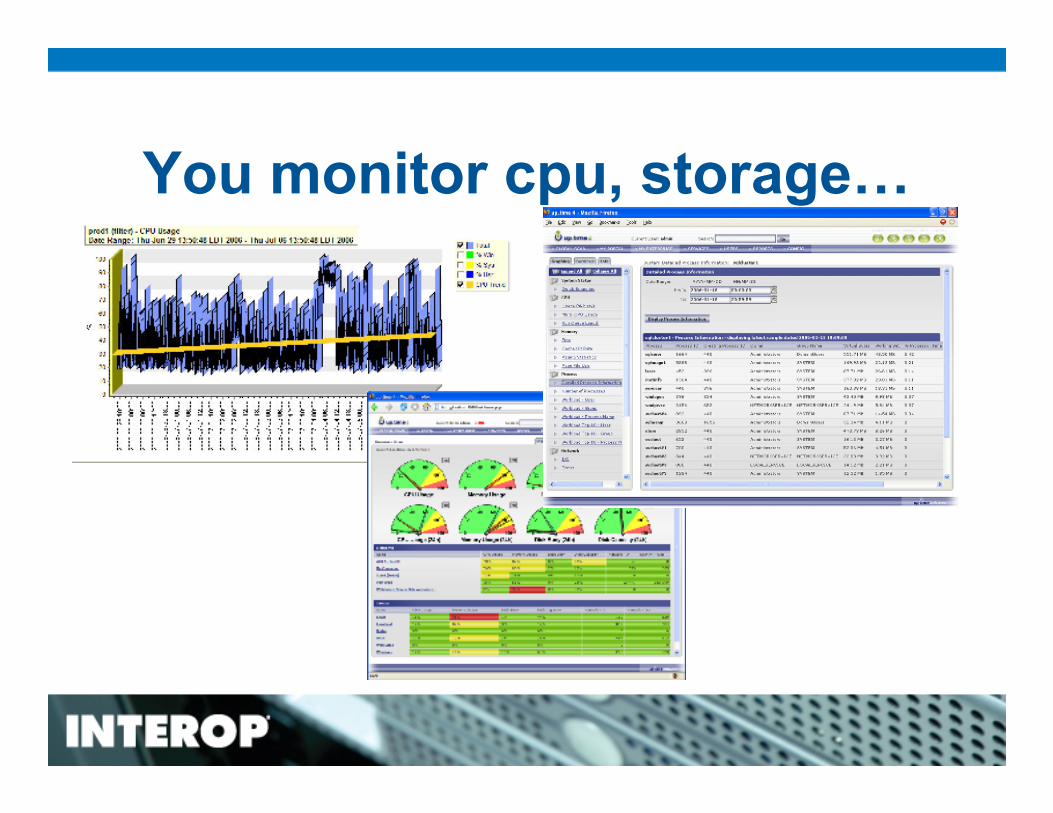
You monitor cpu, storage…

0 to10
30 to 40
60 to 70
12345
6-10
10-2
0
20-5
0
0
1
2
3
4
5
6
Events
Per
Year
Voltage (% of
Nominal)
Duration ( cycles)
Average of 50
Sags/Year
Interruptions
Typical PQ Problems
10%
7%
5% 5% 5%
10%
5%
7%
46% Sags
Swells
Spikes, switching Spikes, switching transients transients
Under voltage Under voltage
Over voltage Over voltage
Harmonics Harmonics
Line Noise Line Noise
Frequency Frequency variations variations 2002 EPRI study
of 985 customers in the US
Interruption
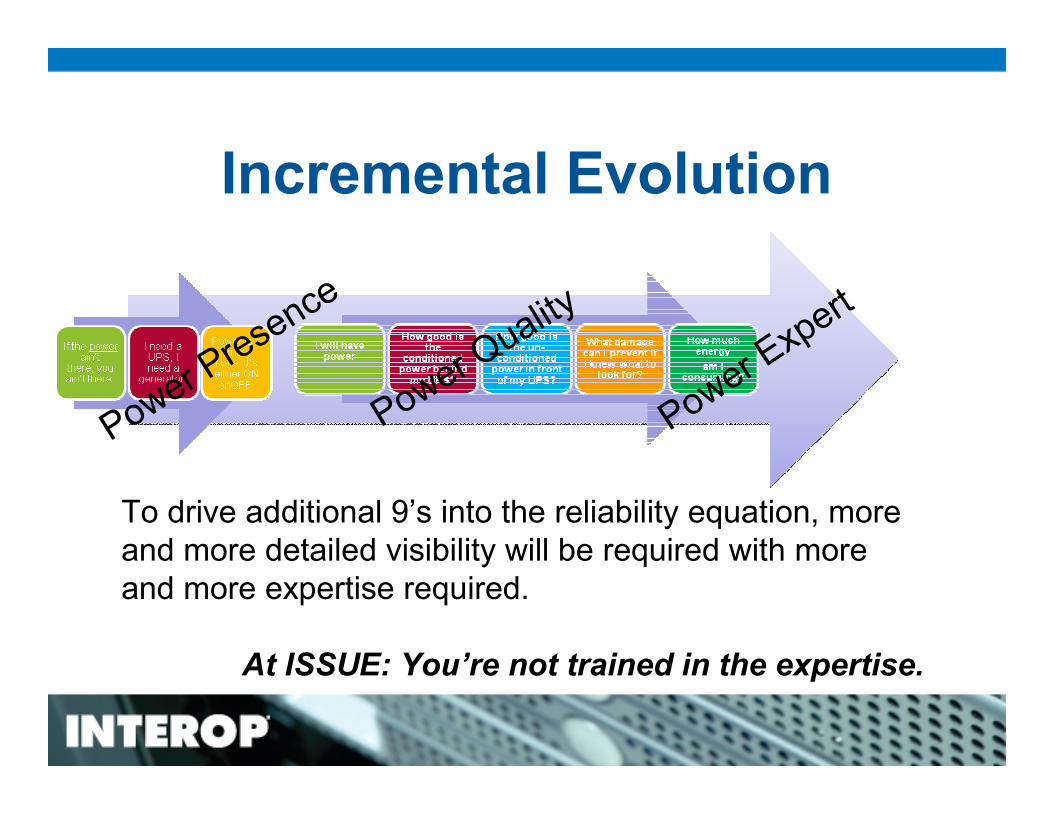
Incremental Evolution
To drive additional 9’s into the reliability equation, more
and more detailed visibility will be required with more
and more expertise required.
At ISSUE: You’re not trained in the expertise.
Power Quality
Power Pre
sence
Power Expert

The “IT Cares” Checklist• Do you have power supply failures?
• Do you have certain machines that hang
inexplicably?
• Do you have fans, compressors, motors,
printers or lighting on or near your UPS-
protected (conditioned power) loads?
• Do you know how good your UPS is?
• Is your company concerned about energy
costs?

Best Practices- MetricsPower Metrics
1. Contribution: power required
by Data Center over the total
power required for the facility.
2. Efficiency: power required by
IT equipment over the total
power required for the Data
Center
3. Productivity: power required
for process over the power
required for the IT equipment
PEData Center = PIT equipment
PData Center
PCData Center = PData Center
PFacility
PPData Center = PProcess
PIT equipment

Measuring power
Anybody seen my clipboard?
or
Wanna spend a bunch o’money on a
proprietary communication system to a
bunch o’meters?
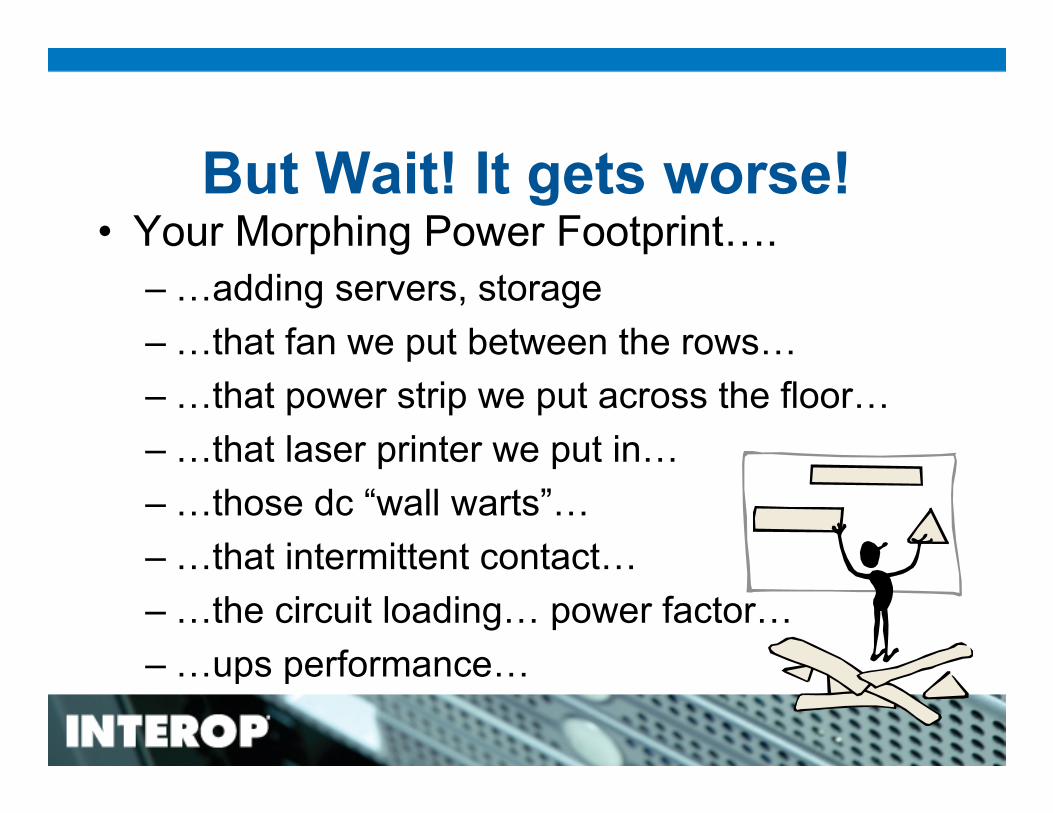
But Wait! It gets worse!• Your Morphing Power Footprint….
– …adding servers, storage
– …that fan we put between the rows…
– …that power strip we put across the floor…
– …that laser printer we put in…
– …those dc “wall warts”…
– …that intermittent contact…
– …the circuit loading… power factor…
– …ups performance…
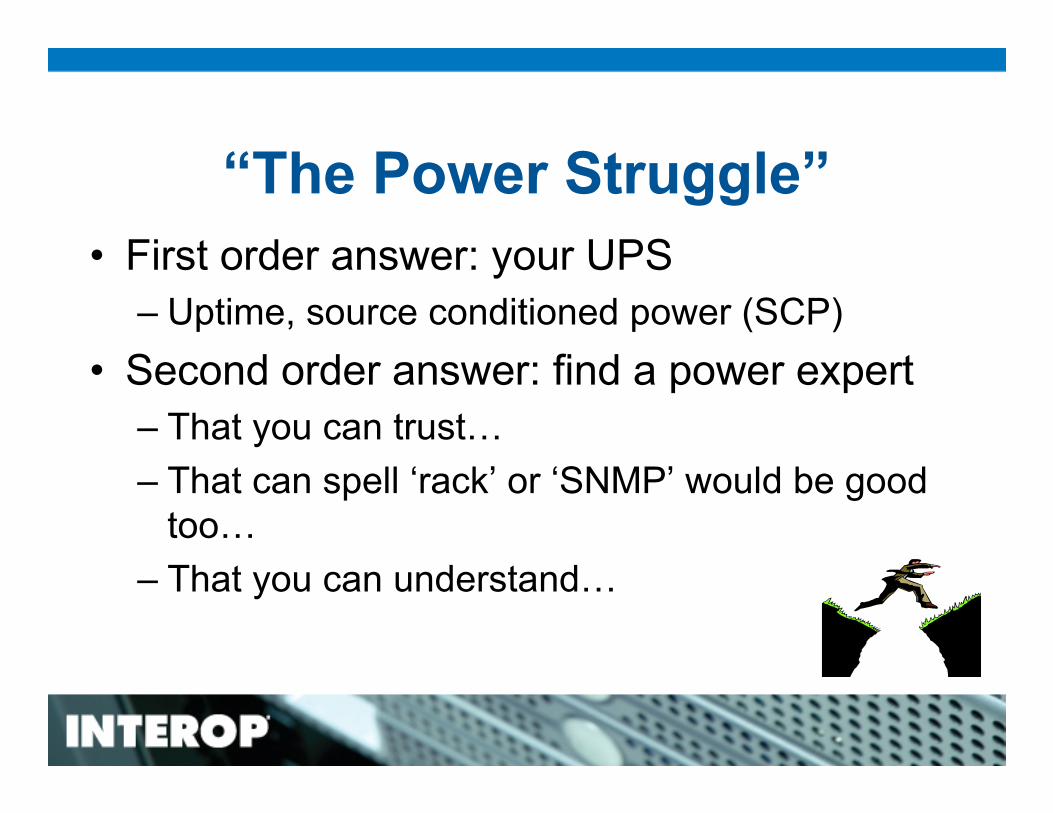
“The Power Struggle”
• First order answer: your UPS
– Uptime, source conditioned power (SCP)
• Second order answer: find a power expert
– That you can trust…
– That can spell ‘rack’ or ‘SNMP’ would be good
too…
– That you can understand…

The Power Expert’s strange
guttural sounds...• TDDI
• THDV
• K Factor, Crest Factor
• Phasors (ok this isn’t
too strange, but for
wrong reasons…)
• Flicker (Perceptibility,
PLT, PST)
• Harmonics
•Voltage, Current THD
• Sags, Swells, dv/dt
• kWh / kW (fwd, rev)
• kVARh / kVAR
• Comtrade wave file format
• Line to Line, Neutral to
Ground Voltage/Current
• Neutral Current, Ground
Current
• Frequency, Symmetric
Voltage (Zero-Sequence,
Pos-Sequence, Neg-
Sequence)
• Power Factor
(Displacement, Apparent)
• Apparent Power, Real
Power, Reactive Power

Insert head explosion here...
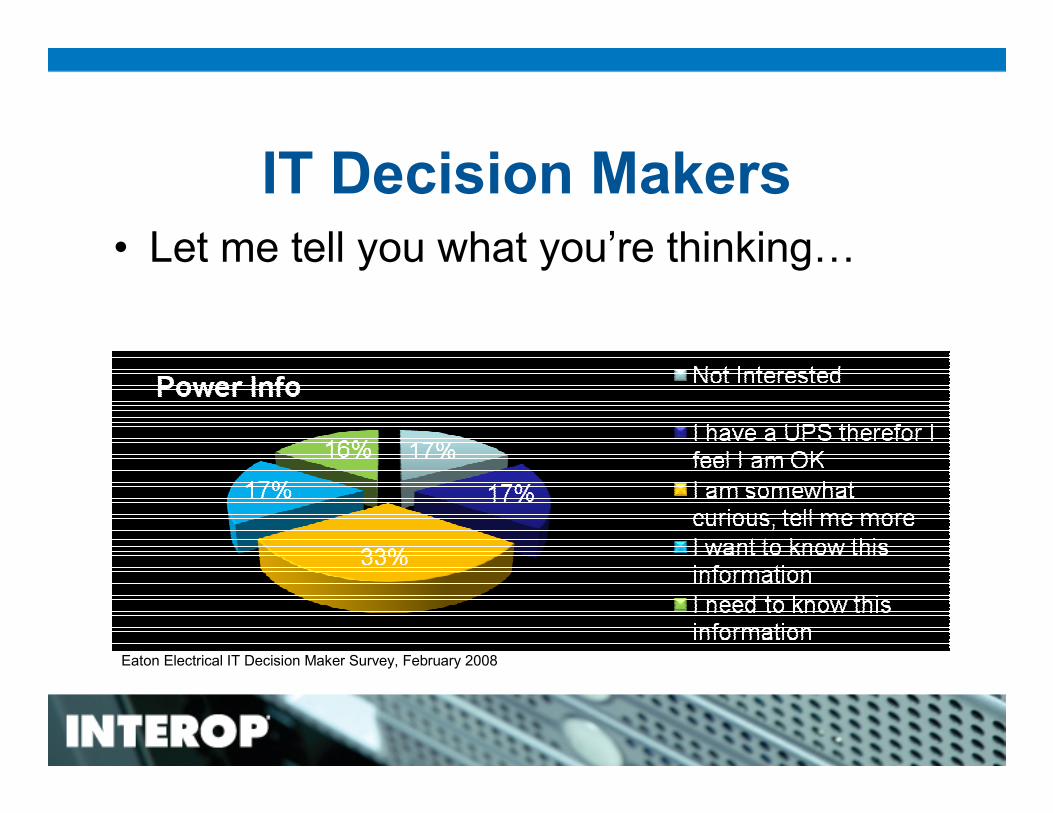
IT Decision Makers• Let me tell you what you’re thinking…
Eaton Electrical IT Decision Maker Survey, February 2008
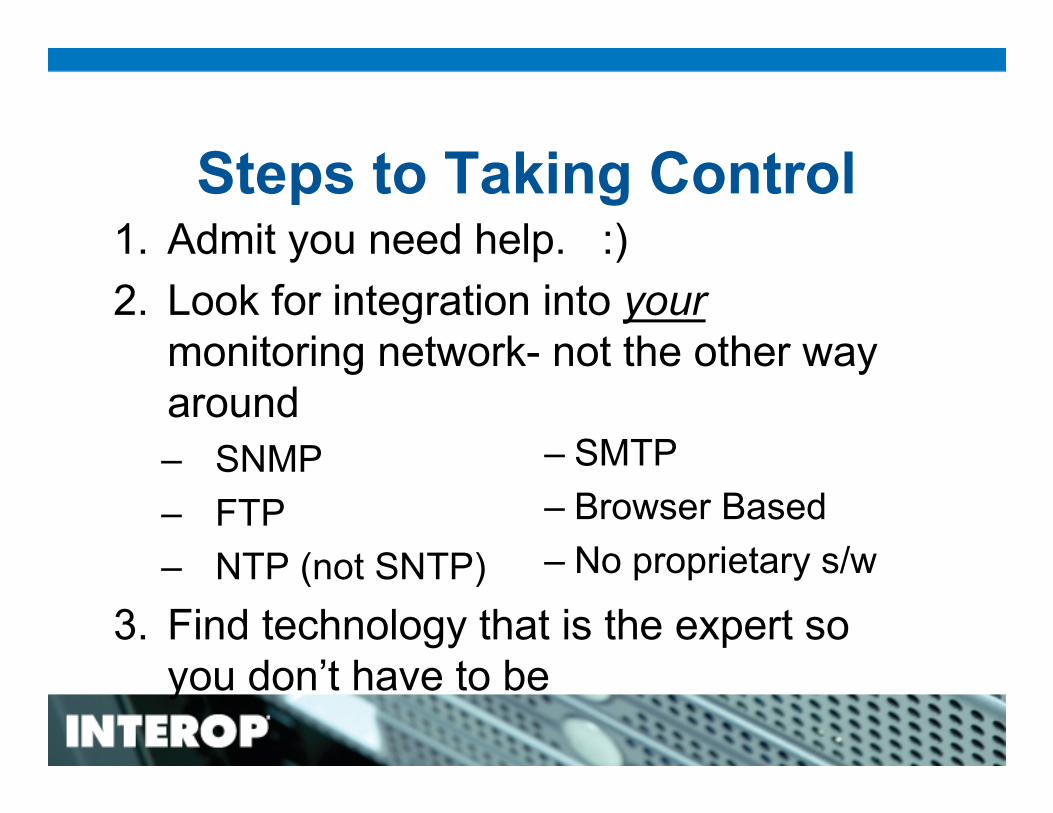
1. Admit you need help. :)
2. Look for integration into your
monitoring network- not the other way
around
– SNMP
– FTP
– NTP (not SNTP)
3. Find technology that is the expert so
you don’t have to be
Steps to Taking Control
– SMTP
– Browser Based
– No proprietary s/w
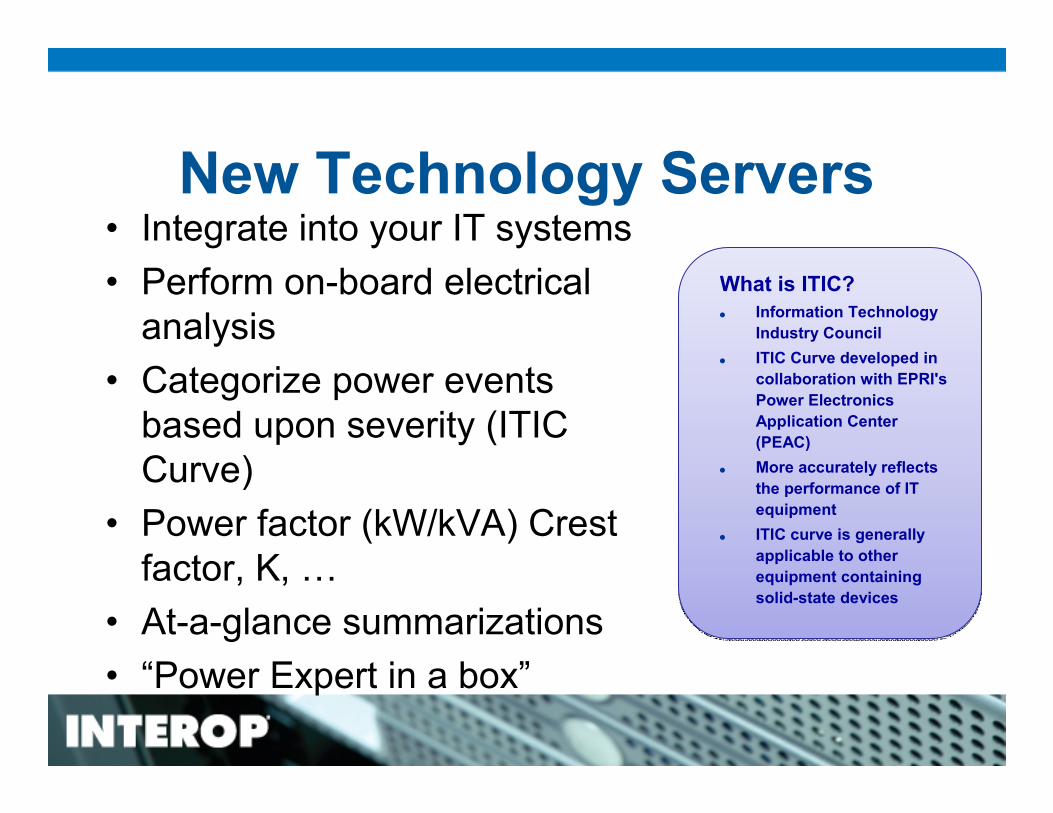
New Technology Servers• Integrate into your IT systems
• Perform on-board electrical
analysis
• Categorize power events
based upon severity (ITIC
Curve)
• Power factor (kW/kVA) Crest
factor, K, …
• At-a-glance summarizations
• “Power Expert in a box”
What is ITIC?
� Information Technology
Industry Council
� ITIC Curve developed in
collaboration with EPRI's
Power Electronics
Application Center
(PEAC)
� More accurately reflects
the performance of IT
equipment
� ITIC curve is generally
applicable to other
equipment containing
solid-state devices

18
The Server

19
The ITIC CurveArea above black line is the Area above black line is the
Equipment Disruption & Equipment Disruption &
Damage Region!Damage Region!
Transients Transients –– silent killers silent killers
equivalent to equivalent to ““high blood high blood
pressurepressure””
L2, L4 and L8 SwellsL2, L4 and L8 Swells
L2, L4 and L8 SagsL2, L4 and L8 Sags
Events occurring within the ITIC curve are deemed ‘safe’ for server power supplies-
anything outside is harmful. Simply clicking on a button shows you the event.
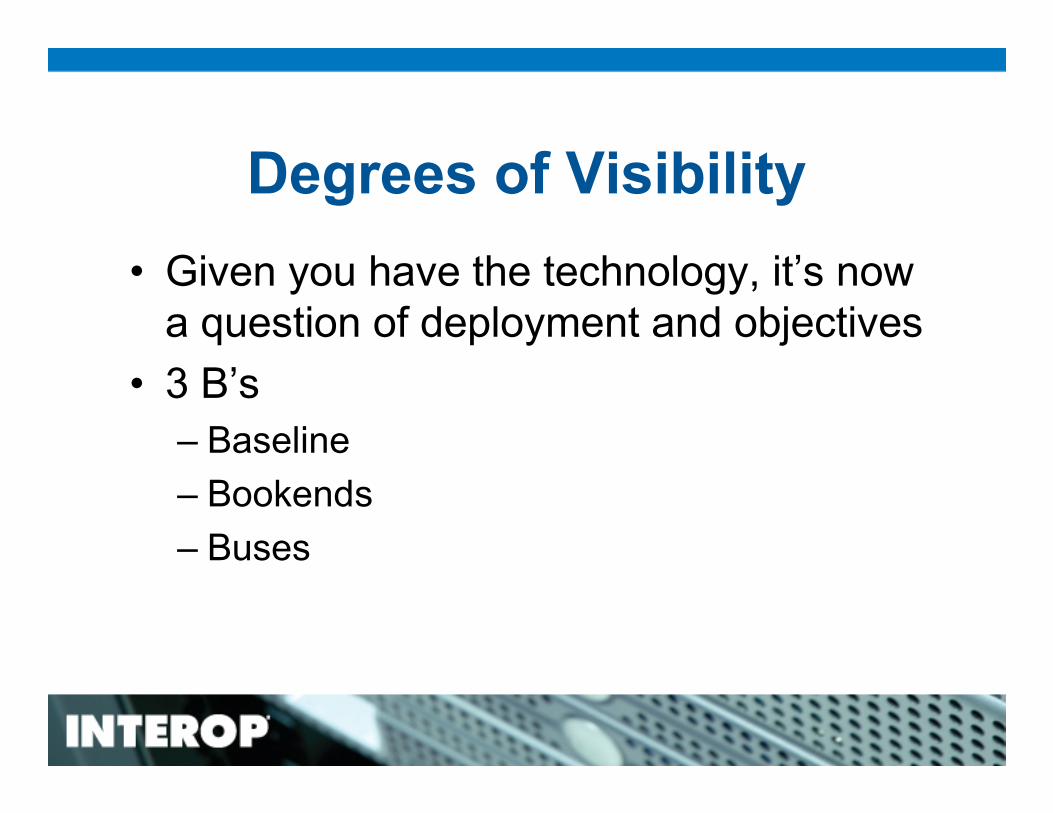
Degrees of Visibility
• Given you have the technology, it’s now
a question of deployment and objectives
• 3 B’s
– Baseline
– Bookends
– Buses

Conditioned/Unconditioned
21
Both conditioned and
unconditioned power
systems suffer electrical
events.
B
B
B
BB
B
Baseline
Bookends
Buses
B

Checklist• Checklist of things to do
– Utility bill- get a copy CC’d to you
– Get a baseline of your energy
– Obtain your power factor
– Measure your power quality
– Move to bookends
– Move to buses
– Sleep better at night**Your results may vary
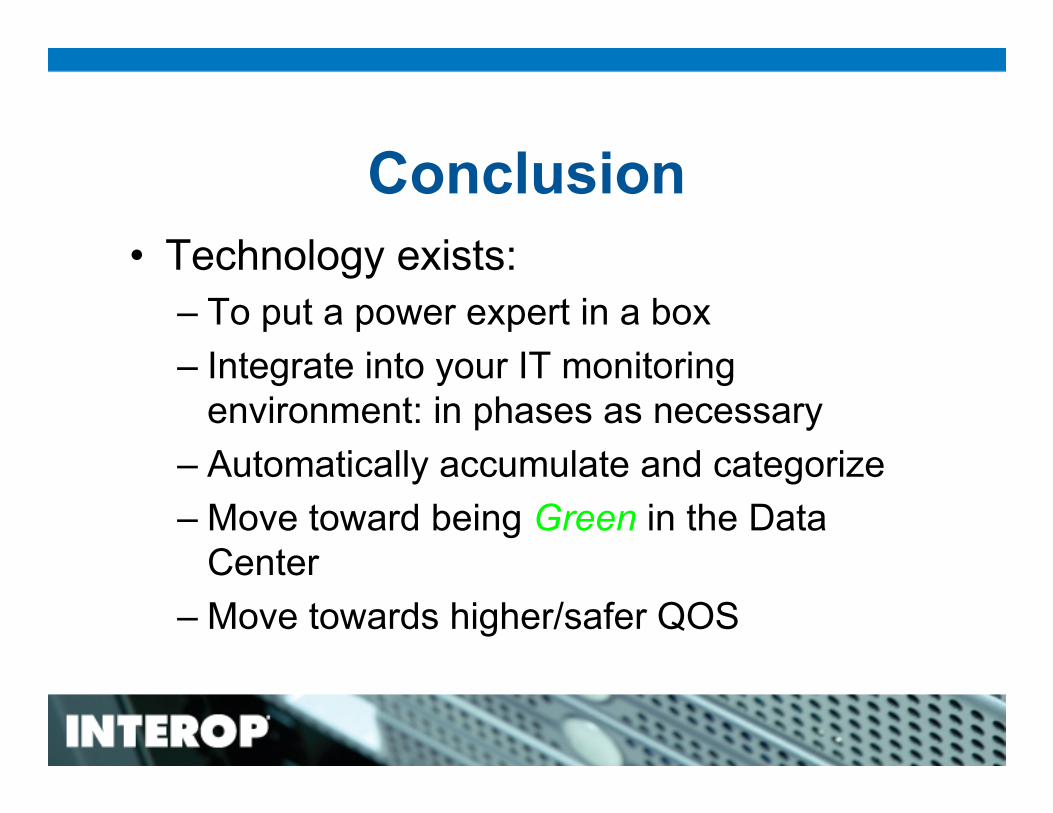
Conclusion
• Technology exists:
– To put a power expert in a box
– Integrate into your IT monitoring
environment: in phases as necessary
– Automatically accumulate and categorize
– Move toward being Green in the Data
Center
– Move towards higher/safer QOS
How to not be a power expert
but act like one.