How Skip-Generation and Other Older Person Household ...
41
1 How Skip-Generation and Other Older Person Household Compositions in sub-Saharan Africa Relate to Material Well-Being Zachary Zimmer (University of California, San Francisco) Suparna Das (University of Utah) Contact information: Zachary Zimmer, Department of Social and Behavioral Sciences, University of California, San Francisco, 3333 California Street, Suite 455, San Francisco, CA 94118. Ph: 415-476-9860. email: [email protected].
Transcript of How Skip-Generation and Other Older Person Household ...

1
How Skip-Generation and Other Older Person Household Compositions in sub-Saharan Africa Relate to Material Well-Being
Zachary Zimmer (University of California, San Francisco)
Suparna Das (University of Utah)
Contact information: Zachary Zimmer, Department of Social and Behavioral Sciences, University of California, San Francisco, 3333 California Street, Suite 455, San Francisco, CA 94118. Ph: 415-476-9860. email: [email protected].

2
ABSTRACT: Demographic realities mean skip-generation households are common and increasing in sub-Saharan Africa. We test how this household type fares in comparison to four other types. Skip-generation older person households are hypothesized to do particularly poorly in countries with high AIDS mortality. Data come from recent Demographic and Health Surveys. Material well-being is operationalized using a durable wealth score (DWS). Results indicate older person only households have the lowest average DWS followed by skip-generation. Households containing adult children are best off. Tests that descriptively connect material well-being of skip-generation households across countries fail to confirm a robust link between DWS and level of AIDS mortality. Older persons may benefit materially when a grandchild moves in following an AIDS death in the family by increased support of other family members or support from grandchildren themselves. Older person households with absent adult children are at a disadvantage regardless of the reason for absence.

3
This manuscript presents the relationship, across sub-Saharan African countries, between
several types of household compositions of older adults - a characteristic that is an important
indicator of access to support - and the material well-being of households within which older
persons live (Bongaarts and Zimmer 2002; Davis et al. 1997). The relationship is important due
to a combination of unique challenges facing older persons in the region. Across all developing
countries, older persons are at risk of living in poverty and as a result are susceptible to
experiencing low levels of well-being across many dimensions, such as material, physical and
emotional (Barrientos, Gorman and Heslop 2003; Gupta, Pattillo and Wagh 2009; Lloyd-
Sherlock 2000). The probability of living in poverty in sub-Saharan Africa is particularly high
and risks of old-age poverty are extreme (Adeyemi, Ijaiya and Raheem 2009; Barrett, Carter and
Little 2006; Collier 2007; Ezeh et al. 2006; Kakwani and Subbarao 2007). Understanding
determinants of material well-being among elders in the region is thus an important step towards
reduction in poverty and improvement in overall well-being.
But, older persons in the region face additional obstacles that may make them even more
vulnerability to low quality of life in comparison to others. More than those at other ages, they
are at risk of physical functioning limitations and non-communicative chronic diseases. This
results in a subsequent need for physical and material support; assistance that has, within the sub-
Saharan African culture, been traditionally provided by adult children and other family members
(Aboderin 2006; Adamchak et al. 1991). But, an HIV/AIDS epidemic that is resulting in high
mortality within families, labor migration, and modest reductions in fertility may be reducing
availability of adult children, who are the traditional providers of old-age support. Indeed,
households containing older persons and their grandchildren in a skip-generation situation, which
is defined as a household containing one or more older person and at least one of their

4
grandchildren 15 or younger but none of their own children aged 16 and older, are on the rise
and the trend is likely to continue (Apt 2007). The HIV/AIDS epidemic itself has been
implicated as a major force leading to increased numbers of skip-generation households in high
AIDS-mortality countries (Kakwani and Subbarao 2007; Kautz et al. 2010; Zimmer 2009).
Consequently, for many older adults, the time of life when they are most in need of support may
also be a time when they are required to contribute to the care of youngsters while they may or
may not be getting material support from their own adult children or other family members.
Despite these challenges and the dynamic nature of household composition in the region, older
persons in sub-Saharan Africa remain somewhat of a ‘black box’. Certainly, very little is known
regarding whether, and to what extent, their well-being is a function of household composition.
AGING, HOUSEHOLD COMPOSITION AND VULNERABILITY
Population aging, defined as a growth in the number and proportion of older people
within a population, is taking place throughout the developing world. As an ongoing process, it
is occurring more rapidly in developing than developed countries (Kinsella and Phillips 2005;
United Nations 2007). For instance, those 60 and older constituted about 22% of the population
of the world’s more developed regions in 2010, and this will increase to about 31% by 2040
according to United Nations medium variant estimations. At the same time, about 9% of the
population in the world’s less developed regions was aged 60 and older, but this will almost
double to 17% over the same time period (United Nations 2009). Thus, while populations in the
more developed world will, for some time, consist of a larger percent of older persons, growth in
the aged population is much higher in the developing world (Velkoff and Kowal 2006).
5
While it is not often thought of as an aging region, sub-Saharan Africa is part of this
global process. Its 60 and older population is increasing at an astounding rate of 3.2% annually –
a rate at which doubling occurs in only about 20 years - and will increase from approximately 43
million persons in 2010 to over 110 million by 2040. As a comparison, the global population is
growing at a rate of about 1% annually; a rate at which doubling takes about 70 years.
Population aging results in challenges for the developing world. These tend to be
overwhelming in the poorest countries that do not have the resources available to support an
overhaul in population age structure. Health care systems, as one example, which in younger
aged countries tend to be geared toward children and maternal health, need to be restructured to
additionally deal with non-communicative chronic diseases common among the aged.
Furthermore, these poorest of countries cannot provide public forms of social security available
to those in other parts of the world. As some put it, they are growing old before rich, in contrast
to developed countries that were already rich before old (Long and Pfau 2009). This is the case
in Sub-Saharan Africa where normative systems of material well-being revolve around the
family, particularly adult children, who traditionally provide caretaking and material support for
their aging parents (Aboderin 2006; Apt 1992).
Additional phenomena are working in tandem to decrease the propensity of older persons
to be supported by their adult children (Kakwani and Subbarao 2005; Kakwani and Subbarao
2007). Many families suffer from severe poverty, and some evidence suggests rates are
increasing (Collier 2007). As a result, the traditional family orientated social security safety net
is becoming increasingly unreliable. At the same time, the AIDS epidemic in much of the sub-
continent is resulting in heightened death rates for working aged adults. As such, the epidemic is
6
taking away, through mortality, substantial numbers of those who are the traditional caretakers of
older persons.
The epidemic may also have ways of increasing the cost burden among older persons and
hence households containing an older adult. There is the loss of income from working aged
adult children that die, the bearing of costs for the caretaking of those that are ill, costs for their
subsequent funerals, and expenditures associated with caretaking of grandchildren left behind
(Adeyemi, Ijaiya and Raheem 2009; Clark 2006; Knodel, Watkins and VanLandingham 2003).
Older persons may find the need to sell durable goods or borrow money and go into debt in order
to pay for costs associated with an adult child’s AIDS illness and subsequent death.
Additionally, the HIV virus often runs through a family, and subsequently AIDS tends to kill
both an adult child and their spouse, leaving behind a ‘double orphan’ who often ends up living
in an older adult household (Zimmer 2009).
Another impact on the material well-being of older persons is the movement of working
aged adults in search of labor. Labor-based migration can increase the numbers of skip-
generation households and put burdens on elders to become household breadwinners and
caretakers for grandchildren left behind (Hosegood and Timaeus 2006; Kakwani and Subbarao
2007; Zimmer 2009). But, migration can also have positive impacts in the form of remittances
from children living elsewhere (Gupta, Pattillo and Wagh 2009; Isiugo-Abanihe 2002;
Madhavan 2004).
It is clear that both household composition and material well-being among older persons
in sub-Saharan Africa need to be examined within specific contexts that include population aging
and factors that make older persons in the region vulnerable to material support losses.
Generally, a household containing an older adult living with one or more adult child is common,
7
normative and expected in the region (Aboderin 2006; Bongaarts and Zimmer 2002). But, AIDS
deaths result in a higher proportion of skip-generation households, particularly within high HIV
prevalence countries (Kautz et al. 2010; Madhavan and Schatz 2007; Ntozi and Nakayiwa 1999;
Zimmer 2009). Another possible household composition that may occur frequently with
increasing AIDS deaths is older persons living alone, with spouse only, or with other older
persons (Kakwani and Subbarao 2005). Additionally, while living alone is not common within
the sub-Saharan African context, skip-generation households are; even in countries with low
HIV prevalence (Zimmer and Dayton 2005). Leaving a child behind to be fostered by
grandparents while parents are absent working elsewhere is simply a normative part of life in
sub-Saharan Africa.
Research Questions
While research has shown that the AIDS epidemic can change household composition for
older persons in sub-Saharan Africa, the question of whether this change has a substantial impact
on material well-being has not been addressed (Kautz et al. 2010). Nonetheless, some studies
provide expectations. Kakwani and Subbarao (2007) show, using data from 1996 to 2000, that
the chance of a household being in poverty is higher when there is an older adult present. They
find the chance is particularly extreme for households containing an older adult in Malawi and
Zambia, countries with high HIV prevalence. They also show elevated rates of poverty in
households containing older persons and younger children. According to the authors, the finding
“confirms a generally held impression that poverty among older persons is intensified when they
become caregivers for children” (Kakwani and Subbarao 2007).
8
Others have noted that an AIDS death may have an impact on material well-being within
older adult households through decreasing the income that comes in from adult children and
increasing household expenses needed to support grandchildren (Adeyemi, Ijaiya and Raheem
2009; Hosegood and Timaeus 2006; Knodel and Im-em 2004; Oppong 2006; World Health
Organization 2002). In contrast, Gupta, Patillo and Wagh (2009) shows that remittances from
adult children can have a substantial impact on the reduction of poverty in the region, suggesting
that skip-generation households may benefit materially from their adult children’s absence if the
reason for the absence is migration rather than mortality. The proportion of skip-generation
households that are due to migration should be high in low HIV prevalence countries, while the
proportion due to mortality high in high HIV prevalence countries.
Thus, while it is fairly certain that demographic realities are resulting in increasing
numbers of skip-generation households, it is unclear how this relates to the loss of material well-
being. Using comparable data across 13 countries that took part in the Demographic Health
Survey (DHS) between 2006 and 2008, we ask: (1) Do households described as skip-generation
older adult households score lower with respect to material well-being than other types of older
adult households? (2) Does the link between the skip-generation household and material well-
being vary across countries depending upon the robustness of the AIDS epidemic within the
country? While older adults living alone may also be disadvantageous, with this exception, and
based on the discussion thus far, we hypothesize yes to both of these questions.
DATA
Data come from DHSs conducted in 13 sub-Saharan African countries over the period 2006 to
2008. The DHS program involves representative probability sample surveys of households and
9
household members in developing countries, organized and implemented by OCR Macro
International in collaboration with within country statistical organizations. The purpose is to
obtain information on a variety of demographic and health variables, such as household member
characteristics, socioeconomic status and wealth, fertility practices, nutrition, maternal and child
health and other information needed for demographic analyses and policy. The DHS has been
implemented in 89 countries worldwide since the mid 1980s (Measure DHS 2011).
The DHS consists of several sections, including a household component that charts
household composition using a question about relationship of each member to the household
head as well as their age, sex, marital status and a few other key demographic characteristics.
From this, it can be determined whether a household contains one or more older persons, which
for this study is defined as age 60+, and whether there is one or more offspring, grandchild,
spouse or other person, relative or non-relative, of any of these older persons also in the
household. A selected list of country and sample characteristics of interest are provided in Table
1. The table also shows the average of these characteristics and, where appropriate, the sum
across countries. The countries represent a range of population size and national wealth. Nigeria
is by far the most populous. Based on Gross National Income (GNI) statistics obtained from the
Population Reference Bureau (2007; Population Reference Bureau 2008; Population Reference
Bureau 2009), Namibians are the wealthiest on average and Liberians the poorest. Most of the
other countries are quite poor with GNI’s in the 1,000 to 2,000 range. In total, a pooled sample
across countries includes almost 35,000 households containing at least one older adult. There are
over 147,000 household combined across the 13 DHSs, meaning that about 1 in 4 households
contains an older adult. In total, these 13 countries constitute about 40% of the region’s total
population.

10
Table 1 about here
Weights are included with the DHS data, which are used to assure that the sample is
representative of households within each country. Since data are pooled across countries, and
sampling fractions for households are different for each country, this weight is adjusted so that
the pooled sample is representative of households across the 13 countries. That is, the adjusted
weight is one that assumes that the roughly 147,000 households selected for observation were
based on a random sample that began with a sample frame consisting of all households across the
13 countries. These weights are used in the analysis.
CONSTRUCTING DURABLE WEALTH SCORES
The concept of material well-being in this study is operationalized using a Durable
Wealth Score (DWS). This DWS is consistent with the DHS Wealth Index, a measure that is
often employed to assess the affluence or living standard of a household relative to other
households in the same survey in the absence of detailed information on income, the value of
owned resources or consumption expenditures (Rutstein and Johnson 2004). A fundamental
characteristic of the index is its relativeness, a feature that gives it predictive power valuable for
hypothesis testing, particularly when other measures of income are not collected, which is often
the case across the poorest of global settings (Montgomery et al. 2000). The DHS Wealth Index
itself has been used in many household survey-based analyses due to other advantageous
qualities including the ease of obtaining the information necessary for its construction, its
reliability, and its internal and criterion validity as a proxy for affluence or standard of living
(Filmer and Prichette 2001; Montgomery and Hewett 2005). For the current analysis, it is the
ideal outcome measure since durable wealth is synonymous with the concept of material well-

11
being. This is because higher durable wealth scores, as will be seen below, translate directly into
more assets and more valuable assets existing within households, thus more and more valuable
material goods. Furthermore, it is the only measure related to household material wealth that is
available and comparable across such a broad set of sub-Saharan African countries.
The index is constructed as a linear computation involving the sum of weighted scores
assigned to the ownership of specific household assets, with the weight of each asset assigned by
Principal Component factor scores. The types of assets that are commonly recorded in the DHS
are things like radios, televisions, refrigerators, bicycles, motor vehicles, and so on. The
information collected on specific items differs across DHS countries. For this study, all assets
available in a specific country’s DHS survey were used to create a DWS for that country. This
means that the specific items that are used to determine a score differ for different countries. A
list of the assets by country is shown in part A of Appendix I under the heading ‘Durable items’.
A score was determined for each household in the 13 DHSs regardless of whether the
household contained an older adult. As is customary when using this index, the resultant scores
were standardized across countries and, in this case, also across rural and urban areas, to have a
low of 0, a high of 100, and a mean of 50 within each country and rural or urban area. If
households with older persons were on average the same with respect to material well-being as
other households, then the sub-sample of older adult households within each country and area
would also have a mean of 50. As it happens, older adult households are among the poorest. To
illustrate this, Table 2 displays the mean DWSs for the over 147,000 households in the sample by
household age composition. Households containing only one or more older adult have a mean
DWS of just 32.7 across the countries. In contrast, households containing only one or more
working age adult have a mean DWS of 52.0, while households containing one or more working

12
age adult and one or more child has a mean DWS of 52.9. These results substantiate Kakwani
and Subbarao (2007) since older adult households in sub-Saharan Africa are shown to have the
lowest material well-being.
Table 2 about here
Levels of actual material well-being differ across countries. Because income in Namibia
is substantially greater than income in Liberia, pooling data from these countries would result in
scores being primarily on the upper end in the former and the lower end in the latter. This can
result in cross-country biases when associating household composition with the DWS. Also,
because the specific items used in each country differ, the meaning of a score is different for
each country. It is for this reason that scores are standardized for each country, and as such, each
country’s index is a relative-to-country latent conception of material well-being. It is for similar
that reasons wealth scores are standardized for rural and urban areas. Poor urban households
may contain a few assets even if they are located in a slum area of the city, perhaps due to the
availability of electricity. A household in a rural area with the same assets may be considered
well off in comparison. Combining rural and urban would impair the relative nature of the
index.
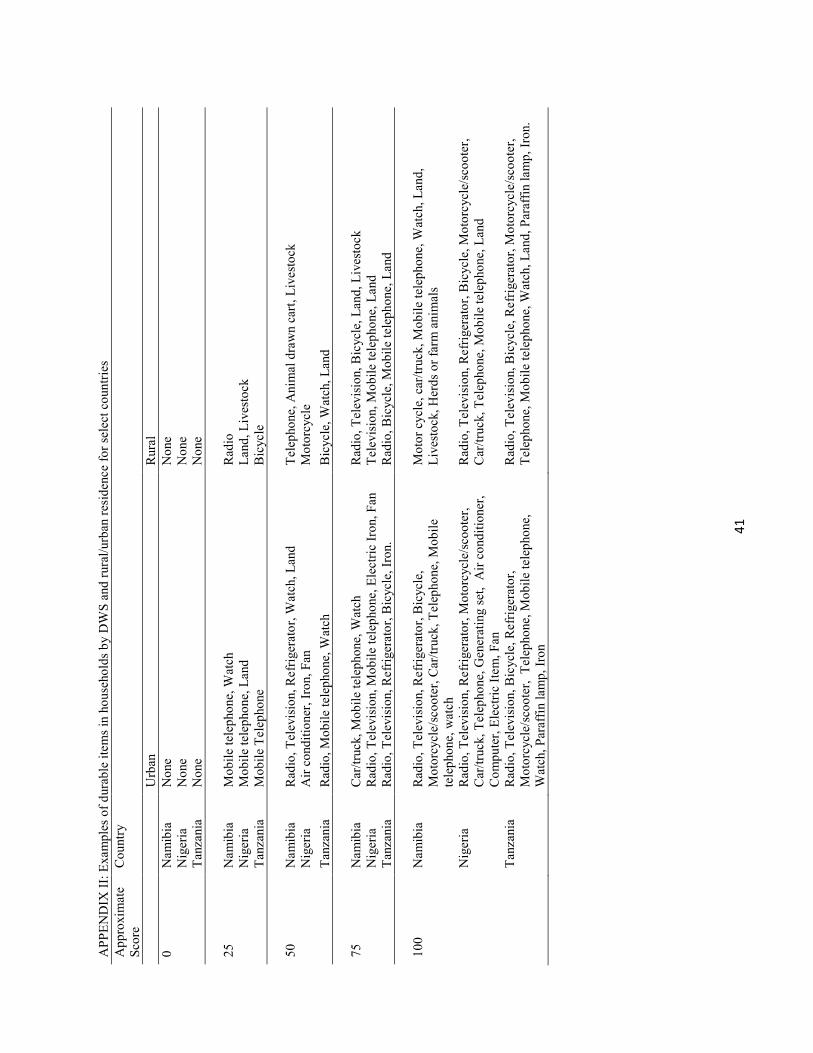
In order to provide some intuitive sense of what a particular score means, Appendix II
shows the actual assets that exist in a real set of randomly selected households with DWSs of
about 0, 25, 50, 75 and 100 in rural and urban areas in three countries. The Appendix table
demonstrates how a higher score translates into a greater number and value of assets while the
same score relates to the ownership of different numbers and types of items across rural and
urban areas in the same country and across countries.
13
The difference between the DWS used in this study and the standard DHS Wealth Index
is that the latter includes not only durable goods but items such as availability and source of
drinking water, materials from which a house is constructed and the existence and type of toilet
facility used by the household, as part of the scale construction. These can be considered as non-
liquid or fixed assets and are indicators of affluence that are not readily bought and sold. For
reasons described in detail below, the current analysis uses fixed wealth as a predictor of durable
wealth rather than as part of the index.
DEFINING HOUSEHOLD COMPOSITION
Definitions of older adult living arrangements normally revolve around the existence or
non-existence of spouses, children and grandchildren in the household (De Vos 2004). This
study constructs a five category measure for household composition that is consistent with this
notion. (1) Older adult households: These contain only older persons, or only older persons plus
their spouses, regardless of the age of the spouse. In all but a small percentage of cases, this
means an older adult living alone or with spouse only. (2) Skip-generation households: These
contain one or a greater number of older persons and one or more of their grandchildren but no
offspring of the older persons are in the household. About half of these households are pure
skip-generation in that there are no others in the household except for older persons and their
grandchildren, and the other half contains other members, such as other relatives. (3) Adult child
households: These contain one or more older persons and at least one of their own adult children
but no grandchildren. (4) Three-generation households: These contain at least one older adult
living with a grandchild and an own child. (5) Other: The last category contains older persons
living with other family or non-family members besides spouse, children and grandchildren.

14
In order to be considered as living with a grandchild, the grandchild must be 15 or
younger. In order to be considered living with an adult child, the child must be older than 15.
The purpose of this age criteria is to isolate the impact of living with grandchildren to those that
are not old enough to be considered head of household. There are in fact virtually no cases
where a grandchild or adult child 15 or under is listed as head of household. Therefore, the term
‘adult children’ means, in all cases that the household in question contains an older adult and one
of their children that is at least 16 years of age, and the term ‘skip-generation’ means in all cases
that the household in question contains an older adult and one of their grandchildren under 16
years of age. Grandchildren over 15 and children under 15, though relatively rare, are placed
into the ‘other’ category.
More than two-thirds of all of the roughly 35,000 households in these data contain six or
fewer persons, only one in 10 contain more than 10 persons, the mean household size is 5.5 and
the median is 5. So, while the majority of households are not complex, there are also a fair
number of complex households containing several families. If analyzed on a family or
individual level, these complex households could contain more than one category as defined
above. We are unable, due to the nature of the data, to analyze on a family level. Therefore,
some classification decisions for complex households are necessary. If there is at least one three-
generation family in the household then it is considered a three-generation household. If no
three-generation families exist, but an adult child of at least one older adult is present, then the
classification is an adult child household. Households can only be classified as skip-generation
if none of the older persons in the household has an adult child present.
There are also consistency problems in defining a household across countries and within
countries across cultural, geographic and political boundaries. The DHS attempts to be as
15
consistent as possible, defining a household for all countries as ‘a group of people that usually
lies and eats together,’ with the prevision that if people eat in one household and sleep in
another, they are considered to be a member of the household wherein they sleep (ORC Macro
2006).
RESULTS
Distributions for Household Composition
Table 3 shows the distribution of household composition within each country. Countries
are arranged from top to bottom according to their CCDR. The bottom two rows are summary
measures. One is the average distribution for the 13 countries. The other is the pooled sample
distribution, weighted to be representative of the population of households in the 13 countries.
Looking at the summary measures, the most common household composition is the three-
generation.
Table 3 about here
The three-generation is most frequent composition in 11 of the 13 countries. There is
variation in the distribution of household composition across countries. For instance, the percent
of households categorized as older adult ranges from a low of 8.5 percent in Niger to a high of
25.8 percent in Nigeria, while skip-generation ranges from a low of 10.6 percent in Mali to a
high of 27.5 percent in Zimbabwe. The percent of skip-generation households are most
obviously associated with CCDR. It is a common household composition, representing about
one in four older person households, in the four highest CCDR countries. In these four
countries, skip-generation households are more common than adult child households. In low
CCDR countries skip-generation households are much less common and adult child households

16
much more so. Niger and Liberia, low CCDR countries, have very high percentages of three-
generation households. Although it has minimal variation, the other household composition is
somewhat more common in low CCDR countries.
The Association between Household Composition and DWS
Table 4 displays the results of Ordinary Least Squares regressions that predict DWS.
Model 1 shows whether there are any differences across countries. Since DWSs are standardized
across countries and rural/urban areas, there is indeed very little variation remaining to be
explained. The r-square for model 1 is only .002.
Table 4 about here
Model 2 adds household composition. The r-square increases to explain 6.3% of the
variation in DWS. All compositions are significantly different from the three-generation
household, which is the most favorable. Adult child households do not however differ much and
also offer a relatively favorable situation for older persons. The other household composition
scores about eight points lower than the three-generation. The skip-generation household
composition scores between 13 and 14 points lower, and the older adult household composition,
which is the least favorable, is more than 18 points lower than the three-generation.
Additional controls that are available and important in determining household material
well-being are added in Model 3. These include the following: (1) Whether or not one or more of
the older persons in the household lives with a spouse. This is particularly important to account
for since one of the household composition categories is the older adult only composition. But,
this could mean an older adult living alone or with a spouse, and living with a spouse is
favorable for this category as well as for others. (2) Age of the oldest household member. (3)

17
Whether the older persons in the household are female versus being male or there being a
combination of male and female older persons. (4) Household size. This is particularly
important to account for since the categorization of household composition does not indicate
whether the household is large and/or complex. For instance, skip-generation households
include those that contain a number of other relatives plus those that only contain an older adult
and a grandchild. The measure used is a residual household size which is calculated as the total
number of household members minus one if there is an older person’s spouse present, minus one
if there is an older person’s adult child present, minus all persons under age 16. The reason for a
residual rather than a total household size is that, first, the spouse and child are already accounted
for in other variables and should not be double counted, and second, more adults in a household
will bring more durable wealth, but such is not necessarily the case for younger persons. (5)
Whether any older person in the household has formal education. (6) Whether the head of the
household is a female. (7) Whether the head of the household is an older person.
The last control variable is (8) fixed wealth. This is constructed in a similar fashion as
the DWS, but with country specific non-liquid items available with each country’s own DHS.
These are listed in part B of Appendix II under the heading ‘Fixed items’. The inclusion of a
fixed wealth score when predicting durable wealth using cross-sectional data is suggested by
Linnemayr (2005), who noted that while causality cannot be assured given cross-sectional data,
one is in a better position to conjecture that a difference in wealth across household composition,
when controlling for fixed wealth, is a function of the household composition. This is because if
an older adult finds they need extra money, for example, for the caretaking of a grandchild when
own children are absent, they may cease to purchase or sell durable items, but they are unlikely
to move residences. In fact, fixed wealth is a good measure of long-term material well-being.
18
Therefore, change in household composition is more likely to impact on the DWS while not
impacting on fixed wealth.
In Model 3 the effect of household composition on DWS is reduced, but not to the extent
that composition becomes unimportant. Older adult households remain worse off, scoring about
10 points lower than the three-generation. Skip-generation households are also not favorable,
being on average seven points lower after controls are added. Clearly, households that contain
an adult child, whether with or without grandchildren, are most favorable.
Other covariates prove to be significant and important predictors of DWS. When adding
them, the r-square increases to explain over 38% of the variation. The presence of a spouse of an
older person, older persons being female, household size, older persons having education and
fixed wealth are all positively associated with DWS. Age of the oldest household member,
having a female and an older person household head are negatively associated. These results
suggest that older persons living alone would have very low DWSs. The presence of a spouse
adds over three points to the score, while each additional adult household member adds almost 2
points. The impact of fixed wealth is particularly robust. Each point on the fixed wealth index,
which is structured in the same fashion as the DWS, adds 0.5 points. For instance, a household
with a fixed wealth score of 50, which would represent the country by region average, would
score 10 points better on the DWS than a household with a fixed wealth score of 30.
It may be surprising that if older persons in the household are female as opposed to male
or both male and female, it results in a higher DWS. There are two possible reasons for this.
The first is that the impact of sex is mostly felt if the female is the head of household. Second,
there is some evidence that older women in Africa and other developing countries are treated
with greater respect than are older men due to a concept that has been called the ‘patriarchal
19
bargain,’ whereby offspring feel closer emotionally to their mothers than their fathers due to the
time and bond that is formed between child and mother when children are young (Kandiyoti
1988; Yount 2005). For this reason, offspring may better support their older mothers than their
older fathers.
The associations with country dummy variables remain small. Older persons in Namibia,
on average, live in households with higher DWSs than those in other countries. Namibia’s
higher scores are likely a function of better developed social security programs for older persons,
which may itself be a function of its relatively high economic standing as measured as GNI per
capita (Barbone and Sanchez 1999; Frayne 2004). It is difficult to say why other countries
would have higher or lower DWSs, although it is the case that country effects remain relatively
unimportant compared to household composition and other covariates.
Predicting Specific DWSs by Household Composition and Country
A last model which is not shown added country by household composition interactions.
The interactions increase the r-square from Model 3 by only .002. Therefore, we can conclude
that DWS by household composition is fairly consistent across countries. To show this, we used
the coefficients from the interaction model to calculate predicted DWSs. In doing so, all control
variables were set at their country by household composition mean values. For instance, the
predicted DWS for skip-generation households in Zimbabwe multiplied coefficients for control
variables by the mean for that variable among skip-generation households in Zimbabwe. These
products were summed, added to the constant then added to the main and interaction effects for
country and household composition. This provides us with an estimate of DWS for each country
by household composition that is very close to the observed raw data means.

20
Figure 1 shows the results. The X-axis indicates household composition arranged from
the predicted lowest to highest DWS based on the OLS regression model. High CCDR countries
are plotted as solid lines and low CCDR countries are plotted as dotted lines. Country indicator
names are placed on the graph near to the end of their prediction line, with high CCDR countries
on the left and low CCDR countries on the right. The graph illustrates an almost a linear
increase in DWS when moving across household compositions, with some flattening between the
adult child and three-generation household type. There appears to be very little slope variation
and thus, the association between household compositions is remarkably consistent across all 13
countries. Note also that Namibia appears as an outlier in the older adult only household, likely
a function of the social security policies mentioned above (Barbone and Sanchez 1999; Frayne
2004).
Figure 1 about here
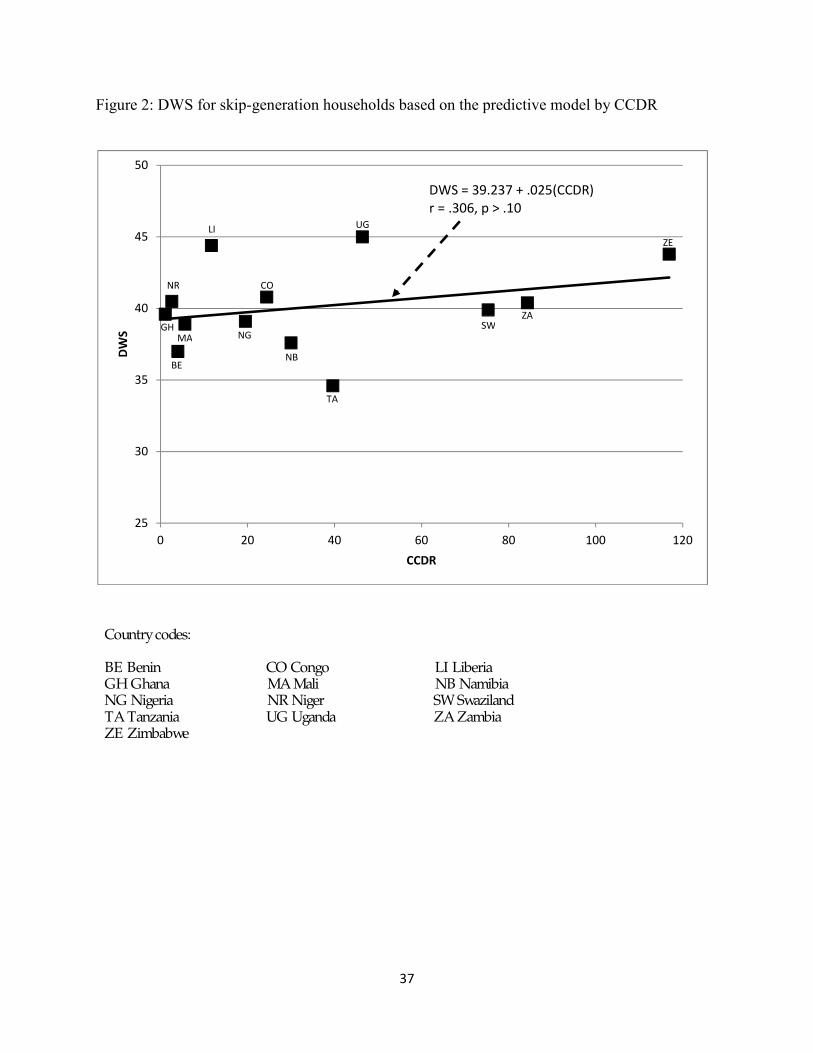
Figure 2 is a scatterplot that is presented to provide a closer look at the specific DWSs for
skip-generation households across countries with different levels of AIDS mortality. CCDRs are
shown along the X-axis and DWSs along the Y-axis. Also shown is the linear equation, the
linear trendline predicting DWS and Pearson’s r. The hypothesis that skip-generation
households fare worse in high AIDS-mortality is not supported by this figure. In fact, although
the association is not significant, as indicated by r, the association is positive. An increase of 1
point in the CCDR is predicted to increase the DWS by .025. Two of the highest AIDS-
mortality countries, Uganda and Zimbabwe, have amongst the highest DWS for skip-generation
households. The correlation is non-significant according to Pearson’s r, and is modestly robust
at +0.306
Figure 2 about here
21
Is there an Indirect Association?
While the skip-generation household is not conforming to the hypothesized direction
when examined in the context of AIDS mortality, it is still possible that there is an indirect
association between AIDS mortality and material wealth operating through household
composition. This is because high CCDR associates with a greater proportion of skip-generation
households, as seen in Table 3. In turn, skip-generation households have relatively low DWSs in
comparison to households with adult children. Therefore, the distribution of household
composition may be a factor pushing down material well-being for older persons in high AIDS
mortality countries.
We tested this using a standardization procedure that involved calculating two DWSs for
each country. The first is the predicted DWS shown in Figure 1. The second is a DWS
predicted using a standardized household composition distribution. The standard was the
average across all countries shown in Table 3. In the highest AIDS mortality countries, the
standard household composition distribution will have a smaller proportion of skip-generation
households than has the country itself. Fewer skip-generation households result in higher DWSs.
The opposite is the case in the lowest AIDS mortality countries. Here, the standard household
composition distribution will have a larger proportion of skip-generation households than the
country itself, and so the DWS predicted by the model should be higher than the one predicted
by the standard distribution. We subtracted the standardized DWS from the DWS predicted in
the model. For countries with high AIDS-mortality, this should result in a negative number. For
low AIDS mortality countries, the subtraction should produce a positive number.
22
The result of this procedure is seen in graphical form in Figure 3. CCDR is again along
the X-axis. The Y-axis presents the subtraction result between predicted DWS using the model
minus the predicted DWS using the standard household composition, with the result of the
subtraction expressed as a percent difference. Again, the linear equation, the linear trendline
predicting the percent difference and Pearson’s r are also shown. We expect to see a negative
association moving from left to right. Indeed, the most negative result is found in Zambia, a
country with very high AIDS mortality, where the DWS based on the model is 3.5 percent lower
than the DWS based on the standard distribution. The second most negative result is found in
Uganda, a country that also has a high level of AIDS mortality. The most positive result is in
Niger, where the DWS based on the model is almost 3 percent higher than the one based on the
standard distribution. The second most positive result is in Liberia. Both of these countries have
very low AIDS mortality.
Figure 3 about here
Clearly the association is negative, as expected, but it is only modestly robust. Pearson r
between CCDR and DWS differences expressed as a percent is -0.346, as shown on the figure,
and is non-significant. Swaziland and Tanzania are part of the reason for the lack of a strong
association. Despite having high proportions of skip-generation households, these two countries
have better DWSs than would be the case if their household compositions were equal to the
standard. Empirically, the reason can be seen by referring back to Table 3. While these
countries have higher than average proportions of skip-generation households, they also have
lower than average proportion of adult only households, and the latter produce very low DWSs.
In addition, some countries with low AIDS mortality have a higher than average proportion of
older adult households. These include Ghana and Nigeria, and explain empirically why DWS

23
predicted by the model in these countries is lower than the one predicted using the standardized
distribution.
CONCLUSION
Understanding the factors that influence material well-being is important if there is to be
reduction in poverty and its consequences in sub-Saharan Africa. This region of the world
contains the highest percentage of poor households and, not coincidentally, the lowest life
expectancy, the highest prevalence rates of HIV and several other infectious diseases, the highest
rates of infant mortality and other indicators of low quality of life.
In understanding material well-being, it is important to pay attention to the region’s older
persons. They are a group that has been woefully ignored in much of the research that is taking
place in the region despite their growing importance as a population segment. Population aging
is occurring in sub-Saharan Africa just as it is across the globe, in part due to declining levels of
fertility, which have the impact of reducing the number of young into society and increasing the
percent of those in other age groups (Darkwa and Mazibuko 2002). One out of every four
households in the region contains an older adult. Migration and mortality due to AIDS is
contributing to making older households an even larger component of the societies (Aboderin
2006; Apt 2007).
This paper asked whether the skip-generation household has lower material well-being
than households with other compositions. Importantly, given the trend toward increasing
proportions of skip-generation households in the literature reviewed, we found this household
type to be much worse off than household compositions that include living with an adult child.
Households that contain one or more older adult and one or more of their grandchildren but no

24
adult children score about 13 points less on average on the DWS than three-generation
households. The difference can be partially explained by other household characteristics such as
household size and sex and age of the household head. Controlling for these other variables,
skip-generation households still score almost 7 points lower than three-generation. However,
and notably, we also found that an older adult household, which consists of older adults only, or
older adults only and their spouses, are even worse off, scoring more than 18 points lower on the
DWS when not adjusted and more than 9 points lower when adjusted for other characteristics.
Results of other covariates showed that if the older adult household contains the spouse of the
older adult, and several other household members, the average DWS will increase.
One of the factors that may be contributing to changing material well-being for older
adults in the region is the AIDS epidemic that is of immense consequence to many aspects of life
in high HIV prevalence countries. Thus, the current study also asked whether associations
between the material well-being in household types associate with rate of AIDS mortality within
a country. We expected that skip-generation households would fare worse in high AIDS-
morality countries since the missing generation is more likely the result of death and therefore a
direct loss of support rather than other reasons for absence, such as labor migration. The results,
data and nature of the analysis allow us to conjecture on this. Much of the between country
variation in DWS is accounted for by standardizing scores by country and rural/urban area.
There is very little country level variation in slopes related to household composition as was seen
in Figure 1. Also, whatever variation does exist, it was not found to be related to the number of
individuals that have died due to AIDS as a proportion of population size in that country,
measured as the CCDR. Additionally, Figure 2 showed very little variation in average DWS for
skip-generation households by AID mortality. If anything, the modest non-significant

25
association was positive, meaning that skip-generation households in some high AIDS mortality
countries are better off than skip-generation households in some low AIDS mortality countries.
Still, there is the possibility of an indirect impact of AIDS mortality on material well-
being. Skip-generation households are found more often where there is high AIDS mortality
(Kautz et al. 2010; Zimmer 2009). In turn, skip-generation households are not a very favorable
household composition. We found only modest evidence of this indirect link. We compared
DWS scores for each country predicted by our model, which are similar to the raw DWS scores,
with DWS scores based on a standard household distribution, with the standard being the
average across countries. We would have expected that in the high AIDS mortality countries the
DWS predicted by the model would be lower than the DWS predicted by the standard
distribution. This was the case in Zambia and Uganda, but not in Swaziland and Tanzania. In
Zimbabwe and Namibia, also high AIDS mortality countries, the two DWSs were about equal.
We are left to speculate upon the reason for the lack of strong associations between level
of AIDS mortality in a country and material well-being of specific household types. Certainly, it
appears that the proportion of older adult only households varies quite a bit across countries and
not necessarily in concurrence with AIDS mortality. In some countries there may be a trade-off
between the older adult only and skip-generation household. Perhaps when adult children die
and move in with grandparents, the presence of a grandchild brings some material benefit. This
may be because other family members help or the grandchild themselves produces some wealth.
So, there may be some benefit of an AIDS death to material well-being of older adults in some
countries. But, any benefit is likely to be country specific.
Conversely, we expected countries with low CCDRs to have higher country level DWS
scores predicted by the model than predicted using the standardized household composition

26
distribution. This was the case in Congo, Liberia, Mali and Niger. It was not the case in Nigeria
and Ghana. The two DWS scores in Benin were about equal. In these cases, the non-
conforming countries had relatively high frequencies of older adult households. It is difficult to
speculate upon the reasons for high proportions of older adult households in these countries,
although we suspect this may be a function of cultural norms. The conclusion we come to is that
the indirect impact of AIDS mortality on material well-being is likely complex and cannot be
teased out of the current cross-sectional analysis. What is required is more detailed data, either
longitudinal or retrospective, that can allow for the determination of how households actually
change when there is a death in the family, and how that change alters material well-being within
the household. While an indirect association is modestly suggested here, it cannot be confirmed.
It may be that in some places when there is a death in a family grandchildren go to live
with family members that have the greatest resources. So, orphaned grandchildren may move in
with grandparents only when the grandparents are relatively wealthy, an occurrence that would
bring up the DWSs for skip-generation households. It is for this reason that the current analysis
broke up wealth indices into durable and fixed, and predicted durable adjusting for fixed. Fixed
wealth is unlikely to change with changing living arrangements. But, changes in household
composition can impact on durable wealth in a number of ways. With respect to HIV, research
has shown costs related to caretaking of their sick child, costs for their funerals, and eventually
caretaking of grandchildren left behind (Knodel, Watkins and VanLandingham 2003). A change
in household composition may provoke the need to sell off or at least not buy durable goods.
But, this is unlikely to impact on fixed wealth with is more long-term. Thus, adjusting for fixed
wealth provides a little more confidence that associations seen are causal rather than being
endogenous correlations.

27
The way the DWS was constructed needs to also be considered when interpreting results.
A preferential operationalization for material well-being would include a measure of
consumption (Montgomery et al. 2000). In addition, the DWS index was purposely constructed
to be standardized across countries and rural/urban areas. This removes much of the overall
country level variation in material well-being. This was done not only because specific items
that are used to measure DWS in each DHS survey differ, but also to isolate the impact of
household composition without biases based on the overarching levels of material well-being
within a country and between rural and urban areas. Again, further research with more detailed
data on households within individual countries is needed to better illuminate how changes in
composition associate with changes in material well-being.
Despite limitations, the current study has shown strong associations existing between the
household composition of older adults and material well-being, which suggest clear policy.
Older persons should not be ignored when it comes to assessing material well-being and the
chances of living in severe poverty in poor regions of the world. Indeed, older persons in sub-
Saharan Africa already represent the poorest of the poor (Barrientos, Gorman and Heslop 2003;
Kakwani and Subbarao 2007). Older persons in developing countries generally tend to be
vulnerable to low quality of life across a number of dimensions. This analysis has shown that
living without children is a determinant of poor material well-being. Yet, this is a situation that
is likely to increase over time due to, if nothing else, past reductions in fertility and migration of
adult children. Older persons already face challenges related to aging, such as increasing
chances of functional disability and non-communicative disease. Pension and other security
programs need to consider older persons as a paramount segment with particular needs which are

28
being affected by changing household dynamics. Any policy related to alleviating poverty that
does not consider older persons and these dynamics would be flawed.
The current study suggests that when a child is absent the older adult household has
lower material well-being regardless of the reason for the absence. This conclusion is contrary to
the commonsense view of a positive impact of labor migration and remittances. But, without
further research using data that is sensitive to changes over time and reasons for the absence of
adult children, we cannot be certain of the causal connection.
It is hoped that this analysis will increase the dialogue on the well-being of older adult
households and possibly lead to broader discourse on wealth inequality in sub-Saharan Africa
and throughout the developing world. Older persons are already vulnerable to the impacts of
poverty in developing countries. Where there is a robust AIDS epidemic, more skip-generation
households are likely. This can increase the vulnerability of a population segment that is already
susceptible to negative consequences of aging and the changing nature of intergenerational
relations. Yet they are frequently ignored when it comes to examining factors related to socio-
economic development. As the percent that are in older ages increases across the developing
countries, this is likely to change.
29
REFERENCES
Aboderin, Isabella. 2006. Intergenerational Support and Old Age in Africa. New Brunswick, NJ: Transaction Publishers.
Adamchak, Donald J., Adrian O. Wilson, Andrew Nyanguru, and Joseph Hampson. 1991. "Elderly support and intergenerational transfer in Zimbabwe: An analysis by gender, marital status, and place of residence." The Gerontologist 31(4):505-13.
Adeyemi, Sidikat L., Gafar T. Ijaiya, and Usman A. Raheem. 2009. "Determinants of poverty in sub-Saharan Africa." African Research Review 3(2):162-77.
Apt, Nana Araba. 1992. "Family support to elderly people in Ghana." Pp. 203-12 in Family Support for the Elderly: The International Experience, edited by Hal L. Kendig, Akiko Hashimoto, and Larry C. Coppard. New York, NY: Oxford University Press.
—. 2007. "Health and aging in Africa." Pp. 187-96 in Global Health and Global Aging, edited by Mary Robinson, William Novelli, Clarence Pearson, and Laurie Norris. San Francisco: Jossey-Bass.
Barbone, Luca, and Luiz-Alvaro Sanchez. 1999. "Governance of social security schemes: Pension schemes in Africa." in International Social Security Association Thirteenth African Regional Conference. Accra, Ghana.
Barrett, Christopher B., Michael R. Carter, and Peter D. Little. 2006. "Understanding and reducing persistent poverty in Africa: Introduction to a special issue." Journal of Development Studies 42(2):167-77.
Barrientos, Armando, Mark Gorman, and Amanda Heslop. 2003. "Old age poverty in developing countries: contributions and dependence in later life." World Development 31(3):555-70.
Bongaarts, John, and Zachary Zimmer. 2002. "Living arrangements of the elderly in the developing world: An analysis of DHS household surveys." Journal of Gerontology: Social Sciences 57(1):S145-S57.
Clark, Samuel J. 2006. "Demographic impacts of the HIV epidemic and consequencess of population-wide treatment of HIV for the elderly: Results from microsimulation." Pp. 3-1 - 3-24 in Aging in Sub-Saharan Africa: Recommendations for Furthering Research, edited by Barney Cohen and Jane Menken. Washington: National Academies Press.
Collier, Paul. 2007. "Poverty reduction in Africa." Proceedings of the National Academy of Sciences 104(43):16763-68.
Darkwa, O. K., and F. N. M. Mazibuko. 2002. "Population Aging and Its Impact on Elderly Welfare in Africa." International Journal of Aging & Human Development 54(2):107-23.
Davis, Maradee A., Deborah J. Moritz, John M. Neuhaus, John D. Barclay, and Lauren Gee. 1997. "Living arrangements, changes in living arrangements, and survival among community dwelling older adults." American Journal of Public Health 87(3):371-77.
De Vos, Susan. 2004. "Research note: Revisiting the classification of household composition among elderly people." Journal of Cross-Cultural Gerontology 12(2):135-52.
Ezeh, Alex C., Gloria Chepngeno, Abdhalah Ziraba DKasiira, and Zewdu Woubalem. 2006. "The situation of older people in poor urban settings: The case of Nairobi, Kenya." Pp. 6-1 - 6-24 in Aging in Sub-Saharan Africa: Recommendations for Furthering Research, edited by Barney Cohen and Jane Menken. Washington: National Academies Press.
Filmer, D., and L. Prichette. 2001. "Estimating weath effects without expenditure data - or tears: An application to educational enrollments in states of India." Demography 38(1):115-32.
Frayne, Bruce. 2004. "Migration and urban survival strategies in Windhoek, Namibia." Geoforum 35(4):489-505.
30
Gupta, Sanjeev, Catherine A. Pattillo, and Smita Wagh. 2009. "Effect of remittances on poverty and financial development in sub-Saharan Africa." World Development 37(1):104-15.
Hosegood, Victoria, and Ian M. Timaeus. 2006. "HIV/AIDS and older people in South Africa." Pp. 8-41 - 8-25 in Aging in Sub-Saharan Africa: Recommendations for Furthering Research, edited by Barney Cohen and Jane Menken. Washington: National Academies Press.
Isiugo-Abanihe, Uche C. 2002. "Child fosterage in west Africa." Population and Development Review 11(1):53-73.
Kakwani, Nanak, and Kalanidhi Subbarao. 2005. "Aging and poverty in Africa and the role of social pensions." in Social Protection Discussion Paper Series, number 521: World Bank.
—. 2007. "Poverty among the elderly in sub-Saharan Africa and the role of social pensions." Journal of Development Studies 43(6):987-1008.
Kandiyoti, Deniz. 1988. "Bargaining with patriarchy." Gender and Society 2(3):274-90. Kautz, Tim, Eran Bendavid, Jay Bhattacharya, and Grant Miller. 2010. "AIDS and declining support for
dependent elderly people in Africa: Retrospective analysis using dmeographic and health surveys." British Medical Journal (online first) 2010(340):1-6.
Kinsella, Kevin, and David R. Phillips. 2005. "Global aging: The challenge of success." Population Bulletin 60(1):1-40.
Knodel, John, and Wassana Im-em. 2004. "The economic consequences for parents of losing an adult child to AIDS: Evidence from Thailand." Social Science and Medicine 59(5):987-1001.
Knodel, John, Susan Watkins, and Mark VanLandingham. 2003. "AIDS and older persons: An international perspective " Journal of Acquired Immune Deficiency Syndrome 33(Suppl. 2):153-65.
Linnemayr, Sebastian. 2005. "Awareness, morbidity, mortality: When does the economic impact of HIV/AIDS at the household level commence?" Presented at the IUSSP seminar "Interaction bewteen poverty and HIV/AIDS" in Capetown South Africa.
Lloyd-Sherlock, P. 2000. "Old age and poverty in developing countries: New policy challenges." World Development 28(12):2157-68.
Long, Giang Thanh, and Wade Donald Pfau. 2009. "Ageing, poverty and the role of a social pension in Vietnam." Development and Change 40(2):333-60.
Madhavan, Sangeetha. 2004. "Forsterage patterns in the age of AIDS: Continuity and change." Social Science and Medicine 58(7):1443-54.
Madhavan, Sangeetha, and Enid J. Schatz. 2007. "Coping with change: Household structure and composition in rural South Africa, 1992-2003." Scandinavian Journal of Public Health 35(Suppl 69):85-93.
Measure DHS. 2011. Demographic and Health Surveys. Accessed at: http://www.measuredhs.com/start.cfm, June 28, 2011: ORC Macro.
Montgomery, Mark .R., Michele Grangnolati, Kathleen A. Burke, and Edmundo Paredes. 2000. "Measuring living standards with proxy variables." Demography 37(2):155-74.
Montgomery, Mark .R., and Paul .C. Hewett. 2005. "Urban poverty and health in developing countries: Household and neighborhood effects." Demography 42(3):397-425.
Ntozi, James P.M., and Sylvia Nakayiwa. 1999. "AIDS in Uganda: How has the household coped with the epidemic?" Pp. 155-81 in The Continuing HIV/AIDS Epidemic in Africa: Responses and Coping Strategies, edited by I.O. Orubuloye, J. C. Caldwell, and J. P. M. Ntozi. Canberra, Australia: Australia National University.
Oppong, Christine. 2006. "Familial roles and social transformations: Older men and women in sub-Saharan Africa." Research on Aging 28(6):654-68.
ORC Macro. 2006. Demographic and Health Survey Interviewer's Manual. MEASURE DHS Basic Documentation No. 2. Calverton, MD: ORC Macro.

31
Population Reference Bureau. 2007. 2007 World Population Data Sheet. Washington, D.C.: PRB. —. 2008. 2008 World Population Data Sheet. Washington, D.C.: PRB. —. 2009. 2009 World Population Data Sheet. Washington, D.C.: PRB. Rutstein, Shea, and Kiersten Johnson. 2004. The DHS wealth index. Calverton, MD: ORC Macro. United Nations. 2007. Development in an Ageing World. New York: United Nations. —. 2009. World Population Prospects: The 2008 Revision. New York, NY: U.N. Velkoff, Victoria A., and Paul R. Kowal. 2006. "Aging in Sub-Saharan Africa: The changing demography of
the region." Pp. 2-1 - 2-48 in Aging in Sub-Saharan Africa: Recommendations for Furthering Research, edited by Barney Cohen and Jane Menken. Washington: National Academies Press.
World Health Organization. 2002. "Impact of AIDS on older people in Africa: Zimbabwe Case Study." Geneva: World Health Organization.
Yount, Kathryn M. 2005. "The patriarchal bargain and intergenerational coresidence in Egypt." The Sociological Quarterly 46(1):139-66.
Zimmer, Zachary. 2009. "Household composition among elders in Sub-Saharan Africa in the context of HIV/AIDS." Journal of Marriage and the Family 71(4):1086-99.
Zimmer, Zachary, and Julia Dayton. 2005. "Older adults in sub-saharan Africa living with children and grandchildren." Population Studies 59(3):295-312.

32
Tab
le 1
: Sam
ple
and
coun
try
char
acte
rist
ics
Y
ear
of
DH
S
Popu
latio
n in
m
illio
ns1,
2
Lif
e ex
pect
ancy
m
ales
1,2,
4
Lif
e ex
pect
ancy
fe
mal
es1,
2,4
GN
I PPP
pe
r cap
ita
(USD
) 1,2
Num
ber o
f ho
useh
olds
in
DH
S3
Num
ber o
f ho
useh
olds
co
ntai
ning
so
meo
ne
aged
60+
3
HIV
Pr
eval
ence
ra
te1,
2
Cum
ulat
ive
crud
e de
aths
du
e to
AID
S (C
CD
R)1,
5
Ben
in
2006
8.
7 53
55
1,
160
17,5
11
4,03
2 1.
2 4.
0 C
ongo
20
07
3.8
51
53
2,75
0 8,
886
1,72
1 3.
5 24
.4
Gha
na
2008
23
.9
58
59
1,43
0 11
,778
2,
910
1.9
1.1
Lib
eria
20
07
3.8
44
46
290
6,82
4 1,
383
1.7
11.7
M
ali
2006
13
.9
48
49
1,13
0 12
,998
3,
441
1.3
5.6
Nam
ibia
20
07
2.1
50
53
5,12
0 9,
200
2,31
9 15
.3
30.0
N
iger
20
06
14.4
44
44
83
0 7,
660
2,17
3 0.
7 2.
6 N
iger
ia
2008
14
8.1
46
47
1,94
0 34
,070
8,
331
3.1
19.5
Sw
azila
nd
2008
1.
1 33
34
5,
010
4,84
3 1,
125
26.1
75
.3
Tan
zani
a 20
07
38.7
49
51
1,
200
8,49
7 2,
208
6.2
39.6
U
gand
a 20
06
27.7
47
47
1,
490
8,87
0 1,
727
6.7
46.4
Z
ambi
a 20
07
11.5
38
37
1,
000
7,16
4 1,
417
15.2
84
.3
Zim
babw
e 20
07
13.3
38
37
1,
940
9,28
5 2,
184
18.1
11
6.9
Ave
rage
23.9
46
.1
47.1
1,
945
11
,352
2,
690
7.8
35.5
Su
m
31
1.0
---
---
---
147,
586
34,9
71
---
---
1 In y
ear o
f the
DH
S.
2 So
urce
: Pop
ulat
ion
Ref
eren
ce B
urea
u. (2
006,
200
7, 2
008,
200
9) Population Data Sheet,
Was
hing
ton
DC
: PR
B.
3 Sou
rce:
DH
S.
4 At b
irth
. 5 C
CD
R =
[(Σ
deat
hs d
ue to
AID
from
199
0 un
til y
ear o
f DH
S) /
(Pop
ulat
ion
in y
ear o
f DH
S)] X
1,0
00

33
Table 2: Summary findings for DWS across all 13 countries by age distribution of household members1
Household composition Pooled Sample N
Mean DWS for pooled sample
One or more working age adult 24,721 52.0 One or more working age adult and one or more child 87,503 52.9 One or more working age adult and one or more older adult 5,306 47.9 One or more working age adult, one or more older adult, and one or more child
21,539 50.5
One or more older adult and one or more child 3,004 35.3 One or more older adults 5,122 32.7 Total 147,195 P-Value2 .00 1 149 households (0.10% of total) classified as children only and 233 (0.16% of total) as having no permanent residents are omitted from this table. N’s are weighted. Working age adults are those 15 to 59. Children are those under 15. Older adults are those 60 and older. 2 F-Test for differences of means.
34
Table 3: Percent household composition distribution by country, with countries arranged from highest to lowest CCDR
Household composition Country Older adult Skip-
generation Adult child
Three-generation
Other Total
Zimbabwe 11.0 27.5 14.0 34.5 13.0 100 Zambia 20.9 22.9 14.5 29.2 12.5 100 Swaziland 12.2 24.6 10.6 41.8 10.8 100 Uganda 17.4 25.7 11.9 31.2 13.7 100 Tanzania 14.6 15.5 14.3 39.2 16.4 100 Namibia 13.3 17.0 13.7 41.4 14.7 100 Congo 16.9 11.3 18.8 39.4 13.6 100 Nigeria 25.8 10.9 28.6 21.7 13.0 100 Liberia 10.6 15.1 13.1 46.0 15.2 100 Mali 14.2 10.6 30.1 27.7 17.4 100 Benin 21.2 11.5 23.3 29.9 14.2 100 Niger 8.5 19.3 18.1 37.1 17.1 100 Ghana 22.8 12.9 24.7 26.2 13.4 100 Summary:
Average
16.1 17.3 18.1 34.3 14.2 100
Pooled sample 20.9 14.6 22.9 27.8 13.8 100

35
Table 4: Ordinary Least Squares Regression estimates predicting DWS Model
1 Model
2 Model
3 Household compositions Older adult -18.2** -9.7** Skip-generation -13.5** -6.9** Adult child -1.9** -1.3** Three-generation (contrast) --- --- Other -7.9** -4.7** Control variables Older person’s spouse in hh 3.3** Age of oldest hh member -0.1** Older person(s) females 3.0** Residual hh size 1.7** Any education in hh 10.0** hh head is female -8.2** hh head is older person -5.0** Fixed wealth score 0.5** Country variables Benin -3.7 -2.2 1.5 Congo 1.3 1.9 0.4 Ghana -2.0 -0.0 1.2 Liberia (contrast) --- --- --- Mali 0.6 1.1 2.4 Namibia 2.2 2.9 6.5** Niger 0.3 0.7 1.2 Nigeria -1.7 0.6 2.2 Swaziland -0.8 0.4 3.7* Tanzania -2.1 -1.2 3.3* Uganda 1.3 3.8* 4.3** Zambia -2.9 -0.2 -0.1 Zimbabwe 2.2 3.7* 3.6* Constant 47.1 52.5 22.8 Fit statistics F-ratio 6.0*** 145.8** 325.1** ∆ F1 6.0** 564.2** 2,246.0** R-square .002 .063 .381 ** p < .01 * .05 > p > .01 1 Compared to previous model, except Model1 which is compared to an intercept only model.
36
Figure 1: Predicted DWS by country and household composition
0
10
20
30
40
50
60
Older Adults Skip-generation Other Adult child Three-generation
DW
S
Household type
CO NR NG GH MA LI
BE
ZE SW
ZA TA
UG
NB
High CCDR countries ZE Zimbabwe ZA Zambia SW Swaziland UG Uganda TA Tanzania NB Namibia Low CCDR countries CO Congo NG Nigeria LI Liberia MA Mali BE Benin NR Niger GH Ghana
37
Figure 2: DWS for skip-generation households based on the predictive model by CCDR
25
30
35
40
45
50
0 20 40 60 80 100 120
DW
S
CCDR
Country codes: BE Benin CO Congo LI Liberia GH Ghana MA Mali NB Namibia NG Nigeria NR Niger SW Swaziland TA Tanzania UG Uganda ZA Zambia ZE Zimbabwe
DWS = 39.237 + .025(CCDR) r = .306, p > .10
GH
NR
BE
MA
LI
NG
CO
NB
TA
UG
SW ZA
ZE

38
Figure 3: DWS based on the predictive model minus DWS based on the standard household composition, expressed as a percent, by CCDR
-4
-3
-2
-1
0
1
2
3
4
0 20 40 60 80 100 120
Perc
ent d
iffer
ence
CCDR
Country codes: BE Benin CO Congo LI Liberia GH Ghana MA Mali NB Namibia NG Nigeria NR Niger SW Swaziland TA Tanzania UG Uganda ZA Zambia ZE Zimbabwe
Percent = .837 - .018(CCDR) r = -.346, p > .10
GH
NR
BE
MA
LI
NG
CO
NB
TA
UG
SW
ZA
ZE

39
APP
EN
DIX
I: It
ems
used
for t
he D
urab
le W
ealth
Sco
re a
nd F
ixed
Wea
lth S
core
by
coun
try
C
ongo
N
amib
ia
Nig
eria
B
enin
G
hana
L
iber
ia
Nig
er
Mal
i Sw
azila
nd
Uga
nda
Zam
bia
Zim
babw
e A
. Dur
able
item
s
1.
Rad
io
X
X
X
X
X
X
X
X
X
X
X
X
2. T
elev
isio
n X
X
X
X
X
X
X
X
X
X
X
X
3.
Ref
rige
rato
r X
X
X
X
X
X
X
X
X
X
X
X
4.
Bic
ycle
X
X
X
X
X
X
X
X
X
X
X
X
5.
Mot
orcy
cle/
scoo
ter
X
X
X
X
X
X
X
X
X
X
X
X
6. C
ar/tr
uck
X
X
X
X
X
X
X
X
X
X
X
X
7. T
elep
hone
X
X
X
X
X
X
X
X
X
X
8.
Mob
ile te
leph
one
X
X
X
X
X
X
X
X
X
X
X
X
9. A
nim
al d
raw
n ca
rt
X
X
X
X
X
X
X
X
X
X
10. O
wn
agri
cultu
ral l
and
X
X
X
X
X
X
X
X
11. T
able
X
X
X
X
12
. Cha
irs
X
X
X
X
X
13
. Sof
a se
t
X
X
14
. Bed
X
X
X
X
X
15. C
upbo
ard
X
X
X
X
16. C
lock
X
X
X
17. B
oat w
ithou
t mot
or
X
X
X
X
18.G
rill/
heat
er
X
19
.Cas
sette
e Pl
ayer
X
20.L
amps
X
21. S
tove
/Coo
ker
X
X
X
22
. Hoe
X
23. S
ewin
g M
achi
ne
X
X
X
X
X
24
. Can
oe, d
ugou
t X
X
X
X
25
. Gen
erat
or
X
X
X
26
. Ref
rige
rato
r
X
27. W
atch
X
X
X
X
28
. Liv
esto
ck
X
X
X
X
X
X
X
29
. Air
Con
ditio
ner
X
X
30
. Com
pute
r
X
X
X
X
31
. Ele
ctri
c It
em
X

40
APP
EN
DIX
I: C
ontin
ued
C
ongo
N
amib
ia
Nig
eria
B
enin
G
hana
L
iber
ia
Nig
er
Mal
i Sw
azila
nd
Uga
nda
Zam
bia
Zim
babw
e 32
. Fan
X
X
34
. Plo
ugh
X
35
. Gra
in G
rind
er
X
36
. VC
R/D
VD
X
X
X
X
37
Ham
mer
Mill
X
38. W
heel
Bar
row
39
. HiF
i Ste
reo
X
40. F
oyer
am
elio
rés
X
41
. Foo
d C
ooke
rs
X
42
. Was
hing
Mac
hine
X
X
X
43. R
enta
l Hou
se
X
44
. Iro
n
X
45
. Con
nect
ion
to In
tern
et
X
X
46. M
attr
ess
X
47
. Im
prov
ed tr
aditi
onal
ki
tche
n
X
48. F
reez
er
X
49
. Cam
era
X
B
. Fix
ed it
ems
1. M
oder
n so
urce
of
drin
king
wat
er
X
X
X
X
X
X
X
X
X
X
X
X
2. M
oder
n to
ilet f
acili
ty
X
X
X
X
X
X
X
X
X
X
X
X
3. E
lect
rici
ty
X
X
X
X
X
X
X
X
X
X
X
X
4. M
oder
n fl
oor
X
X
X
X
X
X
X
X
X
X
X
X
5. M
oder
n w
all
X
X
X
X
X
X
X
X
X
X
6. M
oder
n ro
of
X
X
X
X
X
X
X
X
X
X
7. M
ore
than
one
room
in
hous
e fo
r sle
epin
g
X
X
X
X
X
X
X
X
X
X
X
8. D
oes
not s
hare
toile
t w
ith o
ther
hou
seho
lds
X
X
X
X
X
X
X
X
X
X
X
X
9. H
as s
epar
ate
kitc
hen
X
X
X
X
X
X
X
X
X
41
APP
EN
DIX
II: E
xam
ples
of d
urab
le it
ems
in h
ouse
hold
s by
DW
S an
d ru
ral/u
rban
resi
denc
e fo
r sel
ect c
ount
ries
A
ppro
xim
ate
Scor
e C
ount
ry
Urb
an
Rur
al
0 N
amib
ia
Non
e
Non
e
Nig
eria
N
one
N
one
T
anza
nia
N
one
Non
e
25
N
amib
ia
Mob
ile te
leph
one,
Wat
ch
Rad
io
N
iger
ia
Mob
ile te
leph
one,
Lan
d L
and,
Liv
esto
ck
T
anza
nia
M
obile
Tel
epho
ne
Bic
ycle
50
N
amib
ia
Rad
io, T
elev
isio
n, R
efri
gera
tor,
Wat
ch, L
and
T
elep
hone
, Ani
mal
dra
wn
cart
, Liv
esto
ck
N
iger
ia
Air
con
ditio
ner,
Iron
, Fan
M
otor
cycl
e
Tan
zani
a
Rad
io, M
obile
tele
phon
e, W
atch
B
icyc
le, W
atch
, Lan
d
75
N
amib
ia
Car
/truc
k, M
obile
tele
phon
e, W
atch
R
adio
, Tel
evis
ion,
Bic
ycle
, Lan
d, L
ives
tock
Nig
eria
R
adio
, Tel
evis
ion,
Mob
ile te
leph
one,
Ele
ctri
c Ir
on, F
an
Tel
evis
ion,
Mob
ile te
leph
one,
Lan
d
Tan
zani
a
Rad
io, T
elev
isio
n, R
efri
gera
tor,
Bic
ycle
, Iro
n.
Rad
io, B
icyc
le, M
obile
tele
phon
e, L
and
100
Nam
ibia
R
adio
, Tel
evis
ion,
Ref
rige
rato
r, B
icyc
le,
Mot
orcy
cle/
scoo
ter,
Car
/truc
k, T
elep
hone
, Mob
ile
tele
phon
e, w
atch
Mot
or c
ycle
, car
/truc
k, M
obile
tele
phon
e, W
atch
, Lan
d,
Liv
esto
ck, H
erds
or f
arm
ani
mal
s
N
iger
ia
Rad
io, T
elev
isio
n, R
efri
gera
tor,
Mot
orcy
cle/
scoo
ter,
Car
/truc
k, T
elep
hone
, Gen
erat
ing
set,
Air
con
ditio
ner,
Com
pute
r, E
lect
ric
Item
, Fan
Rad
io, T
elev
isio
n, R
efri
gera
tor,
Bic
ycle
, Mot
orcy
cle/
scoo
ter,
C
ar/tr
uck,
Tel
epho
ne, M
obile
tele
phon
e, L
and
T
anza
nia
R
adio
, Tel
evis
ion,
Bic
ycle
, Ref
rige
rato
r, M
otor
cycl
e/sc
oote
r, T
elep
hone
, Mob
ile te
leph
one,
W
atch
, Par
affi
n la
mp,
Iron
Rad
io, T
elev
isio
n, B
icyc
le, R
efri
gera
tor,
Mot
orcy
cle/
scoo
ter,
Tel
epho
ne, M
obile
tele
phon
e, W
atch
, Lan
d, P
araf
fin
lam
p, Ir
on.