How Should Capital be Represented in Studies of Total ...
14
Capital Stock Conference March 1997 Agenda Item VII How Should Capital be Represented in Studies of Total Factor Productivity Derek Blades and Jeroen Meyer-zu-Schlochtern Statistics Directorate, OECD
Transcript of How Should Capital be Represented in Studies of Total ...

Capital Stock ConferenceMarch 1997Agenda Item VII
How Should Capital be Represented in Studies of Total Factor Productivity
Derek Blades and Jeroen Meyer-zu-SchlochternStatistics Directorate, OECD

How Should Capital be Represented in Studies of Total Factor Productivity?
Derek Blades and Jeroen Meyer-zu-Schlochtern Statistics Directorate, OECD*
This note looks at the choice of capital variable for studies of total factor productivity. Most studies follow the lead of the early pioneers in growth accounting and use the gross capital stock to represent capital input. It is argued that a stock variable is not appropriate to explain changes in economic flows and that capital consumption may be a better measure of capital input. Calculations of TFP for six countries suggest that capital consumption performs as well or better than capital stock in explaining changes in value added. The note recognises that capital inputs should ideally be measured by reference to "rental prices" but since these are so rarely available, capital consumption may be the next best variable for international comparisons of TFP.
Introduction
1. Total Factor Productivity, (OECD terminology is used rather than "Multifactor Productivity" as proposed by the Conference organisers), is that part of the change in value added which cannot be explained by changes in inputs of labour and capital.
i Total factor productivity (TFP) is seen as a
measure of technical progress which is "disembodied" in the sense that it does not come about through using larger quantities of labour or capital. Some part of TFP may be truly disembodied and occur because, for example, producers are less wasteful in their use of intermediate inputs, because they learn how to better motivate their work force or because they combine capital and labour in more efficient ways. But in practice some part of measures TFP may be due to poor specification, or faulty measurement, of the labour and capital variables: if they more accurately measure the quantities of labour and capital actually devoted to the generation of each period's value added, a part of TFP may turn out to be embodied in either labour or capital.
*The views expressed in this paper are those of the authors and should not be attributed to the OECD.

2. The large majority of TFP studies have used the gross capital stock (GCS) as the capital variable. This is the total value of capital assets at what they would have cost to purchase, as new, in the current year (current price GCS) or in a base year (constant price GCS), Denison's studies in the 1960's
ii were influential both at the policy level and for statistical
methodology. The gross stock was preferred to the net stock, (which was then seen as the alternative)' because it was felt that with propermaintenance most capital assets go on working at a constant level of efficiency throughout their lives. Denison's lead has generally been followed by growth accountants including, for example, Solow
iii and Maddison
iv. At the
OECD, GCS is used for the TFP module of INTERLINKv as well as in the
numerous TFP studies based on the "International Sectoral Data Base"vi .
3. In some early TFP studies, Christensen and Jorgensonvii and also
Kendricksviii
used the Net Capital Stock (NCS) as the capital input although they also used the GCS in subsequent work. Denison
ix later suggested
taking a weighted average of gross and net stocks, using weights of three and one respectively. The Net Capital Stock differs from the Gross Capital Stock because assets are valued at the prices at which they could be bought in their present state instead of "as new" prices. NCS supporters argue that "present state" prices capture the reduced efficiency of older assets due to higher repair costs or growing obsolescence. Other authors have agreed that there is indeed some loss of efficiency as assets age and that the GCS requires some downward adjustment if it is to serve as the capital input for TFP studies. However, the full mount of depreciation is generally agreed to overstate the loss of efficiency. The U.S. Bureau of Labor Statistics (BLS) applies an explicit age-efficiency function which reduces the value of the stock by the presumed loss of efficiency due to aging.
x The age-efficiency
relationship is represented by the hyperbolic function: St = (L-t)/(L-βt)
where St is the relative efficiency of a t year old asset, L is the service life, and t is the age of the asset.
With values of β between 0 and 1, St lies on curve that is concave to the origin implying an increasing loss of efficiency as the asset ages.
Stocks versus Flows
4. The obvious problem in using GCS or NCS to represent capital input is that they are stock variables in a model in which both the dependent variable and the other explanatory variable are both measures of flows. Specifically, in the standard formulation, Y = f(L,K) both Y (value added) and L (labour employed or hours worked) both relate to flows of outputs and inputs during a single accounting period while K measures the stock of assets available for use over several accounting periods. That the mixing of stocks and flows is not merely a semantic problem becomes clear when the

nature of the GCS variable is examined.
5. The Gross Capital Stock is the value of the capital assets - factories, machines, transport equipment and the like - which are available at a point in time for use in production at their "as new" replacement prices. "As new" replacement prices are what the asset owners would have to pay to purchase the assets in their original, pristine, condition. In competitive market conditions, the price of an asset at the time of purchase is equal to the present value of the income expected to be earned by the asset over its entire service life. The GCS thus represents the sum of expected returns through using assets over their entire lifetimes; when it is used to explain changes in value added in a single year it has the severe drawback that it includes the predicted incomes over the entire lifetimes of the assets in periods both preceding and succeeding, as well as including, the year in question. If the Net Capital Stock is used, the situation is only slightly improved. The NCS excludes expected incomes preceding the year in question but still includes the incomes that the asset is expected to earn in all years following the year in question.
6. The use of stock variables in TFP calculations is sometimes justified by the assertion that the services rendered by capital assets are proportional to their prices. But this assertion can only be used to justify the addition of disparate types of capital goods - e.g., machines and factories - into a single aggregate called the capital stock. The problem is that because different kinds of assets have different service lives the intensity with which they contribute to production in a given year will not be the same.
7. To pursue the argument further, consider a country whose capital stock consists of two assets - one factory and one machine. The original purchase price of each asset is IOO units so that the GCS equals 200. However, the factory has an expected life of a hundred years while the service life of the machine is ten years. In any given year, therefore, the factory will contribute a smaller portion of its total value to the production in that year compared to the shorter-lived machine. Because the capital services rendered in a single year are inversely related to service lives, the capital services actually rendered in any given year can be approximated by weighting the values of the assets by the inverse of their service lives. This is a way of recognising that more of the value of short-lived assets is used up in producing a given year' s value added than is the case with long-lived assets. For the two-asset country, a measure of the capital services rendered each year would then be obtained as 1OO/1OO+100/10=11 rather than the GCS measure of 100+1OO=2OO. Of course, which measure is used makes no difference to a TFP calculation if the asset composition remains constant, but if the composition is changing the use of different weights may make a significant difference to the measure of capital input and, hence, to measured TFP.
8. A capital service measure of the kind proposed here is available for virtually all countries that compile stock statistics; it is, of course, capital consumption.
Capital consumption as capital input
9. The idea of using capital consumption to measure the input of capital in TFP calculations has been occasionally mentioned in the literature. In one of the best early reviews of growth accounting, Creamer
xi writes "The next
step is the choice of measure of capital services from the series available - the gross stock, the net capital stock or capital consumption." Unfortunately, his implied promise to consider the use of capital consumption is not pursued and his article concentrates exclusively on the choice between the GCS and NCS. The idea was explored in more detail by Ward
xii who
concluded that "Annual capital consumption valued at a common replacement cost may be taken to represent an initial proxy estimate for the real annual capital factor input value of assets with differing lifetimes and vintages".
10. One apparent problem in using capital consumption in TFP calculation is that capital consumption is included in the dependent variable - GDP or gross value added. It is true that for non-market producers gross value added is obtained as the sum of capital consumption and compensation of employed so that non-market gross value added is directly affected by changes in capital consumption. But for market production - i.e., the "business" share of GDP - the level of gross value added is unaffected by the amount of capital consumption. Capital consumption is merely a charge against gross value added (and other balancing items) representing the amount that must be deducted in order to maintain the asset-owners' wealth; annual variations in capital consumption have no accounting implications on the dependent variable - GDP or gross value added.
11. There are several reasons why capital consumption is only an approximation to the annual value of services rendered by the capital stock. Several countries use geometric rather than straight-line consumption; the former will give more weight to the services rendered by an asset during the early part of its service life, while straight-line depreciation gives equal weight to each year' s contribution which seems more appropriate for present purposes. More important, perhaps, is the fact that asset values represent discounted flows of services; in the case of the machine that cost 100 units the services that the entrepreneur expected it to render in the course of its ten-year life must have exceeded 10 per year because of the discount factor, so that 10 is an under-estimate of the value of its annual services. The longer the life of an asset the greater is the understatement of the annual services provided by the asset, so that when capital consumption is used to measure capital services, it will, in general, give too much weight to short life assets. And finally, assets are not in practice used with equal intensity throughout their lives; this depends, among other things on cyclical factors. This problem, however, also applies to the use of GCS or NCS. Despite these imperfections, there seem to be good reasons to explore the use of capital consumption as the measure of Capital input for TFP calculations.

TFP using capital consumption versus gross capital stock
12. The OECD's International Sectoral Data Base (ISDB) contains, among several other variables, long time series on value added, gross capital stocks and capital consumption for 14 Member countries and for 30 "sectors" (i.e., kinds of activity). The data used for the results given below are expressed in constant 1990 prices and are converted to U.S. dollars using PPPs.
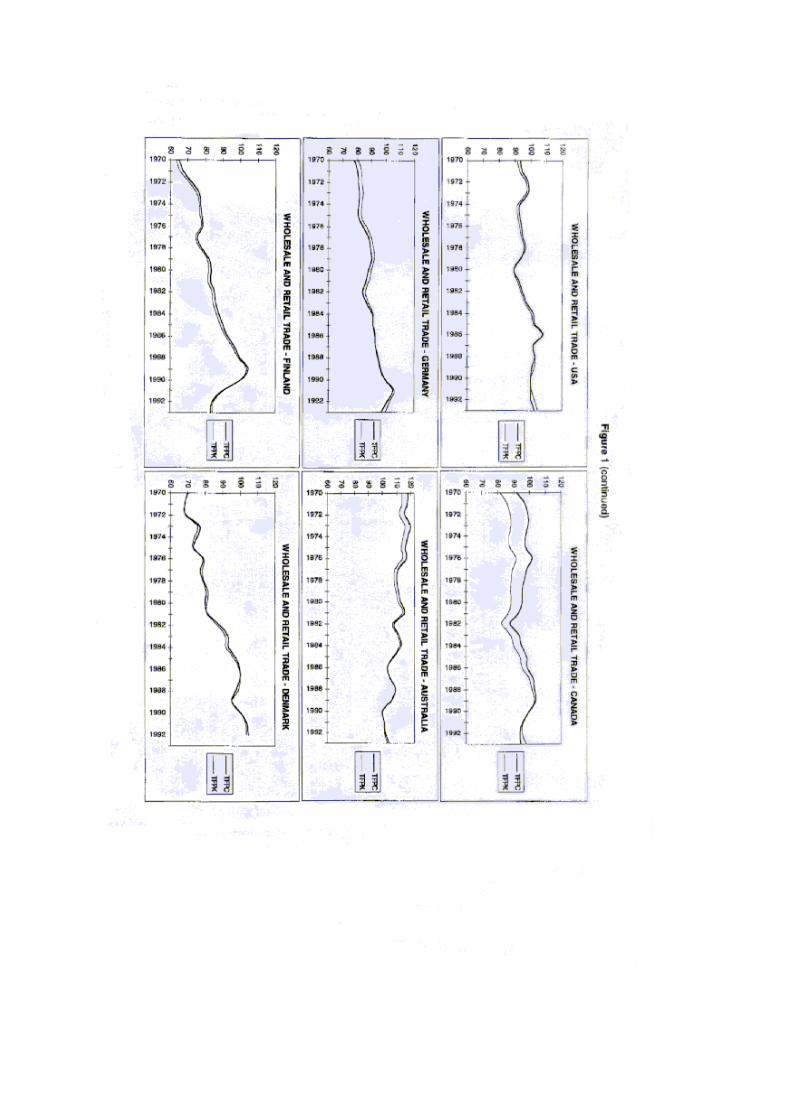
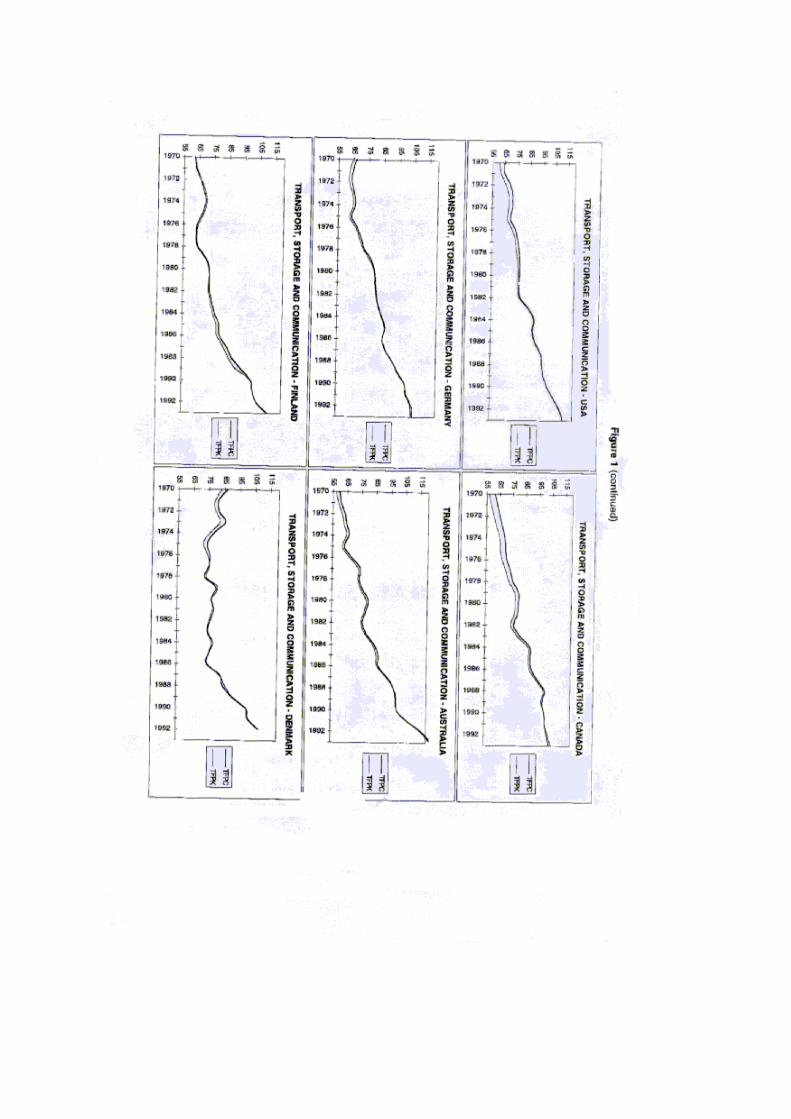
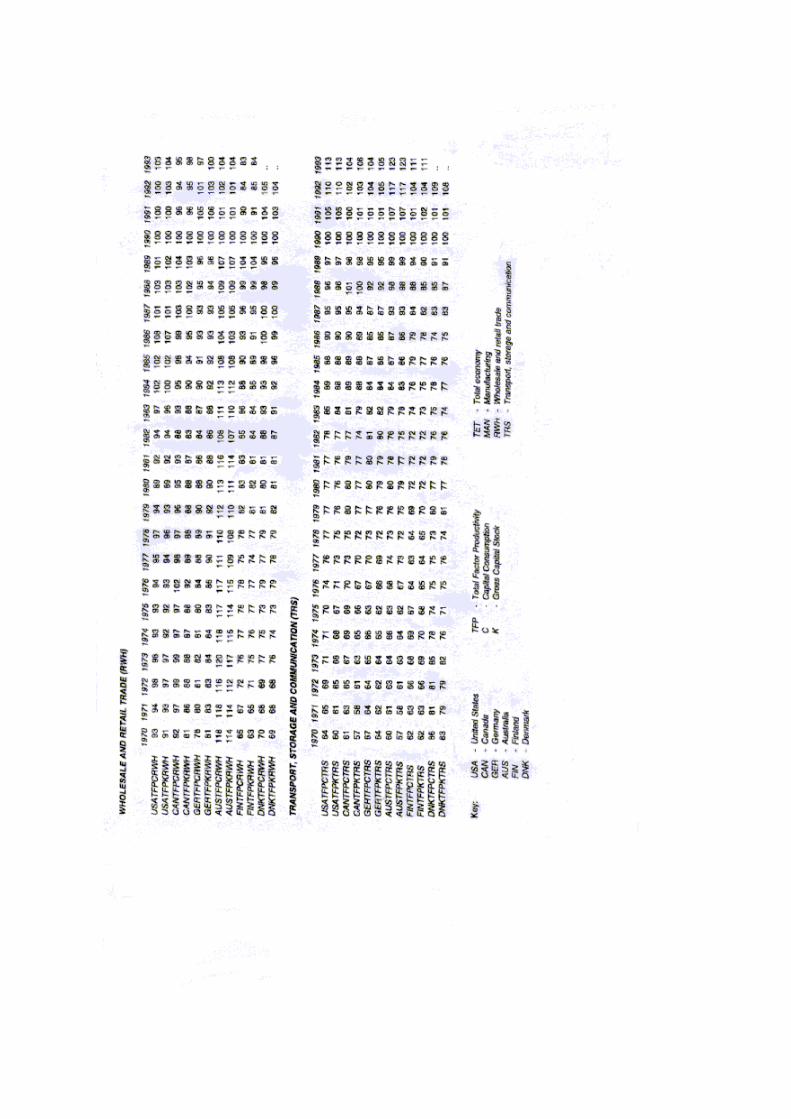
13. Total factor productivity indices have been calculated for six countries usingconsumption of fixed capital and gross capital stock. Separate calculations have been made for GDP, for manufacturing, for retail and wholesale trade and for transport, storage and communications. The results are graphed in Figure 1 and the indices themselves are given in Table 1. The formula used is as follows:
where: TFP = total factor productivity index VA = value added at 1990 prices and 1990 PPPs
ET = total employment w = labour share in GDP, fixed at 0.7, TFP0 = total factor productivity index, 1990 valueand C = gross capital stock or consumption of fixed capital, both at
1990 prices and at 1990 PPPs.
The value of 0.7 for the labour share is the average share of compensation of employees in GDP for the countries included in the ISDB. It includes an imputation for the wage share of "mixed income" received by the self-employed. The ISDB can also be used to calculate TFP with country and sector-specific labour shares and these may be preferred for some purposes. It seems unlikely, however, that the use of alternative shares will significantly affect the conclusions drawn from the results given below.
14. A first point to notice is the close similarity between the two sets of results - TFPC (using consumption of fixed capital) and TFPK (using GCS). Indeed, for the total economy the choice of capital variable makes almost no difference in Germany, Australia and Finland. One reason for this may be that these countries make relatively little differentiation in the service lives assigned to different types of machinery and equipment so that the capital consumption variable is less affected by shifts in the asset composition of the stock at least as between different types of machinery. It may also be the case that in these three countries there really has been no change in the composition of the total stock as between short and long life assets. Finally it should be noted that the capital input has a relatively low weight (0.3) in the TFP calculation; this would account in part for the fact that the two curves move in a very similar way for all countries and all four kinds of activities.
15. Perhaps the most striking result is that where the choice of capital variable does ,make a difference, the effect of using consumption of fixed capital is almost always in the same direction - namely to reduce the growth of TFP. The only exceptions are for wholesale and retail trade in Germany and (marginally) in Denmark; in Australia, the use of capital consumption increases the rate of decline in TFP over the period.
16. The tendency for capital consumption to reduce the growth of TFP can be interpreted as meaning that it performs better than the capital stock in explaining the growth of value added. Using capital consumption as the capital variable we have generally explained more of the growth of value added than when gross capital stock is used. In other words, the use of a true flow variable "embodies" more of the growth of value added than the stock variable which is usually used in these calculations.
BLS measure of capital services
17. In its own, very detailed, TFP studies, the BLS uses the GCS as its capital variable, but in addition to using a decay adjustment, BLS researchers weight the stock of each type of asset by its "rental price", i.e., the rate of depreciation plus the discount rate minus the nominal holding gain. The procedure is described in detail in the BLS Bulletin 2178 (See reference (x) pp. 49-52) Michael Harper, currently responsible for BLS studies of TFP, has also examined the effects of using alternative rental prices.
xiii It is clear that the BLS procedure generates estimates of the capital
services which are superior to stock variables and, also, to capital consumption. The problem is that estimates of rental prices are not, so far as we can ascertain, available for any country other than the United States.
18. Rental prices could, in principle, be obtained directly from companies that are in the business of renting assets. BLS researchers have not done this because they believe that the rents charged by these companies include a substantial service element - notably for repair and maintenance - which it would be difficult to unravel from the rental price per se. BLS rental prices are essentially estimated as the ratios of gross operating surplus to the capital stock for detailed kinds of activity. At the present time, BLS must be considered the world leaders in the techniques of measuring TFP and it would clearly be useful if other OECD countries could follow their lead. In the meantime, however, the use of capital consumption for TFP analysis could be further explored; in terms of desirability it lies mid-way between inferior stock variables and superior rental price measures.


Notes and references
i Some studies use gross output as the dependent variable in which case inputs of intermediate goods and services are included as independent variables together with labour and capital inputs. See, for example,. William Gullickson and Michael J. Harper, "Multifactor productivity in U.S. on Manufacturing, 1949-83" in Monthly Labour Review, October 1987, Bureau of Labor Statistics, Washington, D.C. The conclusions of this note are not affected by the choice, as dependent variable, between value added and gross output
iiln particular, E.F. Denison, The Sources of Economic Growth in the United States and the Alternatives Before US, Committee for Economic Development, 1962 and (assisted. by J-P. Poullier) Why Growth Rates Differ: Post-War Experience in Nine Western Countries., The Brookings Institute, 1967.
iii Solow, Robert M., "Technical Progress, Capital Formation and Economic Growth", Papers
and Proceedings of the Seventy-fourth Annual Meeting, The American Economic Review, Vol. LII, No. 2, May 1962.
ivMaddison, Angus, Les phases du developpment capitaliste, Economica, Paris, 198 l.
vGiorgo, Claude, Pete Richardson and Wik Suyker, "Technical Progress, Factor Productivity and Macro-Economic Performance in the Medium Term", in OECD Economic Studies, No. 25, 1995 II
viInternational Sectoral Data Base, ISDB 1996, OECD, November 1996.
vii Christensen, Laurits R. and Dale W. Jorgenson, "The Measurement of U.S. Real Capital
Input, 1929-1967" in Review of Income and Wealth, Series 15, December 1969.viii
Kendrick, John W., Productivity Trends in the United States, National Bureau of Economic Research, No. 71, General Series, Princeton University Press, 1961.ixDenison, E.F., "Some Major Issues in Productivity Analysis", in Survey of Current Business,
Bureau of Economic Analysis, Washington, D.C., May 1969.x Trends in Multifactor Productivity, 1948-81, U.S Department of Labor, Bureau of Labor Statistics, Bulletin 2178, September 1983 (pp. 41-45).xiCreamer, Daniel, "Measuring Capital Input for Total Factor Productivity Analysis: Comments
by a Sometime Estimator", in The Review of Income and Wealth, Series 18, No. 1 March 1972. (The quotation is from page 64.)xii Ward, Michael, The Measurement of Capital: The Methodology of Capital Stock Estimates
in OECD Countries, OECD, Paris 1976. (The quotation is from page 29.)xiii
Harper, Michael J., Ernst R. Berndt and David O. Wood, "Rates of Return and Capital Aggregation Using Alternative Rental Prices" in Dale W. Jorgenson and Ralph Landon (eds.) Technology and Capital Formation, The MIT Press, Cambridge and London.