CAPITAL ADEQUACY Capital Adequacy (Consolidated)Capital Adequacy Ratio, the names of those companies...
65
CAPITAL ADEQUACY 39 INTERIM REPORT 2019 The Norinchukin Bank Capital Adequacy (Consolidated) Scope of Consolidation • Reason for discrepancies between companies belong- ing to the Bank’s group that are required to compute a consolidated capital adequacy ratio, as specified in the Notification Regarding Capital Adequacy Ratio, Article 3 (hereinafter, “the Consolidated Group”) and the com- panies included in the scope of consolidation, based on “Ordinance on Terminology, Forms and Preparation Methods of Consolidated Financial Statement” under Ministerial Ordinance No. 28, issued by the Ministry of Finance in 1976: Not applicable • As of September 30, 2019, the Bank had 17 consolidated subsidiaries and firms. The names and principal lines of business of the primary subsidiaries are as follows: 1. Norinchukin Trust & Banking Co., Ltd.: Trust and banking business 2. Kyodo Housing Loan Co., Ltd.: Loans and guaran- tees for housing • Companies belonging to the Consolidated Group but not included in the scope of consolidation: Not applicable • Companies not belonging to the Consolidated Group but included in the scope of consolidation: Not applicable • Affiliated companies engaged in financial service busi- ness that were subject to the provisions of Article 9 of the Notification Regarding Capital Adequacy Ratio: Not applicable • Restrictions on the transfer of funds and capital between the members of the Consolidated Group: Not applicable Companies with Less than the Regulatory Required Capital and the Amount of Shortfall With regard to the group companies that are subject to capi- tal deduction, as provided for in the Notification Regarding Capital Adequacy Ratio, the names of those companies whose capital is less than the regulatory required capital and the total amount of shortfall in their capital: Not applicable Remarks on Computation of the Consolidated Capital Adequacy Ratio Foundation Internal Ratings-Based Approach (F-IRB))” and “The Standardized Approach (TSA)” for calculating operational risk capital charges. The disclosure requirements for the Bank are provided in Notification No. 6 of the 2007 Financial Services Agency and the Ministry of Agriculture, Forestry and Fisheries of Japan entitled “Disclosure Items Related to Capital Adequacy of The Norinchukin Bank” (hereinafter, “Disclosure Notification”). These disclosures as well as the features of regulatory capital instruments can be found in the IR Library of the Bank’s website at https://www. nochubank.or.jp/. Disclosure Regarding Capital Adequacy and Features of Regulatory Capital Instruments The Bank calculates its capital adequacy ratio based on the formula contained in Notification No. 4 of the 2006 Financial Services Agency and the Ministry of Agriculture, Forestry and Fisheries of Japan entitled “Standards for Judging the Soundness of Management of The Norinchukin Bank” (hereinafter, “Notification Regarding Capital Adequacy Ratio”). In addition, to calculate risk-weighted assets for credit risk, the Bank has adopted the “Advanced Internal Ratings-Based Approach (A-IRB) (partially the
Transcript of CAPITAL ADEQUACY Capital Adequacy (Consolidated)Capital Adequacy Ratio, the names of those companies...

CAPITAL ADEQUACY
39INTERIM REPORT 2019 The Norinchukin Bank
Capital Adequacy (Consolidated)
Scope of Consolidation
• Reason for discrepancies between companies belong-
ing to the Bank’s group that are required to compute a
consolidated capital adequacy ratio, as specified in the
Notification Regarding Capital Adequacy Ratio, Article
3 (hereinafter, “the Consolidated Group”) and the com-
panies included in the scope of consolidation, based on
“Ordinance on Terminology, Forms and Preparation
Methods of Consolidated Financial Statement” under
Ministerial Ordinance No. 28, issued by the Ministry of
Finance in 1976:
Not applicable
• As of September 30, 2019, the Bank had 17 consolidated
subsidiaries and firms. The names and principal lines of
business of the primary subsidiaries are as follows:
1. Norinchukin Trust & Banking Co., Ltd.: Trust and
banking business
2. Kyodo Housing Loan Co., Ltd.: Loans and guaran-
tees for housing
• Companies belonging to the Consolidated Group but not
included in the scope of consolidation:
Not applicable
• Companies not belonging to the Consolidated Group but
included in the scope of consolidation:
Not applicable
• Affiliated companies engaged in financial service busi-
ness that were subject to the provisions of Article 9 of the
Notification Regarding Capital Adequacy Ratio:
Not applicable
• Restrictions on the transfer of funds and capital between
the members of the Consolidated Group:
Not applicable
Companies with Less than the Regulatory
Required Capital and the Amount of
Shortfall
With regard to the group companies that are subject to capi-
tal deduction, as provided for in the Notification Regarding
Capital Adequacy Ratio, the names of those companies
whose capital is less than the regulatory required capital
and the total amount of shortfall in their capital:
Not applicable
Remarks on Computation of the Consolidated Capital Adequacy Ratio
Foundation Internal Ratings-Based Approach (F-IRB))”
and “The Standardized Approach (TSA)” for calculating
operational risk capital charges.
The disclosure requirements for the Bank are provided
in Notification No. 6 of the 2007 Financial Services
Agency and the Ministry of Agriculture, Forestry and
Fisheries of Japan entitled “Disclosure Items Related to
Capital Adequacy of The Norinchukin Bank” (hereinafter,
“Disclosure Notification”). These disclosures as well as
the features of regulatory capital instruments can be found
in the IR Library of the Bank’s website at https://www.
nochubank.or.jp/.
Disclosure Regarding Capital Adequacy
and Features of Regulatory Capital
Instruments
The Bank calculates its capital adequacy ratio based on
the formula contained in Notification No. 4 of the 2006
Financial Services Agency and the Ministry of Agriculture,
Forestry and Fisheries of Japan entitled “Standards for
Judging the Soundness of Management of The Norinchukin
Bank” (hereinafter, “Notification Regarding Capital
Adequacy Ratio”). In addition, to calculate risk-weighted
assets for credit risk, the Bank has adopted the “Advanced
Internal Ratings-Based Approach (A-IRB) (partially the
CAPITAL ADEQUACY
40INTERIM REPORT 2019 The Norinchukin Bank
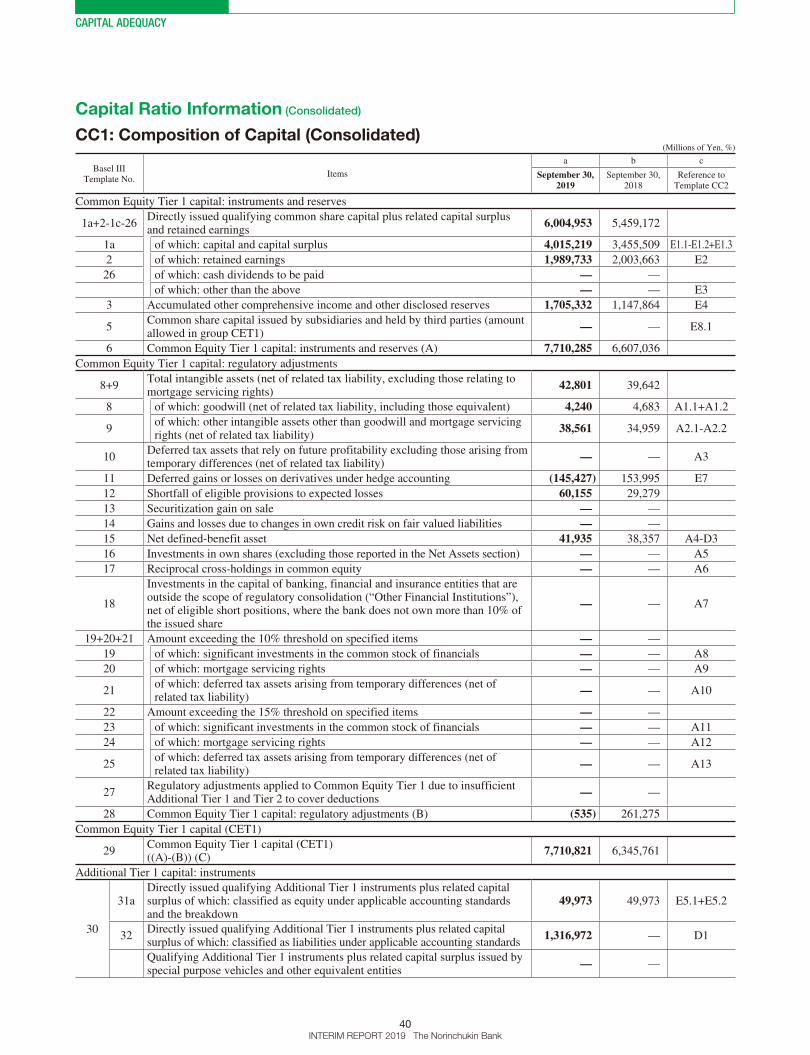
Capital Ratio Information (Consolidated)
CC1: Composition of Capital (Consolidated)(Millions of Yen, %)
Basel III Template No.
Items
a b c
September 30, 2019
September 30, 2018
Reference to Template CC2
Common Equity Tier 1 capital: instruments and reserves
1a+2-1c-26Directly issued qualifying common share capital plus related capital surplus and retained earnings
6,004,953 5,459,172
1a of which: capital and capital surplus 4,015,219 3,455,509 E1.1-E1.2+E1.3
2 of which: retained earnings 1,989,733 2,003,663 E2
26 of which: cash dividends to be paid — —
of which: other than the above — — E3
3 Accumulated other comprehensive income and other disclosed reserves 1,705,332 1,147,864 E4
5Common share capital issued by subsidiaries and held by third parties (amount allowed in group CET1)
— — E8.1
6 Common Equity Tier 1 capital: instruments and reserves (A) 7,710,285 6,607,036
Common Equity Tier 1 capital: regulatory adjustments
8+9Total intangible assets (net of related tax liability, excluding those relating to mortgage servicing rights)
42,801 39,642
8 of which: goodwill (net of related tax liability, including those equivalent) 4,240 4,683 A1.1+A1.2
9of which: other intangible assets other than goodwill and mortgage servicing rights (net of related tax liability)
38,561 34,959 A2.1-A2.2
10Deferred tax assets that rely on future profitability excluding those arising from temporary differences (net of related tax liability)
— — A3
11 Deferred gains or losses on derivatives under hedge accounting (145,427) 153,995 E7
12 Shortfall of eligible provisions to expected losses 60,155 29,279
13 Securitization gain on sale — —
14 Gains and losses due to changes in own credit risk on fair valued liabilities — —
15 Net defined-benefit asset 41,935 38,357 A4-D3
16 Investments in own shares (excluding those reported in the Net Assets section) — — A5
17 Reciprocal cross-holdings in common equity — — A6
18
Investments in the capital of banking, financial and insurance entities that are outside the scope of regulatory consolidation (“Other Financial Institutions”), net of eligible short positions, where the bank does not own more than 10% of the issued share
— — A7
19+20+21 Amount exceeding the 10% threshold on specified items — —
19 of which: significant investments in the common stock of financials — — A8
20 of which: mortgage servicing rights — — A9
21of which: deferred tax assets arising from temporary differences (net of related tax liability)
— — A10
22 Amount exceeding the 15% threshold on specified items — —
23 of which: significant investments in the common stock of financials — — A11
24 of which: mortgage servicing rights — — A12
25of which: deferred tax assets arising from temporary differences (net of related tax liability)
— — A13
27Regulatory adjustments applied to Common Equity Tier 1 due to insufficient Additional Tier 1 and Tier 2 to cover deductions
— —
28 Common Equity Tier 1 capital: regulatory adjustments (B) (535) 261,275
Common Equity Tier 1 capital (CET1)
29Common Equity Tier 1 capital (CET1)((A)-(B)) (C)
7,710,821 6,345,761
Additional Tier 1 capital: instruments
30
31aDirectly issued qualifying Additional Tier 1 instruments plus related capital surplus of which: classified as equity under applicable accounting standards and the breakdown
49,973 49,973 E5.1+E5.2
32Directly issued qualifying Additional Tier 1 instruments plus related capital surplus of which: classified as liabilities under applicable accounting standards
1,316,972 — D1
Qualifying Additional Tier 1 instruments plus related capital surplus issued by special purpose vehicles and other equivalent entities
— —
CAPITAL ADEQUACY
41INTERIM REPORT 2019 The Norinchukin Bank
(Millions of Yen, %)
Basel III Template No.
Items
a b c
September 30, 2019
September 30, 2018
Reference to Template CC2
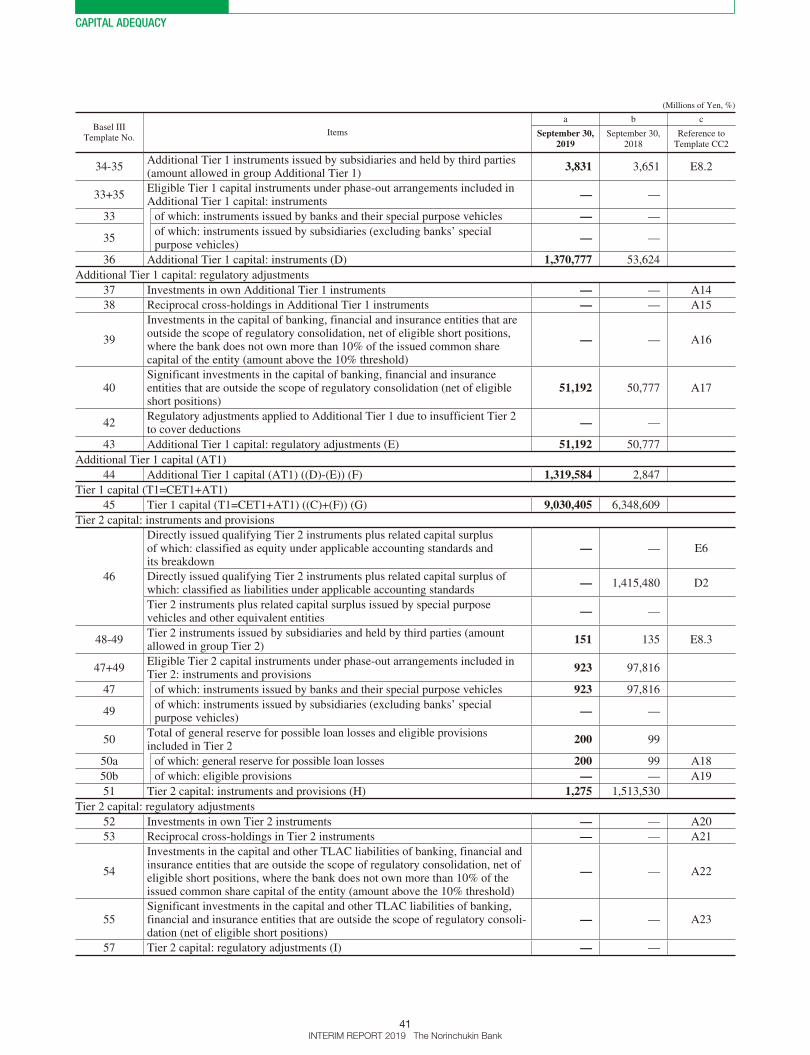
34-35Additional Tier 1 instruments issued by subsidiaries and held by third parties (amount allowed in group Additional Tier 1)
3,831 3,651 E8.2
33+35Eligible Tier 1 capital instruments under phase-out arrangements included in Additional Tier 1 capital: instruments
— —
33 of which: instruments issued by banks and their special purpose vehicles — —
35of which: instruments issued by subsidiaries (excluding banks’ special purpose vehicles)
— —
36 Additional Tier 1 capital: instruments (D) 1,370,777 53,624
Additional Tier 1 capital: regulatory adjustments
37 Investments in own Additional Tier 1 instruments — — A14
38 Reciprocal cross-holdings in Additional Tier 1 instruments — — A15
39
Investments in the capital of banking, financial and insurance entities that are outside the scope of regulatory consolidation, net of eligible short positions, where the bank does not own more than 10% of the issued common share capital of the entity (amount above the 10% threshold)
— — A16
40Significant investments in the capital of banking, financial and insurance entities that are outside the scope of regulatory consolidation (net of eligible short positions)
51,192 50,777 A17
42Regulatory adjustments applied to Additional Tier 1 due to insufficient Tier 2 to cover deductions
— —
43 Additional Tier 1 capital: regulatory adjustments (E) 51,192 50,777
Additional Tier 1 capital (AT1)
44 Additional Tier 1 capital (AT1) ((D)-(E)) (F) 1,319,584 2,847
Tier 1 capital (T1=CET1+AT1)
45 Tier 1 capital (T1=CET1+AT1) ((C)+(F)) (G) 9,030,405 6,348,609
Tier 2 capital: instruments and provisions
46
Directly issued qualifying Tier 2 instruments plus related capital surplus of which: classified as equity under applicable accounting standards and its breakdown
— — E6
Directly issued qualifying Tier 2 instruments plus related capital surplus of which: classified as liabilities under applicable accounting standards
— 1,415,480 D2
Tier 2 instruments plus related capital surplus issued by special purpose vehicles and other equivalent entities
— —
48-49Tier 2 instruments issued by subsidiaries and held by third parties (amount allowed in group Tier 2)
151 135 E8.3
47+49Eligible Tier 2 capital instruments under phase-out arrangements included in Tier 2: instruments and provisions
923 97,816
47 of which: instruments issued by banks and their special purpose vehicles 923 97,816
49of which: instruments issued by subsidiaries (excluding banks’ special purpose vehicles)
— —
50Total of general reserve for possible loan losses and eligible provisions included in Tier 2
200 99
50a of which: general reserve for possible loan losses 200 99 A18
50b of which: eligible provisions — — A19
51 Tier 2 capital: instruments and provisions (H) 1,275 1,513,530
Tier 2 capital: regulatory adjustments
52 Investments in own Tier 2 instruments — — A20
53 Reciprocal cross-holdings in Tier 2 instruments — — A21
54
Investments in the capital and other TLAC liabilities of banking, financial and insurance entities that are outside the scope of regulatory consolidation, net of eligible short positions, where the bank does not own more than 10% of the issued common share capital of the entity (amount above the 10% threshold)
— — A22
55Significant investments in the capital and other TLAC liabilities of banking, financial and insurance entities that are outside the scope of regulatory consoli-dation (net of eligible short positions)
— — A23
57 Tier 2 capital: regulatory adjustments (I) — —
CAPITAL ADEQUACY
42INTERIM REPORT 2019 The Norinchukin Bank
(Millions of Yen, %)
Basel III Template No.
Items
a b c
September 30, 2019
September 30, 2018
Reference to Template CC2
Tier 2 capital (T2)
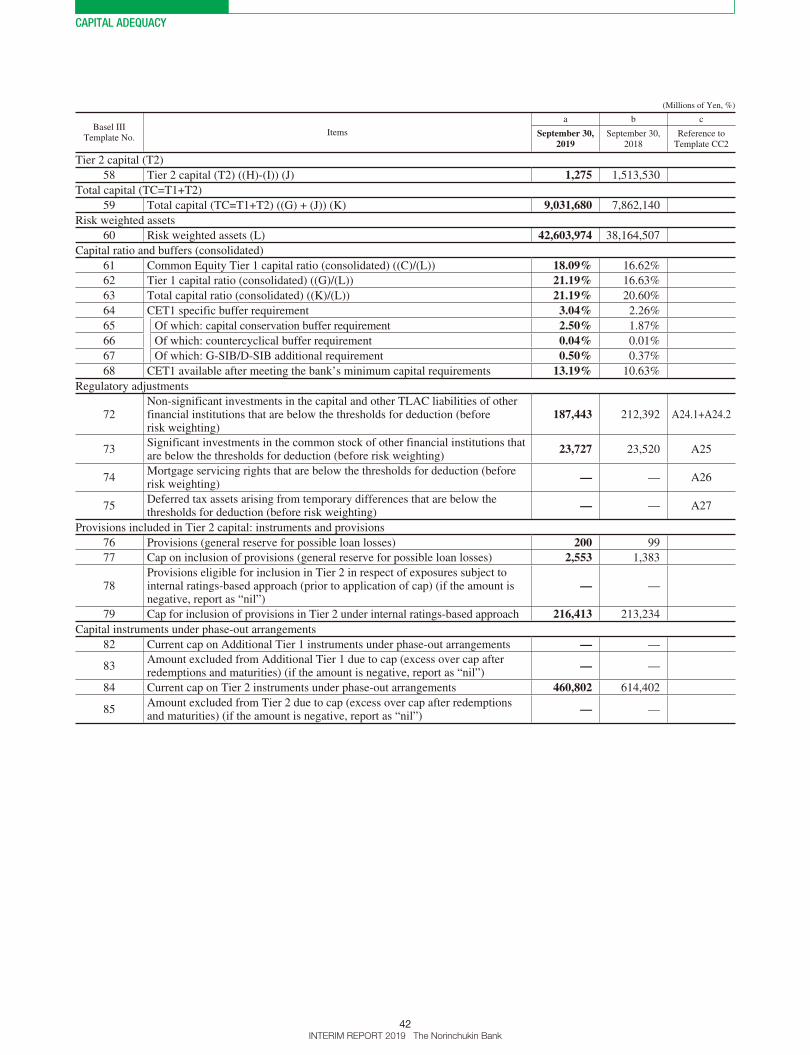
58 Tier 2 capital (T2) ((H)-(I)) (J) 1,275 1,513,530
Total capital (TC=T1+T2)
59 Total capital (TC=T1+T2) ((G) + (J)) (K) 9,031,680 7,862,140
Risk weighted assets
60 Risk weighted assets (L) 42,603,974 38,164,507
Capital ratio and buffers (consolidated)
61 Common Equity Tier 1 capital ratio (consolidated) ((C)/(L)) 18.09% 16.62%
62 Tier 1 capital ratio (consolidated) ((G)/(L)) 21.19% 16.63%
63 Total capital ratio (consolidated) ((K)/(L)) 21.19% 20.60%
64 CET1 specific buffer requirement 3.04% 2.26%
65 Of which: capital conservation buffer requirement 2.50% 1.87%
66 Of which: countercyclical buffer requirement 0.04% 0.01%
67 Of which: G-SIB/D-SIB additional requirement 0.50% 0.37%
68 CET1 available after meeting the bank’s minimum capital requirements 13.19% 10.63%
Regulatory adjustments
72Non-significant investments in the capital and other TLAC liabilities of other financial institutions that are below the thresholds for deduction (before risk weighting)
187,443 212,392 A24.1+A24.2
73Significant investments in the common stock of other financial institutions that are below the thresholds for deduction (before risk weighting)
23,727 23,520 A25
74Mortgage servicing rights that are below the thresholds for deduction (before risk weighting)
— — A26
75Deferred tax assets arising from temporary differences that are below the thresholds for deduction (before risk weighting)
— — A27
Provisions included in Tier 2 capital: instruments and provisions
76 Provisions (general reserve for possible loan losses) 200 99
77 Cap on inclusion of provisions (general reserve for possible loan losses) 2,553 1,383
78Provisions eligible for inclusion in Tier 2 in respect of exposures subject to internal ratings-based approach (prior to application of cap) (if the amount is negative, report as “nil”)
— —
79 Cap for inclusion of provisions in Tier 2 under internal ratings-based approach 216,413 213,234
Capital instruments under phase-out arrangements
82 Current cap on Additional Tier 1 instruments under phase-out arrangements — —
83Amount excluded from Additional Tier 1 due to cap (excess over cap after redemptions and maturities) (if the amount is negative, report as “nil”)
— —
84 Current cap on Tier 2 instruments under phase-out arrangements 460,802 614,402
85Amount excluded from Tier 2 due to cap (excess over cap after redemptions and maturities) (if the amount is negative, report as “nil”)
— —
CAPITAL ADEQUACY
43INTERIM REPORT 2019 The Norinchukin Bank
(Millions of Yen)
Items
a b c
Consolidated balance sheet
amount
Consolidated balance sheet
amounts based on regulatory scope of consolidation
Reference numbers or symbols for referring to
Template CC1
(Assets)
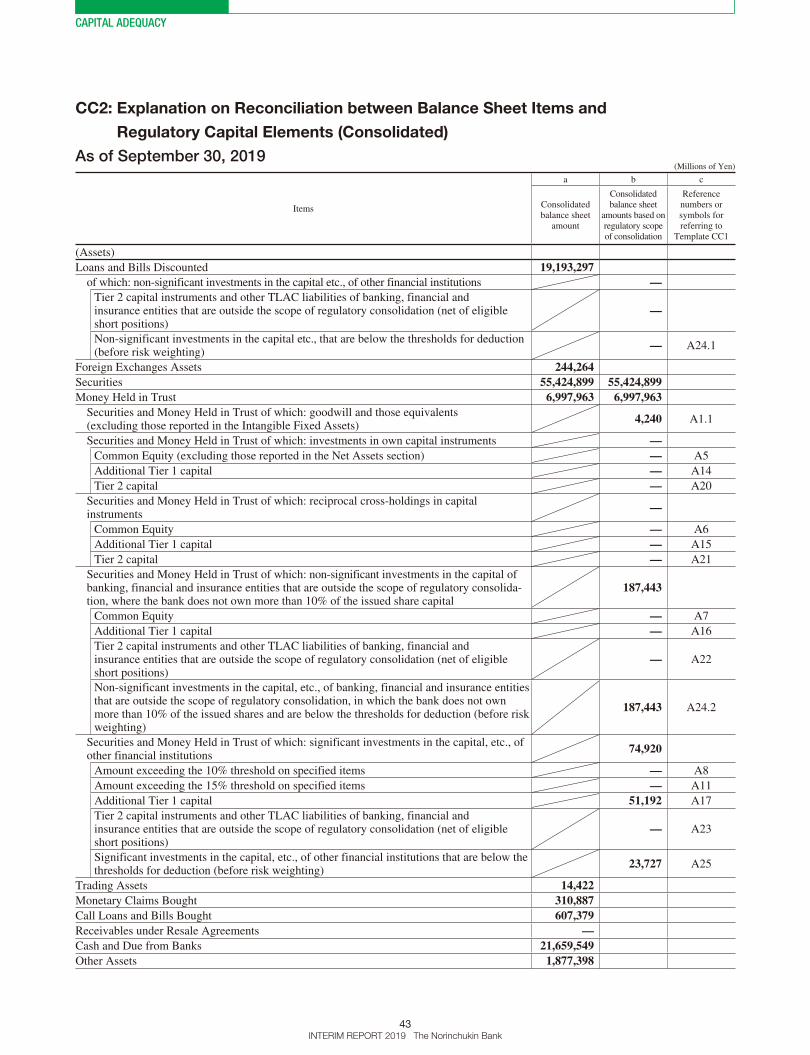
Loans and Bills Discounted 19,193,297of which: non-significant investments in the capital etc., of other financial institutions —
Tier 2 capital instruments and other TLAC liabilities of banking, financial and insurance entities that are outside the scope of regulatory consolidation (net of eligible short positions)
—
Non-significant investments in the capital etc., that are below the thresholds for deduction (before risk weighting)
— A24.1
Foreign Exchanges Assets 244,264Securities 55,424,899 55,424,899Money Held in Trust 6,997,963 6,997,963
Securities and Money Held in Trust of which: goodwill and those equivalents (excluding those reported in the Intangible Fixed Assets)
4,240 A1.1
Securities and Money Held in Trust of which: investments in own capital instruments —Common Equity (excluding those reported in the Net Assets section) — A5
Additional Tier 1 capital — A14
Tier 2 capital — A20
Securities and Money Held in Trust of which: reciprocal cross-holdings in capital instruments
—
Common Equity — A6
Additional Tier 1 capital — A15
Tier 2 capital — A21
Securities and Money Held in Trust of which: non-significant investments in the capital of banking, financial and insurance entities that are outside the scope of regulatory consolida-tion, where the bank does not own more than 10% of the issued share capital
187,443
Common Equity — A7
Additional Tier 1 capital — A16
Tier 2 capital instruments and other TLAC liabilities of banking, financial and insurance entities that are outside the scope of regulatory consolidation (net of eligible short positions)
— A22
Non-significant investments in the capital, etc., of banking, financial and insurance entities that are outside the scope of regulatory consolidation, in which the bank does not own more than 10% of the issued shares and are below the thresholds for deduction (before risk weighting)
187,443 A24.2
Securities and Money Held in Trust of which: significant investments in the capital, etc., of other financial institutions
74,920
Amount exceeding the 10% threshold on specified items — A8
Amount exceeding the 15% threshold on specified items — A11
Additional Tier 1 capital 51,192 A17
Tier 2 capital instruments and other TLAC liabilities of banking, financial and insurance entities that are outside the scope of regulatory consolidation (net of eligible short positions)
— A23
Significant investments in the capital, etc., of other financial institutions that are below the thresholds for deduction (before risk weighting)
23,727 A25
Trading Assets 14,422Monetary Claims Bought 310,887Call Loans and Bills Bought 607,379Receivables under Resale Agreements —Cash and Due from Banks 21,659,549Other Assets 1,877,398
CC2: Explanation on Reconciliation between Balance Sheet Items and
Regulatory Capital Elements (Consolidated)
As of September 30, 2019

CAPITAL ADEQUACY
44INTERIM REPORT 2019 The Norinchukin Bank
(Millions of Yen)
Items
a b c
Consolidated balance sheet
amount
Consolidated balance sheet
amounts based on regulatory scope of consolidation
Reference numbers or symbols for referring to
Template CC1
Tangible Fixed Assets 114,379Intangible Fixed Assets 52,059 52,059
of which: goodwill and those equivalents (excluding those reported in the Net Assets section)
— A1.2
of which: other intangible assets other than goodwill and mortgage servicing rights 52,059 A2.1
of which: amount that corresponds to effective tax rate to other intangible assets other than goodwill and mortgage servicing rights
13,498 A2.2
of which: mortgage servicing rights (net of related deferred tax liabilities) —Amount exceeding the 10% threshold on specified items — A9
Amount exceeding the 15% threshold on specified items — A12
Amount below the thresholds for deduction (before risk weighting) — A26
Amounts of assets related to retirement benefits 58,042 58,042 A4
Deferred Tax Assets 2,180 2,180of which: deferred tax assets that rely on future profitability excluding those arising from temporary differences (net of related deferred tax liabilities)
— A3
of which: deferred tax assets arising from temporary differences —Amount exceeding the 10% threshold on specified items — A10
Amount exceeding the 15% threshold on specified items — A13
Amount below the thresholds for deduction (before risk weighting) — A27
Customers’ Liabilities for Acceptances and Guarantees 1,890,578Reserve for Possible Loan Losses (48,953) (48,953)
of which: general reserve for possible loan losses includes Tier 2 (200) A18
of which: eligible provisions includes Tier 2 — A19
Reserve for Possible Investment Losses (130)Total Assets 108,398,217(Liabilities)
Deposits 66,115,817Negotiable Certificates of Deposit 2,631,483Debentures 1,007,792Trading liabilities 8,935Borrowed Money 4,963,385 4,963,385
of which: qualifying Additional Tier 1 instruments 1,316,972 D1
of which: qualifying Tier 2 instruments — D2
Payables under Repurchase Agreements 15,617,369Foreign Exchanges Liabilities 0Trust Money 2,166,311Other Liabilities 5,521,773Reserve for Bonus Payments 7,542Liability Related to Retirement Benefits 37,877Reserve for Directors’ Retirement Benefits 1,231Deferred Tax Liabilities 648,809 648,809
of which: assets related to retirement benefits 16,106 D3
Deferred Tax Liabilities for Land Revaluation 8,607 8,607Acceptances and Guarantees 1,890,578Total Liabilities 100,627,515(Net Assets)
Paid-in Capital 4,040,198 4,040,198 E1.1
of which: preferred stock 24,999 E1.2
of which: directly issued qualifying Additional Tier 1 instruments plus related capital surplus of which classified as equity under applicable accounting standards
24,999 E5.1
Capital Surplus 24,993 24,993of which: other capital surplus 20 E1.3
of which: directly issued qualifying Additional Tier 1 instruments plus related capital surplus of which classified as equity under applicable accounting standards
24,973 E5.2
CAPITAL ADEQUACY
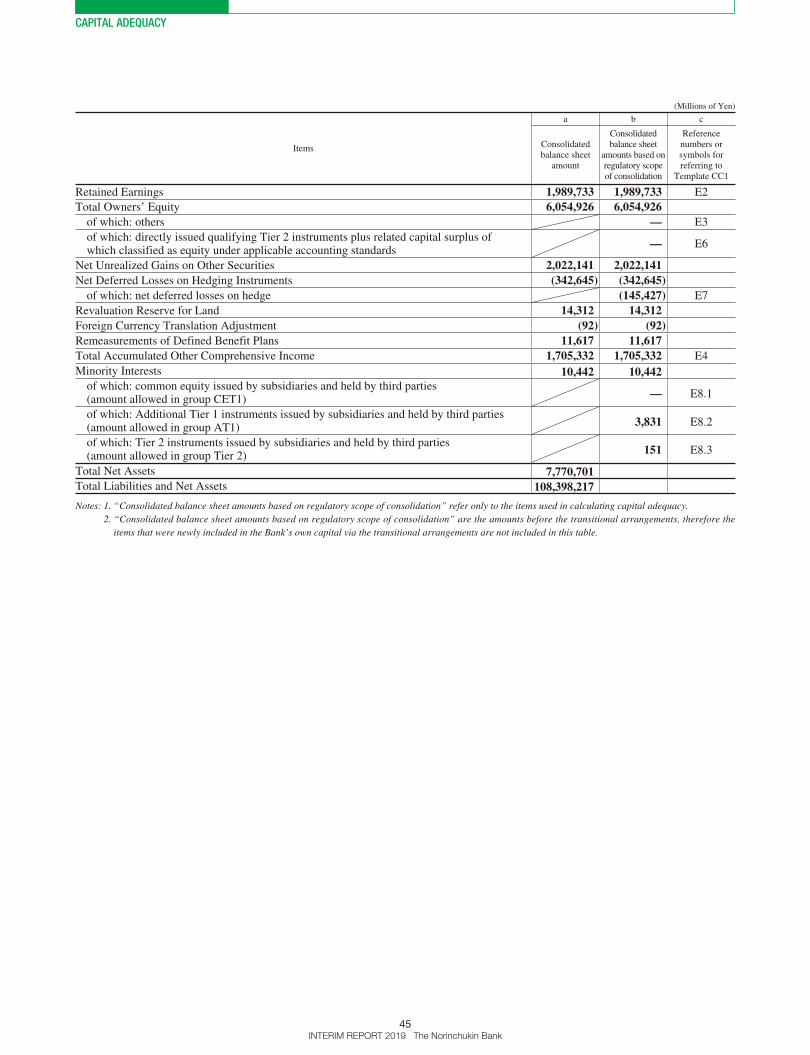
45INTERIM REPORT 2019 The Norinchukin Bank
(Millions of Yen)
Items
a b c
Consolidated balance sheet
amount
Consolidated balance sheet
amounts based on regulatory scope of consolidation
Reference numbers or symbols for referring to
Template CC1
Retained Earnings 1,989,733 1,989,733 E2
Total Owners’ Equity 6,054,926 6,054,926of which: others — E3
of which: directly issued qualifying Tier 2 instruments plus related capital surplus of which classified as equity under applicable accounting standards
— E6
Net Unrealized Gains on Other Securities 2,022,141 2,022,141Net Deferred Losses on Hedging Instruments (342,645) (342,645)
of which: net deferred losses on hedge (145,427) E7
Revaluation Reserve for Land 14,312 14,312Foreign Currency Translation Adjustment (92) (92)Remeasurements of Defined Benefit Plans 11,617 11,617Total Accumulated Other Comprehensive Income 1,705,332 1,705,332 E4
Minority Interests 10,442 10,442of which: common equity issued by subsidiaries and held by third parties (amount allowed in group CET1) — E8.1
of which: Additional Tier 1 instruments issued by subsidiaries and held by third parties (amount allowed in group AT1) 3,831 E8.2
of which: Tier 2 instruments issued by subsidiaries and held by third parties (amount allowed in group Tier 2)
151 E8.3
Total Net Assets 7,770,701Total Liabilities and Net Assets 108,398,217
Notes: 1. “Consolidated balance sheet amounts based on regulatory scope of consolidation” refer only to the items used in calculating capital adequacy. 2. “Consolidated balance sheet amounts based on regulatory scope of consolidation” are the amounts before the transitional arrangements, therefore the
items that were newly included in the Bank’s own capital via the transitional arrangements are not included in this table.

CAPITAL ADEQUACY
46INTERIM REPORT 2019 The Norinchukin Bank
(Millions of Yen)
ItemsConsolidated balance sheet
amount
Consolidated balance sheet
amounts based on regulatory scope of consolidation
Reference numbers or symbols for referring to
Template CC1
(Assets)
Loans and Bills Discounted 13,943,442
of which: non-significant investments in the capital instruments of other financial institutions —
Tier 2 capital instruments —
Non-significant investments in the capital of other financials that are below the thresholds for deduction (before risk weighting)
— A24.1
Foreign Exchanges Assets 228,485
Securities 53,987,491 53,987,491
Money Held in Trust 8,736,957 8,736,957
Securities and Money Held in Trust of which: goodwill and those equivalents (excluding those reported in the Intangible Fixed Assets)
4,683 A1.1
Securities and Money Held in Trust of which: investments in own capital instruments —
Common Equity (excluding those reported in the Net Assets section) — A5
Additional Tier 1 capital — A14
Tier 2 capital — A20
Securities and Money Held in Trust of which: reciprocal cross-holdings in capital instruments
—
Common Equity — A6
Additional Tier 1 capital — A15
Tier 2 capital — A21
Securities and Money Held in Trust of which: investments in the capital of banking, financial and insurance entities that are outside the scope of regulatory consolidation, where the bank does not own more than 10% of the issued share capital
212,392
Common Equity — A7
Additional Tier 1 capital — A16
Tier 2 capital — A22
Non-significant investments in the capital of other financials that are below the thresholds for deduction (before risk weighting)
212,392 A24.2
Securities and Money Held in Trust of which: significant investments in the capital of bank-ing, financial and insurance entities that are outside the scope of regulatory consolidation (net of eligible short positions)
74,297
Amount exceeding the 10% threshold on specified items — A8
Amount exceeding the 15% threshold on specified items — A11
Additional Tier 1 capital 50,777 A17
Tier 2 capital — A23
Significant investments in the common stock of financials that are below the thresholds for deduction (before risk weighting)
23,520 A25
Trading Assets 7,491
Monetary Claims Bought 315,805
Call Loans and Bills Bought 1,075,000
Receivables under Resale Agreements 37,200
Cash and Due from Banks 26,322,933
Other Assets 1,629,477
Tangible Fixed Assets 119,650
Intangible Fixed Assets 47,147 47,147
of which: goodwill and those equivalents (excluding those reported in the Net Assets section)
— A1.2
of which: other intangible assets other than goodwill and mortgage servicing rights 47,147 A2.1
of which: amount that corresponds to effective tax rate to other intangible assets other than goodwill and mortgage servicing rights
12,188 A2.2
of which: mortgage servicing rights (net of related deferred tax liabilities) —
Amount exceeding the 10% threshold on specified items — A9
Amount exceeding the 15% threshold on specified items — A12
Amount below the thresholds for deduction (before risk weighting) — A26
Amounts of assets related to retirement benefits 53,089 53,089 A4
As of September 30, 2018
CAPITAL ADEQUACY
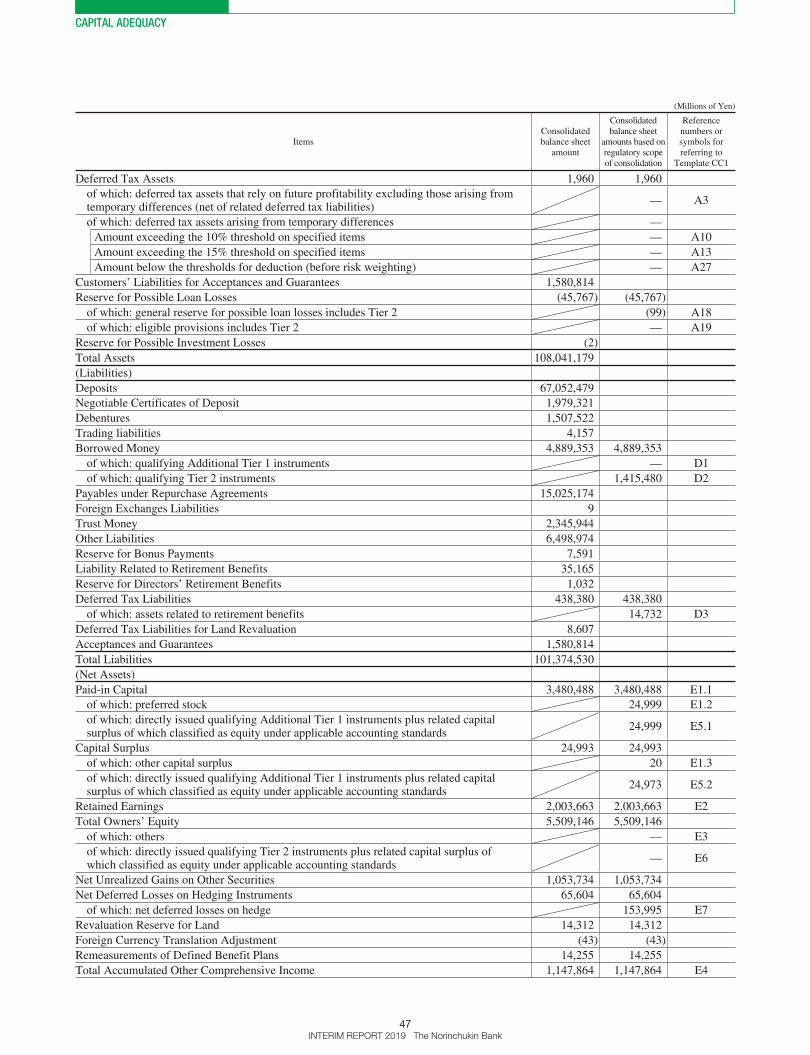
47INTERIM REPORT 2019 The Norinchukin Bank
(Millions of Yen)
ItemsConsolidated balance sheet
amount
Consolidated balance sheet
amounts based on regulatory scope of consolidation
Reference numbers or symbols for referring to
Template CC1
Deferred Tax Assets 1,960 1,960
of which: deferred tax assets that rely on future profitability excluding those arising from temporary differences (net of related deferred tax liabilities)
— A3
of which: deferred tax assets arising from temporary differences —
Amount exceeding the 10% threshold on specified items — A10
Amount exceeding the 15% threshold on specified items — A13
Amount below the thresholds for deduction (before risk weighting) — A27
Customers’ Liabilities for Acceptances and Guarantees 1,580,814
Reserve for Possible Loan Losses (45,767) (45,767)
of which: general reserve for possible loan losses includes Tier 2 (99) A18
of which: eligible provisions includes Tier 2 — A19
Reserve for Possible Investment Losses (2)
Total Assets 108,041,179
(Liabilities)
Deposits 67,052,479
Negotiable Certificates of Deposit 1,979,321
Debentures 1,507,522
Trading liabilities 4,157
Borrowed Money 4,889,353 4,889,353
of which: qualifying Additional Tier 1 instruments — D1
of which: qualifying Tier 2 instruments 1,415,480 D2
Payables under Repurchase Agreements 15,025,174
Foreign Exchanges Liabilities 9
Trust Money 2,345,944
Other Liabilities 6,498,974
Reserve for Bonus Payments 7,591
Liability Related to Retirement Benefits 35,165
Reserve for Directors’ Retirement Benefits 1,032
Deferred Tax Liabilities 438,380 438,380
of which: assets related to retirement benefits 14,732 D3
Deferred Tax Liabilities for Land Revaluation 8,607
Acceptances and Guarantees 1,580,814
Total Liabilities 101,374,530
(Net Assets)
Paid-in Capital 3,480,488 3,480,488 E1.1
of which: preferred stock 24,999 E1.2
of which: directly issued qualifying Additional Tier 1 instruments plus related capital surplus of which classified as equity under applicable accounting standards
24,999 E5.1
Capital Surplus 24,993 24,993
of which: other capital surplus 20 E1.3
of which: directly issued qualifying Additional Tier 1 instruments plus related capital surplus of which classified as equity under applicable accounting standards
24,973 E5.2
Retained Earnings 2,003,663 2,003,663 E2
Total Owners’ Equity 5,509,146 5,509,146
of which: others — E3
of which: directly issued qualifying Tier 2 instruments plus related capital surplus of which classified as equity under applicable accounting standards
— E6
Net Unrealized Gains on Other Securities 1,053,734 1,053,734
Net Deferred Losses on Hedging Instruments 65,604 65,604
of which: net deferred losses on hedge 153,995 E7
Revaluation Reserve for Land 14,312 14,312
Foreign Currency Translation Adjustment (43) (43)
Remeasurements of Defined Benefit Plans 14,255 14,255
Total Accumulated Other Comprehensive Income 1,147,864 1,147,864 E4

CAPITAL ADEQUACY
48INTERIM REPORT 2019 The Norinchukin Bank
(Millions of Yen)
ItemsConsolidated balance sheet
amount
Consolidated balance sheet
amounts based on regulatory scope of consolidation
Reference numbers or symbols for referring to
Template CC1
Minority Interests 9,638 9,638of which: common equity issued by subsidiaries and held by third parties (amount allowed in group CET1) — E8.1
of which: Additional Tier 1 instruments issued by subsidiaries and held by third parties (amount allowed in group AT1) 3,651 E8.2
of which: Tier 2 instruments issued by subsidiaries and held by third parties (amount allowed in group Tier 2)
135 E8.3
Total Net Assets 6,666,648Total Liabilities and Net Assets 108,041,179
Notes: 1. “Consolidated balance sheet amounts based on regulatory scope of consolidation” refer only to the items used in calculating capital adequacy. 2. “Consolidated balance sheet amounts based on regulatory scope of consolidation” are the amounts before the transitional arrangements, therefore the
items that were newly included in the Bank’s own capital via the transitional arrangements are not included in this table.
CAPITAL ADEQUACY
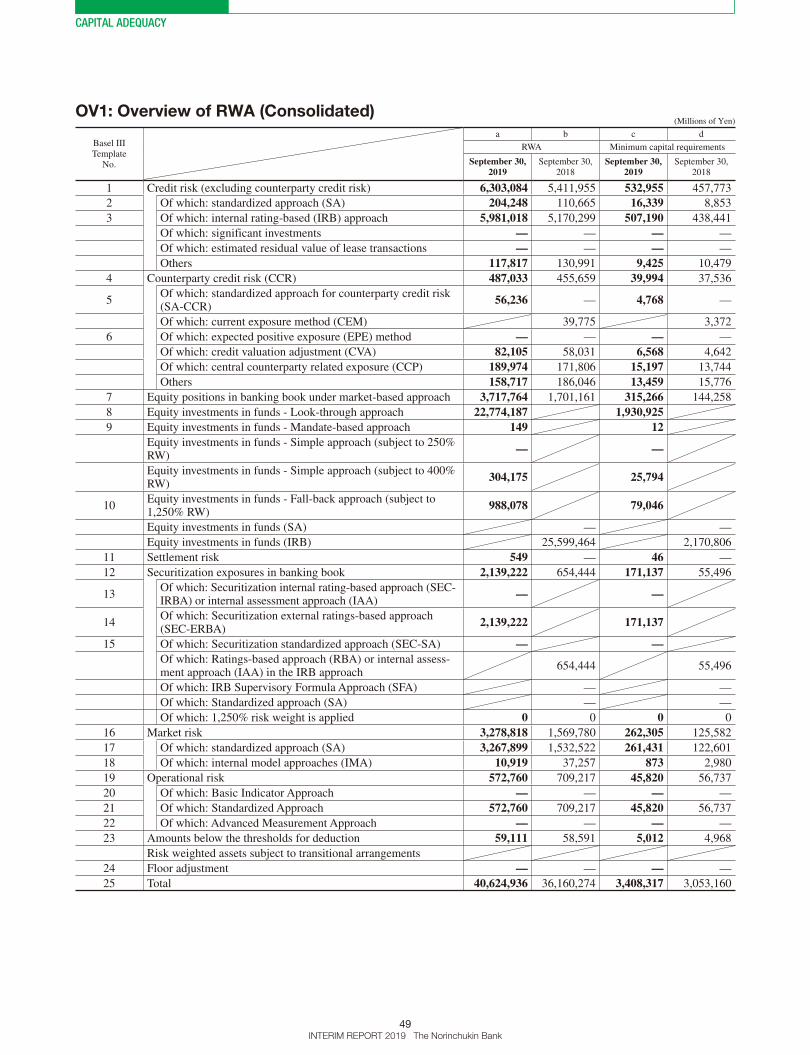
49INTERIM REPORT 2019 The Norinchukin Bank
OV1: Overview of RWA (Consolidated)(Millions of Yen)
Basel IIITemplate
No.
a b c d
RWA Minimum capital requirements
September 30, 2019
September 30, 2018
September 30, 2019
September 30, 2018
1 Credit risk (excluding counterparty credit risk) 6,303,084 5,411,955 532,955 457,773
2 Of which: standardized approach (SA) 204,248 110,665 16,339 8,853
3 Of which: internal rating-based (IRB) approach 5,981,018 5,170,299 507,190 438,441
Of which: significant investments — — — —
Of which: estimated residual value of lease transactions — — — —
Others 117,817 130,991 9,425 10,479
4 Counterparty credit risk (CCR) 487,033 455,659 39,994 37,536
5Of which: standardized approach for counterparty credit risk (SA-CCR)
56,236 — 4,768 —
Of which: current exposure method (CEM) 39,775 3,372
6 Of which: expected positive exposure (EPE) method — — — —
Of which: credit valuation adjustment (CVA) 82,105 58,031 6,568 4,642
Of which: central counterparty related exposure (CCP) 189,974 171,806 15,197 13,744
Others 158,717 186,046 13,459 15,776
7 Equity positions in banking book under market-based approach 3,717,764 1,701,161 315,266 144,258
8 Equity investments in funds - Look-through approach 22,774,187 1,930,925 9 Equity investments in funds - Mandate-based approach 149 12
Equity investments in funds - Simple approach (subject to 250% RW)
— —
Equity investments in funds - Simple approach (subject to 400% RW)
304,175 25,794
10Equity investments in funds - Fall-back approach (subject to 1,250% RW)
988,078 79,046
Equity investments in funds (SA) — —
Equity investments in funds (IRB) 25,599,464 2,170,806
11 Settlement risk 549 — 46 —
12 Securitization exposures in banking book 2,139,222 654,444 171,137 55,496
13Of which: Securitization internal rating-based approach (SEC-IRBA) or internal assessment approach (IAA)
— —
14Of which: Securitization external ratings-based approach (SEC-ERBA)
2,139,222 171,137
15 Of which: Securitization standardized approach (SEC-SA) — —Of which: Ratings-based approach (RBA) or internal assess-ment approach (IAA) in the IRB approach
654,444 55,496
Of which: IRB Supervisory Formula Approach (SFA) — —
Of which: Standardized approach (SA) — —
Of which: 1,250% risk weight is applied 0 0 0 0
16 Market risk 3,278,818 1,569,780 262,305 125,582
17 Of which: standardized approach (SA) 3,267,899 1,532,522 261,431 122,601
18 Of which: internal model approaches (IMA) 10,919 37,257 873 2,980
19 Operational risk 572,760 709,217 45,820 56,737
20 Of which: Basic Indicator Approach — — — —
21 Of which: Standardized Approach 572,760 709,217 45,820 56,737
22 Of which: Advanced Measurement Approach — — — —
23 Amounts below the thresholds for deduction 59,111 58,591 5,012 4,968
Risk weighted assets subject to transitional arrangements
24 Floor adjustment — — — —
25 Total 40,624,936 36,160,274 3,408,317 3,053,160

CAPITAL ADEQUACY
50INTERIM REPORT 2019 The Norinchukin Bank
CR1: Credit quality of assets
For the Six Months Ended September 30, 2019 (Millions of Yen)
No.
a b c d
Gross carrying values ofAllowances/impairments
Net values (a+b-c)Defaulted
exposuresNon-defaulted
exposures
On-balance sheet assets
1 Loans 43,221 18,921,718 45,464 18,919,475 2 Debt Securities — 30,012,543 — 30,012,543 3 Off-balance sheet exposures 21 22,684,156 35 22,684,143 4 Total on-balance sheet assets (1+2+3) 43,242 71,618,419 45,499 71,616,162
Off-balance sheet assets
5 Acceptances and Guarantees 1,724 1,888,853 1,850 1,888,727 6 Commitments 900 1,407,962 158 1,408,703 7 Total off-balance sheet assets (5+6) 2,624 3,296,815 2,009 3,297,431
Total
8 Total (4+7) 45,867 74,915,235 47,508 74,913,594
Note: Default exposure is classified in the Bank’s self-assessment as being under “Debtor Under Requirement of Control.”
For the Six Months Ended September 30, 2018 (Millions of Yen)
No.
a b c d
Gross carrying values ofAllowances/impairments
Net values (a+b-c)Defaulted
exposuresNon-defaulted
exposures
On-balance sheet assets
1 Loans 38,824 13,721,644 42,148 13,718,320
2 Debt Securities — 29,748,393 — 29,748,393
3 Off-balance sheet exposures 17 27,852,633 42 27,852,608
4 Total on-balance sheet assets (1+2+3) 38,841 71,322,671 42,191 71,319,321
Off-balance sheet assets
5 Acceptances and Guarantees 1,517 1,579,179 1,490 1,579,206
6 Commitments — 1,100,302 229 1,100,072
7 Total off-balance sheet assets (5+6) 1,517 2,679,481 1,719 2,679,279
Total
8 Total (4+7) 40,359 74,002,152 43,911 73,998,600
Note: Default exposure is classified in the Bank’s self-assessment as being under “Debtor Under Requirement of Control.”
CR2: Changes in stock of defaulted loans and debt securities (Millions of Yen)
No.For the Six Months Ended
September 30, 2019For the Six Months Ended
September 30, 2018
1 Defaulted loans and debt securities at end of the previous reporting period 37,668 40,004
2
Changes in the amounts of per factor during the reporting period
Default 23,225 18,388
3 Returned to non-defaulted status 688 232
4 Amounts written off 24 1,639
5Other changes (Decrease in the balance due to a recovery of exposure mainly at default)
(16,937) (17,679)
6 Defaulted loans and debt securities at end of the reporting period (1+2-3-4+5) 43,242 38,841

CAPITAL ADEQUACY
51INTERIM REPORT 2019 The Norinchukin Bank
CR3: Credit risk mitigation techniques – overview
For the Six Months Ended September 30, 2019 (Millions of Yen)
No.
a b c d e
Exposures unsecured
Exposures totally secured
Exposures secured by collateral, of which:
secured amount
Exposures secured by financial
guarantees, of which: secured
amount
Exposures secured by credit
derivatives, of which: secured
amount
1 Loans 18,408,452 511,023 421,841 520,824 —2 Debt securities 29,096,380 916,163 — 916,163 —3 Other on-balance sheet assets 22,681,715 2,427 592 2,712 —4 Total 70,186,547 1,429,615 422,433 1,439,701 —5 Of which defaulted 41,057 2,184 5,820 — —
For the Six Months Ended September 30, 2018 (Millions of Yen)
No.
a b c d e
Exposures unsecured
Exposures totally secured
Exposures secured by collateral, of which:
secured amount
Exposures secured by financial
guarantees, of which: secured
amount
Exposures secured by credit
derivatives, of which: secured
amount
1 Loans 13,273,382 444,937 370,668 451,845 —
2 Debt securities 28,951,075 797,317 — 797,317 —
3 Other on-balance sheet assets 27,850,292 2,315 543 2,521 —
4 Total 70,074,751 1,244,570 371,212 1,251,685 —
5 Of which defaulted 36,557 2,284 6,188 — —

CAPITAL ADEQUACY
52INTERIM REPORT 2019 The Norinchukin Bank
CR4: Standardized approach – credit risk exposure and Credit Risk Mitigation
(CRM) effects
For the Six Months Ended September 30, 2019 (Millions of Yen, %)
No.
a b c d e f
Exposures before CCF and CRM
Exposures post-CCF and CRM
RWA RWA density
Asset classesOn-balance
sheet amountOff-balance
sheet amountOn-balance
sheet amountOff-balance
sheet amount
1 Cash — — — — — —2 Japanese government and the Bank of Japan — — — — — —3 Foreign central government and their central banks — — — — — —4 Bank for International Settlements — — — — — —5 Japanese regional municipal bodies — — — — — —6 Non-central government public sector entities — — — — — —7 Multilateral Development Bank — — — — — —8 Japan Finance Organization for Municipalities — — — — — —9 Japanese government institutions — — — — — —10 Regional third-sector company — — — — — —11 Banks and securities firms — — — — — —12 Corporates — — — — — —13 SMEs and individuals — — — — — —14 Residential Mortgage — — — — — —
15Exposures to corporates, SMEs and individuals (acquisition of real estate)
— — — — — —
16Loans with principal or interest payments three months or more in arrears (excluding residential mortgage)
— — — — — —
17Extension of three months or more in mortgage loan terms
— — — — — —
18 Bills in process of collection — — — — — —19 Guarantee by Credit Guarantee Corporations — — — — — —
20Guarantee by Regional Economy Vitalization Corporation of Japan (REVIC)
— — — — — —
21 Investment (excluding important investment) — — — — — —22 Total — — — — — —
Notes: 1. Assets subject to the Standardized Approach are a) the on-balance and off-balance sheet assets of the Bank’s consolidated subsidiaries, with the exception of IRB approach-applied subsidiaries and b) the suspense payments and prepaid expenses on the consolidated balance sheet of the Bank and IRB approach-applied subsidiaries.
2. The total of the credit risk assets subject to the Standardized Approach (above a+b) is ¥204.2 billion, which is not shown in these statements due to its extremely limited amount—only about 0.52% of the credit risk assets on a consolidated basis (¥38,752.3 billion).

CAPITAL ADEQUACY
53INTERIM REPORT 2019 The Norinchukin Bank
For the Six Months Ended September 30, 2018 (Millions of Yen, %)
No.
a b c d e f
Exposures before CCF and CRM
Exposures post-CCF and CRM
RWA RWA density
Asset classesOn-balance
sheet amountOff-balance
sheet amountOn-balance
sheet amountOff-balance
sheet amount
1 Cash — — — — — —
2 Japanese government and the Bank of Japan — — — — — —
3 Foreign central government and their central banks — — — — — —
4 Bank for International Settlements — — — — — —
5 Japanese regional municipal bodies — — — — — —
6 Non-central government public sector entities — — — — — —
7 Multilateral Development Bank — — — — — —
8 Japan Finance Organization for Municipalities — — — — — —
9 Japanese government institutions — — — — — —
10 Regional third-sector company — — — — — —
11 Banks and securities firms — — — — — —
12 Corporates — — — — — —
13 SMEs and individuals — — — — — —
14 Residential Mortgage — — — — — —
15Exposures to corporates, SMEs and individuals (acquisition of real estate)
— — — — — —
16Loans with principal or interest payments three months or more in arrears (excluding residential mortgage)
— — — — — —
17Extension of three months or more in mortgage loan terms
— — — — — —
18 Bills in process of collection — — — — — —
19 Guarantee by Credit Guarantee Corporations — — — — — —
20Guarantee by Regional Economy Vitalization Corporation of Japan (REVIC)
— — — — — —
21 Investment (excluding important investment) — — — — — —
22 Total — — — — — —
Notes: 1. Assets subject to the Standardized Approach are a) the on-balance and off-balance sheet assets of the Bank’s consolidated subsidiaries, with the exception of IRB approach-applied subsidiaries and b) the suspense payments and prepaid expenses on the consolidated balance sheet of the Bank and IRB approach-applied subsidiaries.
2. The total of the credit risk assets subject to the Standardized Approach (above a+b) is ¥110.6 billion, which is not shown in these statements due to its extremely limited amount—only about 0.30% of the credit risk assets on a consolidated basis (¥35,885.5 billion).
CAPITAL ADEQUACY
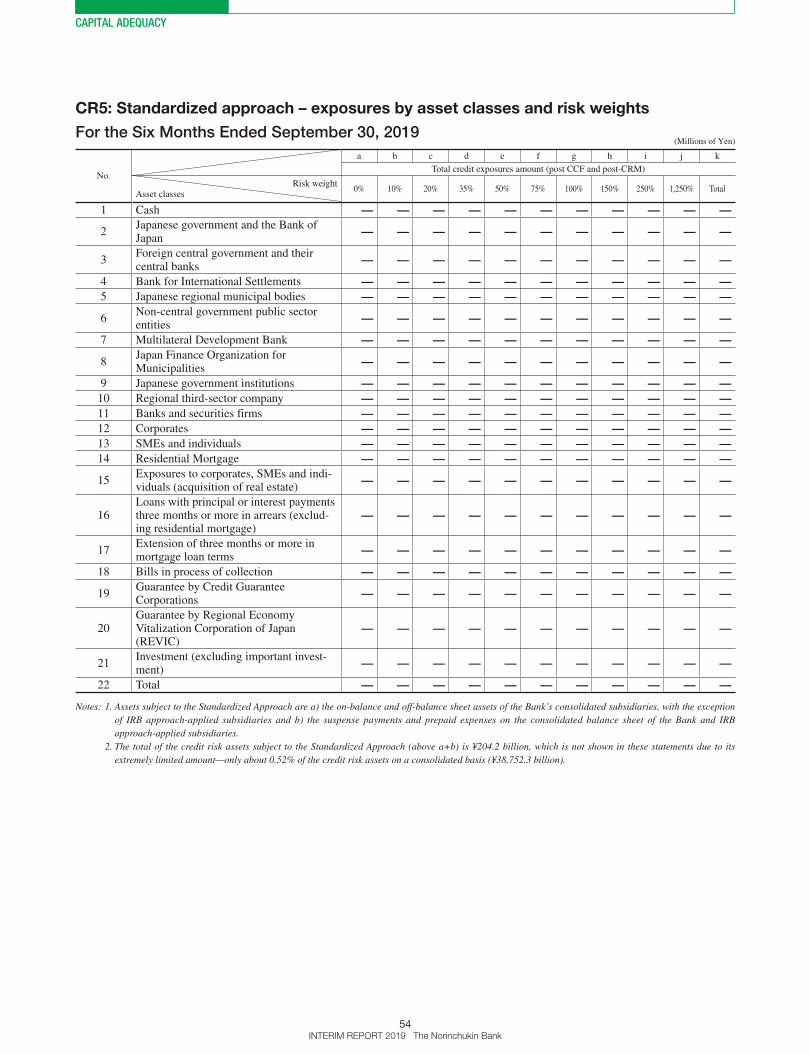
54INTERIM REPORT 2019 The Norinchukin Bank
CR5: Standardized approach – exposures by asset classes and risk weights
For the Six Months Ended September 30, 2019 (Millions of Yen)
No.
a b c d e f g h i j k
Total credit exposures amount (post CCF and post-CRM)
Risk weightAsset classes
0% 10% 20% 35% 50% 75% 100% 150% 250% 1,250% Total
1 Cash — — — — — — — — — — —
2Japanese government and the Bank of Japan
— — — — — — — — — — —
3Foreign central government and their central banks
— — — — — — — — — — —
4 Bank for International Settlements — — — — — — — — — — —5 Japanese regional municipal bodies — — — — — — — — — — —
6Non-central government public sector entities
— — — — — — — — — — —
7 Multilateral Development Bank — — — — — — — — — — —
8Japan Finance Organization for Municipalities
— — — — — — — — — — —
9 Japanese government institutions — — — — — — — — — — —10 Regional third-sector company — — — — — — — — — — —11 Banks and securities firms — — — — — — — — — — —12 Corporates — — — — — — — — — — —13 SMEs and individuals — — — — — — — — — — —14 Residential Mortgage — — — — — — — — — — —
15Exposures to corporates, SMEs and indi-viduals (acquisition of real estate)
— — — — — — — — — — —
16Loans with principal or interest payments three months or more in arrears (exclud-ing residential mortgage)
— — — — — — — — — — —
17Extension of three months or more in mortgage loan terms
— — — — — — — — — — —
18 Bills in process of collection — — — — — — — — — — —
19Guarantee by Credit Guarantee Corporations
— — — — — — — — — — —
20Guarantee by Regional Economy Vitalization Corporation of Japan (REVIC)
— — — — — — — — — — —
21Investment (excluding important invest-ment)
— — — — — — — — — — —
22 Total — — — — — — — — — — —
Notes: 1. Assets subject to the Standardized Approach are a) the on-balance and off-balance sheet assets of the Bank’s consolidated subsidiaries, with the exception of IRB approach-applied subsidiaries and b) the suspense payments and prepaid expenses on the consolidated balance sheet of the Bank and IRB approach-applied subsidiaries.
2. The total of the credit risk assets subject to the Standardized Approach (above a+b) is ¥204.2 billion, which is not shown in these statements due to its extremely limited amount—only about 0.52% of the credit risk assets on a consolidated basis (¥38,752.3 billion).

CAPITAL ADEQUACY
55INTERIM REPORT 2019 The Norinchukin Bank
For the Six Months Ended September 30, 2018 (Millions of Yen)
No.
a b c d e f g h i j k
Total credit exposures amount (post CCF and post-CRM)
Risk weightAsset classes
0% 10% 20% 35% 50% 75% 100% 150% 250% 1,250% Total
1 Cash — — — — — — — — — — —
2Japanese government and the Bank of Japan
— — — — — — — — — — —
3Foreign central government and their central banks
— — — — — — — — — — —
4 Bank for International Settlements — — — — — — — — — — —
5 Japanese regional municipal bodies — — — — — — — — — — —
6Non-central government public sector entities
— — — — — — — — — — —
7 Multilateral Development Bank — — — — — — — — — — —
8Japan Finance Organization for Municipalities
— — — — — — — — — — —
9 Japanese government institutions — — — — — — — — — — —
10 Regional third-sector company — — — — — — — — — — —
11 Banks and securities firms — — — — — — — — — — —
12 Corporates — — — — — — — — — — —
13 SMEs and individuals — — — — — — — — — — —
14 Residential Mortgage — — — — — — — — — — —
15Exposures to corporates, SMEs and indi-viduals (acquisition of real estate)
— — — — — — — — — — —
16Loans with principal or interest payments three months or more in arrears (exclud-ing residential mortgage)
— — — — — — — — — — —
17Extension of three months or more in mortgage loan terms
— — — — — — — — — — —
18 Bills in process of collection — — — — — — — — — — —
19Guarantee by Credit Guarantee Corporations
— — — — — — — — — — —
20Guarantee by Regional Economy Vitalization Corporation of Japan (REVIC)
— — — — — — — — — — —
21Investment (excluding important invest-ment)
— — — — — — — — — — —
22 Total — — — — — — — — — — —
Notes: 1. Assets subject to the Standardized Approach are a) the on-balance and off-balance sheet assets of the Bank’s consolidated subsidiaries, with the exception of IRB approach-applied subsidiaries and b) the suspense payments and prepaid expenses on the consolidated balance sheet of the Bank and IRB approach-applied subsidiaries.
2. The total of the credit risk assets subject to the Standardized Approach (above a+b) is ¥110.6 billion, which is not shown in these statements due to its extremely limited amount—only about 0.30% of the credit risk assets on a consolidated basis (¥35,885.5 billion).

CAPITAL ADEQUACY
56INTERIM REPORT 2019 The Norinchukin Bank
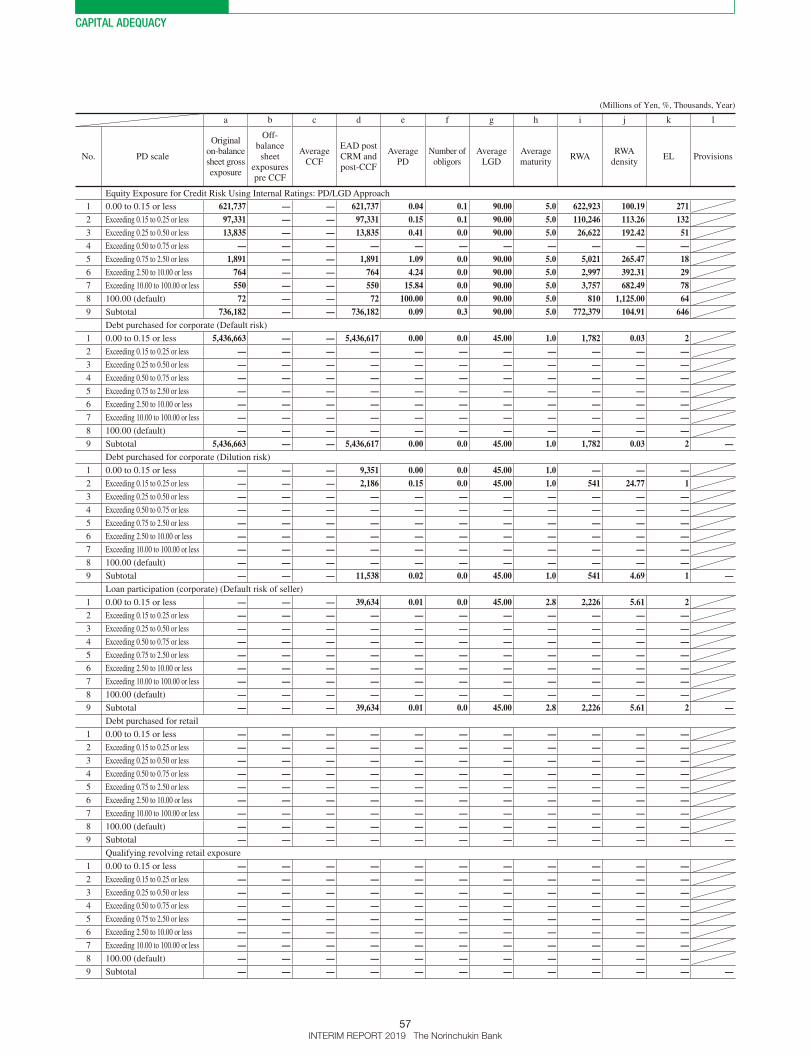
CR6: IRB – Credit risk exposures by portfolio and PD range
■ Foundation Internal Ratings-Based Approach (F-IRB)
For the Six Months Ended September 30, 2019 (Millions of Yen, %, Thousands, Year)
a b c d e f g h i j k l
No. PD scale
Original on-balance sheet gross exposure
Off-balance sheet
exposures pre CCF
Average CCF
EAD post CRM and post-CCF
Average PD
Number of obligors
Average LGD
Average maturity
RWARWA
densityEL Provisions
Sovereign exposure
1 0.00 to 0.15 or less 50,297,735 8,343 0.75 51,110,191 0.00 0.0 45.00 2.2 123,971 0.24 90 2 Exceeding 0.15 to 0.25 or less — — — — — — — — — — —3 Exceeding 0.25 to 0.50 or less 34,018 — — 34,018 0.28 0.0 45.00 5.0 26,518 77.95 42 4 Exceeding 0.50 to 0.75 or less — — — — — — — — — — —5 Exceeding 0.75 to 2.50 or less 1,349 — — 1,349 0.86 0.0 45.00 4.7 1,554 115.20 5 6 Exceeding 2.50 to 10.00 or less 112,312 — — 40 5.90 0.0 45.00 4.9 75 188.24 1 7 Exceeding 10.00 to 100.00 or less — — — — — — — — — — —8 100.00 (default) — — — — — — — — — — —9 Subtotal 50,445,417 8,343 0.75 51,145,600 0.00 0.0 45.00 2.2 152,120 0.29 139 —
Bank exposure
1 0.00 to 0.15 or less 4,958,358 — — 4,958,358 0.03 0.1 45.00 2.0 809,085 16.31 839 2 Exceeding 0.15 to 0.25 or less — — — — — — — — — — —3 Exceeding 0.25 to 0.50 or less 100,842 1,000 0.75 39,725 0.40 0.0 44.02 2.2 25,004 62.94 69 4 Exceeding 0.50 to 0.75 or less — — — — — — — — — — —5 Exceeding 0.75 to 2.50 or less 60,064 2,165 0.95 61,988 1.14 0.0 37.16 1.6 44,696 72.10 262 6 Exceeding 2.50 to 10.00 or less 26,506 561 1.00 25,978 4.06 0.0 33.00 2.1 27,272 104.98 377 7 Exceeding 10.00 to 100.00 or less — — — — — — — — — — —8 100.00 (default) — — — — — — — — — — —9 Subtotal 5,145,771 3,726 0.90 5,086,050 0.07 0.2 44.83 2.0 906,059 17.81 1,549 —
Corporate exposure (excluding SMEs exposure and specialized lending)
1 0.00 to 0.15 or less 955,046 — — 425,039 0.05 0.1 58.48 3.8 172,701 40.63 133 2 Exceeding 0.15 to 0.25 or less 75,899 — — 75,899 0.22 0.0 46.58 4.7 53,384 70.33 78 3 Exceeding 0.25 to 0.50 or less 30 — — 30 0.42 0.0 45.00 2.7 20 66.67 0 4 Exceeding 0.50 to 0.75 or less 4 — — 4 0.63 0.0 45.00 4.6 4 102.57 0 5 Exceeding 0.75 to 2.50 or less 24,083 — — 1,361 1.67 0.0 45.00 3.7 1,660 121.93 10 6 Exceeding 2.50 to 10.00 or less 14,620 541 0.75 15,026 3.91 0.1 45.00 4.4 24,618 163.83 264 7 Exceeding 10.00 to 100.00 or less 62,295 2,707 0.75 64,325 15.35 0.1 45.00 4.2 156,077 242.63 4,443 8 100.00 (default) 1,365 — — 1,365 100.00 0.0 45.00 3.9 — — 614 9 Subtotal 1,133,346 3,248 0.75 583,053 2.10 0.4 55.03 4.0 408,468 70.05 5,544 100
SMEs exposure
1 0.00 to 0.15 or less — — — — — — — — — — —2 Exceeding 0.15 to 0.25 or less — — — — — — — — — — —3 Exceeding 0.25 to 0.50 or less — — — — — — — — — — —4 Exceeding 0.50 to 0.75 or less — — — — — — — — — — —5 Exceeding 0.75 to 2.50 or less — — — — — — — — — — —6 Exceeding 2.50 to 10.00 or less — — — — — — — — — — —7 Exceeding 10.00 to 100.00 or less — — — — — — — — — — —8 100.00 (default) — — — — — — — — — — —9 Subtotal — — — — — — — — — — — —
Specialized lending exposure
1 0.00 to 0.15 or less — — — — — — — — — — —2 Exceeding 0.15 to 0.25 or less — — — — — — — — — — —3 Exceeding 0.25 to 0.50 or less — — — — — — — — — — —4 Exceeding 0.50 to 0.75 or less — — — — — — — — — — —5 Exceeding 0.75 to 2.50 or less — — — — — — — — — — —6 Exceeding 2.50 to 10.00 or less — — — — — — — — — — —7 Exceeding 10.00 to 100.00 or less — — — — — — — — — — —8 100.00 (default) — — — — — — — — — — —9 Subtotal — — — — — — — — — — — —
CAPITAL ADEQUACY
57INTERIM REPORT 2019 The Norinchukin Bank
(Millions of Yen, %, Thousands, Year)
a b c d e f g h i j k l
No. PD scale
Original on-balance sheet gross exposure
Off-balance sheet
exposures pre CCF
Average CCF
EAD post CRM and post-CCF
Average PD
Number of obligors
Average LGD
Average maturity
RWARWA
densityEL Provisions
Equity Exposure for Credit Risk Using Internal Ratings: PD/LGD Approach
1 0.00 to 0.15 or less 621,737 — — 621,737 0.04 0.1 90.00 5.0 622,923 100.19 271 2 Exceeding 0.15 to 0.25 or less 97,331 — — 97,331 0.15 0.1 90.00 5.0 110,246 113.26 132 3 Exceeding 0.25 to 0.50 or less 13,835 — — 13,835 0.41 0.0 90.00 5.0 26,622 192.42 51 4 Exceeding 0.50 to 0.75 or less — — — — — — — — — — —5 Exceeding 0.75 to 2.50 or less 1,891 — — 1,891 1.09 0.0 90.00 5.0 5,021 265.47 18 6 Exceeding 2.50 to 10.00 or less 764 — — 764 4.24 0.0 90.00 5.0 2,997 392.31 29 7 Exceeding 10.00 to 100.00 or less 550 — — 550 15.84 0.0 90.00 5.0 3,757 682.49 78 8 100.00 (default) 72 — — 72 100.00 0.0 90.00 5.0 810 1,125.00 64 9 Subtotal 736,182 — — 736,182 0.09 0.3 90.00 5.0 772,379 104.91 646
Debt purchased for corporate (Default risk)
1 0.00 to 0.15 or less 5,436,663 — — 5,436,617 0.00 0.0 45.00 1.0 1,782 0.03 2 2 Exceeding 0.15 to 0.25 or less — — — — — — — — — — —3 Exceeding 0.25 to 0.50 or less — — — — — — — — — — —4 Exceeding 0.50 to 0.75 or less — — — — — — — — — — —5 Exceeding 0.75 to 2.50 or less — — — — — — — — — — —6 Exceeding 2.50 to 10.00 or less — — — — — — — — — — —7 Exceeding 10.00 to 100.00 or less — — — — — — — — — — —8 100.00 (default) — — — — — — — — — — —9 Subtotal 5,436,663 — — 5,436,617 0.00 0.0 45.00 1.0 1,782 0.03 2 —
Debt purchased for corporate (Dilution risk)
1 0.00 to 0.15 or less — — — 9,351 0.00 0.0 45.00 1.0 — — —2 Exceeding 0.15 to 0.25 or less — — — 2,186 0.15 0.0 45.00 1.0 541 24.77 1 3 Exceeding 0.25 to 0.50 or less — — — — — — — — — — —4 Exceeding 0.50 to 0.75 or less — — — — — — — — — — —5 Exceeding 0.75 to 2.50 or less — — — — — — — — — — —6 Exceeding 2.50 to 10.00 or less — — — — — — — — — — —7 Exceeding 10.00 to 100.00 or less — — — — — — — — — — —8 100.00 (default) — — — — — — — — — — —9 Subtotal — — — 11,538 0.02 0.0 45.00 1.0 541 4.69 1 —
Loan participation (corporate) (Default risk of seller)
1 0.00 to 0.15 or less — — — 39,634 0.01 0.0 45.00 2.8 2,226 5.61 2 2 Exceeding 0.15 to 0.25 or less — — — — — — — — — — —3 Exceeding 0.25 to 0.50 or less — — — — — — — — — — —4 Exceeding 0.50 to 0.75 or less — — — — — — — — — — —5 Exceeding 0.75 to 2.50 or less — — — — — — — — — — —6 Exceeding 2.50 to 10.00 or less — — — — — — — — — — —7 Exceeding 10.00 to 100.00 or less — — — — — — — — — — —8 100.00 (default) — — — — — — — — — — —9 Subtotal — — — 39,634 0.01 0.0 45.00 2.8 2,226 5.61 2 —
Debt purchased for retail
1 0.00 to 0.15 or less — — — — — — — — — — —2 Exceeding 0.15 to 0.25 or less — — — — — — — — — — —3 Exceeding 0.25 to 0.50 or less — — — — — — — — — — —4 Exceeding 0.50 to 0.75 or less — — — — — — — — — — —5 Exceeding 0.75 to 2.50 or less — — — — — — — — — — —6 Exceeding 2.50 to 10.00 or less — — — — — — — — — — —7 Exceeding 10.00 to 100.00 or less — — — — — — — — — — —8 100.00 (default) — — — — — — — — — — —9 Subtotal — — — — — — — — — — — —
Qualifying revolving retail exposure
1 0.00 to 0.15 or less — — — — — — — — — — —2 Exceeding 0.15 to 0.25 or less — — — — — — — — — — —3 Exceeding 0.25 to 0.50 or less — — — — — — — — — — —4 Exceeding 0.50 to 0.75 or less — — — — — — — — — — —5 Exceeding 0.75 to 2.50 or less — — — — — — — — — — —6 Exceeding 2.50 to 10.00 or less — — — — — — — — — — —7 Exceeding 10.00 to 100.00 or less — — — — — — — — — — —8 100.00 (default) — — — — — — — — — — —9 Subtotal — — — — — — — — — — — —
CAPITAL ADEQUACY
58INTERIM REPORT 2019 The Norinchukin Bank
(Millions of Yen, %, Thousands, Year)
a b c d e f g h i j k l
No. PD scale
Original on-balance sheet gross exposure
Off-balance sheet
exposures pre CCF
Average CCF
EAD post CRM and post-CCF
Average PD
Number of obligors
Average LGD
Average maturity
RWARWA
densityEL Provisions
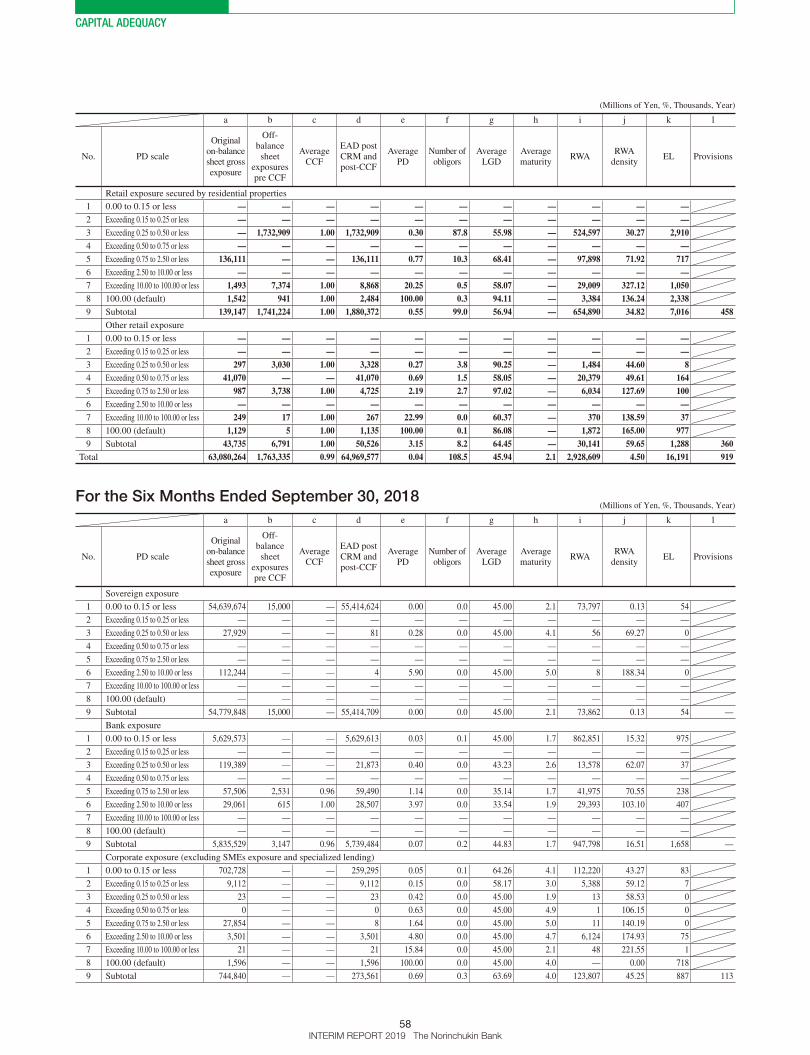
Retail exposure secured by residential properties
1 0.00 to 0.15 or less — — — — — — — — — — —2 Exceeding 0.15 to 0.25 or less — — — — — — — — — — —3 Exceeding 0.25 to 0.50 or less — 1,732,909 1.00 1,732,909 0.30 87.8 55.98 — 524,597 30.27 2,910 4 Exceeding 0.50 to 0.75 or less — — — — — — — — — — —5 Exceeding 0.75 to 2.50 or less 136,111 — — 136,111 0.77 10.3 68.41 — 97,898 71.92 717 6 Exceeding 2.50 to 10.00 or less — — — — — — — — — — —7 Exceeding 10.00 to 100.00 or less 1,493 7,374 1.00 8,868 20.25 0.5 58.07 — 29,009 327.12 1,050 8 100.00 (default) 1,542 941 1.00 2,484 100.00 0.3 94.11 — 3,384 136.24 2,338 9 Subtotal 139,147 1,741,224 1.00 1,880,372 0.55 99.0 56.94 — 654,890 34.82 7,016 458
Other retail exposure
1 0.00 to 0.15 or less — — — — — — — — — — —2 Exceeding 0.15 to 0.25 or less — — — — — — — — — — —3 Exceeding 0.25 to 0.50 or less 297 3,030 1.00 3,328 0.27 3.8 90.25 — 1,484 44.60 8 4 Exceeding 0.50 to 0.75 or less 41,070 — — 41,070 0.69 1.5 58.05 — 20,379 49.61 164 5 Exceeding 0.75 to 2.50 or less 987 3,738 1.00 4,725 2.19 2.7 97.02 — 6,034 127.69 100 6 Exceeding 2.50 to 10.00 or less — — — — — — — — — — —7 Exceeding 10.00 to 100.00 or less 249 17 1.00 267 22.99 0.0 60.37 — 370 138.59 37 8 100.00 (default) 1,129 5 1.00 1,135 100.00 0.1 86.08 — 1,872 165.00 977 9 Subtotal 43,735 6,791 1.00 50,526 3.15 8.2 64.45 — 30,141 59.65 1,288 360
Total 63,080,264 1,763,335 0.99 64,969,577 0.04 108.5 45.94 2.1 2,928,609 4.50 16,191 919
For the Six Months Ended September 30, 2018 (Millions of Yen, %, Thousands, Year)
a b c d e f g h i j k l
No. PD scale
Original on-balance sheet gross exposure
Off-balance sheet
exposures pre CCF
Average CCF
EAD post CRM and post-CCF
Average PD
Number of obligors
Average LGD
Average maturity
RWARWA
densityEL Provisions
Sovereign exposure
1 0.00 to 0.15 or less 54,639,674 15,000 — 55,414,624 0.00 0.0 45.00 2.1 73,797 0.13 54
2 Exceeding 0.15 to 0.25 or less — — — — — — — — — — —
3 Exceeding 0.25 to 0.50 or less 27,929 — — 81 0.28 0.0 45.00 4.1 56 69.27 0
4 Exceeding 0.50 to 0.75 or less — — — — — — — — — — —
5 Exceeding 0.75 to 2.50 or less — — — — — — — — — — —
6 Exceeding 2.50 to 10.00 or less 112,244 — — 4 5.90 0.0 45.00 5.0 8 188.34 0
7 Exceeding 10.00 to 100.00 or less — — — — — — — — — — —
8 100.00 (default) — — — — — — — — — — —
9 Subtotal 54,779,848 15,000 — 55,414,709 0.00 0.0 45.00 2.1 73,862 0.13 54 —
Bank exposure
1 0.00 to 0.15 or less 5,629,573 — — 5,629,613 0.03 0.1 45.00 1.7 862,851 15.32 975
2 Exceeding 0.15 to 0.25 or less — — — — — — — — — — —
3 Exceeding 0.25 to 0.50 or less 119,389 — — 21,873 0.40 0.0 43.23 2.6 13,578 62.07 37
4 Exceeding 0.50 to 0.75 or less — — — — — — — — — — —
5 Exceeding 0.75 to 2.50 or less 57,506 2,531 0.96 59,490 1.14 0.0 35.14 1.7 41,975 70.55 238
6 Exceeding 2.50 to 10.00 or less 29,061 615 1.00 28,507 3.97 0.0 33.54 1.9 29,393 103.10 407
7 Exceeding 10.00 to 100.00 or less — — — — — — — — — — —
8 100.00 (default) — — — — — — — — — — —
9 Subtotal 5,835,529 3,147 0.96 5,739,484 0.07 0.2 44.83 1.7 947,798 16.51 1,658 —
Corporate exposure (excluding SMEs exposure and specialized lending)
1 0.00 to 0.15 or less 702,728 — — 259,295 0.05 0.1 64.26 4.1 112,220 43.27 83
2 Exceeding 0.15 to 0.25 or less 9,112 — — 9,112 0.15 0.0 58.17 3.0 5,388 59.12 7
3 Exceeding 0.25 to 0.50 or less 23 — — 23 0.42 0.0 45.00 1.9 13 58.53 0
4 Exceeding 0.50 to 0.75 or less 0 — — 0 0.63 0.0 45.00 4.9 1 106.15 0
5 Exceeding 0.75 to 2.50 or less 27,854 — — 8 1.64 0.0 45.00 5.0 11 140.19 0
6 Exceeding 2.50 to 10.00 or less 3,501 — — 3,501 4.80 0.0 45.00 4.7 6,124 174.93 75
7 Exceeding 10.00 to 100.00 or less 21 — — 21 15.84 0.0 45.00 2.1 48 221.55 1
8 100.00 (default) 1,596 — — 1,596 100.00 0.0 45.00 4.0 — 0.00 718
9 Subtotal 744,840 — — 273,561 0.69 0.3 63.69 4.0 123,807 45.25 887 113
CAPITAL ADEQUACY
59INTERIM REPORT 2019 The Norinchukin Bank
(Millions of Yen, %, Thousands, Year)
a b c d e f g h i j k l
No. PD scale
Original on-balance sheet gross exposure
Off-balance sheet
exposures pre CCF
Average CCF
EAD post CRM and post-CCF
Average PD
Number of obligors
Average LGD
Average maturity
RWARWA
densityEL Provisions
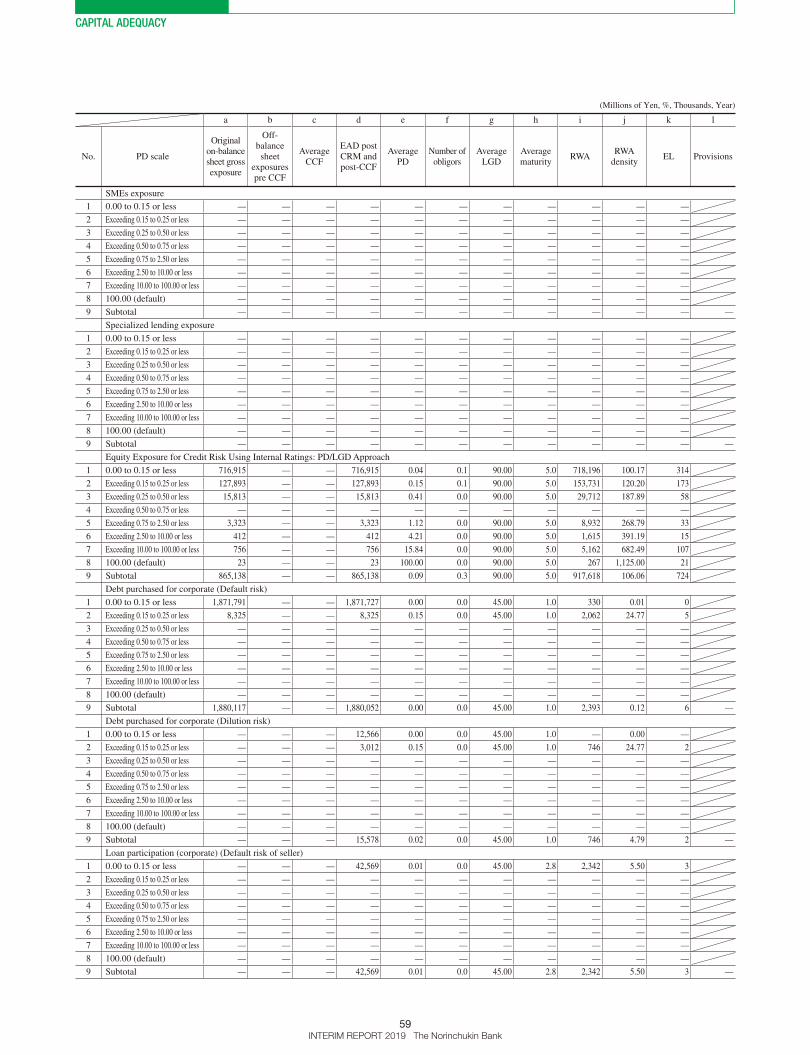
SMEs exposure
1 0.00 to 0.15 or less — — — — — — — — — — —
2 Exceeding 0.15 to 0.25 or less — — — — — — — — — — —
3 Exceeding 0.25 to 0.50 or less — — — — — — — — — — —
4 Exceeding 0.50 to 0.75 or less — — — — — — — — — — —
5 Exceeding 0.75 to 2.50 or less — — — — — — — — — — —
6 Exceeding 2.50 to 10.00 or less — — — — — — — — — — —
7 Exceeding 10.00 to 100.00 or less — — — — — — — — — — —
8 100.00 (default) — — — — — — — — — — —
9 Subtotal — — — — — — — — — — — —
Specialized lending exposure
1 0.00 to 0.15 or less — — — — — — — — — — —
2 Exceeding 0.15 to 0.25 or less — — — — — — — — — — —
3 Exceeding 0.25 to 0.50 or less — — — — — — — — — — —
4 Exceeding 0.50 to 0.75 or less — — — — — — — — — — —
5 Exceeding 0.75 to 2.50 or less — — — — — — — — — — —
6 Exceeding 2.50 to 10.00 or less — — — — — — — — — — —
7 Exceeding 10.00 to 100.00 or less — — — — — — — — — — —
8 100.00 (default) — — — — — — — — — — —
9 Subtotal — — — — — — — — — — — —
Equity Exposure for Credit Risk Using Internal Ratings: PD/LGD Approach
1 0.00 to 0.15 or less 716,915 — — 716,915 0.04 0.1 90.00 5.0 718,196 100.17 314
2 Exceeding 0.15 to 0.25 or less 127,893 — — 127,893 0.15 0.1 90.00 5.0 153,731 120.20 173
3 Exceeding 0.25 to 0.50 or less 15,813 — — 15,813 0.41 0.0 90.00 5.0 29,712 187.89 58
4 Exceeding 0.50 to 0.75 or less — — — — — — — — — — —
5 Exceeding 0.75 to 2.50 or less 3,323 — — 3,323 1.12 0.0 90.00 5.0 8,932 268.79 33
6 Exceeding 2.50 to 10.00 or less 412 — — 412 4.21 0.0 90.00 5.0 1,615 391.19 15
7 Exceeding 10.00 to 100.00 or less 756 — — 756 15.84 0.0 90.00 5.0 5,162 682.49 107
8 100.00 (default) 23 — — 23 100.00 0.0 90.00 5.0 267 1,125.00 21
9 Subtotal 865,138 — — 865,138 0.09 0.3 90.00 5.0 917,618 106.06 724
Debt purchased for corporate (Default risk)
1 0.00 to 0.15 or less 1,871,791 — — 1,871,727 0.00 0.0 45.00 1.0 330 0.01 0
2 Exceeding 0.15 to 0.25 or less 8,325 — — 8,325 0.15 0.0 45.00 1.0 2,062 24.77 5
3 Exceeding 0.25 to 0.50 or less — — — — — — — — — — —
4 Exceeding 0.50 to 0.75 or less — — — — — — — — — — —
5 Exceeding 0.75 to 2.50 or less — — — — — — — — — — —
6 Exceeding 2.50 to 10.00 or less — — — — — — — — — — —
7 Exceeding 10.00 to 100.00 or less — — — — — — — — — — —
8 100.00 (default) — — — — — — — — — — —
9 Subtotal 1,880,117 — — 1,880,052 0.00 0.0 45.00 1.0 2,393 0.12 6 —
Debt purchased for corporate (Dilution risk)
1 0.00 to 0.15 or less — — — 12,566 0.00 0.0 45.00 1.0 — 0.00 —
2 Exceeding 0.15 to 0.25 or less — — — 3,012 0.15 0.0 45.00 1.0 746 24.77 2
3 Exceeding 0.25 to 0.50 or less — — — — — — — — — — —
4 Exceeding 0.50 to 0.75 or less — — — — — — — — — — —
5 Exceeding 0.75 to 2.50 or less — — — — — — — — — — —
6 Exceeding 2.50 to 10.00 or less — — — — — — — — — — —
7 Exceeding 10.00 to 100.00 or less — — — — — — — — — — —
8 100.00 (default) — — — — — — — — — — —
9 Subtotal — — — 15,578 0.02 0.0 45.00 1.0 746 4.79 2 —
Loan participation (corporate) (Default risk of seller)
1 0.00 to 0.15 or less — — — 42,569 0.01 0.0 45.00 2.8 2,342 5.50 3
2 Exceeding 0.15 to 0.25 or less — — — — — — — — — — —
3 Exceeding 0.25 to 0.50 or less — — — — — — — — — — —
4 Exceeding 0.50 to 0.75 or less — — — — — — — — — — —
5 Exceeding 0.75 to 2.50 or less — — — — — — — — — — —
6 Exceeding 2.50 to 10.00 or less — — — — — — — — — — —
7 Exceeding 10.00 to 100.00 or less — — — — — — — — — — —
8 100.00 (default) — — — — — — — — — — —
9 Subtotal — — — 42,569 0.01 0.0 45.00 2.8 2,342 5.50 3 —
CAPITAL ADEQUACY
60INTERIM REPORT 2019 The Norinchukin Bank
(Millions of Yen, %, Thousands, Year)
a b c d e f g h i j k l
No. PD scale
Original on-balance sheet gross exposure
Off-balance sheet
exposures pre CCF
Average CCF
EAD post CRM and post-CCF
Average PD
Number of obligors
Average LGD
Average maturity
RWARWA
densityEL Provisions
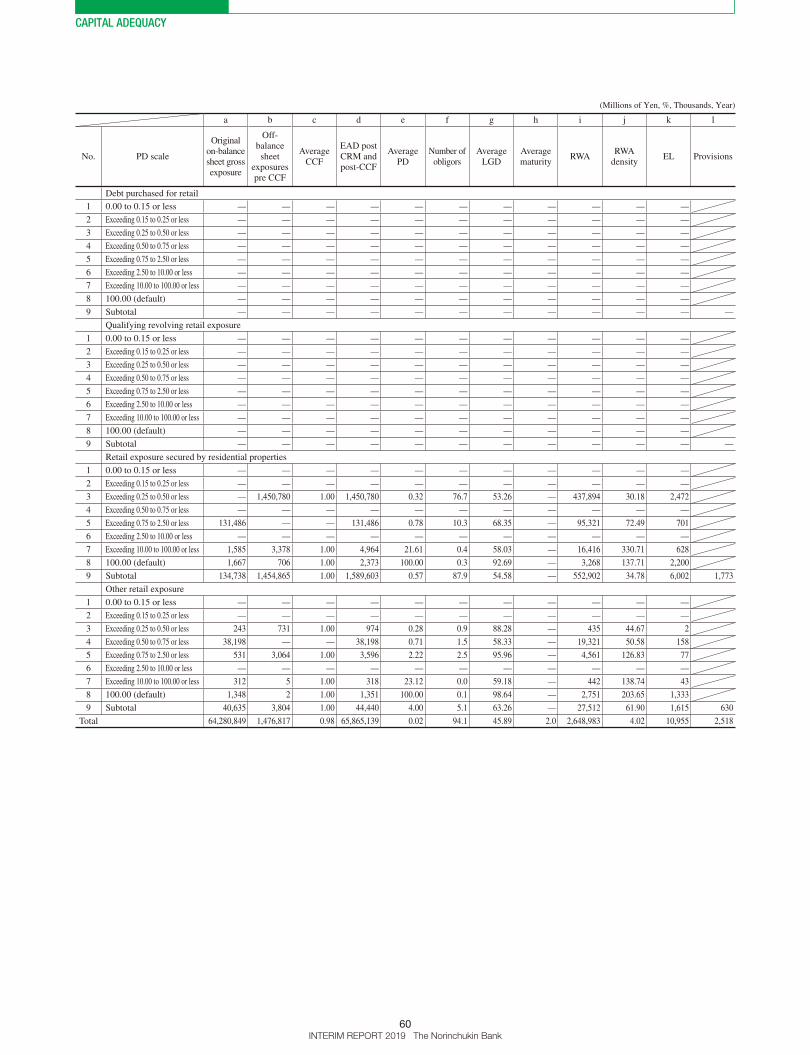
Debt purchased for retail
1 0.00 to 0.15 or less — — — — — — — — — — —
2 Exceeding 0.15 to 0.25 or less — — — — — — — — — — —
3 Exceeding 0.25 to 0.50 or less — — — — — — — — — — —
4 Exceeding 0.50 to 0.75 or less — — — — — — — — — — —
5 Exceeding 0.75 to 2.50 or less — — — — — — — — — — —
6 Exceeding 2.50 to 10.00 or less — — — — — — — — — — —
7 Exceeding 10.00 to 100.00 or less — — — — — — — — — — —
8 100.00 (default) — — — — — — — — — — —
9 Subtotal — — — — — — — — — — — —
Qualifying revolving retail exposure
1 0.00 to 0.15 or less — — — — — — — — — — —
2 Exceeding 0.15 to 0.25 or less — — — — — — — — — — —
3 Exceeding 0.25 to 0.50 or less — — — — — — — — — — —
4 Exceeding 0.50 to 0.75 or less — — — — — — — — — — —
5 Exceeding 0.75 to 2.50 or less — — — — — — — — — — —
6 Exceeding 2.50 to 10.00 or less — — — — — — — — — — —
7 Exceeding 10.00 to 100.00 or less — — — — — — — — — — —
8 100.00 (default) — — — — — — — — — — —
9 Subtotal — — — — — — — — — — — —
Retail exposure secured by residential properties
1 0.00 to 0.15 or less — — — — — — — — — — —
2 Exceeding 0.15 to 0.25 or less — — — — — — — — — — —
3 Exceeding 0.25 to 0.50 or less — 1,450,780 1.00 1,450,780 0.32 76.7 53.26 — 437,894 30.18 2,472
4 Exceeding 0.50 to 0.75 or less — — — — — — — — — — —
5 Exceeding 0.75 to 2.50 or less 131,486 — — 131,486 0.78 10.3 68.35 — 95,321 72.49 701
6 Exceeding 2.50 to 10.00 or less — — — — — — — — — — —
7 Exceeding 10.00 to 100.00 or less 1,585 3,378 1.00 4,964 21.61 0.4 58.03 — 16,416 330.71 628
8 100.00 (default) 1,667 706 1.00 2,373 100.00 0.3 92.69 — 3,268 137.71 2,200
9 Subtotal 134,738 1,454,865 1.00 1,589,603 0.57 87.9 54.58 — 552,902 34.78 6,002 1,773
Other retail exposure
1 0.00 to 0.15 or less — — — — — — — — — — —
2 Exceeding 0.15 to 0.25 or less — — — — — — — — — — —
3 Exceeding 0.25 to 0.50 or less 243 731 1.00 974 0.28 0.9 88.28 — 435 44.67 2
4 Exceeding 0.50 to 0.75 or less 38,198 — — 38,198 0.71 1.5 58.33 — 19,321 50.58 158
5 Exceeding 0.75 to 2.50 or less 531 3,064 1.00 3,596 2.22 2.5 95.96 — 4,561 126.83 77
6 Exceeding 2.50 to 10.00 or less — — — — — — — — — — —
7 Exceeding 10.00 to 100.00 or less 312 5 1.00 318 23.12 0.0 59.18 — 442 138.74 43
8 100.00 (default) 1,348 2 1.00 1,351 100.00 0.1 98.64 — 2,751 203.65 1,333
9 Subtotal 40,635 3,804 1.00 44,440 4.00 5.1 63.26 — 27,512 61.90 1,615 630
Total 64,280,849 1,476,817 0.98 65,865,139 0.02 94.1 45.89 2.0 2,648,983 4.02 10,955 2,518
CAPITAL ADEQUACY
61INTERIM REPORT 2019 The Norinchukin Bank
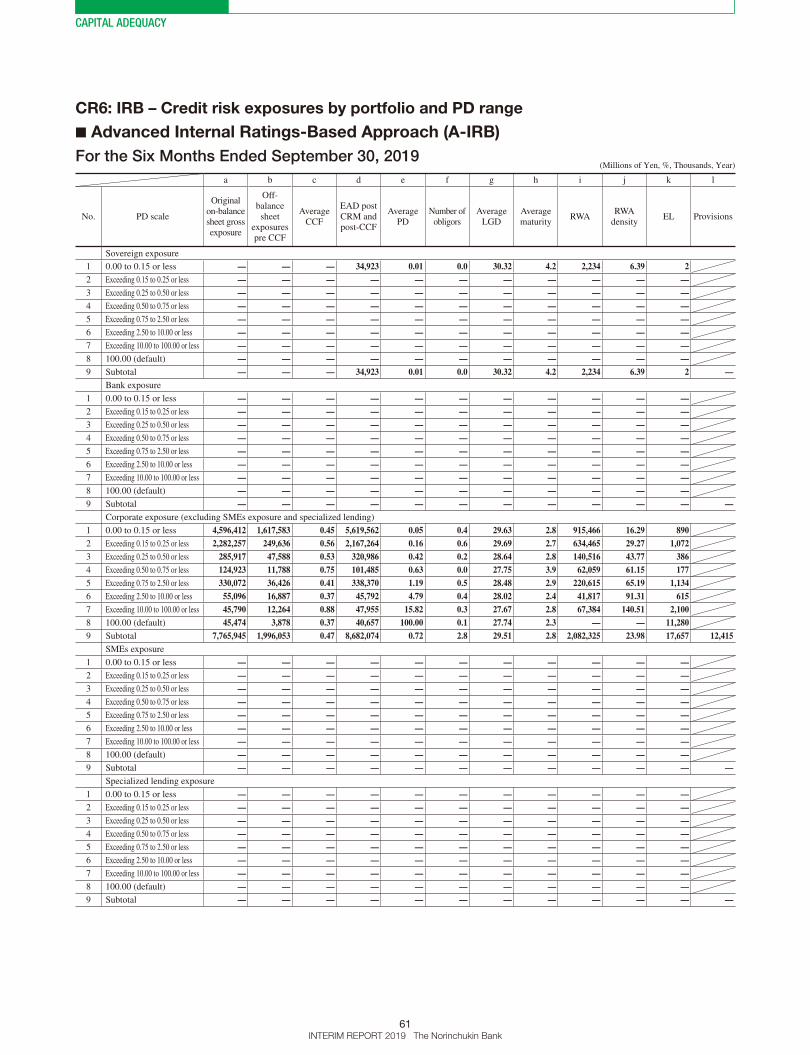
CR6: IRB – Credit risk exposures by portfolio and PD range
■ Advanced Internal Ratings-Based Approach (A-IRB)
For the Six Months Ended September 30, 2019 (Millions of Yen, %, Thousands, Year)
a b c d e f g h i j k l
No. PD scale
Original on-balance sheet gross exposure
Off-balance sheet
exposures pre CCF
Average CCF
EAD post CRM and post-CCF
Average PD
Number of obligors
Average LGD
Average maturity
RWARWA
densityEL Provisions
Sovereign exposure
1 0.00 to 0.15 or less — — — 34,923 0.01 0.0 30.32 4.2 2,234 6.39 2 2 Exceeding 0.15 to 0.25 or less — — — — — — — — — — —3 Exceeding 0.25 to 0.50 or less — — — — — — — — — — —4 Exceeding 0.50 to 0.75 or less — — — — — — — — — — —5 Exceeding 0.75 to 2.50 or less — — — — — — — — — — —6 Exceeding 2.50 to 10.00 or less — — — — — — — — — — —7 Exceeding 10.00 to 100.00 or less — — — — — — — — — — —8 100.00 (default) — — — — — — — — — — —9 Subtotal — — — 34,923 0.01 0.0 30.32 4.2 2,234 6.39 2 —
Bank exposure
1 0.00 to 0.15 or less — — — — — — — — — — —2 Exceeding 0.15 to 0.25 or less — — — — — — — — — — —3 Exceeding 0.25 to 0.50 or less — — — — — — — — — — —4 Exceeding 0.50 to 0.75 or less — — — — — — — — — — —5 Exceeding 0.75 to 2.50 or less — — — — — — — — — — —6 Exceeding 2.50 to 10.00 or less — — — — — — — — — — —7 Exceeding 10.00 to 100.00 or less — — — — — — — — — — —8 100.00 (default) — — — — — — — — — — —9 Subtotal — — — — — — — — — — — —
Corporate exposure (excluding SMEs exposure and specialized lending)
1 0.00 to 0.15 or less 4,596,412 1,617,583 0.45 5,619,562 0.05 0.4 29.63 2.8 915,466 16.29 890 2 Exceeding 0.15 to 0.25 or less 2,282,257 249,636 0.56 2,167,264 0.16 0.6 29.69 2.7 634,465 29.27 1,072 3 Exceeding 0.25 to 0.50 or less 285,917 47,588 0.53 320,986 0.42 0.2 28.64 2.8 140,516 43.77 386 4 Exceeding 0.50 to 0.75 or less 124,923 11,788 0.75 101,485 0.63 0.0 27.75 3.9 62,059 61.15 177 5 Exceeding 0.75 to 2.50 or less 330,072 36,426 0.41 338,370 1.19 0.5 28.48 2.9 220,615 65.19 1,134 6 Exceeding 2.50 to 10.00 or less 55,096 16,887 0.37 45,792 4.79 0.4 28.02 2.4 41,817 91.31 615 7 Exceeding 10.00 to 100.00 or less 45,790 12,264 0.88 47,955 15.82 0.3 27.67 2.8 67,384 140.51 2,100 8 100.00 (default) 45,474 3,878 0.37 40,657 100.00 0.1 27.74 2.3 — — 11,280 9 Subtotal 7,765,945 1,996,053 0.47 8,682,074 0.72 2.8 29.51 2.8 2,082,325 23.98 17,657 12,415
SMEs exposure
1 0.00 to 0.15 or less — — — — — — — — — — —2 Exceeding 0.15 to 0.25 or less — — — — — — — — — — —3 Exceeding 0.25 to 0.50 or less — — — — — — — — — — —4 Exceeding 0.50 to 0.75 or less — — — — — — — — — — —5 Exceeding 0.75 to 2.50 or less — — — — — — — — — — —6 Exceeding 2.50 to 10.00 or less — — — — — — — — — — —7 Exceeding 10.00 to 100.00 or less — — — — — — — — — — —8 100.00 (default) — — — — — — — — — — —9 Subtotal — — — — — — — — — — — —
Specialized lending exposure
1 0.00 to 0.15 or less — — — — — — — — — — —2 Exceeding 0.15 to 0.25 or less — — — — — — — — — — —3 Exceeding 0.25 to 0.50 or less — — — — — — — — — — —4 Exceeding 0.50 to 0.75 or less — — — — — — — — — — —5 Exceeding 0.75 to 2.50 or less — — — — — — — — — — —6 Exceeding 2.50 to 10.00 or less — — — — — — — — — — —7 Exceeding 10.00 to 100.00 or less — — — — — — — — — — —8 100.00 (default) — — — — — — — — — — —9 Subtotal — — — — — — — — — — — —
CAPITAL ADEQUACY
62INTERIM REPORT 2019 The Norinchukin Bank
(Millions of Yen, %, Thousands, Year)
a b c d e f g h i j k l
No. PD scale
Original on-balance sheet gross exposure
Off-balance sheet
exposures pre CCF
Average CCF
EAD post CRM and post-CCF
Average PD
Number of obligors
Average LGD
Average maturity
RWARWA
densityEL Provisions
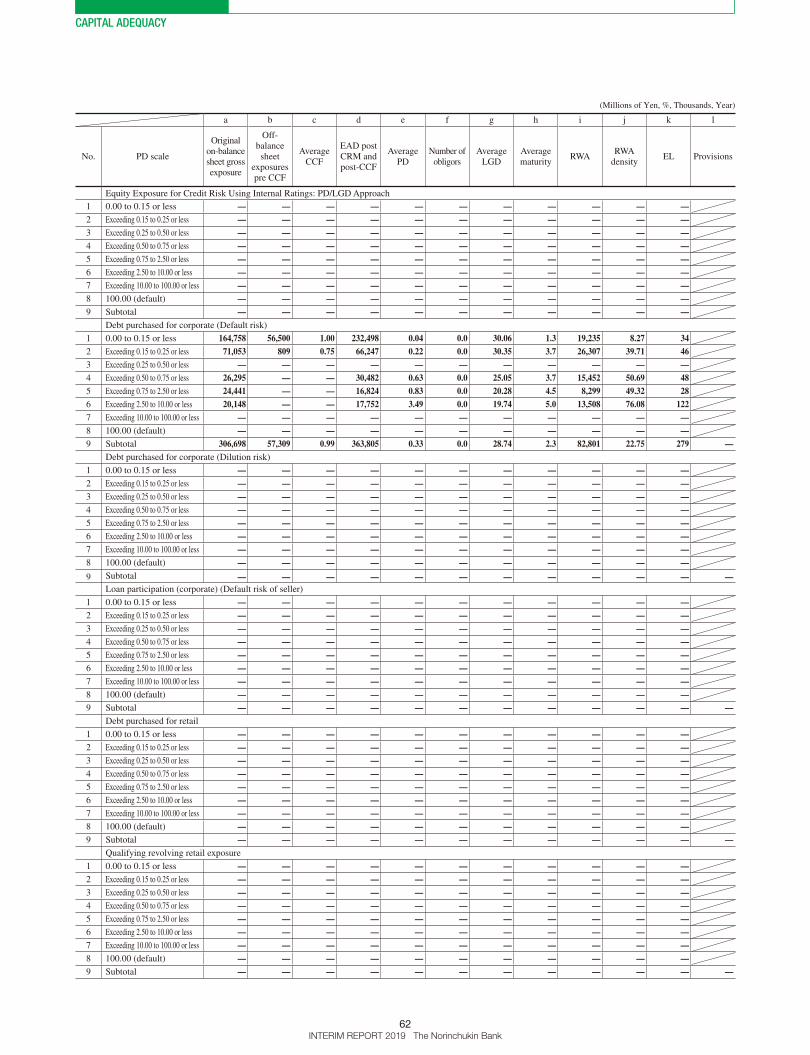
Equity Exposure for Credit Risk Using Internal Ratings: PD/LGD Approach
1 0.00 to 0.15 or less — — — — — — — — — — —2 Exceeding 0.15 to 0.25 or less — — — — — — — — — — —3 Exceeding 0.25 to 0.50 or less — — — — — — — — — — —4 Exceeding 0.50 to 0.75 or less — — — — — — — — — — —5 Exceeding 0.75 to 2.50 or less — — — — — — — — — — —6 Exceeding 2.50 to 10.00 or less — — — — — — — — — — —7 Exceeding 10.00 to 100.00 or less — — — — — — — — — — —8 100.00 (default) — — — — — — — — — — —9 Subtotal — — — — — — — — — — —
Debt purchased for corporate (Default risk)
1 0.00 to 0.15 or less 164,758 56,500 1.00 232,498 0.04 0.0 30.06 1.3 19,235 8.27 34 2 Exceeding 0.15 to 0.25 or less 71,053 809 0.75 66,247 0.22 0.0 30.35 3.7 26,307 39.71 46 3 Exceeding 0.25 to 0.50 or less — — — — — — — — — — — 4 Exceeding 0.50 to 0.75 or less 26,295 — — 30,482 0.63 0.0 25.05 3.7 15,452 50.69 48 5 Exceeding 0.75 to 2.50 or less 24,441 — — 16,824 0.83 0.0 20.28 4.5 8,299 49.32 28 6 Exceeding 2.50 to 10.00 or less 20,148 — — 17,752 3.49 0.0 19.74 5.0 13,508 76.08 122 7 Exceeding 10.00 to 100.00 or less — — — — — — — — — — — 8 100.00 (default) — — — — — — — — — — —9 Subtotal 306,698 57,309 0.99 363,805 0.33 0.0 28.74 2.3 82,801 22.75 279 —
Debt purchased for corporate (Dilution risk)
1 0.00 to 0.15 or less — — — — — — — — — — —2 Exceeding 0.15 to 0.25 or less — — — — — — — — — — —3 Exceeding 0.25 to 0.50 or less — — — — — — — — — — —4 Exceeding 0.50 to 0.75 or less — — — — — — — — — — —5 Exceeding 0.75 to 2.50 or less — — — — — — — — — — —6 Exceeding 2.50 to 10.00 or less — — — — — — — — — — —7 Exceeding 10.00 to 100.00 or less — — — — — — — — — — —8 100.00 (default) — — — — — — — — — — —
9 Subtotal — — — — — — — — — — — —Loan participation (corporate) (Default risk of seller)
1 0.00 to 0.15 or less — — — — — — — — — — —2 Exceeding 0.15 to 0.25 or less — — — — — — — — — — —3 Exceeding 0.25 to 0.50 or less — — — — — — — — — — —4 Exceeding 0.50 to 0.75 or less — — — — — — — — — — —5 Exceeding 0.75 to 2.50 or less — — — — — — — — — — —6 Exceeding 2.50 to 10.00 or less — — — — — — — — — — —7 Exceeding 10.00 to 100.00 or less — — — — — — — — — — —8 100.00 (default) — — — — — — — — — — —9 Subtotal — — — — — — — — — — — —
Debt purchased for retail
1 0.00 to 0.15 or less — — — — — — — — — — —2 Exceeding 0.15 to 0.25 or less — — — — — — — — — — —3 Exceeding 0.25 to 0.50 or less — — — — — — — — — — —4 Exceeding 0.50 to 0.75 or less — — — — — — — — — — —5 Exceeding 0.75 to 2.50 or less — — — — — — — — — — —6 Exceeding 2.50 to 10.00 or less — — — — — — — — — — —7 Exceeding 10.00 to 100.00 or less — — — — — — — — — — —8 100.00 (default) — — — — — — — — — — —9 Subtotal — — — — — — — — — — — —
Qualifying revolving retail exposure
1 0.00 to 0.15 or less — — — — — — — — — — —2 Exceeding 0.15 to 0.25 or less — — — — — — — — — — —3 Exceeding 0.25 to 0.50 or less — — — — — — — — — — —4 Exceeding 0.50 to 0.75 or less — — — — — — — — — — —5 Exceeding 0.75 to 2.50 or less — — — — — — — — — — —6 Exceeding 2.50 to 10.00 or less — — — — — — — — — — —7 Exceeding 10.00 to 100.00 or less — — — — — — — — — — —8 100.00 (default) — — — — — — — — — — —9 Subtotal — — — — — — — — — — — —

CAPITAL ADEQUACY
63INTERIM REPORT 2019 The Norinchukin Bank
(Millions of Yen, %, Thousands, Year)
a b c d e f g h i j k l
No. PD scale
Original on-balance sheet gross exposure
Off-balance sheet
exposures pre CCF
Average CCF
EAD post CRM and post-CCF
Average PD
Number of obligors
Average LGD
Average maturity
RWARWA
densityEL Provisions
Retail exposure secured by residential properties
1 0.00 to 0.15 or less — — — — — — — — — — —2 Exceeding 0.15 to 0.25 or less — — — — — — — — — — —3 Exceeding 0.25 to 0.50 or less — — — — — — — — — — —4 Exceeding 0.50 to 0.75 or less — — — — — — — — — — —5 Exceeding 0.75 to 2.50 or less — — — — — — — — — — —6 Exceeding 2.50 to 10.00 or less — — — — — — — — — — —7 Exceeding 10.00 to 100.00 or less — — — — — — — — — — —8 100.00 (default) — — — — — — — — — — —9 Subtotal — — — — — — — — — — — —
Other retail exposure
1 0.00 to 0.15 or less — — — — — — — — — — —2 Exceeding 0.15 to 0.25 or less — — — — — — — — — — —3 Exceeding 0.25 to 0.50 or less — — — — — — — — — — —4 Exceeding 0.50 to 0.75 or less — — — — — — — — — — —5 Exceeding 0.75 to 2.50 or less — — — — — — — — — — —6 Exceeding 2.50 to 10.00 or less — — — — — — — — — — —7 Exceeding 10.00 to 100.00 or less — — — — — — — — — — —8 100.00 (default) — — — — — — — — — — —9 Subtotal — — — — — — — — — — — —
Total 8,072,644 2,053,362 0.49 9,080,803 0.70 2.8 29.49 2.8 2,167,362 23.86 17,939 12,415
For the Six Months Ended September 30, 2018 (Millions of Yen, %, Thousands, Year)
a b c d e f g h i j k l
No. PD scale
Original on-balance sheet gross exposure
Off-balance sheet
exposures pre CCF
Average CCF
EAD post CRM and post-CCF
Average PD
Number of obligors
Average LGD
Average maturity
RWARWA
densityEL Provisions
Sovereign exposure
1 0.00 to 0.15 or less — — — 33,432 0.01 0.0 30.31 4.2 1,668 4.99 1
2 Exceeding 0.15 to 0.25 or less — — — — — — — — — — —
3 Exceeding 0.25 to 0.50 or less — — — — — — — — — — —
4 Exceeding 0.50 to 0.75 or less — — — — — — — — — — —
5 Exceeding 0.75 to 2.50 or less — — — — — — — — — — —
6 Exceeding 2.50 to 10.00 or less — — — — — — — — — — —
7 Exceeding 10.00 to 100.00 or less — — — — — — — — — — —
8 100.00 (default) — — — — — — — — — — —
9 Subtotal — — — 33,432 0.01 0.0 30.31 4.2 1,668 4.99 1 —
Bank exposure
1 0.00 to 0.15 or less — — — — — — — — — — —
2 Exceeding 0.15 to 0.25 or less — — — — — — — — — — —
3 Exceeding 0.25 to 0.50 or less — — — — — — — — — — —
4 Exceeding 0.50 to 0.75 or less — — — — — — — — — — —
5 Exceeding 0.75 to 2.50 or less — — — — — — — — — — —
6 Exceeding 2.50 to 10.00 or less — — — — — — — — — — —
7 Exceeding 10.00 to 100.00 or less — — — — — — — — — — —
8 100.00 (default) — — — — — — — — — — —
9 Subtotal — — — — — — — — — — — —

CAPITAL ADEQUACY
64INTERIM REPORT 2019 The Norinchukin Bank
(Millions of Yen, %, Thousands, Year)
a b c d e f g h i j k l
No. PD scale
Original on-balance sheet gross exposure
Off-balance sheet
exposures pre CCF
Average CCF
EAD post CRM and post-CCF
Average PD
Number of obligors
Average LGD
Average maturity
RWARWA
densityEL Provisions
Corporate exposure (excluding SMEs exposure and specialized lending)
1 0.00 to 0.15 or less 3,844,967 1,521,898 0.44 4,751,789 0.05 0.3 29.79 2.8 766,451 16.12 743
2 Exceeding 0.15 to 0.25 or less 2,166,519 250,083 0.60 2,127,016 0.16 0.5 29.56 2.8 637,654 29.97 1,070
3 Exceeding 0.25 to 0.50 or less 274,815 35,618 0.44 292,195 0.42 0.2 28.06 2.5 118,518 40.56 344
4 Exceeding 0.50 to 0.75 or less 116,561 1,756 0.75 74,693 0.63 0.0 25.27 3.7 40,349 54.01 118
5 Exceeding 0.75 to 2.50 or less 243,826 26,639 0.36 244,393 1.23 0.5 27.95 2.4 147,886 60.51 839
6 Exceeding 2.50 to 10.00 or less 46,483 22,794 0.44 47,639 4.67 0.4 26.89 3.2 44,887 94.22 602
7 Exceeding 10.00 to 100.00 or less 60,950 6,208 0.81 57,628 15.81 0.3 28.08 2.3 80,313 139.36 2,560
8 100.00 (default) 37,789 3,008 0.26 33,215 100.00 0.1 26.98 1.6 — 0.00 8,964
9 Subtotal 6,791,913 1,868,007 0.46 7,628,572 0.72 2.7 29.51 2.8 1,836,060 24.06 15,244 12,014
SMEs exposure
1 0.00 to 0.15 or less — — — — — — — — — — —
2 Exceeding 0.15 to 0.25 or less — — — — — — — — — — —
3 Exceeding 0.25 to 0.50 or less — — — — — — — — — — —
4 Exceeding 0.50 to 0.75 or less — — — — — — — — — — —
5 Exceeding 0.75 to 2.50 or less — — — — — — — — — — —
6 Exceeding 2.50 to 10.00 or less — — — — — — — — — — —
7 Exceeding 10.00 to 100.00 or less — — — — — — — — — — —
8 100.00 (default) — — — — — — — — — — —
9 Subtotal — — — — — — — — — — — —
Specialized lending exposure
1 0.00 to 0.15 or less — — — — — — — — — — —
2 Exceeding 0.15 to 0.25 or less — — — — — — — — — — —
3 Exceeding 0.25 to 0.50 or less — — — — — — — — — — —
4 Exceeding 0.50 to 0.75 or less — — — — — — — — — — —
5 Exceeding 0.75 to 2.50 or less — — — — — — — — — — —
6 Exceeding 2.50 to 10.00 or less — — — — — — — — — — —
7 Exceeding 10.00 to 100.00 or less — — — — — — — — — — —
8 100.00 (default) — — — — — — — — — — —
9 Subtotal — — — — — — — — — — — —
Equity Exposure for Credit Risk Using Internal Ratings: PD/LGD Approach
1 0.00 to 0.15 or less — — — — — — — — — — —
2 Exceeding 0.15 to 0.25 or less — — — — — — — — — — —
3 Exceeding 0.25 to 0.50 or less — — — — — — — — — — —
4 Exceeding 0.50 to 0.75 or less — — — — — — — — — — —
5 Exceeding 0.75 to 2.50 or less — — — — — — — — — — —
6 Exceeding 2.50 to 10.00 or less — — — — — — — — — — —
7 Exceeding 10.00 to 100.00 or less — — — — — — — — — — —
8 100.00 (default) — — — — — — — — — — —
9 Subtotal — — — — — — — — — — —
Debt purchased for corporate (Default risk)
1 0.00 to 0.15 or less 163,162 36,500 1.00 206,509 0.05 0.0 30.35 1.2 17,480 8.46 31
2 Exceeding 0.15 to 0.25 or less 33,657 6,585 0.75 31,749 0.19 0.0 30.35 2.3 8,894 28.01 19
3 Exceeding 0.25 to 0.50 or less — — — — — — — — — — —
4 Exceeding 0.50 to 0.75 or less 2,646 1,204 0.75 4,685 0.63 0.0 30.35 1.2 1,969 42.02 8
5 Exceeding 0.75 to 2.50 or less 2,271 — — 1,135 0.83 0.0 30.35 1.0 516 45.44 2
6 Exceeding 2.50 to 10.00 or less — — — — — — — — — — —
7 Exceeding 10.00 to 100.00 or less — — — — — — — — — — —
8 100.00 (default) — — — — — — — — — — —
9 Subtotal 201,737 44,289 0.95 244,079 0.08 0.0 30.35 1.3 28,859 11.82 62 —
Debt purchased for corporate (Dilution risk)
1 0.00 to 0.15 or less — — — — — — — — — — —
2 Exceeding 0.15 to 0.25 or less — — — — — — — — — — —
3 Exceeding 0.25 to 0.50 or less — — — — — — — — — — —
4 Exceeding 0.50 to 0.75 or less — — — — — — — — — — —
5 Exceeding 0.75 to 2.50 or less — — — — — — — — — — —
6 Exceeding 2.50 to 10.00 or less — — — — — — — — — — —
7 Exceeding 10.00 to 100.00 or less — — — — — — — — — — —
8 100.00 (default) — — — — — — — — — — —
9 Subtotal — — — — — — — — — — — —
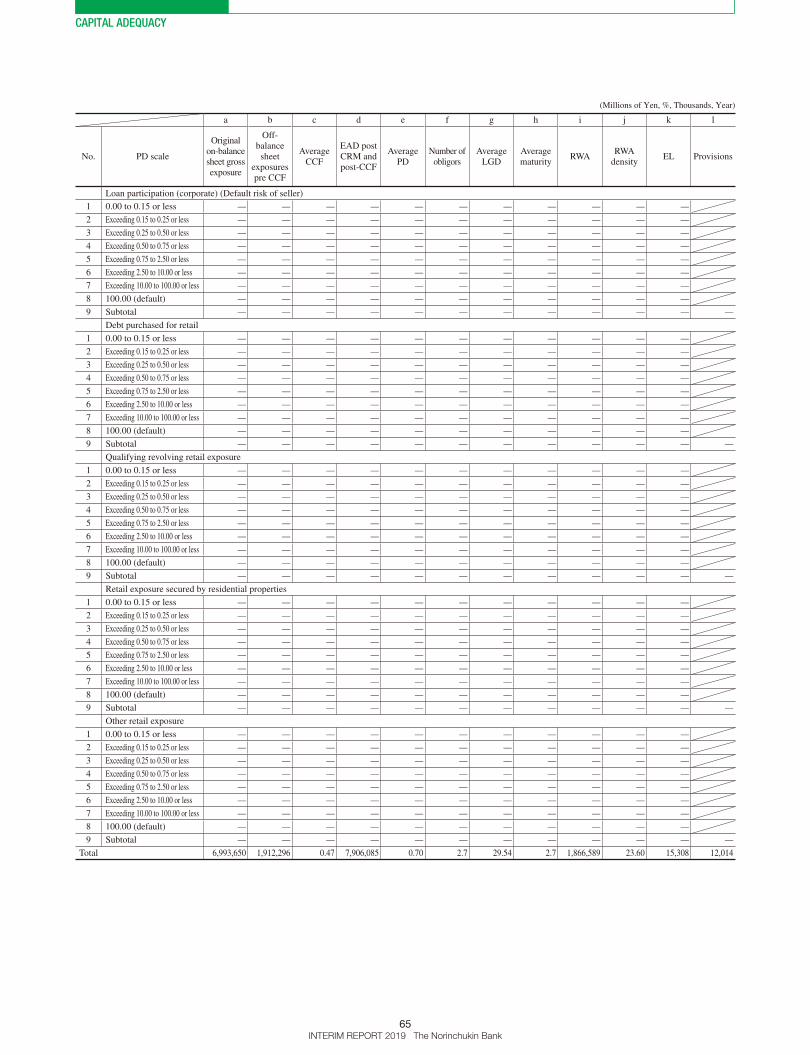
CAPITAL ADEQUACY
65INTERIM REPORT 2019 The Norinchukin Bank
(Millions of Yen, %, Thousands, Year)
a b c d e f g h i j k l
No. PD scale
Original on-balance sheet gross exposure
Off-balance sheet
exposures pre CCF
Average CCF
EAD post CRM and post-CCF
Average PD
Number of obligors
Average LGD
Average maturity
RWARWA
densityEL Provisions
Loan participation (corporate) (Default risk of seller)
1 0.00 to 0.15 or less — — — — — — — — — — —
2 Exceeding 0.15 to 0.25 or less — — — — — — — — — — —
3 Exceeding 0.25 to 0.50 or less — — — — — — — — — — —
4 Exceeding 0.50 to 0.75 or less — — — — — — — — — — —
5 Exceeding 0.75 to 2.50 or less — — — — — — — — — — —
6 Exceeding 2.50 to 10.00 or less — — — — — — — — — — —
7 Exceeding 10.00 to 100.00 or less — — — — — — — — — — —
8 100.00 (default) — — — — — — — — — — —
9 Subtotal — — — — — — — — — — — —
Debt purchased for retail
1 0.00 to 0.15 or less — — — — — — — — — — —
2 Exceeding 0.15 to 0.25 or less — — — — — — — — — — —
3 Exceeding 0.25 to 0.50 or less — — — — — — — — — — —
4 Exceeding 0.50 to 0.75 or less — — — — — — — — — — —
5 Exceeding 0.75 to 2.50 or less — — — — — — — — — — —
6 Exceeding 2.50 to 10.00 or less — — — — — — — — — — —
7 Exceeding 10.00 to 100.00 or less — — — — — — — — — — —
8 100.00 (default) — — — — — — — — — — —
9 Subtotal — — — — — — — — — — — —
Qualifying revolving retail exposure
1 0.00 to 0.15 or less — — — — — — — — — — —
2 Exceeding 0.15 to 0.25 or less — — — — — — — — — — —
3 Exceeding 0.25 to 0.50 or less — — — — — — — — — — —
4 Exceeding 0.50 to 0.75 or less — — — — — — — — — — —
5 Exceeding 0.75 to 2.50 or less — — — — — — — — — — —
6 Exceeding 2.50 to 10.00 or less — — — — — — — — — — —
7 Exceeding 10.00 to 100.00 or less — — — — — — — — — — —
8 100.00 (default) — — — — — — — — — — —
9 Subtotal — — — — — — — — — — — —
Retail exposure secured by residential properties
1 0.00 to 0.15 or less — — — — — — — — — — —
2 Exceeding 0.15 to 0.25 or less — — — — — — — — — — —
3 Exceeding 0.25 to 0.50 or less — — — — — — — — — — —
4 Exceeding 0.50 to 0.75 or less — — — — — — — — — — —
5 Exceeding 0.75 to 2.50 or less — — — — — — — — — — —
6 Exceeding 2.50 to 10.00 or less — — — — — — — — — — —
7 Exceeding 10.00 to 100.00 or less — — — — — — — — — — —
8 100.00 (default) — — — — — — — — — — —
9 Subtotal — — — — — — — — — — — —
Other retail exposure
1 0.00 to 0.15 or less — — — — — — — — — — —
2 Exceeding 0.15 to 0.25 or less — — — — — — — — — — —
3 Exceeding 0.25 to 0.50 or less — — — — — — — — — — —
4 Exceeding 0.50 to 0.75 or less — — — — — — — — — — —
5 Exceeding 0.75 to 2.50 or less — — — — — — — — — — —
6 Exceeding 2.50 to 10.00 or less — — — — — — — — — — —
7 Exceeding 10.00 to 100.00 or less — — — — — — — — — — —
8 100.00 (default) — — — — — — — — — — —
9 Subtotal — — — — — — — — — — — —
Total 6,993,650 1,912,296 0.47 7,906,085 0.70 2.7 29.54 2.7 1,866,589 23.60 15,308 12,014
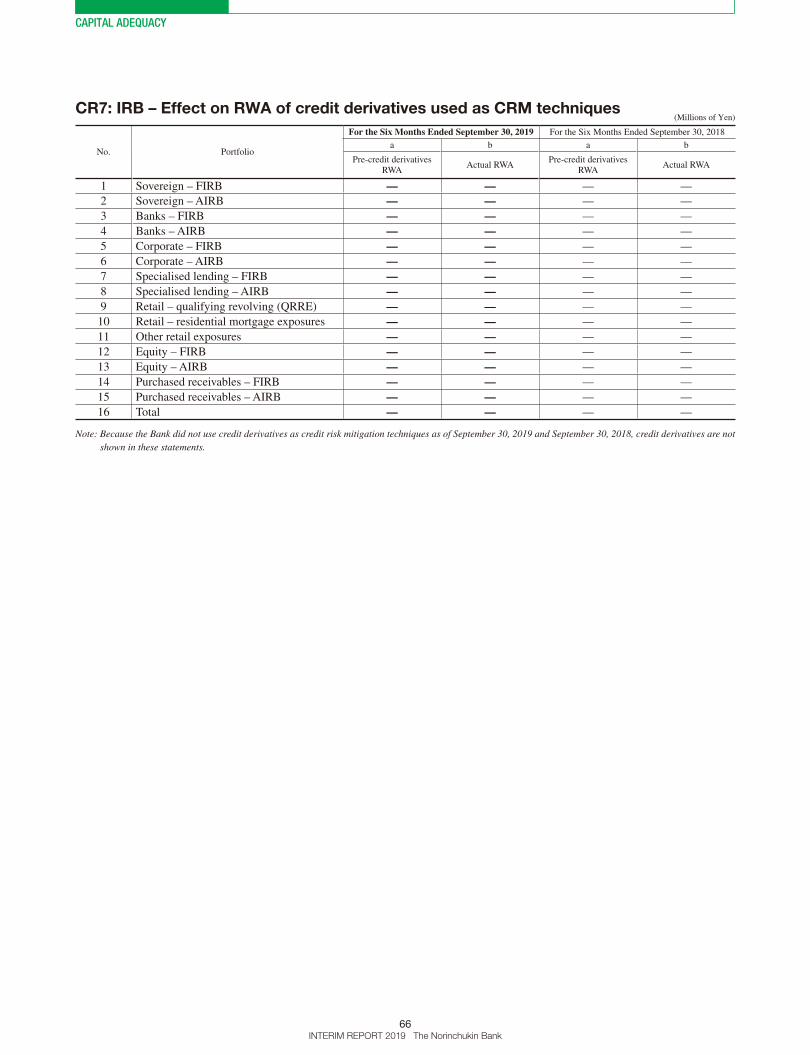
CAPITAL ADEQUACY
66INTERIM REPORT 2019 The Norinchukin Bank
CR7: IRB – Effect on RWA of credit derivatives used as CRM techniques (Millions of Yen)
No. Portfolio
For the Six Months Ended September 30, 2019 For the Six Months Ended September 30, 2018
a b a b
Pre-credit derivatives RWA
Actual RWAPre-credit derivatives
RWAActual RWA
1 Sovereign – FIRB — — — —
2 Sovereign – AIRB — — — —
3 Banks – FIRB — — — —
4 Banks – AIRB — — — —
5 Corporate – FIRB — — — —
6 Corporate – AIRB — — — —
7 Specialised lending – FIRB — — — —
8 Specialised lending – AIRB — — — —
9 Retail – qualifying revolving (QRRE) — — — —
10 Retail – residential mortgage exposures — — — —
11 Other retail exposures — — — —
12 Equity – FIRB — — — —
13 Equity – AIRB — — — —
14 Purchased receivables – FIRB — — — —
15 Purchased receivables – AIRB — — — —
16 Total — — — —
Note: Because the Bank did not use credit derivatives as credit risk mitigation techniques as of September 30, 2019 and September 30, 2018, credit derivatives are not shown in these statements.
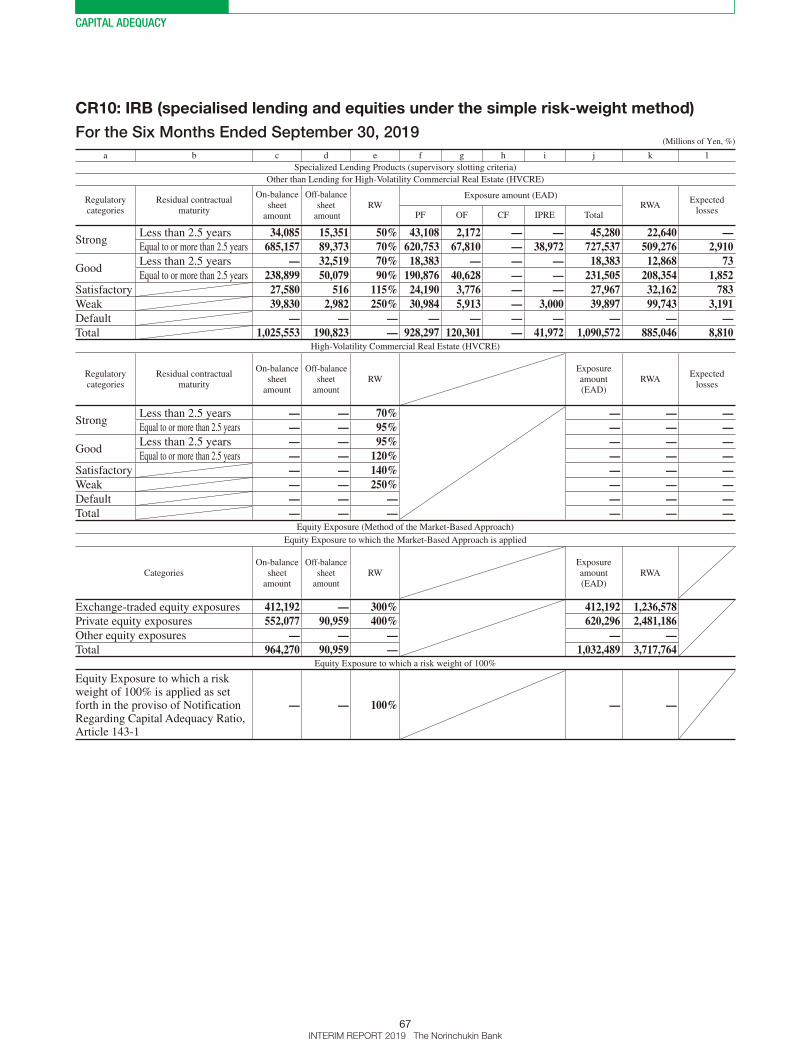
CAPITAL ADEQUACY
67INTERIM REPORT 2019 The Norinchukin Bank
CR10: IRB (specialised lending and equities under the simple risk-weight method)
For the Six Months Ended September 30, 2019 (Millions of Yen, %)
a b c d e f g h i j k l
Specialized Lending Products (supervisory slotting criteria)
Other than Lending for High-Volatility Commercial Real Estate (HVCRE)
Regulatory categories
Residual contractual maturity
On-balance sheet
amount
Off-balance sheet
amountRW
Exposure amount (EAD)RWA
Expected losses
PF OF CF IPRE Total
StrongLess than 2.5 years 34,085 15,351 50% 43,108 2,172 — — 45,280 22,640 —Equal to or more than 2.5 years 685,157 89,373 70% 620,753 67,810 — 38,972 727,537 509,276 2,910
GoodLess than 2.5 years — 32,519 70% 18,383 — — — 18,383 12,868 73 Equal to or more than 2.5 years 238,899 50,079 90% 190,876 40,628 — — 231,505 208,354 1,852
Satisfactory 27,580 516 115% 24,190 3,776 — — 27,967 32,162 783 Weak 39,830 2,982 250% 30,984 5,913 — 3,000 39,897 99,743 3,191 Default — — — — — — — — — —Total 1,025,553 190,823 — 928,297 120,301 — 41,972 1,090,572 885,046 8,810
High-Volatility Commercial Real Estate (HVCRE)
Regulatory categories
Residual contractual maturity
On-balance sheet
amount
Off-balance sheet
amountRW
Exposure amount (EAD)
RWAExpected
losses
StrongLess than 2.5 years — — 70% — — —Equal to or more than 2.5 years — — 95% — — —
GoodLess than 2.5 years — — 95% — — —Equal to or more than 2.5 years — — 120% — — —
Satisfactory — — 140% — — —Weak — — 250% — — —Default — — — — — —Total — — — — — —
Equity Exposure (Method of the Market-Based Approach)
Equity Exposure to which the Market-Based Approach is applied
CategoriesOn-balance
sheet amount
Off-balance sheet
amountRW
Exposure amount (EAD)
RWA
Exchange-traded equity exposures 412,192 — 300% 412,192 1,236,578 Private equity exposures 552,077 90,959 400% 620,296 2,481,186 Other equity exposures — — — — —Total 964,270 90,959 — 1,032,489 3,717,764
Equity Exposure to which a risk weight of 100%
Equity Exposure to which a risk weight of 100% is applied as set forth in the proviso of Notification Regarding Capital Adequacy Ratio, Article 143-1
— — 100% — —

CAPITAL ADEQUACY
68INTERIM REPORT 2019 The Norinchukin Bank
For the Six Months Ended September 30, 2018 (Millions of Yen, %)
a b c d e f g h i j k l
Specialized Lending Products (supervisory slotting criteria)
Other than Lending for High-Volatility Commercial Real Estate (HVCRE)
Regulatory categories
Residual contractual maturity
On-balance sheet
amount
Off-balance sheet
amountRW
Exposure amount (EAD)RWA
Expected losses
PF OF CF IPRE Total
StrongLess than 2.5 years 58,008 7,954 50% 63,973 — — — 63,973 31,986 —Equal to or more than 2.5 years 492,919 47,586 70% 448,866 20,823 — 38,581 508,271 355,790 2,033
GoodLess than 2.5 years 6,558 20,908 70% 18,880 — — — 18,880 13,216 75 Equal to or more than 2.5 years 167,975 18,748 90% 133,544 10,101 — — 143,646 129,281 1,149
Satisfactory 35,640 3,414 115% 24,518 13,683 — — 38,201 43,931 1,069 Weak 30,439 5,500 250% 25,357 6,849 — — 32,207 80,518 2,576 Default 805 — — — 1,822 — — 1,822 — 911 Total 792,348 104,112 — 715,142 53,281 — 38,581 807,004 654,725 7,815
High-Volatility Commercial Real Estate (HVCRE)
Regulatory categories
Residual contractual maturity
On-balance sheet
amount
Off-balance sheet
amountRW
Exposure amount (EAD)
RWAExpected
losses
StrongLess than 2.5 years — — 70% — — —Equal to or more than 2.5 years — — 95% — — —
GoodLess than 2.5 years — — 95% — — —Equal to or more than 2.5 years — — 120% — — —
Satisfactory — — 140% — — —Weak — — 250% — — —Default — — — — — —Total — — — — — —
Equity Exposure (Method of the Market-Based Approach)
Equity Exposure to which the Market-Based Approach is applied
CategoriesOn-balance
sheet amount
Off-balance sheet
amountRW
Exposure amount (EAD)
RWA
Exchange-traded equity exposures 20,396 — 300% 20,396 61,188 Private equity exposures 143,804 — 400% 143,804 575,219 Other equity exposures 385,978 — 276% 385,978 1,064,753 Total 550,179 — — 550,179 1,701,161
Equity Exposure to which a risk weight of 100%
Equity Exposure to which a risk weight of 100% is applied as set forth in the proviso of Notification Regarding Capital Adequacy Ratio, Article 143-1
— — 100% — —
CCR1: Analysis of counterparty credit risk (CCR) exposure by approach
For the Six Months Ended September 30, 2019 (Millions of Yen)
No.
a b c d e f
Replacement cost
Potential future
exposureEEPE
Alpha used for computing
regulatory EAD
EAD post-CRM
RWA
1 SA-CCR 15,684 243,157 1.4 388,416 56,236 2 Expected positive exposure method — — — —3 Simple Approach for credit risk mitigation — —4 Comprehensive Approach for credit risk mitigation 16,434,008 158,717 5 VaR — —6 Total 214,954

CAPITAL ADEQUACY
69INTERIM REPORT 2019 The Norinchukin Bank
For the Six Months Ended September 30, 2018 (Millions of Yen)
No.
a b c d e f
Replacement cost
Potential future
exposureEEPE
Alpha used for computing
regulatory EAD
EAD post-CRM
RWA
1 SA-CCR — — 1.4 — —
Current exposure method 31,203 233,198 284,812 39,775
2 Expected positive exposure method — — — —
3 Simple Approach for credit risk mitigation — —
4 Comprehensive Approach for credit risk mitigation 16,186,152 186,046
5 VaR — —
6 Total 225,821
CCR2: Credit valuation adjustment (CVA) capital charge (Millions of Yen)
No.
For the Six Months Ended September 30, 2019
For the Six Months Ended September 30, 2018
a b a b
EAD post-CRM RWA EAD post-CRM RWA
1Total portfolios subject to the Advanced CVA capital charge
— — — —
2 (i) VaR component (including the 3×multiplier) — —
3(ii) Stressed VaR component (including the
3×multiplier)— —
4All portfolios subject to the Standardized CVA capital charge
344,746 82,105 258,506 58,031
5 Total subject to the CVA capital charge 344,746 82,105 258,506 58,031
CCR3: Standardized approach – CCR exposures by regulatory portfolio and risk weights
For the Six Months Ended September 30, 2019 (Millions of Yen)
No.
a b c d e f g h i
Amount of Credit Exposure (Consideration the effect of credit risk mitigation techniques)
Risk weightItems
0% 10% 20% 50% 75% 100% 150% Others Total
1Japanese government and the Bank of Japan
— — — — — — — — —
2Foreign central government and their central banks
— — — — — — — — —
3 Bank for International Settlements — — — — — — — — —4 Japanese regional municipal bodies — — — — — — — — —
5Non-central government public sector entities
— — — — — — — — —
6 Multilateral Development Bank — — — — — — — — —
7Japan Finance Organization for Municipalities
— — — — — — — — —
8 Japanese government institutions — — — — — — — — —9 Regional third-sector company — — — — — — — — —10 Banks and securities firms — — — — — — — — —11 Corporates — — — — — — — — —12 SMEs and individuals — — — — — — — — —13 Other than above — — — — — — — — —14 Total — — — — — — — — —
Note: The Bank had no counterparty credit risk exposure subject to the Standardized Approach as of September 30, 2019.

CAPITAL ADEQUACY
70INTERIM REPORT 2019 The Norinchukin Bank
For the Six Months Ended September 30, 2018 (Millions of Yen)
No.
a b c d e f g h i
Amount of Credit Exposure (Consideration the effect of credit risk mitigation techniques)
Risk weightItems
0% 10% 20% 50% 75% 100% 150% Others Total
1Japanese government and the Bank of Japan
— — — — — — — — —
2Foreign central government and their central banks
— — — — — — — — —
3 Bank for International Settlements — — — — — — — — —
4 Japanese regional municipal bodies — — — — — — — — —
5Non-central government public sector entities
— — — — — — — — —
6 Multilateral Development Bank — — — — — — — — —
7Japan Finance Organization for Municipalities
— — — — — — — — —
8 Japanese government institutions — — — — — — — — —
9 Regional third-sector company — — — — — — — — —
10 Banks and securities firms — — — — — — — — —
11 Corporates — — — — — — — — —
12 SMEs and individuals — — — — — — — — —
13 Other than above — — — — — — — — —
14 Total — — — — — — — — —
Note: As of September 30, 2018, although the Bank applied the standardized approach to some of the derivatives, the RWAs are not shown in these statements because the amounts of such assets were less than one million yen.

CAPITAL ADEQUACY
71INTERIM REPORT 2019 The Norinchukin Bank
CCR4: IRB – CCR exposures by portfolio and PD scale
■ Foundation Internal Ratings-Based Approach (F-IRB)
For the Six Months Ended September 30, 2019 (Millions of Yen, %, Thousands, Year)
No.
a b c d e f g
PD scale EAD post-CRM Average PDNumber of
obligorsAverage LGD
Average maturity
RWA RWA density
Sovereign exposure
1 0.00 to 0.15 or less 2,529,118 0.00 0.0 45.00 0.5 — 0.00 2 Exceeding 0.15 to 0.25 or less — — — — — — —3 Exceeding 0.25 to 0.50 or less — — — — — — —4 Exceeding 0.50 to 0.75 or less — — — — — — —5 Exceeding 0.75 to 2.50 or less — — — — — — —6 Exceeding 2.50 to 10.00 or less — — — — — — —7 Exceeding 10.00 to 100.00 or less — — — — — — —8 100.00 (default) — — — — — — —9 Subtotal 2,529,118 0.00 0.0 45.00 0.5 — 0.00
Bank exposure
1 0.00 to 0.15 or less 12,987,537 0.03 0.0 7.57 0.2 168,077 1.29 2 Exceeding 0.15 to 0.25 or less — — — — — — —3 Exceeding 0.25 to 0.50 or less — — — — — — —4 Exceeding 0.50 to 0.75 or less — — — — — — —5 Exceeding 0.75 to 2.50 or less — — — — — — —6 Exceeding 2.50 to 10.00 or less — — — — — — —7 Exceeding 10.00 to 100.00 or less — — — — — — —8 100.00 (default) — — — — — — —9 Subtotal 12,987,537 0.03 0.0 7.57 0.2 168,077 1.29
Corporate exposure
1 0.00 to 0.15 or less — — — — — — —2 Exceeding 0.15 to 0.25 or less — — — — — — —3 Exceeding 0.25 to 0.50 or less — — — — — — —4 Exceeding 0.50 to 0.75 or less — — — — — — —5 Exceeding 0.75 to 2.50 or less — — — — — — —6 Exceeding 2.50 to 10.00 or less — — — — — — —7 Exceeding 10.00 to 100.00 or less — — — — — — —8 100.00 (default) — — — — — — —9 Subtotal — — — — — — —
Total 15,516,656 0.02 0.0 13.67 0.2 168,077 1.08
Note: The number of counterparties is less than 100 in each portfolio.

CAPITAL ADEQUACY
72INTERIM REPORT 2019 The Norinchukin Bank
For the Six Months Ended September 30, 2018 (Millions of Yen, %, Thousands, Year)
No.
a b c d e f g
PD scale EAD post-CRM Average PDNumber of
obligorsAverage LGD
Average maturity
RWA RWA density
Sovereign exposure
1 0.00 to 0.15 or less 2,257,620 0.00 0.0 45.00 0.4 — 0.00
2 Exceeding 0.15 to 0.25 or less — — — — — — —
3 Exceeding 0.25 to 0.50 or less — — — — — — —
4 Exceeding 0.50 to 0.75 or less — — — — — — —
5 Exceeding 0.75 to 2.50 or less — — — — — — —
6 Exceeding 2.50 to 10.00 or less — — — — — — —
7 Exceeding 10.00 to 100.00 or less — — — — — — —
8 100.00 (default) — — — — — — —
9 Subtotal 2,257,620 0.00 0.0 45.00 0.4 — 0.00
Bank exposure
1 0.00 to 0.15 or less 12,963,759 0.03 0.0 8.13 0.1 184,180 1.42
2 Exceeding 0.15 to 0.25 or less — — — — — — —
3 Exceeding 0.25 to 0.50 or less — — — — — — —
4 Exceeding 0.50 to 0.75 or less — — — — — — —
5 Exceeding 0.75 to 2.50 or less — — — — — — —
6 Exceeding 2.50 to 10.00 or less — — — — — — —
7 Exceeding 10.00 to 100.00 or less — — — — — — —
8 100.00 (default) — — — — — — —
9 Subtotal 12,963,759 0.03 0.0 8.13 0.1 184,180 1.42
Corporate exposure
1 0.00 to 0.15 or less — — — — — — —
2 Exceeding 0.15 to 0.25 or less — — — — — — —
3 Exceeding 0.25 to 0.50 or less — — — — — — —
4 Exceeding 0.50 to 0.75 or less — — — — — — —
5 Exceeding 0.75 to 2.50 or less — — — — — — —
6 Exceeding 2.50 to 10.00 or less — — — — — — —
7 Exceeding 10.00 to 100.00 or less — — — — — — —
8 100.00 (default) — — — — — — —
9 Subtotal — — — — — — —
Total 15,221,379 0.02 0.0 13.60 0.2 184,180 1.21
Note: The number of counterparties is less than 100 in each portfolio.

CAPITAL ADEQUACY
73INTERIM REPORT 2019 The Norinchukin Bank
CCR4: IRB – CCR exposures by portfolio and PD scale
■ Advanced Internal Ratings-Based Approach (A-IRB)
For the Six Months Ended September 30, 2019 (Millions of Yen, %, Thousands, Year)
No.
a b c d e f g
PD scale EAD post-CRM Average PDNumber of
obligorsAverage LGD
Average maturity
RWA RWA density
Sovereign exposure
1 0.00 to 0.15 or less — — — — — — —2 Exceeding 0.15 to 0.25 or less — — — — — — —3 Exceeding 0.25 to 0.50 or less — — — — — — —4 Exceeding 0.50 to 0.75 or less — — — — — — —5 Exceeding 0.75 to 2.50 or less — — — — — — —6 Exceeding 2.50 to 10.00 or less — — — — — — —7 Exceeding 10.00 to 100.00 or less — — — — — — —8 100.00 (default) — — — — — — —9 Subtotal — — — — — — —
Bank exposure
1 0.00 to 0.15 or less — — — — — — —2 Exceeding 0.15 to 0.25 or less — — — — — — —3 Exceeding 0.25 to 0.50 or less — — — — — — —4 Exceeding 0.50 to 0.75 or less — — — — — — —5 Exceeding 0.75 to 2.50 or less — — — — — — —6 Exceeding 2.50 to 10.00 or less — — — — — — —7 Exceeding 10.00 to 100.00 or less — — — — — — —8 100.00 (default) — — — — — — —9 Subtotal — — — — — — —
Corporate exposure
1 0.00 to 0.15 or less 1,301,716 0.05 0.0 17.31 0.1 44,648 3.42 2 Exceeding 0.15 to 0.25 or less 1,764 0.15 0.0 30.35 2.5 461 26.16 3 Exceeding 0.25 to 0.50 or less 108 0.42 0.0 30.35 2.2 45 41.52 4 Exceeding 0.50 to 0.75 or less — — — — — — —5 Exceeding 0.75 to 2.50 or less 2,179 0.83 0.0 30.35 4.9 1,721 79.00 6 Exceeding 2.50 to 10.00 or less — — — — — — —7 Exceeding 10.00 to 100.00 or less — — — — — — —8 100.00 (default) — — — — — — —9 Subtotal 1,305,768 0.05 0.0 17.35 0.1 46,876 3.58
Total 1,305,768 0.05 0.0 17.35 0.1 46,876 3.58
Note: The number of counterparties is less than 100 in each portfolio.
For the Six Months Ended September 30, 2018 (Millions of Yen, %, Thousands, Year)
No.
a b c d e f g
PD scale EAD post-CRM Average PDNumber of
obligorsAverage LGD
Average maturity
RWA RWA density
Sovereign exposure
1 0.00 to 0.15 or less — — — — — — —
2 Exceeding 0.15 to 0.25 or less — — — — — — —
3 Exceeding 0.25 to 0.50 or less — — — — — — —
4 Exceeding 0.50 to 0.75 or less — — — — — — —
5 Exceeding 0.75 to 2.50 or less — — — — — — —
6 Exceeding 2.50 to 10.00 or less — — — — — — —
7 Exceeding 10.00 to 100.00 or less — — — — — — —
8 100.00 (default) — — — — — — —
9 Subtotal — — — — — — —

CAPITAL ADEQUACY
74INTERIM REPORT 2019 The Norinchukin Bank
(Millions of Yen, %, Thousands, Year)
No.
a b c d e f g
PD scale EAD post-CRM Average PDNumber of
obligorsAverage LGD
Average maturity
RWA RWA density
Bank exposure
1 0.00 to 0.15 or less — — — — — — —
2 Exceeding 0.15 to 0.25 or less — — — — — — —
3 Exceeding 0.25 to 0.50 or less — — — — — — —
4 Exceeding 0.50 to 0.75 or less — — — — — — —
5 Exceeding 0.75 to 2.50 or less — — — — — — —
6 Exceeding 2.50 to 10.00 or less — — — — — — —
7 Exceeding 10.00 to 100.00 or less — — — — — — —
8 100.00 (default) — — — — — — —
9 Subtotal — — — — — — —
Corporate exposure
1 0.00 to 0.15 or less 1,247,031 0.05 0.0 17.30 0.1 40,385 3.23
2 Exceeding 0.15 to 0.25 or less 1,205 0.15 0.0 30.35 2.4 308 25.57
3 Exceeding 0.25 to 0.50 or less 1,626 0.42 0.0 30.35 4.9 1,005 61.79
4 Exceeding 0.50 to 0.75 or less — — — — — — —
5 Exceeding 0.75 to 2.50 or less 58 0.97 0.0 30.35 1.2 29 50.46
6 Exceeding 2.50 to 10.00 or less — — — — — — —
7 Exceeding 10.00 to 100.00 or less — — — — — — —
8 100.00 (default) — — — — — — —
9 Subtotal 1,249,921 0.05 0.0 17.33 0.1 41,727 3.33
Total 1,249,921 0.05 0.0 17.33 0.1 41,727 3.33
Note: The number of counterparties is less than 100 in each portfolio.
CCR5: Composition of collateral for CCR exposure
For the Six Months Ended September 30, 2019 (Millions of Yen)
No.
a b c d e f
Collateral used in derivative transactions Collateral used in SFTs
Fair value of collateral received Fair value of posted collateral Fair value of collateral
received
Fair value of posted col-
lateralSegregated Unsegregated Segregated Unsegregated
1 Cash – domestic currency — 129,840 393,800 182,763 578,257 4,700 2 Cash – other currencies — 6,786 241,985 32,286 18,895,976 55,665 3 Domestic sovereign debt — — 814,410 — 400 7,254,415 4 Other sovereign debt — — 27,186 1,120 21,198 11,482,025 5 Government agency debt — — — — — 2,214,093 6 Corporate bonds — — — — — —7 Equity securities — — — 33,701 — —8 Other collateral — — — — 366 3,022,326 9 Total — 136,627 1,477,383 249,870 19,496,199 24,033,226

CAPITAL ADEQUACY
75INTERIM REPORT 2019 The Norinchukin Bank
For the Six Months Ended September 30, 2018 (Millions of Yen)
No.
a b c d e f
Collateral used in derivative transactions Collateral used in SFTs
Fair value of collateral received Fair value of posted collateral Fair value of collateral
received
Fair value of posted col-
lateralSegregated Unsegregated Segregated Unsegregated
1 Cash – domestic currency — 885 — 526,574 612,744 41,900
2 Cash – other currencies — — — 30,163 19,053,311 70,730
3 Domestic sovereign debt — — 620,951 — 36,100 6,453,562
4 Other sovereign debt — — 1,162 — — 11,681,604
5 Government agency debt — — — — — 3,433,495
6 Corporate bonds — — — — — 487,867
7 Equity securities — — 32,348 — — —
8 Other collateral — — — — — 2,036,633
9 Total — 885 654,461 556,737 19,702,156 24,205,794
CCR6: Credit derivatives exposures (Millions of Yen)
No.
For the Six Months Ended September 30, 2019
For the Six Months Ended September 30, 2018
a b a b
Protection bought Protection sold Protection bought Protection sold
Notionals
1 Single-name credit default swaps — — — —
2 Index credit default swaps — — — —
3 Total return swaps — — — —
4 Credit options — — — —
5 Other credit derivatives — — — —
6 Total notionals — — — —
Fair values
7 Positive fair value (asset) — — — —
8 Negative fair value (liability) — — — —
Note: The Bank had no amount of credit derivative instruments exposure subject to the tallying on this template as of September 30, 2019 and September 30, 2018.

CAPITAL ADEQUACY
76INTERIM REPORT 2019 The Norinchukin Bank
CCR8: Exposures to central counterparties (Millions of Yen)
No.
For the Six Months Ended September 30, 2019
For the Six Months Ended September 30, 2018
a b a b
EAD (post-CRM) RWA EAD (post-CRM) RWA
1 Exposures to QCCPs (total) 189,974 171,806
2Exposures for trades at QCCPs (excluding initial margin and default fund contributions); of which
8,649,539 390 8,726,445 18,797
3 (i) OTC derivatives 1,157,742 381 813,962 18,733
4 (ii) Exchange-traded derivatives 230 9 1,604 64
5 (iii) Securities financing transactions 7,491,566 — 7,910,878 —
6(iv) Netting sets where cross-product netting
has been approved— — — —
7 Segregated initial margin 509,384 —
8 Non-segregated initial margin 107,670 0 293,150 593
9 Pre-funded default fund contributions 105,294 189,582 107,675 152,414
10 Unfunded default fund contributions — — — —
11 Exposures to non-QCCPs (total) — —
12Exposures for trades at non-QCCPs (excluding initial margin and default fund contributions); of which
— — — —
13 (i) OTC derivatives — — — —
14 (ii) Exchange-traded derivatives — — — —
15 (iii) Securities financing transactions — — — —
16(iv) Netting sets where cross-product netting
has been approved— — — —
17 Segregated initial margin — —
18 Non-segregated initial margin — — — —
19 Pre-funded default fund contributions — — — —
20 Unfunded default fund contributions — — — —
SEC1: Securitization exposures in the banking book
For the Six Months Ended September 30, 2019 (Millions of Yen)
No. Types of underlying assets
a b c d e f g h i
Bank acts as originator Bank acts as sponsor Banks acts as investor
Traditional Synthetic Sub-total Traditional Synthetic Sub-total Traditional Synthetic Sub-total
1 Retail (total) – of which — — — — — — 2,505,705 — 2,505,7052 residential mortgage — — — — — — 1,522,963 — 1,522,9633 credit card — — — — — — 338,944 — 338,9444 other retail exposures — — — — — — 643,797 — 643,7975 re-securitization — — — — — — 0 — 06 Wholesale (total) – of which — — — — — — 8,137,439 — 8,137,4397 loans to corporates — — — — — — 8,069,715 — 8,069,7158 commercial mortgage — — — — — — 65,604 — 65,6049 lease and receivables — — — — — — 2,119 — 2,11910 other wholesale — — — — — — — — —11 re-securitization — — — — — — — — —
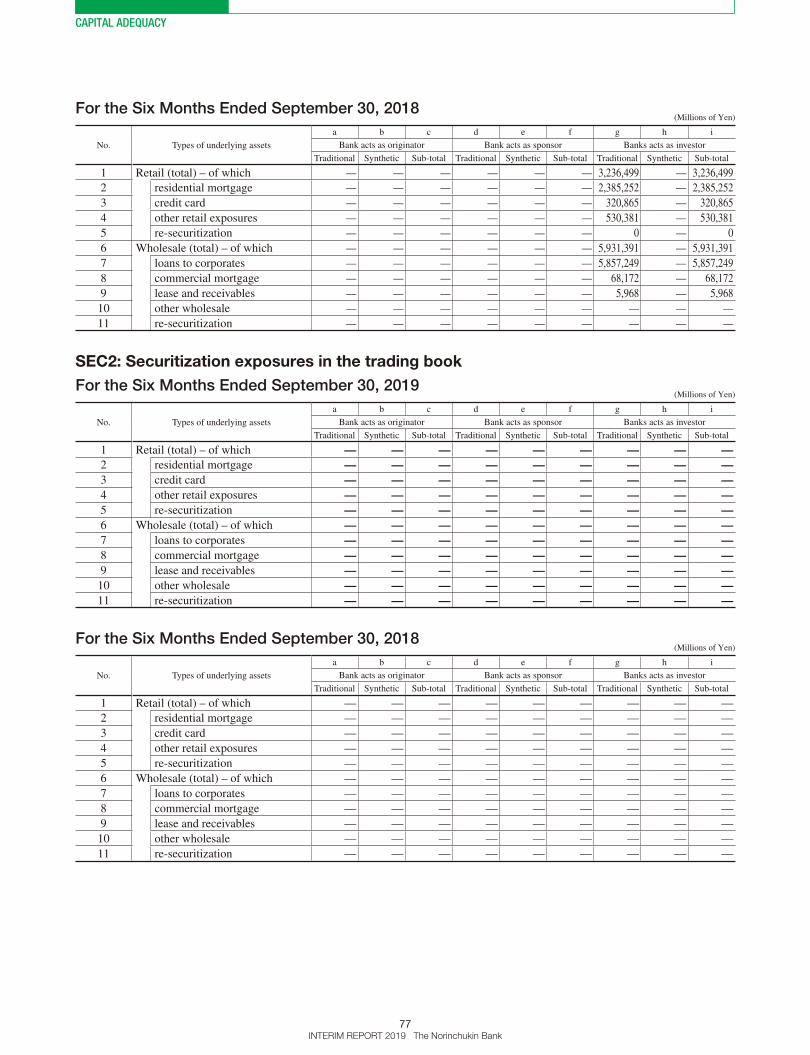
CAPITAL ADEQUACY
77INTERIM REPORT 2019 The Norinchukin Bank
For the Six Months Ended September 30, 2018 (Millions of Yen)
No. Types of underlying assets
a b c d e f g h i
Bank acts as originator Bank acts as sponsor Banks acts as investor
Traditional Synthetic Sub-total Traditional Synthetic Sub-total Traditional Synthetic Sub-total
1 Retail (total) – of which — — — — — — 3,236,499 — 3,236,499
2 residential mortgage — — — — — — 2,385,252 — 2,385,252
3 credit card — — — — — — 320,865 — 320,865
4 other retail exposures — — — — — — 530,381 — 530,381
5 re-securitization — — — — — — 0 — 0
6 Wholesale (total) – of which — — — — — — 5,931,391 — 5,931,391
7 loans to corporates — — — — — — 5,857,249 — 5,857,249
8 commercial mortgage — — — — — — 68,172 — 68,172
9 lease and receivables — — — — — — 5,968 — 5,968
10 other wholesale — — — — — — — — —
11 re-securitization — — — — — — — — —
SEC2: Securitization exposures in the trading book
For the Six Months Ended September 30, 2019 (Millions of Yen)
No. Types of underlying assets
a b c d e f g h i
Bank acts as originator Bank acts as sponsor Banks acts as investor
Traditional Synthetic Sub-total Traditional Synthetic Sub-total Traditional Synthetic Sub-total
1 Retail (total) – of which — — — — — — — — —2 residential mortgage — — — — — — — — —3 credit card — — — — — — — — —4 other retail exposures — — — — — — — — —5 re-securitization — — — — — — — — —6 Wholesale (total) – of which — — — — — — — — —7 loans to corporates — — — — — — — — —8 commercial mortgage — — — — — — — — —9 lease and receivables — — — — — — — — —10 other wholesale — — — — — — — — —11 re-securitization — — — — — — — — —
For the Six Months Ended September 30, 2018 (Millions of Yen)
No. Types of underlying assets
a b c d e f g h i
Bank acts as originator Bank acts as sponsor Banks acts as investor
Traditional Synthetic Sub-total Traditional Synthetic Sub-total Traditional Synthetic Sub-total
1 Retail (total) – of which — — — — — — — — —
2 residential mortgage — — — — — — — — —
3 credit card — — — — — — — — —
4 other retail exposures — — — — — — — — —
5 re-securitization — — — — — — — — —
6 Wholesale (total) – of which — — — — — — — — —
7 loans to corporates — — — — — — — — —
8 commercial mortgage — — — — — — — — —
9 lease and receivables — — — — — — — — —
10 other wholesale — — — — — — — — —
11 re-securitization — — — — — — — — —

CAPITAL ADEQUACY
78INTERIM REPORT 2019 The Norinchukin Bank
SEC3: Securitization exposures in the banking book and associated regulatory capital
requirements – bank acting as originator or as sponsor
For the Six Months Ended September 30, 2019 (Millions of Yen)
No.
a b c d e f g h i j k l m n o
Total exposures
Traditional securitization Synthetic securitization
Of which securitization Of which re-securitization Of which securitization Of which re-securitization
Of which retail
underly-ing
Of which wholesale
Of which senior
Of which non-
senior
Of which retail
underly-ing
Of which wholesale
Of which senior
Of which non-
senior
Exposure values (by RW bands)
1 ≤20% RW — — — — — — — — — — — — — — —2 >20% to 50% RW — — — — — — — — — — — — — — —
3>50% to 100% RW
— — — — — — — — — — — — — — —
4>100% to <1,250% RW
— — — — — — — — — — — — — — —
5 1,250% RW — — — — — — — — — — — — — — —Exposure values (by regulatory approach)
6 SEC-IRBA or IAA — — — — — — — — — — — — — — —7 SEC-ERBA — — — — — — — — — — — — — — —8 SEC-SA — — — — — — — — — — — — — — —9 1,250% — — — — — — — — — — — — — — —
RWA (by regulatory approach)
10 SEC-IRBA or IAA — — — — — — — — — — — — — — —11 SEC-ERBA — — — — — — — — — — — — — — —12 SEC-SA — — — — — — — — — — — — — — —13 1,250% — — — — — — — — — — — — — — —
Capital charge after cap
14 SEC-IRBA or IAA — — — — — — — — — — — — — — —15 SEC-ERBA — — — — — — — — — — — — — — —16 SEC-SA — — — — — — — — — — — — — — —17 1,250% — — — — — — — — — — — — — — —
For the Six Months Ended September 30, 2018 (Millions of Yen)
No.
a b c d e f g h i j k l m n o
Total exposures
Traditional securitization Synthetic securitization
Of which securitization Of which re-securitization Of which securitization Of which re-securitization
Of which retail
underly-ing
Of which wholesale
Of which senior
Of which non-
senior
Of which retail
underly-ing
Of which wholesale
Of which senior
Of which non-
senior
Exposure values (by RW bands)
1 ≤20% RW — — — — — — — — — — — — — — —
2 >20% to 50% RW — — — — — — — — — — — — — — —
3>50% to 100% RW
— — — — — — — — — — — — — — —
4>100% to <1,250% RW
— — — — — — — — — — — — — — —
5 1,250% RW — — — — — — — — — — — — — — —
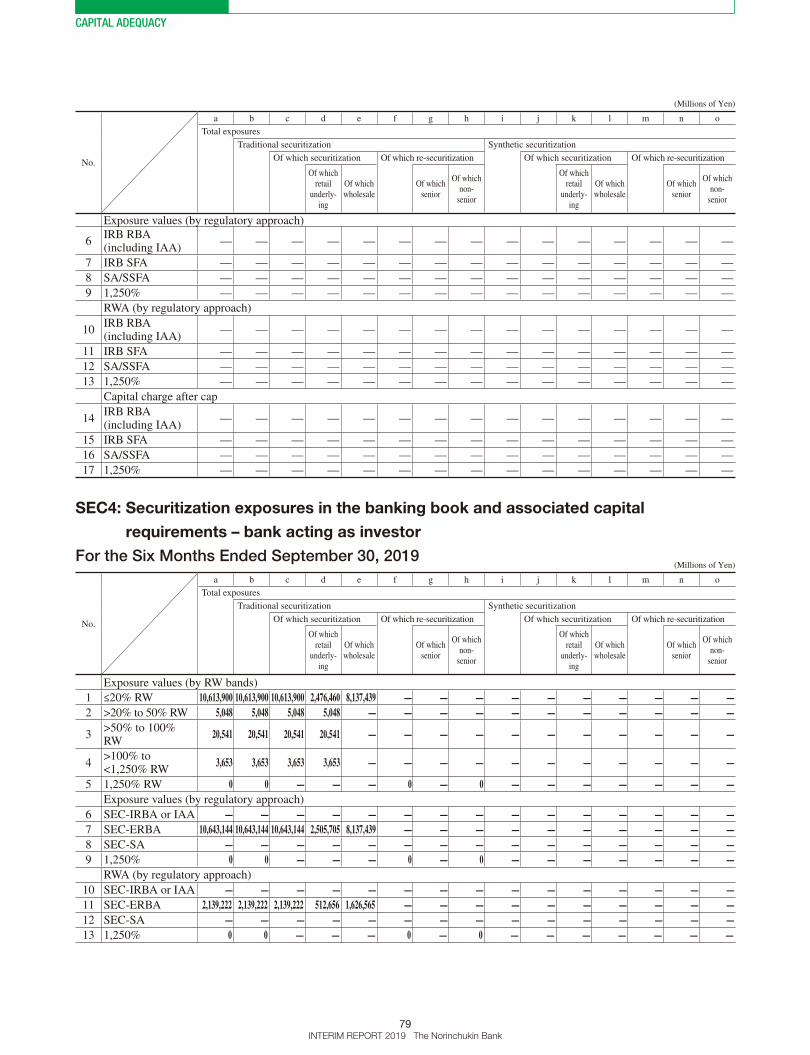
CAPITAL ADEQUACY
79INTERIM REPORT 2019 The Norinchukin Bank
(Millions of Yen)
No.
a b c d e f g h i j k l m n o
Total exposures
Traditional securitization Synthetic securitization
Of which securitization Of which re-securitization Of which securitization Of which re-securitization
Of which retail
underly-ing
Of which wholesale
Of which senior
Of which non-
senior
Of which retail
underly-ing
Of which wholesale
Of which senior
Of which non-
senior
Exposure values (by regulatory approach)
6IRB RBA (including IAA)
— — — — — — — — — — — — — — —
7 IRB SFA — — — — — — — — — — — — — — —
8 SA/SSFA — — — — — — — — — — — — — — —
9 1,250% — — — — — — — — — — — — — — —
RWA (by regulatory approach)
10IRB RBA (including IAA)
— — — — — — — — — — — — — — —
11 IRB SFA — — — — — — — — — — — — — — —
12 SA/SSFA — — — — — — — — — — — — — — —
13 1,250% — — — — — — — — — — — — — — —
Capital charge after cap
14IRB RBA (including IAA)
— — — — — — — — — — — — — — —
15 IRB SFA — — — — — — — — — — — — — — —
16 SA/SSFA — — — — — — — — — — — — — — —
17 1,250% — — — — — — — — — — — — — — —
SEC4: Securitization exposures in the banking book and associated capital
requirements – bank acting as investor
For the Six Months Ended September 30, 2019 (Millions of Yen)
No.
a b c d e f g h i j k l m n o
Total exposures
Traditional securitization Synthetic securitization
Of which securitization Of which re-securitization Of which securitization Of which re-securitization
Of which retail
underly-ing
Of which wholesale
Of which senior
Of which non-
senior
Of which retail
underly-ing
Of which wholesale
Of which senior
Of which non-
senior
Exposure values (by RW bands)
1 ≤20% RW 10,613,900 10,613,900 10,613,900 2,476,460 8,137,439 — — — — — — — — — —2 >20% to 50% RW 5,048 5,048 5,048 5,048 — — — — — — — — — — —
3>50% to 100% RW
20,541 20,541 20,541 20,541 — — — — — — — — — — —
4>100% to <1,250% RW
3,653 3,653 3,653 3,653 — — — — — — — — — — —
5 1,250% RW 0 0 — — — 0 — 0 — — — — — — —Exposure values (by regulatory approach)
6 SEC-IRBA or IAA — — — — — — — — — — — — — — —7 SEC-ERBA 10,643,144 10,643,144 10,643,144 2,505,705 8,137,439 — — — — — — — — — —8 SEC-SA — — — — — — — — — — — — — — —9 1,250% 0 0 — — — 0 — 0 — — — — — — —
RWA (by regulatory approach)
10 SEC-IRBA or IAA — — — — — — — — — — — — — — —11 SEC-ERBA 2,139,222 2,139,222 2,139,222 512,656 1,626,565 — — — — — — — — — —12 SEC-SA — — — — — — — — — — — — — — —13 1,250% 0 0 — — — 0 — 0 — — — — — — —
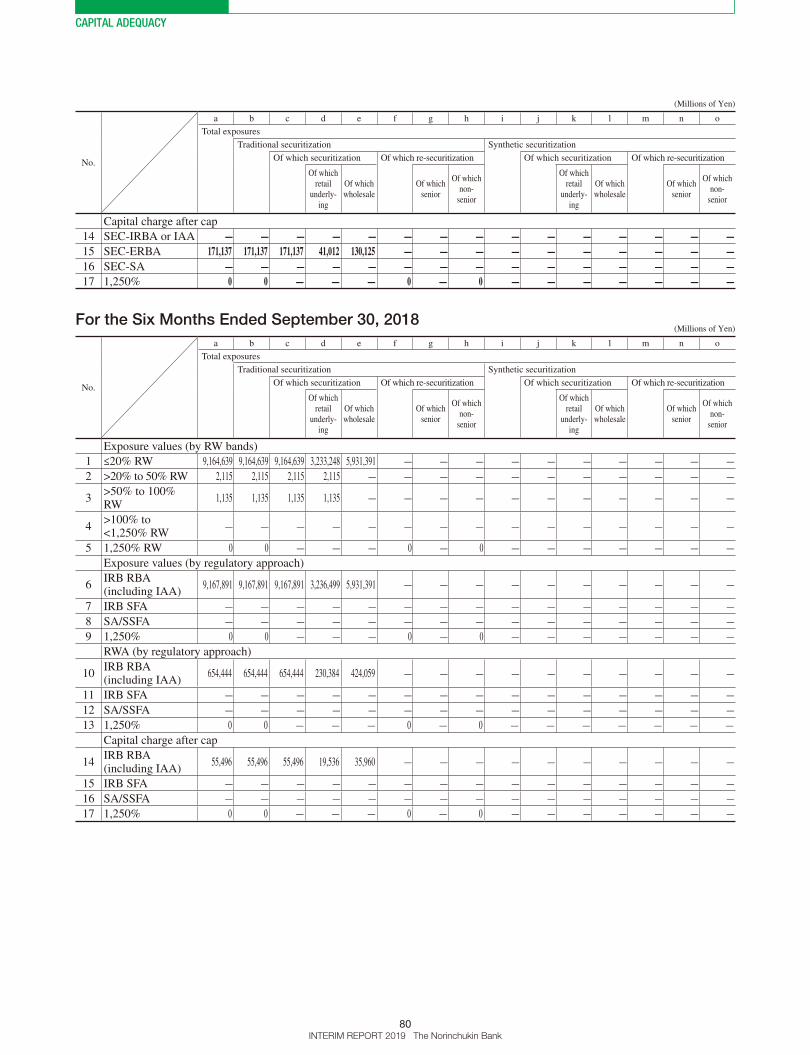
CAPITAL ADEQUACY
80INTERIM REPORT 2019 The Norinchukin Bank
(Millions of Yen)
No.
a b c d e f g h i j k l m n o
Total exposures
Traditional securitization Synthetic securitization
Of which securitization Of which re-securitization Of which securitization Of which re-securitization
Of which retail
underly-ing
Of which wholesale
Of which senior
Of which non-
senior
Of which retail
underly-ing
Of which wholesale
Of which senior
Of which non-
senior
Capital charge after cap
14 SEC-IRBA or IAA — — — — — — — — — — — — — — —15 SEC-ERBA 171,137 171,137 171,137 41,012 130,125 — — — — — — — — — —16 SEC-SA — — — — — — — — — — — — — — —17 1,250% 0 0 — — — 0 — 0 — — — — — — —
For the Six Months Ended September 30, 2018 (Millions of Yen)
No.
a b c d e f g h i j k l m n o
Total exposures
Traditional securitization Synthetic securitization
Of which securitization Of which re-securitization Of which securitization Of which re-securitization
Of which retail
underly-ing
Of which wholesale
Of which senior
Of which non-
senior
Of which retail
underly-ing
Of which wholesale
Of which senior
Of which non-
senior
Exposure values (by RW bands)
1 ≤20% RW 9,164,639 9,164,639 9,164,639 3,233,248 5,931,391 — — — — — — — — — —
2 >20% to 50% RW 2,115 2,115 2,115 2,115 — — — — — — — — — — —
3>50% to 100% RW
1,135 1,135 1,135 1,135 — — — — — — — — — — —
4>100% to <1,250% RW
— — — — — — — — — — — — — — —
5 1,250% RW 0 0 — — — 0 — 0 — — — — — — —
Exposure values (by regulatory approach)
6IRB RBA (including IAA)
9,167,891 9,167,891 9,167,891 3,236,499 5,931,391 — — — — — — — — — —
7 IRB SFA — — — — — — — — — — — — — — —
8 SA/SSFA — — — — — — — — — — — — — — —
9 1,250% 0 0 — — — 0 — 0 — — — — — — —
RWA (by regulatory approach)
10IRB RBA (including IAA)
654,444 654,444 654,444 230,384 424,059 — — — — — — — — — —
11 IRB SFA — — — — — — — — — — — — — — —
12 SA/SSFA — — — — — — — — — — — — — — —
13 1,250% 0 0 — — — 0 — 0 — — — — — — —
Capital charge after cap
14IRB RBA (including IAA)
55,496 55,496 55,496 19,536 35,960 — — — — — — — — — —
15 IRB SFA — — — — — — — — — — — — — — —
16 SA/SSFA — — — — — — — — — — — — — — —
17 1,250% 0 0 — — — 0 — 0 — — — — — — —
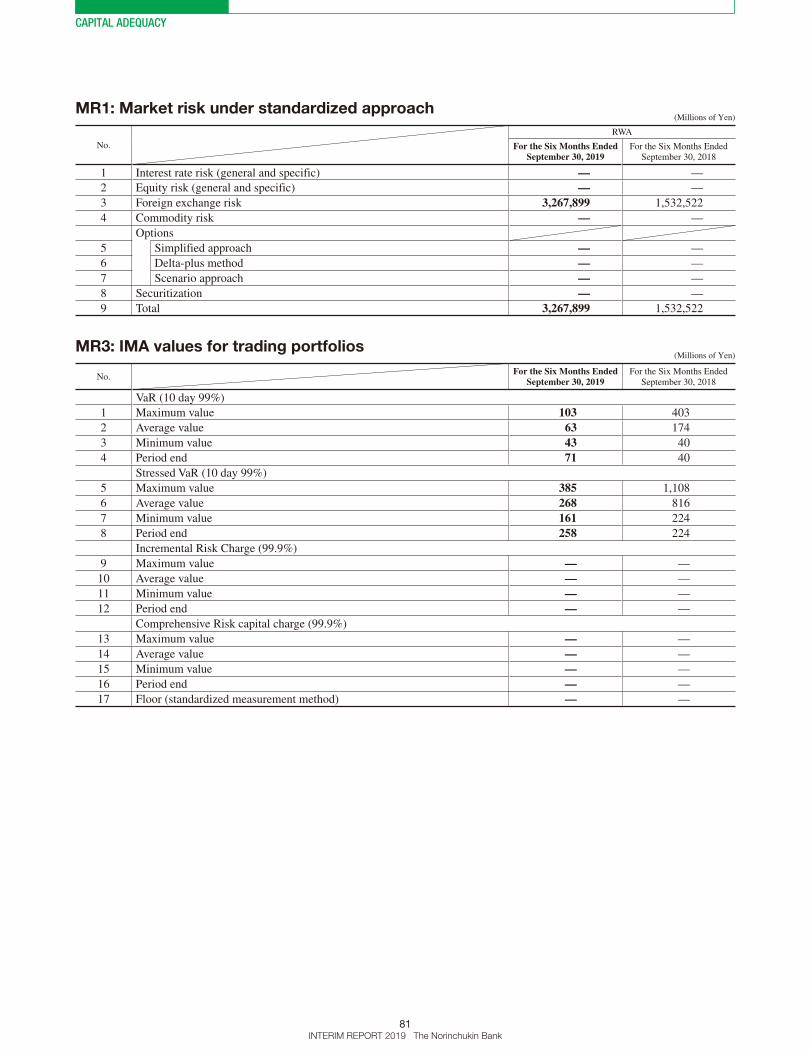
CAPITAL ADEQUACY
81INTERIM REPORT 2019 The Norinchukin Bank
MR1: Market risk under standardized approach (Millions of Yen)
No.
RWA
For the Six Months Ended September 30, 2019
For the Six Months Ended September 30, 2018
1 Interest rate risk (general and specific) — —
2 Equity risk (general and specific) — —
3 Foreign exchange risk 3,267,899 1,532,522
4 Commodity risk — —
Options
5 Simplified approach — —
6 Delta-plus method — —
7 Scenario approach — —
8 Securitization — —
9 Total 3,267,899 1,532,522
MR3: IMA values for trading portfolios (Millions of Yen)
No.For the Six Months Ended
September 30, 2019For the Six Months Ended
September 30, 2018
VaR (10 day 99%)
1 Maximum value 103 403
2 Average value 63 174
3 Minimum value 43 40
4 Period end 71 40
Stressed VaR (10 day 99%)
5 Maximum value 385 1,108
6 Average value 268 816
7 Minimum value 161 224
8 Period end 258 224
Incremental Risk Charge (99.9%)
9 Maximum value — —
10 Average value — —
11 Minimum value — —
12 Period end — —
Comprehensive Risk capital charge (99.9%)
13 Maximum value — —
14 Average value — —
15 Minimum value — —
16 Period end — —
17 Floor (standardized measurement method) — —
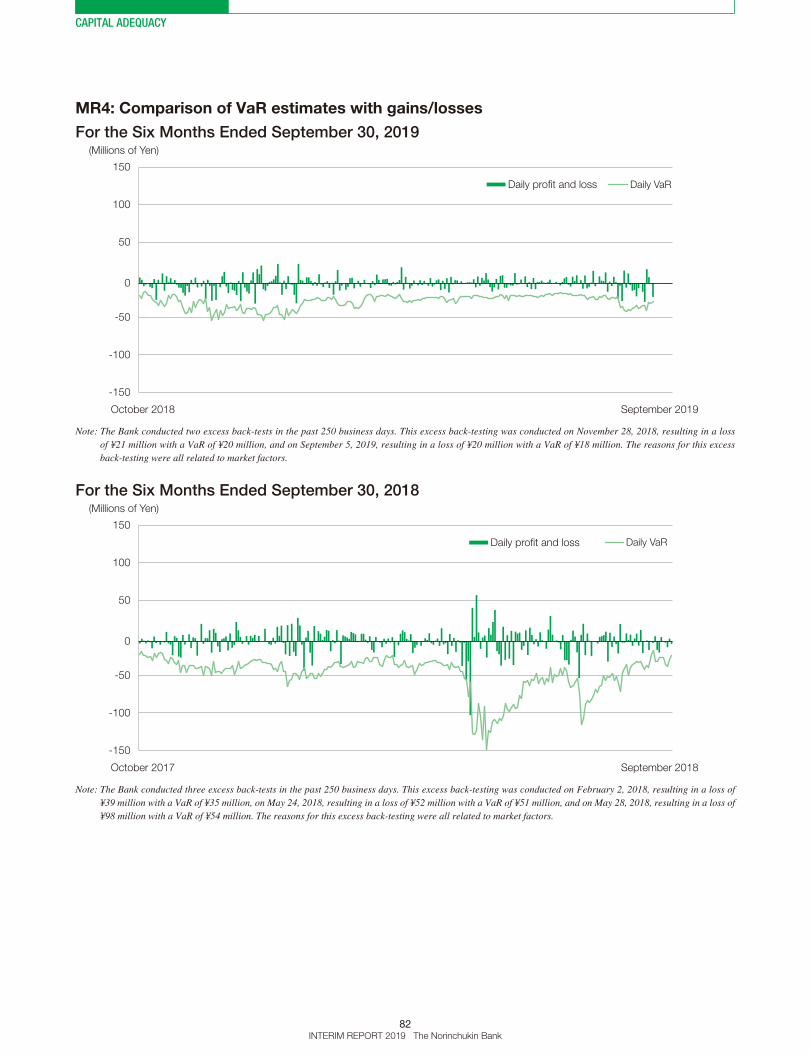
CAPITAL ADEQUACY
82INTERIM REPORT 2019 The Norinchukin Bank
MR4: Comparison of VaR estimates with gains/losses
For the Six Months Ended September 30, 2019
-150
-100
-50
0
50
100
150
October 2018 September 2019
(Millions of Yen)
Daily profit and loss Daily VaR
Note: The Bank conducted two excess back-tests in the past 250 business days. This excess back-testing was conducted on November 28, 2018, resulting in a loss of ¥21 million with a VaR of ¥20 million, and on September 5, 2019, resulting in a loss of ¥20 million with a VaR of ¥18 million. The reasons for this excess back-testing were all related to market factors.
For the Six Months Ended September 30, 2018
-150
-100
-50
0
50
100
150
October 2017 September 2018
(Millions of Yen)
Daily profit and loss Daily VaR
Note: The Bank conducted three excess back-tests in the past 250 business days. This excess back-testing was conducted on February 2, 2018, resulting in a loss of ¥39 million with a VaR of ¥35 million, on May 24, 2018, resulting in a loss of ¥52 million with a VaR of ¥51 million, and on May 28, 2018, resulting in a loss of ¥98 million with a VaR of ¥54 million. The reasons for this excess back-testing were all related to market factors.
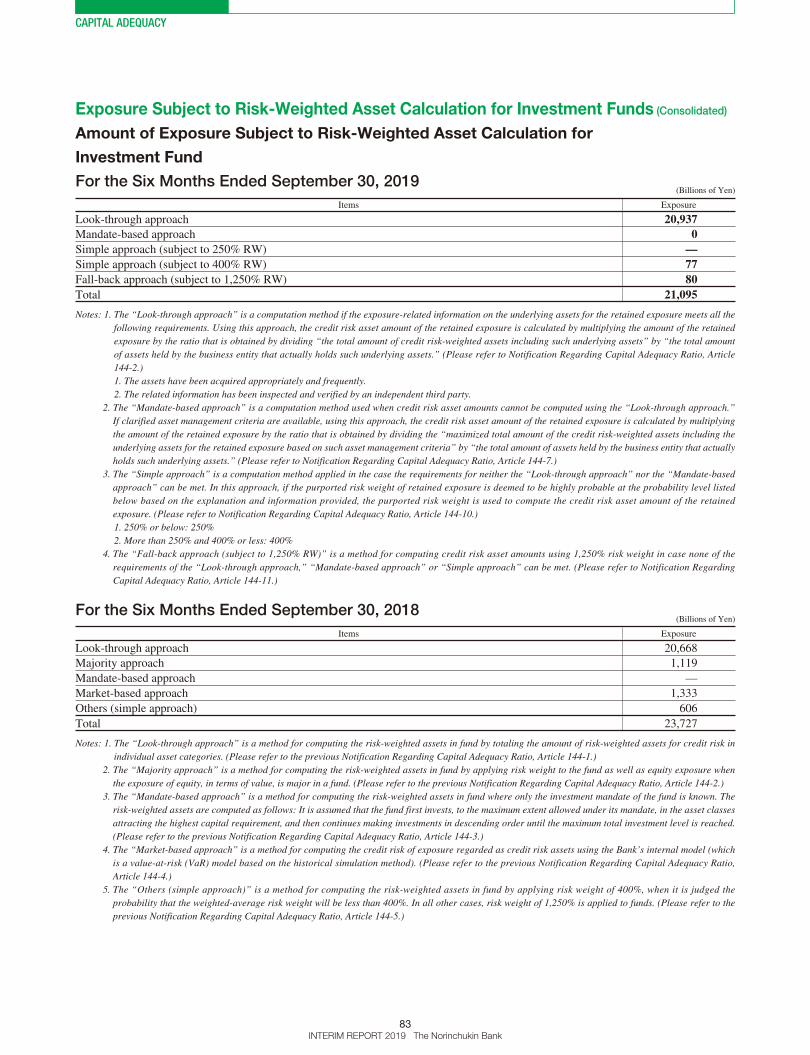
CAPITAL ADEQUACY
83INTERIM REPORT 2019 The Norinchukin Bank
Exposure Subject to Risk-Weighted Asset Calculation for Investment Funds (Consolidated)
Amount of Exposure Subject to Risk-Weighted Asset Calculation for
Investment Fund
For the Six Months Ended September 30, 2019 (Billions of Yen)
Items Exposure
Look-through approach 20,937Mandate-based approach 0Simple approach (subject to 250% RW) —Simple approach (subject to 400% RW) 77Fall-back approach (subject to 1,250% RW) 80Total 21,095
Notes: 1. The “Look-through approach” is a computation method if the exposure-related information on the underlying assets for the retained exposure meets all the following requirements. Using this approach, the credit risk asset amount of the retained exposure is calculated by multiplying the amount of the retained exposure by the ratio that is obtained by dividing “the total amount of credit risk-weighted assets including such underlying assets” by “the total amount of assets held by the business entity that actually holds such underlying assets.” (Please refer to Notification Regarding Capital Adequacy Ratio, Article 144-2.)1. The assets have been acquired appropriately and frequently.2. The related information has been inspected and verified by an independent third party.
2. The “Mandate-based approach” is a computation method used when credit risk asset amounts cannot be computed using the “Look-through approach.” If clarified asset management criteria are available, using this approach, the credit risk asset amount of the retained exposure is calculated by multiplying the amount of the retained exposure by the ratio that is obtained by dividing the “maximized total amount of the credit risk-weighted assets including the underlying assets for the retained exposure based on such asset management criteria” by “the total amount of assets held by the business entity that actually holds such underlying assets.” (Please refer to Notification Regarding Capital Adequacy Ratio, Article 144-7.)
3. The “Simple approach” is a computation method applied in the case the requirements for neither the “Look-through approach” nor the “Mandate-based approach” can be met. In this approach, if the purported risk weight of retained exposure is deemed to be highly probable at the probability level listed below based on the explanation and information provided, the purported risk weight is used to compute the credit risk asset amount of the retained exposure. (Please refer to Notification Regarding Capital Adequacy Ratio, Article 144-10.)1. 250% or below: 250%2. More than 250% and 400% or less: 400%
4. The “Fall-back approach (subject to 1,250% RW)” is a method for computing credit risk asset amounts using 1,250% risk weight in case none of the requirements of the “Look-through approach,” “Mandate-based approach” or “Simple approach” can be met. (Please refer to Notification Regarding Capital Adequacy Ratio, Article 144-11.)
For the Six Months Ended September 30, 2018 (Billions of Yen)
Items Exposure
Look-through approach 20,668
Majority approach 1,119
Mandate-based approach —
Market-based approach 1,333
Others (simple approach) 606
Total 23,727
Notes: 1. The “Look-through approach” is a method for computing the risk-weighted assets in fund by totaling the amount of risk-weighted assets for credit risk in individual asset categories. (Please refer to the previous Notification Regarding Capital Adequacy Ratio, Article 144-1.)
2. The “Majority approach” is a method for computing the risk-weighted assets in fund by applying risk weight to the fund as well as equity exposure when the exposure of equity, in terms of value, is major in a fund. (Please refer to the previous Notification Regarding Capital Adequacy Ratio, Article 144-2.)
3. The “Mandate-based approach” is a method for computing the risk-weighted assets in fund where only the investment mandate of the fund is known. The risk-weighted assets are computed as follows: It is assumed that the fund first invests, to the maximum extent allowed under its mandate, in the asset classes attracting the highest capital requirement, and then continues making investments in descending order until the maximum total investment level is reached. (Please refer to the previous Notification Regarding Capital Adequacy Ratio, Article 144-3.)
4. The “Market-based approach” is a method for computing the credit risk of exposure regarded as credit risk assets using the Bank’s internal model (which is a value-at-risk (VaR) model based on the historical simulation method). (Please refer to the previous Notification Regarding Capital Adequacy Ratio, Article 144-4.)
5. The “Others (simple approach)” is a method for computing the risk-weighted assets in fund by applying risk weight of 400%, when it is judged the probability that the weighted-average risk weight will be less than 400%. In all other cases, risk weight of 1,250% is applied to funds. (Please refer to the previous Notification Regarding Capital Adequacy Ratio, Article 144-5.)

CAPITAL ADEQUACY
84INTERIM REPORT 2019 The Norinchukin Bank
IRRBB1 – Quantitative information on IRRBB (Millions of Yen)
No.
a b c d
⊿EVE ⊿NII
For the Six Months Ended September
30, 2019
For the Six Months Ended September
30, 2018
For the Six Months Ended September
30, 2019
For the Six Months Ended September
30, 2018
1 Parallel up 1,887,827 2,491,560 121,031 203,001
2 Parallel down (657,124) (936,478) (127,881) (158,121)
3 Steepener 503,743 813,594
4 Flattener (18,580) (112,498)
5 Short rate up 558,227 592,828
6 Short rate down (129,004) (230,727)
7 Maximum 1,887,827 2,491,560 121,031 203,001e f
For the Six Months Ended September 30, 2019
For the Six Months Ended September 30, 2018
8 Tier 1 capital 9,030,405 6,348,609
Note: Interest risk measurements are conducted as to the non-consolidated and consolidated subsidiaries that retain more than a certain level of interest rate risk.
CCyB1: Geographical distribution of credit exposures used in the countercyclical
capital buffer
For the Six Months Ended September 30, 2019 (Millions of Yen, %)
a b c d
Geographical breakdownCountercyclical
capital buffer rate
Exposure values and/or risk-weighted assets used in
the computation of the countercyclical
capital buffer
Bank-specific countercyclical
capital buffer rate
Countercyclical buffer amount
France 0.25% 342,473Hong Kong (China) 2.50% 91,480Sweden 2.50% 47,886UK 1.00% 1,201,912Subtotal 1,683,751Total 33,197,414 0.04% 17,041
Note: As to geographic allocation methods for the amounts of credit risk-weighted assets, the location of each project of direct investments or fund and securitization products with which the look-through of the underlying assets is possible is defined as the ultimate country bearing the risk. Regarding fund and securitization products with which it is difficult to “look-through” the underlying assets, the ultimate risk-bearing country is allocated based on the asset management criteria and other factors.
For the Six Months Ended September 30, 2018
Not applicable.
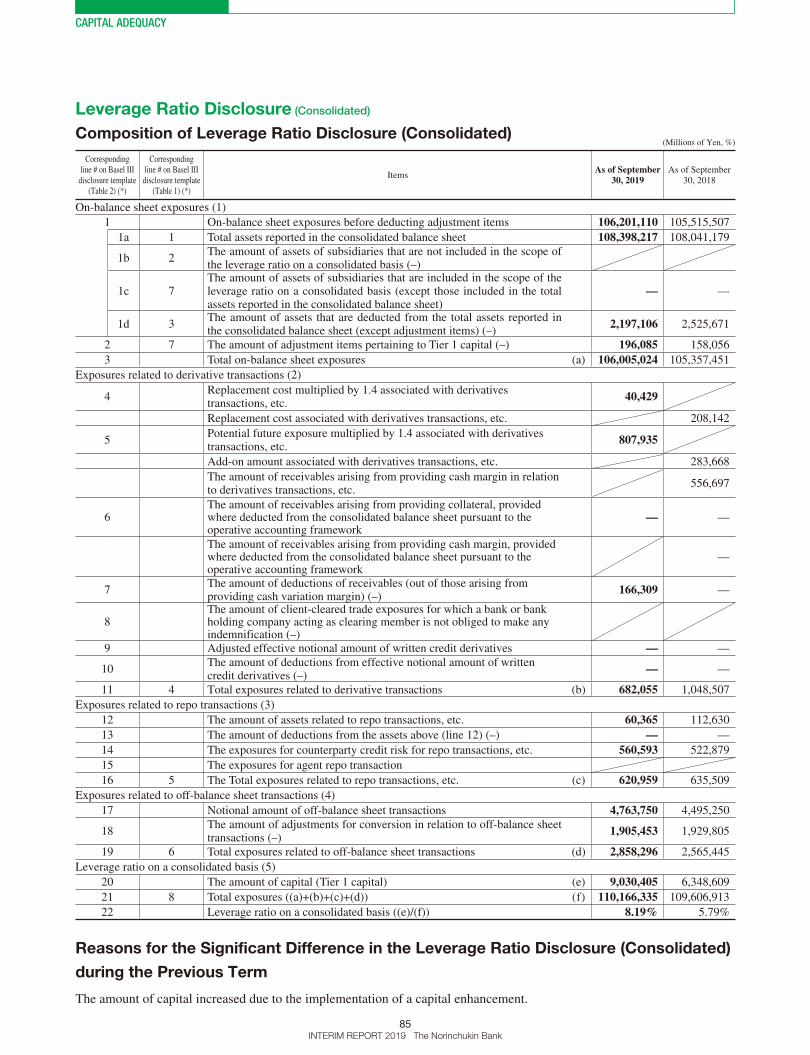
CAPITAL ADEQUACY
85INTERIM REPORT 2019 The Norinchukin Bank
Leverage Ratio Disclosure (Consolidated)
Composition of Leverage Ratio Disclosure (Consolidated) (Millions of Yen, %)
Corresponding line # on Basel III
disclosure template (Table 2) (*)
Corresponding line # on Basel III
disclosure template (Table 1) (*)
ItemsAs of September
30, 2019As of September
30, 2018
On-balance sheet exposures (1)
1 On-balance sheet exposures before deducting adjustment items 106,201,110 105,515,507
1a 1 Total assets reported in the consolidated balance sheet 108,398,217 108,041,179
1b 2The amount of assets of subsidiaries that are not included in the scope of the leverage ratio on a consolidated basis (–)
1c 7The amount of assets of subsidiaries that are included in the scope of the leverage ratio on a consolidated basis (except those included in the total assets reported in the consolidated balance sheet)
— —
1d 3The amount of assets that are deducted from the total assets reported in the consolidated balance sheet (except adjustment items) (–)
2,197,106 2,525,671
2 7 The amount of adjustment items pertaining to Tier 1 capital (–) 196,085 158,056
3 Total on-balance sheet exposures (a) 106,005,024 105,357,451
Exposures related to derivative transactions (2)
4Replacement cost multiplied by 1.4 associated with derivatives transactions, etc.
40,429
Replacement cost associated with derivatives transactions, etc. 208,142
5Potential future exposure multiplied by 1.4 associated with derivatives transactions, etc.
807,935
Add-on amount associated with derivatives transactions, etc. 283,668
The amount of receivables arising from providing cash margin in relation to derivatives transactions, etc.
556,697
6The amount of receivables arising from providing collateral, provided where deducted from the consolidated balance sheet pursuant to the operative accounting framework
— —
The amount of receivables arising from providing cash margin, provided where deducted from the consolidated balance sheet pursuant to the operative accounting framework
—
7The amount of deductions of receivables (out of those arising from providing cash variation margin) (–)
166,309 —
8The amount of client-cleared trade exposures for which a bank or bank holding company acting as clearing member is not obliged to make any indemnification (–)
9 Adjusted effective notional amount of written credit derivatives — —
10The amount of deductions from effective notional amount of written credit derivatives (–)
— —
11 4 Total exposures related to derivative transactions (b) 682,055 1,048,507
Exposures related to repo transactions (3)
12 The amount of assets related to repo transactions, etc. 60,365 112,630
13 The amount of deductions from the assets above (line 12) (–) — —
14 The exposures for counterparty credit risk for repo transactions, etc. 560,593 522,879
15 The exposures for agent repo transaction
16 5 The Total exposures related to repo transactions, etc. (c) 620,959 635,509
Exposures related to off-balance sheet transactions (4)
17 Notional amount of off-balance sheet transactions 4,763,750 4,495,250
18The amount of adjustments for conversion in relation to off-balance sheet transactions (–)
1,905,453 1,929,805
19 6 Total exposures related to off-balance sheet transactions (d) 2,858,296 2,565,445
Leverage ratio on a consolidated basis (5)
20 The amount of capital (Tier 1 capital) (e) 9,030,405 6,348,609
21 8 Total exposures ((a)+(b)+(c)+(d)) (f) 110,166,335 109,606,913
22 Leverage ratio on a consolidated basis ((e)/(f)) 8.19% 5.79%
Reasons for the Significant Difference in the Leverage Ratio Disclosure (Consolidated)
during the Previous Term
The amount of capital increased due to the implementation of a capital enhancement.

CAPITAL ADEQUACY
86INTERIM REPORT 2019 The Norinchukin Bank
(Millions of Yen, %, the Number of Items)
ItemsThe current quarter
(July 1 to September 30, 2019)The previous quarter
(April 1 to June 30, 2019)
High-quality liquid assets (1)
1 Total high-quality liquid assets 27,620,064 26,300,626
Cash outflows (2)
Amount before multiplying a cash outflow
ratio
Amount after multiplying a cash outflow
ratio
Amount before multiplying a cash outflow
ratio
Amount after multiplying a cash outflow
ratio
2 Cash outflows relating to unsecured retail funding 45,265 4,499 45,420 4,515
3 of which: stable deposits 394 12 392 12
4 of which: quasi-stable deposits 44,872 4,487 45,028 4,503
5 Cash outflows relating to unsecured wholesale funding 10,667,813 7,806,074 12,165,721 8,373,737
6 of which: qualifying operational deposits 0 0 0 0
7of which: capital relating to unsecured wholesale funding, excluding qualifying operational deposits and debt securities
10,066,119 7,204,380 11,715,417 7,923,433
8 of which: debt securities 601,694 601,694 450,304 450,304
9 Cash outflows relating to secured funding, etc. 179,965 148,920
10Cash outflows relating to funding programs and credit/liquidity facilities such as derivative transactions, etc.
2,682,824 1,593,420 2,699,125 1,611,992
11 of which: cash outflows relating to derivative transactions 1,319,464 1,319,464 1,351,987 1,351,987
12 of which: cash outflows relating to funding programs 0 0 0 0
13 of which: cash outflows relating to credit/liquidity facilities 1,363,359 273,956 1,347,138 260,004
14 Cash outflows based on an obligation to provide capital 5,381,036 532,681 5,956,093 531,012
15 Cash outflows relating to contingencies 5,324,173 205,997 5,442,534 228,344
16 Total cash outflows 10,322,636 10,898,519
Cash inflows (3)
Amount before multiplying a cash outflow
ratio
Amount after multiplying a cash outflow
ratio
Amount before multiplying a cash outflow
ratio
Amount after multiplying a cash outflow
ratio
17 Cash inflows relating to secured fund management, etc. 10,484 0 75,756 0
18 Cash inflows relating to collections of advances, etc. 3,949,853 3,007,057 2,831,735 2,106,483
19 Other cash inflows 5,422,244 445,521 6,153,247 570,150
20 Total cash inflows 9,382,580 3,452,578 9,060,737 2,676,633
Liquidity coverage ratio on a consolidated basis (4)
21 Sum of high-quality liquid assets that can be included 27,620,064 26,300,626
22 Net cash outflows 6,870,058 8,221,886
23 Liquidity coverage ratio on a consolidated basis 402.0% 319.8%
24 The number of data for calculating the average value 62 59
Quantitative Disclosure Items Concerning a Liquidity Coverage Ratio on a
Consolidated Basis
Sound Management of Liquidity Risk (Consolidated)
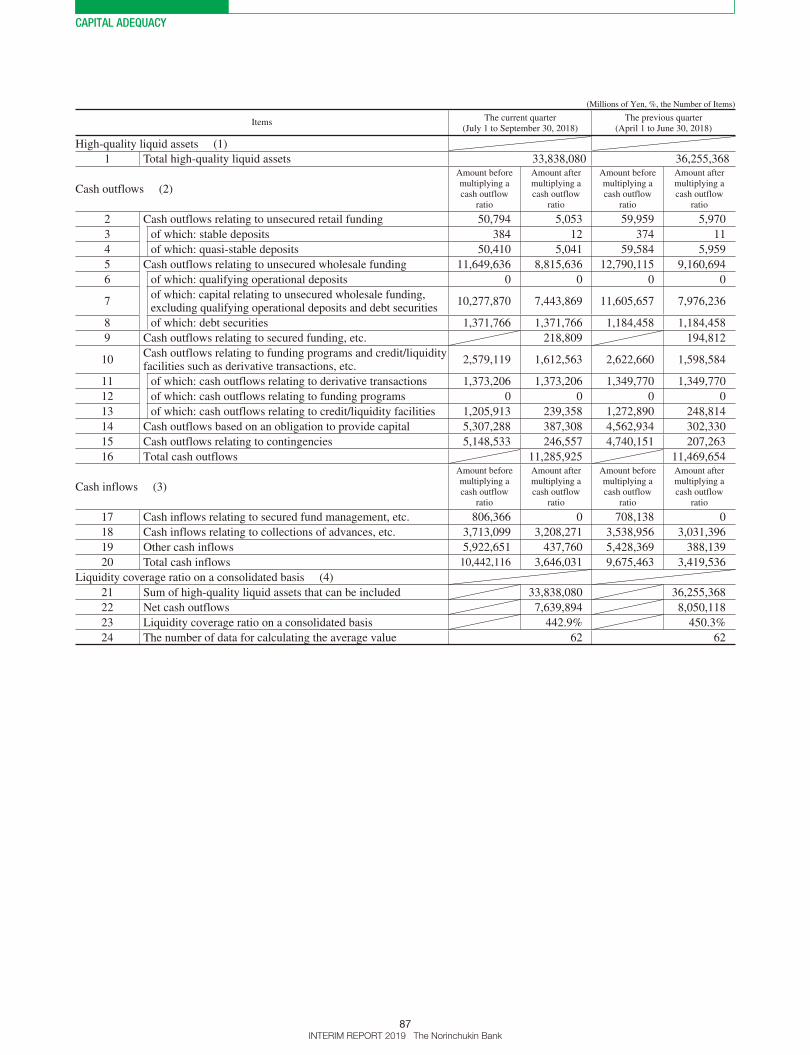
CAPITAL ADEQUACY
87INTERIM REPORT 2019 The Norinchukin Bank
(Millions of Yen, %, the Number of Items)
ItemsThe current quarter
(July 1 to September 30, 2018)The previous quarter
(April 1 to June 30, 2018)
High-quality liquid assets (1)
1 Total high-quality liquid assets 33,838,080 36,255,368
Cash outflows (2)
Amount before multiplying a cash outflow
ratio
Amount after multiplying a cash outflow
ratio
Amount before multiplying a cash outflow
ratio
Amount after multiplying a cash outflow
ratio
2 Cash outflows relating to unsecured retail funding 50,794 5,053 59,959 5,970
3 of which: stable deposits 384 12 374 11
4 of which: quasi-stable deposits 50,410 5,041 59,584 5,959
5 Cash outflows relating to unsecured wholesale funding 11,649,636 8,815,636 12,790,115 9,160,694
6 of which: qualifying operational deposits 0 0 0 0
7of which: capital relating to unsecured wholesale funding, excluding qualifying operational deposits and debt securities
10,277,870 7,443,869 11,605,657 7,976,236
8 of which: debt securities 1,371,766 1,371,766 1,184,458 1,184,458
9 Cash outflows relating to secured funding, etc. 218,809 194,812
10Cash outflows relating to funding programs and credit/liquidity facilities such as derivative transactions, etc.
2,579,119 1,612,563 2,622,660 1,598,584
11 of which: cash outflows relating to derivative transactions 1,373,206 1,373,206 1,349,770 1,349,770
12 of which: cash outflows relating to funding programs 0 0 0 0
13 of which: cash outflows relating to credit/liquidity facilities 1,205,913 239,358 1,272,890 248,814
14 Cash outflows based on an obligation to provide capital 5,307,288 387,308 4,562,934 302,330
15 Cash outflows relating to contingencies 5,148,533 246,557 4,740,151 207,263
16 Total cash outflows 11,285,925 11,469,654
Cash inflows (3)
Amount before multiplying a cash outflow
ratio
Amount after multiplying a cash outflow
ratio
Amount before multiplying a cash outflow
ratio
Amount after multiplying a cash outflow
ratio
17 Cash inflows relating to secured fund management, etc. 806,366 0 708,138 0
18 Cash inflows relating to collections of advances, etc. 3,713,099 3,208,271 3,538,956 3,031,396
19 Other cash inflows 5,922,651 437,760 5,428,369 388,139
20 Total cash inflows 10,442,116 3,646,031 9,675,463 3,419,536
Liquidity coverage ratio on a consolidated basis (4)
21 Sum of high-quality liquid assets that can be included 33,838,080 36,255,368
22 Net cash outflows 7,639,894 8,050,118
23 Liquidity coverage ratio on a consolidated basis 442.9% 450.3%
24 The number of data for calculating the average value 62 62

CAPITAL ADEQUACY
88INTERIM REPORT 2019 The Norinchukin Bank
Items concerning a change in the
consolidated liquidity coverage ratio on a
time-series basis
The consolidated liquidity coverage ratio has shown stable
progress for the past two years.
Items concerning evaluation of the level of
the consolidated liquidity coverage ratio
The consolidated liquidity coverage ratio has tended to be
well above the required level.
The future consolidated liquidity coverage ratio is not
predicted to differ substantially from the disclosed ratio.
The actual value of the consolidated liquidity coverage
ratio does not differ substantially from the initial forecast.
Items concerning the details of the sum
of high-quality liquid assets that can be
included
In light of the Bank’s consolidated liquidity coverage ratio,
there is no material item.
Qualitative Disclosure Items Concerning a Liquidity Coverage Ratio on a
Consolidated Basis
Other items concerning the consolidated
liquidity coverage ratio
The Bank has not adopted the “Special case related to quali-
fying operational deposits” and the “Additional amount of
collateral required at the time of scenario approach-based
changes in fair value.”
Considering the impact on the Bank’s consolidated
liquidity coverage ratio, with regard to immaterial consoli-
dated subsidiaries with restrictions on practical operation,
end-of-month data are converted to daily data.

CAPITAL ADEQUACY
89INTERIM REPORT 2019 The Norinchukin Bank
(Millions of Yen, %)
Basel III Template No.
Items
a b c
As of September 30, 2019
As of September 30, 2018
Reference to Template CC2
Common Equity Tier 1 capital: instruments and reserves
1a+2-1c-26Directly issued qualifying common share capital plus related capital surplus and retained earnings
5,937,310 5,394,675
1a of which: capital and capital surplus 4,015,219 3,455,509 E1.1+E1.2
2 of which: retained earnings 1,922,091 1,939,166 E2
26 of which: cash dividends to be paid — —
of which: other than the above — — E3
3 Valuation and translation adjustments and other disclosed reserves 1,696,330 1,132,132 E4
6 Common Equity Tier 1 capital: instruments and reserves (A) 7,633,641 6,526,808
Common Equity Tier 1 capital: regulatory adjustments
8+9Total intangible assets (net of related tax liability, excluding those relating to mortgage servicing rights)
35,144 31,732
8 of which: goodwill (net of related tax liability, including those equivalent) — — A1.1+A1.2
9of which: other intangible assets other than goodwill and mortgage servicing rights (net of related tax liability)
35,144 31,732 A2.1-A2.2
10Deferred tax assets that rely on future profitability excluding those arising from temporary differences (net of related tax liability)
— —
11 Deferred gains or losses on derivatives under hedge accounting (142,362) 153,886 E7
12 Shortfall of eligible provisions to expected losses 57,621 22,285
13 Securitization gain on sale — —
14 Gains and losses due to changes in own credit risk on fair valued liabilities — —
15 Defined-benefit pension fund net assets (prepaid pension costs) 23,044 17,796 A3-D3
16 Investments in own shares (excluding those reported in the Net Assets section) — — A4
17 Reciprocal cross-holdings in common equity — — A5
18
Investments in the capital of banking, financial and insurance entities that are outside the scope of regulatory consolidation (“Other Financial Institutions”), net of eligible short positions, where the bank does not own more than 10% of the issued share
— — A6
19+20+21 Amount exceeding the 10% threshold on specified items — —
19 of which: significant investments in the common stock of financials — — A7
20 of which: mortgage servicing rights — — A8
21of which: deferred tax assets arising from temporary differences (net of related tax liability)
— —
22 Amount exceeding the 15% threshold on specified items — —
23 of which: significant investments in the common stock of financials — — A9
24 of which: mortgage servicing rights — — A10
25of which: deferred tax assets arising from temporary differences (net of related tax liability)
— —
27Regulatory adjustments applied to Common Equity Tier 1 due to insufficient Additional Tier 1 and Tier 2 to cover deductions
— —
28 Common Equity Tier 1 capital: regulatory adjustments (B) (26,551) 225,701
Common Equity Tier 1 capital (CET1)
29 Common Equity Tier 1 capital (CET1) ((A)-(B)) (C) 7,660,193 6,301,106
Additional Tier 1 capital: instruments
30
31aDirectly issued qualifying Additional Tier 1 instruments plus related capital surplus of which: classified as equity under applicable accounting standards and the breakdown
49,999 49,999 E5.1+E5.2
32Directly issued qualifying Additional Tier 1 instruments plus related capital surplus of which: classified as liabilities under applicable accounting standards
1,316,972 — D1
Qualifying Additional Tier 1 instruments plus related capital surplus issued by special purpose vehicles and other equivalent entities
— —
Capital Ratio Information (Non-Consolidated)
CC1: Composition of Capital (Non-Consolidated)
Capital Adequacy (Non-Consolidated)
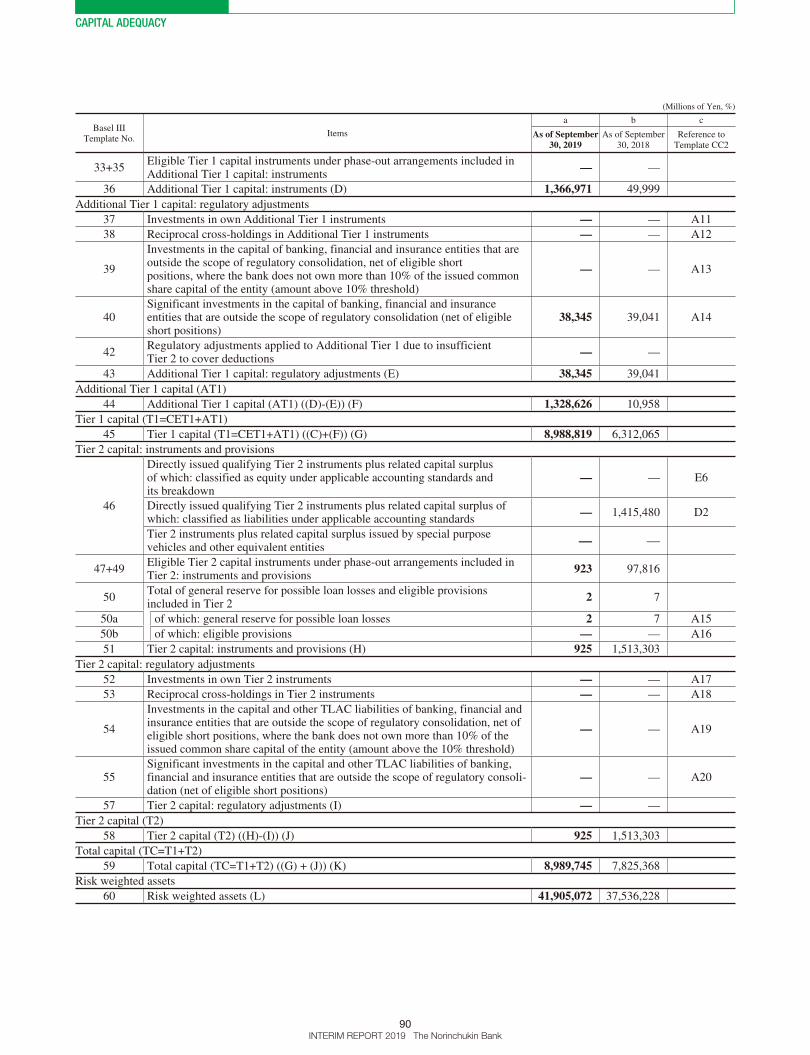
CAPITAL ADEQUACY
90INTERIM REPORT 2019 The Norinchukin Bank
(Millions of Yen, %)
Basel III Template No.
Items
a b c
As of September 30, 2019
As of September 30, 2018
Reference to Template CC2
33+35Eligible Tier 1 capital instruments under phase-out arrangements included in Additional Tier 1 capital: instruments
— —
36 Additional Tier 1 capital: instruments (D) 1,366,971 49,999
Additional Tier 1 capital: regulatory adjustments
37 Investments in own Additional Tier 1 instruments — — A11
38 Reciprocal cross-holdings in Additional Tier 1 instruments — — A12
39
Investments in the capital of banking, financial and insurance entities that are outside the scope of regulatory consolidation, net of eligible short positions, where the bank does not own more than 10% of the issued common share capital of the entity (amount above 10% threshold)
— — A13
40Significant investments in the capital of banking, financial and insurance entities that are outside the scope of regulatory consolidation (net of eligible short positions)
38,345 39,041 A14
42Regulatory adjustments applied to Additional Tier 1 due to insufficient Tier 2 to cover deductions
— —
43 Additional Tier 1 capital: regulatory adjustments (E) 38,345 39,041
Additional Tier 1 capital (AT1)
44 Additional Tier 1 capital (AT1) ((D)-(E)) (F) 1,328,626 10,958
Tier 1 capital (T1=CET1+AT1)
45 Tier 1 capital (T1=CET1+AT1) ((C)+(F)) (G) 8,988,819 6,312,065
Tier 2 capital: instruments and provisions
46
Directly issued qualifying Tier 2 instruments plus related capital surplus of which: classified as equity under applicable accounting standards and its breakdown
— — E6
Directly issued qualifying Tier 2 instruments plus related capital surplus of which: classified as liabilities under applicable accounting standards
— 1,415,480 D2
Tier 2 instruments plus related capital surplus issued by special purpose vehicles and other equivalent entities
— —
47+49Eligible Tier 2 capital instruments under phase-out arrangements included in Tier 2: instruments and provisions
923 97,816
50Total of general reserve for possible loan losses and eligible provisions included in Tier 2
2 7
50a of which: general reserve for possible loan losses 2 7 A15
50b of which: eligible provisions — — A16
51 Tier 2 capital: instruments and provisions (H) 925 1,513,303
Tier 2 capital: regulatory adjustments
52 Investments in own Tier 2 instruments — — A17
53 Reciprocal cross-holdings in Tier 2 instruments — — A18
54
Investments in the capital and other TLAC liabilities of banking, financial and insurance entities that are outside the scope of regulatory consolidation, net of eligible short positions, where the bank does not own more than 10% of the issued common share capital of the entity (amount above the 10% threshold)
— — A19
55Significant investments in the capital and other TLAC liabilities of banking, financial and insurance entities that are outside the scope of regulatory consoli-dation (net of eligible short positions)
— — A20
57 Tier 2 capital: regulatory adjustments (I) — —
Tier 2 capital (T2)
58 Tier 2 capital (T2) ((H)-(I)) (J) 925 1,513,303
Total capital (TC=T1+T2)
59 Total capital (TC=T1+T2) ((G) + (J)) (K) 8,989,745 7,825,368
Risk weighted assets
60 Risk weighted assets (L) 41,905,072 37,536,228

CAPITAL ADEQUACY
91INTERIM REPORT 2019 The Norinchukin Bank
(Millions of Yen, %)
Basel III Template No.
Items
a b c
As of September 30, 2019
As of September 30, 2018
Reference to Template CC2
Capital ratio and buffers (non-consolidated)
61 Common Equity Tier 1 capital ratio (non-consolidated) ((C)/(L)) 18.27% 16.78%
62 Tier 1 capital ratio (non-consolidated) ((G)/(L)) 21.45% 16.81%
63 Total capital ratio (non-consolidated) ((K)/(L)) 21.45% 20.84%
64 CET1 specific buffer requirement
65 Of which: capital conservation buffer requirement
66 Of which: countercyclical buffer requirement
67 Of which: G-SIB/D-SIB additional requirement
68 CET1 available after meeting the bank’s minimum capital requirements
Regulatory adjustments
72Non-significant investments in the capital and other TLAC liabilities of other financial institutions that are below the thresholds for deduction (before risk weighting)
188,745 211,140 A21.1+A21.2
73Significant investments in the common stock of other financial institutions that are below the thresholds for deduction (before risk weighting)
17,055 17,055 A22
74Mortgage servicing rights that are below the thresholds for deduction (before risk weighting)
— — A23
75Deferred tax assets arising from temporary differences that are below the thresholds for deduction (before risk weighting)
— —
Provisions included in Tier 2 capital: instruments and provisions
76 Provisions (general reserve for possible loan losses) 2 7
77 Cap on inclusion of provisions (general reserve for possible loan losses) 37 101
78Provisions eligible for inclusion in Tier 2 in respect of exposures subject to internal ratings-based approach (prior to application of cap) (if the amount is negative, report as “nil”)
— —
79 Cap for inclusion of provisions in Tier 2 under internal ratings-based approach 213,618 210,247
Capital instruments under phase-out arrangements
82 Current cap on Additional Tier 1 instruments under phase-out arrangements — —
83Amount excluded from Additional Tier 1 due to cap (excess over cap after redemptions and maturities) (if the amount is negative, report as “nil”)
— —
84 Current cap on Tier 2 instruments under phase-out arrangements 460,802 614,402
85Amount excluded from Tier 2 due to cap (excess over cap after redemptions and maturities) (if the amount is negative, report as “nil”)
— —

CAPITAL ADEQUACY
92INTERIM REPORT 2019 The Norinchukin Bank
CC2: Explanation on Reconciliation between Balance Sheet Items and
Regulatory Capital Elements (Non-Consolidated)
As of September 30, 2019 (Millions of Yen)
Items
a b c
Non-Consolidated balance sheet
amount
Consolidated balance sheet
amounts based on regulatory scope of consolidation
Reference numbers or symbols for referring to
Template CC1
(Assets)
Loans and Bills Discounted 18,989,907of which: non-significant investments in the capital, etc., of other financial institutions —
Tier 2 capital instruments and other TLAC liabilities of banking, financial and insurance enti-ties that are outside the scope of regulatory consolidation (net of eligible short positions)
—
Non-significant investments in the capital of other financials that are below the thresholds for deduction (before risk weighting)
— A21.1
Foreign Exchanges Assets 226,258Securities 55,547,345 55,547,339Money Held in Trust 6,997,384 6,997,384
Securities and Money Held in Trust of which: goodwill and those equivalents (excluding those reported in the Intangible Fixed Assets)
— A1.1
Securities and Money Held in Trust of which: investments in own capital instruments — —
Common Equity (excluding those reported in the Net Assets section) — A4
Additional Tier 1 capital — A11
Tier 2 capital — A17
Securities and Money Held in Trust of which: reciprocal cross-holdings in capital instruments
— —
Common Equity — A5
Additional Tier 1 capital — A12
Tier 2 capital — A18
Securities and Money Held in Trust of which: non-significant investments in the capital, etc., of other financial institutions
188,745 —
Common Equity — A6
Additional Tier 1 capital — A13
Tier 2 capital instruments and other TLAC liabilities of banking, financial and insurance enti-ties that are outside the scope of regulatory consolidation (net of eligible short positions)
— A19
Non-significant investments in the capital of other financials that are below the thresholds for deduction (before risk weighting)
188,745 A21.2
Securities and Money Held in Trust of which: significant investments in the capital of bank-ing, financial and insurance entities that are outside the scope of regulatory consolidation, where the bank does not own more than 10% of the issued share capital
55,400 —
Amount exceeding the 10% threshold on specified items — A7
Amount exceeding the 15% threshold on specified items — A9
Additional Tier 1 capital 38,345 A14
Tier 2 capital instruments and other TLAC liabilities of banking, financial and insurance enti-ties that are outside the scope of regulatory consolidation (net of eligible short positions)
— A20
Significant investments in the capital, etc., of other financial institutions that are below the thresholds for deduction (before risk weighting)
17,055 A22
Trading Assets 14,422Monetary Claims Bought 310,887Call Loans 607,379Receivables under Resale Agreements —Cash and Due from Banks 21,625,236Other Assets 1,870,131Tangible Fixed Assets 113,015
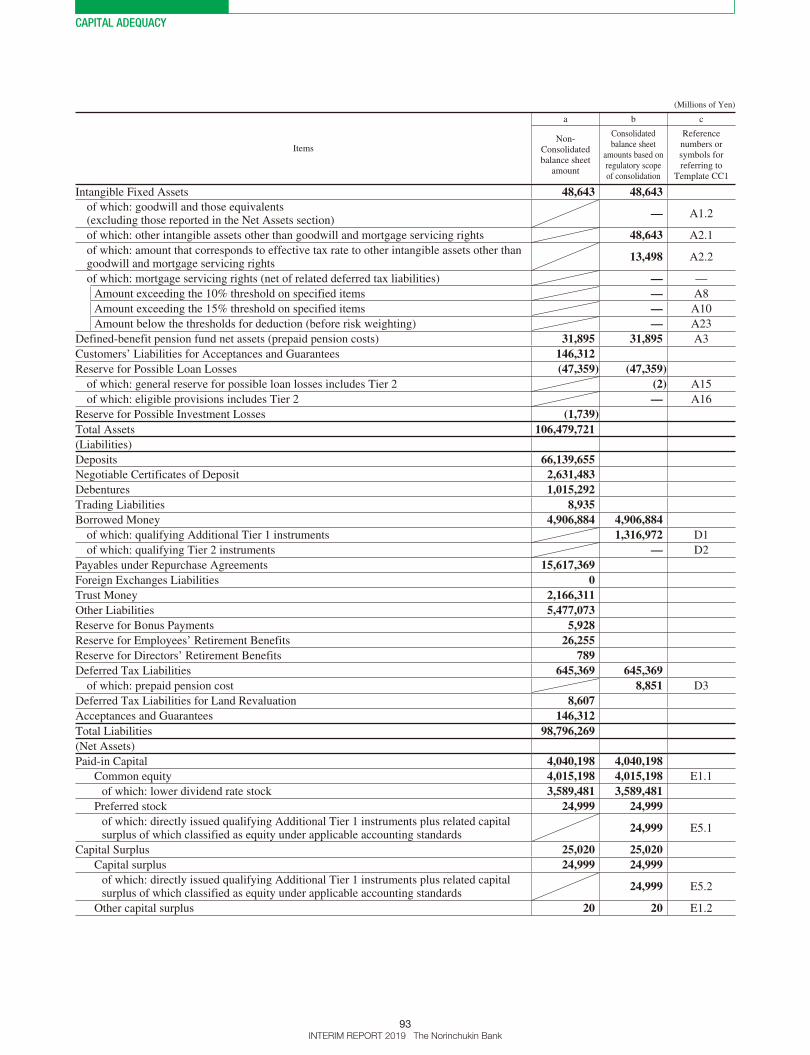
CAPITAL ADEQUACY
93INTERIM REPORT 2019 The Norinchukin Bank
(Millions of Yen)
Items
a b c
Non-Consolidated balance sheet
amount
Consolidated balance sheet
amounts based on regulatory scope of consolidation
Reference numbers or symbols for referring to
Template CC1
Intangible Fixed Assets 48,643 48,643of which: goodwill and those equivalents (excluding those reported in the Net Assets section)
— A1.2
of which: other intangible assets other than goodwill and mortgage servicing rights 48,643 A2.1
of which: amount that corresponds to effective tax rate to other intangible assets other than goodwill and mortgage servicing rights
13,498 A2.2
of which: mortgage servicing rights (net of related deferred tax liabilities) — —
Amount exceeding the 10% threshold on specified items — A8
Amount exceeding the 15% threshold on specified items — A10
Amount below the thresholds for deduction (before risk weighting) — A23
Defined-benefit pension fund net assets (prepaid pension costs) 31,895 31,895 A3
Customers’ Liabilities for Acceptances and Guarantees 146,312Reserve for Possible Loan Losses (47,359) (47,359)
of which: general reserve for possible loan losses includes Tier 2 (2) A15
of which: eligible provisions includes Tier 2 — A16
Reserve for Possible Investment Losses (1,739)Total Assets 106,479,721(Liabilities)
Deposits 66,139,655Negotiable Certificates of Deposit 2,631,483Debentures 1,015,292Trading Liabilities 8,935Borrowed Money 4,906,884 4,906,884
of which: qualifying Additional Tier 1 instruments 1,316,972 D1
of which: qualifying Tier 2 instruments — D2
Payables under Repurchase Agreements 15,617,369Foreign Exchanges Liabilities 0 Trust Money 2,166,311Other Liabilities 5,477,073Reserve for Bonus Payments 5,928Reserve for Employees’ Retirement Benefits 26,255Reserve for Directors’ Retirement Benefits 789Deferred Tax Liabilities 645,369 645,369
of which: prepaid pension cost 8,851 D3
Deferred Tax Liabilities for Land Revaluation 8,607Acceptances and Guarantees 146,312Total Liabilities 98,796,269(Net Assets)
Paid-in Capital 4,040,198 4,040,198Common equity 4,015,198 4,015,198 E1.1
of which: lower dividend rate stock 3,589,481 3,589,481Preferred stock 24,999 24,999
of which: directly issued qualifying Additional Tier 1 instruments plus related capital surplus of which classified as equity under applicable accounting standards
24,999 E5.1
Capital Surplus 25,020 25,020Capital surplus 24,999 24,999
of which: directly issued qualifying Additional Tier 1 instruments plus related capital surplus of which classified as equity under applicable accounting standards
24,999 E5.2
Other capital surplus 20 20 E1.2

CAPITAL ADEQUACY
94INTERIM REPORT 2019 The Norinchukin Bank
(Millions of Yen)
Items
a b c
Non-Consolidated balance sheet
amount
Consolidated balance sheet
amounts based on regulatory scope of consolidation
Reference numbers or symbols for referring to
Template CC1
Retained Earnings 1,921,905 1,922,091 E2
Legal reserves 755,766 755,766Voluntary reserves 1,166,139 1,166,325
Special reserves 323,700 323,700General reserves 559,403 559,403Reserves for tax basis adjustments of fixed assets 7,030 7,030Others 7 7Unappropriated retained earnings 275,997 276,184
Total Owners’ Equity 5,987,124 5,987,310of which: others — E3
of which: directly issued qualifying Tier 2 instruments plus related capital surplus of which classified as equity under applicable accounting standards
— E6
Net Unrealized Gains on Other Securities 2,021,595 2,021,595Net Deferred Losses on Hedging Instruments (339,580) (339,580)
of which: net deferred losses on hedge (142,362) E7
Revaluation Reserve for Land, net of taxes 14,312 14,312Foreign Currency Translation Adjustment — 3Total Valuation and Translation Adjustment 1,696,327 1,696,330 E4
Total Net Assets 7,683,452Total Liabilities and Net Assets 106,479,721
Notes: 1. “Consolidated balance sheet amounts based on regulatory scope of consolidation” refer only to the items used in calculating capital adequacy. 2. “Consolidated balance sheet amounts based on regulatory scope of consolidation” are the amounts before the transitional arrangements, therefore the
items that were newly included in the Bank’s own capital via the transitional arrangements are not included in this table.

CAPITAL ADEQUACY
95INTERIM REPORT 2019 The Norinchukin Bank
As of September 30, 2018 (Millions of Yen)
Items
Non-Consolidated balance sheet
amount
Consolidated balance sheet
amounts based on regulatory scope of consolidation
Ref. No.
(Assets)
Loans and Bills Discounted 13,821,164
Including non-significant investments in the capital instruments of other financial institutions —
Tier 2 capital instruments —
Non-significant investments in the capital instruments of other financial institutions not subject to deduction
— A21.1
Foreign Exchanges Assets 228,485
Securities 54,003,459 54,003,453
Money Held in Trust 8,736,211 8,736,211Securities and Money Held in Trust of which: goodwill and those equivalents (excluding those reported in the Intangible Fixed Assets)
— A1.1
Securities and Money Held in Trust of which: investments in own capital instruments — —
Common Equity (excluding those reported in the Net Assets section) — A4
Additional Tier 1 capital — A11
Tier 2 capital — A17
Securities and Money Held in Trust of which: reciprocal cross-holdings in capital instruments
— —
Common Equity — A5
Additional Tier 1 capital — A12
Tier 2 capital — A18
Securities and Money Held in Trust of which: investments in the instruments of banking, financial and insurance entities that are outside the scope of regulatory consolidation, where the bank does not own more than 10% of the issued share capital
211,140 —
Common Equity — A6
Additional Tier 1 capital — A13
Tier 2 capital — A19
Non-significant investments in the capital of other financials that are below the thresholds for deduction (before risk weighting)
211,140 A21.2
Securities and Money Held in Trust of which: significant investments in the common stock of banking, financial and insurance entities that are outside the scope of regulatory consolidation (net of eligible short positions)
56,096 —
Amount exceeding the 10% threshold on specified items — A7
Amount exceeding the 15% threshold on specified items — A9
Additional Tier 1 capital 39,041 A14
Tier 2 capital — A20
Significant investments in the common stock of financials that are below the thresholds for deduction (before risk weighting)
17,055 A22
Trading Assets 7,491
Monetary Claims Bought 315,805
Call Loans 1,075,000
Receivables under Resale Agreements 37,200
Cash and Due from Banks 26,293,684
Other Assets 1,623,307
Tangible Fixed Assets 118,344
Intangible Fixed Assets 43,920 43,920
of which: goodwill and those equivalents (excluding those reported in the Net Assets section)
— A1.2
of which: other intangible assets other than goodwill and mortgage servicing rights 43,920 A2.1
of which: amount that corresponds to effective tax rate to other intangible assets other than goodwill and mortgage servicing rights
12,188 A2.2
of which: mortgage servicing rights (net of related deferred tax liabilities) — —
Amount exceeding the 10% threshold on specified items — A8
Amount exceeding the 15% threshold on specified items — A10
Amount below the thresholds for deduction (before risk weighting) — A23

CAPITAL ADEQUACY
96INTERIM REPORT 2019 The Norinchukin Bank
(Millions of Yen)
Items
Non-Consolidated balance sheet
amount
Consolidated balance sheet
amounts based on regulatory scope of consolidation
Ref. No.
Defined-benefit pension fund net assets (prepaid pension costs) 24,631 24,631 A3
Customers’ Liabilities for Acceptances and Guarantees 125,217
Reserve for Possible Loan Losses (44,859) (44,859)
of which: general reserve for possible loan losses includes Tier 2 (7) A15
of which: eligible provisions includes Tier 2 — A16
Reserve for Possible Investment Losses (1,047)
Total Assets 106,408,018
(Liabilities)
Deposits 67,074,121
Negotiable Certificates of Deposit 1,979,321
Debentures 1,515,522
Trading Liabilities 4,157
Borrowed Money 4,832,353 4,832,353
of which: qualifying Additional Tier 1 instruments — D1
of which: qualifying Tier 2 instruments 1,415,480 D2
Payables under Repurchase Agreements 15,025,174
Foreign Exchanges Liabilities 9
Trust Money 2,345,944
Other Liabilities 6,456,289
Reserve for Bonus Payments 6,007
Reserve for Employees’ Retirement Benefits 25,183
Reserve for Directors’ Retirement Benefits 658
Deferred Tax Liabilities 432,831 432,831
of which: prepaid pension cost 6,835 D3
Deferred Tax Liabilities for Land Revaluation 8,607
Acceptances and Guarantees 125,217
Total Liabilities 99,831,400
(Net Assets)
Paid-in Capital 3,480,488 3,480,488
Common equity 3,455,488 3,455,488 E1.1
of which: lower dividend rate stock 3,029,771 3,029,771
Preferred stock 24,999 24,999
of which: directly issued qualifying Additional Tier 1 instruments plus related capital surplus of which classified as equity under applicable accounting standards
24,999 E5.1
Capital Surplus 25,020 25,020
Capital surplus 24,999 24,999
of which: directly issued qualifying Additional Tier 1 instruments plus related capital surplus of which classified as equity under applicable accounting standards
24,999 E5.2
Other capital surplus 20 20 E1.2
Retained Earnings 1,938,989 1,939,166 E2
Legal reserves 735,566 735,566
Voluntary reserves 1,203,423 1,203,600
Special reserves 303,500 303,500
General reserves 559,403 559,403
Reserves for tax basis adjustments of fixed assets 7,131 7,131
Others 7 7
Unappropriated retained earnings 333,381 333,558
Total Owners’ Equity 5,444,498 5,444,675
of which: others — E3
of which: directly issued qualifying Tier 2 instruments plus related capital surplus of which classified as equity under applicable accounting standards
— E6

CAPITAL ADEQUACY
97INTERIM REPORT 2019 The Norinchukin Bank
(Millions of Yen)
Items
Non-Consolidated balance sheet
amount
Consolidated balance sheet
amounts based on regulatory scope of consolidation
Ref. No.
Net Unrealized Gains on Other Securities 1,052,310 1,052,310
Net Deferred Losses on Hedging Instruments 65,495 65,495
of which: net deferred losses on hedge 153,886 E7
Revaluation Reserve for Land, net of taxes 14,312 14,312
Foreign Currency Translation Adjustment — 13
Total Valuation and Translation Adjustment 1,132,118 1,132,132 E4
Total Net Assets 6,576,617
Total Liabilities and Net Assets 106,408,018
Notes: 1. “Consolidated balance sheet amounts based on regulatory scope of consolidation” refer only to the items used in calculating capital adequacy. 2. “Consolidated balance sheet amounts based on regulatory scope of consolidation” are the amounts before the transitional arrangements, therefore the
items that were newly included in the Bank’s own capital via the transitional arrangements are not included in this table.

CAPITAL ADEQUACY
98INTERIM REPORT 2019 The Norinchukin Bank
OV1: Overview of RWA (Non-Consolidated)(Millions of Yen)
Basel IIITemplate
No.
a b c d
RWA Minimum capital requirements
For the Six Months Ended September 30,
2019
For the Six Months Ended September 30,
2018
For the Six Months Ended September 30,
2019
For the Six Months Ended September 30,
2018
1 Credit risk (excluding counterparty credit risk) 5,410,109 4,852,143 458,199 410,796
2 Of which: standardized approach (SA) 2,994 8,109 239 648
3 Of which: internal rating-based (IRB) approach 5,289,802 4,713,600 448,575 399,713
Of which: significant investments — — — —
Of which: estimated residual value of lease transactions — — — —
Others 117,312 130,433 9,385 10,434
4 Counterparty credit risk (CCR) 487,033 457,975 39,994 37,733
5Of which: standardized approach for counterparty credit risk (SA-CCR)
56,236 — 4,768 —
Of which: current exposure method (CEM) 39,775 3,372
6 Of which: expected positive exposure (EPE) method — — — —
Of which: credit valuation adjustment (CVA) 82,105 58,031 6,568 4,642
Of which: central counterparty related exposure (CCP) 189,974 171,806 15,197 13,744
Others 158,717 188,363 13,459 15,973
7 Equity positions in banking book under market-based approach 3,720,080 1,703,477 315,462 144,454
8 Equity investments in funds - Look-through approach 23,112,761 1,959,636 9 Equity investments in funds - Mandate-based approach 149 12
Equity investments in funds - Simple approach (subject to 250% RW)
— —
Equity investments in funds - Simple approach (subject to 400% RW)
231,936 19,668
10Equity investments in funds - Fall-back approach (subject to 1,250% RW)
988,078 79,046
Equity investments in funds (SA) — —
Equity investments in funds (IRB) 25,598,404 2,170,716
11 Settlement risk 549 — 46 —
12 Securitization exposures in banking book 2,139,222 654,444 171,137 55,496
13Of which: Securitization internal rating-based approach (SEC-IRBA) or internal assessment approach (IAA)
— —
14Of which: Securitization external ratings-based approach (SEC-ERBA)
2,139,222 171,137
15 Of which: Securitization standardized approach (SEC-SA) — —Of which: Ratings-based approach (RBA) or internal assessment approach (IAA) in the IRB approach
654,444 55,496
Of which: IRB Supervisory Formula Approach (SFA) — —
Of which: Standardized approach (SA) — —
Of which: 1,250% risk weight is applied 0 0 0 0
16 Market risk 3,278,770 1,569,780 262,301 125,582
17 Of which: standardized approach (SA) 3,267,850 1,532,522 261,428 122,601
18 Of which: internal model approaches (IMA) 10,919 37,257 873 2,980
19 Operational risk 541,046 681,275 43,283 54,502
20 Of which: Basic Indicator Approach — — — —
21 Of which: Standardized Approach 541,046 681,275 43,283 54,502
22 Of which: Advanced Measurement Approach — — — —
23 Amounts below the thresholds for deduction 42,638 42,638 3,615 3,615
Risk weighted assets subject to transitional arrangements
24 Floor adjustment — — — —
25 Total 39,952,376 35,560,140 3,352,405 3,002,898
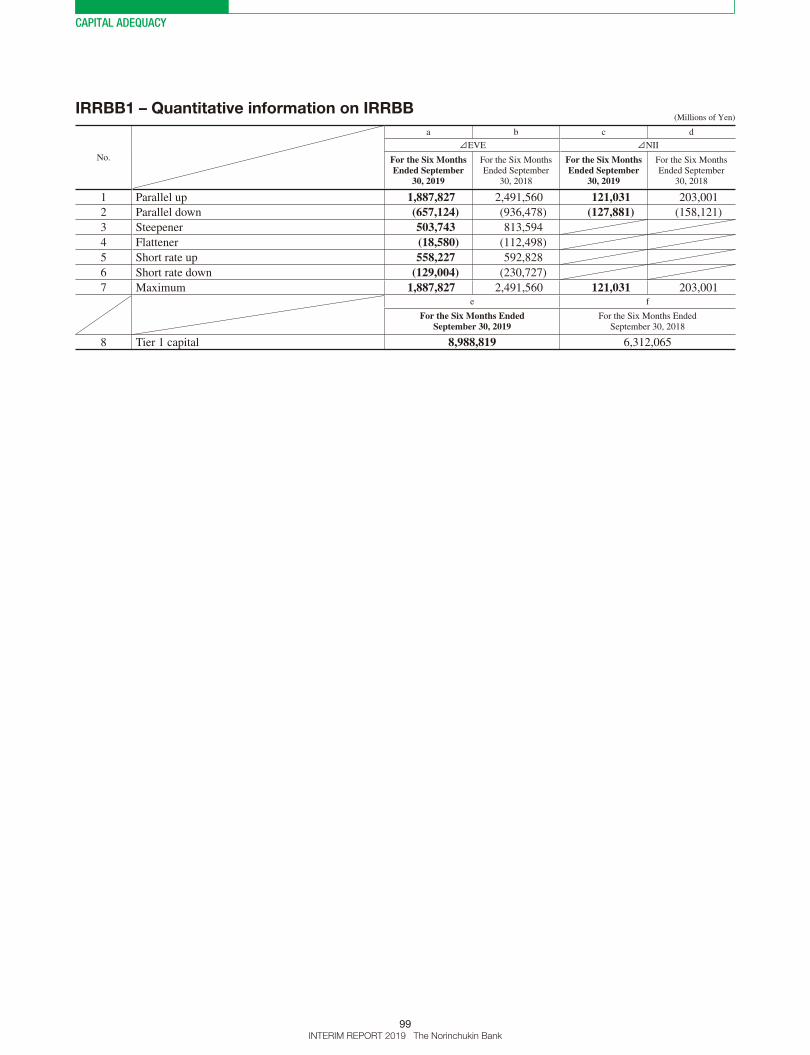
CAPITAL ADEQUACY
99INTERIM REPORT 2019 The Norinchukin Bank
IRRBB1 – Quantitative information on IRRBB (Millions of Yen)
No.
a b c d
⊿EVE ⊿NII
For the Six Months Ended September
30, 2019
For the Six Months Ended September
30, 2018
For the Six Months Ended September
30, 2019
For the Six Months Ended September
30, 2018
1 Parallel up 1,887,827 2,491,560 121,031 203,001
2 Parallel down (657,124) (936,478) (127,881) (158,121)
3 Steepener 503,743 813,594
4 Flattener (18,580) (112,498)
5 Short rate up 558,227 592,828
6 Short rate down (129,004) (230,727)
7 Maximum 1,887,827 2,491,560 121,031 203,001e f
For the Six Months Ended September 30, 2019
For the Six Months Ended September 30, 2018
8 Tier 1 capital 8,988,819 6,312,065
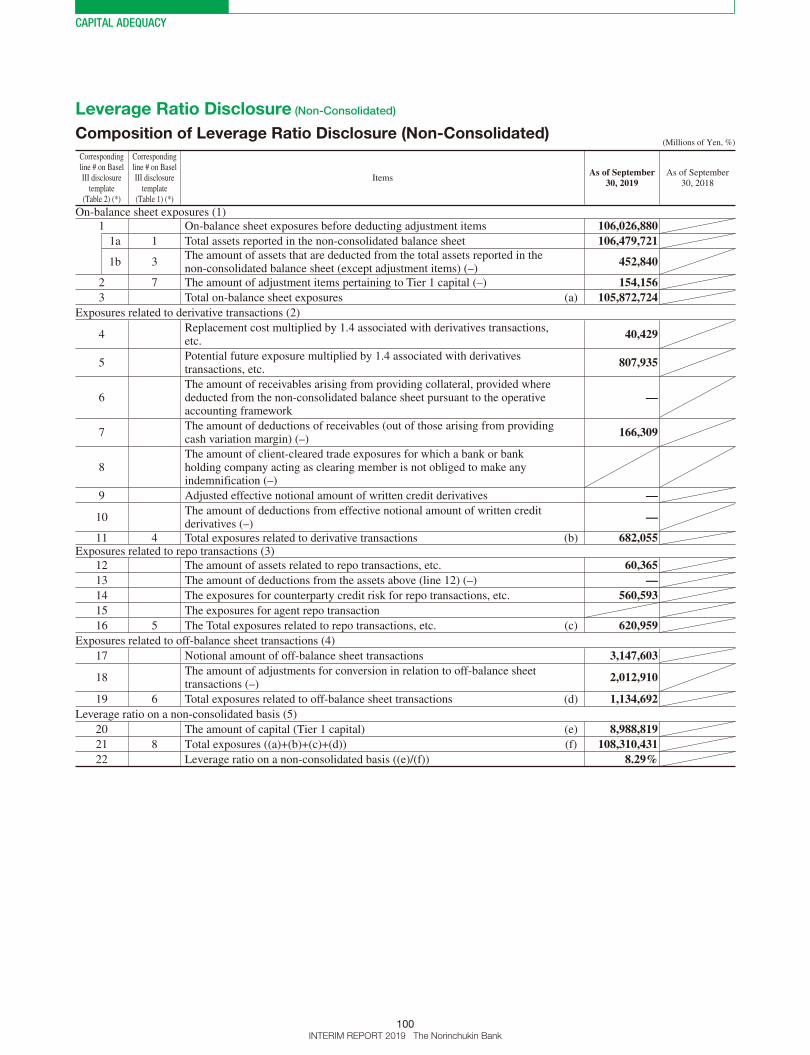
CAPITAL ADEQUACY
100INTERIM REPORT 2019 The Norinchukin Bank
Leverage Ratio Disclosure (Non-Consolidated)
Composition of Leverage Ratio Disclosure (Non-Consolidated) (Millions of Yen, %)
Corresponding line # on Basel III disclosure
template (Table 2) (*)
Corresponding line # on Basel III disclosure
template (Table 1) (*)
ItemsAs of September
30, 2019As of September
30, 2018
On-balance sheet exposures (1)1 On-balance sheet exposures before deducting adjustment items 106,026,880
1a 1 Total assets reported in the non-consolidated balance sheet 106,479,721
1b 3The amount of assets that are deducted from the total assets reported in the non-consolidated balance sheet (except adjustment items) (–)
452,840
2 7 The amount of adjustment items pertaining to Tier 1 capital (–) 154,156 3 Total on-balance sheet exposures (a) 105,872,724
Exposures related to derivative transactions (2)
4Replacement cost multiplied by 1.4 associated with derivatives transactions, etc.
40,429
5Potential future exposure multiplied by 1.4 associated with derivatives transactions, etc.
807,935
6The amount of receivables arising from providing collateral, provided where deducted from the non-consolidated balance sheet pursuant to the operative accounting framework
—
7The amount of deductions of receivables (out of those arising from providing cash variation margin) (–)
166,309
8The amount of client-cleared trade exposures for which a bank or bank holding company acting as clearing member is not obliged to make any indemnification (–)
9 Adjusted effective notional amount of written credit derivatives —
10The amount of deductions from effective notional amount of written credit derivatives (–)
—
11 4 Total exposures related to derivative transactions (b) 682,055 Exposures related to repo transactions (3)
12 The amount of assets related to repo transactions, etc. 60,365 13 The amount of deductions from the assets above (line 12) (–) —14 The exposures for counterparty credit risk for repo transactions, etc. 560,593 15 The exposures for agent repo transaction
16 5 The Total exposures related to repo transactions, etc. (c) 620,959 Exposures related to off-balance sheet transactions (4)
17 Notional amount of off-balance sheet transactions 3,147,603
18The amount of adjustments for conversion in relation to off-balance sheet transactions (–)
2,012,910
19 6 Total exposures related to off-balance sheet transactions (d) 1,134,692 Leverage ratio on a non-consolidated basis (5)
20 The amount of capital (Tier 1 capital) (e) 8,988,819 21 8 Total exposures ((a)+(b)+(c)+(d)) (f) 108,310,431 22 Leverage ratio on a non-consolidated basis ((e)/(f)) 8.29%
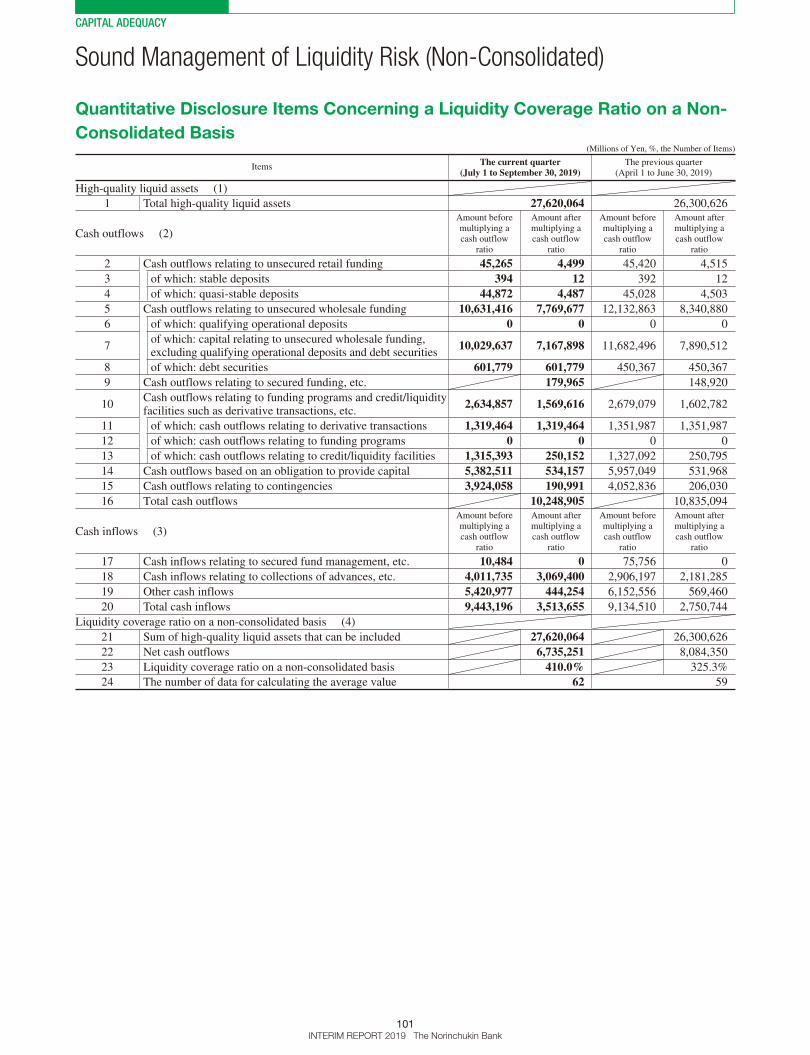
CAPITAL ADEQUACY
101INTERIM REPORT 2019 The Norinchukin Bank
(Millions of Yen, %, the Number of Items)
ItemsThe current quarter
(July 1 to September 30, 2019)The previous quarter
(April 1 to June 30, 2019)
High-quality liquid assets (1)
1 Total high-quality liquid assets 27,620,064 26,300,626
Cash outflows (2)
Amount before multiplying a cash outflow
ratio
Amount after multiplying a cash outflow
ratio
Amount before multiplying a cash outflow
ratio
Amount after multiplying a cash outflow
ratio
2 Cash outflows relating to unsecured retail funding 45,265 4,499 45,420 4,515
3 of which: stable deposits 394 12 392 12
4 of which: quasi-stable deposits 44,872 4,487 45,028 4,503
5 Cash outflows relating to unsecured wholesale funding 10,631,416 7,769,677 12,132,863 8,340,880
6 of which: qualifying operational deposits 0 0 0 0
7of which: capital relating to unsecured wholesale funding, excluding qualifying operational deposits and debt securities
10,029,637 7,167,898 11,682,496 7,890,512
8 of which: debt securities 601,779 601,779 450,367 450,367
9 Cash outflows relating to secured funding, etc. 179,965 148,920
10Cash outflows relating to funding programs and credit/liquidity facilities such as derivative transactions, etc.
2,634,857 1,569,616 2,679,079 1,602,782
11 of which: cash outflows relating to derivative transactions 1,319,464 1,319,464 1,351,987 1,351,987
12 of which: cash outflows relating to funding programs 0 0 0 0
13 of which: cash outflows relating to credit/liquidity facilities 1,315,393 250,152 1,327,092 250,795
14 Cash outflows based on an obligation to provide capital 5,382,511 534,157 5,957,049 531,968
15 Cash outflows relating to contingencies 3,924,058 190,991 4,052,836 206,030
16 Total cash outflows 10,248,905 10,835,094
Cash inflows (3)
Amount before multiplying a cash outflow
ratio
Amount after multiplying a cash outflow
ratio
Amount before multiplying a cash outflow
ratio
Amount after multiplying a cash outflow
ratio
17 Cash inflows relating to secured fund management, etc. 10,484 0 75,756 0
18 Cash inflows relating to collections of advances, etc. 4,011,735 3,069,400 2,906,197 2,181,285
19 Other cash inflows 5,420,977 444,254 6,152,556 569,460
20 Total cash inflows 9,443,196 3,513,655 9,134,510 2,750,744
Liquidity coverage ratio on a non-consolidated basis (4)
21 Sum of high-quality liquid assets that can be included 27,620,064 26,300,626
22 Net cash outflows 6,735,251 8,084,350
23 Liquidity coverage ratio on a non-consolidated basis 410.0% 325.3%
24 The number of data for calculating the average value 62 59
Quantitative Disclosure Items Concerning a Liquidity Coverage Ratio on a Non-
Consolidated Basis
Sound Management of Liquidity Risk (Non-Consolidated)
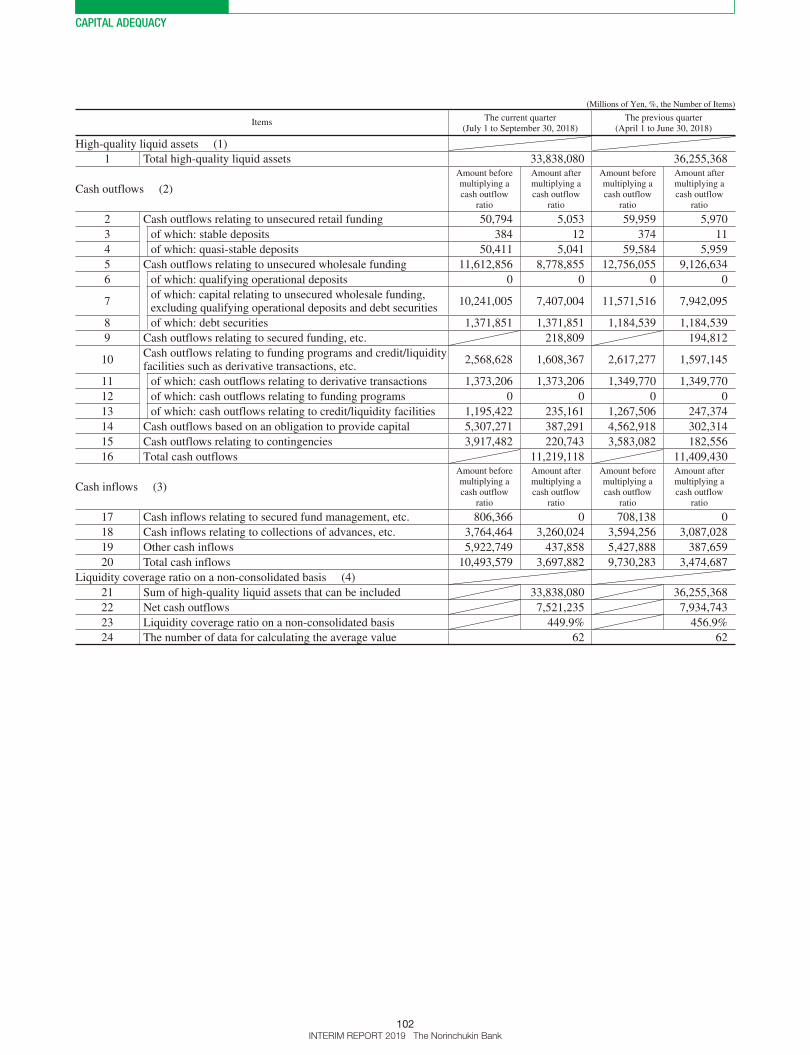
CAPITAL ADEQUACY
102INTERIM REPORT 2019 The Norinchukin Bank
(Millions of Yen, %, the Number of Items)
ItemsThe current quarter
(July 1 to September 30, 2018)The previous quarter
(April 1 to June 30, 2018)
High-quality liquid assets (1)
1 Total high-quality liquid assets 33,838,080 36,255,368
Cash outflows (2)
Amount before multiplying a cash outflow
ratio
Amount after multiplying a cash outflow
ratio
Amount before multiplying a cash outflow
ratio
Amount after multiplying a cash outflow
ratio
2 Cash outflows relating to unsecured retail funding 50,794 5,053 59,959 5,970
3 of which: stable deposits 384 12 374 11
4 of which: quasi-stable deposits 50,411 5,041 59,584 5,959
5 Cash outflows relating to unsecured wholesale funding 11,612,856 8,778,855 12,756,055 9,126,634
6 of which: qualifying operational deposits 0 0 0 0
7of which: capital relating to unsecured wholesale funding, excluding qualifying operational deposits and debt securities
10,241,005 7,407,004 11,571,516 7,942,095
8 of which: debt securities 1,371,851 1,371,851 1,184,539 1,184,539
9 Cash outflows relating to secured funding, etc. 218,809 194,812
10Cash outflows relating to funding programs and credit/liquidity facilities such as derivative transactions, etc.
2,568,628 1,608,367 2,617,277 1,597,145
11 of which: cash outflows relating to derivative transactions 1,373,206 1,373,206 1,349,770 1,349,770
12 of which: cash outflows relating to funding programs 0 0 0 0
13 of which: cash outflows relating to credit/liquidity facilities 1,195,422 235,161 1,267,506 247,374
14 Cash outflows based on an obligation to provide capital 5,307,271 387,291 4,562,918 302,314
15 Cash outflows relating to contingencies 3,917,482 220,743 3,583,082 182,556
16 Total cash outflows 11,219,118 11,409,430
Cash inflows (3)
Amount before multiplying a cash outflow
ratio
Amount after multiplying a cash outflow
ratio
Amount before multiplying a cash outflow
ratio
Amount after multiplying a cash outflow
ratio
17 Cash inflows relating to secured fund management, etc. 806,366 0 708,138 0
18 Cash inflows relating to collections of advances, etc. 3,764,464 3,260,024 3,594,256 3,087,028
19 Other cash inflows 5,922,749 437,858 5,427,888 387,659
20 Total cash inflows 10,493,579 3,697,882 9,730,283 3,474,687
Liquidity coverage ratio on a non-consolidated basis (4)
21 Sum of high-quality liquid assets that can be included 33,838,080 36,255,368
22 Net cash outflows 7,521,235 7,934,743
23 Liquidity coverage ratio on a non-consolidated basis 449.9% 456.9%
24 The number of data for calculating the average value 62 62
CAPITAL ADEQUACY
103INTERIM REPORT 2019 The Norinchukin Bank
Items concerning a change in the non-
consolidated liquidity coverage ratio on a
time-series basis
The non-consolidated liquidity coverage ratio has shown
stable progress for the past two years.
Items concerning evaluation of the level
of the non-consolidated liquidity cover-
age ratio
The non-consolidated liquidity coverage ratio has tended to
be well above the required level.
The future non-consolidated liquidity coverage ratio is
not predicted to differ substantially from the disclosed ratio.
The actual value of the non-consolidated liquidity cover-
age ratio does not differ substantially from the initial forecast.
Qualitative Disclosure Items Concerning a Liquidity Coverage Ratio on a Non-
Consolidated Basis
Items concerning the details of the sum
of high-quality liquid assets that can be
included
In light of the Bank’s non-consolidated liquidity coverage
ratio, there is no material item.
Other items concerning the non-consoli-
dated liquidity coverage ratio
The Bank has not adopted the “Special case related to quali-
fying operational deposits” and the “Additional amount of
collateral required at the time of scenario approach-based
changes in fair value.”


![Capital Adequacy (E) Task Force - National Association of ... · Capital Adequacy (E) Task Force . RBC Proposal Form [ ] Capital Adequacy (E) Task Force ... LR004 – Mortgages –](https://static.fdocuments.in/doc/165x107/5f0a28317e708231d42a4995/capital-adequacy-e-task-force-national-association-of-capital-adequacy-e.jpg)