Hertfordshire Minerals Planning · Hertfordshire Minerals Planning ... 2 INTRODUCTION ... monitor...
38
Hertfordshire Minerals Planning Local Aggregate Assessment 2017
Transcript of Hertfordshire Minerals Planning · Hertfordshire Minerals Planning ... 2 INTRODUCTION ... monitor...

Local Aggregate Assessment 2017
Hertfordshire Minerals
Planning
Local Aggregate Assessment
2017
Local Aggregate Assessment 2017
Contents
1 EXECUTIVE SUMMARY 1 2 INTRODUCTION 2 3 GEOLOGY OF HERTFORDSHIRE 3
Sand and Gravel 4 Chalk 5 Clay 6 Hard Rock 6 Marine Aggregates 6
4 SAND AND GRAVEL SALES 7 Extraction Sites 8 Apportionments 10 Local approach to determining apportionment figures 12 Landbank of permitted mineral reserves 13 Timeline for mineral planning 14
5 IMPORTS AND EXPORTS 14 Imports – Sand and Gravel 15 Imports – Marine sources 15 Imports – Crushed Rock 16 Exports – Sand and Gravel 16 Sales and Construction 17 Rail Aggregate Depots 18 Brick Clay 20 Chalk 20
6 SECONDARY AND RECYCLED AGGREGATE 21 Inert Waste Management in Hertfordshire 22 Secondary and Recycled Aggregate Sources 23 Expected Contribution to Supply 24
7 FUTURE AGGREGATES SUPPLY AND DEMAND 25 Supply 25 Potential Future Supply from Preferred Areas 28 Demand 28 Population Projections 28 Housing completions and forecast 29 Key Planned Infrastructure Requirements 30
8 CONCLUSION 32
LIST OF TABLES
Table 1: Sand and gravel sales compared with permitted reserves in Hertfordshire since 2007
Table 2: Permitted sand and gravel extraction in Hertfordshire
Table 3: Sales and apportionment
Table 4: Landbanks for sand and gravel in Hertfordshire in 2015
Table 5: Hertfordshire’s primary aggregates imports and exports (2009)
Table 6: Sales and consumption in 2016
Table 7: Permitted chalk extraction sites in Hertfordshire
Table 8: Total recycled and secondary aggregate processed over the last 10 years
Table 9: Secondary and recycled aggregate sites
Table 10: Requirement for sand and gravel in Hertfordshire over the Plan period of 15 year to 2031
Table 11: Planned housing requirements at the district/borough councils
LIST OF FIGURES
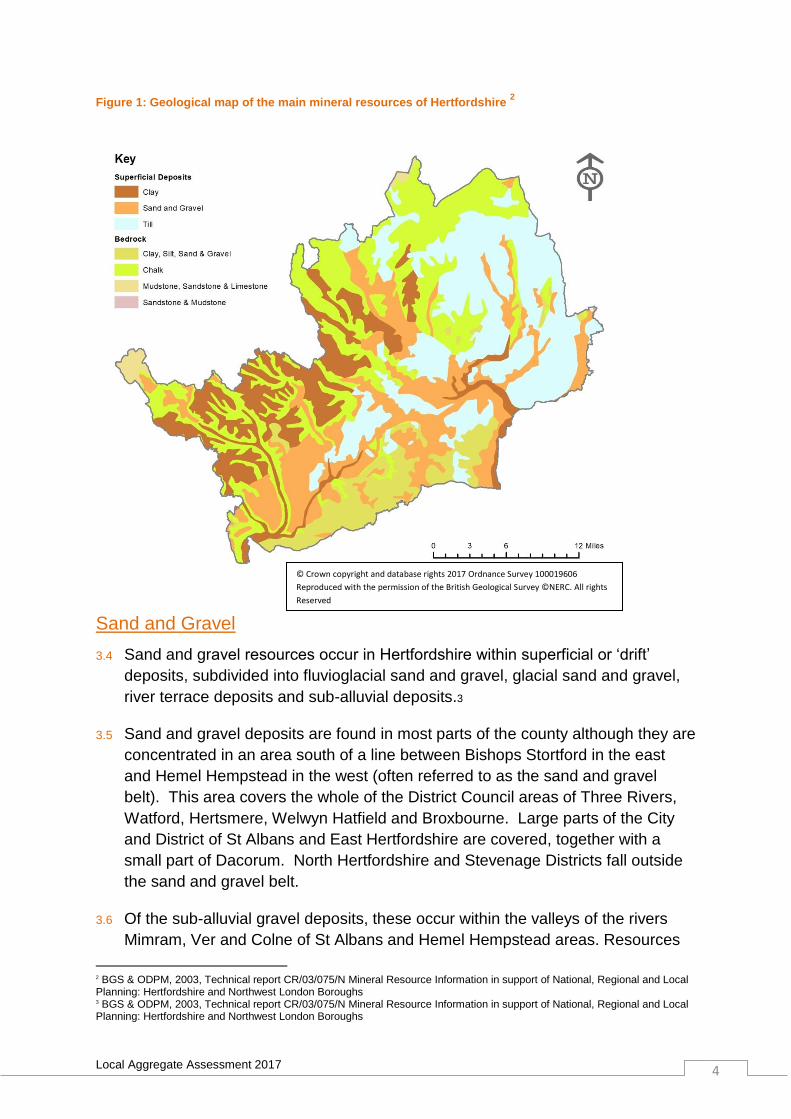
Figure 1: Geological map of the main mineral resources of Hertfordshire
Figure 2: Sales of sand and gravel in Hertfordshire 2007-2016 compared with apportionment
Figure 3: Geology of Hertfordshire with permitted sand and gravel sites
Figure 4: Hertfordshire’s rail aggregate depots
Figure 5: Location of permitted sites in Hertfordshire for the production of recycled/secondary
aggregates
Local Aggregate Assessment 2017 1
1 EXECUTIVE SUMMARY
1.1 The county council has a duty under the National Planning Policy Framework
(NPPF) to produce a Local Aggregate Assessment (LAA). The LAA will be
considered by the members of the East of England Aggregates Working Party.
1.2 The LAA is an evidence base document for the review of the Minerals Local
Plan. Its primary purpose is to set out aggregate supply and demand to calculate
landbanks and acts as a monitoring report for aggregates. For Hertfordshire the
aggregates reported are land won sand and gravel and secondary and recycled
aggregates. The county does not have any reserves of hard rock. The LAA is
updated annually to provide an up-to-date picture of the sand and gravel
reserves and sales in the county over the last ten years and compares this with
the predicted future land-won aggregate need whilst taking into account the
imports and exports of sand and gravel and secondary and recycled aggregates.
1.3 This document covers the calendar year for 2016. The headline figures for 2016
show that extraction is steadily continuing at the active sand and gravel sites.
One additional site began extracting within this timeframe, average sales have
remained fairly steady and reserves have declined in line with sales. The
permitted reserves can supply aggregate for a period of 8.5 years based on
Hertfordshire’s current apportionment of 1.39 million tonnes.
1.4 Sales of sand and gravel have decreased this year compared with last year by
4.9%. At 1.165 million tonnes, they are above the ten year average as they were
last year, but are now below the three year average. As a comparison, the ten
year average sales figure is 1.15 million tonnes and the three year average is
1.20 million tonnes. In terms of the destination of these sales, we only have a
broad indication from 2014 data which shows that 57% was sold within Herts
with 22% to the rest of the East of England area and 21% to other destinations in
the UK.
1.5 The county council intends to continue to use the sub-regional apportionment
figure for the planning of sand and gravel in Hertfordshire, which is in line with
the East of England Aggregates Working Party’s collectively agreed approach to
plan making.
1.6 Of the sites listed in the adopted Minerals Local Plan with potential to extract
sand and gravel, all three Preferred Areas have come forward for extraction. The
third and final Preferred Area (BAE, Land at Hatfield Aerodrome) was granted
planning permission subject to S106 at Committee in January 2017. Land at
Ware Park covers the southern part of Preferred Area 2 at Rickneys Quarry had
permission refused at Committee in March 2017. In addition planning permission
has been granted subject to S106 at Furzefield, Hatfield Quarry at Committee on
22 March 2017.

Local Aggregate Assessment 2017 2
Summary of main conclusions of this LAA
Performance in 2016
Comparison with 2015
Land won sand and gravel sales (tonnes) 1,164,633 ↓ 59,651
Permitted reserves of sand and gravel (tonnes)
11,752,000 ↓ 1,463,716
Landbank based on apportionment (years)
8.5 ↓ 1
Landbank based on 10 year average sales (years)
10.2 ↓ 1.2
Landbank based on 3 year average sales (years)
9.8 ↓ 1.3
Rail depot imports (sand and gravel) - ↓ 34,613
Rail depot imports (crushed rock) 520,085 ↑ 66,196
2 INTRODUCTION
2.1 The Government recognises the importance of minerals to support sustainable
economic growth and our quality of life. They are a finite resource and can only
be worked where they are found. The National Planning Policy Framework
(NPPF) (March 2012) paragraph 145 requires Minerals Planning Authorities to
monitor aggregate production and plan for a steady and adequate supply of
aggregates.
2.2 This document has been prepared to fulfil the requirement introduced within the
NPPF to produce an annual Local Aggregate Assessment (LAA). It has been
prepared in line with guidance within the National Planning Policy Guidance
(NPPG) and POS/MPA Practice Guidance on the production and use of LAAs
living document (May 2017).
2.3 The purpose of the LAA is to assess the current local mineral provision against
the requirements detailed in the NPPF and NPPG, including the Government’s
Guidance on Managed Aggregate Supply System which has now been
incorporated into the NPPG. The document details performance in line with the
East of England Aggregates Working Party. It also reviews guidance from the
government’s Department for Communities and Local Government relating to the
NPPF. The county council will update this document on an annual basis and will
use its contents to inform the review of Hertfordshire’s Minerals Local Plan.

Local Aggregate Assessment 2017 3
2.4 This LAA details the current supply and demand in Hertfordshire, from which
information relating to existing sites, reserves and aggregate apportionment
levels to 2031 (plan period for the new Minerals Local Plan), based on the
agreed East of England apportionment figure and rolling average of ten years
sales data and other relevant local information, is included within this document.
Other potential sources of aggregates are included, namely secondary and
recycled aggregates, imports and exports.
3 GEOLOGY OF HERTFORDSHIRE
3.1 The main mineral resources in Hertfordshire are sand and gravel with smaller
deposits of chalk and brick clay (as shown in Figure 1).
3.2 The geology of Hertfordshire is largely Chalk of the Cretaceous period, overlain
in the south and east by London Clay. In the far north and northwest of the
county are small areas of Gault Clay. Throughout much of the county, the
superficial deposits which overlay the solid geology complicate the picture.
These include the Clay-with-flints of much of west Hertfordshire; including the
Chilterns dip slope; the boulder clay of central and east Hertfordshire; and the
gravels of the Vale of St Albans and the river valleys.1
3.3 Sand, gravel, crushed rock, chalk and clay all provide the construction industry
with the raw materials required for constructing and maintaining roads, buildings
and other infrastructure. Minerals are also essential elements in the production
of a variety of other products. An adequate and steady supply of minerals is
essential if current standards of living are to be maintained in society as well as
meeting basic needs for quality of life, such as shelter.
1 Biodiversity Action Plan for Hertfordshire 2006, www.hef.org.uk
Local Aggregate Assessment 2017 4
Figure 1: Geological map of the main mineral resources of Hertfordshire 2
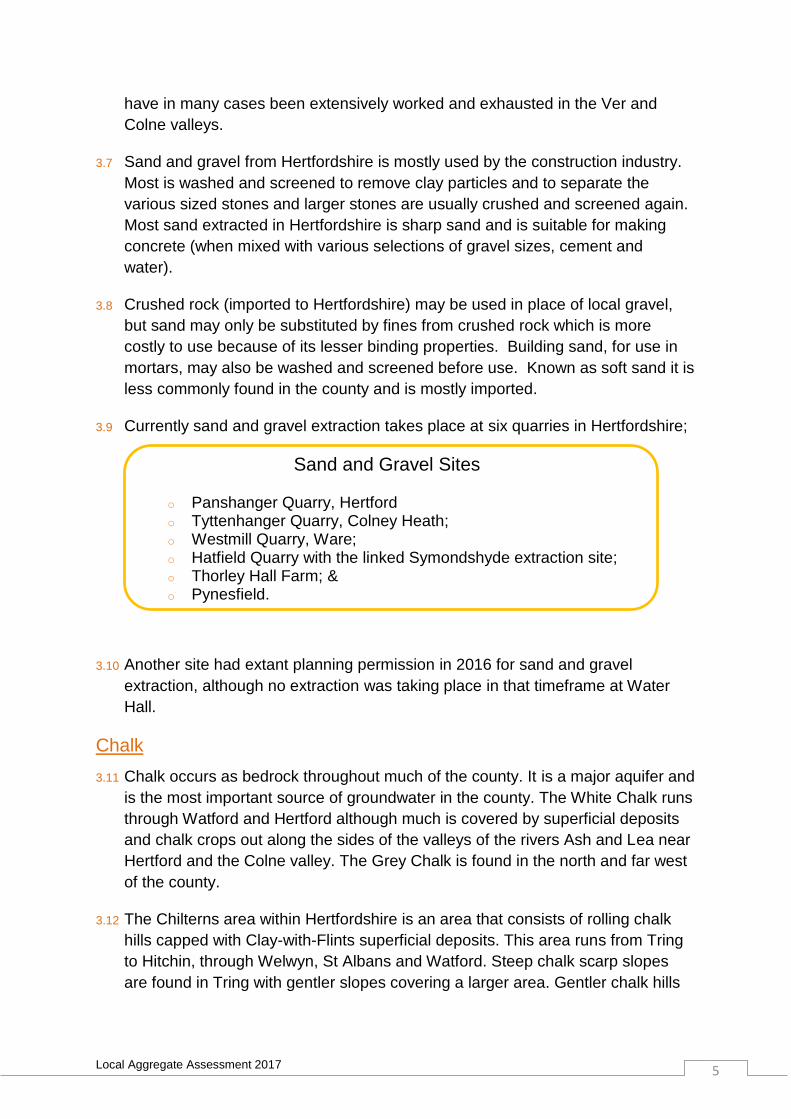
Sand and Gravel
3.4 Sand and gravel resources occur in Hertfordshire within superficial or ‘drift’
deposits, subdivided into fluvioglacial sand and gravel, glacial sand and gravel,
river terrace deposits and sub-alluvial deposits.3
3.5 Sand and gravel deposits are found in most parts of the county although they are
concentrated in an area south of a line between Bishops Stortford in the east
and Hemel Hempstead in the west (often referred to as the sand and gravel
belt). This area covers the whole of the District Council areas of Three Rivers,
Watford, Hertsmere, Welwyn Hatfield and Broxbourne. Large parts of the City
and District of St Albans and East Hertfordshire are covered, together with a
small part of Dacorum. North Hertfordshire and Stevenage Districts fall outside
the sand and gravel belt.
3.6 Of the sub-alluvial gravel deposits, these occur within the valleys of the rivers
Mimram, Ver and Colne of St Albans and Hemel Hempstead areas. Resources
2 BGS & ODPM, 2003, Technical report CR/03/075/N Mineral Resource Information in support of National, Regional and Local Planning: Hertfordshire and Northwest London Boroughs 3 BGS & ODPM, 2003, Technical report CR/03/075/N Mineral Resource Information in support of National, Regional and Local Planning: Hertfordshire and Northwest London Boroughs
© Crown copyright and database rights 2017 Ordnance Survey 100019606
Reproduced with the permission of the British Geological Survey ©NERC. All rights
Reserved
Local Aggregate Assessment 2017 5
have in many cases been extensively worked and exhausted in the Ver and
Colne valleys.
3.7 Sand and gravel from Hertfordshire is mostly used by the construction industry.
Most is washed and screened to remove clay particles and to separate the
various sized stones and larger stones are usually crushed and screened again.
Most sand extracted in Hertfordshire is sharp sand and is suitable for making
concrete (when mixed with various selections of gravel sizes, cement and
water).
3.8 Crushed rock (imported to Hertfordshire) may be used in place of local gravel,
but sand may only be substituted by fines from crushed rock which is more
costly to use because of its lesser binding properties. Building sand, for use in
mortars, may also be washed and screened before use. Known as soft sand it is
less commonly found in the county and is mostly imported.
3.9 Currently sand and gravel extraction takes place at six quarries in Hertfordshire;
Sand and Gravel Sites
o Panshanger Quarry, Hertford o Tyttenhanger Quarry, Colney Heath; o Westmill Quarry, Ware; o Hatfield Quarry with the linked Symondshyde extraction site; o Thorley Hall Farm; & o Pynesfield.
3.10 Another site had extant planning permission in 2016 for sand and gravel
extraction, although no extraction was taking place in that timeframe at Water
Hall.
Chalk
3.11 Chalk occurs as bedrock throughout much of the county. It is a major aquifer and
is the most important source of groundwater in the county. The White Chalk runs
through Watford and Hertford although much is covered by superficial deposits
and chalk crops out along the sides of the valleys of the rivers Ash and Lea near
Hertford and the Colne valley. The Grey Chalk is found in the north and far west
of the county.
3.12 The Chilterns area within Hertfordshire is an area that consists of rolling chalk
hills capped with Clay-with-Flints superficial deposits. This area runs from Tring
to Hitchin, through Welwyn, St Albans and Watford. Steep chalk scarp slopes
are found in Tring with gentler slopes covering a larger area. Gentler chalk hills
Local Aggregate Assessment 2017 6
than the Chilterns are found in the East Anglian Chalk area which runs from the
Chilterns through Hertfordshire and South Cambridgeshire.
3.13 There were many chalk extraction sites in the past, essentially for local use.
However today, the scale of working is relatively small and chalk is mainly
quarried at a small number of sites to the north and west of the sand and gravel
belt. Chalk in Hertfordshire is extracted for use as an agricultural lime on farms
both within and outside the county.
3.14 There are currently three chalk extraction sites in Hertfordshire:
Chalk sites
o Codicote; o Bedwell Park (just outside of Hertford); and o Anstey.
Clay
3.15 Hertfordshire sits within the Northern Thames Basin Character Area with geology
of mostly London Clay overlain with superficial deposits of sand and gravel. The
west Anglian Plain with geology of Gault Clay adjoins the northern part of the
county and the Eastern Anglian Plain covers a large part of the East of the
county with underlying chalk with a covering of Boulder Clay.
3.16 The scale of working for brick clay is relatively small. The only brick clay is
located in the Hemel Hempstead area. Brick clay is extracted for use at
specialist brickworks in the county, of which there is one remaining in the county,
in Bovingdon. The bricks are made from mottled clays of Reading Formation and
Clay-with-Flints. Two sites in Hertfordshire have permission to extract brick clay
for use at Bovingdon Brickworks. These sites are Pocket’s Dell Quarry and Land
at Cox and Croft Fields, Shantock Hall Lane
Hard Rock
3.17 There is no hard rock found in the county. Hertfordshire imports crushed rock
into the county via the rail aggregate depots. Reserves from outside of
Hertfordshire will be relied upon for this source of mineral.
Marine Aggregates
3.18 Hertfordshire is a land locked county and as such contains no areas suitable for
the dredging of marine aggregates. A relatively small amount of marine sand and
gravel is consumed in the county which is imported via Kent and London.
Local Aggregate Assessment 2017 7
4 SAND AND GRAVEL SALES
4.1 Sales of sand and gravel (including soft sands) for the ten year period between
2007 and 2016 inclusive are shown in Figure 2 and Table 1. The figures are
based on actual sales data retrieved from the county’s Aggregate Monitoring
Surveys 2016 and the BGS Aggregate Minerals Survey 2014 for England and
Wales collated data for Hertfordshire’s aggregate sales and destinations.
4.2 However, there have historically been difficulties in obtaining mineral data and
this problem is recognised nationally. Only some minerals data is made available
to the minerals planning authority or can be inaccurate, inconsistent and
incomplete. The county council is part of the East of England Aggregates
Working Party (EEAWP), which is a technical working group comprising mineral
planning authorities and other interested parties that are working together to
obtain better survey data which is used by individual authorities and collated in
the East of England Authorities’ Monitoring Report. It is hoped that in the years
to come the data available for both minerals and waste will be more available
and consistent.
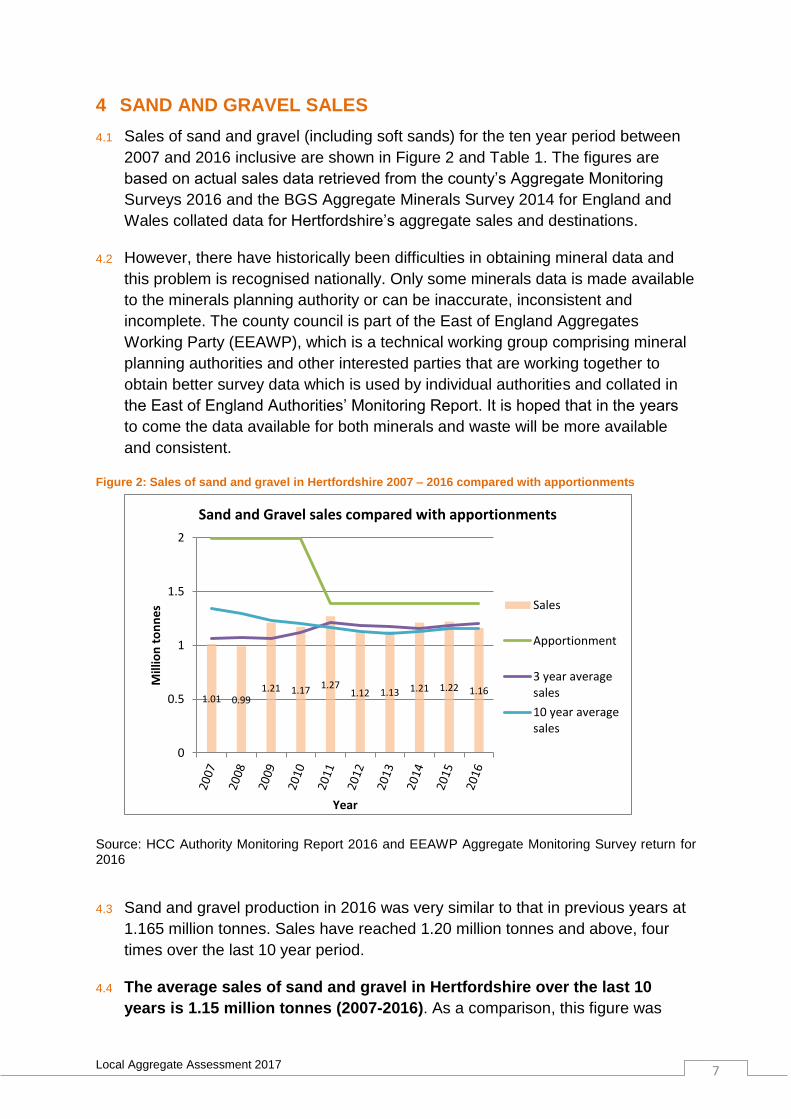
Figure 2: Sales of sand and gravel in Hertfordshire 2007 – 2016 compared with apportionments
Source: HCC Authority Monitoring Report 2016 and EEAWP Aggregate Monitoring Survey return for 2016
4.3 Sand and gravel production in 2016 was very similar to that in previous years at
1.165 million tonnes. Sales have reached 1.20 million tonnes and above, four
times over the last 10 year period.
4.4 The average sales of sand and gravel in Hertfordshire over the last 10
years is 1.15 million tonnes (2007-2016). As a comparison, this figure was
1.01 0.99 1.21 1.17
1.27 1.12 1.13 1.21 1.22 1.16
0
0.5
1
1.5
2
Mill
ion
to
nn
es
Year
Sand and Gravel sales compared with apportionments
Sales
Apportionment
3 year averagesales
10 year averagesales

Local Aggregate Assessment 2017 8
1.16 million tonnes as of 2015, 1.13 million tonnes as of 2014 and 1.12 million
tonnes as of 2013, thereby remaining relatively constant over the last few years.
4.5 The rolling 3 year average is 1.20 million tonnes per annum (2014-2016).
This was 1.16 million tonnes per annum in 2015, 1.15 million tonnes per annum
in 2014 and 1.13 million tonnes per annum in 2013.
4.6 Based on 2016 levels, Hertfordshire contributed 10% and in 2015 contributed
11% of the sand and gravel sales in the East of England region 4.
4.7 Figures for reserves are available from 2007. The table below shows the sales
figure alongside the reserves figure for sand and gravel in Hertfordshire.
Table 1: Sand and gravel sales compared with permitted reserves in Hertfordshire since 2007
Year Sales of soft sand and sharp sands and gravel (tonnes)
Permitted reserves of soft sand and sharp sands and gravel (tonnes)
2007 1,010,466 10,840,668
2008 988,517 10,869,000
2009 1,214,3065 10,619,000
2010 1,172,890 10,786,465
2011 1,268,465 16,700,000
2012 1,123,645 15,792,000
2013 1,130,295 16,260,000
2014 1,209,532 14,440,000
2015 1,224,284 13,215,716
2016 1,164,633 11,752,000
Source: HCC Authority Monitoring Report 2017 & Annual East of England Aggregates Working Party Aggregates Monitoring Survey return for 2016
4.8 The table above shows that between 2007 and 2010 the permitted reserves of
sand and gravel in the county remained fairly constant; however this is now at a
higher level due to additional planning permissions and reassessment of actual
reserves by operators.
Extraction Sites
4 East of England Aggregates Working Party Annual Monitoring Report 2016, published August 2017 5 There is a slight difference between the figure in the HCC Annual Monitoring Report 2010 and the figure recorded by the East of England Aggregate Monitoring Survey for 2009 (1,214,306t and 1,207,000t respectively)
Local Aggregate Assessment 2017 9
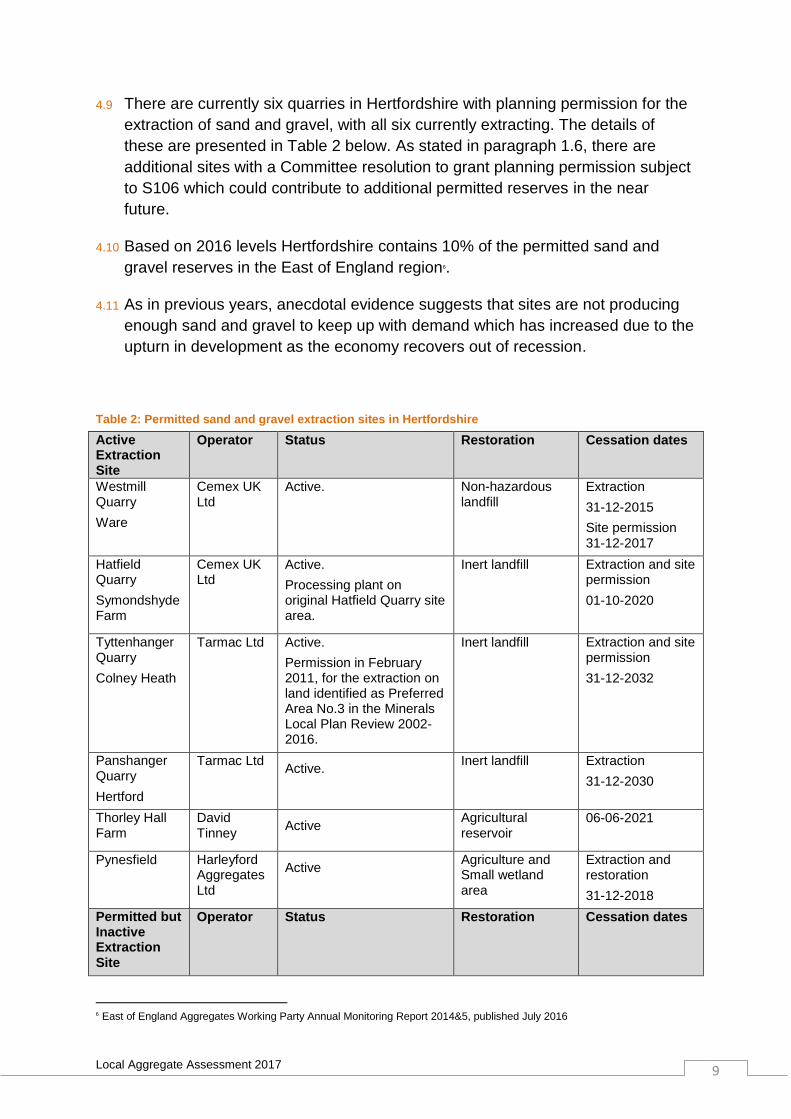
4.9 There are currently six quarries in Hertfordshire with planning permission for the
extraction of sand and gravel, with all six currently extracting. The details of
these are presented in Table 2 below. As stated in paragraph 1.6, there are
additional sites with a Committee resolution to grant planning permission subject
to S106 which could contribute to additional permitted reserves in the near
future.
4.10 Based on 2016 levels Hertfordshire contains 10% of the permitted sand and
gravel reserves in the East of England region6.
4.11 As in previous years, anecdotal evidence suggests that sites are not producing
enough sand and gravel to keep up with demand which has increased due to the
upturn in development as the economy recovers out of recession.
Table 2: Permitted sand and gravel extraction sites in Hertfordshire
Active Extraction Site
Operator Status Restoration Cessation dates
Westmill Quarry
Ware
Cemex UK Ltd
Active. Non-hazardous landfill
Extraction
31-12-2015
Site permission 31-12-2017
Hatfield Quarry
Symondshyde Farm
Cemex UK Ltd
Active.
Processing plant on original Hatfield Quarry site area.
Inert landfill Extraction and site permission
01-10-2020
Tyttenhanger Quarry
Colney Heath
Tarmac Ltd Active.
Permission in February 2011, for the extraction on land identified as Preferred Area No.3 in the Minerals Local Plan Review 2002-2016.
Inert landfill Extraction and site permission
31-12-2032
Panshanger Quarry
Hertford
Tarmac Ltd Active.
Inert landfill Extraction
31-12-2030
Thorley Hall Farm
David Tinney
Active Agricultural reservoir
06-06-2021
Pynesfield Harleyford Aggregates Ltd
Active Agriculture and Small wetland area
Extraction and restoration
31-12-2018
Permitted but Inactive Extraction Site
Operator Status Restoration Cessation dates
6 East of England Aggregates Working Party Annual Monitoring Report 2014&5, published July 2016

Local Aggregate Assessment 2017 10
Waterhall
Hertford
Waterhall (England) Ltd/Frank Lyons
Inactive extraction.
Only sand and gravel reserves under plant site.
Inert landfill Extraction
21-02-2017.
4.12 In addition there are two sand and gravel quarry sites that are currently in the
restoration phase. These sites are as follows:
o Great Westwood Quarry near Watford (final restoration stage; o Waterhall in Bayfordbury near Hertford (permission for extraction
ceased 21 February 2017. Bunker’s Hill part of the site - inert landfill permission expires 31-12-2017).
Figure 3: Geology of Hertfordshire with permitted sand and gravel sites
Apportionments
4.13 The current annual apportionment for Hertfordshire is 1.39 million tonnes of sand
and gravel.
Local Aggregate Assessment 2017 11
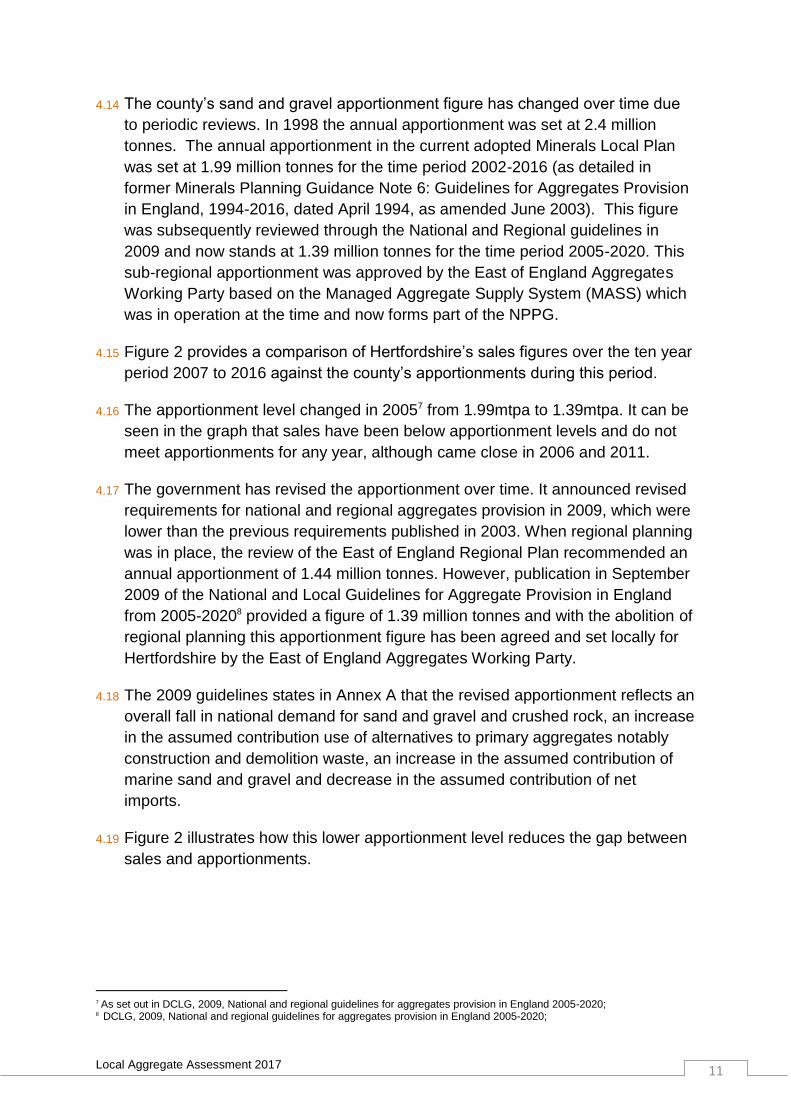
4.14 The county’s sand and gravel apportionment figure has changed over time due
to periodic reviews. In 1998 the annual apportionment was set at 2.4 million
tonnes. The annual apportionment in the current adopted Minerals Local Plan
was set at 1.99 million tonnes for the time period 2002-2016 (as detailed in
former Minerals Planning Guidance Note 6: Guidelines for Aggregates Provision
in England, 1994-2016, dated April 1994, as amended June 2003). This figure
was subsequently reviewed through the National and Regional guidelines in
2009 and now stands at 1.39 million tonnes for the time period 2005-2020. This
sub-regional apportionment was approved by the East of England Aggregates
Working Party based on the Managed Aggregate Supply System (MASS) which
was in operation at the time and now forms part of the NPPG.
4.15 Figure 2 provides a comparison of Hertfordshire’s sales figures over the ten year
period 2007 to 2016 against the county’s apportionments during this period.
4.16 The apportionment level changed in 20057 from 1.99mtpa to 1.39mtpa. It can be
seen in the graph that sales have been below apportionment levels and do not
meet apportionments for any year, although came close in 2006 and 2011.
4.17 The government has revised the apportionment over time. It announced revised
requirements for national and regional aggregates provision in 2009, which were
lower than the previous requirements published in 2003. When regional planning
was in place, the review of the East of England Regional Plan recommended an
annual apportionment of 1.44 million tonnes. However, publication in September
2009 of the National and Local Guidelines for Aggregate Provision in England
from 2005-20208 provided a figure of 1.39 million tonnes and with the abolition of
regional planning this apportionment figure has been agreed and set locally for
Hertfordshire by the East of England Aggregates Working Party.
4.18 The 2009 guidelines states in Annex A that the revised apportionment reflects an
overall fall in national demand for sand and gravel and crushed rock, an increase
in the assumed contribution use of alternatives to primary aggregates notably
construction and demolition waste, an increase in the assumed contribution of
marine sand and gravel and decrease in the assumed contribution of net
imports.
4.19 Figure 2 illustrates how this lower apportionment level reduces the gap between
sales and apportionments.
7 As set out in DCLG, 2009, National and regional guidelines for aggregates provision in England 2005-2020;
8 DCLG, 2009, National and regional guidelines for aggregates provision in England 2005-2020;

Local Aggregate Assessment 2017 12
Local approach to determining apportionment figures
10 year and 3 year sales average
4.20 The NPPF states in paragraph 145 that Mineral Planning Authorities (MPAs)
should prepare an annual LAA ‘based on a rolling average of 10 years sales
data, and other relevant information, and an assessment of all supply options
(including marine dredged, secondary and recycled sources)’. When planning for
a steady and adequate supply of aggregates, such local information includes
geology, environmental issues, local demand and past patterns of supply.
4.21 The government’s aim is to provide a simpler and more transparent approach to
calculating the apportionment than the sub-regional apportionment method that
relies on a complex model incorporating a range of confidential variables.
4.22 The NPPG suggests the use of the 3 year sales average to identify a general
trend in sales and consider increasing supply if this is appropriate. The NPPG
suggests that the rolling 10 year average, 3 year average sales and sub-regional
guidelines should all be had regard to in order to establish a broad view of
planned provision.
4.23 The difference in the agreed apportionment and average sales are as follows:
Table 3: Sales and apportionment
Sales and apportionment Million tonnes per annum
Agreed apportionment 1.39
10 year sales average 1.15 (2007-2016)
3 year sales average 1.20 (2014-2016)
4.24 The NPPG states MPAs can plan for more or less than the figure set out in the
sub-regional guidelines based on their LAA and ‘in those areas where
apportionment of the land-won element has already taken place, those figures
may be used as an indicator as to how much should be planned for’ (NPPG,
paragraph 071).
4.25 There may be advantages of taking into account average sales data over a
period of time which levels out the peaks and troughs of an economic cycle by
accounting for periods of slow (2008-2011) and high (2001-2007) economic
growth. However, the table above shows that if the current ten or three year
sales averages were used to calculate the sand and gravel landbank for
Hertfordshire, this would result in a lower provision being planned for. This figure
will change yearly due to the rolling average of sales data, but at present would
place additional pressure on neighbouring MPAs to meet any shortfall if the
demand for aggregates rises such as increased certainty of a higher level of

Local Aggregate Assessment 2017 13
future growth in the county as Local Planning Authorities set their housing
figures.
Landbank of permitted mineral reserves
4.26 Permitted reserves of sand and gravel in Hertfordshire (i.e. sites with planning
permission to extract) are currently 11,752,000 tonnes (as of the end of 2016)
(see table 1). The annual apportionment for Hertfordshire is 1,390,000 tonnes
based on the DCLG 2009 guidance.
4.27 By using the permitted reserves and dividing this figure by the annual
apportionment figure, this shows the landbank in years. A landbank is defined in
the Minerals Local Plan as ‘a stock of planning permissions for the winning and
working of minerals’.
4.28 The current landbank (as of the end of 2016) for Hertfordshire is 8.5 years. This
is lower than the landbank for the East of England which stands at 9.4 years9
4.29 As a comparison, landbanks for the previous years (all based on 1.39mtpa since
2005) were as follows:
o 9.5 years in 2015. Minimal reserves were approved.
o 10.4 years in 2014. Minimal reserves were approved.
o 11.7 years in 2013. A reassessment of reserves took place and
additional reserves approved.
o 11.4 years in 2012. No additional reserves were approved.
o 12 years in 2011 when additional reserves were approved; o 7.8 years in 2010. The reason for this lower figure is due to the fact that
Rickneys eastern extension was not permitted at this time which is reflected in the subsequent years up until December 2013.
4.30 Sand and gravel permitted reserves that make up the figure to calculate the
landbank are contained in seven sites in Table 2 (Westmill, Hatfield,
Tyttenhanger, Panshanger, Thorley Hall Farm, Pynesfield & Waterhall).
4.31 Table 3 shows the most up-to-date landbank calculations based on the reserves
and showing the difference when sales figures are used compared with the
apportionment figure.
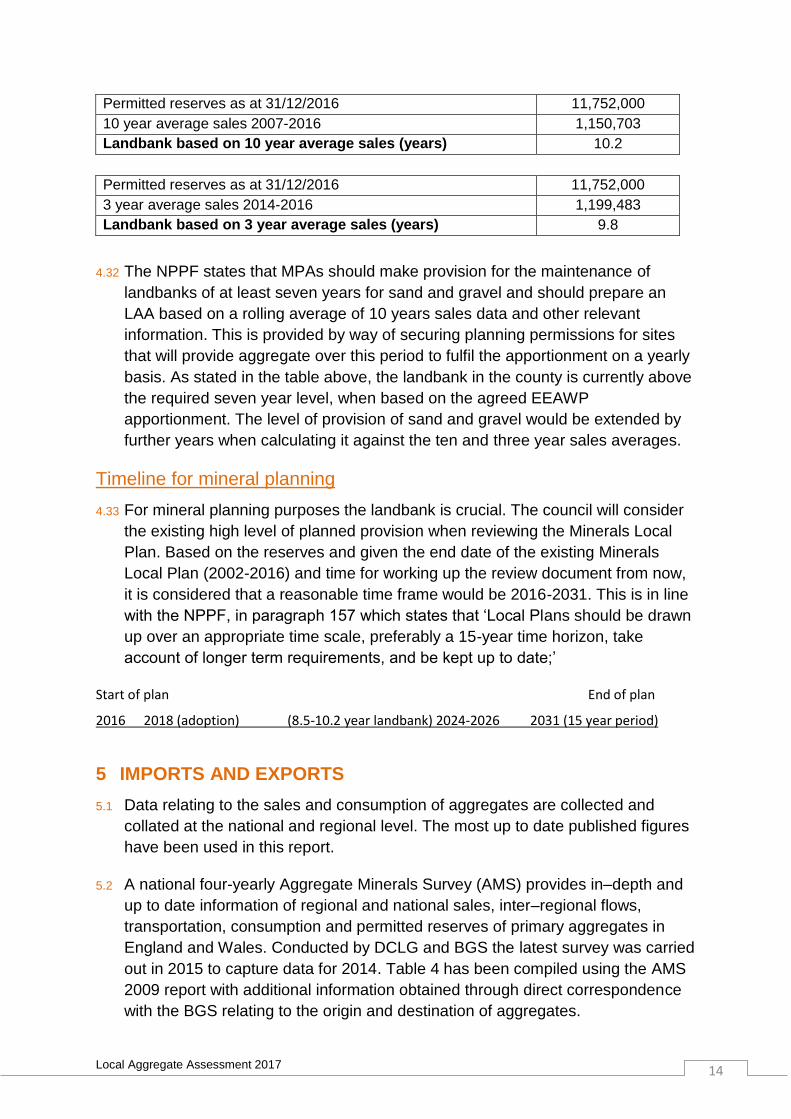
Table 4: Landbanks for sand and gravel in Hertfordshire in 2016
Permitted reserves as at 31/12/2016 11,752,000
East of England AWP apportionment for Herts 2005-2020 1,390,000
Landbank based on EEAWP apportionment (years) 8.5
9 East of England Aggregates Monitoring Report 2014&2015, published July 2016.
Local Aggregate Assessment 2017 14
Permitted reserves as at 31/12/2016 11,752,000
10 year average sales 2007-2016 1,150,703
Landbank based on 10 year average sales (years) 10.2
Permitted reserves as at 31/12/2016 11,752,000
3 year average sales 2014-2016 1,199,483
Landbank based on 3 year average sales (years) 9.8
4.32 The NPPF states that MPAs should make provision for the maintenance of
landbanks of at least seven years for sand and gravel and should prepare an
LAA based on a rolling average of 10 years sales data and other relevant
information. This is provided by way of securing planning permissions for sites
that will provide aggregate over this period to fulfil the apportionment on a yearly
basis. As stated in the table above, the landbank in the county is currently above
the required seven year level, when based on the agreed EEAWP
apportionment. The level of provision of sand and gravel would be extended by
further years when calculating it against the ten and three year sales averages.
Timeline for mineral planning
4.33 For mineral planning purposes the landbank is crucial. The council will consider
the existing high level of planned provision when reviewing the Minerals Local
Plan. Based on the reserves and given the end date of the existing Minerals
Local Plan (2002-2016) and time for working up the review document from now,
it is considered that a reasonable time frame would be 2016-2031. This is in line
with the NPPF, in paragraph 157 which states that ‘Local Plans should be drawn
up over an appropriate time scale, preferably a 15-year time horizon, take
account of longer term requirements, and be kept up to date;’
Start of plan End of plan
2016 2018 (adoption) (8.5-10.2 year landbank) 2024-2026 2031 (15 year period)
5 IMPORTS AND EXPORTS
5.1 Data relating to the sales and consumption of aggregates are collected and
collated at the national and regional level. The most up to date published figures
have been used in this report.
5.2 A national four-yearly Aggregate Minerals Survey (AMS) provides in–depth and
up to date information of regional and national sales, inter–regional flows,
transportation, consumption and permitted reserves of primary aggregates in
England and Wales. Conducted by DCLG and BGS the latest survey was carried
out in 2015 to capture data for 2014. Table 4 has been compiled using the AMS
2009 report with additional information obtained through direct correspondence
with the BGS relating to the origin and destination of aggregates.

Local Aggregate Assessment 2017 15
Table 5: Hertfordshire's primary aggregates imports and exports (2009)
Mineral Import
amount
(tonnes) 10
Consumption
(tonnes)11
Export
(tonnes)12
Balance
(imports-
exports)
(tonnes)
Land won sand and
gravel
163,000 1,053,000 317,000 - 154,000
Marine sand and
gravel
1,000 1,000 0 + 1,000
Total sand and
gravel
164,000 1,054,000 317,000 - 153,000
Crushed rock 413,000 413,000 0 + 413,000
Total aggregates 577,000 1,467,000 317,000 + 260,000
Note: In balance column, a ‘-‘ prefix indicates a net export, and a ‘+’ prefix indicates a net import.
5.3 The results of the Aggregate Minerals Survey in 2009 showed that movements
of sand and gravel into and out of Hertfordshire are not self-balancing (Table 5).
Overall, Hertfordshire is a net exporter of sand and gravel, although there is a
small amount of marine sand and gravel imported. Hertfordshire relies on
imports of crushed rock, as this is not found in the county.
Imports – Sand and Gravel
5.4 Of the land won sand and gravel consumed in Hertfordshire (1,126,000 tonnes)
as reported in the AMS 2014:
o 60-70%% came from within Hertfordshire; o 10-20% came from Essex; o 1-10% came from Bedford Borough, o Cambridgeshire, Central Bedfordshire & Suffolk (within the East of
England) and Windsor & Maidenhead District and Great London East (outside of East of England);
o <1% came from Wiltshire, Hampshire, Oxfordshire, Leicestershire, Northamptonshire & Staffordshire.13
Imports – Marine sources
5.5 Of the 19,000 tonnes of marine sand and gravel consumed in Hertfordshire as
reported in the AMS 2014 (Table 11):
o 10-20% was supplied via Kent; o 70-80% was supplied via Greater London – East; & o <1% was supplied via Hampshire. 14
10
DCLG & BGS, 20014, Collation of the results of the 20014 aggregate minerals survey for England and Wales 11
DCLG & BGS, 20014, Collation of the results of the 20014 aggregate minerals survey for England and Wales 12
Table 9d (calculation of land won sand and gravel to the East of England plus elsewhere) DCLG & BGS, 2009, Collation of
the results of the 2009 aggregate minerals survey for England and Wales 13 Information supplied directly by BGS – AMS2014 source of primary aggregates by sub-region as percent categories
Local Aggregate Assessment 2017 16
5.6 In summary, of the imports of sand and gravel into Hertfordshire, approximately
9-29% came from within the East of England area and 71-91% from outside the
East of England area. 15
Imports – Crushed Rock
5.7 Of the total crushed rock consumed in Hertfordshire (591,000 tonnes) as
reported in the AMS 2014 (Table 11):
o 80-90% came from Leicestershire; o 10-20% came from Somerset; o 1-10% came from Cambridgeshire, Shropshire and Powys; o <1% came from outside England & Wales, Gloucestershire, Doncaster,
Yorkshire Dales and Neath Port Talbot; 5.8 In summary, of the imports of crushed rock, only 1-10% came from the East of
England area. 16
Exports – Sand and Gravel
5.9 Of the total land won sand and gravel sales from quarries in Hertfordshire
(1,209,532 tonnes) for which year there is a breakdown of sales destinations as
reported in the AMS 2014: 17
5.10 57% was within Hertfordshire (692,000 tonnes), 22% was to the rest of the East
of England (265,000 tonnes) and 21% was to other destinations (252,000
tonnes).
From a national perspective the UK Minerals Yearbook 201518 reports the following:
5.11 In GB there were:
o 56 million tonnes of sand and gravel consumed; (2014)19 and o 99 million tonnes of crushed rock consumed (2014); o 535 sand and gravel workings in the UK (as at March 2016); 20
5.12 Of the aggregates produced in the UK in 201421:
o 46.8million tonnes was land-won sand and gravel; o 14.3 million tonnes was marine dredged sand and gravel; o 110.3 million tonnes was crushed rock; and o 6.8 million tonnes was clay and shale (for bricks22).
14 Information supplied directly by BGS – AMS2014 source of primary aggregates by sub-region as percent categories 15 Information supplied directly by BGS - AMS2014 source of primary aggregates by sub-region as percent categories 16 Information supplied directly by BGS - AMS2014 source of primary aggregates by sub-region as percent categories 17
Table 9d, AM2014 Survey 18 Page 22, BGS, 2015, United Kingdom Minerals Yearbook 2015, Minerals and Waste Programme Open Report OR/16/021 19
Page 15, BGS, 2015, United Kingdom Minerals Yearbook 2015, Minerals and Waste Programme Open Report OR/16/021 20
Page 18 of BGS, 2015, United Kingdom Minerals Yearbook 2015, Minerals and Waste Programme Open Report OR/16/021 21 Page BGS, 2015, United Kingdom Minerals Yearbook 2015, Minerals and Waste Programme Open Report OR/16/021 22
Page 23 BGS, 2015, United Kingdom Minerals Yearbook 2015, Minerals and Waste Programme Open Report OR/16/021

Local Aggregate Assessment 2017 17
Total imports of sand and gravel and crushed rock into the UK in 2012 were 39.2 million tonnes and total exports from the UK were 68.2 million tonnes23
The Annual Minerals Raised Inquiry (AMRI) 2014 reports the following:
o A total of 4.7 million tonnes was extracted in Great Britain24. There are no figures reported for clay extracted and sold for Hertfordshire.
o The UK had a rise in total clay sales from 6,464 to 6,806 thousand tonnes 2013-2014;
o The UK had a rise in sales from 3,528 thousand tonnes 2012- 2013 to 3,312 thousand tonnes 2013-2014. There are no figures reported for chalk extracted and sold for Hertfordshire.25
o Hertfordshire is listed as one of only 13 areas in Great Britain that produce chalk.
o UK total sales of sand and gravel rose from 51,925 in 2012-2013 to 56,129 thousand tonnes.26
From the East of England area perspective the Area’s Annual Monitoring Report 2014
reports the following:
o Hertfordshire contributed 10% of sand and gravel sales in the East of England in 2014 and 11% in 2015; 27
o Cambridgeshire & Peterborough and Bedford, Central Bedfordshire & Luton have a higher landbank of sand and gravel than Hertfordshire in the East of England; 28
o The East of England landbank (average over all authorities) stands at 9.5 years using the sub-regional apportionment figure derived from the National and regional Guidelines 2005-2020.; 29
o Cambridgeshire & Peterborough and Norfolk are the only authorities in the East of England that extract rock and propose to maintain current extraction rates;30
o Although likely to be under-representations, in 2015 the EEAWP area imported over 2.2 million tonnes of aggregate (sand and gravel and crushed rock) from outside the area by rail depots and wharfs. In comparison exports of aggregates from the area by rail were over 100,000 tonnes. 31
Sales and Construction 23 Page 19 of BGS, 2014, United Kingdom Minerals Yearbook 2013, Minerals and Waste Programme Open Report OR/14/036 22 Table 8, DCLG & ONS, March 2016, Annual Mineral Raised Inquiry (AMRI) ‘Mineral extraction in Great Britain 2014’, Business Monitor PA1007 25
Table 9, DCLG & ONS, March 2016, Annual Mineral Raised Inquiry (AMRI) ‘ mineral extraction in Great Britain 2014,’ Business Monitor PA1007 26
Table 2, DCLG & ONS, March 2016, Annual Mineral Raised Inquiry (AMRI) ‘Mineral extraction in Great Britain 2014’,
Business Monitor PA1007 27
Figure 2 of East of England Aggregates Working Party, Annual Monitoring Report 2014-2015 28
Table 3, East of England Aggregates Working Party, Annual Monitoring Report 2014-2015 29 Table 3, East of England Aggregates Working Party, Annual Monitoring Report 2014-2015 30
Table 1, East of England Aggregates Working Party, Annual Monitoring Report 2014-2015 31
Page14, East of England Aggregates Working Party, Annual Monitoring Report 2014-2015
Local Aggregate Assessment 2017 18
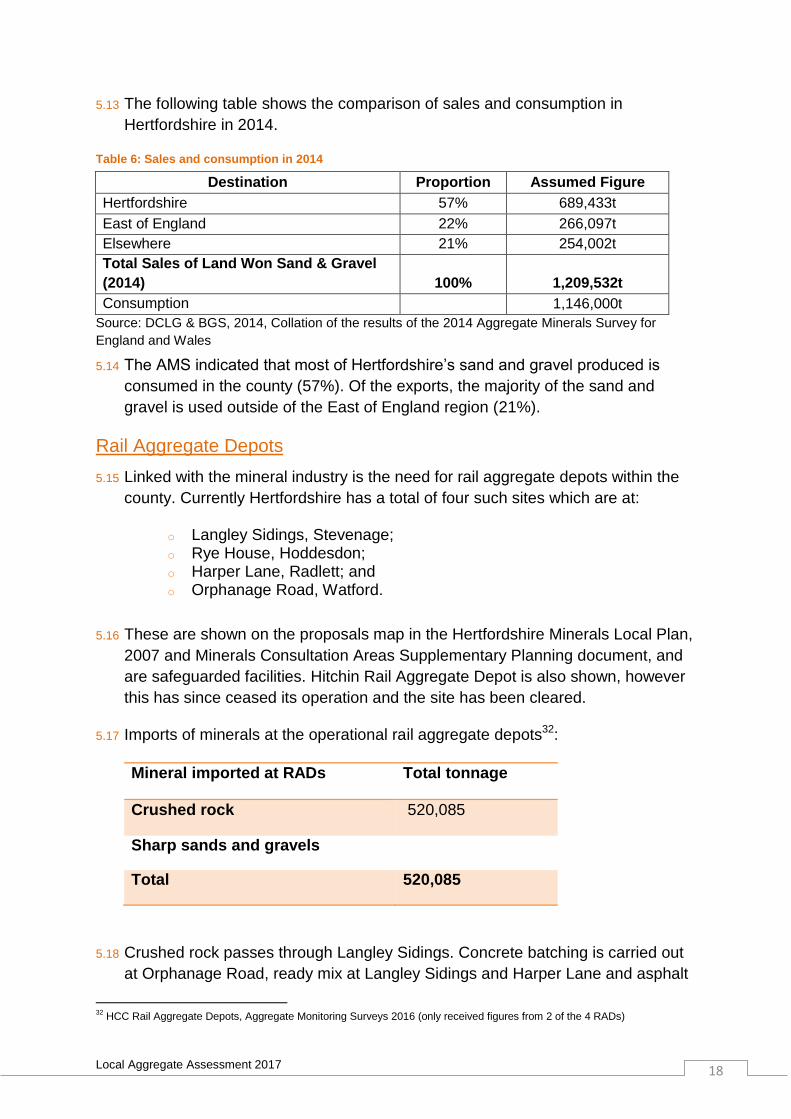
5.13 The following table shows the comparison of sales and consumption in
Hertfordshire in 2014.
Table 6: Sales and consumption in 2014
Destination Proportion Assumed Figure
Hertfordshire 57% 689,433t
East of England 22% 266,097t
Elsewhere 21% 254,002t
Total Sales of Land Won Sand & Gravel
(2014)
100% 1,209,532t
Consumption 1,146,000t
Source: DCLG & BGS, 2014, Collation of the results of the 2014 Aggregate Minerals Survey for
England and Wales
5.14 The AMS indicated that most of Hertfordshire’s sand and gravel produced is
consumed in the county (57%). Of the exports, the majority of the sand and
gravel is used outside of the East of England region (21%).
Rail Aggregate Depots
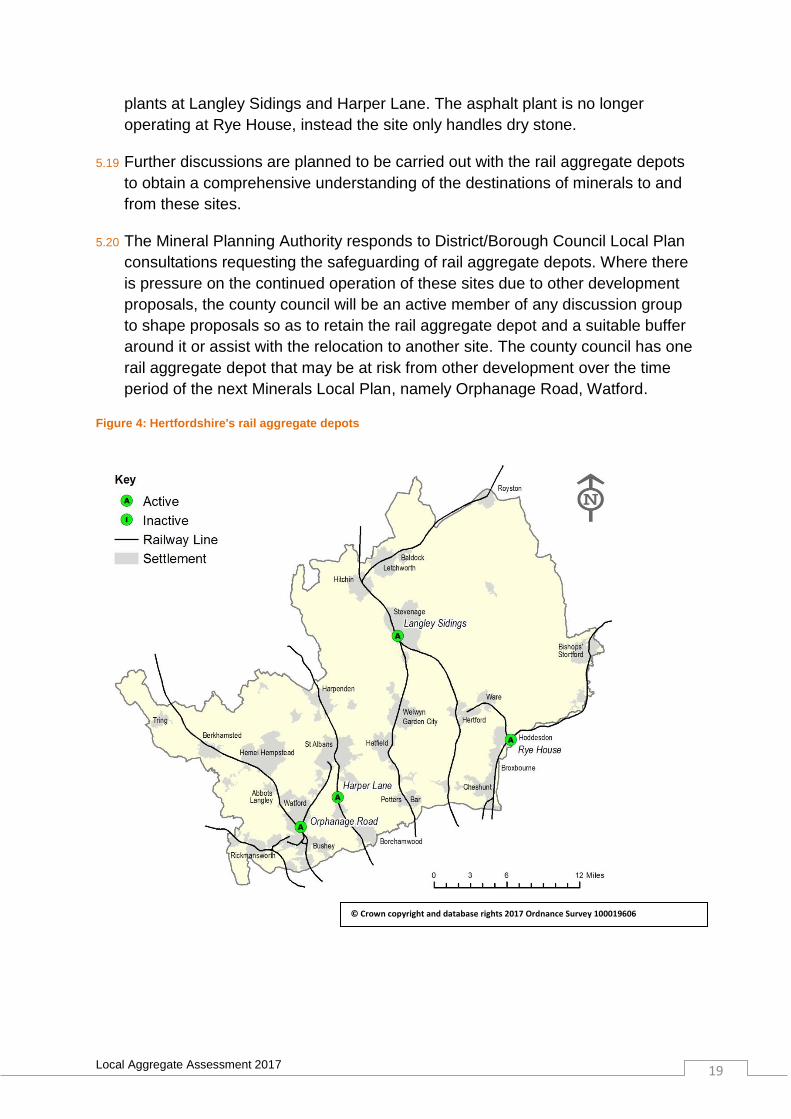
5.15 Linked with the mineral industry is the need for rail aggregate depots within the
county. Currently Hertfordshire has a total of four such sites which are at:
o Langley Sidings, Stevenage; o Rye House, Hoddesdon; o Harper Lane, Radlett; and o Orphanage Road, Watford.
5.16 These are shown on the proposals map in the Hertfordshire Minerals Local Plan,
2007 and Minerals Consultation Areas Supplementary Planning document, and
are safeguarded facilities. Hitchin Rail Aggregate Depot is also shown, however
this has since ceased its operation and the site has been cleared.
5.17 Imports of minerals at the operational rail aggregate depots32:
Mineral imported at RADs Total tonnage
Crushed rock 520,085
Sharp sands and gravels
Total 520,085
5.18 Crushed rock passes through Langley Sidings. Concrete batching is carried out
at Orphanage Road, ready mix at Langley Sidings and Harper Lane and asphalt
32
HCC Rail Aggregate Depots, Aggregate Monitoring Surveys 2016 (only received figures from 2 of the 4 RADs)
Local Aggregate Assessment 2017 19
plants at Langley Sidings and Harper Lane. The asphalt plant is no longer
operating at Rye House, instead the site only handles dry stone.
5.19 Further discussions are planned to be carried out with the rail aggregate depots
to obtain a comprehensive understanding of the destinations of minerals to and
from these sites.
5.20 The Mineral Planning Authority responds to District/Borough Council Local Plan
consultations requesting the safeguarding of rail aggregate depots. Where there
is pressure on the continued operation of these sites due to other development
proposals, the county council will be an active member of any discussion group
to shape proposals so as to retain the rail aggregate depot and a suitable buffer
around it or assist with the relocation to another site. The county council has one
rail aggregate depot that may be at risk from other development over the time
period of the next Minerals Local Plan, namely Orphanage Road, Watford.
Figure 4: Hertfordshire's rail aggregate depots
© Crown copyright and database rights 2017 Ordnance Survey 100019606

Local Aggregate Assessment 2017 20
Brick Clay
5.21 Hertfordshire has one site which excavates brick clay for the use on-site in the
production of specialist bricks. The current planning permission at the site runs
until 31 September 2035 for extraction.
5.22 There is no apportionment for clay provision; however the NPPF requires that a
stock of permitted reserves of at least 25 years for brick clay is required. The
adopted Minerals Local Plan did not require a landbank of brick clay. The review
of the Minerals Local Plan therefore needs to address this issue. This will be
planned for in the review of the Minerals Local Plan and could be shown as a
Mineral Safeguarded Area(s).
5.23 Reserves at the site are unpredictable due to the nature of the deposit. In
accordance with the current planning permission, there are permitted reserves at
the site for 18 years. However the site is not operating as it has been in previous
years. If there is no potential for further clay extraction in Hertfordshire,
Hertfordshire will need to co-operate with neighbouring authorities to plan for the
maintenance of brick clay over the next 25 years.
5.24 The existing policies in the adopted Minerals Local Plan 2002-2016 can be relied
upon by decision makers to determine any planning applications that may come
forward until the Minerals Local Plan is reviewed. The NPPF is a material
planning consideration and therefore would need to be taken into account.
Therefore reference to the NPPF may be necessary should any issues relating
to clay come forward before the review of the Minerals Local Plan.
Chalk
5.25 Chalk is extracted in Hertfordshire for use as an agricultural lime on farms to
improve soil quality and is therefore classed as an industrial mineral rather than
an aggregate used in construction (e.g. for use in cement).Hertfordshire does not
have a working cement plant and therefore it is not necessary to plan for a
separate landbank for this resource.
5.26 The Annual Minerals Raised Inquiry Survey 2014 states that there were sales of
30 thousand tonnes of chalk in Hertfordshire for agricultural uses33. For
information purposes and the monitoring of sites the table below provides further
information on these sites with permitted reserves:-
33
Table 9, DCLG, 2014, Annual Minerals Raised Inquiry Survey ‘Minerals extraction in Great Britain 2012, Business Monitor PA1007’
Local Aggregate Assessment 2017 21
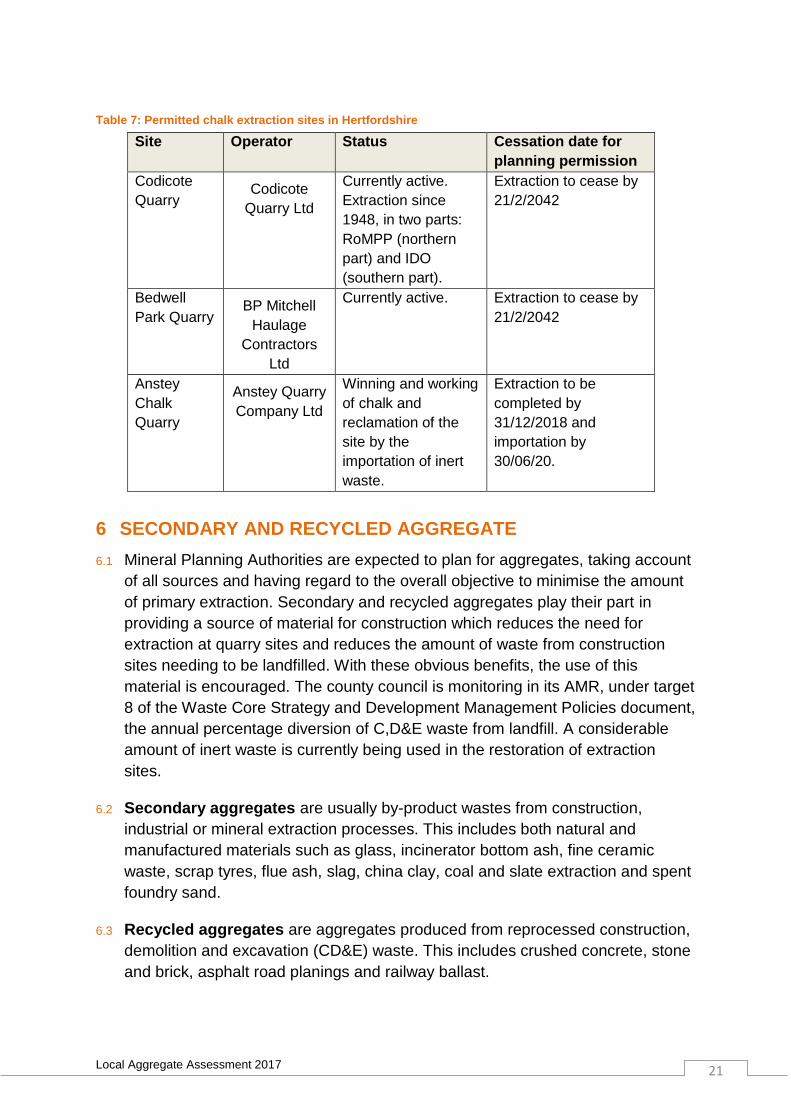
Table 7: Permitted chalk extraction sites in Hertfordshire
Site Operator Status Cessation date for
planning permission
Codicote
Quarry Codicote
Quarry Ltd
Currently active.
Extraction since
1948, in two parts:
RoMPP (northern
part) and IDO
(southern part).
Extraction to cease by
21/2/2042
Bedwell
Park Quarry BP Mitchell
Haulage
Contractors
Ltd
Currently active. Extraction to cease by
21/2/2042
Anstey
Chalk
Quarry
Anstey Quarry
Company Ltd
Winning and working
of chalk and
reclamation of the
site by the
importation of inert
waste.
Extraction to be
completed by
31/12/2018 and
importation by
30/06/20.
6 SECONDARY AND RECYCLED AGGREGATE
6.1 Mineral Planning Authorities are expected to plan for aggregates, taking account
of all sources and having regard to the overall objective to minimise the amount
of primary extraction. Secondary and recycled aggregates play their part in
providing a source of material for construction which reduces the need for
extraction at quarry sites and reduces the amount of waste from construction
sites needing to be landfilled. With these obvious benefits, the use of this
material is encouraged. The county council is monitoring in its AMR, under target
8 of the Waste Core Strategy and Development Management Policies document,
the annual percentage diversion of C,D&E waste from landfill. A considerable
amount of inert waste is currently being used in the restoration of extraction
sites.
6.2 Secondary aggregates are usually by-product wastes from construction,
industrial or mineral extraction processes. This includes both natural and
manufactured materials such as glass, incinerator bottom ash, fine ceramic
waste, scrap tyres, flue ash, slag, china clay, coal and slate extraction and spent
foundry sand.
6.3 Recycled aggregates are aggregates produced from reprocessed construction,
demolition and excavation (CD&E) waste. This includes crushed concrete, stone
and brick, asphalt road planings and railway ballast.

Local Aggregate Assessment 2017 22
6.4 The processing of aggregate occurs both on construction sites for reuse on the
same site or off site for use in other construction works.
Inert Waste Management in Hertfordshire
6.5 The data available on recovered material that can be sold as recycled and
particularly secondary aggregate is variable and not considered completely
reliable. The county council receives limited data provided by site operators in
the annual surveys relating to aggregate recovery. In 2016 there was 234,783
tonnes of secondary and recycled aggregate produced in Hertfordshire. 34 A
reduction in operations has been noticeable in this years’ figures.
Table 8: Total recycled and secondary aggregate processed over the last 10 years
Year Recycled and Secondary Aggregate Processing (tonnes)35
2007 267,210
2008 229,769
2009 258,427
2010 346,560
2011 303,869
2012 316,941
2013 329,457
2014 362,203
2015 317,314
2016 234,783
6.6 According to the Environment Agency’s Waste Data Interrogator, figures of inert
C,D & E waste treated in the county may be different to the figures received from
operator returns. The Environment Agency’s figure does not include figures at
waste transfer stations that bulk up and transfer aggregate on to recycling
facilities for processing. 36
34
Hertfordshire County Council annual waste survey 2016 provided by operators, and average figures from previous years where actual data was not obtained, 35
Please note there may be a difference in the figures available from difference sources, including HCC operator data,
Environment Agency data and other studies. 36 HCC, 2013, Authority Monitoring Report
Local Aggregate Assessment 2017 23
6.7 At the sub-regional level, the most recent study on secondary and recycled
aggregate arisings was undertaken in 2005 by a contractor on behalf of DCLG.
The figures for Hertfordshire featured in the report as a combined figure with
Bedfordshire to show that these two authorities produced a combined 1,269,259
tonnes of recycled aggregates. 37
6.8 The adopted Waste Core Strategy and Development Management Policies
document concludes that there is sufficient permitted capacity within the county
for the disposal and treatment of this waste stream. 38
Secondary and Recycled Aggregate Sources
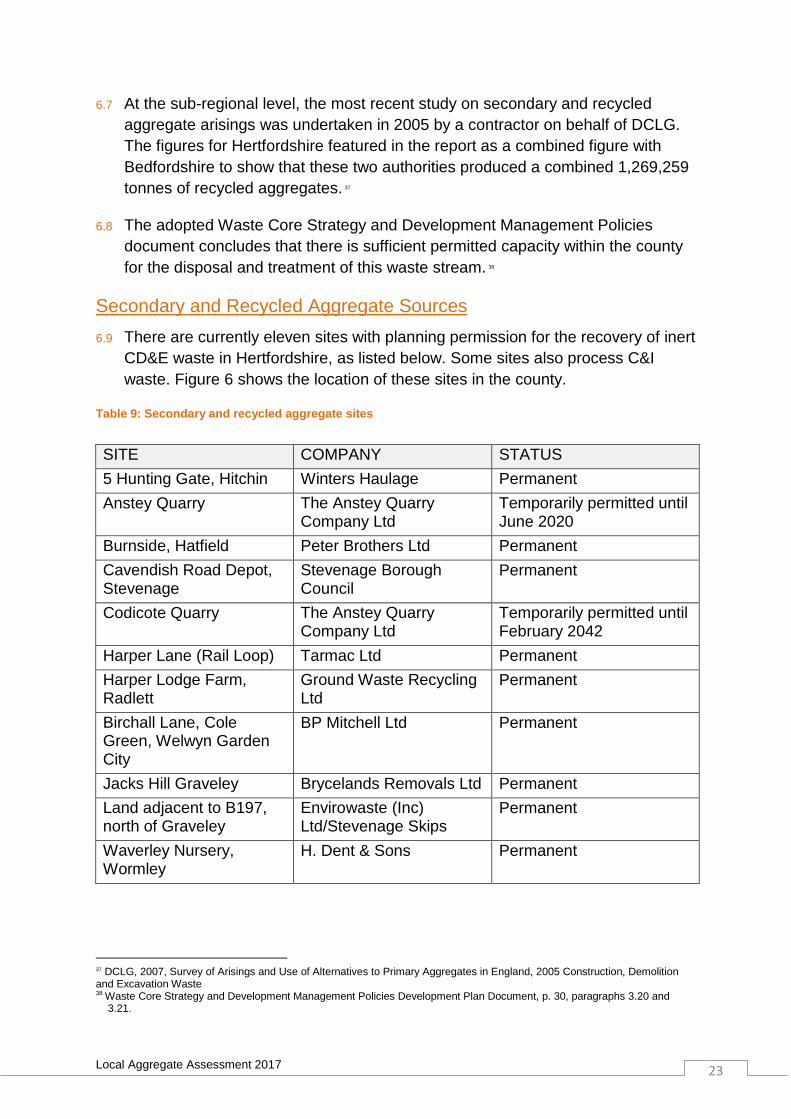
6.9 There are currently eleven sites with planning permission for the recovery of inert
CD&E waste in Hertfordshire, as listed below. Some sites also process C&I
waste. Figure 6 shows the location of these sites in the county.
Table 9: Secondary and recycled aggregate sites
SITE COMPANY STATUS
5 Hunting Gate, Hitchin Winters Haulage Permanent
Anstey Quarry The Anstey Quarry Company Ltd
Temporarily permitted until June 2020
Burnside, Hatfield Peter Brothers Ltd Permanent
Cavendish Road Depot, Stevenage
Stevenage Borough Council
Permanent
Codicote Quarry The Anstey Quarry Company Ltd
Temporarily permitted until February 2042
Harper Lane (Rail Loop) Tarmac Ltd Permanent
Harper Lodge Farm, Radlett
Ground Waste Recycling Ltd
Permanent
Birchall Lane, Cole Green, Welwyn Garden City
BP Mitchell Ltd Permanent
Jacks Hill Graveley Brycelands Removals Ltd Permanent
Land adjacent to B197, north of Graveley
Envirowaste (Inc) Ltd/Stevenage Skips
Permanent
Waverley Nursery, Wormley
H. Dent & Sons Permanent
37 DCLG, 2007, Survey of Arisings and Use of Alternatives to Primary Aggregates in England, 2005 Construction, Demolition and Excavation Waste 38
Waste Core Strategy and Development Management Policies Development Plan Document, p. 30, paragraphs 3.20 and 3.21.

Local Aggregate Assessment 2017 24
Figure 5: Location of permitted sites in Hertfordshire for the production of recycled/secondary aggregates
Expected Contribution to Supply
6.10 In terms of relying on secondary and recycled aggregate and thereby reducing
the need for extracting land won sand and gravel to meet the demand in
Hertfordshire, precise data on this supply option needs to be available to factor
this into mineral planning. This is not always available. The county council
surveyed operators of known recycled and secondary aggregate sites and
figures have been provided.
6.11 In addition, there is the use of some inert material that is reprocessed on
demolition sites and used in their redevelopment as groundworks and basic
engineering fill. Whilst this is potentially a lower grade aggregate, its use can
also offset the need for primary won extraction of sand and gravel. Again, the
difficulty is obtaining reliable data to quantify how much of this material can be
relied upon.
6.12 Issues with data availability and reliability for secondary and recycled aggregates
does not allow for a firm figure for local supply of this source of aggregate in
© Crown copyright and database rights 2017 Ordnance Survey 100019606

Local Aggregate Assessment 2017 25
Hertfordshire. It is considered reasonable to assume that as the economy
recovers out of recession, volumes of secondary and recycled aggregates
similar to those of recent years will continue to be available in the county. As
such there should not be any significant effect on the demand for newly
extracted land won sand and gravel.
6.13 In a similar way, a small amount of marine dredged sand and gravel as detailed
in table 4 and paragraph 5.5 is imported for use in the county. It is considered
reasonable to assume that this supply of sand and gravel will continue to be
used in the county at a similar volume in future years and therefore there should
not be a significant effect on the amount of newly extracted sand and gravel
required. As stated in table 4 and paragraph 5.7, hard rock is supplied from other
counties as Hertfordshire does not have any of this resource. As the economy
grows it is assumed that as this aggregate is already within the supply chain it is
considered reasonable to assume that the proportions of market demand
currently being met from these sources will continue to be met.
7 FUTURE AGGREGATES SUPPLY AND DEMAND
Supply
7.1 As shown in the calculations of sand and gravel landbanks in table 4, using the
EEAWP sub-regional apportionment of 1.39mtpa (8.5 years), the 10 year rolling
average sales (10.2 years) or the 3 year average sales figures (9.8 years), the
county does not have sufficient permitted reserves to fulfil the requirement for a
15 year Minerals Local Plan period, nor the additional planning for 7 years at the
end of the plan period which equates to needing aggregate for a 22 year period.
As such the county council will seek to address this by allocating sufficient land
for extraction in the review of the Minerals Local Plan.
7.2 The County Council has permitted two sand and gravel planning applications,
subject to S106 agreements, at committee on 25 January 2017 and 22 March
2017 (Land at Hatfield Aerodrome and Furzefield, Hatfield Quarry). However, as
the S106 agreements require signing, decision notices have not been issued for
these applications to date. In total these sites could provide 8.45 million tonnes.
7.3 A comparison of the sub-regional apportionment with the shortfall is shown
below:
Local Aggregate Assessment 2017 26
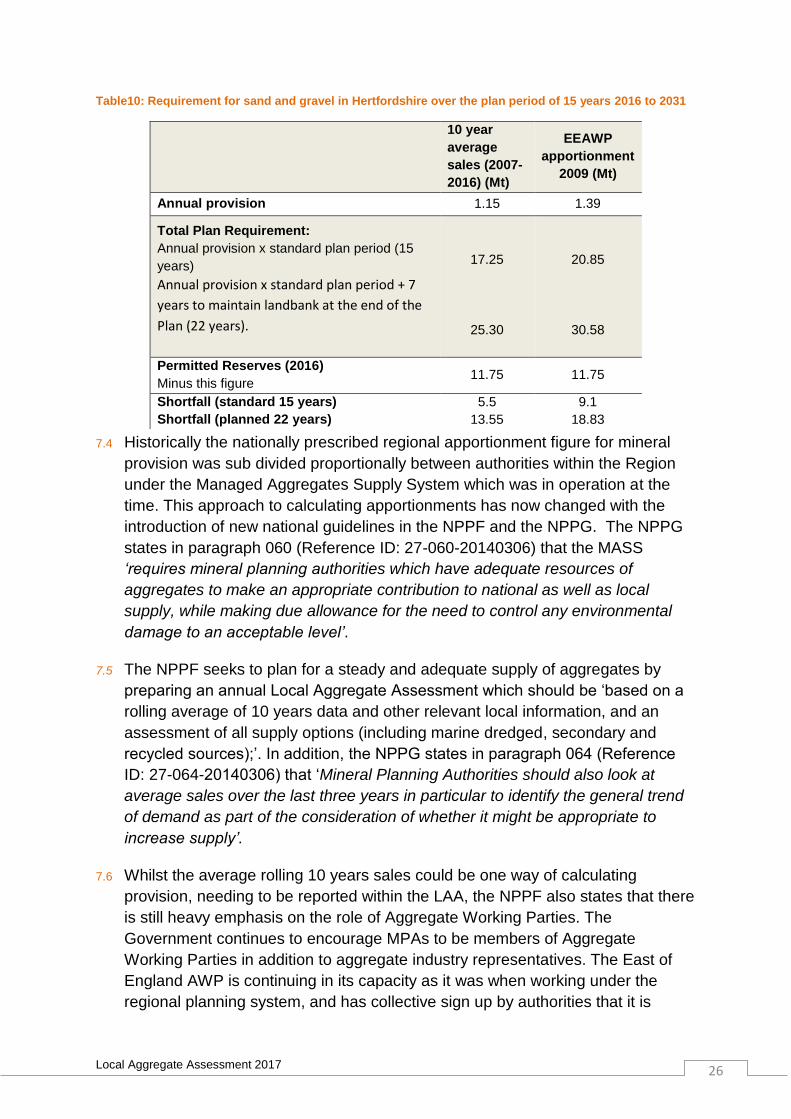
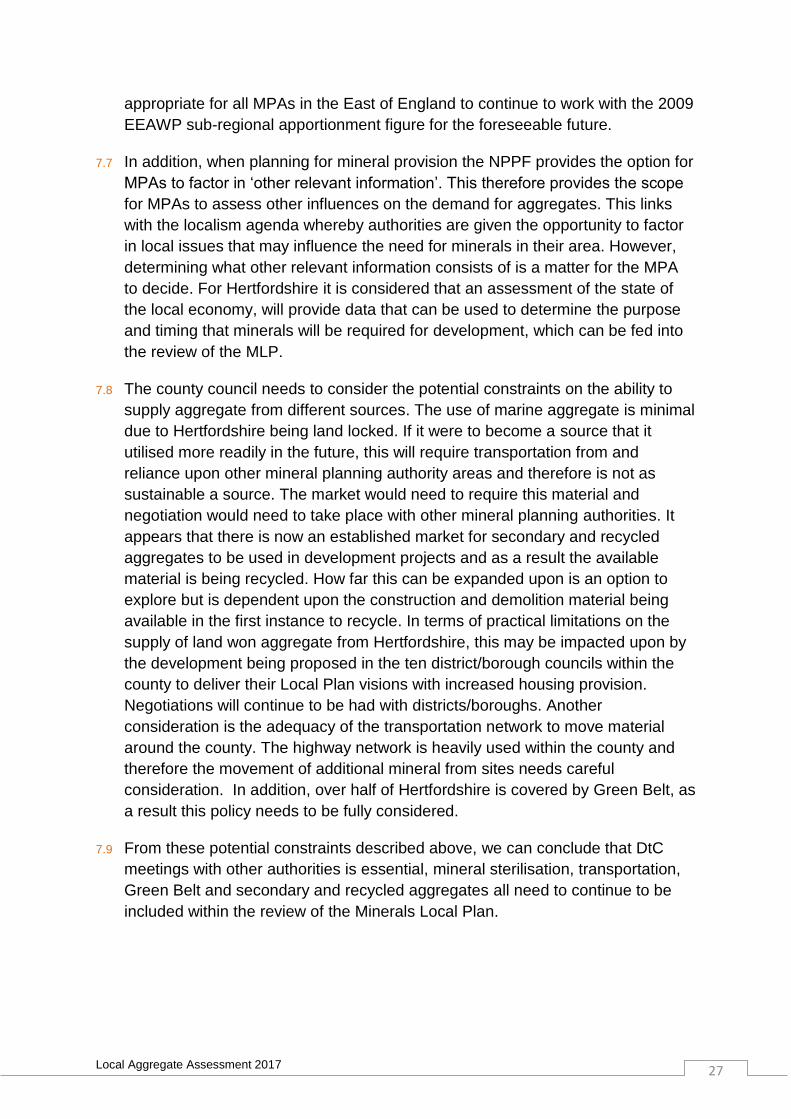
Table10: Requirement for sand and gravel in Hertfordshire over the plan period of 15 years 2016 to 2031
7.4 Historically the nationally prescribed regional apportionment figure for mineral
provision was sub divided proportionally between authorities within the Region
under the Managed Aggregates Supply System which was in operation at the
time. This approach to calculating apportionments has now changed with the
introduction of new national guidelines in the NPPF and the NPPG. The NPPG
states in paragraph 060 (Reference ID: 27-060-20140306) that the MASS
‘requires mineral planning authorities which have adequate resources of
aggregates to make an appropriate contribution to national as well as local
supply, while making due allowance for the need to control any environmental
damage to an acceptable level’.
7.5 The NPPF seeks to plan for a steady and adequate supply of aggregates by
preparing an annual Local Aggregate Assessment which should be ‘based on a
rolling average of 10 years data and other relevant local information, and an
assessment of all supply options (including marine dredged, secondary and
recycled sources);’. In addition, the NPPG states in paragraph 064 (Reference
ID: 27-064-20140306) that ‘Mineral Planning Authorities should also look at
average sales over the last three years in particular to identify the general trend
of demand as part of the consideration of whether it might be appropriate to
increase supply’.
7.6 Whilst the average rolling 10 years sales could be one way of calculating
provision, needing to be reported within the LAA, the NPPF also states that there
is still heavy emphasis on the role of Aggregate Working Parties. The
Government continues to encourage MPAs to be members of Aggregate
Working Parties in addition to aggregate industry representatives. The East of
England AWP is continuing in its capacity as it was when working under the
regional planning system, and has collective sign up by authorities that it is
10 year
average
sales (2007-
2016) (Mt)
EEAWP
apportionment
2009 (Mt)
Annual provision 1.15 1.39
Total Plan Requirement:
Annual provision x standard plan period (15
years)
Annual provision x standard plan period + 7
years to maintain landbank at the end of the
Plan (22 years).
17.25
25.30
20.85
30.58
Permitted Reserves (2016)
Minus this figure 11.75 11.75
Shortfall (standard 15 years)
Shortfall (planned 22 years)
5.5
13.55
9.1
18.83
Local Aggregate Assessment 2017 27
appropriate for all MPAs in the East of England to continue to work with the 2009
EEAWP sub-regional apportionment figure for the foreseeable future.
7.7 In addition, when planning for mineral provision the NPPF provides the option for
MPAs to factor in ‘other relevant information’. This therefore provides the scope
for MPAs to assess other influences on the demand for aggregates. This links
with the localism agenda whereby authorities are given the opportunity to factor
in local issues that may influence the need for minerals in their area. However,
determining what other relevant information consists of is a matter for the MPA
to decide. For Hertfordshire it is considered that an assessment of the state of
the local economy, will provide data that can be used to determine the purpose
and timing that minerals will be required for development, which can be fed into
the review of the MLP.
7.8 The county council needs to consider the potential constraints on the ability to
supply aggregate from different sources. The use of marine aggregate is minimal
due to Hertfordshire being land locked. If it were to become a source that it
utilised more readily in the future, this will require transportation from and
reliance upon other mineral planning authority areas and therefore is not as
sustainable a source. The market would need to require this material and
negotiation would need to take place with other mineral planning authorities. It
appears that there is now an established market for secondary and recycled
aggregates to be used in development projects and as a result the available
material is being recycled. How far this can be expanded upon is an option to
explore but is dependent upon the construction and demolition material being
available in the first instance to recycle. In terms of practical limitations on the
supply of land won aggregate from Hertfordshire, this may be impacted upon by
the development being proposed in the ten district/borough councils within the
county to deliver their Local Plan visions with increased housing provision.
Negotiations will continue to be had with districts/boroughs. Another
consideration is the adequacy of the transportation network to move material
around the county. The highway network is heavily used within the county and
therefore the movement of additional mineral from sites needs careful
consideration. In addition, over half of Hertfordshire is covered by Green Belt, as
a result this policy needs to be fully considered.
7.9 From these potential constraints described above, we can conclude that DtC
meetings with other authorities is essential, mineral sterilisation, transportation,
Green Belt and secondary and recycled aggregates all need to continue to be
included within the review of the Minerals Local Plan.

Local Aggregate Assessment 2017 28
Potential Future Supply from Preferred Areas
7.10 The adopted Minerals Local Plan 2002-2016, adopted in 2007 contains 3
Preferred Areas:
o PA1 – BAE o PA2 – Rickneys; & o PA3 – Coursers Road (Tyttenhanger)
7.11 Of these sites, all three of them have come forward for extraction. Extraction of
sand and gravel was permitted at Coursers Road, Tyttenhanger and is currently
taking place. The figures for reserves are included within Table 1 above.
Planning permission has lapsed for extraction of sand and gravel at Rickneys.
The site had been mothballed and the operator is not currently extracting from
this site. There is no plant and machinery at the site. A planning application was
refused on Land at Ware Park which covers the southern part of Preferred Area
2 adjacent to Rickneys quarry. Applications at BAE, Hatfield and Furzefield,
Hatfield have been permitted at committee, subject to the signing of S106 legal
agreements. Consequently decision notices have not been issued to date. The
figure for the sites with outstanding S106 agreements is not included in table 1.
7.12 As stated within the adopted Minerals Local Plan, estimated resources at BAE
Preferred Area 1 is 8 million tonnes of sand and gravel and the remainder of the
Preferred Area 2 site which is 5-6 million tonnes as stated within the Minerals
Local Plan. Therefore should there be a supply of mineral from these sites in the
future it could assist with meeting the sand and gravel requirements to be
planned for in the county. The unworked Preferred Area sites will be considered
alongside the site selection criteria within the site selection methodology for the
review of the Minerals Local Plan which is taking place.
Demand
7.13 District and borough councils in Hertfordshire will plan for objectively assessed
needs. Development will require aggregate materials for the construction of
dwellings and associated infrastructure such as employment, roads, schools and
retail. This includes both the need for land won aggregates and secondary and
recycled aggregates.
Population Projections
7.14 The latest estimate of the usual resident population of Hertfordshire is 1,176,700
as at 30/6/16. 39 This is an increase of 10,40040 in the last year. Using the Office of
National Statistic’s published data of the 2014-based subnational population
projections for England, population projections for Hertfordshire suggest an
39
ONS mid-2015 population estimates, as reported in Hertfordshire’s Local Information System (www.hertslis.org) 40
Calculated from mid-2015 estimate in previous LAA

Local Aggregate Assessment 2017 29
increase of approximately 276,400 (23.93%) in population over the 25 year
period from 2014 to 2039. 41
Housing completions and forecast
7.15 The Spatial Planning and Economy Unit at Hertfordshire County Council
annually surveys the county to check on the permitted housing developments
that have been started and completed. Information obtained for 2016 (financial
year) shows42:
o There were 4,626 housing completions. This figure is higher than that of previous years.
o There were 5,351 housing starts. This figure is higher than that of previous years.
o Compared with last year there has been an increase in completions by approximately 700 residential dwellings. This year has seen a rise in dwelling commitments of approximately 1900 extra dwellings since last year. Most commitments recorded have planning permission but have not yet been implemented.
7.16 The Hertfordshire Local Enterprise Partnership’s (LEP) growth deal is planning
for housing provision of 16,500 new homes and 11,000 jobs by 2024/25.43
7.17 The following table shows a summary of the housing projections that each
District/Borough Councils have decided will need to be constructed based on
each authority areas objectively assessed housing needs:
Table 11: Planned housing requirements at the district/borough councils
41
ONS mid-2014 population estimates, as reported in Hertfordshire’s Local Information System (www.hertslis.org) 42
Spatial Planning and Economy Unit, September 2017 43
https://www.hertfordshirelep.com/invest-in-herts/about-herts/
District/Borough Council
Planned housing requirement Source of housing figure
Broxbourne (7,700 homes until 2031) This works out to be just over 513 per annum
Duty to Cooperate meeting 16/6/17
Dacorum 430 per annum (10,750 from 2006-2031)
Core Strategy 2006-2031 adopted 25/9/2013 & Duty to Cooperate meeting 10/5/17
East Herts 745 per annum (16,400 from 2011-2033)
Duty to Cooperate meeting 17/5/17
Hertsmere (4,177 from 2012-2027) This works out to be 278 per annum
Site Allocations and Development Management Policies adopted November 2016 & Duty to Cooperate meeting 15/5/17

Local Aggregate Assessment 2017 30
Key Planned Infrastructure Requirements
7.18 The requirement for minerals will increase in the event of the development of
major infrastructure within Hertfordshire or in the surrounding areas. The council
is mindful of other planned development that will be required to support
additional housing growth in and around the county. Whilst mineral miles will be
a consideration in the supply of minerals, specific quality of mineral may be
required for schemes that is not readily available in the immediate vicinity of the
project. As such Hertfordshire may be required to provide minerals to
development schemes in neighbouring authority areas. Other significant
schemes will be required to accommodate growth and will be monitored
annually.
7.19 The certainty of some projects is unknown as is the timing for their delivery
therefore it is difficult to programme this requirement into the supply of material
for such projects. The known major development schemes and those that are
being planned in and around Hertfordshire that may require minerals to be
supplied are as follows:
Potential schemes across Hertfordshire:
o A120 bypass Little Hadham; o A602 improvements Stevenage to Ware; o A1(M) improvements; & o Croxley Rail Link (Metropolitan Line Extension – MLX.
North Herts (15,950 from 2011-2031) This works out to be 798 per annum
Porposed Submission Local Plan 2011-2031, October 2016
St Albans (9,000 from 2011-2031) This works out to be 450 per annum
Duty to Cooperate meeting 5/5/17
Stevenage 380 per annum (7,600 from 2011-2031)
Duty to Cooperate meeting 15/5/17
Three Rivers 180 per annum (4,500 by 2025/26)
Core Strategy 2011-2026 adopted 17/10/2011 & Duty to Cooperate meeting 9/6/17
Watford 260 per annum (6,500 from 2006-2031)
Core Strategy 2006-2031 adopted 30/1/2013 & Duty to Cooperate meeting 9/6/17
Welwyn Hatfield (12,000 from 2013-2032) This works out to be 498 per annum 2013-14 to 2021/22 and 752 per annum from 2022/23 to 2031/32
Draft Local Plan Submittion Document, August 2016
Local Aggregate Assessment 2017 31
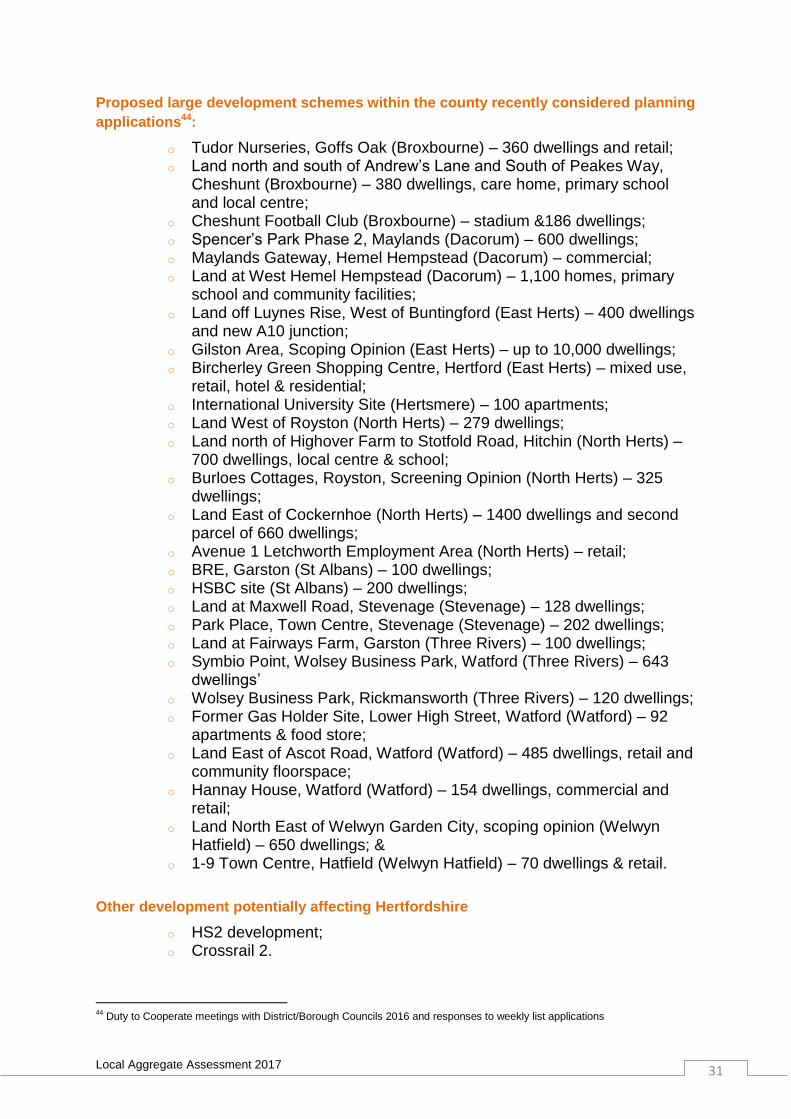
Proposed large development schemes within the county recently considered planning
applications44:
o Tudor Nurseries, Goffs Oak (Broxbourne) – 360 dwellings and retail; o Land north and south of Andrew’s Lane and South of Peakes Way,
Cheshunt (Broxbourne) – 380 dwellings, care home, primary school and local centre;
o Cheshunt Football Club (Broxbourne) – stadium &186 dwellings; o Spencer’s Park Phase 2, Maylands (Dacorum) – 600 dwellings; o Maylands Gateway, Hemel Hempstead (Dacorum) – commercial; o Land at West Hemel Hempstead (Dacorum) – 1,100 homes, primary
school and community facilities; o Land off Luynes Rise, West of Buntingford (East Herts) – 400 dwellings
and new A10 junction; o Gilston Area, Scoping Opinion (East Herts) – up to 10,000 dwellings; o Bircherley Green Shopping Centre, Hertford (East Herts) – mixed use,
retail, hotel & residential; o International University Site (Hertsmere) – 100 apartments; o Land West of Royston (North Herts) – 279 dwellings; o Land north of Highover Farm to Stotfold Road, Hitchin (North Herts) –
700 dwellings, local centre & school; o Burloes Cottages, Royston, Screening Opinion (North Herts) – 325
dwellings; o Land East of Cockernhoe (North Herts) – 1400 dwellings and second
parcel of 660 dwellings; o Avenue 1 Letchworth Employment Area (North Herts) – retail; o BRE, Garston (St Albans) – 100 dwellings; o HSBC site (St Albans) – 200 dwellings; o Land at Maxwell Road, Stevenage (Stevenage) – 128 dwellings; o Park Place, Town Centre, Stevenage (Stevenage) – 202 dwellings; o Land at Fairways Farm, Garston (Three Rivers) – 100 dwellings; o Symbio Point, Wolsey Business Park, Watford (Three Rivers) – 643
dwellings’ o Wolsey Business Park, Rickmansworth (Three Rivers) – 120 dwellings; o Former Gas Holder Site, Lower High Street, Watford (Watford) – 92
apartments & food store; o Land East of Ascot Road, Watford (Watford) – 485 dwellings, retail and
community floorspace; o Hannay House, Watford (Watford) – 154 dwellings, commercial and
retail; o Land North East of Welwyn Garden City, scoping opinion (Welwyn
Hatfield) – 650 dwellings; & o 1-9 Town Centre, Hatfield (Welwyn Hatfield) – 70 dwellings & retail.
Other development potentially affecting Hertfordshire
o HS2 development; o Crossrail 2.
44
Duty to Cooperate meetings with District/Borough Councils 2016 and responses to weekly list applications
Local Aggregate Assessment 2017 32
8 CONCLUSION
8.1 Planning for mineral provision must be seen in the context of the wider economy
and the government’s growth agenda. In light of the current economic recession
which began in 2007, average sales of sand and gravel are likely to be skewed.
Whilst there may be less of a need for minerals in the short term, mineral
planning is concerned with longer term provision. We would not want for there to
be an under supply that could restrict future development and hinder future
economic growth which is currently being planned for at Local Planning Authority
level. As such it is not considered to be a viable approach to simply plan for
mineral provision on the average of the last 10 years of sales.
8.2 Whilst the option of using the 3 year average sales to plan for minerals may
identify a local influence that requires either more or less minerals to be
extracted, this is only a short term requirement. Data from the last 3 years (2014-
2016) shows average sales of sand and gravel in Hertfordshire at 1.20 mtpa
which is 0.05mtpa higher than the 10 year average sales. There were fluctuating
sand and gravel sales in the last 10 years with a marginal increase in the last
three years and no general trend that has occurred. The use of the 3 year
average sales data provides an indication but does not provide a clear direction
for the 15 year MLP.
8.3 The rolling 10 year sales average may be a better indicator of the need for
minerals by using a reasonable time span to judge the need for minerals in the
county. However this level of mineral provision is below the last 3 years sales
given that it has spanned the period of recession in latter years and a continuous
decline in sales until 2005 in the lead up to the recession. It can be seen in
Figure 2, when looking at the sales figures over the last 10 years that there is a
possibility of a rise in sales just as easily as a decline. To this end, paragraph 14
of the NPPF refers to maintaining sufficient flexibility to adapt to rapid change.
8.4 Planning for mineral provision at the lowest of levels will not allow for any
economic recovery out from recession. Paragraph 145 of the NPPF also states
that the AWP figures should still be taken into consideration for the purposes of
calculating future demand and supply of aggregates. Whilst it is recognised that
secondary and recycled aggregates may reduce demand for land won provision
of sand and gravel, the local data is not considered sufficiently reliable to
properly take account of this and adjust the land won provision requirement that
has been debated by EEAWP members and based on a sound and thorough
assessment of national need. The small amount of marine aggregates is not
significant to adjust the apportionment figure either.
8.5 As such the council considers it sensible to plan in line with the EEAWP
agreement and continue to plan for the sub-regional apportionment level to
provide for flexibility to maintain supply when the economy recovers. This will
Local Aggregate Assessment 2017 33
ensure that an adequate and steady supply of aggregate is achieved over the
longer term.
8.6 This LAA and subsequent annual updates will inform the Minerals Local Plan
review and continue to monitor the supply and demand for aggregates. In
addition, the Minerals Local Plan will include monitoring targets and indicators to
ensure that monitoring of the delivery of sites and use of the policies takes place.
Local Aggregate Assessment 2017 34
References
BGS, 2016, United Kingdom Minerals Yearbook 2015, Minerals and Waste Programme Open Report OR/16/021
BGS & ODPM, 2003, Technical report CR/03/075/N, Mineral Resource Information in Support of National, Regional and Local Planning: Hertfordshire and Northwest London Boroughs;
BGS, 2008, Aggregates supply in England, Issues for Planning;
DCLG & ONS, March 2016, Annual Mineral Raised Inquiry (AMRI) Mineral extraction in Great Britain 2014, Business Monitor PA1007
https://www.gov.uk/government/statistics/mineral-extraction-in-great-britain-2014
DCLG & BGS, 2011 (second edition), Collation of the results of the 2009 aggregate minerals survey for England and Wales;
DCLG & BGS, Aggregate Mineral Survey AM2014 source of primary aggregates by sub-region – percent categories
DCLG, 2009, National and regional guidelines for aggregates provision in England 2005-2020;
DCLG, 2007, Survey of Arisings and Use of Alternatives to Primary Aggregates in
England, 2005 Construction, Demolition and Excavation Waste;
EoEAWP, East of England Aggregates Annual Monitoring Report 2016
East of England Aggregates Working Party Survey MPA Collation Form 2011;
HCC, Hertfordshire Authority Monitoring Report 2016;
HCC, Hertfordshire Minerals Local Plan Review 2002-2016, adopted 2007;
HCC Site Monitoring Reports, Spatial Planning and Economy Unit;
Hertfordshire Environmental Forum, 2006, Biodiversity Action Plan for Hertfordshire, www.hef.org.uk
Hertfordshire Partnership, A Biodiversity Action Plan for Hertfordshire, March 2006.
http://www.hertslis.org/env/qualityoflife/
Mineral Produced in the UK in 2010 -
http://www.bgs.ac.uk/mineralsuk/statistics/downloads/MineralsProducedInTheUnited
Kingdom.pdf
National Planning Policy Framework (NPPF) (in particular paragraphs 145-146)
National Planning Practice Guidance (NPPG) (in particular paragraphs 060-071
Local Aggregate Assessment 2017 35
Practice Guidance on the production and use of Local Aggregate Assessments, Living Document (May 2017), Planning Officers Society and Minerals Products Association http://www.mineralproducts.org/documents/LAA_Guidance.pdf

Local Aggregate Assessment 2017 36
Further Information
This document has been produced by the Spatial Planning and Economy Unit,
Hertfordshire County Council.
Should you have any questions in relation to this document please email