Helsinki University of Technology - Aalto · Helsinki University of Technology Publications in...
8
Helsinki University of Technology Publications in Computer and Information Science Report E7 December 2006 FUNCTIONAL ELEMENTS AND NETWORKS IN fMRI Jarkko Ylipaavalniemi Eerika Savia Ricardo Vigário Samuel Kaski AB TEKNILLINEN KORKEAKOULU TEKNISKA HÖGSKOLAN HELSINKI UNIVERSITY OF TECHNOLOGY TECHNISCHE UNIVERSITÄT HELSINKI UNIVERSITE DE TECHNOLOGIE D’HELSINKI
Transcript of Helsinki University of Technology - Aalto · Helsinki University of Technology Publications in...
Helsinki University of Technology Publications in Computer and Information Science Report E7
December 2006
FUNCTIONAL ELEMENTS AND NETWORKS IN fMRI
Jarkko Ylipaavalniemi Eerika Savia Ricardo Vigário Samuel Kaski
AB TEKNILLINEN KORKEAKOULU
TEKNISKA HÖGSKOLAN
HELSINKI UNIVERSITY OF TECHNOLOGY
TECHNISCHE UNIVERSITÄT HELSINKI
UNIVERSITE DE TECHNOLOGIE D’HELSINKI
Distribution: Helsinki University of Technology Department of Computer Science and Engineering Laboratory of Computer and Information Science P.O. Box 5400 FI-02015 TKK, Finland Tel. +358-9-451 3267 Fax +358-9-451 3277 This report is downloadable at http://www.cis.hut.fi/Publications/ ISBN-13 978-951-22-8570-9 ISBN-10 951-22-8570-3 ISSN 1796-2803

Functional Elements and Networks in fMRI
Jarkko Ylipaavalniemi1, Eerika Savia1,2, Ricardo Vigario1 and Samuel Kaski1,2 ∗
1- Helsinki University of Technology - Adaptive Informatics Research Centre
2- Helsinki University of Technology - Helsinki Institute for Information Technology
P.O. Box 5400, FI-02015 TKK - Finland
Abstract. We propose a two-step approach for the analysis of func-
tional magnetic resonance images, in the context of natural stimuli. In the
first step, elements of functional brain activity emerge, based on spatial
independence assumptions. The second step exploits temporal covariation
between the elements and given features of the natural stimuli to identify
functional networks. The networks can have complex activation patterns
related to common task goals.
1 Introduction
Functional magnetic resonance imaging (fMRI) is one of the most successfulmethods for studying the living human brain. Traditionally, its analysis relies onartificially generated stimuli, coupled with generic statistical signal processing,in clear hypothesis-driven setups. The rising interest in natural stimuli studiescalls for the development of new processing approaches.
Completely data-driven methods, when applied to natural uncontrolled stim-uli, will discover all active brain processes, regardless of the study’s researchquestions. In this work we propose a two-step approach, where independent com-ponent analysis (ICA) finds spatially independent functional elements, whereasnonparametric dependent component analysis (DeCA1) collects them into net-works related to the natural stimulation. The processing framework is schemat-ically shown in Figure 1.
Related canonical correlation approaches have been previously suggested forfMRI [1, 2, 3]. Yet, no method has dealt with natural stimuli, since all experi-ments rely on non-overlapping block designs. Furthermore, the novel functionalframework introduced in this paper extends the interpretation ability of theanalyses.
2 Material and Methods
The experiments use a dataset from a recent competition organized by the Uni-versity of Pittsburgh [4]. The data consists of fMRI recordings of three subjectsas they viewed short film clips and a set of features describing the stimulus.
∗This work was partly supported by the IST Programme of the European Community,under the PASCAL Network of Excellence, IST-2002-506778. This publication only reflectsthe authors’ views.
1DeCA generalizes canonical correlation analysis (CCA).
1

dependency- driven
data- driven
ICA
/ el
emen
ts
fMRI Data
DeC
A /
netw
orks
Stimulus Data
Fig. 1: The proposed framework: elements of functional brain activity emergefrom the data via ICA. Functional networks are revealed by DeCA, based oncovariation between the elements and task goals, encoded as features.
2.1 Natural Stimulus fMRI Recordings
Data related to the first subject viewing the first movie clip was analyzed. Itconsists of 20 minutes of continuous fMRI measurements. Whole head volumeswere acquired with a 3T scanner using an EPI sequence (TR=1.75s, TE=25ms,slice=3.5mm, FOV=210mm, flip=76◦), resulting in 64×64×34 voxels per vol-ume, for 858 time points.
Preprocessing provided by the competition organizers included motion cor-rection, slice time correction, linear trend removal, and spatial normalization ofthe volume data. Then the cortical surface was extracted and morphed into asmooth inflated surface containing 238735 vertices. Additionally, we retainedonly 641 time points of the data that contained actual movie viewing.
2.2 Features of Natural Stimulus Data
The film clips, i.e., the natural stimuli, were described with 29 features in thedataset. Some of the features were quantitative, such as brightness or rms sound,measuring image intensity and root-mean-square sound amplitude, respectively.On the other hand, most of the features were more qualitative, e.g., laughter
and sadness, based on subjective labelings given by the viewers. There werestrong correlations among the 29 features. From strongly correlating pairs offeatures we always selected only one to the experiment. Brain activity relatedto observing other people’s actions is of particular interest, so we combinedthe original actor-specific features (e.g., al and brad) into a single new featurepeople by taking their maximum value. We left out features related to places(e.g., kitchen and backyard).
The resulting set of 9 features was attention, brightness, faces, food, language,laughter, rms sound, sadness and people, shown in Figure 2. Each feature was
2
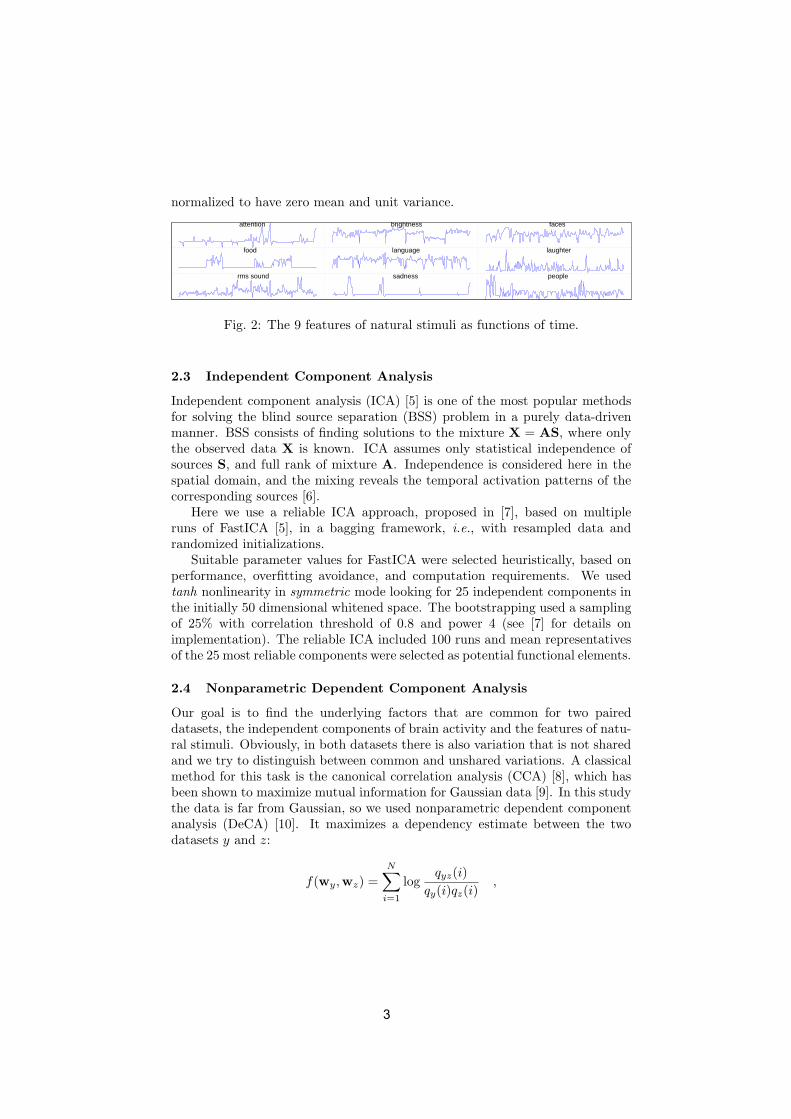
normalized to have zero mean and unit variance.
attention brightness faces
food language laughter
rms sound sadness people
Fig. 2: The 9 features of natural stimuli as functions of time.
2.3 Independent Component Analysis
Independent component analysis (ICA) [5] is one of the most popular methodsfor solving the blind source separation (BSS) problem in a purely data-drivenmanner. BSS consists of finding solutions to the mixture X = AS, where onlythe observed data X is known. ICA assumes only statistical independence ofsources S, and full rank of mixture A. Independence is considered here in thespatial domain, and the mixing reveals the temporal activation patterns of thecorresponding sources [6].
Here we use a reliable ICA approach, proposed in [7], based on multipleruns of FastICA [5], in a bagging framework, i.e., with resampled data andrandomized initializations.
Suitable parameter values for FastICA were selected heuristically, based onperformance, overfitting avoidance, and computation requirements. We usedtanh nonlinearity in symmetric mode looking for 25 independent components inthe initially 50 dimensional whitened space. The bootstrapping used a samplingof 25% with correlation threshold of 0.8 and power 4 (see [7] for details onimplementation). The reliable ICA included 100 runs and mean representativesof the 25 most reliable components were selected as potential functional elements.
2.4 Nonparametric Dependent Component Analysis
Our goal is to find the underlying factors that are common for two paireddatasets, the independent components of brain activity and the features of natu-ral stimuli. Obviously, in both datasets there is also variation that is not sharedand we try to distinguish between common and unshared variations. A classicalmethod for this task is the canonical correlation analysis (CCA) [8], which hasbeen shown to maximize mutual information for Gaussian data [9]. In this studythe data is far from Gaussian, so we used nonparametric dependent componentanalysis (DeCA) [10]. It maximizes a dependency estimate between the twodatasets y and z:
f(wy,wz) =
N∑
i=1
logqyz(i)
qy(i)qz(i),
3

where w are the parameters that define the components (linear projection direc-tions) and q denote Parzen estimators of the density of the projected data. Thesummation is taken over the samples. Intuitively, if the two projected datasetswould be near to independent, the estimator of joint density qyz would roughlyfactorize to the product qyqz of the marginals, resulting in zero cost. DeCAlooks for projections that are as far from this situation as possible. Multiplecomponents were computed in a deflation manner, looking for one componentat a time and removing the found component from the data before looking forthe next one.
We run DeCA 20 times from different initializations and took the best solu-tions according to the cost function. If the next best projections had the samekind of profile we averaged the solution over them.
3 Results
Consistent with previous studies, the reliable independent components in Fig-ure 3 represent spatially independent functional regions of the brain. For exam-ple, component with index 3 (IC3) corresponds to the sensory auditory areas inthe superior temporal lobes of both hemispheres, whereas IC20 corresponds tothe anterior cingulate gyrus. Interpretations for all the components is out of thescope of this paper.
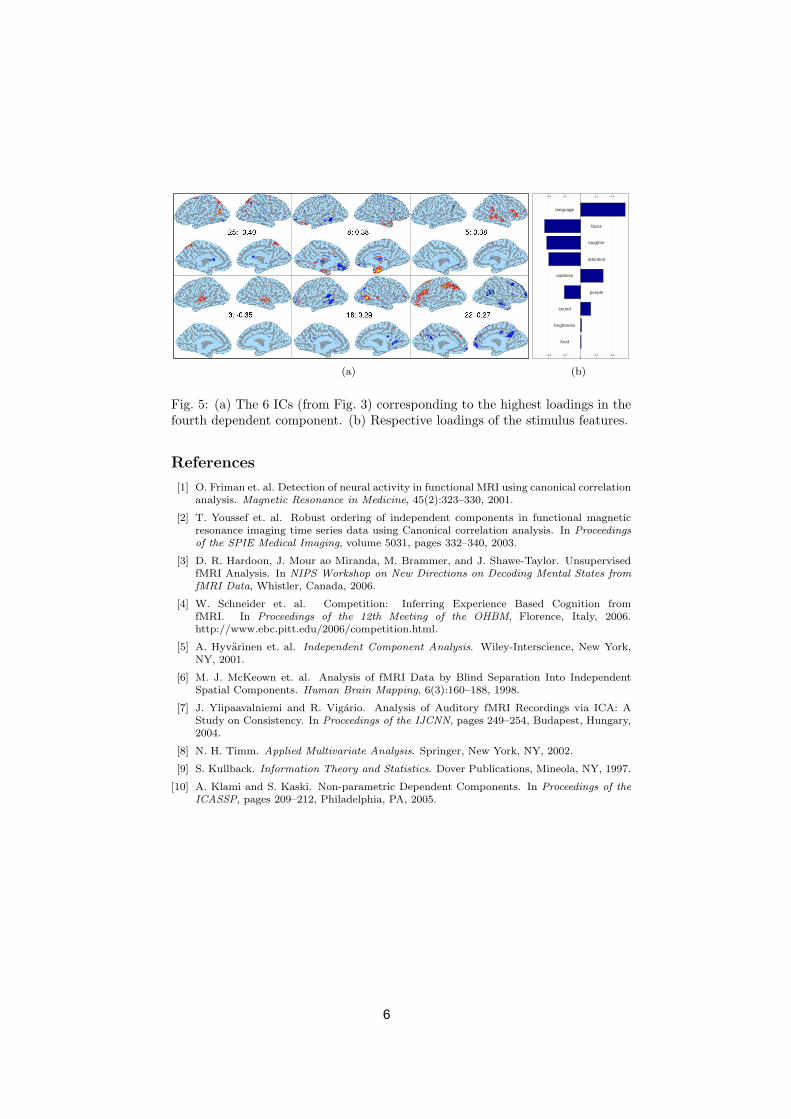
Two illustrative functional networks identified by the method are shown inFigure 4, corresponding to the first dependent component, and Figure 5, cor-responding to the fourth dependent component. In both cases, 6 independentcomponents with the highest loading values are shown, sorted according to theabsolute loading values. High absolute loading value means that the correspond-ing IC or stimulus feature contributes significantly to the respective dependentcomponent. The first network comprises areas corresponding to, e.g., auditory(IC3), visual (IC12), and multi-modal integration (IC24). This suggest that thefunctional role of the network is related to combining information from manysensory inputs. Indeed, the four highest scoring features of the dependent compo-nent are attention, people, brightness and language. The second network includesareas related to, e.g., language processing (IC3 and IC5) and face recognition(IC8). Additional information can again be drawn from the four highest scoringfeatures language, faces, laughter and attention.
4 Discussion
We introduced a two-step approach to the identification of networks of functionalbrain activity. The method was tested on fMRI recordings of brain responsesto natural stimuli. The found networks seem plausible, considering the verysubjective and unreliable nature of the available goal settings. Different networkspartially shared individual elements, each with a clear functional contribution tothe network’s common goal. More controlled studies are being planned to verifythe results and to further develop the approach.
4

Fig. 3: Overview of 25 independent components representing spatially indepen-dent functional brain regions. The index of each component is shown in themiddle of each square. Lateral and medial views of both hemispheres of theinflated cortex are shown. The cortex anatomy in light gray shades and theactivation pattern superimposed with dark (yellow and blue gradients in colorversion).
(a)
-0.4 -0.2 0.2 0.4
-0.4 -0.2 0.2 0.4
sadness
faces
laughter
food
brightness
language
sound
people
attention
(b)
Fig. 4: (a) The 6 ICs (from Fig. 3) corresponding to the highest loadings in thefirst dependent component. The loading value is shown in the middle of eachsquare. (b) Respective loadings of the stimulus features.
5
(a)
-0.4 -0.2 0.2 0.4
-0.4 -0.2 0.2 0.4
laughter
attention
people
faces
sadness
sound
brightness
food
language
(b)
Fig. 5: (a) The 6 ICs (from Fig. 3) corresponding to the highest loadings in thefourth dependent component. (b) Respective loadings of the stimulus features.
References
[1] O. Friman et. al. Detection of neural activity in functional MRI using canonical correlationanalysis. Magnetic Resonance in Medicine, 45(2):323–330, 2001.
[2] T. Youssef et. al. Robust ordering of independent components in functional magneticresonance imaging time series data using Canonical correlation analysis. In Proceedings
of the SPIE Medical Imaging, volume 5031, pages 332–340, 2003.
[3] D. R. Hardoon, J. Mour ao Miranda, M. Brammer, and J. Shawe-Taylor. UnsupervisedfMRI Analysis. In NIPS Workshop on New Directions on Decoding Mental States from
fMRI Data, Whistler, Canada, 2006.
[4] W. Schneider et. al. Competition: Inferring Experience Based Cognition fromfMRI. In Proceedings of the 12th Meeting of the OHBM, Florence, Italy, 2006.http://www.ebc.pitt.edu/2006/competition.html.
[5] A. Hyvarinen et. al. Independent Component Analysis. Wiley-Interscience, New York,NY, 2001.
[6] M. J. McKeown et. al. Analysis of fMRI Data by Blind Separation Into IndependentSpatial Components. Human Brain Mapping, 6(3):160–188, 1998.
[7] J. Ylipaavalniemi and R. Vigario. Analysis of Auditory fMRI Recordings via ICA: AStudy on Consistency. In Proceedings of the IJCNN, pages 249–254, Budapest, Hungary,2004.
[8] N. H. Timm. Applied Multivariate Analysis. Springer, New York, NY, 2002.
[9] S. Kullback. Information Theory and Statistics. Dover Publications, Mineola, NY, 1997.
[10] A. Klami and S. Kaski. Non-parametric Dependent Components. In Proceedings of the
ICASSP, pages 209–212, Philadelphia, PA, 2005.
6