Hedonic Equilibrium Analysis of Property Tax Policy ... · Evidence from the Shenzhen Metropolitan...
37
Hedonic model of property tax page 1 of 37 Hedonic Equilibrium Analysis of Property Tax Policy: Evidence from the Shenzhen Metropolitan Area July 29, 2008 – Submission Version Yong Chen Cambridge University 19 Silver Street Cambridge, CB3 9EP, UK e-mail: [email protected] John M. Clapp* University of Connecticut 2100 Stadium Road, Unit-1041RE Storrs, CT 06269-1041 Tel: +1-860-486-5057 email: [email protected] Dogan Tirtiroglu The University of Adelaide 10 Pulteney Street, Room 12.42 Business School Adelaide, SA 5005, Australia Tel: +61-(0)8-83038007 e-mail: [email protected] * Please address communications to Clapp.
Transcript of Hedonic Equilibrium Analysis of Property Tax Policy ... · Evidence from the Shenzhen Metropolitan...

Hedonic model of property tax page 1 of 37
Hedonic Equilibrium Analysis of Property Tax Policy: Evidence from the Shenzhen Metropolitan Area
July 29, 2008 – Submission Version
Yong Chen Cambridge University
19 Silver Street Cambridge, CB3 9EP, UK
e-mail: [email protected]
John M. Clapp* University of Connecticut
2100 Stadium Road, Unit-1041RE Storrs, CT 06269-1041
Tel: +1-860-486-5057 email: [email protected]
Dogan Tirtiroglu The University of Adelaide
10 Pulteney Street, Room 12.42 Business School
Adelaide, SA 5005, Australia Tel: +61-(0)8-83038007 e-mail: [email protected]
* Please address communications to Clapp.

Hedonic model of property tax page 2 of 37
Hedonic Equilibrium Analysis of Property Tax Policy: Evidence from the Shenzhen Metropolitan Area
Abstract
We develop an equilibrium hedonic pricing model designed to distinguish the „shelter‟ and „investment‟ values of high-rise condominium dwellings. Theory defines the necessity or shelter component as that part of the hedonic function with declining marginal price per unit of interior floor area. The investment component is defined by rising marginal price per unit because this reveals greater willingness to pay for larger units. We suggest that the local government annually tax only the investment value to finance public infrastructure and services, and that the shelter component be protected by making the tax rate progressive. Such a tax would provide incentives for citizens to be actively involved in local government; in particular, tax rates and expenditure decisions will be of interest to property owners because tax money spent efficiently will benefit property value. We test our hedonic method using sales of new high rise condominiums in two districts within Shenzhen: Futian and Longgang. The results show that the dividing line between shelter and investment property is about 60 square meters. Our hedonic model shows that, in equilibrium the proposed tax would have resulted in additional revenues of between 5.5% and 13% of existing real estate taxes in the year 2000, or between 380M RMB and 840M RMB per year.

Hedonic model of property tax page 3 of 37
Hedonic Equilibrium Analysis of Property Tax Policy: Evidence from the Shenzhen Metropolitan Area
1. Introduction
This research is based on Rosen‟s (1974) model of hedonic equilibrium. We consider
the equilibrium established after negative capitalization of a new property tax into house value.
Our analysis of the demand side of the market allows us to derive inferences about the effect of
a proposed annual property tax on dwelling owners in Shenzhen. The proposed tax will be
compared to existing tax collections in terms of its ability to finance investments in public
infrastructure and services. The role of the national government in financing economic
development inside and outside the Shenzhen special economic zone (SEZ) will be factored
into the policy analysis.
Our main research contribution is to use the hedonic model to distinguish between
shelter and investment components of housing purchases. Specifically, consider a sample
condominium with 100 square meters. Let's assume that we find empirically that the first 60
square meters shows a decreasing ability to pay for each increment to dwelling size, while the
remaining 40 square meters displays rising price per square meter. Based on hedonic theory,
we argue that the first 60 square meters represents a necessity commodity (i.e., shelter) while
the second component is above and beyond that (i.e., it has an investment component).1
What if the first component were free from annual property taxation while the second
component was taxed? Such a system will be reviewed with special reference to the incentives
that it would provide for efficient public expenditures on infrastructure and public services.
Our hedonic model provides a new method for estimating the effects of an ad valorem
property tax following the progressive scheme outlined above, where the degree of progressivity
depends on empirical results. We use empirical results from the tax capitalization literature
(Clapp, Nanda and Ross, 2008; de Bartolome and Rosenthal, 1999; Palmon and Smith, 1998)
to evaluate the effect of the proposed property tax on the hedonic envelope function.2
Our database for Shenzhen allows us to estimate important characteristics of the utility
functions of buyers in the high-rise housing market.3 Our data are a very rich and complete
representation of free market transactions of ownership units in high rise buildings (i.e.,
1 The terms “necessity” and “investment” components are rigorously defined by hedonic theory, in Section
3. 2 China has a very different tax system than the US, so we use a simple version of tax capitalization
model in Yinger et al., 1988. We do not need to consider the tax deduction issues raised by Follain and Ling (1991). 3 Data source: Shenzhen Land & Real Estate Exchange Centre.

Hedonic model of property tax page 4 of 37
condominiums) between August 2004 and January 2006. Many of the sales are presales: i.e.,
sold before the buildings are completed. Thus, we take our results as an approximation to the
market for new housing.
As a second contribution, we propose to test for the significance of location within a SEZ
on the necessity vs. investment components. This is based on a strength of our database: We
have projects inside and outside the Shenzhen SEZ.
Finally, the availability of the timing of transactions allows us to track comparatively the
evolution of the housing prices in and outside of the Shenzhen SEZ in each month during our
sample period. We add to empirical findings with respect to Hong Kong high rise housing prices
(see Leung, Leong and Wong 2006).
The next section discusses the relevance of Shenzhen in Chinese economic and
housing development, and it provides an overview of existing tax policy. Motivation for an
annual property tax, and application to the necessity and investment components, is discussed
in this section. Section 3 develops the role of equilibrium hedonic pricing theory in identifying the
boundary between necessity and investment housing demand. It argues that the simple
structure of supply in the high rise housing market allows identification of the demand side.
Section 4 develops a functional form for the hedonic regression and provides an overview of the
tax simulation model. Section 5 presents the data and empirical results, including estimates of
revenues collected from the proposed property tax. Section 6 concludes.
2. Housing and tax policy in Shenzhen and China as a whole
Shenzhen is an important engine of Chinese economic development, with population
growth of roughly 15% per year fueled by in-migration.4 Many of the immigrants have been
single people seeking work for several months out of the year. But at the same time Shenzhen
had about 1.2 million family households in the year 2000. This is about 5.5% of the 18.8 million
family households in the sprawling Guangdong (aka Guangzhou) conurbation (Map 1).5
We study new high rise housing in two districts in Shenzhen: Futian (inside the SEZ and
centrally located) and Longgang (outside the SEZ and peripherally located). Together, these
districts comprise nearly 45% of Shenzhen‟s family households.
4 The China Daily (November 16, 2004) reports that: “Shenzhen's population density tops large and
medium cities in the Chinese mainland at 3,597 people per square kilometre. That density is growing 15.32% per year. In comparison, the population density in Beijing was 881 people per square kilometre, 2,902 in Shanghai and 975 in Guangzhou.” 5 China Census 2000 reports that there were over 340 million family households in all of China.
Hedonic model of property tax page 5 of 37
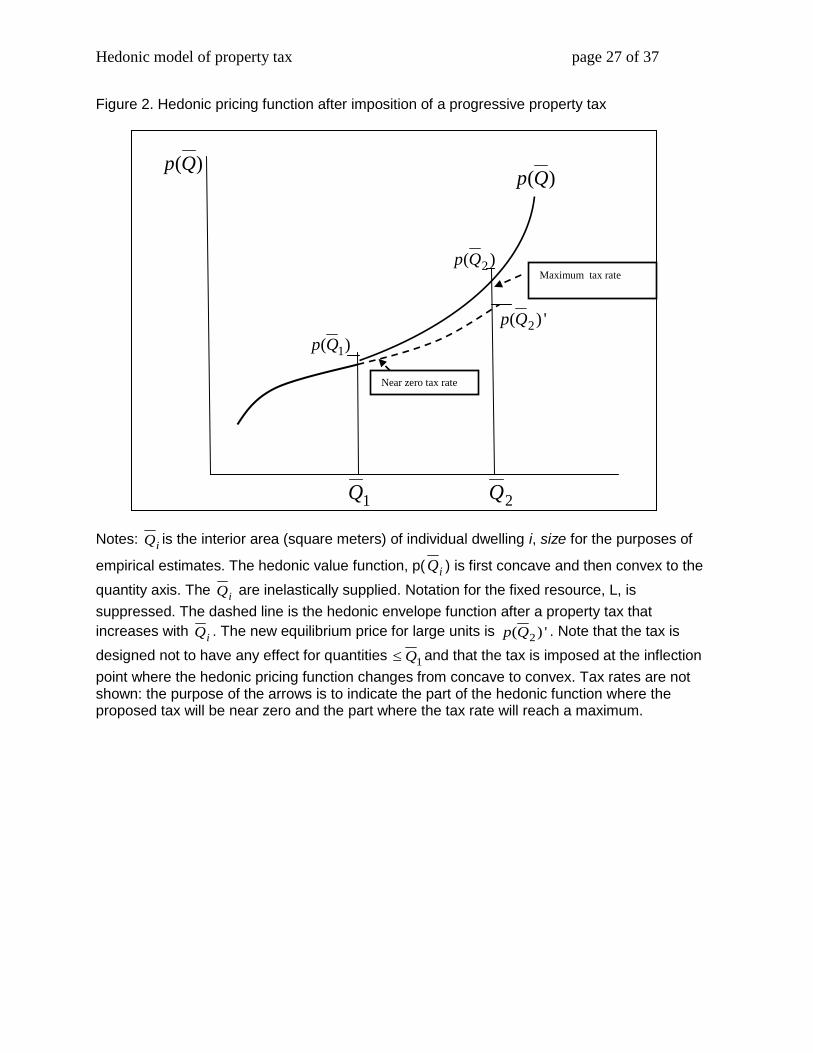
The rapid growth of family housing in Shenzhen is indicated by the relatively large
percentage of housing that was new (i.e., less than 10 years old) in 2000:
Percent of Housing Units < 10 years old
Shenzhen 77%
Futian District 83%
Longgang District 79%
National 42%
Source: Authors‟ calculations based on China Census 2000, Table7-1, p 294-295, reference A and Table 11, p 811, reference B.
Moreover, 40% of Shenzhen family households own their dwelling unit. Of these, many
estimate that their housing is quite valuable compared to the national median of about 15,000
RMB:
Housing Expenditure, RMB
Shenzhen Futian District
Longgang District
National
Total 100% 100% 100% 100%
<10k 7% 0% 11% 41%
10-20k 3% 3% 2% 20%
20-30k 5% 6% 2% 10%
30-50k 8% 10% 4% 8%
50-100k 15% 17% 17% 5%
100-200k 22% 19% 26% 2%
200-300k 16% 10% 24% 0%
300-500k 13% 15% 12% 0%
>500k 11% 21% 3% 0%
Source: Authors‟ calculations based on China Census 2000, Table 7-5, p 296-297, reference A and Table 20, p 812, reference B.
The municipal government of Shenzhen is under considerable pressure to quickly
expand infrastructure and public services to accommodate rapid population growth. We turn to
tax policies that are relevant to the growing population in middle class and luxury housing.

Hedonic model of property tax page 6 of 37
Existing tax policy in China and in Shenzhen
China has a complex system of taxation at the national and local levels. Appendix 1
(China‟s National Taxation System, 2005) and Appendix 2 (Important Changes in China‟s Real
Estate Tax Policies) provide some details. These appendices are available from the authors on
request.
At the national level, important real estate taxes include: 1) A deed tax (transfer tax) of
1.5% on sales of residential units and 3% on certain other properties; 2) A 5% tax on the selling
price of properties held less than 5 years; 3) Land Appreciation Tax (LAT) , a percentage of
appreciation over allowed deductions. Existing sources of revenue in Shenzhen include an
education surcharge at the rate of 3% of paid business tax.
Land revenue includes state-owned land leases, land use fees and other income related
to land.6 Land revenue is collected into a special government fund and exclusively used in land
requisition compensation, affordable housing development, and urban infrastructure. The
national government does not provide financial support, but offers policy incentives for social
and economic development of Shenzhen. The largest policy benefit for Shenzhen: only 15% of
the enterprise income tax (EIT, described in Appendix 1) applies to Shenzhen‟s special
economic zone. Other policy incentives have been eliminated in recent years.
Why impose an annual property tax?
The property tax has an important advantage over other taxes: it makes property owners
into stakeholders in the local government. If revenues from the property tax are spent efficiently
on local infrastructure and local public services, then property values will rise enough to partially
or wholly offset the burden of the property tax. Therefore, property owners have an incentive to
be actively involved in local government affairs and monitor the efficiency with which officials
spend tax money. A second advantage of the property tax is that real property is observable
and verifiable. Therefore, it is difficult to avoid taxation by concealing real assets.
6 Land use fees rather than land use taxes are applied in Shenzhen. The rates depend on land use fee type, land type and land class. However, land use fees have been replaced by land use tax in Shenzhen since November 2007, according to the Announcement of Shenzhen Local Tax Bureau on Starting to Levy Urban Land Use Tax. The land use tax started to be collected from June 1, 2008. Residential units occupied by owners are exempt. Land revenues in 2002, 2004 and 2005 for Shenzhen were RMB 14.263 billion, RMB 11.64 billion and RMB 12.92 billion, respectively. Further, real estate related tax revenue was RMB 4.984 billion in the first five months of 2007. This accounts for 19.6% of local tax revenue. It should be noted that it is extremely difficult to collect data regarding land revenue and real estate related tax revenue.

Hedonic model of property tax page 7 of 37
The often-cited disadvantages of the property tax have limited applicability to the
progressive investment tax proposed here. It is often alleged that the property tax imposes a
higher burden as a percentage of income on lower income households.7 But the tax proposed
here is specifically designed to be progressive.
Another major criticism of the property tax is associated with the difficulty of determining
the value of real property. Some properties trade infrequently, are in unusual locations or have
characteristics that are difficult to value. However, the property tax proposed here is based on
the living space of new high rise apartments. This property class is relatively homogenous and
easy to value with recent transactions prices.
We propose to set a maximum tax rate on properties above 110 square meters.
Moreover, properties above 110 square meters will be valued based on their size, not on other
characteristics. Therefore, the tax will be based uniformly on observable characteristics of the
property and on the hedonic regression proposed below. There will be minimal judgment
involved on the part of the tax assessor.
3. Hedonic equilibrium theory applied to high-rise housing
The hedonic model provides a theory for the equilibrium pricing for each characteristic of
a bundle of characteristics that are sold in inseparable units.8 Consider a single characteristic,
such as interior area (square meters) of a unit. The theory says that the larger the size of the
unit, the higher the bundle price must be, holding constant for other characteristics. Thus,
equilibrium rules out the possibility that one can buy larger units for a lower total price. However,
the theory does not predict whether the price per unit declines or rises with the equilibrium
quantity in the market. Rosen‟s seminal work emphasized the case where price per unit rises
with quantity, but he does not discuss the implications of this.
Figure 1 illustrates the case where price per unit rises as the quantity increases; i.e., the
hedonic pricing function is convex to the X-axis. For the moment, suppose that the cost per unit
of production of interior area is constant; i.e., marginal and variable costs are identical and equal
to a constant. Then the convex hedonic pricing function must mean that higher income
households (or those with a greater taste for larger units) are willing to pay more per unit than
the lower income households. In effect, this means that there are relatively more of these
7 This is a debatable claim because local public services are also oriented towards lower income
households. For a discussion, see Goodman (2006), Listoken, Listoken and Voicu (2006), Peterson (2006), Peterson (1973) and Netzer (1966). 8 Rosen‟s (1974) theory has been generalized by Bajari and Benkard (2005). Most importantly, the
generalization allows for discontinuous supply of bundles of hedonic characteristics.

Hedonic model of property tax page 8 of 37
households compared to the supply of these large housing units on the market. Thus, the
bidding among higher income households causes the price per square meter to rise as the
number of square meters increases.
Our empirical evidence indicates that the convex pricing function illustrated in Figure 1
holds for high-rise housing above 60 square meters. Identification of the demand side is
obtained because cost to build should be less for larger units; plumbing and kitchen facilities are
spread over more area and fewer partitions are required. Thus, if the equilibrium is as described
in Figure 1, land owners must be making a higher profit on the larger units. This may occur in a
supply constrained market where it is difficult both to get permission to build and to forecast the
demand for units of various sizes.
Implications for shelter vs. investment goods
Hedonic equilibrium theory says that supply and demand match (pair off) at different
bundles of characteristics. Ekeland, Heckman and Nesheim (2004) emphasize that supply-
demand pairings are essential because in equilibrium the market must clear for every bundle
being sold in the market.
Given these pairings, and the fact that supply costs decrease for larger units, why would
buyers pay more per square meter for larger apartments (Figure 1)? They must have the
income and/or taste associated with higher demand for larger units. But, it is common
knowledge that many high-rise apartments in Shenzhen are sold to investors. So the “taste” for
larger units likely comes from an investment motive: the costs of carrying the investment
(management costs) can be spread over more square meters, lowering the opportunity cost of
the investment. This characterization of the investment motive is an approximation that does not
apply to every transaction. Consequently, we define the “investment component” to mean that
portion of the hedonic function with rising marginal costs.9
Those demanding larger housing units could shift their demand to the smaller end of the
market. This is likely to happen if buyers have a shelter motive. That is, if the hedonic envelope
function is shaped as in Figure 1, they can obtain basic shelter at lower cost per unit by buying
smaller apartments.
Proposed policy: Progressive annual property tax
9 Likewise, the terms “necessity” or “shelter” component are defined here to refer to the part of the
hedonic function with declining marginal cost per unit of interior area, or the minimal amount of area if the hedonic function is convex throughout its range as in Figure 1.

Hedonic model of property tax page 9 of 37
China does not have an annual ad valorem property tax. However, our results indicate
that there is an ability to pay this tax if it were imposed on the larger units. The property tax
imposed on such units would reduce their total value, but the convex hedonic equilibrium
illustrated in Figure 1 and supported by our empirical results indicates there is considerable
room to pay such a tax and still have a functional market for large units. Figure 2 illustrates the
effect of imposing a progressive ad valorem property tax above a minimal size, 1Q . Just above
1Q the percentage tax rate is near zero; it rises to a maximum tax rate at2
Q . Thus, the tax is a
progressive percent of property value.
The progressive aspect of the proposed tax minimizes incentives to shift the production
of housing to an amount just below1Q : the tax saved by small adjustments in production will be
small. In this way, the proposed tax has an advantage over the property tax as implemented in
the US and many other countries, where there is an incentive to hold vacant land rather than to
build structures. The proposed tax provides no disincentive to build necessary shelter, and
taxes the investment component only where the hedonic function is convex.
When the market reaches equilibrium after the tax, demand for investment apartments
will be reduced as illustrated by comparing the dashed line to the solid line in Figure 2. The
market prices of these apartments will fall as the tax is negatively capitalized (see Yinger et al.,
1988). Of course, the equilibrium price of investment units will still be higher than those of
smaller apartments as required by the theory of Rosen (1974).
Figure 2 illustrates the effect of the tax on price, but there will be a corresponding
reduction in the equilibrium number of units built and sold at each size above 1Q . This follows
from the pairings between supply and demand, where a number of buyers and sellers reach
equilibrium at each quantity of the hedonic characteristic, Q .10 We allow for the negative
equilibrium demand shift in number of units and price when we simulate the effects of the
proposed property tax.
The hedonic model with monopolistic competition
We model monopolistic competition in the supply of hedonic characteristics in the high-
rise housing market in Shenzhen. The assumption of monopolistic competition is appropriate on
several counts:
10
See the discussion of Figure 1 in Eckland, Heckman and Nesheim (2004). The role of general equilibrium adjustments in response to taxes is discussed in Gyorko and Sinai (2003).

Hedonic model of property tax page 10 of 37
1. Spatial markets are inherently monopolistic because each location in space is
unique;
2. Sites suitable for the development of high rise housing are in limited supply;
3. Permission from the local government to build is in limited supply.
The hedonic model with monopolistic competition has long been developed in the
literature (see Dixit and Stiglitz, 1977). We use a version recently implemented by Pakes (2003).
In this model price is a function of the vector of hedonic characteristics (simplified here to the
size of the unit) and so are marginal cost and the elasticity of demand.
( ) ( ) 1/ ( )DP size mc size e size (1)
where ( )De size is the absolute value of demand elasticity with respect to size of the unit (interior
square meters), ( )mc size is the marginal cost of supplying space and ( )P size is the hedonic
envelope function illustrated in Figures 1 and 2. Our focus on size is standard in the housing
literature: i.e., people are paying for elbow room more than anything else.
Equation (1) says that the equilibrium hedonic envelope is equal to the marginal cost of
supplying space plus a markup, which is higher for more inelastic demand. Pakes (2003) points
out that this equation holds exactly for Bertrand competition; the markup becomes a complex
function of the distribution of ownership and preferences when we depart from this simple
assumption. However, equation (1) provides a valuable insight: the elasticity of demand is a key
parameter. The simple structure of supply in the high rise housing sector allows us to identify
demand as indicated by equation (1).
Our assumption is that, in the high rise sector, marginal cost has a particularly simple
form. All units have a kitchen and a bathroom, the main fixed components of cost when
constructing a unit. Moreover, construction costs will increase with the number of floors. The
increase is particularly large after about five floors when construction materials must be lifted
with cranes and other heavy construction equipment. So we take mc() as constant depending
on the floor number.
We turn to an empirical model that allows flexible measurement of demand elasticity.
4. Functional form for the empirical model
We allow flexibility in the estimate of the elasticity parameter with a Taylor expansion in
the log of interior area (size). The Taylor expansion is well established and the use of the log

Hedonic model of property tax page 11 of 37
form is standard in the hedonic literature.11 The log linear model would have constant elasticity.
The squared and cubed terms for the log of size allow the flexibility we seek to accurately
measure changes in elasticity with respect to the amount of space being purchased.
2 3
0 1 2 3ln ln( ) [ln( )] [ln( )] ( , , ) ( )price size size size I type floor month U (2)
where size is measured in square meters; ()I refers to indicator (0,1) variables; type refers to
dwelling type (e.g., a townhouse or a 2 bedroom flat); floor indicates height of the unit above
street level; and month is each month where sales took place. 12 The disturbance term is a result
of negotiation between buyer and seller. The function ( )U allows for possible spatial
autocorrelation in disturbance term, , an important factor given the large literature providing
evidence for spatial structure.
Simulation of the proposed tax
Arc elasticities of demand will be estimated from the parameters in equation (2), with
other variables held at selected values (e.g., the 5th floor and the first month). To calculate arc
elasticities, we simply estimate predicted price for each level of size, then find the percent
change in price for a one percent change in size.
The negative demand shift from imposing a tax on a unit of given size is estimated from
the elasticity parameters. Data in China Census 2000 allow estimation of the number of housing
units in each size category. We calculate the number of units, and the equilibrium price, after
allowing for the negative demand shift. Then it is straightforward to tabulate the tax that will be
collected depending on the percentage taxed, the interest rate and the rate at which the
property tax is capitalized into value.
Details of the algorithm for calculating tax collected are given below.
5. Data and empirical results
Shenzhen database and variable definitions
11
An advantage of the log form is that is reduces heteroscedasticity in the disturbance terms. The source of the disturbance terms is negotiation between buyers and sellers and these negotiations are likely to take place in terms of percentage of the selling price. Therefore, the log model is a natural one to use. 12
It is well known that in China, certain floor numbers are considered unlucky, so demand should decrease for apartments on these floors.

Hedonic model of property tax page 12 of 37
We have collected and edited an extensive database on free market transactions of high
density condominium units in the Shenzhen region. Our original dataset contains 10,252 sales
transactions with information on (a) sales price, (b) square meters of floor space, (c) a project
identifier (which also identifies whether a property is inside or outside of the SEZ), (d) a building
identifier, (e) unit type (one bedroom through four bedroom, duplex, greater than four bedrooms,
single apartment and single dormitory), (f) floor number, and (g) date of sale.13 The date of sale
ranges from August 2004 to January 2006, with exact day of sale included in the data.
Our dependent variable is the natural logarithm of the transaction price, Totprice, of a
sample property, lnprice. The independent variables of the model are defined as follows:
F(i) or L(j) = 1 if a sample housing unit is located in housing project Futian, denoted by i or
Longgang, denoted by j, 0 otherwise (where i = 1,2, ..., 11 and j = 1, 2, ..., 5);
Type1 = 1 for 1-bedroom or single apartment or single-dormitory housing units, 0 otherwise;
Type2 = 1 for 2-bedroom housing units, 0 otherwise;
Type3 = 1 for 3-bedroom housing units, 0 otherwise;
Type4 = 1 for 4-bedroom housing units, 0 otherwise;
Type5 = 1 for duplex or „more-than-4-bedroom‟ housing units, 0 otherwise14;
lnsize is the natural logarithm of the square meter of a given sample housing unit;
Month (k) = 1 if a sample housing unit was sold in month k, 0 otherwise (k=1, 2, 3,…, 18;
Month1 is August 2004);
Floor1 = 1 if a sample housing unit was located between the first and the fifth floors of a
given housing project (F(i) or L(j)), 0 otherwise;
Floor2 = 1 if a sample housing unit was located between the sixth and the tenth floors of a
given housing project (F(i) or L(j)), 0 otherwise;
Floor3 = 1 if a sample housing unit was located between the eleventh and the fifteenth
floors of a given housing project (F(i) or L(j)), 0 otherwise;
Floor4 = 1 if a sample housing unit was located between the sixteenth and the twentieth
floors of a given housing project (F(i) or L(j)), 0 otherwise;
Floor5 = 1 if a sample housing unit was located between the twenty-first or the twenty-fifth
floors of a given housing project (F(i) or L(j)), 0 otherwise;
13
A subset of the above data contains the 6,411 sales where we have some project information. These are projects F1-F5, L1 and L2. The project information includes size of the project, floor area ratio, parking, availability of common facilities, availability of daycare within the project, management fee, date construction began and presence of a special economic zone as well as other information. When needed, these data supplement our larger dataset. 14
Due to limited number of observations, single apartment or single dormitory (more-than-4-bedroom) transactions are combined with 1-bedroom (duplex) transactions, respectively.

Hedonic model of property tax page 13 of 37
Floor6 = 1 if a sample housing unit was located between the twenty-sixth and thirtieth floors
of a given housing project (F(i) or L(j)), 0 otherwise;
Floor7 = 1 if a sample housing unit was located between the thirty-first or the thirty-sixth
floors of a given housing project (F(i) or L(j)), 0 otherwise.
We study separately two sub-samples -- one for the properties inside the SEZ, which are
located within the Futian District (6,998 observations), and a second one for the properties
outside the SEZ, which are located within the Longgang District (3,254 observations). Further
screening of the data for each sub-sample reveals that (a) there are no observations for the
Futian sub-sample in August, September, and October of 2004, (b) the Futian sub-sample has
only 25 observations in January 2006, (c) the Longgang sub-sample has no observation on
single apartment or single dormitory transactions and has only four observations on transactions
for the „more-than-four bedroom‟ properties, (d) projects F6 and especially F7 in the Futian sub-
sample have few observations and (e) the Longgang sub-sample does not have any Floor7
observations. Given that one of our objectives is also to construct a price index for each sub-
sample, we exclude the month of January 2006 from the Futian sub-sample to avoid an
unreliable price index estimate for January 2006. This exclusion leaves a total of 6,973
observations for the Futian sub-sample.
The data and variable restrictions affect our model specifications and estimations for each
sub-sample in a number of ways. For the Futian sub-sample, we observe the following empirical
issues. First, the omitted base month is November 2004 (i.e., Month4) since there is no
observation for August, September and October of 2004. Hence, all estimates for the monthly
dummy variables shift in relation to November 2004. Second, the presence of only a handful of
observations for January 2006 (i.e., Month 18) forces us not to include a dummy variable for
Month18 in our estimations. Third, project F7 is the omitted category; all estimates of the
project-related dummy variables shift in relation to F7, which has only a few observations.
For the Longgang sub-sample, we have no observation on Floor 7 and have a small
number of observations on Floor 6, which, as a result, is designated as the omitted category in
relation to Project1 through Project5.15 Further, Type1 consists entirely of 1-bedroom properties
and serves as the omitted category. Each sample month has sufficient number of observations.
So, August 2004 (Month1) is the omitted category for this sub-sample.
Table1 - Panel A and Panel B provide summary statistics for each sub-sample. The
mean, median and standard deviation of transaction prices in RMB for the Futian District are
670,932, 431,592, and 821,977 while the corresponding figures for the Longgang District are
15
Not surprisingly, the average building height is larger in Futian, the more central location.

Hedonic model of property tax page 14 of 37
549,365, 422,705, and 487,068. The average price per square meter of floor space for the
Futian District is 60.5%16 higher than that for the Longgang District (9,723.65 vs. 6,058.95
RMB). This contrasts with the size of a Futian unit, which is only about 60% of the size in the
Longgang District. This is preliminary but strong evidence for the added value per unit size of
being located within the SEZ in Shenzhen. We find that higher location value inside the SEZ
(e.g., the value of better access to the central business district and to Hong Kong) implies less
demand for investment apartments.
Figure 3 further explores the distribution of the important size variable. Both districts
have right-skewed distributions (median less than mean). Both have a long tail above about 110
square meters. We will use 110 as the maximum size for the progressive property tax (i.e., the
tax rate reaches a maximum at 110 sm) because we do not want to extrapolate our elasticity
estimates to a thin part of the distribution.
Regression results
Table 2 – Panels A and B contain representative results for four specifications of a
logarithmic hedonic pricing model estimated by ordinary least squares (OLS). Models 1 and 2 (3
and 4) are cubic non-linear and linear specifications in lnsize and include (exclude) property
types in the estimations, respectively.17
Irrespective of the functional form of the model and sub-sample, results demonstrate a
strong association between size and property prices. In particular, all size-related estimates for
the cubic model specifications for each district are statistically significant. This association for
the Futian District, however, is stronger than that for the Longgang District. The significance
levels for the estimates of the Futian District are higher than the 1% level while, for the
Longgang District, the estimates for lnsize and lnsize-squared attain only 10% and 5%
significance levels under Model 1.
Equilibrium hedonic prices are expected to increase with height of the floor. On the
demand side, residents prefer to reside in higher floors where the view is better and street noise
is less audible. On the supply side, floor level adds extra construction costs since materials
must be lifted up and, above about five floors building core is lost to elevator shafts. The
increasing equilibrium hedonic price with floor level (see definition above) is strong and
applicable to all floor levels (up to the seventh level) in almost a monotonic way for the Futian
16
Based on the medians, this amount is 64.98%. 17
We also estimate a quadratic specification of the hedonic pricing model. We do not report these results. They are available from the authors upon request.

Hedonic model of property tax page 15 of 37
District. It is strong only for the first three floor levels (i.e., through floor 15) for the Longgang
District.
Average price movements in each sample district show an increasing but different trend.
The coefficient estimates for the monthly dummy variables for the Longgang District exhibit
strong statistical significance and an overall increasing trend in relation to August 2004. The
only exception is the statistically non-significant estimate for September 2004. Results for the
Futian District also suggest an increasing trend, albeit a statistically less convincing one, in the
average monthly prices in relation to November 2004. In fact, the coefficient estimates for
December 2004, January 2005, February 2005 and April 2005 do not attain statistical
significance while March 2005 attains significance only at the 10% level.
Type dummy variables have the expected effects. The least desirable type of
condominium (1 bedroom or single-dormitory units, denoted Type1) has a negative effect on
hedonic value both inside and outside the SEZ. The most luxurious units (duplex or more than 4
bedrooms, denoted Type5) are only available in the more centrally located Futian District.
These apartments strongly increase price.
The empirical results described in Table 2 (Models 2 and 4) indicate that the price per
square meter in the high-rise housing sector increases as the interior area of dwellings
increases. This is after holding constant for characteristics of the units. This is the standard
hedonic result: larger units are priced higher and the t-values indicate that interior size is much
more important than any other variable in the regression.
When Panel B is compared to Panel A, the surprising result is that elasticity of price with
respect to size is much larger in Longgang (1.69) than in Futian (1.05); both numbers are for the
models that control for unit type. Since the regression passes through the means, the much
larger elasticity in Longgang may follow from nonlinear effects over the range of lnsize.
Therefore, we add a squared and cubed term for lnsize.
Table 3 shows that the investment condominiums (elasticity increasing) begin at about
60 square meters both inside and outside the SEZ. But inside the SEZ the hedonic function
shows less convexity above 60 square meters, indicating less demand relative to supply of
“investment” condominiums.
The calculations in Table 3 show some interesting differences inside and outside the
SEZ. Outside prices are estimated at about 60% of those inside, controlling for characteristics
and for time.18 Table 1 shows that the minimum size of an outside unit, at 42.5 square meters is
much larger than the 27.5 square meters of an inside unit. Thus, the less centrally located units
18
The “type” variable is omitted from the specification used for calculations in Table 3.

Hedonic model of property tax page 16 of 37
are priced less (i.e., land value is less) and allow bidding on relatively large units. This is
consistent with the elasticity results.
Robustness checks: Allow flexible marginal cost
We performed a number of alternative model specifications in order to check the
robustness of the main findings. First, we removed outliers: i.e., observations that are very
influential in terms of the results. This was done with standard methods for measuring Cooks-D
statistics to identify outliers.
The standard errors for our coefficients are measured using robust clustered standard
errors. Standard errors were clustered within each building in order to avoid spatial dependence
within the buildings. Moreover, Huber-White standard errors were calculated.19
We allowed a number of different model specifications. The elasticity, the main
parameter in equation (1), was calculated for each model specification. Without exception, the
elasticities were not sensitive to model specification.
A plausible objection to these results is that marginal costs differ depending on the floor
of the unit. It is more costly to build an additional square meter at level 2 or higher (i.e., above 5
floors) because construction materials must be lifted; higher floors can be associated with
substantially heavier construction equipment. If marginal costs differ across units, then
estimated elasticities may be inaccurate.
We re-estimated the model allowing marginal cost to differ by floor level. In particular, we
shifted the parameters of the model for the 5th floor and above. The coefficient estimates from
these models differ substantially from those in Table 2. However, the elasticity estimates do not
change much. For example, on a high floor in Futian, the demand elasticity falls to about 1 at 60
square meters and rises to about 1.04 at 110 square meters. These results are substantially the
same as in Table 3. On the first five floors, elasticity falls to about .93 at 70 square meters and
stays close to that level, and then rises at 100 and again at 110 square meters.
We conclude that our main results are robust to allowing flexible marginal costs.
Estimating collections from the property tax
19
This well established method is based the variance covariance on the residuals from an ordinary regression. These residuals are then weighted by the X-values.

Hedonic model of property tax page 17 of 37
Table 4 uses arc elasticity estimates to measure the amount collected from the proposed
tax in hedonic equilibrium. The algorithm used for these calculations follows the general model
framework discussed in Section 4. The steps involved in the estimation model are as follows:
1. Construct an equal interval grid from the minimum of about 20 square meters to a
maximum which is within range of the observed data (see Figure 3).
2. Use estimated coefficients from the hedonic models to calculate predicted price at
each point on the grid and at fixed values for the remaining hedonic characteristics.
3. Multiply predicted price by the proposed annual property tax for square meters of 60
and above.20 i.e., the progressive tax rate is zero percent at less than or equal to 60
square meters.
4. The property tax rate increases linearly from zero percent to a maximum percentage
rate such as 1% or 2%. The maximum determines the progressivity of the proposed
tax.
5. The percent change in equilibrium hedonic value is estimated from the change in
price induced by the tax, the capitalization rate, and the percent of the tax capitalized
into value.21
6. The total number of units in each size category is estimated from China Census
2000 and the distribution of sales by size.
7. The total number of units in equilibrium after the negative demand shift is estimated
from steps 5 and 6 above; i.e., multiply 1/eD by the percent change in price. Thus,
the model allows for the change in demand that results from implementing the tax.
8. The tax collected is simply the tax rate times the equilibrium number of units times
the predicted price per unit from the hedonic regression.
9. Sum the estimate tax collection over all the size categories to obtain the total annual
collection estimated, Table 4.
In Table 4, the degree of progressivity was controlled by the maximum tax rate. That is,
the tax rate starts at zero percent for 60 square meters and increases linearly up to a maximum
percent at 110 square meters. This maximum was chosen based on the range of the data as
20
The area of 60 square meters was chosen because the empirical results show that this is where the
hedonic function changes from concave to convex: 1Q in Figure 2. 21
A parameter here is the percent of the tax capitalized into value. This is based on US studies, which show that the percentage ranges from about 0.3 to 0.9 in decimal terms.

Hedonic model of property tax page 18 of 37
illustrated in the histograms, Figure 3. Above 110 square meters the estimators of elasticity
were not reliable enough to form the basis for a property tax.
A mildly progressive property tax has a maximum rate of 1% at 110 square meters. A
more progressive tax rate has a maximum at 2% at 110 square meters. Two percent is roughly
the average property tax rate in the United States.
The effect of the tax also depends on the percentage capitalized into property value.
More myopic homeowners capitalize a smaller percentage. Results in the US suggest that
between 30%-90% of the tax is capitalized; in theory, the percent capitalized depends on the
relative mobility of the population and of capital.22 The higher the percentage of the tax
capitalized the more negative the effect of the tax would be on the demand for investment
housing. Therefore, demand will shift down and in equilibrium a smaller total tax will be
collected.
The results indicate that the tax collected in the two areas combined would range from
about 170M RMB to about 375M RMB per year. Since Futian has fewer large units, less tax is
collected there; i.e., Futian has a smaller investment sector as suggested by Table 3.
The largest determinant of the amount collected is, of course, the progressivity of the tax
as measured by the maximum tax rate. The next influential factor is the amount of the tax
capitalized into value: i.e., the degree of myopia in the market. The discount rate is not
influential.
We estimate that Shenzhen collected about 6.8B RMB in the year 2000 from the various
real estate taxes discussed in Section 2.23 This implies that the proposed tax will result in an
addition of between 5.5% and 13% to existing real estate taxes. The increase is modest
because we propose to tax only the investment component of new high-rise housing units.
The modest impact of the tax is confirmed by China Census 2000 which shows that only
11% of units in Futian (14% in Longgang) were greater than 50 square meters. Even though
most of these are new (about 77% of all units were built within 10 years), the tax would affect
only the 8% of all families in Shenzhen with larger, new units.
6. Conclusions
22
Clapp, Nanda and Ross (2008) find up to 70% negatively capitalized whereas Palmon and Smith (1998) find about 62% capitalized. de Bartolome and Rosenthal (1999) find results indistinguishable from full capitalization. 23
We estimate that real estate taxes were about 20% of total taxes of about 35B in 2000. In addition, about 13B was collected in land leases and other income related to land.

Hedonic model of property tax page 19 of 37
Rapid economic growth in Shenzhen poses two related problems: providing housing for
the population and providing infrastructure and local public services. When housing is owned by
residents, then owners have an incentive to be actively involved in local government.24 The
property tax focuses this incentive on efficient expenditure of tax dollars.
China has a complex system of taxation at the local and national levels. We propose to
add an annual property tax based on the value of high rise ownership apartments
(“condominiums”). Our proposed tax is progressive so as to minimize the disincentive to build
basic shelter. Only about 8% of Shenzhen families would pay any property tax and most of
these would pay minimal amounts. However, even small amounts provide incentives to be
actively involved citizens.
Given the need to provide shelter, we propose to tax only the investment component of
housing. Hedonic pricing theory is used to define the investment component as those
apartments where price per square meter increases with size. We use this concept to test for an
inflection point where price per square meter changes from declining to rising: i.e., the hedonic
envelope function changes from concave to convex. Moreover, we use hedonic theory to
develop a new method for estimating the effect of introducing a property tax after allowing for
the negative demand shift that will result.
We test our hedonic method using sales of new high rise condominiums in two districts
within Shenzhen: Futian and Longgang. The results show that the dividing line between shelter
and investment property is about 60 square meters. Our tax impact model shows that the
proposed tax will result in additional revenues of between 5.5% and 13% of existing real estate
taxes, or between 380M RMB and 840M RMB per year.25 These modest amounts will allow the
local government to be more efficient in its response to the pressure for rapid economic and
residential development.
Our results indicate substantially more demand for investment housing in Longgang,
outside the SEZ. In the more centrally located Futian district, land values are higher, buildings
tend to have more floors and living space is more restricted. There are fewer investment units
as defined by a convex hedonic function. Moreover, prices were rising much less rapidly inside
the SEZ (.7% per month) than outside (1.6% per month) during the period covered by our data
(the last few months of 2004 through the end of 2005).
24
China Census 2000 shows that about 44% of family households in Shenzhen own their residence. 25
All estimates are adjusted to hold as of the year 2000.

Hedonic model of property tax page 20 of 37
Appendix 1 [Available from Authors on Request]: China‟s National Taxation System, 2005
Under China‟s national taxation system, there were 13 types of taxes26
that applied in 2005 and to the projected REIT regime. Those taxes can be classified into three levels, i.e. taxes at the (1) enterprise level, (2) asset level and (3) investor level. A1.1. Taxation at the Enterprise Level At the enterprise level, there are three main types of taxes, i.e. enterprise income tax (EIT), income tax on enterprises with foreign investment
27 and foreign enterprises
28 (FEIT), and withholding tax. There is no
separate capital gain tax in China‟s taxation system. Instead, capital gains add to other taxable income for income tax purpose. EIT: EIT applies to SOEs, collective enterprises, private enterprises, joint operation enterprises, joint equity enterprises, and other organizations except enterprises and organizations with foreign capital participation (FEs). The tax base of EIT includes enterprises‟ worldwide income from production and business operations and other sources. Distributed income is not a deductible item for EIT purpose. The rate of EIT is currently 33 percent of taxable income but will be reduced to 25 percent when the EIT Law comes into effect on 1 January 2008. FEIT: Income and capital gains received by the FEs are subject to FEIT. The tax base of FEIT is the taxable income derived from sources within China
29 after allowable deduction for costs, expenses and
losses30
. The stipulated rate of FEIT is 33 percent of taxable income, but actual rate of FEIT varies across different regions within China. Specifically, FEIT at a rate of 15 percent applies to the FEs in special economic zones and economic and technological development zones; while 24 percent is for those coastal economic open zones. Most FEs are borne to an actual average income tax burden of 15 percent
31. It is worth to note that a universal EIT unifies both EIT and FEIT with a flat rate of 25 percent
under the EIT Law. The universal EIT will come into effect on 1 January 200832
. Withholding tax: Withholding tax rather than FEIT applies to taxable income of those foreign enterprises which “has no establishment or place in China but which derives profits, interest, rent, royalties or other income from sources in China, or which, though it has an establishment or place in China, derives such income and the income is not effectively connected with such establishment or place” (article 19 of the Income Tax Law on Enterprises with Foreign Investment and Foreign Enterprises (the FEIT Law)). The rate of withholding tax is 20 percent of taxable income, but the actual levying rate is ten percent, which is stipulated in the tax circular of Guofa [2000] No.37
33. The rate will restore to 20 percent under the
provisions of the EIT Law. A.1.2. Taxation at the Asset Level
26
Another tax, fixed assets investment orientation regulation tax, is related to real estate. But this tax has been temporarily suspended. Source: SAT, http://www.chinatax.gov.cn/n480462/n480483/n480675/n761721/n763583/index.html. 27
Enterprises with foreign investment include Chinese-foreign equity joint ventures, Chinese-foreign contractual joint ventures and wholly-foreign owned enterprises. 28
Foreign enterprises include foreign companies, enterprises and other economic organizations which have establishments or places in China engaged in production or business operations or which, though without establishments or places in China, have income from sources within China. 29
However, enterprises with foreign investment with head office in China shall pay income tax on their worldwide income. 30
Source: Beijing Local Taxation Bureau, http://english.tax861.gov.cn/zgszky/zgszky.htm. 31
Source: Xinhua, http://www.chinese-embassy.org.uk/eng/zt/lhzt/npc/t304720.htm. 32
The EIT Law prescribes a 5-year transition period for FEs to adopt the new rates of both EIT and withholding tax. 33
It was promulgated by the State Council in 2000.

Hedonic model of property tax page 21 of 37
At asset level, taxes apply to acquiring, owning, renting and disposal of properties. Such taxes include business tax, land appreciation tax (LAT), city maintenance and construction tax (CMCT), farmland occupation tax (FOT), urban and township land use tax (LUT), house property tax (HPT), urban real estate tax (URET), stamp tax and deed tax. Among them, LAT, FOT, LUT, HPT, URET and deed tax only apply to real estate. The rest types of taxes apply to other business as well. Business Tax: Business tax applies to taxable service provisions, intangible assets and immovable properties transfer. The rate of business tax ranges between 3-20 percent of turnover and actual rate depends on the nature of tax items. Business tax is levied at 5 percent of rental income or capital gains on disposal of property. LAT: LAT adapts progressive rates, that is, the rate of LAT ranges between 30.0-60.0 percent of the proceeds derived from property sale after the allowable deduction. The actual rate depends on percentage of appreciation value over the allowable deduction. CMCT: The levy of CMCT is based on the paid VAT, Consumption Tax and/or Business Tax. Rate of CMCT varies in different areas, i.e. it is seven percent for city area, five percent for county and township area and one percent for other areas. FOT: FOT only applies to real estate development where it involves in using farmland. The rate of FOT depends on average farmland per capita in a given area. That is, the annual amount of FOT is RMB 2-10 per square meter for counties with one mu
34 or less of farmland per capita, RMB 1.6-8 for counties with 1-
2 mu farmland per capita or, RMB 1.3-6.5 for counties with 2-3 mu farmland per capita; and RMB 1-5 for county with over three mu farmland per capita. LUT: LUT applies to all enterprises and individuals that own or use properties. The rate of LUT depends on administrative areas. That is, the annual rate of LUT per square meter is RMB 1.5-30 in large cities, RMB 1.2-24 in medium-size cities, RMB 0.9-18 in small cities, or RMB 0.6-12 in mining districts. HPT: HPT could be calculated in two ways. One is the cost approach in which an annual rate of 1.2 percent applies to the residual value of a property after subtracting 10-30 percent from the property‟s original value. The other is the rental approach in which the rate of 12 percent applies to the rental income from the property under question
35.
URET: Similar to HPT, there are two methods for calculating URET. One is the cost approach in which an annual rate of 1.5 percent applies to the value of the property. The other is the rental approach in which the rate of 15 percent applies to the rental income from the property under question
36.
Stamp Tax: Stamp tax applies to contracts and agreements. The rate of stamp tax depends on the nature of contracts. In particular, tenancy agreements, property insurance contracts and property transfer contracts are levied at the rate of 0.1 percent, 0.1 percent and 0.05 percent of the total contractual sum, respectively. Deed Tax: Deed tax applies to property transfer contracts. It is a flat rate of 3.0-5.0 percent levied on the total contract sum. The actual rate is determined by the local government at the provincial level. Fees and Surcharges: Besides the above taxes, various types of fees and surcharges may be applicable at asset level in different administrative areas. For example, flood prevention fee
37 is applicable in
Guangzhou and education surcharge38
is applicable in Shanghai.
34
Mu is an area unit used in China. One mu is approximately equal to 666.7 square meters. 35
Source: articles 3 and 4 of the Interim Regulations on House Property Tax, which was promulgated on 15 September 1986. 36
Source: article 6(3, 4) of the Interim Regulations on Urban Real Estate Tax, which was promulgated on 8 August 1951. 37
Source: GZI REIT (00405.HK) IPO prospectus. 38
Source: Greentown China Holding Limited (03900.HK) IPO prospectus.

Hedonic model of property tax page 22 of 37
A.1.3. Taxation at the Investor Level Taxes on institutional and individual investors are governed by different tax legislations and regulations. Institutional investors‟ taxation is regulated by the Provisional Regulations of State Council of PRC on Enterprise Income Tax
39 and the FEIT Law, and by the EIT Law from 1 January 2008 onwards.
Institutional investors pay taxes for their income derived from investments as they do on their production and business operation unless otherwise stated. Both domestic and foreign institutional investors pay business tax at the standard rate on income derived from their investments. Domestic institutional investors pay taxes on their investment income at the standard EIT rate; while foreign institutional investors are subject to FEIT or withholding tax depending on their legal status within China and the status of income derived from sources within China. On the other hand, taxes on individual investors are governed by the Individual Income Tax Law (the IIT Law). The individual income tax (IIT) with a flat rate of 20 percent applies to individual investors on their income and capital gains derived from “interest, dividends, bonuses, lease of property, transfer of property, incidental income or income from other sources” (article 3(5) of the IIT Law). The amount of taxable income from such sources “shall be the full amount received in each payment” (article 6(6) of the IIT Law). The IIT is levied at income sources, that is, “the paying unit or individual shall be the withholding agent” to withhold taxes applied to individual income (article 8 of the IIT Law). It is then investigated tax arrangements for investors investing in different vehicles. CRE (Chinese Listed Real Estate Company) Investors: Institutional investors are liable to business tax and EIT regarding their investments in CRE shares. Specially, capital gains, dividends and other income derived from such investments add to other taxable income of an institutional investor for EIT or withholding tax purpose depending on its legal status within China. Institutional investors are also liable to pay 5 percent business tax on capital gains from share trading
40. Foreign investors are liable to
withholding tax on income and capital gains derived from their investments in CRE shares. The NCSSF is exempt from both business tax and EIT regarding its share investments including investing in CRE shares
41. Qualified foreign institutional investors (QFIIs) are exempt from business tax on capital gains
derived from share investment42
. Individual investors are exempt from IIT on capital gains of share investments including CRE shares. Dividends received by individual investors are taxed at a reduced rate of ten percent
43 and withheld by the
CREs where they make such distributions. Both institutional and individual investors are liable to stamp tax at the rate of 0.1 percent of the value of share trading. Appendix 2 [Available from Authors on Request]: Important Changes in China’s Real Estate Tax
Policies 2005-2007
A.2.1 A Chronology of Nationwide Changes in Tax Policy -1 April 2005 Implementation of 5% business tax on residential property sold within two years; -1 June 2005 deed tax (based on sale price or market value if sale price is significantly below estimated market value, and charged upon the transaction of property) maintained at 1.5% for ordinary housing but raised to 3% for non-ordinary units;
39
It was promulgated on 13 December 1993. 40
Article 5(5) of Interim Regulations of PRC on Business Tax, 13 December 1993. 41
Source: MoF and SAT, Cai Shui (Revenue&Tax) [2002] no.75, 2002. 42
Source: MoF and SAT, Cai Shui (Revenue&Tax) [2005] no.155, 1 December 2005. 43
Source: MoF and SAT, Cai Shui (Revenue&Tax) [2005] no.102, 13 June 2005, and [2005] no.107, 24 June 2005.

Hedonic model of property tax page 23 of 37
-1 June 2006 Residential units sold within five years of purchase are subject to a 5% business tax on the selling price of properties. Ordinary housings sold after five years of purchase may get an exemption but the non-ordinary housings will still be subject to 5% business tax; -26 July 2006 Tax authority reiterated that the 20% income tax on sale of properties will be enforced from 1 August 2006, but it could be exempt if: 1) the property has been held for more than five years and is the sellers' sole residence; 2) the seller will get partial or full tax refund if another property is purchased within one year of disposal, depending on the values of the two properties. -16 January 2007 Full enforcement of LAT (land appreciation tax) charge on developers, effective from 1 February 2007. A.2.1.2. Deductible items 1. The sum paid for the acquisition of land use rights; 2. Costs and expenses for the development of land and construction of new buildings and facilities; 3. The selling, administration and finance costs related to development of land and construction of buildings; 4. The taxes related to the transfer of real estate; 5. 20% of the sum of 1 and 2 above. A.2.1.3. Tax rate 1. For that part of the appreciation, amount not exceeding 50% of the sum of deductible items, the tax rate shall be 30%. 2. For that part of the appreciation amount exceeding 50%, but not exceeding 100%, of the sum of deductible items, the tax rate shall be 40%. 3. For that part of the appreciation, amount exceeding 100%, but not exceeding 200%, of the sum of deductible items, the tax rate shall be 50%. 4. For that part of the appreciation, amount exceeding 200% of the sum of deductible items, the tax rate shall be 60%. A.2.1.4. Exemptions 1. Tax payers constructing ordinary standard residences for sale, where the appreciation amount does not exceed 20% of the sum of deductible items; 2. Real estate taken over and repossessed according to laws due to the construction requirements of the State. A.2.2. A Chronology of Changes in Tax Policy in Shenzhen -1 November 2005 Education surcharge was restored at the rate of 3% of paid business tax. A land use fee rather than a land use tax is applied in Shenzhen. The rates depend on land use fee type, land type and land class.
44
44
One of the co-authors, Yong Chen, has detailed tables of both land use fees and land use taxes in Shenzhen. Translation into English may be necessary as part of this project.

Hedonic model of property tax page 24 of 37
REFERENCES
Bajari, P., and C. L. Benkard 2005. “Demand Estimation with Heterogeneous Consumers and Unobserved Product Characteristics: A Hedonic Approach,” Journal of Political Economy, 113(6), 1239-1274.
Clapp, John M.; Nanda, Anupam; Ross, Stephen L.; “Which School Attributes Matter? The Influence of School District Performance and Demographic Composition on Property Values” Journal of Urban Economics, March 2008, v. 63, iss. 2, pp. 451-66 de Bartolome, Charles A. M.; Rosenthal, Stuart S.. 1999; “Property Tax Capitalization in a Model with Tax-Deferred Assets, Standard Deductions, and the Taxation of Nominal Interest” Review of Economics and Statistics, February 1999, v. 81, iss. 1, pp. 85-95
Dixit, A. K., and J. E. Stiglitz 1977. “Monopolistic Competition and Optimum Product Diversity,” The American Economic Review, 67(3), 297-308.
Ekeland, Ivar, James J. Heckman, and Lars Nesheim. 2004. “Identification and Estimation of Hedonic Models.” Journal of Political Economy, 112, no. 1, pt. 2 (February): S60–S109.
Follain, J. and D. Ling 1991. “The Federal Tax Subsidy to Housing and the Reduced Value of the Mortgage Interest Deduction” National Tax Journal, 44(2), 147-168.
Goodman, J. 2006. Houses, Apartments, and the Incidence of Property Taxes. Housing Policy Debate 17(1): 1-26.
Gyorko, J and T.Sinai 2003. “The Spatial Distribution of Housing-Related Ordinary Income Tax Benefits” Real Estate Economics, 31(4), 527-575.
Leung, C.K.Y., Y.C.F. Leong and SK Wong (2006) “Housing Price Dispersion: An Empirical Investigation” Journal of Real Estate Finance and Economics 32: 357-385. Listoken, D., S. Listoken and I. Voicu 2006. Comment on Jack Goodman‟s “Houses, Apartments, and the Incidence of Property Taxes.” Housing Policy Debate 17(1): 27-44. Netzer, D. 1966. Economics of the Property Tax. The Brookings Institution: Washington, D.C.
Pakes, A. 2003. “A Reconsideration of Hedonic Price Indexes with an Application to PC‟s,” The American Economic Review, 93(5), 1578-1596.
Palmon, Oded; Smith, Barton A. 1998; “New Evidence on Property Tax Capitalization” Journal of
Political Economy, October 1998, v. 106, iss. 5, pp. 1099-1111
Petersen, J. 2006. Comment on Jack Goodman‟s “Houses, Apartments, and the Incidence of Property Taxes.” Housing Policy Debate 17(1): 45-56. Peterson, G.E., ed. 1973. Property Tax Reform. The Urban Institute: Washington, D.C.
Rosen, S. 1974. “Hedonic Price and Implicit Markets: Product Differentiation in Pure Competition,”
Journal of Political Economy, 82, 34-55.

Hedonic model of property tax page 25 of 37
Yinger, John_et al.; 1988, pp. xii, 218, Property taxes and house values: The theory and estimation of intrajurisdictional property tax capitalization. Studies in Urban Economics series San Diego; London; Sydney and Toronto: Harcourt Brace Jovanovich, Academic Press

Hedonic model of property tax page 26 of 37
( )
( )
p Q
Q
1Q
1( )Q
2( )Q
2Q
( )p Q
1( )p Q
2( )p Q
Figure 1. Convex Hedonic Equilibrium
Notes: iQ is the interior area (square meters) of individual dwelling i, size for the purposes of
empirical estimates. ( )i Q is the consumer i‟s bid function, compensated for the income effects
associated with changes in iQ . The hedonic value function, p( iQ ) is convex to the quantity
axis. The iQ are inelastically supplied. Notation for the fixed resource, L, is suppressed.
Hedonic model of property tax page 27 of 37
( )p Q
1Q 2Q
( )p Q
1( )p Q
2( )p Q
2( ) 'p Q
Near zero tax rate
Maximum tax rate
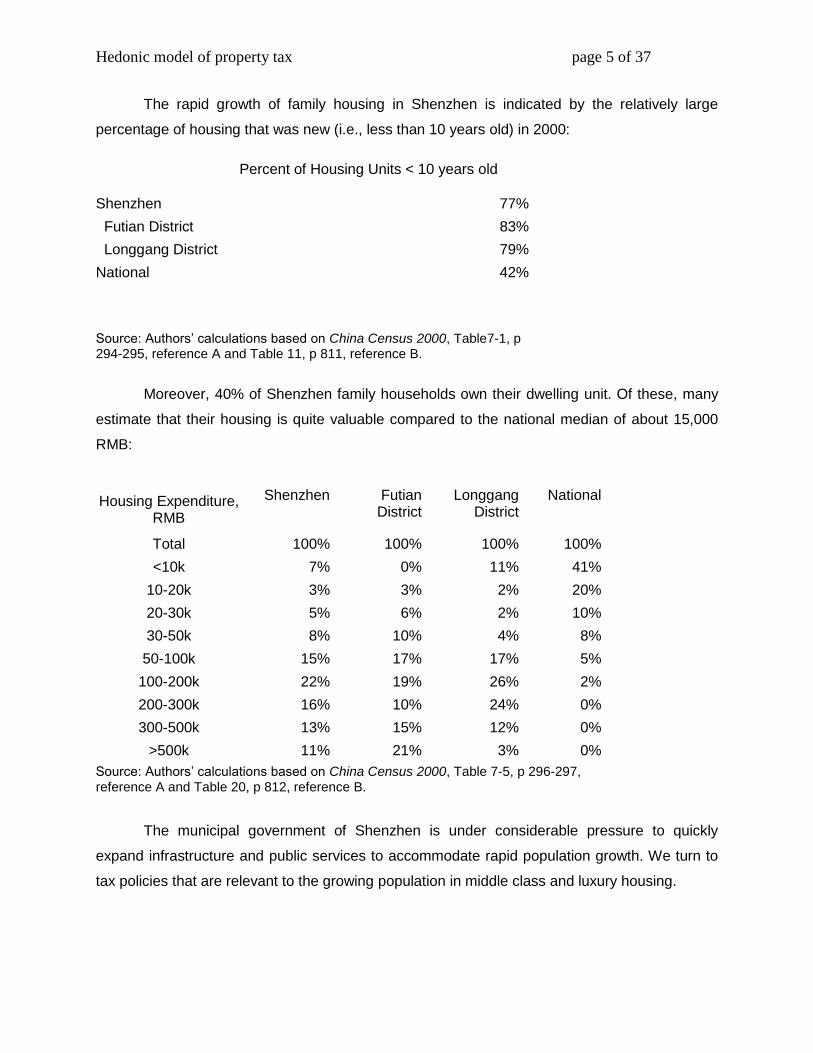
Figure 2. Hedonic pricing function after imposition of a progressive property tax
Notes: iQ is the interior area (square meters) of individual dwelling i, size for the purposes of
empirical estimates. The hedonic value function, p( iQ ) is first concave and then convex to the
quantity axis. The iQ are inelastically supplied. Notation for the fixed resource, L, is
suppressed. The dashed line is the hedonic envelope function after a property tax that
increases with iQ . The new equilibrium price for large units is
2( ) 'p Q . Note that the tax is
designed not to have any effect for quantities 1Q and that the tax is imposed at the inflection
point where the hedonic pricing function changes from concave to convex. Tax rates are not shown: the purpose of the arrows is to indicate the part of the hedonic function where the proposed tax will be near zero and the part where the tax rate will reach a maximum.

Hedonic model of property tax page 28 of 37
Figure 3. The distribution of size (square meters of interior space) in the two districts
a. Futian
0
500
100
01
50
02
00
0
Fre
que
ncy
0 100 200 300 400size
b. Longgang
0
200
400
600
800
Fre
que
ncy
0 50 100 150 200 250size

Hedonic model of property tax page 29 of 37
Notes: The star just above the border with Hong Kong indicates Shenzhen‟s central business district (CBD) and municipal government center. Darker shading indicates more intensively developed areas. The underlined district near the CBD is the Futian District, one of the two used for this study. The other district, Longgang is on the right hand side of the map (see underlining). The dashed line near the middle of the map gives the boundary of Shenzhen‟s special economic zone (SEZ).

Hedonic model of property tax page 30 of 37
Table 1- Panel A: The sub-sample for transactions in the Futian District. Variable Mean Std. Dev. Maximum Minimum
Totprice 670,937 821,978 11,706,208 68,409
Lnprice 13.144 0.617 16.276 11.130
Size 68.996 46.424 391.470 27.490
Lnsize 4.079 0.517 5.970 3.310
lnsize2 16.906 4.478 35.640 10.980
lnsize3 71.272 29.613 212.766 36.390
F1 0.189 0.391 1 0
F2 0.416 0.493 1 0
F3 0.052 0.222 1 0
F4 0.090 0.286 1 0
F5 0.012 0.108 1 0
F6 0.005 0.069 1 0
F7 0.003 0.052 1 0
F8 0.125 0.330 1 0
F9 0.066 0.248 1 0
F10 0.038 0.192 1 0
F11 0.005 0.072 1 0
floor1 0.064 0.246 1 0
floor2 0.175 0.380 1 0
floor3 0.182 0.386 1 0
floor4 0.176 0.381 1 0
floor5 0.170 0.376 1 0
floor6 0.149 0.357 1 0
floor7 0.083 0.276 1 0
type1 0.475 0.499 1 0
type2 0.298 0.457 1 0
type3 0.151 0.359 1 0
type4 0.064 0.245 1 0
type5 0.011 0.107 1 0
Month4 0.007 0.085 1 0
Month5 0.007 0.083 1 0
Month6 0.062 0.242 1 0
Month7 0.121 0.326 1 0
Month8 0.087 0.282 1 0
Month9 0.128 0.334 1 0
Month10 0.051 0.219 1 0

Hedonic model of property tax page 31 of 37
Month11 0.059 0.236 1 0
Month12 0.064 0.245 1 0
Month13 0.081 0.273 1 0
Month14 0.059 0.236 1 0
Month15 0.078 0.269 1 0
Month16 0.127 0.333 1 0
Month17 0.069 0.251 1 0
Minimum numbers not indicated in this table are all zero. Our sample runs between August 2004 and January 2006 and has 10,252 observations inside and outside of the special economic zone (SEZ). The Futian District is inside SEZ. We have a total of 6,998 observations. Excluding the 25 transactions to produce reliable price index estimate for January 2006 reduces the size of the sample to 6,973. There were no observations for this sub-sample during August, September and October 2004. Type1 (Type5) is made up of 1-bedroom or single apartment or single dormitory (duplex and more-than-4-bedroom) properties, respectively.

Hedonic model of property tax page 32 of 37
Table 1- Panel B: The sub-sample for transactions in the Longgang District. Variable Mean Std Dev Maximum Minimum
Totprice 549,365 487,068
3,946,517 144,812
lnprice 13.02 0.55 15.19 11.88
Size 90.67 34.74 234.94 42.46
lnsize 4.45 0.34 5.46 3.75
lnsize2 19.89 3.07 29.80 14.05
lnsize3 89.47 21.05 162.71 52.67
L1 0.277 0.448 1 0
L2 0.065 0.249 1 0
L3 0.274 0.446 1 0
L4 0.329 0.470 1 0
L5 0.054 0.227 1 0
floor1 0.397 0.489 1 0
floor2 0.223 0.416 1 0
floor3 0.162 0.368 1 0
floor4 0.121 0.326 1 0
floor5 0.065 0.246 1 0
floor6 0.033 0.178 1 0
type1 0.098 0.298 1 0
type2 0.358 0.479 1 0
type3 0.417 0.493 1 0
type4 0.045 0.208 1 0
type5 0.082 0.274 1 0
Month1 0.065 0.247 1 0
Month2 0.028 0.165 1 0
Month3 0.033 0.178 1 0
Month4 0.035 0.183 1 0
Month5 0.044 0.206 1 0
Month6 0.036 0.187 1 0
Month7 0.015 0.123 1 0
Month8 0.038 0.192 1 0
Month9 0.009 0.096 1 0
Month10 0.006 0.074 1 0
Month11 0.008 0.091 1 0
Month12 0.039 0.193 1 0
Month13 0.052 0.222 1 0
Month14 0.092 0.288 1 0
Month15 0.168 0.374 1 0
Month16 0.174 0.379 1 0
Month17 0.130 0.336 1 0
Month18 0.027 0.161 1 0
Minimum numbers not indicated in this table are all zero. Our sample runs between August 2004 and January 2006 and has 10,252 observations inside and outside of the special economic zone (SEZ). The Longgang District is outside SEZ. We have a total of 3,254 observations. Type1 (Type5) is made up of 1-bedroom or single apartment or single dormitory (duplex and more-than-4-bedroom) properties, respectively. But, there were no observations of single apartment or single dormitory properties or Floor7 units in this sub-sample. Only a few observations on „more-than-4-bedroom‟ units are in this sub-sample. Sufficient observations are present in each sample month.

Hedonic model of property tax page 33 of 37
Table 2 - Panel A: Empirical Results for the Futian District (inside SEZ). Models 1 and 3 (Models 2 and 4) are cubic (linear) hedonic model specifications with and without the property type variables. The base category variables are Project F7, Floor1, Month4, and Type 2 (2-bedroom units). These are OLS results. ***, **, and * indicate statistical significance at the 1%, 5%, and 10% levels. Month18 is excluded due to very limited number of observations.
Model 1 Model 1 Model 2 Model 2 Model 3 Model 3 Model 4 Model 4
Parameter T Parameter t Parameter t Parameter t
Variable Estimate Statistics Estimate statistics Estimate statistics Estimate statistics Intercept -0.563 -0.93 8.509 216.51*** -3.228 -7.13*** 8.436 278.4***
F1 0.119 6.3*** 0.139 7.3*** 0.112 5.92*** 0.158 7.51***
F2 0.228 12.1*** 0.244 12.8*** 0.232 12.3*** 0.256 12.2***
F3 0.066 3.44*** 0.081 4.2*** 0.063 3.26*** 0.097 4.50***
F4 0.043 2.23** 0.063 3.3*** 0.041 2.16** 0.083 3.88***
F5 0.055 2.66*** 0.052 2.47** 0.052 2.47** 0.050 2.16**
F6 -0.199 -8.5*** -0.193 -8.1*** -0.201 -8.52*** -0.205 -7.79***
F8 0.004 0.21 0.005 0.28 -0.005 -0.24 0.004 0.17
F9 0.473 22.5*** 0.544 26.8*** 0.422 20.5*** 0.598 27.4***
F10 0.116 5.9*** 0.139 7.0*** 0.113 5.74*** 0.160 7.33***
F11 0.015 0.67 -0.027 -1.16 0.030 1.31 0.080 3.11***
Lnsize 7.826 17.8*** 1.053 141.9*** 9.743 30.7*** 1.067 271.9***
Lnsize^2 -1.656 -15.9*** N/A N/A -2.118 -28.9*** N/A N/A Lnsize^3 0.133 16.3*** N/A N/A 0.170 30.7*** N/A N/A Floor2 0.047 10.4*** 0.049 10.8*** 0.045 10.0*** 0.048 9.65***
Floor3 0.092 20.7*** 0.095 21.0*** 0.091 20.2*** 0.095 19.0***
Floor4 0.121 26.9*** 0.124 27.1*** 0.119 26.2*** 0.124 24.5***
Floor5 0.160 35.1*** 0.163 35.2*** 0.158 34.5*** 0.163 31.9***
Floor6 0.174 37.4*** 0.180 38.0*** 0.173 36.9*** 0.183 35.0***
Floor7 0.172 33*** 0.174 32.7*** 0.172 32.7*** 0.185 31.6***
Month5 -0.009 -0.54 -0.010 -0.59 -0.009 -0.56 0.000 0.02
Month6 0.001 0.07 0.002 0.14 -0.004 -0.33 0.010 0.71
Month7 0.001 0.11 0.003 0.24 -0.005 -0.42 0.011 0.81
Month8 0.023 1.88* 0.023 1.92* 0.018 1.48 0.030 2.22**
Month9 0.007 0.58 0.005 0.44 0.003 0.25 0.012 0.92
Month10 0.033 2.65*** 0.030 2.41** 0.028 2.22** 0.038 2.75***
Month11 0.033 2.72*** 0.031 2.49** 0.029 2.34** 0.038 2.77***
Month12 0.039 3.21*** 0.037 2.96*** 0.035 2.88*** 0.044 3.25***
Month13 0.035 2.93*** 0.033 2.72*** 0.030 2.49** 0.040 2.97***
Month14 0.051 4.18*** 0.049 3.95*** 0.046 3.69*** 0.056 4.10***
Month15 0.061 5.03*** 0.059 4.77*** 0.055 4.50*** 0.064 4.73***
Month16 0.085 7.06*** 0.083 6.73*** 0.079 6.47*** 0.087 6.39***
Month17 0.105 8.65*** 0.100 8.16*** 0.099 8.09*** 0.106 7.81***
Type1 -0.019 -4.14*** 0.007 1.61 N/A N/A N/A N/A Type3 0.000 0.09 -0.019 -4.38*** N/A N/A N/A N/A Type4 -0.007 -0.67 0.018 2.27** N/A N/A N/A N/A Type5 0.142 6.13*** 0.380 29.3*** N/A N/A N/A N/A R Square 0.983 0.983 0.983 0.979
N 6973 6973 6973 6973
Hedonic model of property tax page 34 of 37
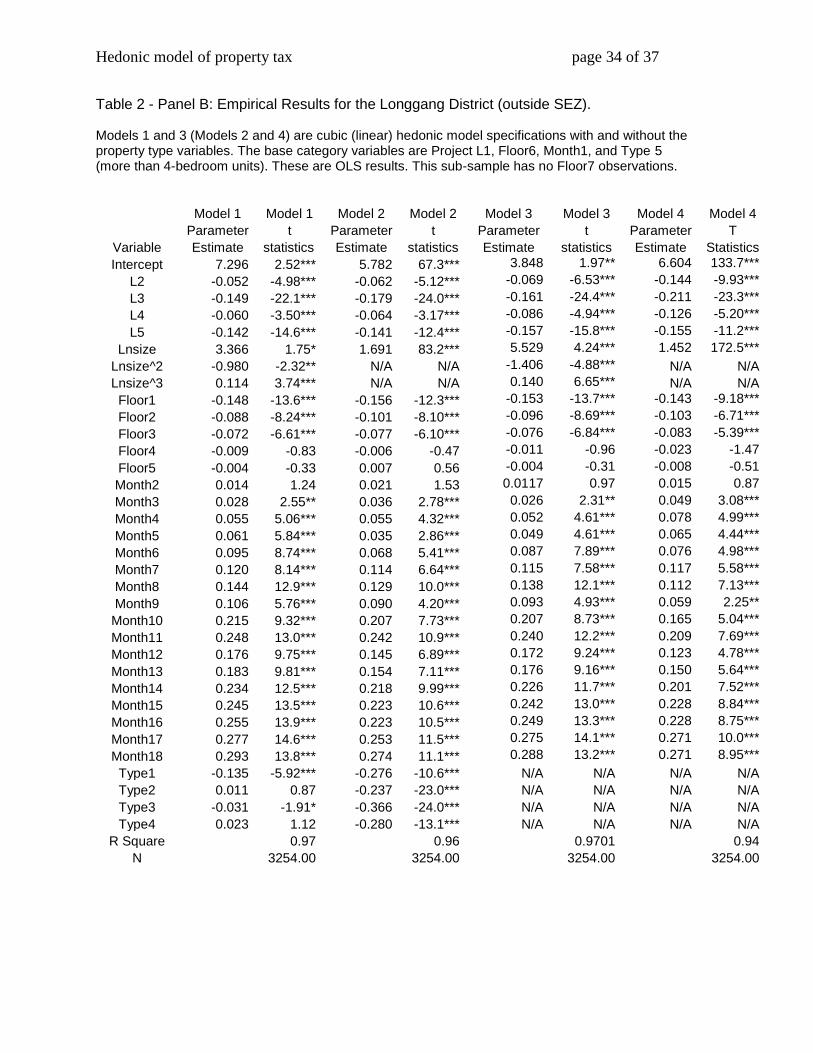
Table 2 - Panel B: Empirical Results for the Longgang District (outside SEZ). Models 1 and 3 (Models 2 and 4) are cubic (linear) hedonic model specifications with and without the property type variables. The base category variables are Project L1, Floor6, Month1, and Type 5 (more than 4-bedroom units). These are OLS results. This sub-sample has no Floor7 observations.
Model 1 Model 1 Model 2 Model 2 Model 3 Model 3 Model 4 Model 4
Parameter t Parameter t Parameter t Parameter T
Variable Estimate statistics Estimate statistics Estimate statistics Estimate Statistics
Intercept 7.296 2.52*** 5.782 67.3*** 3.848 1.97** 6.604 133.7***
L2 -0.052 -4.98*** -0.062 -5.12*** -0.069 -6.53*** -0.144 -9.93***
L3 -0.149 -22.1*** -0.179 -24.0*** -0.161 -24.4*** -0.211 -23.3***
L4 -0.060 -3.50*** -0.064 -3.17*** -0.086 -4.94*** -0.126 -5.20***
L5 -0.142 -14.6*** -0.141 -12.4*** -0.157 -15.8*** -0.155 -11.2***
Lnsize 3.366 1.75* 1.691 83.2*** 5.529 4.24*** 1.452 172.5***
Lnsize^2 -0.980 -2.32** N/A N/A -1.406 -4.88*** N/A N/A
Lnsize^3 0.114 3.74*** N/A N/A 0.140 6.65*** N/A N/A
Floor1 -0.148 -13.6*** -0.156 -12.3*** -0.153 -13.7*** -0.143 -9.18***
Floor2 -0.088 -8.24*** -0.101 -8.10*** -0.096 -8.69*** -0.103 -6.71***
Floor3 -0.072 -6.61*** -0.077 -6.10*** -0.076 -6.84*** -0.083 -5.39***
Floor4 -0.009 -0.83 -0.006 -0.47 -0.011 -0.96 -0.023 -1.47
Floor5 -0.004 -0.33 0.007 0.56 -0.004 -0.31 -0.008 -0.51
Month2 0.014 1.24 0.021 1.53 0.0117 0.97 0.015 0.87
Month3 0.028 2.55** 0.036 2.78*** 0.026 2.31** 0.049 3.08***
Month4 0.055 5.06*** 0.055 4.32*** 0.052 4.61*** 0.078 4.99***
Month5 0.061 5.84*** 0.035 2.86*** 0.049 4.61*** 0.065 4.44***
Month6 0.095 8.74*** 0.068 5.41*** 0.087 7.89*** 0.076 4.98***
Month7 0.120 8.14*** 0.114 6.64*** 0.115 7.58*** 0.117 5.58***
Month8 0.144 12.9*** 0.129 10.0*** 0.138 12.1*** 0.112 7.13***
Month9 0.106 5.76*** 0.090 4.20*** 0.093 4.93*** 0.059 2.25**
Month10 0.215 9.32*** 0.207 7.73*** 0.207 8.73*** 0.165 5.04***
Month11 0.248 13.0*** 0.242 10.9*** 0.240 12.2*** 0.209 7.69***
Month12 0.176 9.75*** 0.145 6.89*** 0.172 9.24*** 0.123 4.78***
Month13 0.183 9.81*** 0.154 7.11*** 0.176 9.16*** 0.150 5.64***
Month14 0.234 12.5*** 0.218 9.99*** 0.226 11.7*** 0.201 7.52***
Month15 0.245 13.5*** 0.223 10.6*** 0.242 13.0*** 0.228 8.84***
Month16 0.255 13.9*** 0.223 10.5*** 0.249 13.3*** 0.228 8.75***
Month17 0.277 14.6*** 0.253 11.5*** 0.275 14.1*** 0.271 10.0***
Month18 0.293 13.8*** 0.274 11.1*** 0.288 13.2*** 0.271 8.95***
Type1 -0.135 -5.92*** -0.276 -10.6*** N/A N/A N/A N/A
Type2 0.011 0.87 -0.237 -23.0*** N/A N/A N/A N/A
Type3 -0.031 -1.91* -0.366 -24.0*** N/A N/A N/A N/A
Type4 0.023 1.12 -0.280 -13.1*** N/A N/A N/A N/A
R Square 0.97 0.96 0.9701 0.94
N 3254.00 3254.00 3254.00 3254.00

Hedonic model of property tax page 35 of 37
Table 3: Estimates of Price Elasticity. These results are based on the estimates of the non-linear cubic hedonic model without the type variables. The arc elasticity computations equal percent change in predicted price divided by percent change in size.
Futian (inside SEZ) Longgang (outside SEZ)
size (sq meters) Price-hat elasticity Price-hat elasticity
10 38,318 66,880
20 108,109 1.82 137,898 1.06
30 175,967 1.26 193,646 0.81
40 240,202 1.10 246,687 0.82
50 301,983 1.03 302,235 0.90
60 362,427 1.00 362,941 1.00
70 422,371 0.99 430,547 1.12
80 482,428 1.00 506,461 1.23
90 543,050 1.01 591,985 1.35
100 604,586 1.02 688,418 1.47
110 667,307 1.04 797,107 1.58
>110 1,000,961 1.04 1,195,660 1.58

Hedonic model of property tax page 36 of 37
Table 4: Equilibrium Tax Collections under a Progressive Property Tax
Assumed parameters of the model:
capitalization rate 4.0% 4.0% 7.5% 7.5% 4.0% 4.0% 7.5% 7.5%
% capitalized 30.0% 90.0% 30.0% 90.0% 30.0% 90.0% 30.0% 90.0%
progressivity (max tax rate) 1.0% 1.0% 1.0% 1.0% 2.0% 2.0% 2.0% 2.0%
Futian
Estimated Annual Tax Collected (millions of Yuan) 49.1 42.5 50.6 47.1 91.6 83.4 97.7 83.8
Longgang
Estimated Annual Tax Collected (millions of Yuan) 139.6 127.4 142.4 135.9 267.0 218.4 278.4 252.4
Two areas Combined
Estimated Annual Tax Collected (millions of Yuan) 188.7 169.9 193.0 183.0 358.6 301.8 376.1 336.2
Projected from two areas to all Shenzhen
Estimated Annual Tax Collected (millions of Yuan) 421.2 379.2 430.8 408.5 800.4 673.7 839.5 750.4
Other real estate taxes (billions of RMB), 2000 Proposed property tax collections as a % of all real estate taxes
6.839 6.2% 5.5% 6.3% 6.0% 11.7% 9.9% 12.3% 11.0%
Notes: The capitalization rates are based on the deposit rate (4%) and the lending rate (7.5%) in China. The percent of the tax capitalized (negatively) into value is estimated from US studies. Progressivity is under the control of taxing authorities. Projections to all Shenzhen are based on China Census 2000 (Table7-2,p. 98-99, reference A), which shows that Futian (Longgang) had 20.6% (24.2%) of all Shenzhen family housing units greater than 50 square meters, and authors‟ own calculations.

Hedonic model of property tax page 37 of 37