Health Impact Scale for Air Quality Improvements in the ...
47
Prepared for Metro Vancouver Document type Report Date May 16, 2019 HEALTH IMPACT SCALE FOR AIR QUALITY IMPROVEMENTS IN THE CANADIAN LOWER FRASER VALLEY AIRSHED
Transcript of Health Impact Scale for Air Quality Improvements in the ...

Prepared for
Metro Vancouver
Document type
Report
Date
May 16, 2019
HEALTH IMPACT SCALE FOR AIR
QUALITY IMPROVEMENTS IN THE
CANADIAN LOWER FRASER VALLEY
AIRSHED

Ramboll Canada Inc.
Ramboll 2400 Meadowpine Boulevard Suite 100 Mississauga, ON L5N 6S2 Canada T +1 289 290 0600 F + 1 905 821 3711 https://ramboll.com
HEALTH IMPACT SCALE FOR AIR QUALITY IMPROVEMENTS IN THE CANADIAN LOWER FRASER VALLEY AIRSHED
Project name Health Impact Scale for Air Quality Improvements in the Canadian Lower
Fraser Valley Airshed Project no. 324000335 Recipient Metro Vancouver Document type Report Version 1 Date May 16, 2019 Prepared by Mike Jammer PEng; Rakesh Singh PhD, PEng; Sonja Sax ScD Checked by Paul Geisberger, PEng Approved by Paul Geisberger, PEng
Notice to Reader:
This report has been reviewed by representatives of Metro Vancouver, who commissioned the study, but the interpretation of the results, as expressed, in the report, is entirely the responsibility of the consultant authors and does not imply endorsement of specific points of view by Metro Vancouver. The findings and conclusions expressed in the report are the opinion of the authors of the study and may not necessarily be supported by Metro Vancouver.
Any use by a third party of the information presented in this report, or any reliance on or decisions based on such information, is solely the responsibility of such third party.

Ramboll - Health Impact Scale for Air Quality Improvements in the Canadian Lower Fraser Valley Airshed
CONTENTS
Executive Summary 1 1. Introduction 7 1.1 Background 7 1.2 Objectives 7 1.3 Limitations 8 2. Development of the health Impact Scale 9 2.1 Criteria Air Contaminants (CACs) 10 2.1.1 Health Benefits Valuation of Air Quality Reductions 10 2.1.2 Air Quality and Annual Emissions 13 2.2 Hazardous Air Pollutants 19 2.2.1 Health Benefits Valuation of Air Quality Reductions 19 2.2.2 Air Quality and Annual Emissions 20 2.3 Health Impact Scale 22 3. Sensitivity Analysis of Impact Scale 26 3.1 Example Policies and Program Actions 26 3.2 Sensitivity Analysis and Scenarios 26 3.3 Discussion of Sensitivity 26 4. Discussion and Recommendations 32
Appendix A. Emission – Concentration Correlations

Ramboll - Health Impact Scale for Air Quality Improvements in the Canadian Lower Fraser Valley Airshed
1/32
EXECUTIVE SUMMARY
Metro Vancouver’s Integrated Air Quality and Greenhouse Gas Management Plan (IAQGGMP), adopted by the Metro Vancouver Board of Directors in 2011, establishes three goals related to Metro Vancouver’s authority to manage air quality: 1. protect public health and the environment, 2. improve visual air quality, and 3. minimize the region’s contribution to global climate change. The IAQGGMP includes 81 actions to support these goals. Although all of the actions have the potential to contribute toward achieving one or more of the three goals listed above, a formal analytical framework was not developed to rank or prioritize actions. It is increasingly important for air quality management agencies to consider the cumulative health impacts of different air contaminants, their sources and ambient concentrations. A broader evaluation of the health impacts associated with key criteria air contaminants and hazardous air pollutants could inform planning decisions so that Metro Vancouver focuses policy and program development on actions expected to yield the most public health benefits in the region. The goal of this study was to develop a relative health impact scale that indicates how changes in emissions of different air contaminants impact public health in the Canadian portion of the Lower Fraser Valley (LFV). Metro Vancouver shares the LFV airshed with the Fraser Valley Regional District to the east and Whatcom County in the State of Washington to the south. The health impact scale was designed for the following uses:
1. To support prioritization of actions in Metro Vancouver’s next air quality and greenhouse gas management plan;
2. To support other future air quality regulatory development initiatives such as evaluation of fees and regulatory impact assessments; and
3. To evaluate air quality improvements at a regional scale. The study does not consider other impacts from air contaminants, including impacts on vegetation, agriculture, visual air quality, material degradation and climate change. The ambient air contaminants considered in the study included criteria air contaminants (CACs) and hazardous air pollutants (HAPs, or air toxics) shown in Table ES-1.

Ramboll - Health Impact Scale for Air Quality Improvements in the Canadian Lower Fraser Valley Airshed
2/32
Table ES-1 Ambient Air Contaminants Considered for the Health Impact Scale
Criteria Air Contaminants (CACs) Hazardous Air Pollutants (HAPs)
Fine particulate matter (PM2.5) 1,3-butadiene
Nitrogen dioxide (NO2) Benzene
Carbon monoxide (CO) Carbon tetrachloride
Sulphur dioxide (SO2) Chromium VI
Secondarily formed ozone (O3) and precursors Diesel particulate matter (DPM)
Formaldehyde
Exposure to ambient air concentrations of these air contaminants can potentially contribute to adverse human health effects, and have been documented to contribute to or be associated with one or more of the following adverse health endpoints shown in Table ES-2:
Table ES-2 Health Endpoint
Health Endpoints (1)
Acute Exposure Mortality Chronic Exposure Lung Cancer Mortality Acute Respiratory Symptom Days Chronic Exposure Respiratory Mortality Adult Chronic Bronchitis Cases Elderly Cardiac Hospital Admissions Asthma Symptom Days Minor Restricted Activity Days Cardiac Emergency Room Visits Respiratory Emergency Room Visits Cardiac Hospital Admissions Respiratory Hospital Admissions Child Acute Bronchitis Episodes Restricted Activity Days Chronic Exposure Cerebrovascular Mortality Non-fatal Cancer Chronic Exposure Ischemic Heart Disease Mortality
Notes: (1) Air contaminants have been associated with other health endpoints that are not listed in this table, including developmental, neurological, and cancers other than lung cancer.
The health impact of an action that results in a reduction in emissions of an air contaminant is dependent on:
• The change in ambient air quality that results from the reduction in emissions of that air contaminant; and
• The health impact associated with a change in population exposure due to that change in ambient air quality.
The health outcomes affected by air pollution vary by air contaminant, which makes it difficult to compare or sum the health benefits associated with emission reductions in multiple air contaminants. However, where the economic valuation (in dollars) of the health benefits can be determined, the impact of changes to multiple air contaminants can be assessed as the simple sum of the valuations associated with each air contaminant. In general, for each individual air contaminant with an emission reduction:

Ramboll - Health Impact Scale for Air Quality Improvements in the Canadian Lower Fraser Valley Airshed
3/32
For actions that involve reductions in emissions of multiple air contaminants, the overall impact of the action is the summation of the impacts of individual air contaminants:
The scope of this project did not support a rigorous assessment of ambient concentration changes and health benefits of multiple air contaminants through detailed dispersion and photochemical modelling and analysis of changes in population exposure. Instead, the relative health impact scale was developed based on existing information and studies related to air quality in the Canadian LFV and other jurisdictions. As a result, the estimates of health impacts used to develop the scale relied on simplifying assumptions that are described below. A sensitivity analysis was conducted to provide some information on the effect of these assumptions. For CACs, the relationships between emissions and ambient air concentrations were based on correlations between annual emission inventories and monitored ambient concentration in the Canadian LFV for the period 1995 to 2015. The valuation of health benefits was based on the Air Quality Benefits Assessment Tool (AQBAT), Version 2a, developed by, and available from, Health Canada. Valuations were converted to 2017 dollars. For HAPs, the relationships between emissions and ambient air concentrations were based on the emission inventory and monitored (or estimated) ambient air concentrations for 2010, as documented in a previous study for Metro Vancouver (Sonoma, 2015). The valuation of health benefits was based on unit risk factors for developing cancer (from Health Canada or California Office of Environmental Health Hazard Assessment), and the associated valuation developed for non-fatal cancers used in the Bay Area Air Quality Management District multi-pollutant evaluation method (BAAQMD, 2016) converted to 2017 Canadian dollars.
Health Benefits Valuation of Air Quality ($/year)/Concentration
Health Benefits Valuation of Air Quality ($/year)/Concentration
=
Valuation of Health Benefits associated with reduction in
ambient concentrations
($/year)/(µg/m³) or ($/year)/ppm
× Reduction in ambient
concentrations per tonne of emission reduction
(µg/m³) / (tonne/year)
or ppm/(tonne/year)
Impact
$/year
= × Health Impact
Scale for Contaminant i
$/tonne
n
∑ i=1
Reduction in Emissions of
Contaminant i
tonnes/year
Health Impact Scale
$/tonne

Ramboll - Health Impact Scale for Air Quality Improvements in the Canadian Lower Fraser Valley Airshed
4/32
The health impact scale was developed as a dollar valuation in order to sum impacts from multiple health outcomes. Recognizing that it may often be useful to scale or rank impacts without specifying dollar values, a relative scale was specified that is proportional to the valuation. The health impact scale is given below in Table ES-3.
Table ES-3 Health Impact Scale by Air Contaminant Emitted
Air Contaminant Air Contaminant Type
Health Impact Scale Valuation ($/tonne) Relative Scale
Chromium VI HAP $14,153,000 32,714.5 PM2.5 CAC $356,822 824.8 VOC CAC $51,967 120.1 NOx CAC $30,324 70.1 1,3-Butadiene HAP $27,016 62.4 SOx CAC $19,844 45.9 Diesel PM HAP $16,370 37.8 Carbon tetrachloride HAP $6,514 15.1 Formaldehyde HAP $4,025 9.3 Benzene HAP $532 1.2 CO CAC $433 1.0
It is important to understand that the impact of any action is the product of the health impact scale (in $/tonne) and the reduction in emissions (in tonnes) associated with the action. While it may appear that the scale is dominated by chromium VI, total emissions of chromium VI were less than 42 kg in 2010, and potential reductions of emissions are expected to be in the order of 1 kg or less. In contrast, the potential reductions of other air contaminants are 3 to 6 orders of magnitude higher. As a result, the health and economic impacts of potential chromium VI reductions are relatively small compared to those of other air contaminants. The health impact scale was applied to ten example actions and associated emission reductions provided by Metro Vancouver. They were developed for demonstration purposes and do not necessarily represent expected Metro Vancouver policy directions. The valuation, relative impact, and resulting rank of each action are given in Table ES-4.

Ramboll - Health Impact Scale for Air Quality Improvements in the Canadian Lower Fraser Valley Airshed
5/32
Table ES-4 Valuation, Relative Impact and Rank by Actions
Actions Valuation Relative
Impact Rank Action No. Description of Action
8 Restrictions on wood burning appliances 438,000,000 309,212 1
10 Implementation of ECA 193,000,000 136,231 2
9 Impact of Nonroad Diesel Engine Emissions Regulation 36,100,000 25,480 3
6 Zero emission vehicle mandate 22,300,000 15,759 4
4 Heavy duty vehicle inspection maintenance program 16,900,000 11,927 5
5 Residential wood stove incentives 3,330,000 2,356 6
1 Apply California-style VOC limits for automotive refinishing products 2,600,000 1,836 7
3 Voluntary program to replace gasoline lawn eqmt 832,000 588 8
7 Heavy duty vehicle licensing program 772,000 545 9
2 Phase out CrVI emissions from miscellaneous industrial sources 22,400 16 10
An analysis was conducted to investigate the sensitivity of the overall impacts to changes in the impact scales of specific air contaminants. Metro Vancouver identified nine (9) alternate scenarios that each represent a change in the impact scale compared to the “Base Case” health impact scale documented in Section 2.
The sensitivity analysis found that, for the sample actions evaluated, valuations are dominated by, and significantly affected by, the value of a statistical life (currently $7,612,582 CAD 2017 dollars). However, the analysis also found that the resulting ranking of actions was relatively insensitive to the range of changes to the scale that were investigated. That is, the range of changes would have little effect on prioritization of actions. The scope of work did not allow for secondary formation of particulate matter to be incorporated into the impact scale.

Ramboll - Health Impact Scale for Air Quality Improvements in the Canadian Lower Fraser Valley Airshed
6/32
It is recommended that:
• Air contaminants formation and algorithms relating changes in ambient concentrations to changes in emissions used in this study should be further investigated.
• Formation of secondary PM2.5 should be further investigated Findings of the sensitivity analysis suggest that this could have an impact on valuations produced by the scale.
• Updating the health impact scale with outputs from the new version of AQBAT should be considered for the future. Changes in the AQBAT model may improve accuracy of CAC valuation, and provide more thorough treatment of a few HAPs. This project relied heavily on the current version of AQBAT (version 2a) for valuation of health impacts of CACs. Health Canada has indicated they are very close to release of a new version of AQBAT that includes modified concentration response functions and valuations. In addition, the new version includes some HAPs.
Ramboll - Health Impact Scale for Air Quality Improvements in the Canadian Lower Fraser Valley Airshed
7/32
1. INTRODUCTION
1.1 Background The Metro Vancouver Regional District (Metro Vancouver) is a regional district of 2.5 million residents, and has delegated authority for air quality management within its regional district boundaries. Metro Vancouver is situated within the Lower Fraser Valley (LFV) airshed – an international airshed shared with the Fraser Valley Regional District (FVRD) to the east and Whatcom County in the State of Washington to the south. As such, air quality management planning efforts address the international airshed to the extent possible, including collaboration with airshed partners in monitoring air quality, planning, and implementing improvement actions. Under its delegated authority, Metro Vancouver has adopted three regional air quality management plans since 1994. The current Integrated Air Quality and Greenhouse Gas Management Plan (IAQGGMP), adopted by Metro Vancouver’s Board of Directors in 2011, establishes three goals related to Metro Vancouver’s authority to manage air quality: 1. protect public health and the environment, 2. improve visual air quality, and 3. minimize the region’s contribution to global climate change. The IAQGGMP includes 81 actions to support these goals. Although all of the actions have the potential to contribute toward achieving one of the three goals listed above, a formal analytical framework was not developed to rank or prioritize actions. It is increasingly important for air quality management agencies to consider the cumulative health impacts of different air contaminants, their sources and ambient concentrations. A broader evaluation of the health impacts associated with key criteria air contaminants and hazardous air pollutants could inform planning decisions so that Metro Vancouver focuses policy and program development on actions expected to yield the most public health benefits in the region.
1.2 Objectives The goal of this study was to develop a relative health impact scale that indicates how changes in emissions of different air contaminants impact public health in the Canadian LFV. The health impact scale was designed for the following uses:
1. To support prioritization of actions in MV’s next air quality and greenhouse gas management plan;
2. To support other future air quality regulatory development initiatives such as evaluation of fees and regulatory impact assessments; and
3. To evaluate impacts at a regional scale. The study did not consider other impacts from air contaminants, including impacts on vegetation, agriculture, visual air quality, material degradation and climate change. Ideally, the impact scale would be a relative indication of health benefit per tonne of emissions, and would be developed for a priority list of air contaminants. A simple scale, presented in tabular format was desired to allow relatively straightforward application for a range of purposes.

Ramboll - Health Impact Scale for Air Quality Improvements in the Canadian Lower Fraser Valley Airshed
8/32
The air contaminants considered included the criteria air contaminants (CACs) and hazardous air pollutants (HAPs, or air toxics) identified and prioritized by MV and subject to availability of information. The final list of air contaminants developed in consultation with Metro Vancouver is given in Table 1. The study focused predominantly on CACs and ground-level ozone that are input to AQBAT Version 2a. The selected HAPs have been associated with some of the highest cancer risks in past risk assessments for the Metro Vancouver area (e.g., Sonoma, 2015; Levelton, 2007).
Table 1 Ambient Air Contaminants Considered for the Health Impact Scale
Criteria Air Contaminants (CACs) Hazardous Air Pollutants (HAPs)
Fine particulate matter (PM2.5) 1,3-butadiene
Nitrogen dioxide (NO2) Benzene
Carbon monoxide (CO) Carbon tetrachloride
Sulphur dioxide (SO2) Chromium VI
Secondarily formed ozone (O3) and precursors Diesel particulate matter (DPM)
Formaldehyde
1.3 Limitations The scope of this project did not support a rigorous assessment of ambient concentration changes and health benefits of multiple air contaminants through detailed modelling and analysis. Instead, the relative health impact scale was developed based on existing information and studies related to air quality in the LFV and other jurisdictions. As a result, the estimates of health impacts used to develop the scale relied on numerous simplifying assumptions. These assumptions are described herein, and users of the health impact scale are advised to consider how these assumptions may affect the scale for any specific use. A sensitivity analysis (see Section 3) provides some information on the effect of these assumptions. This project relied heavily on the current version of AQBAT (version 2a) for valuation of health impacts of CACs. Health Canada has indicated they are very close to release of a new version of AQBAT that includes modified concentration response functions and valuations. In addition, the new version includes some HAPs. Updating the health impact scale with outputs from the new version of AQBAT should be considered for the future. Changes in the AQBAT model may improve accuracy of the CAC valuation, and provide more thorough treatment of a few HAPs.

Ramboll - Health Impact Scale for Air Quality Improvements in the Canadian Lower Fraser Valley Airshed
9/32
2. DEVELOPMENT OF THE HEALTH IMPACT SCALE
The health impact of a reduction in emissions of an air contaminant is dependent on: • The change in ambient air quality that results from the reduction in emissions of that air
contaminant; and • The health benefits associated with that change in ambient air quality.
The health outcomes affected by air pollution vary by air contaminant, which makes it difficult to compare or sum the health benefits associated with emissions reductions from multiple air contaminants. However, where the economic valuation (in dollars) of the health benefits can be determined, the impact of changes to multiple air contaminants can be assessed as the sum of the valuations associated with each air contaminant. In general, for each individual air contaminant with an emission reduction:
For actions that involve reductions in emission of multiple air contaminants, the overall impact of the action is the summation of the impacts of individual air contaminants:
The following sections outline the development of the two basic components of the Health Impact Scale – the relationships between air quality and emissions, and the relationships between valuation of health benefits and air quality. The criteria air contaminants (CACs) and hazardous air pollutants (HAPs) are discussed separately since the data sources and methodologies are unique to each.
Health Benefits Valuation of Air Quality ($/year)/Concentration
Health Benefits Valuation of Air Quality ($/year)/Concentration
=
Valuation of Health Benefits associated with reduction in
ambient concentrations
($/year)/(µg/m³) or ($/year)/ppm
× Reduction in ambient
concentrations per tonne of emission reduction
(µg/m³) / (tonne/year)
or ppm/(tonne/year)
Impact
$/year = ×
Health Impact Scale for
Contaminant i
$/tonne
n
∑ i=1
Health Impact Scale
$/tonne
Reduction in Emissions of
Contaminant i
tonnes/year

Ramboll - Health Impact Scale for Air Quality Improvements in the Canadian Lower Fraser Valley Airshed
10/32
2.1 Criteria Air Contaminants (CACs)
2.1.1 Health Benefits Valuation of Air Quality Reductions The health benefits valuation associated with reduced air contaminant concentrations for CACs was derived using the Air Quality Benefits Assessment Tool (AQBAT) version 2a, developed by and available from Health Canada. AQBAT contains databases to complete health benefits valuations across Canada down to the Census Division (CD) level. AQBAT estimates the human health impacts from changes in ambient air contaminant concentrations. It does not consider any microenvironment of human exposure or human activity in the analysis. The Canadian Lower Fraser Valley encompasses two CDs (Table 2) that were considered in the development of the impact scale.
Table 2 Census Divisions in the Canadian Lower Fraser Valley
Census Division AQBAT Census Division ID Metro Vancouver (MV) 418 Fraser Valley Regional District (FVRD) 417
AQBAT has a total of 18 health endpoints (or outcomes) associated with ambient concentrations of CACs. While AQBAT is capable of Monte Carlo simulation to determine uncertainty in overall health benefits valuation, this was not completed for derivation of the impact scale. Instead, the central value was extracted to develop the impact scale. The central value represents the health benefits resulting if mean input parameters are used in the AQBAT equations deterministically, and using the annual average concentration metric which, for AQBAT, is either the daily 1h maximum concentration (1-h daily max) or daily average concentration. Therefore, either the annual average of the daily 1h maximum or annual average concentration is required. Table 3 summarizes AQBAT health endpoints and corresponding air contaminant and concentration metrics.

Ramboll - Health Impact Scale for Air Quality Improvements in the Canadian Lower Fraser Valley Airshed
11/32
Table 3 AQBAT Input Concentration Metrics by Air Contaminant and Endpoint
Health Endpoint
Input Concentration Metric by Air Contaminant
Annual Average Annual Average of Daily 1h Max
Acute Exposure Mortality CO (ppm) NO2 (ppb) SO2 (ppb)
O3 (ppb)
Acute Respiratory Symptom Days PM2.5 (µg/m³) O3 (May-Sep) (ppb) Adult Chronic Bronchitis Cases PM2.5 (µg/m³) — Asthma Symptom Days PM2.5 (µg/m³) — Cardiac Emergency Room Visits PM2.5 (µg/m³) — Cardiac Hospital Admissions PM2.5 (µg/m³) — Child Acute Bronchitis Episodes PM2.5 (µg/m³) — Chronic Exposure Cerebrovascular Mortality PM2.5 (µg/m³) — Chronic Exposure Ischemic Heart Disease Mortality PM2.5 (µg/m³) —
Chronic Exposure Lung Cancer Mortality PM2.5 (µg/m³) — Chronic Exposure Respiratory Mortality PM2.5 (µg/m³) O3 (May-Sep) (ppb) Elderly Cardiac Hospital Admissions — CO (ppm) Minor Restricted Activity Days — O3 (May-Sep) (ppb) Respiratory Emergency Room Visits PM2.5 (µg/m³) O3 (May-Sep) (ppb) Respiratory Hospital Admissions PM2.5 (µg/m³) O3 (May-Sep) (ppb) Restricted Activity Days PM2.5 (µg/m³) —
The valuations resulting from AQBAT in 2010 dollars were converted to 2017 currency using the consumer price index (CPI) since the 2018 CPI was not available. Thus, all valuations are presented in 2017 Canadian dollars. The valuation of each endpoint is based on the mean or central value as listed in AQBAT and is summarized in Table 4 . In AQBAT Version 2a there is no valuation for Cardiac Hospital Admissions and Respiratory Hospital Admissions. The valuations are based on social welfare, that is, they attempt to measure the impact on overall quality of life, not just the costs of medical care. Therefore, these valuation estimates include not only the costs of medication and the cost of medical treatment, but also the value of lost productivity, lost income due to illness, or an equivalent loss of “productivity” for students who miss school or for care givers that take care of sick children, and an estimate of the value of the pain and suffering of the illness. The valuation for mortality dominates the health effects valuation. For mortality, AQBAT uses the value of a statistical life (VSL). This is not a dollar value on individual lives. Rather, the estimate is generated from studies of how much people are willing to pay for small reductions in their risks of dying from adverse health conditions that may be caused by environmental pollution. This approach is also used by US EPA (e.g., US EPA, 2000).1
1 United States, Environmental Protection Agency, Guidelines for Preparing Economic Analyses, September 2000

Ramboll - Health Impact Scale for Air Quality Improvements in the Canadian Lower Fraser Valley Airshed
12/32
Table 4 AQBAT Valuation per Health Outcome
Health Endpoint Valuation per Outcome (2017 CAD)
Acute Exposure Mortality 7,612,582 Chronic Exposure Cerebrovascular Mortality 7,612,582 Chronic Exposure Ischemic Heart Disease Mortality 7,612,582 Chronic Exposure Lung Cancer Mortality 7,612,582 Chronic Exposure Respiratory Mortality 7,612,582 Adult Chronic Bronchitis Cases 390,036 Elderly Cardiac Hospital Admissions 7,505 Cardiac Emergency Room Visits 6,350 Respiratory Emergency Room Visits 2,886 Child Acute Bronchitis Episodes 455 Asthma Symptom Days 75 Restricted Activity Days 69 Minor Restricted Activity Days 32 Acute Respiratory Symptom Days 19 Cardiac Hospital Admissions n/a Respiratory Hospital Admissions n/a
AQBAT was run by specifying changes to the annual average concentration metrics for each census division using a population projection scenario for the year 2018 that matches the 2016 Census closest2. AQBAT provided the annual valuation directly for the difference in the annual average concentration metric. The calculation of the number of health outcomes associated with a change in concentration and the appropriate valuation of each endpoint was calculated by AQBAT, accounting for the base rates of each endpoint and population in the Metro Vancouver and FVRD census divisions individually. The annual valuation for each endpoint and air contaminant was divided by the concentration difference to produce a valuation for a unit change in each associated metric. It was assumed in developing the health impact scale that the valuations are linear over a range of concentration differences for these values. The resulting valuations of health benefits associated with reductions in ambient air concentrations of air contaminants are given in Table 5 for both Metro Vancouver and FVRD. The valuations estimated for FVRD are much smaller than those for Metro Vancouver because of the small population size.
2 AQBAT Population Projection Scenario 1 has populations of 309,752 and 2,548,689 for FVRD and MV respectively.

Ramboll - Health Impact Scale for Air Quality Improvements in the Canadian Lower Fraser Valley Airshed
13/32
Table 5 AQBAT Valuation per unit reduction in ambient concentration of Criteria Air Contaminants
AQBAT Pollutant
Annual Average Concentration Metric
Annual Valuation (2017 CAD) per Unit Reduction in Annual Average Concentration Metric
Metro Vancouver
FVRD Units
CO 1h daily max CO (ppm) 3,586,640 494,060 ($/yr) / (ppm CO) CO 24 h CO (ppm) 292,561,156 38,914,658 ($/yr) / (ppm CO) NO2 24 h NO2 (ppb) 115,188,340 15,321,633 ($/yr) / (ppb NO2) O3 1h daily max O3 (ppb) 129,196,017 17,184,847 ($/yr / (ppb O3) O3 1h daily max O3 (May-
Sep) (ppb) 57,815,261 7,785,684 ($/yr) / (ppb O3 (May-
Sep)) PM2.5 24 h PM2.5 (µg/m³) 1,158,407,202 153,437,355 ($/yr) / (µg/m³ PM2.5) SO2 24 h SO2 (ppb) 70,708,570 9,405,212 ($/yr) / (ppb SO2)
2.1.2 Air Quality and Annual Emissions In order to develop an impact scale in the units of dollars per tonne of air contaminant emitted, a relationship between emissions and ambient air quality is required. The scope of this project did not support detailed air quality dispersion modelling and photochemical modelling studies. Instead, the relationship was based on existing information and studies related to historical emission inventory and ambient air quality in the Canadian LFV and other jurisdictions. As a result, several simplifying assumptions were applied to provide a means of estimating the air quality changes associated with emission reduction. Relationships between annual emissions in the Canadian LFV and ambient air concentrations were developed using linear regression with annual emission inventory data and ambient monitoring data for the period 1995 to 2015. The study relied on emission inventories and ambient air quality data documented by Metro Vancouver. Emission inventories for the Canadian LFV were available from 1995 to 2015 at 5 year intervals (i.e. 1995, 2000, 2005, 2010 and 2015).3 The data gaps between the emission inventory years were filled using the trends observed in the British Columbia emission inventories, which are available annually through the same period.4 It was assumed that emissions in the Canadian LFV inventory will follow the same trend as changes in the BC inventory. Table 6 presents the emission inventories after data gaps have been filled.
3 John Lindner. Personal Communication, Metro Vancouver. 2018 4 National Pollutant Release Inventory online search. Last accessed Dec 2018 https://pollution-waste.canada.ca/air-emission-inventory/?GoCTemplateCulture=en-CA

Ramboll - Health Impact Scale for Air Quality Improvements in the Canadian Lower Fraser Valley Airshed
14/32
Table 6 Annual Emissions in the Canadian LFV (tonnes/year)
Year CO NOx PM2.5 SOx VOC 1995 504,550 94,983 10,496 11,181 102,290 1996 444,875 85,982 12,608 8,759 99,347 1997 430,279 88,285 11,787 9,128 97,909 1998 425,688 89,595 10,766 9,131 96,897 1999 383,621 90,959 10,020 9,283 91,392 2000 365,002 90,244 9,503 9,408 87,145 2001 383,494 77,635 9,332 8,173 90,872 2002 359,615 79,256 8,747 7,366 88,561 2003 346,628 73,831 8,699 7,328 87,259 2004 341,541 76,167 8,734 7,718 85,839 2005 285,384 71,508 8,511 7,269 77,381 2006 265,098 66,189 7,092 6,739 79,503 2007 253,520 65,597 7,249 6,650 76,659 2008 230,961 63,456 7,176 6,679 72,723 2009 225,249 58,759 6,856 6,604 68,889 2010 211,909 58,898 6,978 6,669 68,421 2011 210,219 49,100 5,507 2,420 67,078 2012 217,801 49,484 6,064 2,479 66,206 2013 199,242 50,936 5,659 2,582 66,880 2014 199,562 51,116 5,616 2,579 65,440 2015 193,007 49,807 5,267 1,619 65,408
Ambient air concentrations for Metro Vancouver and FVRD were based on monitored data for the period 1995 to 2015. For each CD, ambient air concentrations were considered to be uniform across the CD. The concentration for each CD was assumed to be the average concentration reported by all monitoring stations within the CD.3 The Tapered Element Oscillating Microbalance (TEOM) was used to measure ambient PM2.5 hourly concentrations from 1996 to 2012. Starting in 2013, ambient PM2.5 concentrations were measured using the Federal Equivalent Method (FEM) Synchronized Hybrid Ambient Real-time Particulate (SHARP). These two methods yield different results. In order to use the data in a multi-year regression, consistent measurements are needed, so the 2013 to 2015 SHARP data was adjusted to TEOM equivalent PM2.5 values. A recent study5 completed by Ontario Ministry of the Environment and Climate Change (Ontario MOECC) and Environment and Climate Change Canada (ECCC) developed a simplified approach to correct historical TEOM data for reporting long-term PM2.5 trends in Ontario. These results were assumed to be valid for the Canadian LFV, and were applied to 2013-2015 SHARP PM2.5 measurement data. The following relationship was used:
5 Yushan Su, Uwayemi Sofowote,, Jerzy Debosz, Luc White and Anthony Munoz. Multi-Year Continuous PM2.5 Measurements with the Federal Equivalent Method SHARP 5030 and Comparisons to Filter-Based and TEOM Measurements in Ontario, Canada. Atmosphere 2018, 9, 191

Ramboll - Health Impact Scale for Air Quality Improvements in the Canadian Lower Fraser Valley Airshed
15/32
• Warm months (May to September): [Concentration]TEOM = [Concentration]SHARP / 1.08 • Cold months (October to April): [Concentration]TEOM = ([Concentration]SHARP - 1.09)/1.34
Metro Vancouver conducted a separate comparison using ambient monitoring data from TEOM and SHARP units co-located at monitoring stations in Metro Vancouver; this comparison produced similar relationships using an annual basis.3
The average ambient concentrations for each air contaminant with health outcomes predicted by AQBAT are provided in Appendix A for both Metro Vancouver and FVRD for the period 1995 to 2015. For PM2.5, ambient concentrations for 2013 to 2015 in the Appendix have been adjusted to reflect TEOM type measurement. Linear regression was used to establish relationships between average ambient concentration in each CD (the dependent variable), and emissions of air contaminants in the Canadian LFV (the independent variable). Variables used in the regressions are given in Table 7. The slope of the resulting linear relationship represents the change in ambient concentration resulting from a unit change in emissions. Ambient air concentrations of air contaminants in each CD were assumed to be a function of total emissions from both CDs rather than of the individual CDs. Emissions from Metro Vancouver are generally an order of magnitude higher than those of the Fraser Valley and, given the proximity, Fraser Valley concentrations cannot be considered to be independent of Metro Vancouver emissions.
Table 7 Regression Variables
Dependent Variable Independent Variable R2 for MV R2 for FVRD CO concentration CO emission 0.92 0.62 NO2 concentration NOX emission 0.84 0.63 PM2.5 concentration PM2.5 emission 0.58 SO2 concentration SO2 emission 0.81 0.71
(O3 + NOX) concentrations
(NOX + VOC) emissions 0.93 0.75
NOX concentration (O3 + NOX)
concentrations 0.65 0.54
Appendix A includes the emissions and concentration data that were used in each regression analysis. Refer to following tables and figures for the data and regression analysis: • Table A 1 CO emissions and annual 24-hour average ambient CO concentrations • Table A 2 SOx emissions and annual 24-hour average ambient SO2 concentrations • Table A 3 NOx emissions and annual average 24-hour ambient NO2 concentrations • Table A 4 PM2.5 emissions and annual 24-hour average ambient PM2.5 concentrations • Table A 5 NOx and VOC emissions and annual average ambient 1-hour max O3 + 24-hour NOx
concentrations • Figure A-1: CO emissions vs. annual 24-hour average ambient CO concentrations in MV • Figure A-2 CO emissions vs. annual 24-hour average ambient CO concentrations in FVRD

Ramboll - Health Impact Scale for Air Quality Improvements in the Canadian Lower Fraser Valley Airshed
16/32
• Figure A-3 SOx emissions vs. annual 24-hour average ambient SO2 concentrations in MV • Figure A-4 SOx emissions vs. annual 24-hour average ambient SO2 concentrations in FVRD • Figure A-5 NOx emissions vs. annual 24-hour average ambient NO2 concentrations in MV • Figure A-6 NOx emissions vs. annual 24-hour average ambient NO2 concentrations in FVRD • Figure A-7 PM2.5 emissions vs. annual 24-hour average ambient PM2.5 concentrations in
Canadian LFV (MV and FVRD) • Figure A-8 VOC + NOx emissions vs. annual average ambient 1-hour max O3 + 24-hour NOx
concentrations in MV • Figure A-9 VOC + NOx emissions vs. annual average ambient 1-hour max O3 + 24-hour NOx
concentrations in FVRD • Figure A-10 Annual average ambient 24-hour NOx concentrations vs. annual average ambient
1-hour max O3 + 24-hour NOx concentrations in MV • Figure A-11 Annual average ambient 24-hour NOx concentrations vs. annual average ambient
1-hour max O3 + 24-hour NOx concentrations in FVRD For each air contaminant, the relationship is plotted with resulting equation and R-squared value for the fit. The slope of the line represents the change of concentration for a unit change in emissions. R-square (coefficient of multiple determination for multiple regression) is a statistical measure to show how close the data are to the fitted regression line. 0% indicates that the model explains none of the variability of the response data around its mean while 100% indicates that the model explains all the variability of the response data around its mean. We aimed for R2 greater than 0.5. In the case of PM2.5 emissions and concentrations analysis, we could not obtain R2 > 0.5 for FVRD, therefore combined Metro Vancouver and FVRD data was considered. Concentrations of CO and SO2 result entirely from emissions of these air contaminants. The impact of background concentrations (i.e. resulting from emissions outside of the Canadian LFV) or atmospheric reactions creating or destroying these air contaminants were assumed to be negligible. Therefore, fits were forced through a Y-intercept of zero. For CO, AQBAT requires both the annual average concentration and the annual average of the maximum daily 1-hour concentration. The available monitoring data did not include the latter metric. Therefore, it was assumed that both metrics would change equally with a change in emissions. That is, the same slope was assumed to apply for both. Ambient ozone concentrations can be controlled only by controlling emissions of its precursors, such as VOC and oxides of nitrogen (NOx). Nitric oxide (NO) is both a precursor of O3 and a scavenger of O3. NO reacts with O3 and removes O3 from the air. However, nitrogen dioxide (NO2) is formed in this process which is a direct precursor of O3. This chemical transformation takes place while these air contaminants are transported by the winds, and continuously changing composition of O3, NO and NO2. Therefore, concentration of NO2 is dependent on the emissions of NOX and atmospheric reactions with O3 that affect the equilibrium concentrations of NO2 and NO. NO2 concentrations estimated as a function on NOX emissions showed good agreement, therefore NO2 concentrations in this study were estimated as a function of NOx emissions. Ambient concentrations of PM2.5 result from emissions of PM2.5 and secondary formation of PM2.5 from precursors such as VOC, NOX, SOX and ammonia (NH3). For this study, insufficient

Ramboll - Health Impact Scale for Air Quality Improvements in the Canadian Lower Fraser Valley Airshed
17/32
information was available to estimate concentration of secondary PM2.5 due to emissions of precursors, and PM2.5 concentration was treated as a function of PM2.5 emissions only. The regression resulted in a Y-intercept of 2.75 µg/m³, which suggests background concentration and secondary formation of PM2.5 is about 2.75 µg/m³. Average background concentration in BC was reported to be ~2 µg/m³ in 20056 which seems consistent with the regression. Concentration of PM2.5 due to secondary formation is dependent on photochemical reactions and, like background concentration, will be relatively constant over the Canadian LFV and should be similar for both CDs. Using the same Y-intercept for both CDs did not result in an acceptable fit for FVRD (i.e. R2<0.5). Therefore, a single regression was used that included data for both Metro Vancouver and FVRD. Ozone concentration is dependent on complex atmospheric reactions between precursors, mainly NOX and VOCs. For this study, a simplified approach was used to estimate the change in ozone concentration for any change in total precursor emissions (i.e. VOC and NOX). The relationship was established in three steps: 1. Regression analysis between the sum of O3 and NOX ambient concentrations (O3 + NO +
NO2) vs the sum of O3 precursors NOX and VOC emissions (NOX + VOC). As discussed above, chemical transformation and composition of O3 and NOx is continuously changing, and there is an inverse relationship between O3 and local NOx concentrations. Therefore, first we determined O3 and NOx concentrations present in the atmosphere for VOC and NOx emissions (i.e. O3 precursors). See Appendix figures A-8 and A-9;
2. Regression analysis between NOX ambient concentrations vs. the sum of O3 and NOX ambient concentrations (O3 + NOX) provided NOx concentration portions with a reasonable fit. See Appendix figures A-10 and A-11; and
3. Combine steps 1 and 2 to establish a direct relationship between O3 concentrations and NOx + VOC emissions.
After establishing a direct relationship between O3 formation and O3 precursors emissions from statistical models, we used information derived from comprehensive photochemistry modelling studies in the Canadian LFV. For example, a study on ozone formation in the Lower Fraser Valley7 found that the western part of the region is consistently VOC-limited while the eastern region is transitional. Based on this study it was assumed that the change in O3 formation on an annual basis will be primarily driven by VOC emissions in Metro Vancouver and by both NOx and VOC emissions in FVRD. Table 8 provides the relationships between change in emissions and ambient concentrations developed in this study.
6 Background Concentrations of PM2.5 and Ozone in British Columbia, Canada. Prepared by Ian G. McKendry, Geography/Atmospheric Science, The University of British Columbia. Prepared for the British Columbia Ministry of Environment March 2006. Last accessed December 2018 https://www2.gov.bc.ca/assets/gov/environment/air-land-water/air/reports-pub/background_pm25_ozone.pdf
7 Regional Ground-Level Ozone Strategy for the Canadian Lower Fraser Valley Region, April 2014. Last accessed December 2018 http://www.metrovancouver.org/services/air-quality/AirQualityPublications/RGLOS2014.pdf

Ramboll - Health Impact Scale for Air Quality Improvements in the Canadian Lower Fraser Valley Airshed
18/32
Table 8 Change in ambient CAC concentrations for a change in emissions
AQBAT Air contaminant
CD Averaging Period (hours)
Change in Annual Average Concentration Metric per Change in Annual Emissions
CO MV 1 1.34E-06 ppm CO / (tonnes CO/yr) CO MV 24 1.34E-06 ppm CO / (tonnes CO/yr) NO2 MV 24 2.04E-04 ppb NO2 / (tonnes NOX/yr) O3 MV 1 0 ppb O3 / (tonnes NOX/yr) O3 MV 1 2.46E-04 ppb O3 / (tonnes VOC/yr)
O3 (May-Sep) MV 1 0 ppb O3 (May-Sep) / (tonnes NOX/yr) O3 (May-Sep) MV 1 2.46E-04 ppb O3 (May-Sep) / (tonnes VOC/yr)
PM2.5 MV 24 2.72E-04 (µg/m³ PM2.5) / (tonnes PM2.5/yr) SO2 MV 24 2.72E-04 ppb SO2 / (tonnes SOX/yr) CO FVRD 1 9.08E-07 ppm CO / (tonnes CO/yr) CO FVRD 24 9.08E-07 ppm CO / (tonnes CO/yr) NO2 FVRD 24 1.45E-04 ppb NO2 / (tonnes NOX/yr) O3 FVRD 1 1.84E-04 ppb O3 / (tonnes NOX/yr) O3 FVRD 1 2.38E-04 ppb O3 / (tonnes VOC/yr)
O3 (May-Sep) FVRD 1 1.84E-04 ppb O3 (May-Sep) / (tonnes NOX/yr) O3 (May-Sep) FVRD 1 2.38E-04 ppb O3 (May-Sep) / (tonnes VOC/yr)
PM2.5 FVRD 24 2.72E-04 (µg/m³ PM2.5) / (tonnes PM2.5/yr) SO2 FVRD 24 6.50E-05 ppb SO2 / (tonnes SOX/yr)

Ramboll - Health Impact Scale for Air Quality Improvements in the Canadian Lower Fraser Valley Airshed
19/32
2.2 Hazardous Air Pollutants
2.2.1 Health Benefits Valuation of Air Quality Reductions AQBAT version 2a does not include hazardous air pollutants (HAPs). Therefore, a methodology for quantifying the health benefits associated with improved air quality from reductions in HAP concentrations was developed using data compiled for a previous risk assessment that was completed for Metro Vancouver (Sonoma, 2015).8 The following HAPs were selected for inclusion in the analyses based on Metro Vancouver priorities and information availability: 1,3-butadiene, benzene, carbon tetrachloride, chromium VI, diesel particulate matter (PM), and formaldehyde. These HAPs have been associated with some of the highest cancer risks in past risk assessments for the Metro Vancouver area (Sonoma, 2015; Levelton, 2007)8,9. The analysis focused on non-fatal cancer outcomes for the HAPs, as all the HAPs are primarily associated with cancer at lower air concentrations, this health outcome is also more easily quantified, and it is associated with the highest benefits (i.e., higher social welfare costs are associated with the treatment of non-fatal cancer). Other health outcomes such as neurological, reproductive, developmental may be associated with some of these HAPs, but the valuation for these health outcomes is not easily quantifiable. Fatal lung cancer impacts are evaluated for the CACs. Unit risk factors associated with developing cancer for each target HAP were taken from the Sonoma (2015) study. The unit risk factor is the probability of developing cancer at an exposure of 1 µg/m³ over a 70-year lifetime. Unit risk factors from Health Canada were used if available because they were considered most applicable in a Canadian context. Factors from the California Office of Environmental Health Hazard Assessment (OEHHA) were used for HAPs with no Health Canada factor. Unit risk factors used in the development of the impact scale are shown in Table 9.
Table 9 Cancer Unit Risk Factors
Hazardous Air Pollutant Unit Risk(a) (µg/m³)-1 Reference
1,3-Butadiene 0.00017 OEHHA
Benzene 0.0000033 Health Canada
Carbon tetrachloride 0.000042 OEHHA
Chromium VI 0.076 Health Canada
Diesel PM 0.0003 OEHHA
Formaldehyde 0.000006 OEHHA
Notes: (a) Unit risks are the individual lifetime (70 yr) cancer risk per 1 µg/m³ exposure 8 Toxic Air Pollutants Risk Assessment. Prepared by Sonoma Technology, Inc, Prepared for Metro Vancouver 2015. 9 Air Toxics Emission Inventory and Health Risk Assessment – Technical Appendix. Prepared by Levelton Consultants Ltd., Prepared for Greater Vancouver Regional District and Environment Canada 2007.

Ramboll - Health Impact Scale for Air Quality Improvements in the Canadian Lower Fraser Valley Airshed
20/32
A valuation of $4,949,041 per cancer case, expressed in 2017 Canadian dollars, was used in the analysis. This value was derived from the valuation for non-fatal cancers used in the Bay Area Air Quality Management District Multi-Pollutant Evaluation Method (BAAQMD, 2016) and was obtained from a review by McCubbin and Delucchi (1996)10. Like the AQBAT valuation, this value includes all welfare costs of cancer, such as medical costs, pain and suffering to both patients and friends, and the loss of production to society. The BAAQMD value of $3.7M (2015 USD) per cancer case was adjusted to 2017 CAD using the average 2015 exchange rate and the Canadian consumer price index. The annual social welfare costs associated with a 1 µg/m³ change in HAPs concentrations were calculated by applying the unit risk factors to the total population in Metro Vancouver and the FVRD respectively and dividing the result by 70 years to get an annual cost. 𝐴𝐴𝐴𝐴𝐴𝐴𝐴𝐴𝐴𝐴𝐴𝐴 𝑉𝑉𝐴𝐴𝐴𝐴𝐴𝐴𝐴𝐴𝑉𝑉𝑉𝑉𝑉𝑉𝐴𝐴 𝑝𝑝𝑝𝑝𝑝𝑝 µ𝑔𝑔 𝑚𝑚3⁄ = 𝐶𝐶𝑉𝑉𝐶𝐶𝑉𝑉 𝑝𝑝𝑝𝑝𝑝𝑝 𝑐𝑐𝐴𝐴𝐴𝐴𝑐𝑐𝑝𝑝𝑝𝑝 𝑐𝑐𝐴𝐴𝐶𝐶𝑝𝑝 × 𝑈𝑈𝐴𝐴𝑉𝑉𝑉𝑉 𝑅𝑅𝑉𝑉𝐶𝐶𝑅𝑅 (µ𝑔𝑔 𝑚𝑚3⁄ )−1 × 𝑇𝑇𝑉𝑉𝑉𝑉𝐴𝐴𝐴𝐴 𝑃𝑃𝑉𝑉𝑝𝑝𝐴𝐴𝐴𝐴𝐴𝐴𝑉𝑉𝑉𝑉𝑉𝑉𝐴𝐴 𝑉𝑉𝐴𝐴 𝐶𝐶𝐶𝐶 ÷ 70𝑦𝑦𝑝𝑝 Valuation of Health Benefits associated with reduction in ambient concentrations For consistency with the analysis for CACs, the populations for Metro Vancouver and FVRD used in the HAPs calculations were taken from AQBAT. An example calculation is provided for benzene for the Metro Vancouver census division: 𝐴𝐴𝐴𝐴𝐴𝐴𝐴𝐴𝐴𝐴𝐴𝐴 𝑉𝑉𝐴𝐴𝐴𝐴𝐴𝐴𝐴𝐴𝑉𝑉𝑉𝑉𝑉𝑉𝐴𝐴 𝑓𝑓𝑉𝑉𝑝𝑝 𝑏𝑏𝑝𝑝𝐴𝐴𝑏𝑏𝑝𝑝𝐴𝐴𝑝𝑝 𝑉𝑉𝐴𝐴 𝑀𝑀𝑉𝑉 = $4,949,041 × 0.0000033 (µ𝑔𝑔 𝑚𝑚3⁄ )−1 × 2,548,689 ÷ 70𝑦𝑦𝑝𝑝 𝐴𝐴𝐴𝐴𝐴𝐴𝐴𝐴𝐴𝐴𝐴𝐴 𝑉𝑉𝐴𝐴𝐴𝐴𝐴𝐴𝐴𝐴𝑉𝑉𝑉𝑉𝑉𝑉𝐴𝐴 𝑓𝑓𝑉𝑉𝑝𝑝 𝑏𝑏𝑝𝑝𝐴𝐴𝑏𝑏𝑝𝑝𝐴𝐴𝑝𝑝 𝑉𝑉𝐴𝐴 𝑀𝑀𝑉𝑉 = 594,639 ($ 𝑦𝑦𝑝𝑝) 𝑝𝑝𝑝𝑝𝑝𝑝 (⁄ µ𝑔𝑔 𝑚𝑚3⁄ ) The annual valuation per 1 µg/m³ reduction in long-term average HAPs concentrations for Metro Vancouver and FVRD associated with cancer, calculated using this equation, are shown in Table 10 .
Table 10 Valuation of Health Benefits Associated with Reduction in Ambient Concentrations
Hazardous Air Pollutant
Annual Health Benefits Valuation (2017 CAD) per µg/m³ Metro Vancouver FVRD
1,3-Butadiene $30,632,944 $3,722,940 Benzene $594,639 $72,269 Carbon tetrachloride $7,568,139 $919,785 Chromium VI $13,694,727,820 $1,664,373,068 Diesel PM $54,058,136 $6,569,894 Formaldehyde $1,081,163 $131,398
2.2.2 Air Quality and Annual Emissions The relationship between ambient concentrations and annual emissions in the Canadian Lower Fraser Valley for HAPs was derived using ambient concentration data and the HAP emission inventory.
10 McCubbin DR, and MA Delucchi, The social cost of the health effects of motor vehicle air pollution, Report #11 in the series: The annualized social cost of motor vehicle use in the United States, based on 1990-1991 data, Institute of Transportation Studies, University of California, Davis, August 1996

Ramboll - Health Impact Scale for Air Quality Improvements in the Canadian Lower Fraser Valley Airshed
21/32
Long-term average concentrations of HAPs in the Canadian LFV were documented for 2010 in a previous study for Metro Vancouver, “Toxics Air Pollutants Risk Assessment” (Sonoma, 2015). Toxic air pollutant is an equivalent term for HAP. Data from individual stations were averaged to produce an average concentration for the Metro Vancouver and FVRD census divisions, respectively, and the results are shown in Table 11. Concentration estimates for hexavalent chromium and diesel particulate matter were developed in the 2015 Sonoma Study as they were not measured directly by the monitoring network.
Table 11 Long-term average concentration (2010) for Hazardous Air Pollutants
Hazardous Air Pollutant
Long-term Average Concentration (µg/m³) Metro Vancouver FVRD
1,3-Butadiene 0.08775 0.05116 Benzene 0.82119 0.47010 Carbon tetrachloride 0.55240 0.55012 Chromium VI 0.00004 0.00002 Diesel PM 0.77750 0.65000 Formaldehyde 2.19748 1.56929
The 2010 emission inventory for HAPs in the Canadian LFV, developed and documented in the same study (Sonoma, 2015), was used as this represented the most recent emission inventory for HAPs in the Canadian LFV (Table 12 ).
Table 12 Hazardous Air Pollutant Emission Inventory (2010) for Canadian Lower Fraser Valley
Hazardous Air Pollutant Annual Emissions (tonnes/year)
1,3-Butadiene 104 Benzene 832 Carbon tetrachloride 2.8 Chromium VI 0.04172 Diesel PM 1451 Formaldehyde 512
Since only a single year of data was available, a regression analysis as was done for CACs could not be completed. Instead, background concentrations of the HAPs were taken into account by using remote concentration estimates (RCE) in the Northern Hemisphere for relevant HAPs from the Technical Support Document for EPA’s 2011 National-scale Air Toxics Assessment11. These values represent an estimate of the background concentration of HAPs in the Northern Hemisphere in 2011 and for the purposes of this study were assumed to be applicable to the Canadian LFV in 2010. The RCE values are given in Table 13 .
11 Table 7, 2011 NATA TSD, Accessed Nov 2018, https://digital.library.unt.edu/ark:/67531/metadc949443/m2/1/high_res_d/2011-nata-tsd.pdf

Ramboll - Health Impact Scale for Air Quality Improvements in the Canadian Lower Fraser Valley Airshed
22/32
Table 13 2011 Remote Concentration Estimate for Northern Hemisphere
Hazardous Air Pollutant Long-term average background concentration (µg/m³)
1,3-Butadiene 2.00E-03 Benzene 0.12 Carbon tetrachloride 0.55 Chromium VI 1.50E-06 Diesel PM No background Formaldehyde 0.43
The RCE was subtracted from the long-term average concentrations presented above and the difference was assumed to be the ambient concentration attributable to the emissions in the Canadian LFV. The change in long-term average concentration per change in Canadian LFV annual emissions was derived by then dividing this result for each census division by the annual emissions from Table 12 . The results are presented in Table 14 .
Table 14 Derived concentration change per change in annual emissions
Hazardous Air Pollutant
Concentration change per change in annual emissions (µg/m³) / (tonne/year)
MV FVRD 1,3-Butadiene 8.24E-04 4.73E-04 Benzene 8.43E-04 4.21E-04 Carbon tetrachloride 8.55E-04 4.32E-05 Chromium VI 9.74E-04 4.88E-04 Diesel PM 2.70E-04 2.70E-04 Formaldehyde 3.45E-03 2.23E-03
2.3 Health Impact Scale The relationships developed in the preceding sections were combined to provide the health impact scale. The valuation ($/tonne) for contaminant emitted resulting ambient air contaminant, and CD are presented in Table 15 . The valuations associated with emissions of each air contaminant for the two CDs are summed to define the health impact scale valuation for the Canadian LFV in Table 16 .

Ramboll - Health Impact Scale for Air Quality Improvements in the Canadian Lower Fraser Valley Airshed
23/32
Table 15 Summary of Valuations by Ambient Air Contaminant
Table 16 Health Impact Scale by Air Contaminant Emitted
Air Contaminant Air Contaminant Type
Health Impact Scale Valuation ($/tonne) Relative Scale
Chromium VI HAP $14,153,000 32,714.5 PM2.5 CAC $356,822 824.8 VOC CAC $51,967 120.1 NOx CAC $30,324 70.1 1,3-Butadiene HAP $27,016 62.4 SOx CAC $19,844 45.9 Diesel PM HAP $16,370 37.8 Carbon tetrachloride HAP $6,514 15.1 Formaldehyde HAP $4,025 9.3 Benzene HAP $532 1.2 CO CAC $433 1.0
CDValue Units Value Units Value Units
1.34E-06 ppm CO / (tonnes CO/yr) 296,147,796 ($/year)/(ppm CO) 397 $/tonne CO2.04E-04 ppb NO2 / (tonnes NOX/yr) 115,188,340 ($/year)/(ppb NO2) 23,498 $/ tonne NOx
- ppb O3 / (tonnes NOX/yr) 129,196,017 ($/year)/(ppb O3) - $/ tonne NOx2.46E-04 ppb O3 / (tonnes VOC/yr) 129,196,017 ($/year)/(ppb O3) 31,790 $/tonne VOC
- ppb O3 (May-Sep) / (tonnes NOX/yr) 57,815,261 ($/year)/(ppb O3 (May-Sep)) - $/ tonne NOx2.46E-04 ppb O3 (May-Sep) / (tonnes VOC/yr) 57,815,261 ($/year)/(ppb O3 (May-Sep)) 14,226 $/tonne VOC2.72E-04 (µg/m³ PM2.5) / (tonnes PM2.5/yr) 1,158,407,202 ($/year)/(µg/m³ PM2.5) 315,087 $/tonne PM2.52.72E-04 ppb SO2 / (tonnes SOX/yr) 70,708,570 ($/year)/(ppb SO2) 19,233 $/tonne SOX8.24E-04 (µg/m³) / (tonne/yr) 30,632,944 ($/year)/(µg/m³ ) 25,256 $/ tonne 1,3-Butadiene8.43E-04 (µg/m³) / (tonne/yr) 594,639 ($/year)/(µg/m³ ) 501 $/ tonne Benzene8.55E-04 (µg/m³) / (tonne/yr) 7,568,139 ($/year)/(µg/m³ ) 6,474 $/ tonne Carbon tetrachloride9.74E-04 (µg/m³) / (tonne/yr) 13,694,727,820 ($/year)/(µg/m³ ) 13,340,400 $/ tonne ChromiumVI2.70E-04 (µg/m³) / (tonne/yr) 54,058,136 ($/year)/(µg/m³ ) 14,596 $/ tonne Diesel PM3.45E-03 (µg/m³) / (tonne/yr) 1,081,163 ($/year)/(µg/m³ ) 3,732 $/ tonne Formaldehyde
9.08E-07 ppm CO / (tonnes CO/yr) 39,408,718 ($/year)/(ppm CO) 36 $/tonne CO1.45E-04 ppb NO2 / (tonnes NOX/yr) 15,321,633 ($/year)/(ppb NO2) 2,222 $/ tonne NOx1.84E-04 ppb O3 / (tonnes NOX/yr) 17,184,847 ($/year)/(ppb O3) 3,168 $/ tonne NOx2.38E-04 ppb O3 / (tonnes VOC/yr) 17,184,847 ($/year)/(ppb O3) 4,095 $/tonne VOC1.84E-04 ppb O3 (May-Sep) / (tonnes NOX/yr) 7,785,684 ($/year)/(ppb O3 (May-Sep)) 1,435 $/ tonne NOx2.38E-04 ppb O3 (May-Sep) / (tonnes VOC/yr) 7,785,684 ($/year)/(ppb O3 (May-Sep)) 1,855 $/tonne VOC2.72E-04 (µg/m³ PM2.5) / (tonnes PM2.5/yr) 153,437,355 ($/year)/(µg/m³ PM2.5) 41,735 $/tonne PM2.56.50E-05 ppb SO2 / (tonnes SOX/yr) 9,405,212 ($/year)/(ppb SO2) 611 $/tonne SOX4.73E-04 (µg/m³) / (tonne/yr) $3,722,940 ($/year)/(µg/m³ ) 1,760 $/ tonne 1,3-Butadiene4.21E-04 (µg/m³) / (tonne/yr) $72,269 ($/year)/(µg/m³ ) 30 $/ tonne Benzene4.32E-05 (µg/m³) / (tonne/yr) $919,785 ($/year)/(µg/m³ ) 40 $/ tonne Carbon tetrachloride4.88E-04 (µg/m³) / (tonne/yr) $1,664,373,068 ($/year)/(µg/m³ ) 812,600 $/ tonne ChromiumVI2.70E-04 (µg/m³) / (tonne/yr) $6,569,894 ($/year)/(µg/m³ ) 1,774 $/ tonne Diesel PM2.23E-03 (µg/m³) / (tonne/yr) $131,398 ($/year)/(µg/m³ ) 292 $/ tonne Formaldehyde
Change in Annual Average Concentration Health Benefits Valuation ($/yr) per Change Valuation ($/tonne)
MV
FVRD

Ramboll - Health Impact Scale for Air Quality Improvements in the Canadian Lower Fraser Valley Airshed
24/32
It may be useful at times to rank actions using the scale, but without presenting dollar valuations. For this purpose, a relative scale is also provided in the table. For the relative scale, a value of 1 is assigned to the lowest valuation, and all others are assigned proportionally. The use of the relative scale will result in the same ranking as the valuation. It is important to understand that the impact of any action is the product of the impact scale and the reduction in emissions associated with action. While it may appear that the scale is dominated by Chromium VI, total emissions of chromium VI were less than 42kg in 2010, and potential reductions of emissions are expected to be in the order of 1kg or less. In contrast, the potential reductions of other air contaminants are 3 to 6 orders of magnitude higher. The DPM valuation only included non-fatal cancer. The impact evaluation, however, would include both reductions in PM2.5 and DPM. The valuation estimates compare with some of the estimates and contrasts with others that are reported in the Bay Area Air Quality Management District Clean Air Plan 2017 “Spare the Air – Cool the Climate, A Blueprint for Clean Air and Climate Protection in the Bay Area.” For example, we estimated much higher NOx and VOC valuations and much lower valuations for benzene and PM (both direct and DPM), but similar estimates for SOx, 1,3-butadiene and formaldehyde. These differences are likely due to the different methodology used in producing these estimates compared to the methods used by BAAQMD. The methods employed in this analysis are associated with a number of uncertainties, which primarily include:
• Assumptions regarding the association between emissions and concentrations, which are based on only a single point in time. A more rigorous modeling approach to derive the relationship between emissions and concentrations would reduce these uncertainties.
• Assumptions regarding the associations between air pollutants and health impacts, which are based primarily on observations epidemiological associations.
• Assumptions related to the valuation of health impacts, which can vary depending on the methodology for determining these values.
The valuations in this study were compared to a similar analysis completed by the BAAQMD in 2017 (Table 17), which produced valuations on the same order of magnitude, and also indicated that PM2.5 is the criteria contaminant with the most impact per tonne.

Ramboll - Health Impact Scale for Air Quality Improvements in the Canadian Lower Fraser Valley Airshed
25/32
Table 17 Comparison between BAAQMD and Ramboll studies
Pollutant Ramboll valuation ($CDN/tonne)
BAAQMD valuation ($US/ton)
BAAQMD valuation ($CDN/tonne)
Ratio Ramboll/ BAAQMD
Notes
CO $ 433 - - - -
NOx $ 30,324 $6,000 $8,461 3.58 Same order of magnitude
PM2.5 $ 356,822 $ 558,400 $ 787,424 0.45 Same order of magnitude
VOC $ 51,967 $3,400 $4,794 10.84
Poor agreement - Differences may be due to ozone chemistry
SOx $ 19,844 $ 18,700 $ 26,370 0.75 Same order of magnitude
1,3-butadiene $ 27,016 $ 32,400 $ 45,689 0.59 Same order of magnitude
Benzene $ 532 $9,200 $ 12,973 0.04
Poor agreement - different unit risks used12
Carbon tetrachloride $6,514 - - - -
Chromium 6 $14,153,000 - - - -
DPM $ 16,370 $4,200 $5,923 2.76 Same order of magnitude
Formaldehyde $4,025 $1,400 $1,974 2.04 Same order of magnitude
Acetaldehyde $ 600 $ 846 - -
12 The benzene valuation in Scenario 5 of the Sensitivity Analysis (see Section 3) is $4671/tonne, based on the more conservative OEHHA unit risk

Ramboll - Health Impact Scale for Air Quality Improvements in the Canadian Lower Fraser Valley Airshed
26/32
3. SENSITIVITY ANALYSIS OF IMPACT SCALE
3.1 Example Policies and Program Actions Metro Vancouver provided ten (10) example actions that are included in the IAQGGMP or by other regulatory authorities in the region. Metro Vancouver estimated the annual emission reductions that would result from implementation of these actions, generally based on expected reductions and the 2015 emissions inventory. They were developed for demonstration purposes and do not necessarily represent expected Metro Vancouver policy directions. The health impact scale was applied to these example actions to illustrate how the scale would value and prioritize the actions. It is assumed that the actions would be prioritized based on ranking from highest to lowest valuation. The list of actions and the associated reductions in annual emissions are provided in Table 18. The table includes the overall impact valuation and ranking after application of the health impact scale described in Section 2. The breakdown in valuation resulting from each air contaminant is provided in Table 19 . Action 8, restriction on wood burning appliances, is ranked highest priority, with an annual valuation of about $438M based on the health impact scale. This action has been studied in detail, and results were documented in “Health and Economic Impacts of Residential Wood Burning in Metro Vancouver”, Hemmera Envirochem Inc., 201713. The study estimated annual cost benefits from emission reductions ranging from $282M to $869M depending on assumptions. The health impact scale valuation falls well within this range, suggesting reasonable agreement with the Hemmera methodology.
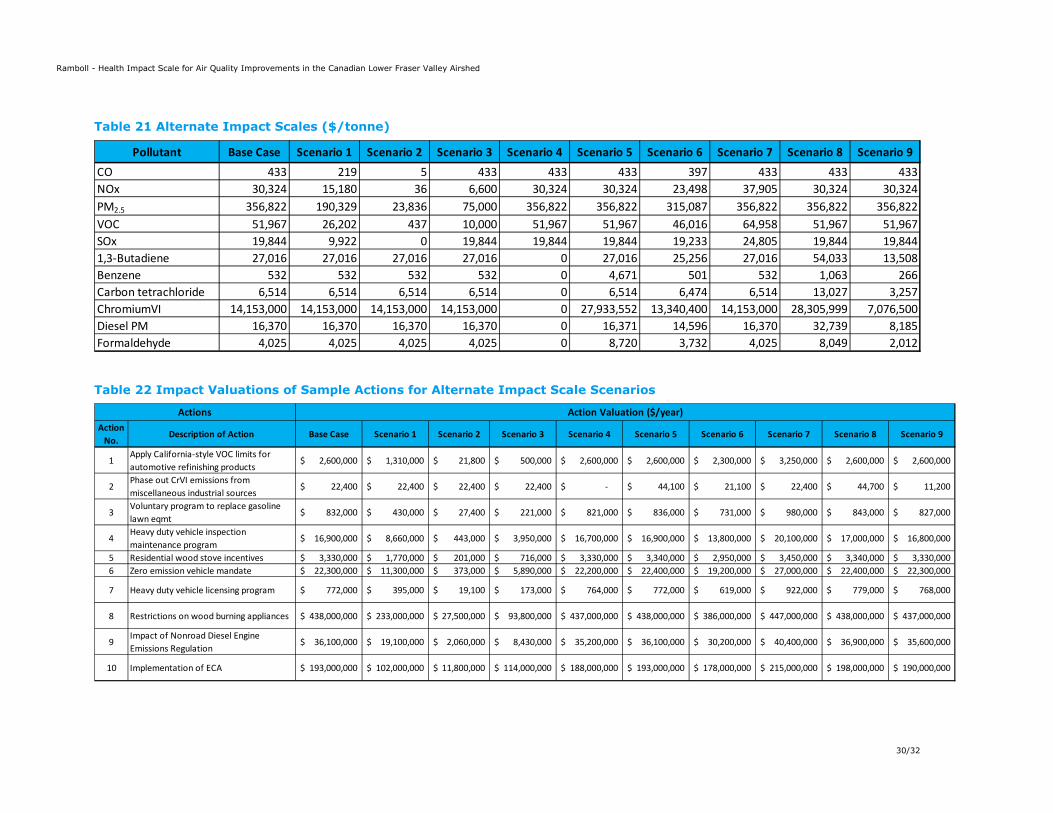
3.2 Sensitivity Analysis and Scenarios An analysis was conducted to investigate the sensitivity of the overall impacts to changes in the impact scales of specific air contaminants. Metro Vancouver identified nine (9) alternate scenarios that each represent a change in the impact scale compared to the “Base Case” health impact scale documented in Section 2. The nine scenarios are described in Table 20. The impact scales for the Base Case and the nine alternate scenarios are presented in Table 21. These alternate scales were applied to the example actions described in Table 18, and the resulting valuation and ranking of the actions are provided in Table 22 and Table 23.
3.3 Discussion of Sensitivity Comparing the alternate scenarios to the Base Case in Table 22 and Table 23 leads to a number of notable observations. For this particular set of example actions, the ranking of actions is not particularly sensitive to the changes in the scale covered by the alternate scenarios. Only 2 of the 9 scenarios resulted in any change to the ranking whatsoever. Scenario 3 (specified values for NOX VOC, and PM2.5) resulted only in a reversal of the 1st and 2nd ranked actions. Scenario 2 (zero valuation for
13 Health and Economic Impacts of Residential Wood Burning in Metro Vancouver, Prepared by Hemmera Envirochem Inc., Prepared for Metro Vancouver, 2017

Ramboll - Health Impact Scale for Air Quality Improvements in the Canadian Lower Fraser Valley Airshed
27/32
mortality) had more effect on ranking, though it should be noted that the three actions ranked highest were unaffected, with minor rearrangement of the lower rankings. It is notable that eliminating the impact of toxics, or HAPs, (Scenario 4) or doubling the impact of toxics (Scenario 8) did not affect the ranking of the actions. With the exception of Action 10, which affects Chromium 6 emissions only, eliminating or doubling the impact of toxics had negligible effect on the valuation of the action. Comparison of Scenario 2 (zero valuation for a statistical life) to the Base Case shows that valuations are dominated by the value of a statistical life. For all actions other than Scenario 2, which affects Cr VI only, the value of mortalities represented more than 93% of the total impact. Nevertheless, as mentioned above, the value of mortalities had limited effect on ranking of actions. The impact scale does not currently account for secondary formation of PM, so it is possible that the impact scale of precursors (NOX, VOC, SO2) may be different than presented in this study. Scenario 7 (25% increase in valuation of NOX, VOC, and SO2) was included to investigate the potential effect of higher impact scales for these precursors. This change did not affect the ranking of the 10 actions, though the valuation of the actions increased between 0 and 25%, depending on the air contaminants involved. This suggests that ignoring secondary formation in the scale has moderate to negligible effect on the impacts predicted.

Ramboll - Health Impact Scale for Air Quality Improvements in the Canadian Lower Fraser Valley Airshed
28/32
Table 18 Example Actions and Associated Emission Reductions (tonnes/year)
Table 19 Breakdown of Base Case Impact Valuations for Example Actions
Action No.
Description of Action CO NOX PM2.5 VOC SOX 1,3-Butadiene BenzeneCarbon
tetrachlorideChromiumVI Diesel PM Formaldehyde Valuation Rank
8 Restrictions on wood burning appliances 5,427 72.0 1,117 650 11.0 8.79 41.4 - - - 67.2 438,000,000$ 110 Implementation of ECA - - 279 - 4,433 - - - - 316 - 193,000,000$ 2
9Impact of Nonroad Diesel Engine Emissions Regulation
300 500 50.0 40.0 1.00 0.242 2.83 - 6.01E-05 50.0 0.713 36,100,000$ 3
6 Zero emission vehicle mandate 3,380 185 5.71 248 9.45 1.31 8.09 - 2.92E-04 2.82 3.47 22,300,000$ 4
4Heavy duty vehicle inspection maintenance program
609 350 10.0 43.2 1.10 0.125 0.495 - - 10.0 0.665 16,900,000$ 5
5 Residential wood stove incentives 48.9 0.125 7.98 8.68 0.0749 0.117 0.553 - - - 0.898 3,330,000$ 6
1Apply California-style VOC limits for automotive refinishing products
- - - 50.0 - - - - - - - 2,600,000$ 7
3Voluntary program to replace gasoline lawn eqmt
136 2.32 0.484 10.0 0.00626 0.0606 0.708 - 5.82E-07 0.484 0.178 832,000$ 8
7 Heavy duty vehicle licensing program 3.60 19.1 0.450 0.43 - 1.25E-03 4.93E-03 - - 0.450 0.0299 772,000$ 9
2Phase out CrVI emissions from miscellaneous industrial sources
- - - - - - - - 1.58E-03 - - 22,400$ 10
Actions Projected Emission Reductions (tonnes/year) Overall Impact
Action No.
Description of Action CO NOX PM2.5 VOC SOX 1,3-Butadiene BenzeneCarbon
tetrachlorideChromiumVI Diesel PM Formaldehyde Valuation Rank
8 Restrictions on wood burning appliances 2,347,835$ 2,183,314$ 398,569,861$ 33,778,393$ 218,285$ 237,478$ 21,983$ -$ -$ -$ 270,560$ 438,000,000$ 110 Implementation of ECA -$ -$ 99,660,711$ -$ 87,968,762$ -$ -$ -$ -$ 5,178,750$ -$ 193,000,000$ 2
9Impact of Nonroad Diesel Engine Emissions Regulation
129,786$ 15,161,905$ 17,841,086$ 2,078,670$ 19,844$ 6,550$ 1,506$ -$ 851$ 818,478$ 2,871$ 36,100,000$ 3
6 Zero emission vehicle mandate 1,462,098$ 5,605,508$ 2,038,522$ 12,905,529$ 187,487$ 35,354$ 4,300$ -$ 4,133$ 46,214$ 13,959$ 22,300,000$ 4
4Heavy duty vehicle inspection maintenance program
263,610$ 10,613,334$ 3,568,217$ 2,242,548$ 21,858$ 3,389$ 263$ -$ -$ 163,696$ 2,678$ 16,900,000$ 5
5 Residential wood stove incentives 21,138$ 3,796$ 2,849,052$ 451,306$ 1,486$ 3,173$ 294$ -$ -$ -$ 3,615$ 3,330,000$ 6
1Apply California-style VOC limits for automotive refinishing products
-$ -$ -$ 2,598,338$ -$ -$ -$ -$ -$ -$ -$ 2,600,000$ 7
3Voluntary program to replace gasoline lawn eqmt
58,794$ 70,207$ 172,580$ 519,668$ 124$ 1,638$ 376$ -$ 8$ 7,917$ 718$ 832,000$ 8
7 Heavy duty vehicle licensing program 1,557$ 579,791$ 160,570$ 22,346$ -$ 34$ 3$ -$ -$ 7,366$ 120$ 772,000$ 9
2Phase out CrVI emissions from miscellaneous industrial sources
-$ -$ -$ -$ -$ -$ -$ -$ 22,362$ -$ -$ 22,400$ 10
Overall ImpactActions Valuation ($) with Base Case Health Impact Scale

Ramboll - Health Impact Scale for Air Quality Improvements in the Canadian Lower Fraser Valley Airshed
29/32
Table 20 Alternate Impact Scale Scenarios for Sensitivity Analysis
Scenario No. Change from Base Case Impact Scale Purpose
1 50% reduction in the value of a statistical life - i.e. valuation of mortalities reduced by 50% Vary impact of value of statistical life
2 100% reduction in the value of a statistical life - i.e. mortalities not included in impact scale Vary impact of value of statistical life
3 Impact Scale for NOX, VOC and PM2.5 set to $6,600/tonne, $10,000/tonne, and $75,000/tonne, respectively
Comparison to impact scales provided in private communication with Health Canada staff
4 Toxics (HAPs) removed from Impact Scale - i.e. valuations set to zero Impact of CACs vs. HAPs
5 Unit risks for air toxics changed from prioritized value, to the maximum value reported by STI Worst case impact of HAPs
6 Valuation for benefits in FVRD not included in impact scale - i.e. scale includes Greater Vancouver only Impact only for Metro Vancouver
7 Impact Scale for NOX, VOC and PM2.5 each increased by 25% - as test of importance of considering secondary PM formation Test for considering secondary PM
8 100% increase in the air toxics (HAPs) impact scale - i.e. valuations increased by factor of 2
Impact if HAP impact scale under-estimated
9 50% decrease in the air toxics (HAPs) impact scale - i.e. valuations decreased by factor of 2
Impact if HAP impact scale over-estimated
Ramboll - Health Impact Scale for Air Quality Improvements in the Canadian Lower Fraser Valley Airshed
30/32
Table 21 Alternate Impact Scales ($/tonne)
Table 22 Impact Valuations of Sample Actions for Alternate Impact Scale Scenarios
Pollutant Base Case Scenario 1 Scenario 2 Scenario 3 Scenario 4 Scenario 5 Scenario 6 Scenario 7 Scenario 8 Scenario 9CO 433 219 5 433 433 433 397 433 433 433NOx 30,324 15,180 36 6,600 30,324 30,324 23,498 37,905 30,324 30,324PM2.5 356,822 190,329 23,836 75,000 356,822 356,822 315,087 356,822 356,822 356,822VOC 51,967 26,202 437 10,000 51,967 51,967 46,016 64,958 51,967 51,967SOx 19,844 9,922 0 19,844 19,844 19,844 19,233 24,805 19,844 19,8441,3-Butadiene 27,016 27,016 27,016 27,016 0 27,016 25,256 27,016 54,033 13,508Benzene 532 532 532 532 0 4,671 501 532 1,063 266Carbon tetrachloride 6,514 6,514 6,514 6,514 0 6,514 6,474 6,514 13,027 3,257ChromiumVI 14,153,000 14,153,000 14,153,000 14,153,000 0 27,933,552 13,340,400 14,153,000 28,305,999 7,076,500Diesel PM 16,370 16,370 16,370 16,370 0 16,371 14,596 16,370 32,739 8,185Formaldehyde 4,025 4,025 4,025 4,025 0 8,720 3,732 4,025 8,049 2,012
Action No.
Description of Action Base Case Scenario 1 Scenario 2 Scenario 3 Scenario 4 Scenario 5 Scenario 6 Scenario 7 Scenario 8 Scenario 9
1Apply California-style VOC limits for automotive refinishing products
2,600,000$ 1,310,000$ 21,800$ 500,000$ 2,600,000$ 2,600,000$ 2,300,000$ 3,250,000$ 2,600,000$ 2,600,000$
2Phase out CrVI emissions from miscellaneous industrial sources
22,400$ 22,400$ 22,400$ 22,400$ -$ 44,100$ 21,100$ 22,400$ 44,700$ 11,200$
3Voluntary program to replace gasoline lawn eqmt
832,000$ 430,000$ 27,400$ 221,000$ 821,000$ 836,000$ 731,000$ 980,000$ 843,000$ 827,000$
4Heavy duty vehicle inspection maintenance program
16,900,000$ 8,660,000$ 443,000$ 3,950,000$ 16,700,000$ 16,900,000$ 13,800,000$ 20,100,000$ 17,000,000$ 16,800,000$
5 Residential wood stove incentives 3,330,000$ 1,770,000$ 201,000$ 716,000$ 3,330,000$ 3,340,000$ 2,950,000$ 3,450,000$ 3,340,000$ 3,330,000$ 6 Zero emission vehicle mandate 22,300,000$ 11,300,000$ 373,000$ 5,890,000$ 22,200,000$ 22,400,000$ 19,200,000$ 27,000,000$ 22,400,000$ 22,300,000$
7 Heavy duty vehicle licensing program 772,000$ 395,000$ 19,100$ 173,000$ 764,000$ 772,000$ 619,000$ 922,000$ 779,000$ 768,000$
8 Restrictions on wood burning appliances 438,000,000$ 233,000,000$ 27,500,000$ 93,800,000$ 437,000,000$ 438,000,000$ 386,000,000$ 447,000,000$ 438,000,000$ 437,000,000$
9Impact of Nonroad Diesel Engine Emissions Regulation
36,100,000$ 19,100,000$ 2,060,000$ 8,430,000$ 35,200,000$ 36,100,000$ 30,200,000$ 40,400,000$ 36,900,000$ 35,600,000$
10 Implementation of ECA 193,000,000$ 102,000,000$ 11,800,000$ 114,000,000$ 188,000,000$ 193,000,000$ 178,000,000$ 215,000,000$ 198,000,000$ 190,000,000$
Actions Action Valuation ($/year)

Ramboll - Health Impact Scale for Air Quality Improvements in the Canadian Lower Fraser Valley Airshed
31/32
Table 23 Impact Rankings of Sample Actions for Alternate Impact Scale Scenarios
Action No.
Description of Action Base Case Scenario 1 Scenario 2 Scenario 3 Scenario 4 Scenario 5 Scenario 6 Scenario 7 Scenario 8 Scenario 9
1Apply California-style VOC limits for automotive refinishing products
7 7 9 7 7 7 7 7 7 7
2Phase out CrVI emissions from miscellaneous industrial sources
10 10 8 10 10 10 10 10 10 10
3Voluntary program to replace gasoline lawn eqmt
8 8 7 8 8 8 8 8 8 8
4Heavy duty vehicle inspection maintenance program
5 5 4 5 5 5 5 5 5 5
5 Residential wood stove incentives 6 6 6 6 6 6 6 6 6 66 Zero emission vehicle mandate 4 4 5 4 4 4 4 4 4 4
7 Heavy duty vehicle licensing program 9 9 10 9 9 9 9 9 9 9
8 Restrictions on wood burning appliances 1 1 1 2 1 1 1 1 1 1
9Impact of Nonroad Diesel Engine Emissions Regulation
3 3 3 3 3 3 3 3 3 3
10 Implementation of ECA 2 2 2 1 2 2 2 2 2 2
Actions Action Ranking

Ramboll - Health Impact Scale for Air Quality Improvements in the Canadian Lower Fraser Valley Airshed
32/32
4. DISCUSSION AND RECOMMENDATIONS
The health impact scale for the Canadian LFV has been developed based on empirical relationships between air contaminant emissions within the Canadian LFV and monitored ambient air concentrations. The scope of this project did not support detailed air quality dispersion modelling and photochemical modelling studies to develop the relationships. Instead, the relationships were based on linear correlations between historical emission and ambient concentration data. This involved applying simplifying assumptions to provide a means of estimating the air quality changes associated with emission reduction. The most significant assumptions include:
1) Ambient concentrations were assumed to be uniform across census divisions; 2) Concentrations of NO2, SO2, CO, and VOCs within the Canadian LFV were considered a
function of emissions in the Canadian LFV only, with no significant contribution from long range transport or atmospheric reactions;
3) Concentrations of PM2.5 and ozone were assumed to have contributions from background including long range transport (i.e. resulting from emissions outside of the Canadian LFV) and photochemical or other atmospheric reactions. These background levels were treated as constants;
4) Concentrations of HAPs were assumed to be a function of emissions within the Canadian LFV, and constant background concentrations based on Remote Concentration Estimates (RCE) in the Northern Hemisphere;
5) Ozone was assumed to be VOC limited in the Metro Vancouver CD throughout the year, and primarily a function of VOC emissions in that CD. In the FVRD, ozone can be both VOC and NOX limited over any year, and was assumed to be a function of both VOC and NOX; and
6) Valuations of impacts of air toxics were assumed to be dominated by non-fatal cancer risk. Other health outcomes were not considered in the analysis.
Concentrations of PM2.5 that result from secondary formation in the atmosphere from precursor air contaminants (e.g. NOX, SO2, NH3) are included in ambient monitored concentration, and included with “background” for development of correlations. However, the impact scale does not account for changes in PM2.5 concentrations that result from reductions in the emission of precursors. It is recommended that:
• Air contaminants formation and algorithms relating changes in ambient concentrations to changes in emissions used in this study should be further investigated.
• Formation of secondary PM2.5 should be further investigated. Findings of the sensitivity analysis suggest that this could have an impact on valuations or rankings produced by the scale.
• Updating the health impact scale with outputs from the new version of AQBAT should be considered for the future. Changes in the AQBAT model may improve accuracy of CAC valuation, and provide more thorough treatment of a few HAPs. This project relied heavily on the current version (2a) of AQBAT for valuation of health impacts of CACs. Health Canada has indicated they are very close to release of a new version of AQBAT that includes modified concentration response functions and valuations. In addition, the new version includes some HAPs.

Ramboll - Health Impact Scale for Air Quality Improvements in the Canadian Lower Fraser Valley Airshed
Appendix A
APPENDIX A EMISSION – CONCENTRATION CORRELATIONS
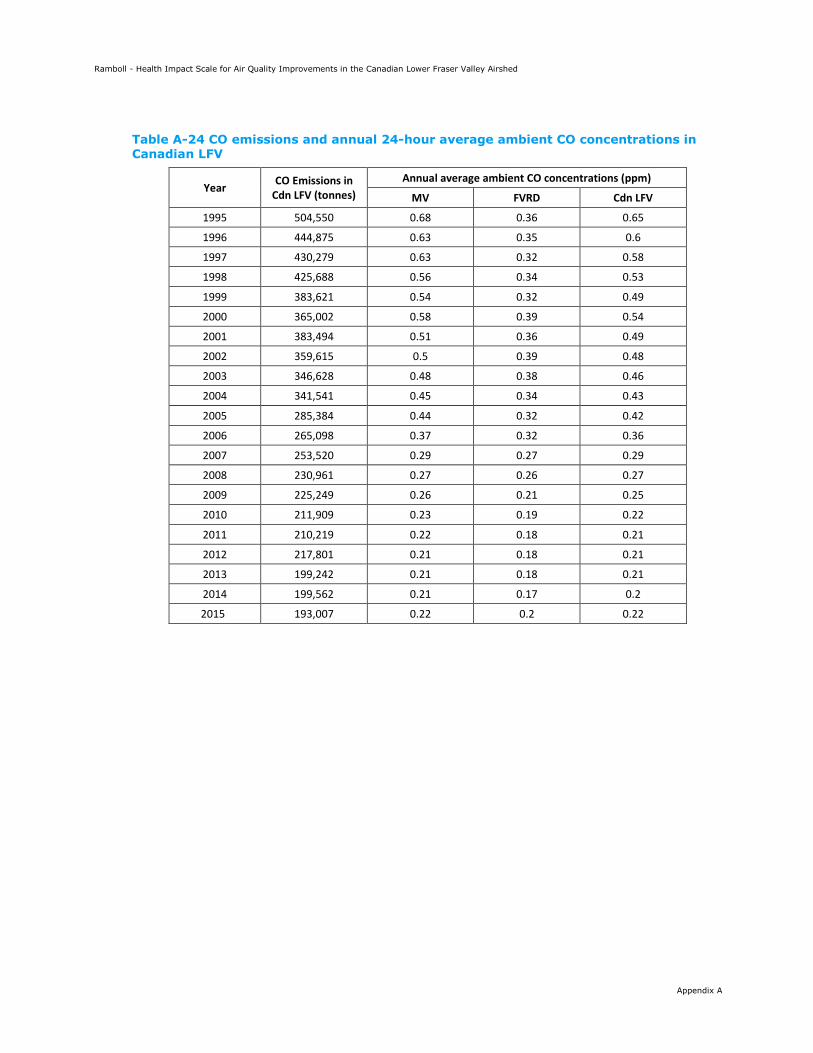
Ramboll - Health Impact Scale for Air Quality Improvements in the Canadian Lower Fraser Valley Airshed
Appendix A
Table A-24 CO emissions and annual 24-hour average ambient CO concentrations in Canadian LFV
Year CO Emissions in Cdn LFV (tonnes)
Annual average ambient CO concentrations (ppm)
MV FVRD Cdn LFV
1995 504,550 0.68 0.36 0.65
1996 444,875 0.63 0.35 0.6
1997 430,279 0.63 0.32 0.58
1998 425,688 0.56 0.34 0.53
1999 383,621 0.54 0.32 0.49
2000 365,002 0.58 0.39 0.54
2001 383,494 0.51 0.36 0.49
2002 359,615 0.5 0.39 0.48
2003 346,628 0.48 0.38 0.46
2004 341,541 0.45 0.34 0.43
2005 285,384 0.44 0.32 0.42
2006 265,098 0.37 0.32 0.36
2007 253,520 0.29 0.27 0.29
2008 230,961 0.27 0.26 0.27
2009 225,249 0.26 0.21 0.25
2010 211,909 0.23 0.19 0.22
2011 210,219 0.22 0.18 0.21
2012 217,801 0.21 0.18 0.21
2013 199,242 0.21 0.18 0.21
2014 199,562 0.21 0.17 0.2
2015 193,007 0.22 0.2 0.22

Ramboll - Health Impact Scale for Air Quality Improvements in the Canadian Lower Fraser Valley Airshed
Appendix A
Figure A-1: CO emissions vs. annual 24-hour average ambient CO concentrations in MV
Figure A-2 CO emissions vs. annual 24-hour average ambient CO concentrations in FVRD
y = 1.34E-06xR² = 9.20E-01
0.0
0.1
0.2
0.3
0.4
0.5
0.6
0.7
0.8
0 100,000 200,000 300,000 400,000 500,000 600,000
CO [p
pm] M
V
CO [tonnes] - Cdn LFV
CO - Metro Vancouver
y = 9.08E-07xR² = 6.15E-01
0.0
0.1
0.1
0.2
0.2
0.3
0.3
0.4
0.4
0.5
0.5
0 100,000 200,000 300,000 400,000 500,000 600,000
CO [p
pm] F
VRD
CO [tonnes] - Cdn LFV
CO - FVRD

Ramboll - Health Impact Scale for Air Quality Improvements in the Canadian Lower Fraser Valley Airshed
Appendix A
Table A-25 SOx emissions and annual 24-hour average ambient SO2 concentrations in Canadian LFV
Year SOX Emissions in Cdn LFV (tonnes)
Annual average ambient SO2 concentrations (ppb)
MV FVRD Cdn LFV
1995 11,181 3.23 — 3.23
1996 8,759 2.9 — 2.9
1997 9,128 2.96 — 2.96
1998 9,131 2.56 — 2.56
1999 9,283 2.3 0.6 2.15
2000 9,408 2.67 0.5 2.49
2001 8,173 2.19 0.6 2.06
2002 7,366 2.05 0.55 1.82
2003 7,328 1.98 0.35 1.75
2004 7,718 1.75 0.7 1.61
2005 7,269 1.73 0.45 1.56
2006 6,739 1.7 0.35 1.52
2007 6,650 1.45 0.4 1.31
2008 6,679 1.49 0.5 1.36
2009 6,604 1.62 0.5 1.47
2010 6,669 1.26 0.3 1.12
2011 2,420 1.18 0.2 1.05
2012 2,479 1.26 0.15 1.12
2013 2,582 0.94 0.2 0.81
2014 2,579 0.82 0.17 0.7
2015 1,619 0.51 0.23 0.46

Ramboll - Health Impact Scale for Air Quality Improvements in the Canadian Lower Fraser Valley Airshed
Appendix A
Figure A-3 SOX emissions vs. annual 24-hour average ambient SO2 concentrations in MV
Figure A-4 SOX emissions vs. annual 24-hour average ambient SO2 concentrations in FVRD
y = 2.72E-04xR² = 8.11E-01
0.0
0.5
1.0
1.5
2.0
2.5
3.0
3.5
0 2,000 4,000 6,000 8,000 10,000 12,000
SO2
[ppb
] MV
SOx [tonnes] - Cdn LFV
SO2 - Metro Vancouver
y = 6.50E-05xR² = 7.13E-01
0.0
0.1
0.2
0.3
0.4
0.5
0.6
0.7
0.8
0 2,000 4,000 6,000 8,000 10,000
SO2
[ppb
] FVR
D
SOx [tonnes] - Cdn LFV
SO2 - FVRD

Ramboll - Health Impact Scale for Air Quality Improvements in the Canadian Lower Fraser Valley Airshed
Appendix A
Table A-26 NOx emissions and annual average 24-hour ambient NO2 concentrations in Canadian LFV
Year NOx Emissions in Cdn LFV (tonnes)
Annual average ambient NO2 concentrations (ppb)
MV FVRD Cdn LFV
1995 94,983 18.24 11.6 17.73
1996 85,982 18.25 10.6 17.66
1997 88,285 18.1 11.55 17.16
1998 89,595 17.25 13.4 16.8
1999 90,959 16.25 12 15.54
2000 90,244 17.11 12.2 16.29
2001 77,635 15.91 15.4 15.88
2002 79,256 15.89 12.97 15.38
2003 73,831 16.01 11.6 15.28
2004 76,167 14.93 10.83 14.28
2005 71,508 14.97 10.2 14.22
2006 66,189 14.39 10.13 13.72
2007 65,597 13.81 9.63 13.15
2008 63,456 13.34 8.87 12.64
2009 58,759 13.38 8.8 12.65
2010 58,898 11.19 7.93 10.65
2011 49,100 10.99 8 10.52
2012 49,484 11.6 8.07 11.07
2013 50,936 11.56 7.7 10.82
2014 51,116 11.07 7.08 10.12
2015 49,807 11.14 8.13 10.32

Ramboll - Health Impact Scale for Air Quality Improvements in the Canadian Lower Fraser Valley Airshed
Appendix A
Figure A-5 NOx emissions vs. annual 24-hour average ambient NO2 concentrations in MV
Figure A-6 NOx emissions vs. annual 24-hour average ambient NO2 concentrations in FVRD
y = 2.04E-04xR² = 8.40E-01
0.0
5.0
10.0
15.0
20.0
25.0
0 20,000 40,000 60,000 80,000 100,000
NO
2 [p
pb] M
V
NOx [tonnes] - Cdn LFV
NO2 - Metro Vancouver
y = 1.45E-04xR² = 6.31E-01
0.0
2.0
4.0
6.0
8.0
10.0
12.0
14.0
16.0
18.0
0 20,000 40,000 60,000 80,000 100,000
NO
2 [p
pb] F
VRD
NOx [tonnes] - Cdn LFV
NO2 - FVRD

Ramboll - Health Impact Scale for Air Quality Improvements in the Canadian Lower Fraser Valley Airshed
Appendix A
Table A-27 PM2.5 emissions and annual 24-hour average ambient PM2.5 concentrations in Canadian LFV
Year PM2.5 Emissions in Cdn LFV (tonnes)
Annual average ambient PM2.5 concentrations (µg/m³)
MV FVRD Cdn LFV
1995 10,496 — — —
1996 12,608 — 5 —
1997 11,787 — 4.4 —
1998 10,766 — 5.3 —
1999 10,020 5.25 4.5 5
2000 9,503 6.2 5.3 5.9
2001 9,332 5.3 4.5 5.03
2002 8,747 5.47 4.9 5.33
2003 8,699 5.48 4.9 5.38
2004 8,734 5.34 4.9 5.25
2005 8,511 5.49 4.55 5.3
2006 7,092 4.88 4 4.7
2007 7,249 4.56 4.15 4.48
2008 7,176 4.58 4.2 4.5
2009 6,856 4.98 4.2 4.84
2010 6,978 4.04 3.9 4.01
2011 5,507 4.08 3.77 4.01
2012 6,064 4.11 4 4.09
2013 5,659 3.97 4.49 4.13
2014 5,616 4.55 4.57 4.55
2015 5,267 4.72 5.04 4.83

Ramboll - Health Impact Scale for Air Quality Improvements in the Canadian Lower Fraser Valley Airshed
Appendix A
Note: Intercept represents background (including secondary) PM2.5 concentrations in Cdn LFV
Figure A-7 PM2.5 emissions vs. annual 24-hour average ambient PM2.5 concentrations in Canadian LFV (MV and FVRD)
y = 2.72E-04x + 2.75E+00R² = 5.83E-01
0.0
1.0
2.0
3.0
4.0
5.0
6.0
7.0
0 2,000 4,000 6,000 8,000 10,000 12,000
PM2.
5 [µ
g/m
³] C
dn LF
V
PM2.5 [tonnes] - Cdn LFV
PM2.5 - Cdn LFV

Ramboll - Health Impact Scale for Air Quality Improvements in the Canadian Lower Fraser Valley Airshed
Appendix A
Table A-28 NOx and VOC emissions and annual average ambient 1-hour max O3 + 24-hour NOx concentrations (ppb)s in Canadian LFV
Year NOx + VOC
Emissions in Cdn LFV (tonnes)
Annual average ambient 1-hour max O3 + 24-hour NOx concentrations (ppb)
MV FVRD Cdn LFV
1995 197,273 67.16 56.07 66.62
1996 185,328 65.21 54.91 64.72
1997 186,194 65.78 53.72 64.06
1998 186,492 61.95 55.38 61.16
1999 182,351 61.79 55.73 60.78
2000 177,389 64.07 55.2 62.57
2001 168,507 61.27 62.07 61.68
2002 167,817 60.31 57.53 59.75
2003 161,090 62.18 57.13 61.29
2004 162,005 57.44 53.08 56.76
2005 148,889 58.2 50.58 56.99
2006 145,692 56.34 51.64 55.6
2007 142,257 53.89 47.77 52.93
2008 136,179 52.34 46.24 51.37
2009 127,649 54.34 47.94 53.33
2010 127,319 48.57 43.82 47.77
2011 116,178 48.12 45.67 47.72
2012 115,690 49.8 45.24 49.19
2013 117,816 49.38 43.46 48.35
2014 116,556 50.27 44.22 48.89
2015 115,215 48.38 45.59 47.53

Ramboll - Health Impact Scale for Air Quality Improvements in the Canadian Lower Fraser Valley Airshed
Appendix A
Figure A-8 VOC + NOx emissions vs. annual average ambient 1-hour max O3 + 24-hour NOx concentrations in MV
Figure A-9 VOC + NOx emissions vs. annual average ambient 1-hour max O3 + 24-hour NOx concentrations in FVRD
y = 2.21E-04x + 2.36E+01R² = 9.34E-01
0.0
10.0
20.0
30.0
40.0
50.0
60.0
70.0
80.0
0 50,000 100,000 150,000 200,000 250,000
O3+
NO
x [p
pb] M
V
VOC+NOx [tonnes] - Cdn LFV
Ozone - Metro Vancouver
y = 1.69E-04x + 2.54E+01R² = 7.50E-01
0.0
10.0
20.0
30.0
40.0
50.0
60.0
70.0
0 50,000 100,000 150,000 200,000 250,000
O3+
NO
x [p
pb] F
VRD
VOC+NOx [tonnes] - Cdn LFV
Ozone - FVRD

Ramboll - Health Impact Scale for Air Quality Improvements in the Canadian Lower Fraser Valley Airshed
Appendix A
Figure A-10 Annual average ambient 24-hour NOx concentrations vs. annual average ambient 1-hour max O3 + 24-hour NOx concentrations in MV
Figure A-11 Annual average ambient 24-hour NOx concentrations vs. annual average ambient 1-hour max O3 + 24-hour NOx concentrations in FVRD
y = 0.4937xR² = 0.6528
0.0
5.0
10.0
15.0
20.0
25.0
30.0
35.0
40.0
45.0
0.0 10.0 20.0 30.0 40.0 50.0 60.0 70.0 80.0
NO
x
O3+NOx
MV
y = 0.3729xR² = 0.5417
0.0
5.0
10.0
15.0
20.0
25.0
30.0
35.0
0.0 10.0 20.0 30.0 40.0 50.0 60.0 70.0
NO
x
O3+NOx
FVRD