1999 National-Scale Air Toxics –January 2006
33
Transcript of 1999 National-Scale Air Toxics –January 2006

1999 National-Scale Air Toxics
Assessment (NATA)
– January 2006
An Overview

2
Outline
� Background on NATA
� Summary of results
� Which air toxics are most important & what are the key source categories?
� Where are the air toxics risks of concern?
� What do the NATA results mean?
� NATA’s impact on the air toxics program

3
What is NATA?
� Characterization of air toxics across the nation
� Nationwide assessment with census tract resolution for 177
air toxics plus diesel PM
� Emissions, modeled ambient concentrations and estimated
inhalation exposures from outdoor sources
� Cancer and noncancer risk estimates for the 133 air toxics
with health data based on chronic exposures
� Tools for State/Local/Tribal Agencies (and EPA) to prioritize
pollutants, emission sources and locations of interest
� Provides a starting point for local-scale assessments
� Focuses community efforts
� Informs monitoring programs
� A few pieces of the air toxic puzzle

The Puzzle
NATA
NATA
NATA
NATA
Comparison
with
Ambient
Concentration
Monitoring
Emission
Inventory
Development
Emission
Processing
(EMS-HAP)
Air
Dispersion
Modeling
(ASPEN)
Inhalation
Exposure
Modeling
(HAPEM)
Risk
Assessment/
Characterization
Dose-
Response
Assessment
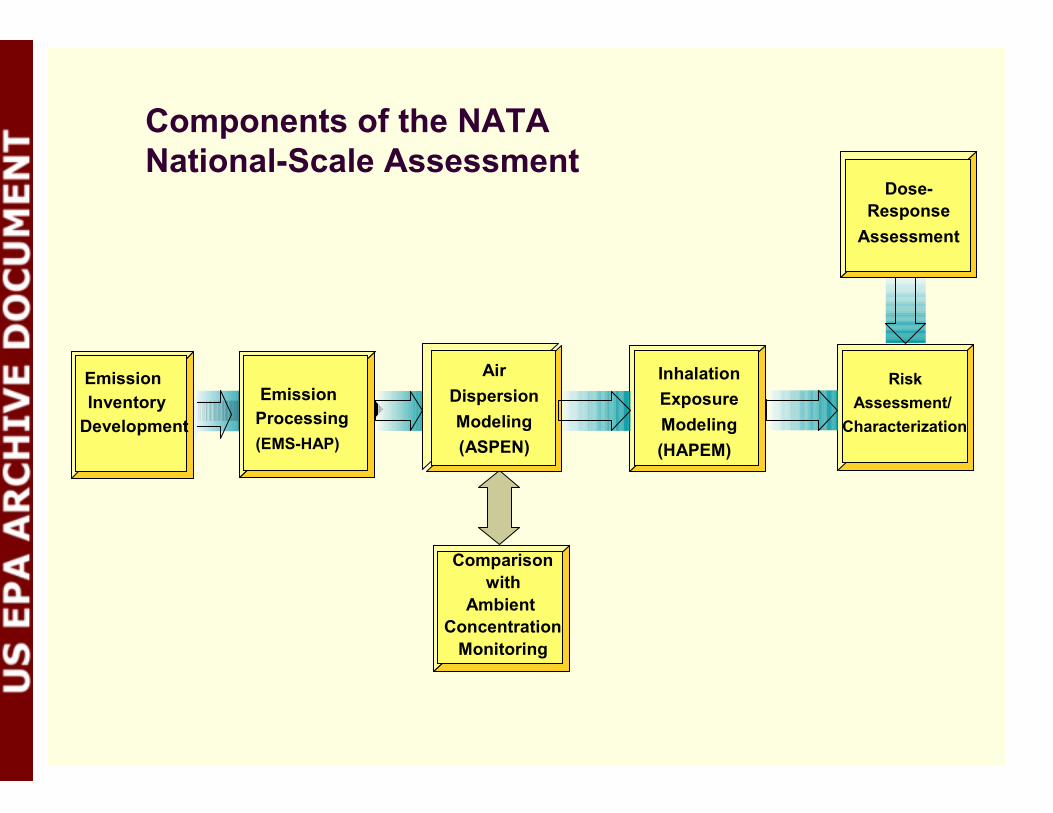
Components of the NATA
National-Scale Assessment

6
History of
National Air Toxics Assessments� Cumulative Exposure Project (CEP)
� 1990 data
� Released in 1998
� No peer review
� 1996 NATA� 1996 data
� Released in May 2002
� Internal and Science Advisory Board peer reviews
� 1999 NATA� 1999 data
� Internal reviews
� Released in 2006

7
Improvement from the 1996 NATA
� Improved quality of inventory
� Expanded coverage to include nearly all air toxics
� Improved technical quality of modeling analyses � Responded to many of Science Advisory Board comments
� Used latest health risk information
� Improved presentation of results � More transparent and accessible website data
� Local scale mapping tools

8
Room for Future Improvements
� Misses some local impacts (e.g. next to major sources, near roadways)
� Modeling science
� Tends to underestimate metals (based on limited data)
� Inventory issues

NATA Model to Monitor Comparisons
1.0=Agreement
Model
overprediction
Model
underprediction
75th percentile
Ben
zene
Car
bon
Tet
Form
alde
hyde
Ace
tald
ehyd
e
Lea
dM
anga
nese
Chr
omiu
m
25th percentile
MedianC
hlor
ofor
m
1,4-
Dic
hlor
oben
zene
Eth
ylen
e D
ichl
orid
e
Met
hylene
Dic
hlor
ide
Perc
Tri
chlo
roet
hyle
ne
Nic
kel
Benzene found
very good
agreement
Metals appear to
be
underpredicted
by NATA

10
Pollutant Issues
� Diesel PM:� Did not calculate cancer risks – based on epidemiological studies
would be among pollutants posing greatest relative risk
� Did calculate noncancer risks
� Formaldehyde:
� Used the cancer unit risk estimate developed by the CIIT
Centers for Health Research, published in 1999
� Naphthalene:
� Included in assessment as carcinogen
� Dioxin:
� not included because EPA is conducting a separate
assessment project specifically for dioxin (was not in 1996
assessment either)
Risks from PM and other criteria pollutants are not included in this assessment.
11
Summary of 1999 NATA Results

12
Overall Summary of 1999 NATA Results
� The average cancer risk for 1999 is 43 in a million (1 in 20,800)� This represents the subset of total air toxics cancer risk which can be quantified
� Benzene is most significant carcinogen*
� Comparable to 1996 NATA of 55 in a million (1 in 18,200)
� To put this in perspective:� radon presents a risk of 2,000 in a million (1 in 500)
� However, emissions of radon are naturally produced
� it is estimated that one out of every three Americans will contract cancer during a lifetime, when all causes are taken into account.
� Two thirds of this risk is due to smoking or lifestyle factors
� The average noncancer risk for 1999 is 6.4 (hazard index for respiratory)
� Acrolein a majority of this risk
� Comparable to 1996 NATA of 5.2
� Some new air toxics added to list of significant pollutants
� Confirmed list of 33 urban air toxics as primary risk drivers
Note: This is an estimate of the average American’s chance of contracting cancer from breathing the air toxics analyzed here, if
they were exposed to 1999 emissions levels for 70 years. This assessment does not include indoor air, diesel emissions, non-
inhalation exposure pathways. Risks from PM and other criteria pollutants are not included in this assessment.

13
Which air toxics
are most important &
what are the key source categories?

14
1999 National-Scale Assessment
Risk Characterization - Significant Pollutants
� Cancer� National drivers 1
� Benzene
� Regional drivers 2
� Arsenic compounds
� Benzidine
� 1,3-Butadiene
� Cadmium compounds
� Carbon Tetrachloride
� Chromium 6
� Coke oven
� Ethylene oxide
� Hydrazine
� Naphthalene
� Perchloroethylene
� POM
� Non-Cancer� National drivers3
� Acrolein
� Regional drivers4
� Antimony
� Arsenic Compounds
� 1,3-Butadiene
� Cadmium compounds
� Chlorine
� Chromium 6
� Diesel PM
� Formaldehyde
� Hexamethylene 1-6-diisocyanate
� Hydrazine
� Hydrochloric acid
� Maleic anhydride
� Manganese compounds
� Nickel compounds
� 2,4-Toluene Diisocyanate
� Triethylamine1 At least 25 million people exposed to risk > 10 in 1 million2 At least 1 million people exposed to risk > 10 in 1 million OR At least 10,000 people exposed to risk > 100 in 1 million
3 At least 25 million people exposed to a hazard quotient (HQ) > 1.0 4 At least 10,000 people exposed to HQ >1Blue indicates new drivers since 1996

Note: NATA does not include radon, indoor air, diesel emissions, dioxins, or non-
inhalation exposure pathways.
10%
19%
24%
5%
42%
Major
Area/Other
Onroad
Nonroad
Background
1999 NATA Cancer Risk
Source Sector Contributions
Average Risk: 43 in a Million
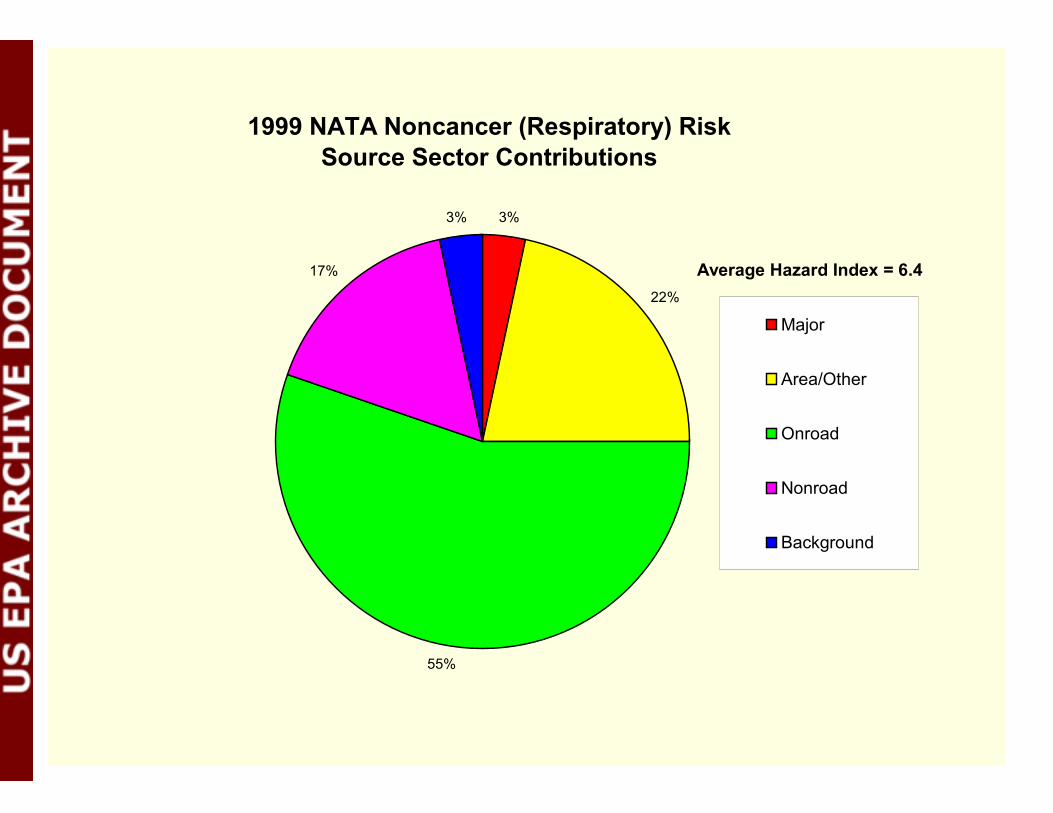
3%
22%
55%
17%
3%
Major
Area/Other
Onroad
Nonroad
Background
1999 NATA Noncancer (Respiratory) Risk
Source Sector Contributions
Average Hazard Index = 6.4

Lets take a closer
look at Benzene
1999 NATA - Pollutant Contribution to Average Cancer Risk (43 in a million)
8%7%
Note: NATA does not include radon, indoor air, diesel emissions, dioxins, or non-inhalation exposure pathways.
Benzene
24%
Ethylene dibromide
9%
Butadiene
9%
Carbon tetrachloride
8%
Acetaldehyde
7%
1,1,2,2 Tetrachloroethane
6%
Bis 2 ethylhexyl phthalate
5%
Naphthalene
5%
Coke Oven Emissions
4%
Tetrachloroethylene
4%
Ethylene oxide
1%
Chromium VI
4%
POM Group_2
1%
Hydrazine
1%
p Dichlorobenzene
1%
Ethylene_dichloride
2%
Other
8%
18
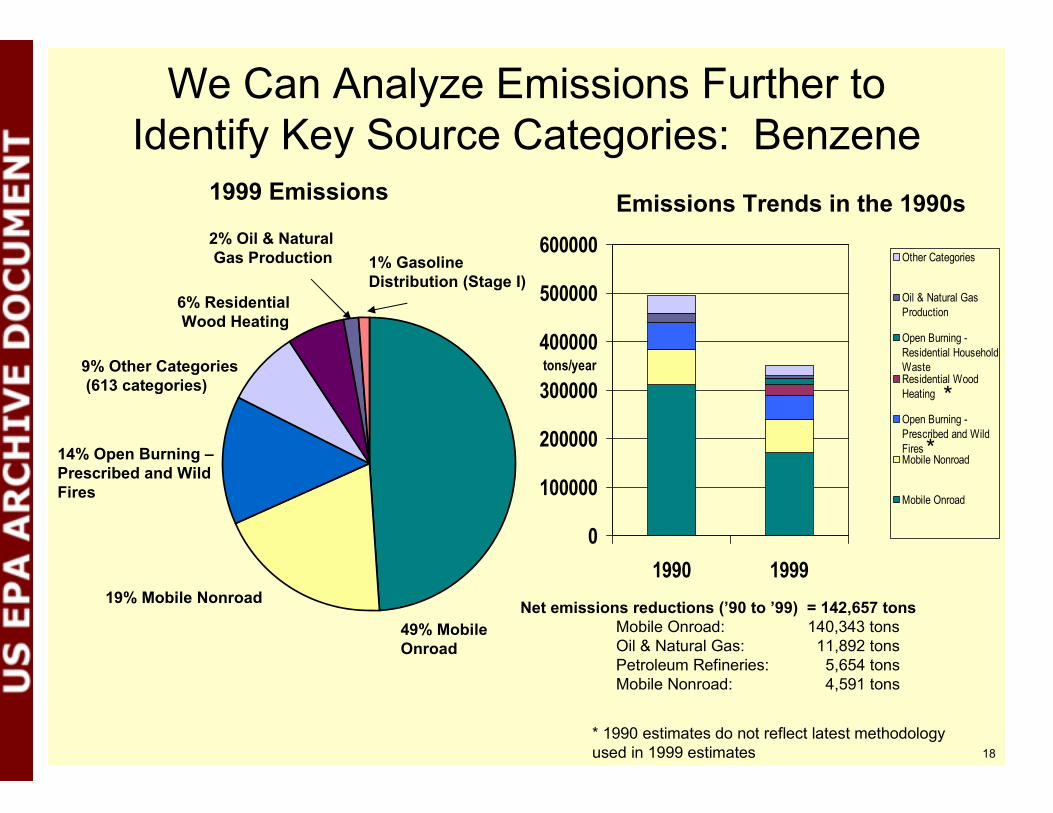
We Can Analyze Emissions Further to
Identify Key Source Categories: Benzene
49% Mobile
Onroad
2% Oil & Natural
Gas Production
9% Other Categories
(613 categories)
19% Mobile Nonroad
14% Open Burning –
Prescribed and Wild
Fires
1% Gasoline
Distribution (Stage I)
6% Residential
Wood Heating
Emissions Trends in the 1990s1999 Emissions
0
100000
200000
300000
400000
500000
600000
1990 1999
tons/year
Other Categories
Oil & Natural Gas
Production
Open Burning -
Residential Household
WasteResidential Wood
Heating
Open Burning -
Prescribed and Wild
FiresMobile Nonroad
Mobile Onroad
Net emissions reductions (’90 to ’99) = 142,657 tons
Mobile Onroad: 140,343 tons
Oil & Natural Gas: 11,892 tons
Petroleum Refineries: 5,654 tons
Mobile Nonroad: 4,591 tons
* 1990 estimates do not reflect latest methodology
used in 1999 estimates
*
*
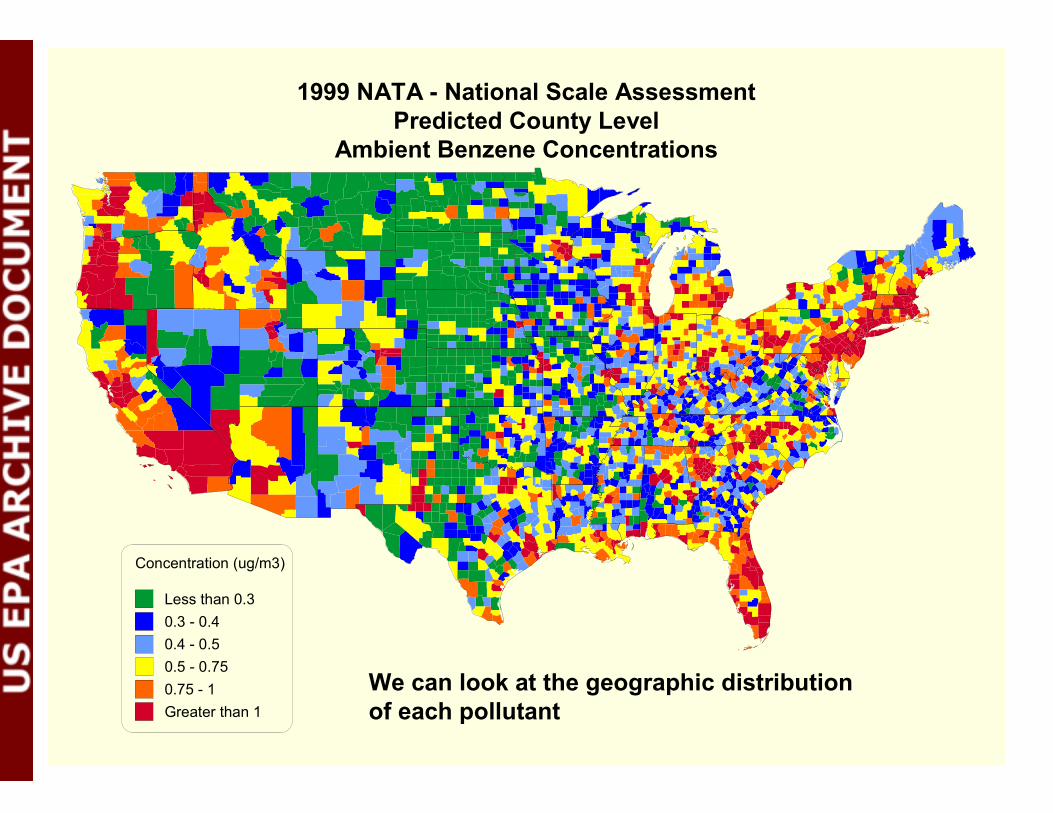
1999 NATA - National Scale AssessmentPredicted County Level
Ambient Benzene Concentrations
Concentration (ug/m3)
Less than 0.3
0.3 - 0.4
0.4 - 0.5
0.5 - 0.75
0.75 - 1
Greater than 1
We can look at the geographic distribution
of each pollutant
1999 NATA - National Scale Assessment
Predicted County Level
Ambient Benzene Concentrations

Median
0.00 - 0.57
0.58 - 0.64
0.65 - 0.80
0.81 - 4.9
Monitoring Sites
• Found very good
agreement with NATA
1999 ambient
concentrations
Model-to-Monitor
Comparison for
Benzene
• Compared 115
monitored values from
1999
1.0=Agreement
Model
overprediction
Model
underprediction
75th percentile
Ben
zene
25th percentile
Median

Lets take a closer
look at Acrolein
1999 NATA - Pollutant Contribution to Average Noncancer Risk (HI=6.4)
Formaldehyde
2%
Acetaldehyde
2%
Bis 2 ethylhexyl phthalate
1%
Chlorine
2%
Other
1%
Methyl bromide
0%2,4 Toluene diisocyanate
1%
Acrolein
91%

22
We Can Analyze Emissions Further to
Identify Key Source Categories: Acrolein
0
10000
20000
30000
40000
50000
60000
70000
1990 1999
tons/year
Other Categories
Structure Fires
Open Burning -
Prescribed and Wild
Fires
Mobile Nonroad
Mobile Onroad
Emissions reductions from 1990 to 1999
Mobile Onroad: 3,730 tons
All Categories 31,273 tons
*
* 1990 estimates do not reflect latest methodology
used in 1999 estimates
1999 Emissions
61% Open Burning -
Prescribed and Wild
Fires
5% Structure Fires
9% Other Categories
(305 categories)
14% Mobile Onroad
11% Mobile
Nonroad
*

We can look at the geographic distribution
of each pollutant
1999 NATA - National Scale AssessmentPredicted County Level
Ambient Acrolein Concentrations
Concentration (ug/m3)
Less than 0.02
0.1 - 0.2
0.2 - 0.3
0.3 - 0.4
0.4 - 0.5
Greater than 0.5
1999 NATA - National Scale Assessment
Predicted County Level
Ambient Acrolein Concentrations
24
Acrolein Monitoring Status
� Model to monitoring comparison not done for
acrolein
� Issue with method sample stability
� EPA is working on a new monitoring method
that may improve reliability
� Resolution pending within the year

25
Where are the air toxic risks of
concern?

26
Geographic Risk Distribution
� Cancer Risk
� Spatially, majority of country predicted to have risk between 25 in a million (1 in 40,000) and 1 in a million
� Most urban locations greater than 25 in a million (1 in 40,000) risk
� Transportation corridors and some locations greater than 50 in a million (1 in 20,000) risk
� Several counties greater than 100 in a million (1 in 10,000) risk
� In comparison, the average risk of contracting cancer from radon is about 2,000 in a million (1 in 500) and the probability of contracting cancer overall is about 330,000 in a million (1 in 3)
� Noncancer
� Over 60% of counties hazard index greater than 1
� Several counties hazard index greater than greater than 10
� High values in Florida forest fires
� Highest risk counties coincide with locations where criteria pollutant issues are significant

Median Risk Level
<1 in a Million
25 - 50 in a Million
>100 in a Million
75 - 100 in a Million
50 - 75 in a Million
1 - 25 in a Million
1999 NATA - National Scale AssessmentPredicted County Level Carcinogenic Risk
1999 NATA - National Scale Assessment
Predicted County Level Cancer Risk – County Medians
Spatially, most of country predicted to have risk between 1 and 25 in a million
Most urban locations greater than 25 in a million
Transportation corridors and some locations greater than 50 in a million
Several counties greater than 100 in a million
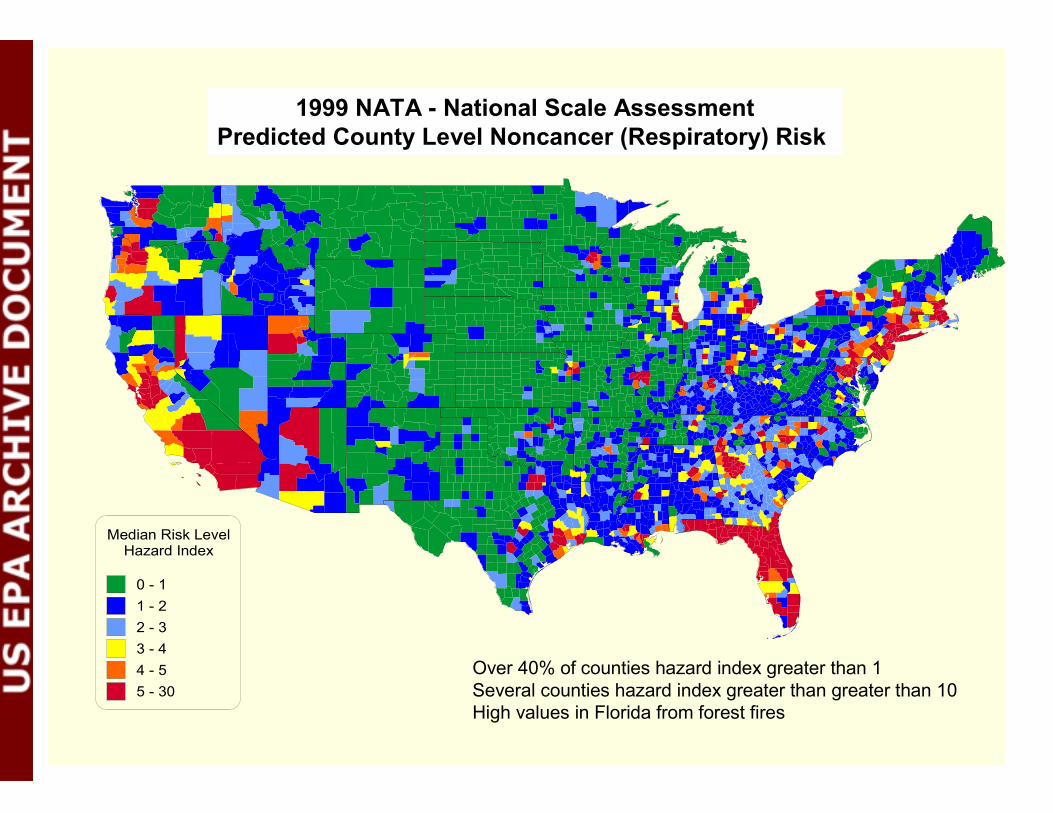
1999 NATA - National Scale AssessmentPredicted County Level Noncancer (Respiratory) Risk
Median Risk LevelHazard Index
0 - 1
1 - 2
2 - 3
3 - 4
4 - 5
5 - 30
Over 40% of counties hazard index greater than 1
Several counties hazard index greater than greater than 10
High values in Florida from forest fires
1999 NATA - National Scale Assessment
Predicted County Level Noncancer (Respiratory) Risk
Median Risk Level
<1 in a Million
25 - 50 in a Million
>100 in a Million
75 - 100 in a Million
50 - 75 in a Million
1 - 25 in a Million
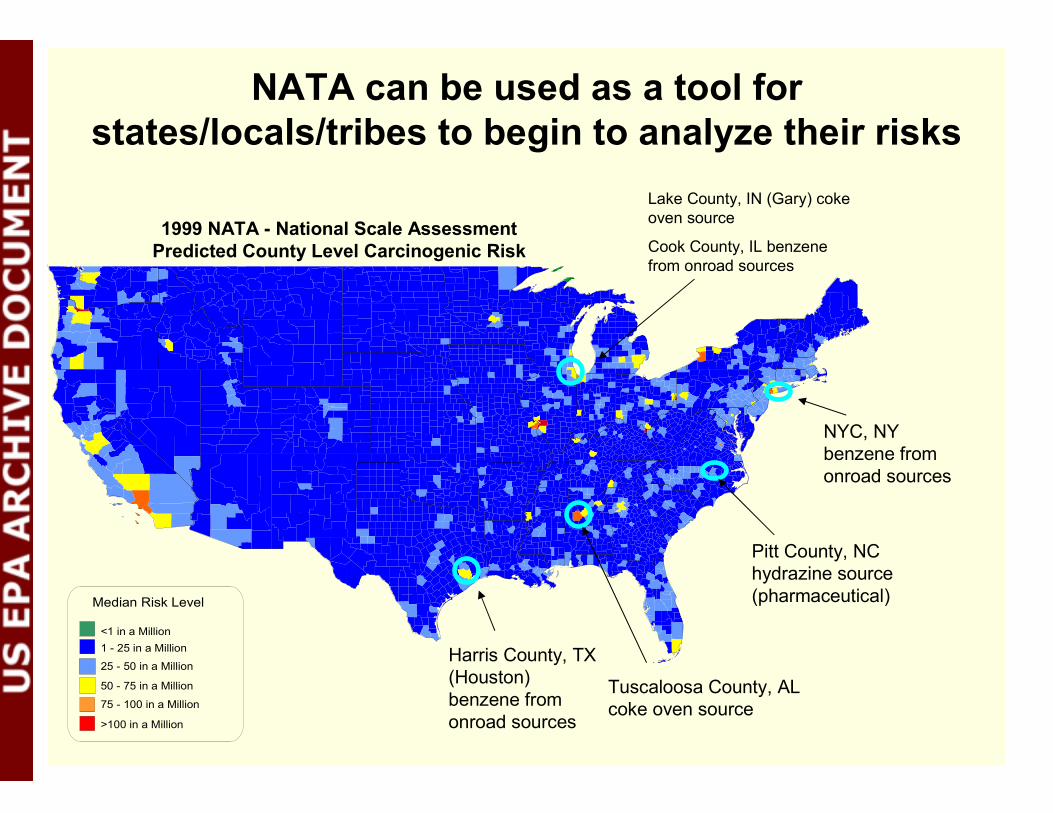
1999 NATA - National Scale AssessmentPredicted County Level Carcinogenic Risk
Pitt County, NC
hydrazine source
(pharmaceutical)
Tuscaloosa County, AL
coke oven source
NYC, NY
benzene from
onroad sources
Lake County, IN (Gary) coke
oven source
Cook County, IL benzene
from onroad sources
Harris County, TX
(Houston)
benzene from
onroad sources
NATA can be used as a tool for
states/locals/tribes to begin to analyze their risks
1999 NATA - National Scale Assessment
Predicted County Level Carcinogenic Risk
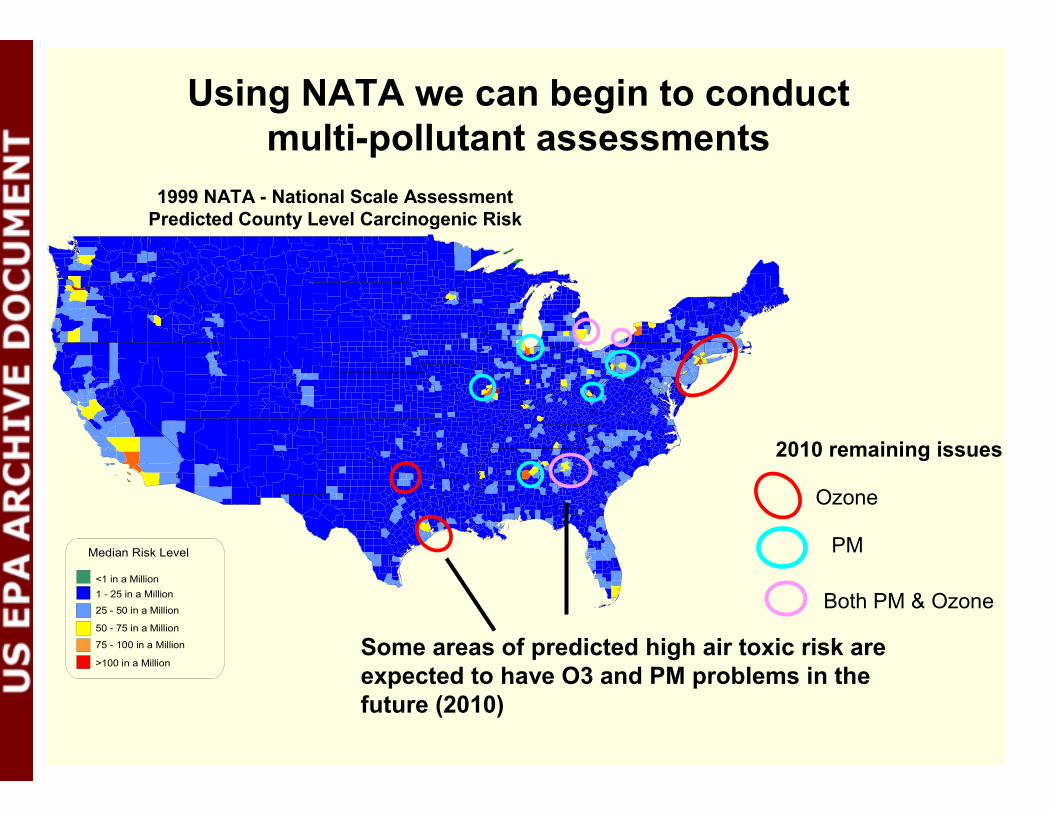
Both PM & Ozone
Some areas of predicted high air toxic risk are
expected to have O3 and PM problems in the
future (2010)
Ozone
2010 remaining issues
PMMedian Risk Level
<1 in a Million
25 - 50 in a Million
>100 in a Million
75 - 100 in a Million
50 - 75 in a Million
1 - 25 in a Million
1999 NATA - National Scale AssessmentPredicted County Level Carcinogenic Risk1999 NATA - National Scale Assessment
Predicted County Level Carcinogenic Risk
Using NATA we can begin to conduct
multi-pollutant assessments

31
What do the NATA Results Mean?
� Generally cancer risks more significant than noncancer
� Identified cancer risks from NATA are significantly less than the average risks from indoor exposures to radon.
� Risk results highly variable from location to location
� Like any assessment of this magnitude, the results have their limitations and contain a degree of uncertainty
� Model-to-monitor results generally show good agreement for volatiles and underprediction for metals
� Model resolution can miss local impacts (e.g., near large polluters)
� Inhalation pathway, chronic exposures only
� Higher risks levels highlight areas for further refinements (i.e., local scale assessments, inventory improvements)
32
What is NATA’s impact on the air
toxics program?� A few pieces of the puzzle to help us track progress of program
� Starting point for local-scale assessment (prioritize pollutants of interest and locations of interest)
� Improving emissions inventories - inspiring greater participation and enhanced quality control
� Impacting the new air toxics monitoring network
� Facilitates future multipollutant assessments
� All of this will enable the Air Toxic Program to more effectively target risk reduction efforts