Hazardous to our Health: The Effects of Urban Sprawl on the Environment and its Inhabitants Erin...
34
Hazardous to our Health: The Effects of Urban Sprawl on the Environment and its Inhabitants Erin Anderson-Ruddon Kayla Arslanian
-
Upload
della-johnson -
Category
Documents
-
view
215 -
download
1
Transcript of Hazardous to our Health: The Effects of Urban Sprawl on the Environment and its Inhabitants Erin...
Hazardous to our Health: The Effects of Urban Sprawl on the
Environment and its Inhabitants
Erin Anderson-RuddonKayla Arslanian
Hazardous to our Health: The Effects of Urban Sprawl on the Environment and its Inhabitants
Sprawl has four dimensions: a population that is widely dispersed in low density development, rigidly separated homes, shops and workplaces, a network of roads marked by huge blocks and poor access, and a general lack of well-defined thriving activity centers or downtowns (Ewing, Pendall, and Chen 2002).
We hypothesize that urban sprawl is harmful to the environment and that the environmental degradation suffered increases health risks in these areas of sprawl.
Urban Sprawl & Air Pollution Air quality is greatly affected by sprawl. Motor vehicles are the leading source of air
pollution. In areas of sprawl, destinations are far apart,
creating a dependence on automobiles to get from destination to destination.
The need to make more car trips increases the average person’s daily miles driven.

Air Pollution & The Sprawl Index The sprawl index categorizes areas according to their level of
sprawl. A standard deviation of 50 separates a high area of sprawl, from
an average area of sprawl, from a low area of sprawl (Sturm and Cohen 2004). For example, Atlanta, GA, an area of very high sprawl has an index of
57.7 whereas Chicago, IL, a denser city has an index of 121.2.
For every 50 unit decrease in standard deviation on the sprawl index (more sprawling), there is a 1.96 miles/day increase in driving per person.
For every 25 unit increase in standard deviation on the sprawl index (less sprawling), there is a 5.4 miles/day decrease in driving per person.
This shows that people in more sprawling areas drive longer distances, more often than those living in areas of relatively low sprawl.

Automobiles & Air Pollution
Because inhabitants in areas of great sprawl have to drive longer distances more frequently, they burn more fuel than persons living in areas of lesser sprawl.
The advent of sprawl could threaten the current positive trend of cleaner air.
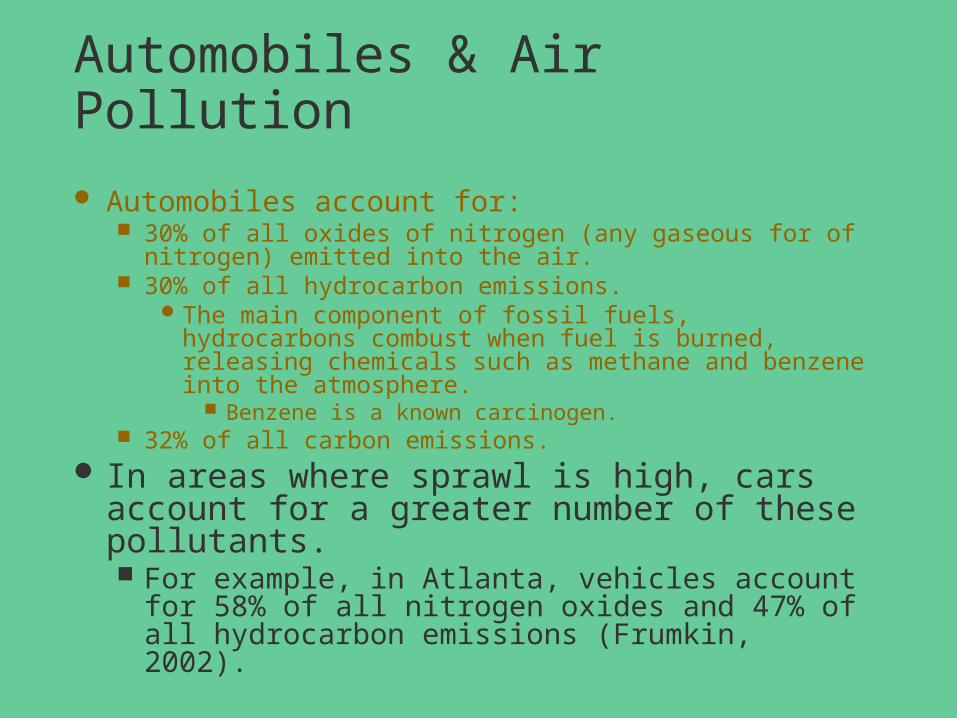
Automobiles & Air Pollution
Automobiles account for: 30% of all oxides of nitrogen (any gaseous
form of nitrogen) emitted into the air. 30% of all hydrocarbon emissions.
The main component of fossil fuels, hydrocarbons combust when fuel is burned, releasing chemicals such as methane and benzene into the atmosphere.
Benzene is a known carcinogen.
32% of all carbon emissions.
Automobiles & Air Pollution
Automobiles account for: 30% of all oxides of nitrogen (any gaseous for of nitrogen)
emitted into the air. 30% of all hydrocarbon emissions.
The main component of fossil fuels, hydrocarbons combust when fuel is burned, releasing chemicals such as methane and benzene into the atmosphere.
Benzene is a known carcinogen. 32% of all carbon emissions.
In areas where sprawl is high, cars account for a greater number of these pollutants. For example, in Atlanta, vehicles account for 58%
of all nitrogen oxides and 47% of all hydrocarbon emissions (Frumkin, 2002).

Urban Sprawl & Ozone Sprawl affects a region’s ozone levels.
Ozone is a photochemical smog created then organic gases (specifically VOCs, nitrogen oxides, heat and sunlight interact (Goldman 2001)).Though ozone is necessary in the stratosphere
to protect earth from the sun’s UV rays, in the troposphere it degrades air quality, and is considered a pollutant.
Currently, over 90 metropolitan areas regularly exceed ozone standards.
The EPA attributes 50% of smog precursors to motor vehicles (Benfield, Raimi and Chen 1999).

Urban Sprawl & OzoneLand use patterns affect levels of
ozone. In sprawling environments, individuals release more VOCs and nitrogen dioxides into the atmosphere, both of which are components of ozone.
avg daily emissions rate perperson (g capita -1)
CompactCity
DispersedCity
VOC 3.93 4.04NOx 4.32 7.40
Table 1: Average daily VOC and NOx emission rate for compact and disperse cities (Borrego,
Martins, and Tchepel et al 2006).
Sprawl Index & Ozone
Every 25 unit increase in the sprawl index (less sprawling) relates to a 7.5 parts per billion decrease in maximum ozone levels.
Ozone levels between the most sprawling regions and the least sprawling regions differ by 41 parts per billion (Ewing, Pendall, and Chen 2002).
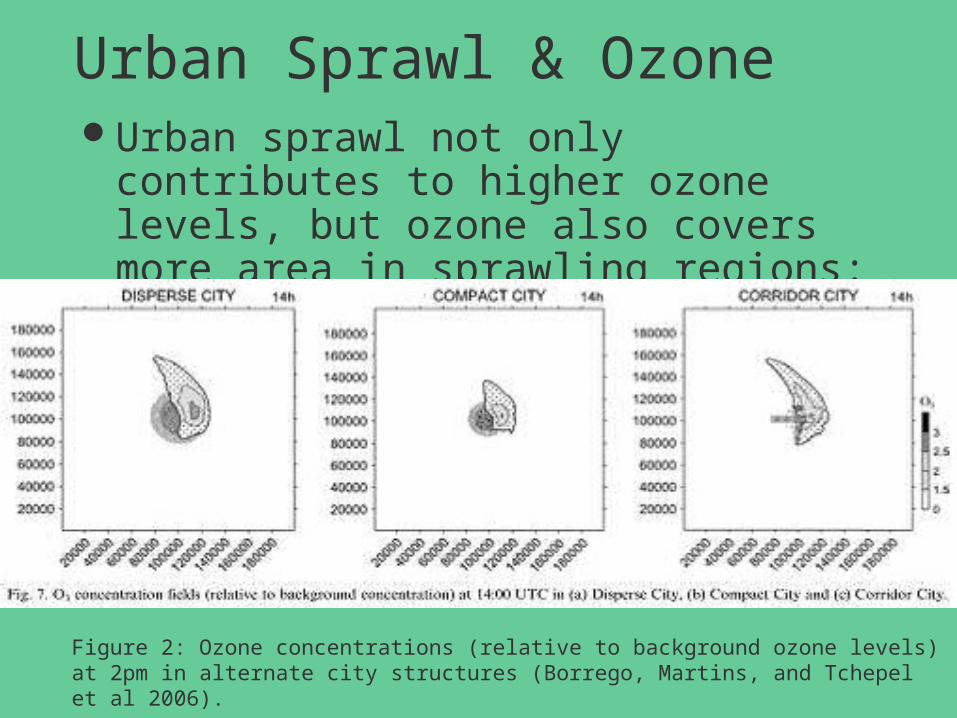
Urban Sprawl & OzoneUrban sprawl not only contributes to
higher ozone levels, but ozone also covers more area in sprawling regions:
Figure 2: Ozone concentrations (relative to background ozone levels) at 2pm in alternate city structures (Borrego, Martins, and Tchepel et al 2006).

Urban Sprawl & OzoneOzone affects more people in areas of
greater sprawl:
Ozone ConcentrationsSuperior to the backgroundconcentration (60µgm-3) by afactor
Populationaffected inCompact City
Populationaffected inDisperse City
2.5 14,200 65,5002.0 209,000 306,6001.5 659,000 740,000
Table 2: Population affected by ozone concentrations (Borrego, Martins, and Tchepel et al 2006).Again, because individuals living in sprawl produce more VOCs and nitrogen oxides daily, as a result their ozone levels are higher, cover more area, and affect more people than compact cities. This is because individuals in compact cities produce less VOCs and nitrogen oxides. Thus, their ozone levels, area and population affected by ozone are not as greatly impacted by ozone pollution.

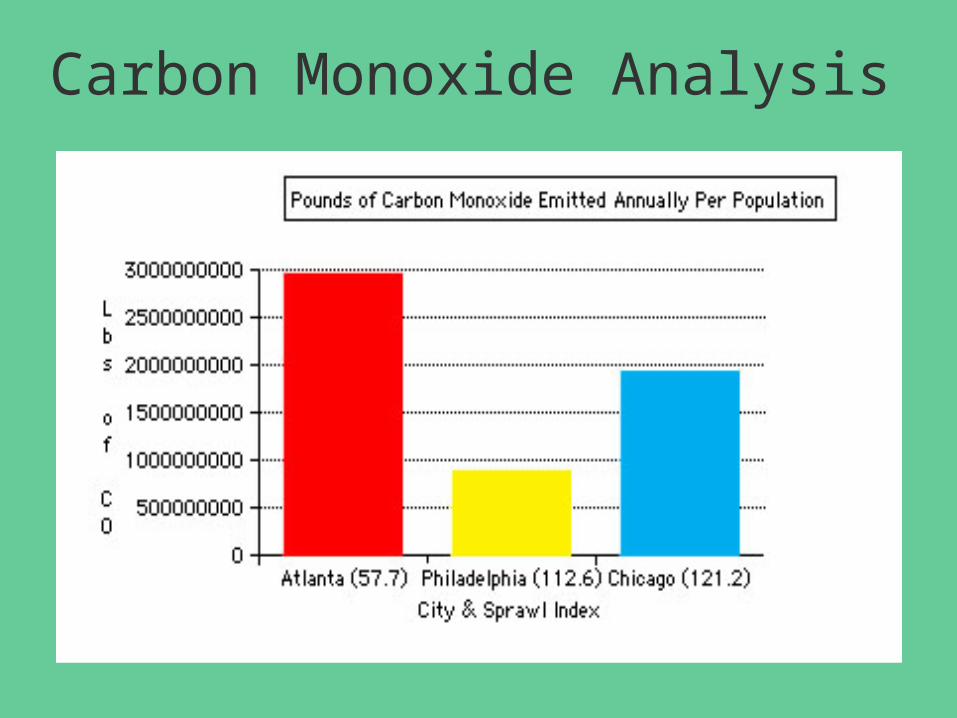
Carbon Monoxide Analysis
Sprawling regions also emit an alarmingly large amount of carbon monoxide. Combining demographic information and data collected on how much carbon monoxide an average car emits, we can see how dangerous sprawl is for air quality.
The EPA estimates that the average car annually produces 22g CO for every 12,500 miles driven (EPA, 1997). This means that the average car produces .00176g CO for every mile driven (22g CO/12,500).
Carbon Monoxide Analysis
It is also recorded the average person in the Atlanta metropolitan area travels 34.1 miles/day, whereas the average person in the Philadelphia metro area dives 16.9 miles a day, and the average Chicago metro inhabitant dives 19.9 miles per day (Frumkin, 2002).
On the sprawl index, Atlanta’s score is has a 57.7 (very sprawly), Philadelphia’s is 112.6 (average sprawl), and Chicago’s is 121.2 (higher sprawl).

Carbon Monoxide Analysis
Carbon Monoxide Analysis
Carbon Monoxide Analysis The Atlanta metro area has nearly two million less
people then the Philadelphia metro area, yet Atlanta emits around two billion more pounds of carbon monoxide yearly. Chicago’s metro area has twice the population of the Atlanta metro area, and Atlanta still produces more than one billion pounds of carbon per year.
The differences seen are attributed to sprawl: individuals living in sprawl drive more frequently and drive than those living elsewhere, and the impact this car dependency has on the environment will be detrimental.
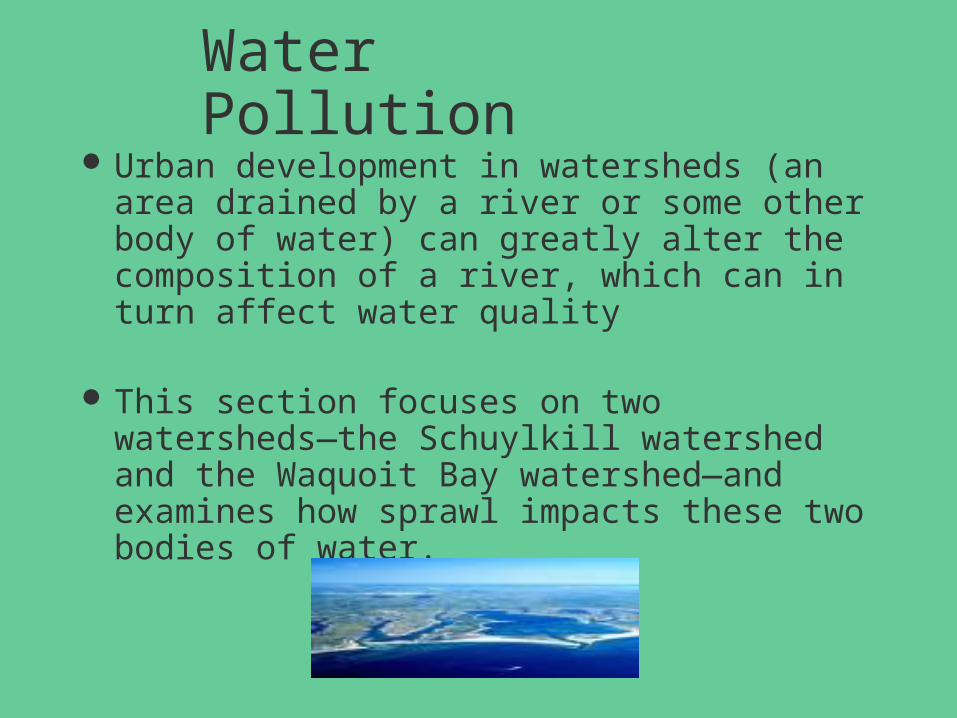
Water Pollution
Urban development in watersheds (an area drained by a river or some other body of water) can greatly alter the composition of a river, which can in turn affect water quality
This section focuses on two watersheds—the Schuylkill watershed and the Waquoit Bay watershed—and examines how sprawl impacts these two bodies of water.
Schuylkill River, PA
The Schuylkill River has some of the highest dissolved solute concentrations of all water sources in the northeast—it has the highest nitrate levels and the second highest chloride levels (Interlandi and Crockett 2003).
The Schuylkill also had the fastest increase
for nitrate, chloride and residuals over all other watersheds in the northeast (Interlandi and Crockett 2003). This suggests that development in the Schuylkill watershed negatively impacts the river.
Schuylkill River, PA
From 1982 to 1997, developed land in the Schuylkill watershed increased from 21.5% of the total watershed land area to 28.5%—over 34,000 hectares of forest and agricultural land were urbanized. This change in land use resulted in a 31% increase in developed land. When sprawling occurred in the watershed and
developed land increased by 31%, chloride levels increased 37% in that same time period (Interlandi and Crockett 2003).
Waquoit Bay, MA The Waquoit Bay is located in Cape Cod, MA, and
like the Schuylkill watershed, the Waquoit Bay watershed has seen a recent burst in urban development.
The predominant source of nitrogen in the water comes from atmospheric deposition, fertilizer use and wastewater disposal.
in the 1980s, the major source of nitrogen changed from atmospheric deposition to wastewater, reflecting the increase in urbanization in the Waquoit watershed (Bowen and Valiela, 2001).

Land Use Change in the Waquoit Watershed
Waquoit Bay
Between 1938 and 1990, when most urbanization occurred in the area, nitrogen inputs into the Waquoit bay watershed increased twofold (Bowen and Valiela, 2001).
In 1990, wastewater accounted for 22% of the bay’s total nitrogen delivery, whereas in the mid-century, it only accounted for 2%.
Thus, nitrogen from wastewater increased ten-fold during the period of urban sprawl in the watershed.

Health Hazards of Sprawl
The harmful effects that sprawl has on air and water quality have implications for human health.
AIR Nitrogen oxides can react with numerous
compounds to form acid and other particles Particles can inflict damage to lung tissue
which can cause or worsen respiratory diseases such as emphysema and bronchitis
Health Hazards of Sprawl - Air
VOCs release hydrocarbons, some of which are carcinogenic
Carbon monoxide affects the central nervous system, causing
visual problems, reduced ability to work or learn, and difficulty performing tasks
At extremely high levels, carbon monoxide is poisonous and can cause death (EPA, 2006).
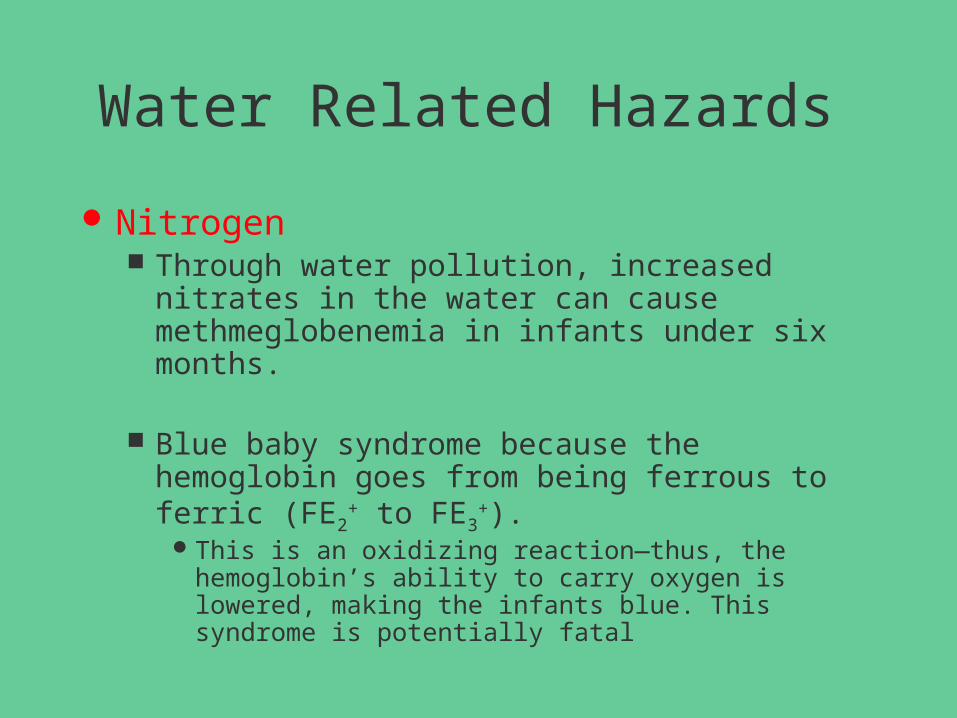
Water Related Hazards
Nitrogen Through water pollution, increased nitrates in the
water can cause methmeglobenemia in infants under six months.
Blue baby syndrome because the hemoglobin goes from being ferrous to ferric (FE2
+ to FE3+).
This is an oxidizing reaction—thus, the hemoglobin’s ability to carry oxygen is lowered, making the infants blue. This syndrome is potentially fatal
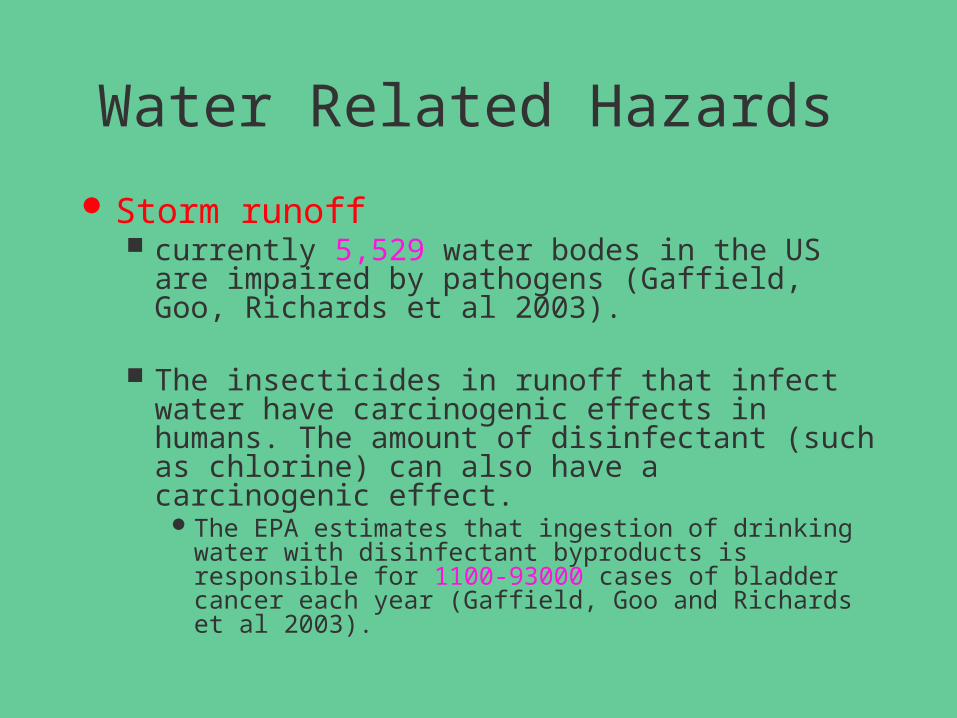
Water Related Hazards
Storm runoff currently 5,529 water bodes in the US are
impaired by pathogens (Gaffield, Goo, Richards et al 2003).
The insecticides in runoff that infect water have carcinogenic effects in humans. The amount of disinfectant (such as chlorine) can also have a carcinogenic effect.
The EPA estimates that ingestion of drinking water with disinfectant byproducts is responsible for 1100-93000 cases of bladder cancer each year (Gaffield, Goo and Richards et al 2003).
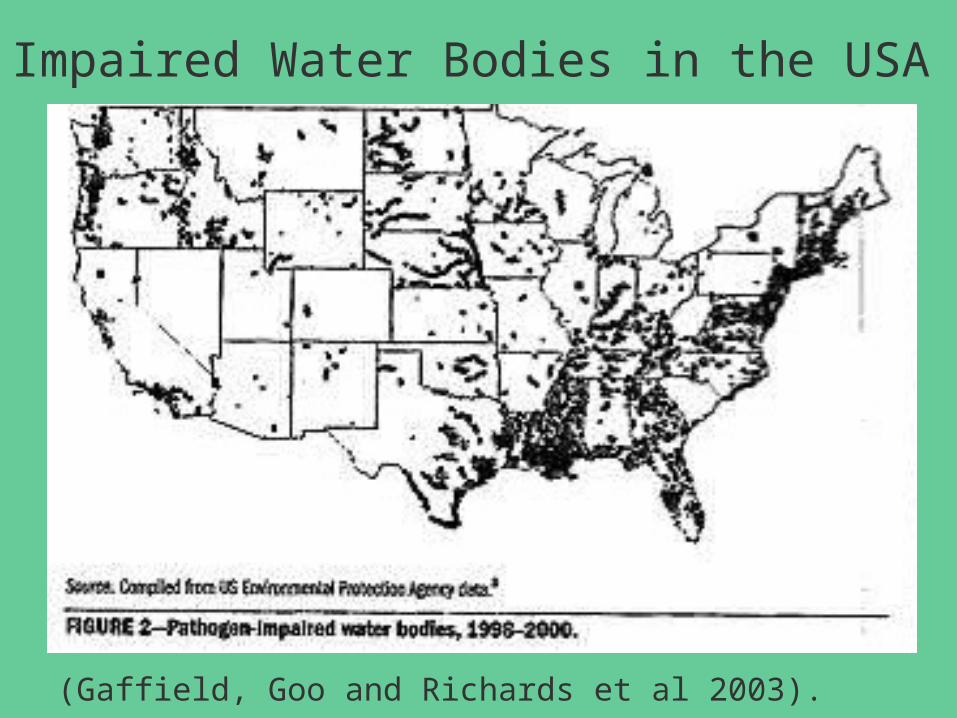
(Gaffield, Goo and Richards et al 2003).
Impaired Water Bodies in the USA

General Health Hazards
Sprawl categorically makes people less healthy.
The overall sprawl index significantly predicts the number of chronic medical conditions and of physical health-related quality of life of the residents in the area.
Greensboro, NCSan Fran, CA
46.8148.6
190181
46.844.2
1.351.14
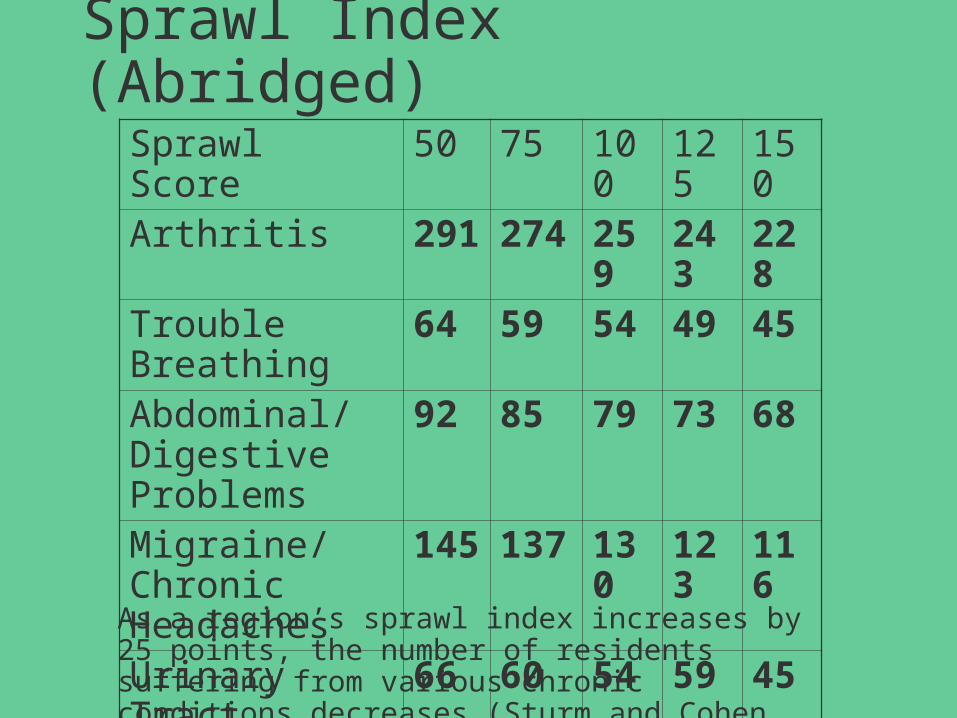
Sprawl Index (Abridged)
As a region’s sprawl index increases by 25 points, the number of residents suffering from various chronic conditions decreases (Sturm and Cohen 2004).
Sprawl Score 50 75 100 125 150Arthritis 291 274 259 243 228Trouble Breathing
64 59 54 49 45
Abdominal/Digestive Problems
92 85 79 73 68
Migraine/Chronic Headaches
145 137 130 123 116
Urinary Tract Issues
66 60 54 59 45
CONCLUSION
America will undoubtedly continue to develop, thus, action must be taken to ensure that further development is not hazardous to the environment and to its inhabitants.
It is necessary that that future designs must be eco-friendly, and moreover, must consider the health of its residents.
Works Cited:
An Introduction to Indoor Air Quality: Organic Gases (Volatile Organic Compounds - VOCs). Environmental Protection Agency. 5 December 2006. <http://www.epa.gov/iaq/voc.html>
Air Emissions Trends - Continued Progress Through 2005. Environmental Protection Agency. 5 December 2006. <http://www.epa.gov/airtrends/econ-emissions.html>
Atlanta Metropolitan Area. Wikipedia. 5 December 2006. <http://en.wikipedia.org/wiki/Atlanta_metropolitan_area>
Benfield, F. Kaid, Matthew D. Raimi, and Donald D.T. Chen. Once There Were Greenfields: How Urban Sprawl is Undermining America’s Environment, Economy, and Social Fabric. New York: Natural Resources Defense Council, 1999.
Borrego, C., H. Martins, O Tchepel, et al. (2006) “How Urban Strucutre Can Affect City Sustainability from an Air Quality Perspective.” Environmental Modeling and Software. 21: 461-467.
Bowen, Jennifer L. and Ivan Valiela. (2001). “The Ecological Effects of Urbanization of Coastal Watersheds: Historical Increases in Nitrogen Loads and Eutrophication of Waquoit Bay Estuaries.” Canadian Journal of Fisheries and Aquatic Sciences. 58: 1489-1500.
Chloride. Wikipedia. 5 December 2006.
Chicagoland. Wikipedia. 5 December 2006. <http://en.wikipedia.org/wiki/Chicago_Metropolitan_Area>
Delaware Valley. Wikipedia. 5 December 2006. <http://en.wikipedia.org/wiki/Delaware_Valley>
Ewing, Richard, Rolf Pendall, and Don Chen. “Measuring Sprawl and its Impact.” Smart Growth America. 24 October 2006. <http://www.smartgrowthamerica.org/sprawlindex/MeasuringSprawl.PDF>
Gardener, Sarah. “The Impact of Sprawl on the Environment and Human Health.” Urban Sprawl: A Comprehensive Reference Guide. Ed. David C. Soule. Westport, CT: Greenwood Press, 2006. 240-260.
Gaffield, Stephen J., Robert L. Goo, Lynn A. Richards et al. (2003) “Public Health Effects of Inadequately Managed Stormwater Runoff.” American Journal of Public Health. 98: 1527-1531.
Goldman, Todd. "Consequences of Sprawl: Threats to California's Natural Environment and Human Health" eScholarship Repository. Institute of Urban & Regional Development at UC Berkley. 24 November 2006. <http://repositories.cdlib.org/iurd/wps/WP-2001-06>
Health and Environmental Impacts of CO. Environmental Protection Agency. 6 December 2006. < http://www.epa.gov/air/urbanair/co/hlth1.html>
Health and Environmental Impacts of NOx. Environmental Protection Agency. 6 December 2006. <http://www.epa.gov/air/urbanair/nox/hlth.html>
Frumkin, Howard. (2002) “Urban Sprawl and Public Health.” U.S. Department of Health and Human Services: Public Health Reports. 117: 201-217.
Interlandi, Sebastian J. and Christopher. S. Crockett. (2003) “Recent Water Quality Trends in the Schuylkill River, Pennsylvania, USA: A Preliminary Assessment of the Relative Influences of Climate, River Discharge and Suburban Development.” Water Research. 37: 1737-1748.
Nitrate. Wikipedia. 5 December 2006. <http://en.wikipedia.org/wiki/Nitrate>
What are the Six Common Air Pollutants? Environmental Protection Agency. 5 December 2006.<http://www.epa.gov/air/urbanair/6poll.html>
Wolfe, Amir H. and Jonathan A. Patz. (2002) “Reactive Nitrogen and Human Health: Acute and Long-term Implications.” Ambio. 31: 120-125.
Images:
Massachusetts Estuaries Project. 5 December 2006. <http://www.oceanscience.net/estuaries/Quashnet.htm>
Schuylkill River: National State and Heritage Area. 5 December 2006. <http://www.schuylkillriver.org/images/home/home_map.gif>
Waquoit Bay: National Estuarine Bay Research Reserve. 5 December 2006. <http://www.waquoitbayreserve.org/images/b&w_aerial_photo_wshed.jpg>
Waquoit Bay: National Estuarine Bay Research Reserve. 5 December 2006. <http://www.waquoitbayreserve.org/images/lu_change_wb_watershed.jpg>