Vancouver Sprawl
17
Sprawl and Smart Growth in Greater Vancouver northwest environment watch 1402 Third Avenue, Suite 500, Seattle, Washington 98101-2130 USA (206) 447-1880, www.northwestwatch.org A Comparison of Vancouver, British Columbia, with Seattle, Washington September 12, 2002 www.northwestwatch.org/press/vancouvergrowth.html smart growth bc 201 - 402 West Pender Street, Vancouver, British Columbia V6B 1T6 Canada (604) 915-5234, www.smartgrowth.bc.ca
Transcript of Vancouver Sprawl

Sprawl and Smart Growth in Greater Vancouver
northwest environment watch
1402 Third Avenue, Suite 500, Seattle, Washington 98101-2130 USA(206) 447-1880, www.northwestwatch.org
A Comparison of Vancouver, British Columbia, with Seattle, Washington
September 12, 2002www.northwestwatch.org/press/vancouvergrowth.html
smart growth bc
201 - 402 West Pender Street, Vancouver, British Columbia V6B 1T6 Canada(604) 915-5234, www.smartgrowth.bc.ca

sprawl and smart growth in greater vancouver, september 2002 2
E X E C U T I V E S U M M A RY
■ Greater Vancouver’s population increased by nearly 50 percent between 1986 and2001, a higher annual growth rate (2.6 percent) than many developing-worldmegacities. This rapid growth has brought two key challenges: maintainingtransportation options for an increasingly crowded region and protecting greenspace and farmland from runaway development.
■ Greater Vancouver has met both challenges by channeling growth inward intocompact neighborhoods, which consume less land and maintain moretransportation options than does sprawl. Greater Seattle, in contrast, has grownoutward, at the expense of both farmland and transportation choices.
■ Fully 62 percent of greater Vancouver’s residents now live in compactneighborhoods (defined as having 12 residents or more per acre), up from 46percent in 1986. In contrast, only 25 percent of Seattle-area residents live incompact neighborhoods.
■ Eleven percent of greater Vancouver’s residents live in highly compact, pedestrian-oriented neighborhoods (40 residents or more per acre), the gold standard forcompact growth.
■ Not all Vancouver-area jurisdictions have been equally successful at containingsprawl. New Westminster and the cities of Vancouver and North Vancouver havedone best, with between 78 and 90 percent of their residents living in compactneighborhoods in 2001; West Vancouver, Port Moody, and Langley District havelagged, with only about 25 percent of their residents living in compact communities.The metropolitan area’s continued success depends on intensifying development of afew dense residential areas.
■ One reason for Vancouver’s success is BC’s provincewide farmland protectionpolicies, which established the Agricultural Land Reserve (ALR) in the 1970s. TheALR has protected farmland within greater Vancouver and, almost inadvertently,helped promote compact communities. In contrast, metropolitan Seattle’s system forestablishing land-use policies has long been more localized and, as a result, moresusceptible to development pressures. Recently the BC provincial government hasmade changes to the Agricultural Land Commission Act that allow for more localcontrol over farmland protection.
■ Had greater Vancouver sprawled like Seattle during the 1990s, it would havedeveloped an additional 18,000 acres—an area about four-fifths the size of Burnaby.
■ Compared with greater Vancouver, greater Seattle spreads across three-quartersmore land per resident. If greater Vancouver had the same overall populationdensity as Seattle, about 650 square kilometers of additional land would be coveredwith suburban development—an area equivalent to all the remaining developableland in the Greater Vancouver Regional District (GVRD), plus four-fifths of theremaining agricultural land.

sprawl and smart growth in greater vancouver, september 2002 3
I N T RO D U C T I O N A N D M E T H O D S
T H E C H A L L E N G E O F R A P I D P O P U L AT I O N G ROW T H
To examine patterns of metropolitan growth in the greater Vancouver and greaterSeattle areas, researchers at Northwest Environment Watch (NEW) and thenonprofit research group CommEn Space examined population trends using datafrom satellite images and digital mapping, as well as data from the 1986, 1991,1996, and 2001 Canadian censuses and the 1990 and 2000 US censuses.
NEW and CommEn Space analyzed data for each city or suburban block in theGreater Vancouver Regional District, except for 1986 information on sparselypopulated portions of Vancouver Electoral District A, the majority of Lion’s Bay, anda small portion of Maple Ridge, for which we lacked data. We did similar analysesof greater Seattle using data from the US census. For each metropolitan location, weused a digital mapping technique to expand a circle outward from that point untilthe circle contained at least 500 residents (or 1,000 acres, whichever came first).1 Wethen calculated the number of people per acre within that circle and assigned thatdensity to the location at the circle’s center. This measurement provides a proxy forthe density of the neighborhood surrounding each location in greater Vancouver andgreater Seattle.
NEW and CommEn Space also analyzed Landsat satellite images from 1987 and1999 for greater Vancouver, and from 1988 and 1999 for greater Seattle todetermine the extent to which impervious surface—roads, rooftops, and parkinglots—covered the landscape. This analysis let us measure impervious surface at twothresholds: partially impervious, where roughly 15 percent or more of the landscapeis covered by roads, buildings, and other hard, built surfaces; and fully impervious,where at least 80 percent of the landscape is covered by such surfaces. These twodata sets—population density and land covered by built surfaces—provided a varietyof ways to measure growth in the two metropolitan regions.
Over the past 15 years, the greater Vancouver region added an average of nearly fivenew residents an hour. Vancouver’s population swelled from 1.4 million to just over2 million. This increase translates to an average annual growth rate (2.6 percent)higher than megacities such as Cairo, Egypt; Jakarta, Indonesia; and Rio de Janeiro,Brazil (see Table 1).2 Greater Vancouver also grew faster over the last decade thanmetropolitan Seattle (1.7 percent per year from 1990 through 2000) and on a parwith metropolitan Portland, Oregon (2.4 percent per year from 1990 through 2000).Although the growth rate slowed slightly after 1996—to 4.2 people per hour, downfrom 5.2 people per hour during the previous five years—greater Vancouver stillgrew at a pace that, if sustained, would double the region’s population by 2038.
The challenge of rapid population growth underlines the importance of planninggrowth well. Typically, expanding ranks of people worsen traffic and consume moreopen space for urban and suburban development. If the region chooses to

sprawl and smart growth in greater vancouver, september 2002 4
Table 1. Vancouver’s annual population growth rate has rivaled rates of manyThird World megacities
Recent annual population growth
Karachi, Pakistan 2.6%Vancouver, BC 2.6%Jakarta, Indonesia 2.3%Cairo, Egypt 2.3%Rio de Janeiro, Brazil 1.9%
Sources: Vancouver population, Census of Canada; international cities, see endnote 2.
S M A RT G ROW T H A N D S P R AW L I N G R E AT E R VA N C O U V E R
accommodate new residents by sprawling outward, Fraser Valley farmland—themost fertile in British Columbia—could be used for a different, and permanent,crop: tracts of suburban housing. Given the speed of greater Vancouver’s growthand its limited surrounding land, the region does not have the luxury of poorlyplanned growth. If Vancouver is to preserve farmland and improve transportationchoices for residents, it has to grow smart, which means concentrating populationincreases in existing neighborhoods.
Researchers comparing 68 cities on four continents have identified populationdensity thresholds that increase residents’ transportation options. In neighborhoodswith fewer than 12 people per acre, a car is needed for virtually every trip; mostresidents must drive to work, stores, and basic services, and those without access tocars are often stranded. We term these neighborhoods “sprawling” or “car-dependent” in this report. (Below 1 person per acre, communities are still car-dependent but are called “rural.”) Above roughly 12 people per acre, publictransportation becomes cost-effective. Research shows that in such neighborhoods—which we refer to as “transit-oriented”—bus ridership increases, private vehicleownership dips, car trips become shorter, and gasoline consumption falls. Aboveroughly 40 people per acre—typical downtown densities—destinations are closeenough together that walking and biking flourish and driving decreases substantially.In these “pedestrian-oriented” neighborhoods, as many as one-third of householdsdo not own a car at all.3 Together, transit- and pedestrian-oriented communities arecalled “compact” or “smart-growth” neighborhoods in this report (see Figure 1).4
Compact neighborhoods use land more intensively but pave over less of thelandscape. Person for person, compact neighborhoods cover less land withimpervious surfaces such as roads, rooftops, and parking lots than do more-sprawling development patterns. Impervious surface increases flooding, erosion, andsedimentation in nearby streams. It slows the recharge of underground aquifers,lowers water tables, and raises stream temperatures. These changes diminish watersupply, harm water quality, and undermine aquatic ecosystems.5

sprawl and smart growth in greater vancouver, september 2002 5
Figure 1. Neighborhood density thresholds
Rural
Less than one person per acre: dependent on motor vehicles; developed little or atextremely low density.
Car-dependent or sprawling
1–12 people per acre: virtually all trips taken by car or private truck.
Compact or smart-growth
Transit-oriented12–40 people per acre: driving declines; transit become viable.
Pedestrian-orientedMore than 40 people per acre: steep decline in driving and vehicle ownership;walking, cycling, and transit flourish.
Not only do compact communities help preserve more green space close to home,but they also take less of a toll on the Earth by fostering alternatives to driving andminimizing reliance on fossil fuels. In British Columbia, for example, the largestsingle source of greenhouse gases is fossil fuels burned by cars and trucks; reduceddriving results in fewer planet-warming emissions, less air pollution, and fewerdangers to wilderness areas threatened by oil drilling.
From 1986 to 2001, the population of greater Vancouver’s compact communitiessurged, rising from 46 to 62 percent of the total (see Figure 2). Its population in car-dependent neighborhoods, meanwhile, actually shrank. During the period, thepopulation living at pedestrian-oriented densities in greater Vancouver increased from6 to 11 percent of all metropolitan residents, while the share living at transit-orienteddensities increased from 40 to 51 percent. About three-fourths of the growth incompact neighborhoods occurred as new residents moved into neighborhoods thatwere already compact. Threshold effects caused the remainder: the addition of newresidents lifted some neighborhoods above the 12-people-per-acre threshold.
Greater Vancouver did slightly better at channeling its development into compactneighborhoods between 1996 and 2001 than during either of the previous two five-year periods (1986–91 and 1991–96). But it did better at channeling developmentinto pedestrian-oriented, as opposed to transit-oriented, development between 1986and 1991 than during the subsequent two periods. Developing more pedestrian-oriented neighborhoods is one key to further success in Vancouver’s quest to protectopen space and provide transportation choices.
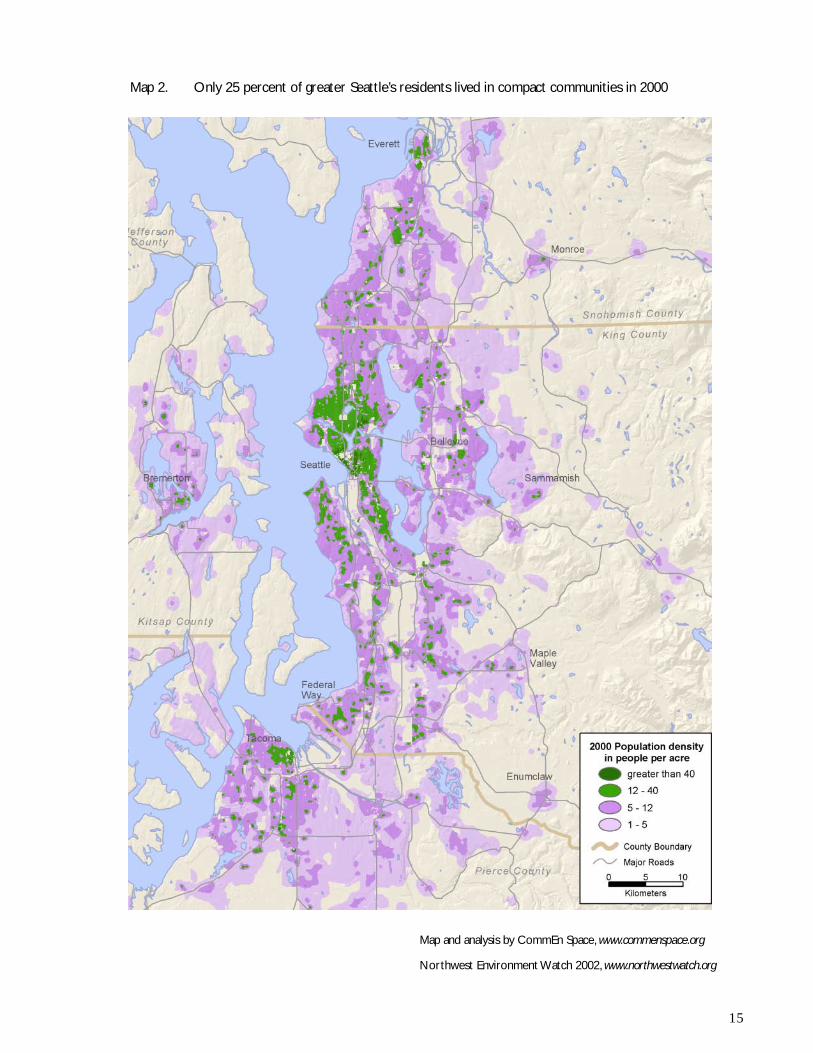
The share of greater Vancouver residents living in compact communities contrastssharply with Seattle. In greater Seattle roughly a quarter of residents lived in compactneighborhoods in 2000—well under half the share of residents living at such densitiesin greater Vancouver. In fact, greater Vancouver’s development pattern is beginning toresemble that of cities laid out before ownership of automobiles was widespread—aremarkable accomplishment for a relatively young city such as Vancouver.
Developing
more pedestrian-
oriented
neighborhoods
is one key to
further success
in Vancouver’s
quest to protect
open space
and provide
transportation
choices

sprawl and smart growth in greater vancouver, september 2002 6
Despite greater Vancouver’s overall achievement, different municipalities havenot been equally effective at concentrating growth in compact neighborhoods. At90 percent, the city of Vancouver had the largest share of residents in compactneighborhoods in 2001. North Vancouver, New Westminster, White Rock,Richmond, and Burnaby followed, at 70–80 percent each. Most sprawling were PortMoody, West Vancouver, and Langley District, where about three-fourths ofresidents lived in car-dependent neighborhoods (see Table 2).
The gold standard in compact growth is pedestrian-oriented neighborhoods,because they bring the steepest reductions in driving and the largest savings of land.Leading in this regard, New Westminster, North Vancouver, and Vancouver eachhoused 20 to 30 percent of their residents in neighborhoods with pedestrian-orienteddensities, but no other municipalities except Burnaby and Richmond logged evendouble-digit figures. For pedestrian-oriented populations, New Westminster was themost improved city in the area; it raised its pedestrian-oriented share by 17percentage points over the past 15 years.
The most improved municipality overall since 1986 was Pitt Meadows, whichhad no residents in compact communities in 1986 but had clustered together 42percent of its people into such neighborhoods by 2001. Least improved was WestVancouver, which still has few compact neighborhoods (see Table 3).
Of course, compact growth does not by itself guarantee better transit orwalkable neighborhoods. A community can have a large share of residents living attransit-oriented densities but still lack an effective transit system. Reducing car
Figure 2. More than three out of five greater Vancouver residents now livein compact neighborhoods
40%
1986 1991 1996 2001
43% 47% 51%
6%9%
10%
11%
Shar
e of
res
iden
ts li
ving
in c
ompa
ct n
eigh
borh
oods Pedestrian-oriented
Transit-oriented

sprawl and smart growth in greater vancouver, september 2002 7
Table 3. Pitt Meadows showed the largest 15-year gain in compact neighborhoods
Share of residents in Totalcompact neighborhoods increase
1986 1991 1996 2001 1986–2001
Pitt Meadows 0% 8% 25% 42% 42%Port Coquitlam 15% 16% 44% 53% 37%Surrey 15% 24% 36% 48% 34%Maple Ridge 4% 12% 18% 29% 24%Burnaby 46% 58% 63% 70% 24%Richmond 52% 68% 74% 76% 24%Delta 25% 34% 41% 47% 22%Langley District 0% 7% 15% 22% 22%Port Moody 6% 21% 21% 26% 20%White Rock 59% 63% 63% 78% 19%Coquitlam 24% 27% 34% 43% 19%Langley 25% 34% 37% 42% 17%North Vancouver District 13% 15% 20% 29% 16%North Vancouver City 65% 72% 75% 80% 15%New Westminster 67% 70% 76% 78% 11%Vancouver 83% 87% 89% 90% 8%West Vancouver 17% 18% 18% 23% 6%
Table 2. Share of residents in compact neighborhoods by municipality or district*
Vancouver 90% 67% 24%North Vancouver City 80% 51% 29%New Westminister 78% 51% 27%White Rock 78% 75% 2%Richmond 76% 64% 12%Burnaby 70% 57% 13%Port Coquitlam 53% 52% 0%Surrey 48% 48% 1%Delta 47% 45% 2%Coquitlam 43% 39% 5%Pitt Meadows 42% 42% 0%Langley 42% 38% 3%North Vancouver District 29% 25% 4%Maple Ridge 29% 26% 2%Port Moody 26% 26% 0%West Vancouver 23% 22% 0%Langley District 22% 21% 1%
Municipality/District
Compact(total)
Transit-oriented
Pedestrian-oriented
*Numbers shown in these tables were rounded to the nearest whole number

sprawl and smart growth in greater vancouver, september 2002 8
L O S S O F RU R A L L A N D A N D O P E N S PAC E: A C O M PA R I S O N W I T H S E AT T L E
To gauge the long-term effects of land-use policies in greater Vancouver on theregion’s development, one need look no further than metropolitan Seattle. In manyways, the two cities present a natural experiment on the effects of growthmanagement policies. In both cities, growth has been constrained by geographicbarriers: Lake Washington and Puget Sound in Seattle, Georgia Strait and the NorthShore mountains in Vancouver. Both cities are adjacent to fertile agricultural land.Both have experienced tremendous population growth over the last three decades.
But the metropolitan areas differ in two key ways. First, greater Seattle hasseveral major highways that promote car dependence and development on the urbanfringe, while greater Vancouver has not constructed a major freeway system. Second,metropolitan Seattle has had no equivalent to British Columbia’s Agricultural LandReserve, the strict provincial farmland protection law passed in the early 1970s, orthe GVRD’s Green Zone, which, in the mid-1990s, consolidated planning for greaterVancouver’s parkland and open space. These policies, reinforced by other measuresat the local, regional, provincial, and even federal levels, have helped to curbsuburban sprawl and to channel development into compact neighborhoods.
Greater Seattle’s protections for farmland and rural open space have been weak,uncoordinated, and predominantly driven by local politics, rather than state orregional concerns. Various farmland easement programs, both public and private,have protected parcels of farmland in the Puget Sound area, and Washington’sGrowth Management Act may have slowed the loss of farmland after the mid-1990s.But for most of the past three decades, local zoning commissions have overseendevelopment of the Seattle region’s farmland, and all too often they allowed, andeven encouraged, car-dependent growth.6
dependence requires a variety of complementary strategies, including effectiveplanning, sufficient funding for transit, and measures to encourage mixed residentialand commercial land uses. Still, creating compact communities is a key first step toreducing residents’ dependence on cars.
With a limited land base and a population that’s expected to grow steadily fordecades, greater Vancouver confronts a large but not insurmountable challenge.Growth need not mean sprawl: growth can even bolster transportation alternatives ifit is concentrated in pedestrian-oriented zones. The metropolitan area could addanother million residents without developing any new rural land by accepting modestincreases in density in existing car-dependent and transit-oriented neighborhoods(adding 2.5 people per acre across the metropolitan region) and dedicating just 5percent of current lower-density residential areas to new pedestrian-orientedneighborhoods. The alternative to such infill development is to sprawl across openspace and farmland, which, as described in the next section, is the course that Seattlehas followed.
sprawl and smart growth in greater vancouver, september 2002 9
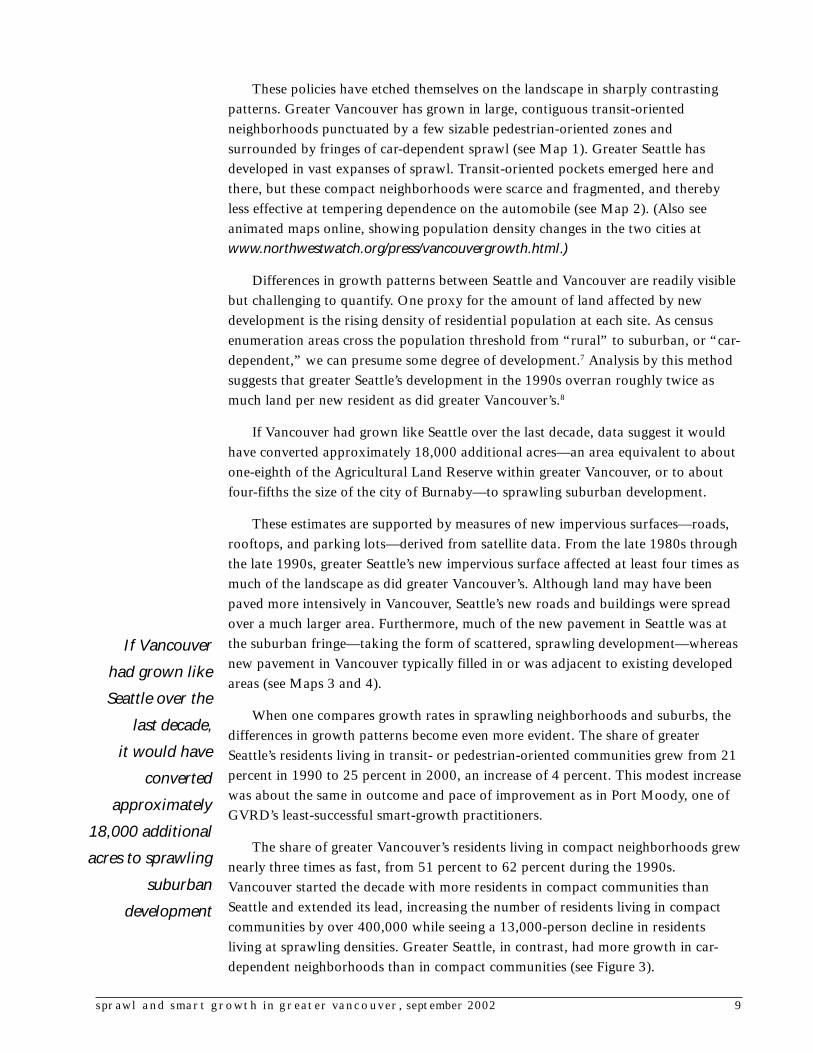
These policies have etched themselves on the landscape in sharply contrastingpatterns. Greater Vancouver has grown in large, contiguous transit-orientedneighborhoods punctuated by a few sizable pedestrian-oriented zones andsurrounded by fringes of car-dependent sprawl (see Map 1). Greater Seattle hasdeveloped in vast expanses of sprawl. Transit-oriented pockets emerged here andthere, but these compact neighborhoods were scarce and fragmented, and therebyless effective at tempering dependence on the automobile (see Map 2). (Also seeanimated maps online, showing population density changes in the two cities atwww.northwestwatch.org/press/vancouvergrowth.html.)
Differences in growth patterns between Seattle and Vancouver are readily visiblebut challenging to quantify. One proxy for the amount of land affected by newdevelopment is the rising density of residential population at each site. As censusenumeration areas cross the population threshold from “rural” to suburban, or “car-dependent,” we can presume some degree of development.7 Analysis by this methodsuggests that greater Seattle’s development in the 1990s overran roughly twice asmuch land per new resident as did greater Vancouver’s.8
If Vancouver had grown like Seattle over the last decade, data suggest it wouldhave converted approximately 18,000 additional acres—an area equivalent to aboutone-eighth of the Agricultural Land Reserve within greater Vancouver, or to aboutfour-fifths the size of the city of Burnaby—to sprawling suburban development.
These estimates are supported by measures of new impervious surfaces—roads,rooftops, and parking lots—derived from satellite data. From the late 1980s throughthe late 1990s, greater Seattle’s new impervious surface affected at least four times asmuch of the landscape as did greater Vancouver’s. Although land may have beenpaved more intensively in Vancouver, Seattle’s new roads and buildings were spreadover a much larger area. Furthermore, much of the new pavement in Seattle was atthe suburban fringe—taking the form of scattered, sprawling development—whereasnew pavement in Vancouver typically filled in or was adjacent to existing developedareas (see Maps 3 and 4).
When one compares growth rates in sprawling neighborhoods and suburbs, thedifferences in growth patterns become even more evident. The share of greaterSeattle’s residents living in transit- or pedestrian-oriented communities grew from 21percent in 1990 to 25 percent in 2000, an increase of 4 percent. This modest increasewas about the same in outcome and pace of improvement as in Port Moody, one ofGVRD’s least-successful smart-growth practitioners.
The share of greater Vancouver’s residents living in compact neighborhoods grewnearly three times as fast, from 51 percent to 62 percent during the 1990s.Vancouver started the decade with more residents in compact communities thanSeattle and extended its lead, increasing the number of residents living in compactcommunities by over 400,000 while seeing a 13,000-person decline in residentsliving at sprawling densities. Greater Seattle, in contrast, had more growth in car-dependent neighborhoods than in compact communities (see Figure 3).
If Vancouver
had grown like
Seattle over the
last decade,
it would have
converted
approximately
18,000 additional
acres to sprawling
suburban
development

sprawl and smart growth in greater vancouver, september 2002 10
Over time, greater Vancouver’s land-use policies have conserved enormousamounts of agricultural land and open space. Per capita, urban and suburbandevelopment occupies nearly three-quarters more land in the Seattle area than in theVancouver area. Had greater Seattle’s overall development patterns been the norm ingreater Vancouver, about 650 additional square kilometers would be covered bysuburban sprawl. More concretely, if Vancouver had grown the way Seattle did overthe last century, all remaining developable land in greater Vancouver, along withfour-fifths of the remaining agricultural land, would be covered with tracts ofsuburban housing.9
C O N C L U S I O N
Greater Vancouver’s land-use policies, including the provincial Agricultural LandReserve, have restrained suburban sprawl, slowed the loss of rural land and openspace over the last 30 years, and made transportation alternatives viable bychanneling development into compact neighborhoods. Seattle’s historically weaker,locally controlled zoning protections for agricultural land have led to rampant car-dependent sprawl and attendant losses of rural land and open space on themetropolitan fringe.
Metropolitan Vancouver can do better still if it holds the line on conversions ofrural land and concentrates new development in dense, pedestrian-orientedneighborhoods. Growth that emulates the city of North Vancouver, rather than thedistrict of Langley, for example, would occupy about a quarter as much of thelandscape, while channeling nearly four times as many residents into transit- orpedestrian-oriented communities.
Figure 3. Greater Vancouver saw tremendous gains in compact neighborhoods
200,000
150,000
50,000
250,000
350,000
100,000
0
450,000
400,000
300,000
Seattle Vancouver–50,000
< 12 residents per acre> 12 residents per acre
Popu
latio
n ch
ange
in t
he 1
990s

sprawl and smart growth in greater vancouver, september 2002 11
A B O U T N O RT H W E S T E N V I RO N M E N T WAT C H
Earlier this year, BC’s provincial government localized some control over theagricultural land reserve. If Seattle’s experience is any guide, a more decentralizedsystem of land-use controls will make it even more necessary for local governmentsto make wise and informed choices about the region’s agricultural lands. GreaterVancouver’s successes so far have resulted from conscious decisions at the local,regional, and provincial levels to protect farmland, limit sprawl, and minimize theamount of land consumed by suburban development. What happens next is up to thepeople of greater Vancouver.
Northwest Environment Watch (NEW) is a Seattle-based, nonprofit research andcommunication center that monitors progress toward an environmentally soundeconomy and way of life in the Pacific Northwest, a region that includes BritishColumbia, Washington, Oregon, Idaho, and adjoining parts of Alaska, Montana,and California. NEW’s research programs are focused on two efforts: to monitor theNorthwest’s progress toward sustainability and to identify the most importantreforms for the region to implement. This report expands on research completed forNEW’s most recent publication, This Place on Earth 2002: Measuring What Matters,the first product of the group’s multiyear project to develop an index of true progressfor the Northwest.
Authors of the report include Alan Durning, executive director; Clark Williams-Derry, research director; Eric de Place, research associate; and Dan Bertolet, researchintern. Tim Schaub of CommEn Space, Seattle, conducted geographical informationsystem (GIS) research and analysis. For more information about NEW and NEW’spublications, please see www.northwestwatch.org.
Northwest Environment Watch gratefully acknowledges the ContorerFoundation for its generous sponsorship of this report and related research.Additional financial support comes from more than 1,000 members of NEW; privatefoundations; and NEW’s patrons, including the Bullitt, Glaser, William & FloraHewlett, David & Lucile Packard, Russell Family, True North, and WeedenFoundations.
A B O U T S M A RT G ROW T H B C
Smart Growth BC is a province-wide nongovernmental organization with a missionto create more livable communities. Working with community groups, businesses,and local governments, the organization promotes compact and completecommunities, sustainable transportation, affordable housing, protection ofagricultural land and greenspace, efficient use of infrastructure, and more-effectivecitizen engagement.

sprawl and smart growth in greater vancouver, september 2002 12
N OT E S A N D S O U R C E S
1. Locations within census enumeration areas or “blocks” identified as having noresidents are assigned a population density of zero, regardless of the density ofadjacent areas.
2. World city population growth rates derived from The World Gazetteer, “Citiesand Metropolitan Areas,” by country, www.world-gazetteer.com/home.htm,April 30, 2002.
3. Relationship between density thresholds and transportation modes from PeterW. G. Newman and Jeffrey R. Kenworthy, Cities and Automobile Dependence(Brookfield, VT: Gower Technical Press, 1989). These thresholds apply to urbancores and may not hold in smaller towns or isolated dense neighborhoods.
4. Though there is no single, universally recognized definition of “smart growth,”the term typically refers to areas that have compact residential densities, a mixof commercial and residential land uses, and preserved open spaces and that usetransportation and other municipal infrastructure efficiently. In this report,“smart growth” has a more limited meaning, referring only to areas withcompact residential development without regard to whether other featuresassociated with “smart growth” are present. Compact residential development isa necessary precondition for cost-effective public transit and locally supportedstores, but compactness does not by itself guarantee that an area possesses allthe features ascribed to “smart-growth” development.
5. Impacts from 1000 Friends of Washington, “Land Use and Water Quality,”www.friends.org/waterq.htm, viewed Nov. 15, 2001; and US EnvironmentalProtection Agency, Office of Water, “Urbanization and Streams: Studies ofHydrologic Impacts,” March 1998, at www.epa.gov/OWOW/NPS/urbanize/report.html.
6. Zoning commissions’ acceptance of farmland losses and effects of farmlandeasements and Growth Management Act from Don Stuart, American FarmlandTrust, Pacific Northwest Regional Office, private communication, June 26,2002, and Tim Trohimovich, 1000 Friends of Washington, privatecommunication, June 28, 2002. Farmland easements and Growth ManagementAct effects also from Rich Hines, American Farmland Trust, Pacific NorthwestRegional Office, private communication, June 20, 2002; and Judy Herring, KingCounty Farmland Preservation Program, private communication, June 20, 2002.
7. For this report, “rural areas” are defined as those having local populationdensities lower than one person per acre. “Urban and suburban” areas havelocal population densities higher than one person per acre. Small amounts ofland in the region may be identified as having “rural” density even if used forcommercial or industrial purposes.

sprawl and smart growth in greater vancouver, september 2002 13
8. For this analysis, greater Vancouver is defined as the Greater VancouverRegional District (GVRD), which had a population of roughly 2 million in 2001and a population increase of 413,000 over the preceding decade. GreaterSeattle, which is defined as those portions of King, Snohomish, and PierceCounties, Washington, that are pictured in Maps 2 and 4, had roughly 3 millionresidents in 2000 and a population increase of 461,000 over the precedingdecade. In greater Seattle, the amount of land in census blocks with at least oneperson per acre (suburban densities or greater) increased by roughly 43,000acres during the 1990s. In greater Vancouver, this increase was 20,500 acres. Bythis measure, greater Seattle’s development covered roughly twice as much landper new metropolitan resident over the decade as did greater Vancouver’s. Thisestimate may be conservative: census blocks are the smallest areas for whichcensus data are tabulated, so some newly developed blocks—particularly incommercial areas or large-lot residential development—might be typicallydescribed as suburban but not register as having been developed over thedecade. By a slightly more expansive definition of suburban land, to includeareas where the average population density of a circle containing at least 500residents exceeds one person per acre (see “Introduction and Methods”), newdevelopment consumed roughly 59,000 acres of previously rural lands in greaterSeattle over the decade but only 22,000 acres in greater Vancouver. By thisgauge, greater Seattle’s sprawling development overran about 2.4 times as muchland as did Vancouver’s during the 1990s. The rapid loss of farmland in thePuget Sound region (41,000 acres, or 21 percent of the total, in King, Pierce,and Snohomish Counties from 1987 through 1997) is consistent with rapidsuburban development of rural land in greater Seattle. Farmland losses from USDept. of Agriculture, National Agricultural Statistics Service, “1997 Census ofAgriculture,” www.nass.usda.gov/census/.
9. Remaining vacant urban land from “Livable Region Strategic Plan: Part One,”Greater Vancouver Regional District, at www.gvrd.bc.ca/services/growth/lrsp/lrsp_toc.html. Area of Agricultural Land Reserve within GVRD from 2001Annual Report, Livable Region Strategic Plan, Policy and Planning Department,Greater Vancouver Regional District, December 2001, p. 4.

sprawl and smart growth in greater vancouver, september 2002 14
Map
1.
Sixt
y-tw
o pe
rcen
t of
gre
ater
Van
couv
er r
esid
ents
live
d in
com
pact
nei
ghbo
rhoo
ds in
200
1, u
p fr
om 4
6 pe
rcen
t in
198
6
Map
and
ana
lysi
s by
Com
mEn
Spa
ce, w
ww
.com
men
spac
e.or
g
Nor
thw
est
Envi
ronm
ent W
atch
200
2, w
ww.
nort
hwes
twat
ch.o
rg
14
sprawl and smart growth in greater vancouver, september 2002 15
Map 2. Only 25 percent of greater Seattle’s residents lived in compact communities in 2000
Map and analysis by CommEn Space, www.commenspace.org
Northwest Environment Watch 2002, www.northwestwatch.org
15

sprawl and smart growth in greater vancouver, september 2002 16
Map and analysis by CommEn Space, www.commenspace.org
Northwest Environment Watch 2002, www.northwestwatch.org
16
Map 3. New pavement in greater Vancouver typically filled in or was adjacent to existingdeveloped areas

sprawl and smart growth in greater vancouver, september 2002 17
Map 4. In greater Seattle, much of the new pavement was at the suburban fringe
Map and analysis by CommEn Space, www.commenspace.org
Northwest Environment Watch 2002, www.northwestwatch.org
17