Hawthorne Court - Central Islip, NY Supplemental... · SUPPLEMENTAL FINANCIAL INFORMATION FOURTH...
35
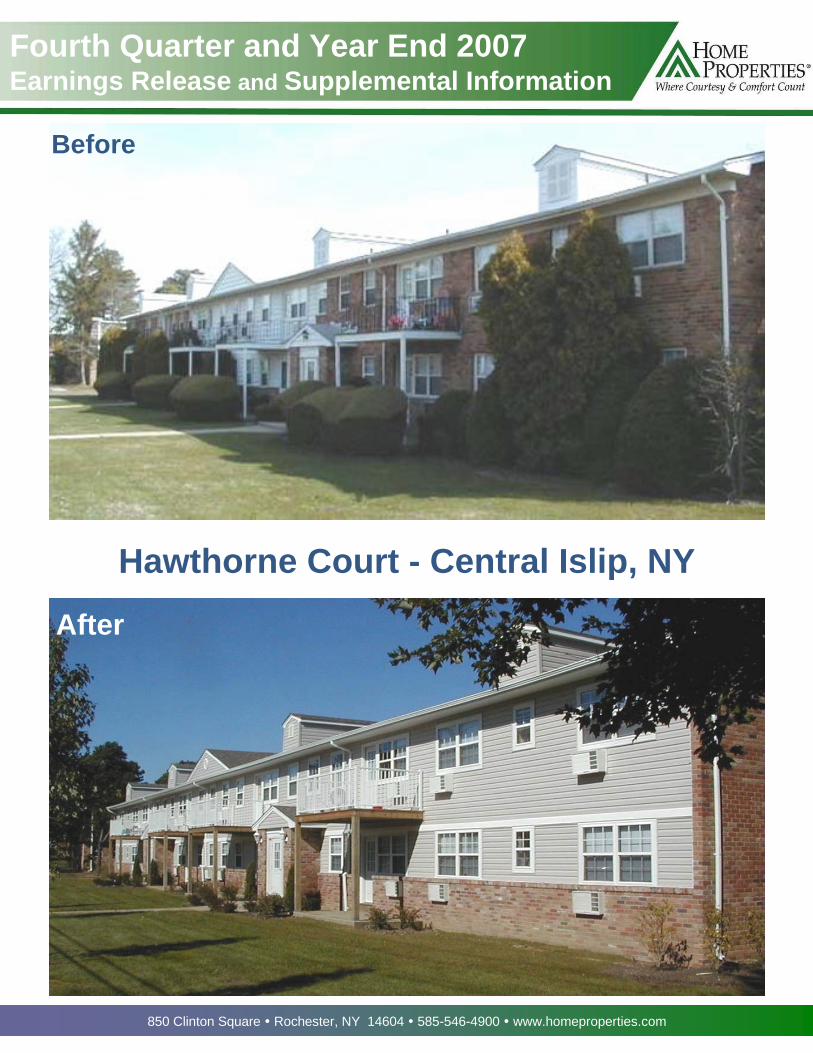
850 Clinton Square y Rochester, NY 14604 y 585-546-4900 y www.homeproperties.com Fourth Quarter and Year End 2007 Earnings Release and Supplemental Information Hawthorne Court - Central Islip, NY Before After
Transcript of Hawthorne Court - Central Islip, NY Supplemental... · SUPPLEMENTAL FINANCIAL INFORMATION FOURTH...
850 Clinton Square Rochester, NY 14604 585-546-4900 www.homeproperties.com
Fourth Quarter and Year End 2007Earnings Release and Supplemental Information
Hawthorne Court - Central Islip, NY
Before
After
HOME PROPERTIES, INC. SUPPLEMENTAL FINANCIAL INFORMATION
FOURTH QUARTER 2007 TABLE OF CONTENTS
4Q 2007 Supplemental Reports Page
1. Earnings Release 1-8
2. Owned Community Results, Quarterly and Year-to-Date 9-14
3. Physical Occupancy Comparison by Region 15
4. Net Operating Results 16
5. Resident Statistics 17
6. Net Operating Income Detail and Seasonality Factor for NAV Calculation 18
7. Operating Expense Detail 19
8. Discontinued Operations 20
9. Summary of Recent Acquisitions 21
10. Summary of Recent Sales 22
11. Breakdown of Owned Units by Market 23
12. Debt Summary Schedule 24-25
13. Recurring Capital Expenditure and Adjusted NOI Summary 26-28
14. Development Communities 29
15. 2008 Earnings Guidance 30-33
-i-
FOR IMMEDIATE RELEASE
HOME PROPERTIES REPORTS FOURTH QUARTER AND YEAR-END 2007 RESULTS
ROCHESTER, NY, FEBRUARY 21, 2008 – Home Properties (NYSE:HME) today released financial results for the fourth quarter and year ended December 31, 2007. All results are reported on a diluted basis.
“Home Properties’ Funds From Operations per share for 2007 was the highest in the Company’s history, reflecting the success of major initiatives completed during the year, including the utility cost recovery programs,” said Edward J. Pettinella, President and CEO. “Despite a weaker economic environment in 2008, results will be positively affected by our defensive geographic footprint and Class B property type as well as by the full implementation of Web-based property management and centralized rent pricing systems.”
Earnings per share ("EPS") for the quarter ended December 31, 2007 was $0.48, compared to $2.33 for the quarter ended December 31, 2006. The reduction in earnings is due primarily to a net $66.3 million (after the allocation of minority interest) decrease in gain on disposition of property, or $1.94 per share. EPS for the year ended December 31, 2007 was $1.73, compared to $3.15 for the year ended December 31, 2006. The year-over-year decrease of $1.42 per share is mainly attributable to a $1.47 per share impact of reduced property gains on sale of real estate for the year.
For the quarter ended December 31, 2007, Funds From Operations ("FFO") was $36.7 million, or $0.79 per share, compared to $36.4 million, or $0.77 per share, for the quarter ended December 31, 2006. For the year ended December 31, 2007, FFO was $151.1 million, or $3.20 per share, compared to $147.1 million, or $3.07 per share, for the year ended December 31, 2006. Excluding the non-cash charge of $0.04 in the 2007 first quarter related to costs associated with the initial offering of the Series F preferred shares which were redeemed, Operating FFO for 2007 was $3.24, a 5.6% increase over 2006. A reconciliation of GAAP net income to FFO is included in the financial data accompanying this news release.
Fourth Quarter Operating Results
For the fourth quarter of 2007, same-property comparisons (for 108 “Core” properties containing 32,600 apartment units owned since January 1, 2006) reflected an increase in total revenues of 3.7% compared to the same quarter a year ago. Net operating income (“NOI”) increased by 3.1% from the fourth quarter of 2006. Property level operating expenses increased by 4.5% for the quarter, primarily due to increases in personnel costs, property insurance, and snow removal costs, offset in part by a reduction in natural gas heating costs.
Home Properties Reports Fourth Quarter and Year-End 2007 Results For Immediate Release: February 21, 2008 Page 2 of 8 Average physical occupancy for the Core properties was 94.6% during the fourth quarter of 2007 compared to 94.4% during the fourth quarter of 2006. Average monthly rental rates, including utility recoveries, increased 3.9% compared to the year-ago period.
On a sequential basis, compared to the 2007 third quarter results for the Core properties, total revenues were up 1.5% in the fourth quarter of 2007, expenses were up 9.4%, and net operating income was down 3.6%. Average physical occupancy decreased 0.4% to 94.6%; however, average monthly rental rates including utility recoveries were 2.3% higher and rental income including utility recoveries posted a 1.8% increase. The sequential expense growth can be attributed to typical seasonality of higher natural gas heating and snow removal costs incurred in the fourth quarter.
Occupancies for the 4,896 net apartment units acquired/developed between January 1, 2006 and December 31, 2007 (the “Recently Acquired Communities”) averaged 94.4% during the fourth quarter of 2007, at average monthly rents of $1,111.
Year-to-Date Operating Results
For the year ended December 31, 2007, same-property comparisons for the Core properties reflected an increase in total revenues of 4.0%, resulting in a 5.0% increase in net operating income compared to 2006. Property level operating expenses increased by 2.8%, primarily due to increases in personnel costs, property insurance, real estate taxes, and snow removal costs, offset in part by a reduction in repairs and maintenance expense.
Average physical occupancy for the Core properties was 94.8% during 2007, compared to 94.7% a year ago, with rent, including utility recoveries, rising 4.3%.
Acquisitions
The Company previously announced the acquisition during the 2007 fourth quarter of Dunfield Townhomes, a 312-unit property located in White Marsh, MD, for $32.2 million.
For the full year 2007, Home Properties acquired a total of five communities with 1,541 units for total consideration of $161.5 million. The weighted average expected first year capitalization rate (“cap rate”) for the acquired communities was 5.9%.
Dispositions
During the fourth quarter of 2007, the Company closed on two separate sale transactions, with a total of 309 units, for $38.9 million. A gain on sale of approximately $14.5 million, before the allocation of minority interest, was recorded in the fourth quarter related to these sales. The weighted average cap rate for these dispositions was 6.1%.
For the full year 2007, Home Properties sold five communities with 1,084 units for total consideration of $129.5 million. The weighted average cap rate for the sold communities was 5.9%. Subsequent to the end of the quarter, the Company closed on two separate transactions for the sale of six properties with a total of 503 units for $57.1 million. A gain on sale of approximately $25 million (before allocation of minority interest) will be recorded in the first quarter of 2008. The weighted average cap rate for these dispositions was 6.2%.
Home Properties Reports Fourth Quarter and Year-End 2007 Results For Immediate Release: February 21, 2008 Page 3 of 8 Capital Markets Activities
As of December 31, 2007, the Company’s ratio of debt-to-total market capitalization was 51.3% (based on a 12/31/2007 stock price of $44.85 to determine equity value), with $2.5 million outstanding on its $140 million revolving credit facility and $6.1 million of unrestricted cash on hand. Mortgage debt of $1.99 billion was outstanding, at rates of interest averaging 5.7% and with staggered maturities averaging approximately six and one-half years and exchangeable senior notes outstanding of $200 million. Approximately 98.6% of total indebtedness is at fixed rates. Interest coverage averaged 2.2 times during the quarter (2.3 for the year); and the fixed charge ratio averaged 2.1 times for the quarter (2.2 for the year).
During the fourth quarter of 2007, the Company repurchased 817,000 of its common shares for $36.5 million, or a weighted average price of $44.73 per share. For the year, the total shares repurchased were 1,243,700 shares for $58.3 million, or $46.86 per share. As of December 31, 2007, the Company has Board authorization to buy back up to approximately 1.4 million additional shares of its common stock or Operating Partnership Units.
Outlook
For 2008, the Company expects FFO per share between $3.31 and $3.47 per share, which will produce FFO per share growth of 3.4% to 8.4% when compared to 2007 results. This guidance range reflects management’s current assessment of economic and market conditions. The assumptions for the 2008 projections are included with the published supplemental information.
The quarterly breakdown for the 2008 guidance on FFO per share results is as follows: First quarter $0.75 to $0.79; second quarter $0.84 to $0.88; third quarter $0.86 to $0.90; fourth quarter $0.86 to $0.90.
Earnings Conference Call
The Company will conduct a conference call and simultaneous webcast tomorrow at 11:00 AM Eastern Time to review and comment on the information reported in this release. To listen to the call, please dial 800-266-2145 (International 212-676-5362). A replay of the call will be available through February 29, 2008, by dialing 800-633-8284 or 402-977-9140 and entering 21354474. The Company webcast, which includes a slide presentation, will be available, live at 11:00 AM and archived by 1:00 PM, through the "Investors" section of our Web site, homeproperties.com, on the Investor Relations home page.
The Company produces supplemental information that provides details regarding property operations, other income, acquisitions, sales, market geographic breakdown, debt and new development. The supplemental information is available via the Company's Web site, e-mail or facsimile upon request.
First Quarter 2008 Event
Home Properties is scheduled to participate in a roundtable presentation and question and answer session at the Citi 2008 Global Property CEO Conference in Palm Beach, Florida, at 8:25 AM EST on Monday, March 3, 2008. Citi will offer audio coverage of the event, accessible by dialing 719-234-7878 and entering the passcode, "394890." A replay will be available a few
Home Properties Reports Fourth Quarter and Year-End 2007 Results For Immediate Release: February 21, 2008 Page 4 of 8 hours after the session ends. The Company's presentation materials will be available in the Investors section of Home Properties’ Web site at homeproperties.com under News & Events – Webcasts & Presentations.
This press release contains forward-looking statements. Although the Company believes expectations reflected in such forward-looking statements are based on reasonable assumptions, it can give no assurance that its expectations will be achieved. Factors that may cause actual results to differ include general economic and local real estate conditions, the weather and other conditions that might affect operating expenses, the timely completion of repositioning and new development activities within anticipated budgets, the actual pace of future acquisitions and dispositions, and continued access to capital to fund growth.
Home Properties is a publicly traded apartment real estate investment trust that owns, operates, develops, acquires and rehabilitates apartment communities primarily in selected Northeast, Mid-Atlantic and Southeast Florida markets. Currently, Home Properties operates 119 communities containing 38,143 apartment units. Of these, 36,993 units in 117 communities are owned directly by the Company; 868 units are partially owned and managed by the Company as general partner, and 282 units are managed for other owners. For more information, visit Home Properties’ Web site at homeproperties.com.
Tables to follow.
Home Properties Reports Fourth Quarter and Year-End 2007 Results For Immediate Release: February 21, 2008 Page 5 of 8
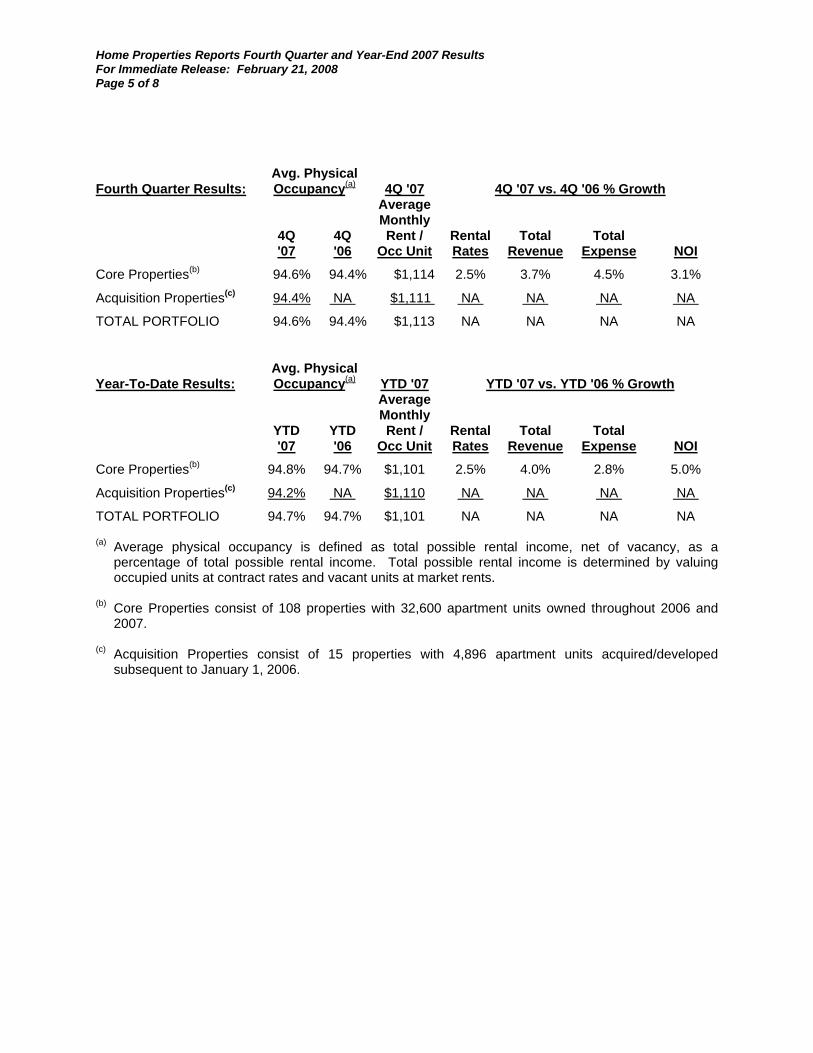
Avg. Physical Fourth Quarter Results: Occupancy(a) 4Q '07 4Q '07 vs. 4Q '06 % Growth
Average Monthly 4Q 4Q Rent / Rental Total Total '07 '06 Occ Unit Rates Revenue Expense NOI
Core Properties(b) 94.6% 94.4% $1,114 2.5% 3.7% 4.5% 3.1%
Acquisition Properties(c) 94.4% NA $1,111 NA NA NA NA
TOTAL PORTFOLIO 94.6% 94.4% $1,113 NA NA NA NA
Avg. Physical Year-To-Date Results: Occupancy(a) YTD '07 YTD '07 vs. YTD '06 % Growth
Average Monthly YTD YTD Rent / Rental Total Total '07 '06 Occ Unit Rates Revenue Expense NOI
Core Properties(b) 94.8% 94.7% $1,101 2.5% 4.0% 2.8% 5.0%
Acquisition Properties(c) 94.2% NA $1,110 NA NA NA NA
TOTAL PORTFOLIO 94.7% 94.7% $1,101 NA NA NA NA (a) Average physical occupancy is defined as total possible rental income, net of vacancy, as a
percentage of total possible rental income. Total possible rental income is determined by valuing occupied units at contract rates and vacant units at market rents.
(b) Core Properties consist of 108 properties with 32,600 apartment units owned throughout 2006 and
2007. (c) Acquisition Properties consist of 15 properties with 4,896 apartment units acquired/developed
subsequent to January 1, 2006.
Home Properties Reports Fourth Quarter and Year-End 2007 Results For Immediate Release: February 21, 2008 Page 6 of 8
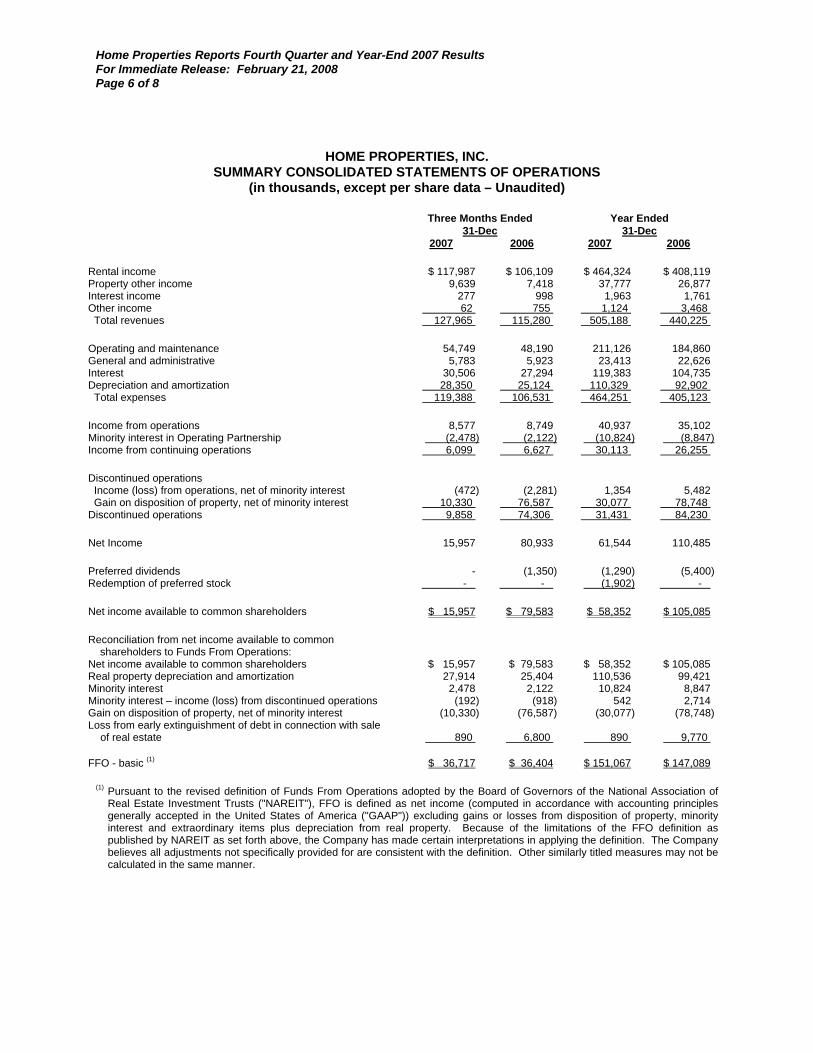
HOME PROPERTIES, INC. SUMMARY CONSOLIDATED STATEMENTS OF OPERATIONS
(in thousands, except per share data – Unaudited)
Three Months Ended Year Ended 31-Dec 31-Dec 2007 2006 2007 2006
Rental income $ 117,987 $ 106,109 $ 464,324 $ 408,119 Property other income 9,639 7,418 37,777 26,877 Interest income 277 998 1,963 1,761 Other income 62 755 1,124 3,468 Total revenues 127,965 115,280 505,188 440,225
Operating and maintenance 54,749 48,190 211,126 184,860 General and administrative 5,783 5,923 23,413 22,626 Interest 30,506 27,294 119,383 104,735 Depreciation and amortization 28,350 25,124 110,329 92,902 Total expenses 119,388 106,531 464,251 405,123
Income from operations 8,577 8,749 40,937 35,102 Minority interest in Operating Partnership (2,478) (2,122) (10,824) (8,847)Income from continuing operations 6,099 6,627 30,113 26,255
Discontinued operations Income (loss) from operations, net of minority interest (472) (2,281) 1,354 5,482 Gain on disposition of property, net of minority interest 10,330 76,587 30,077 78,748 Discontinued operations 9,858 74,306 31,431 84,230
Net Income 15,957 80,933 61,544 110,485
Preferred dividends - (1,350) (1,290) (5,400)Redemption of preferred stock - - (1,902) -
Net income available to common shareholders $ 15,957 $ 79,583 $ 58,352 $ 105,085
Reconciliation from net income available to common shareholders to Funds From Operations:
Net income available to common shareholders $ 15,957 $ 79,583 $ 58,352 $ 105,085 Real property depreciation and amortization 27,914 25,404 110,536 99,421 Minority interest 2,478 2,122 10,824 8,847 Minority interest – income (loss) from discontinued operations (192) (918) 542 2,714 Gain on disposition of property, net of minority interest (10,330) (76,587) (30,077) (78,748)Loss from early extinguishment of debt in connection with sale
of real estate 890 6,800 890 9,770
FFO - basic (1) $ 36,717 $ 36,404 $ 151,067 $ 147,089
(1) Pursuant to the revised definition of Funds From Operations adopted by the Board of Governors of the National Association of Real Estate Investment Trusts ("NAREIT"), FFO is defined as net income (computed in accordance with accounting principles generally accepted in the United States of America ("GAAP")) excluding gains or losses from disposition of property, minority interest and extraordinary items plus depreciation from real property. Because of the limitations of the FFO definition as published by NAREIT as set forth above, the Company has made certain interpretations in applying the definition. The Company believes all adjustments not specifically provided for are consistent with the definition. Other similarly titled measures may not be calculated in the same manner.
Home Properties Reports Fourth Quarter and Year-End 2007 Results For Immediate Release: February 21, 2008 Page 7 of 8
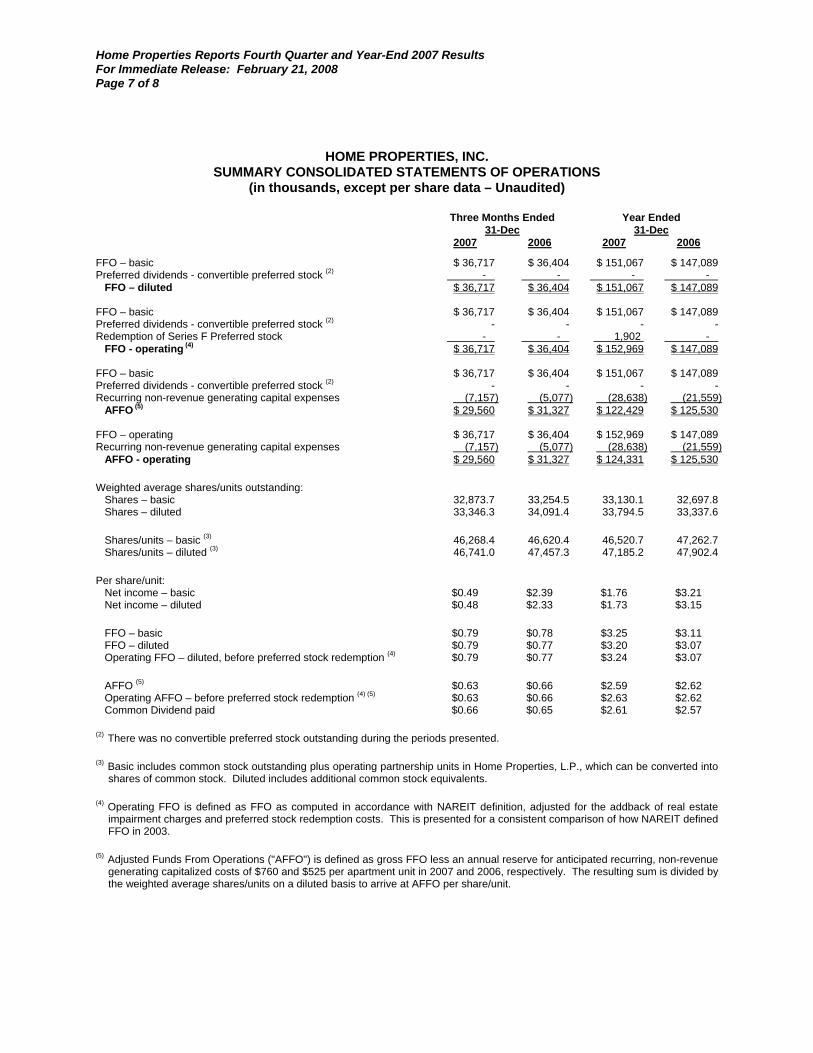
HOME PROPERTIES, INC. SUMMARY CONSOLIDATED STATEMENTS OF OPERATIONS
(in thousands, except per share data – Unaudited)
Three Months Ended Year Ended 31-Dec 31-Dec 2007 2006 2007 2006
FFO – basic $ 36,717 $ 36,404 $ 151,067 $ 147,089 Preferred dividends - convertible preferred stock (2) - - - - FFO – diluted $ 36,717 $ 36,404 $ 151,067 $ 147,089 FFO – basic $ 36,717 $ 36,404 $ 151,067 $ 147,089 Preferred dividends - convertible preferred stock (2) - - - - Redemption of Series F Preferred stock - - 1,902 - FFO - operating (4) $ 36,717 $ 36,404 $ 152,969 $ 147,089 FFO – basic $ 36,717 $ 36,404 $ 151,067 $ 147,089 Preferred dividends - convertible preferred stock (2) - - - - Recurring non-revenue generating capital expenses (7,157) (5,077) (28,638) (21,559) AFFO (5) $ 29,560 $ 31,327 $ 122,429 $ 125,530 FFO – operating $ 36,717 $ 36,404 $ 152,969 $ 147,089 Recurring non-revenue generating capital expenses (7,157) (5,077) (28,638) (21,559) AFFO - operating $ 29,560 $ 31,327 $ 124,331 $ 125,530
Weighted average shares/units outstanding: Shares – basic 32,873.7 33,254.5 33,130.1 32,697.8 Shares – diluted 33,346.3 34,091.4 33,794.5 33,337.6
Shares/units – basic (3) 46,268.4 46,620.4 46,520.7 47,262.7 Shares/units – diluted (3) 46,741.0 47,457.3 47,185.2 47,902.4
Per share/unit: Net income – basic $0.49 $2.39 $1.76 $3.21 Net income – diluted $0.48 $2.33 $1.73 $3.15
FFO – basic $0.79 $0.78 $3.25 $3.11 FFO – diluted $0.79 $0.77 $3.20 $3.07 Operating FFO – diluted, before preferred stock redemption (4) $0.79 $0.77 $3.24 $3.07
AFFO (5) $0.63 $0.66 $2.59 $2.62 Operating AFFO – before preferred stock redemption (4) (5) $0.63 $0.66 $2.63 $2.62 Common Dividend paid $0.66 $0.65 $2.61 $2.57
(2) There was no convertible preferred stock outstanding during the periods presented.
(3) Basic includes common stock outstanding plus operating partnership units in Home Properties, L.P., which can be converted into shares of common stock. Diluted includes additional common stock equivalents.
(4) Operating FFO is defined as FFO as computed in accordance with NAREIT definition, adjusted for the addback of real estate impairment charges and preferred stock redemption costs. This is presented for a consistent comparison of how NAREIT defined FFO in 2003.
(5) Adjusted Funds From Operations ("AFFO") is defined as gross FFO less an annual reserve for anticipated recurring, non-revenue generating capitalized costs of $760 and $525 per apartment unit in 2007 and 2006, respectively. The resulting sum is divided by the weighted average shares/units on a diluted basis to arrive at AFFO per share/unit.
Home Properties Reports Fourth Quarter and Year-End 2007 Results For Immediate Release: February 21, 2008 Page 8 of 8
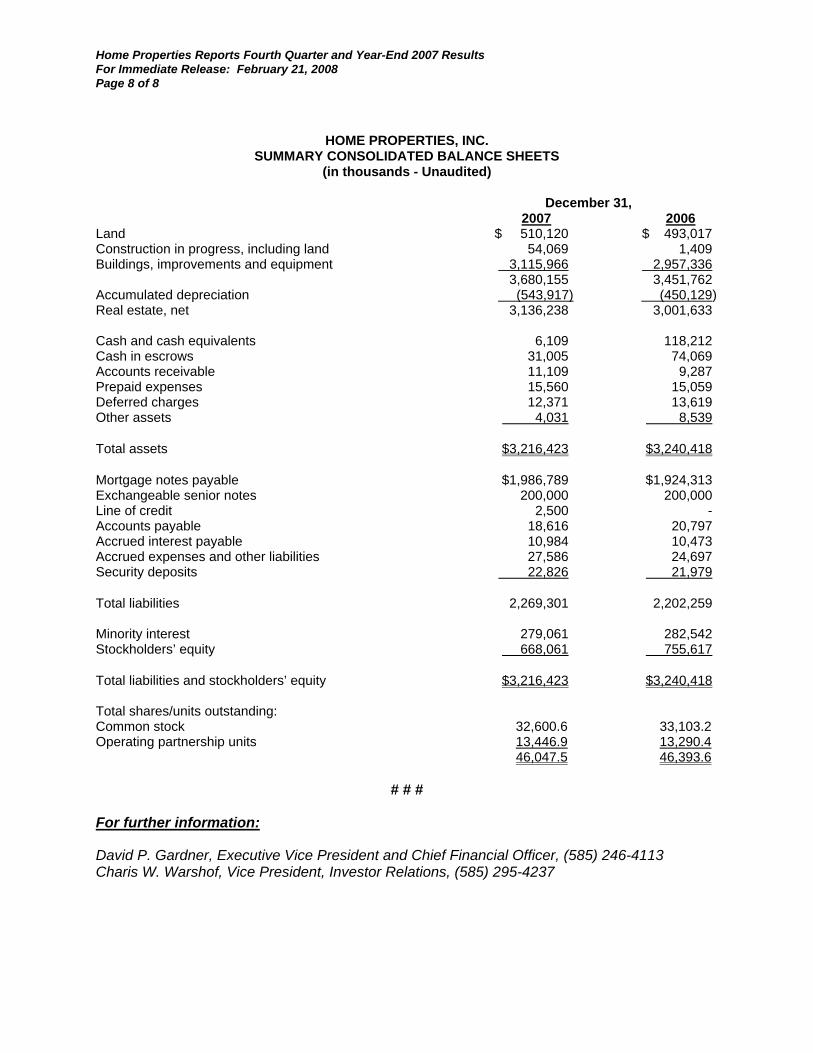
HOME PROPERTIES, INC. SUMMARY CONSOLIDATED BALANCE SHEETS
(in thousands - Unaudited)
December 31, 2007 2006
Land $ 510,120 $ 493,017 Construction in progress, including land 54,069 1,409 Buildings, improvements and equipment 3,115,966 2,957,336 3,680,155 3,451,762 Accumulated depreciation (543,917) (450,129) Real estate, net 3,136,238 3,001,633 Cash and cash equivalents 6,109 118,212 Cash in escrows 31,005 74,069 Accounts receivable 11,109 9,287 Prepaid expenses 15,560 15,059 Deferred charges 12,371 13,619 Other assets 4,031 8,539
Total assets $3,216,423 $3,240,418
Mortgage notes payable $1,986,789 $1,924,313 Exchangeable senior notes 200,000 200,000 Line of credit 2,500 - Accounts payable 18,616 20,797 Accrued interest payable 10,984 10,473 Accrued expenses and other liabilities 27,586 24,697 Security deposits 22,826 21,979
Total liabilities 2,269,301 2,202,259 Minority interest 279,061 282,542 Stockholders’ equity 668,061 755,617
Total liabilities and stockholders’ equity $3,216,423 $3,240,418 Total shares/units outstanding: Common stock 32,600.6 33,103.2 Operating partnership units 13,446.9 13,290.4 46,047.5 46,393.6
# # #
For further information:
David P. Gardner, Executive Vice President and Chief Financial Officer, (585) 246-4113 Charis W. Warshof, Vice President, Investor Relations, (585) 295-4237
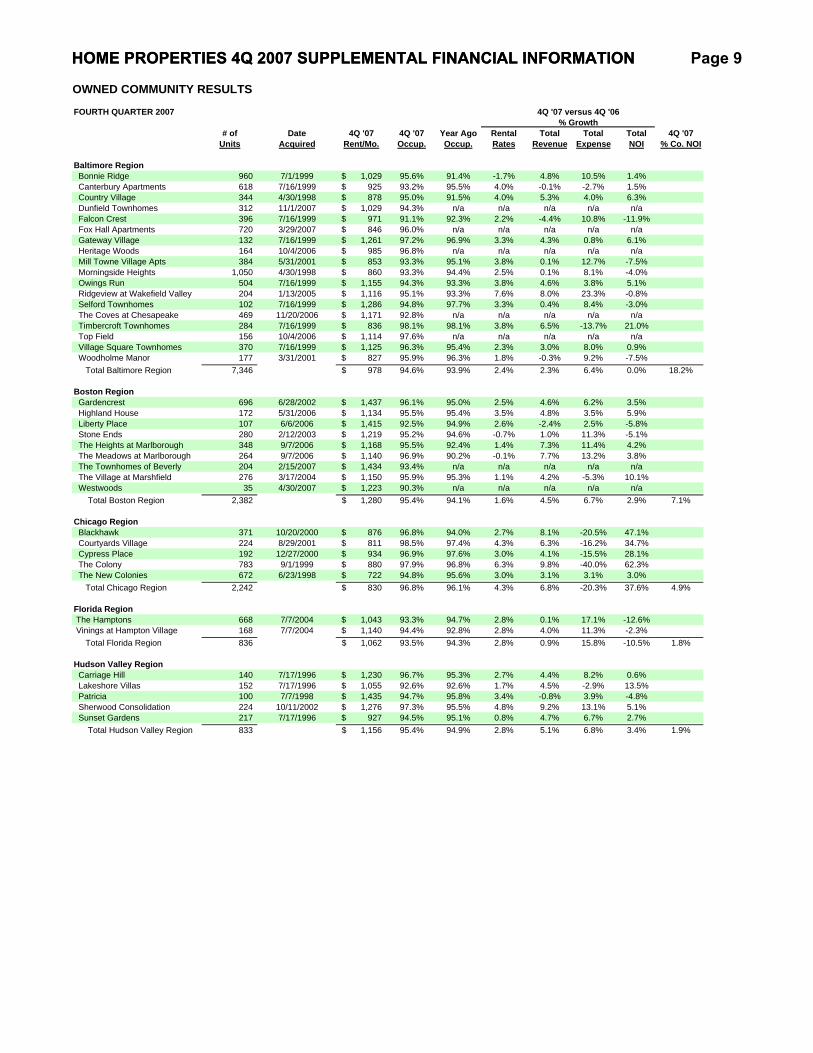
OWNED COMMUNITY RESULTS
FOURTH QUARTER 2007 % Growth
# of Date 4Q '07 4Q '07 Year Ago Rental Total Total Total 4Q '07Units Acquired Rent/Mo. Occup. Occup. Rates Revenue Expense NOI % Co. NOI
Baltimore Region Bonnie Ridge 960 7/1/1999 1,029$ 95.6% 91.4% -1.7% 4.8% 10.5% 1.4% Canterbury Apartments 618 7/16/1999 925$ 93.2% 95.5% 4.0% -0.1% -2.7% 1.5% Country Village 344 4/30/1998 878$ 95.0% 91.5% 4.0% 5.3% 4.0% 6.3% Dunfield Townhomes 312 11/1/2007 1,029$ 94.3% n/a n/a n/a n/a n/a Falcon Crest 396 7/16/1999 971$ 91.1% 92.3% 2.2% -4.4% 10.8% -11.9% Fox Hall Apartments 720 3/29/2007 846$ 96.0% n/a n/a n/a n/a n/a Gateway Village 132 7/16/1999 1,261$ 97.2% 96.9% 3.3% 4.3% 0.8% 6.1% Heritage Woods 164 10/4/2006 985$ 96.8% n/a n/a n/a n/a n/a Mill Towne Village Apts 384 5/31/2001 853$ 93.3% 95.1% 3.8% 0.1% 12.7% -7.5% Morningside Heights 1,050 4/30/1998 860$ 93.3% 94.4% 2.5% 0.1% 8.1% -4.0% Owings Run 504 7/16/1999 1,155$ 94.3% 93.3% 3.8% 4.6% 3.8% 5.1% Ridgeview at Wakefield Valley 204 1/13/2005 1,116$ 95.1% 93.3% 7.6% 8.0% 23.3% -0.8% Selford Townhomes 102 7/16/1999 1,286$ 94.8% 97.7% 3.3% 0.4% 8.4% -3.0% The Coves at Chesapeake 469 11/20/2006 1,171$ 92.8% n/a n/a n/a n/a n/a Timbercroft Townhomes 284 7/16/1999 836$ 98.1% 98.1% 3.8% 6.5% -13.7% 21.0% Top Field 156 10/4/2006 1,114$ 97.6% n/a n/a n/a n/a n/a Village Square Townhomes 370 7/16/1999 1,125$ 96.3% 95.4% 2.3% 3.0% 8.0% 0.9% Woodholme Manor 177 3/31/2001 827$ 95.9% 96.3% 1.8% -0.3% 9.2% -7.5% Total Baltimore Region 7,346 978$ 94.6% 93.9% 2.4% 2.3% 6.4% 0.0% 18.2%
Boston Region Gardencrest 696 6/28/2002 1,437$ 96.1% 95.0% 2.5% 4.6% 6.2% 3.5% Highland House 172 5/31/2006 1,134$ 95.5% 95.4% 3.5% 4.8% 3.5% 5.9% Liberty Place 107 6/6/2006 1,415$ 92.5% 94.9% 2.6% -2.4% 2.5% -5.8% Stone Ends 280 2/12/2003 1,219$ 95.2% 94.6% -0.7% 1.0% 11.3% -5.1% The Heights at Marlborough 348 9/7/2006 1,168$ 95.5% 92.4% 1.4% 7.3% 11.4% 4.2% The Meadows at Marlborough 264 9/7/2006 1,140$ 96.9% 90.2% -0.1% 7.7% 13.2% 3.8% The Townhomes of Beverly 204 2/15/2007 1,434$ 93.4% n/a n/a n/a n/a n/a The Village at Marshfield 276 3/17/2004 1,150$ 95.9% 95.3% 1.1% 4.2% -5.3% 10.1% Westwoods 35 4/30/2007 1,223$ 90.3% n/a n/a n/a n/a n/a Total Boston Region 2,382 1,280$ 95.4% 94.1% 1.6% 4.5% 6.7% 2.9% 7.1%
Chicago Region Blackhawk 371 10/20/2000 876$ 96.8% 94.0% 2.7% 8.1% -20.5% 47.1% Courtyards Village 224 8/29/2001 811$ 98.5% 97.4% 4.3% 6.3% -16.2% 34.7% Cypress Place 192 12/27/2000 934$ 96.9% 97.6% 3.0% 4.1% -15.5% 28.1% The Colony 783 9/1/1999 880$ 97.9% 96.8% 6.3% 9.8% -40.0% 62.3% The New Colonies 672 6/23/1998 722$ 94.8% 95.6% 3.0% 3.1% 3.1% 3.0% Total Chicago Region 2,242 830$ 96.8% 96.1% 4.3% 6.8% -20.3% 37.6% 4.9%
Florida Region The Hamptons 668 7/7/2004 1,043$ 93.3% 94.7% 2.8% 0.1% 17.1% -12.6% Vinings at Hampton Village 168 7/7/2004 1,140$ 94.4% 92.8% 2.8% 4.0% 11.3% -2.3% Total Florida Region 836 1,062$ 93.5% 94.3% 2.8% 0.9% 15.8% -10.5% 1.8%
Hudson Valley Region Carriage Hill 140 7/17/1996 1,230$ 96.7% 95.3% 2.7% 4.4% 8.2% 0.6% Lakeshore Villas 152 7/17/1996 1,055$ 92.6% 92.6% 1.7% 4.5% -2.9% 13.5% Patricia 100 7/7/1998 1,435$ 94.7% 95.8% 3.4% -0.8% 3.9% -4.8% Sherwood Consolidation 224 10/11/2002 1,276$ 97.3% 95.5% 4.8% 9.2% 13.1% 5.1% Sunset Gardens 217 7/17/1996 927$ 94.5% 95.1% 0.8% 4.7% 6.7% 2.7% Total Hudson Valley Region 833 1,156$ 95.4% 94.9% 2.8% 5.1% 6.8% 3.4% 1.9%
4Q '07 versus 4Q '06
HOME PROPERTIES 4Q 2007 SUPPLEMENTAL FINANCIAL INFORMATIONHOME PROPERTIES 4Q 2007 SUPPLEMENTAL FINANCIAL INFORMATION Page 9

OWNED COMMUNITY RESULTS
FOURTH QUARTER 2007 % Growth
# of Date 4Q '07 4Q '07 Year Ago Rental Total Total Total 4Q '07Units Acquired Rent/Mo. Occup. Occup. Rates Revenue Expense NOI % Co. NOI
4Q '07 versus 4Q '06
Long Island, NY Region Bayview / Colonial 160 11/1/2000 1,208$ 93.3% 93.7% 0.4% 3.4% 27.4% -17.3% Cambridge Village 82 3/1/2002 1,618$ 93.6% 97.6% 4.2% 1.9% 9.6% -4.3% Coventry Village 94 7/31/1998 1,390$ 94.5% 97.3% 2.8% 1.0% 3.8% -2.2% Devonshire Hills 297 7/16/2001 1,707$ 95.0% 95.4% -1.4% -3.7% -2.5% -4.4% East Winds 96 11/1/2000 1,166$ 95.6% 93.7% 1.1% 8.1% 8.8% 7.4% Hawthorne Court 434 4/4/2002 1,392$ 94.0% 93.3% 2.5% 5.5% 9.9% 1.2% Heritage Square 80 4/4/2002 1,630$ 97.0% 98.0% 4.5% 2.4% -0.4% 4.9% Holiday Square 144 5/31/2002 1,132$ 96.7% 96.7% 3.0% 4.7% -0.6% 8.5% Lake Grove Apartments 368 2/3/1997 1,397$ 95.4% 94.4% 0.5% 5.5% 4.2% 6.3% Maple Tree 84 11/1/2000 1,131$ 92.3% 97.4% -2.6% -7.3% 7.4% -20.2% Mid- Island Estates 232 7/1/1997 1,308$ 97.0% 94.8% 2.4% 4.1% -2.9% 10.4% Rider Terrace 24 11/1/2000 1,273$ 93.7% 97.8% 2.4% 4.3% 26.2% -10.7% Sayville Commons 342 7/15/2005 1,488$ 97.1% 98.0% 4.1% 4.0% 2.1% 5.4% South Bay Manor 61 9/11/2000 1,608$ 93.8% 88.4% 5.2% 13.7% 21.6% 7.3% Southern Meadows 452 6/29/2001 1,338$ 97.4% 95.3% -1.0% 3.1% 8.5% -0.8% Stratford Greens 359 3/1/2002 1,428$ 96.4% 97.2% 3.1% 5.6% 15.2% -0.7% Terry Apartments 65 11/1/2000 1,141$ 83.6% 92.8% -1.9% -10.7% 10.3% -34.1% Westwood Village Apts 242 3/1/2002 2,260$ 94.5% 95.3% 4.0% 6.6% 6.7% 6.6% Woodmont Village Apts 96 3/1/2002 1,330$ 94.5% 96.2% 2.3% 3.4% 6.7% 1.6% Yorkshire Village Apts 40 3/1/2002 1,671$ 96.9% 99.2% 5.4% 7.3% 11.7% 3.1% Total Long Island Region 3,752 1,454$ 95.3% 95.5% 1.8% 3.5% 7.0% 0.9% 12.7%
Maine Region Liberty Commons 120 8/30/2006 1,161$ 95.5% 97.5% 3.8% 2.6% 0.7% 3.7% Mill Co. Gardens 95 7/7/1998 773$ 96.3% 94.1% 1.0% 3.5% 14.3% -5.8% Redbank Village 500 7/7/1998 827$ 95.9% 92.9% 2.4% 7.1% 4.1% 9.4% Total Maine Region 715 876$ 95.9% 94.1% 2.6% 5.7% 4.8% 6.2% 1.5%
New Jersey Region Barrington Gardens 148 3/1/2005 1,006$ 93.9% 98.2% 13.4% 7.8% 33.0% -8.5% Chatham Hill Apartments 308 1/30/2004 1,674$ 96.3% 95.4% 5.2% 7.7% -2.5% 13.8% East Hill Gardens 33 7/7/1998 1,511$ 91.4% 96.9% 2.7% -2.3% 5.3% -6.4% Hackensack Gardens 198 3/1/2005 974$ 94.0% 96.9% 9.9% 9.8% 29.0% -13.1% Jacob Ford Village 270 2/15/2007 1,064$ 95.1% n/a n/a n/a n/a n/a Lakeview 106 7/7/1998 1,336$ 96.3% 96.5% 5.0% 5.2% -0.1% 9.5% Northwood Apartments 134 1/30/2004 1,286$ 94.3% 93.4% 5.2% 7.6% 15.2% -1.0% Oak Manor 77 7/7/1998 1,779$ 90.7% 99.3% 3.1% -0.6% 6.1% -4.3% Pleasant View 1,142 7/7/1998 1,143$ 94.1% 94.3% 5.4% 7.7% 5.8% 9.2% Pleasure Bay 270 7/7/1998 1,087$ 91.1% 94.4% 2.2% -5.2% 18.0% -23.5% Regency Club 372 9/24/2004 1,118$ 96.8% 91.4% 0.5% 10.3% -0.2% 21.3% Royal Gardens Apartments 550 5/28/1997 1,212$ 95.5% 90.6% 4.8% 13.2% 2.4% 23.8% Wayne Village 275 7/7/1998 1,366$ 97.1% 96.3% 4.8% 7.4% 0.3% 12.5% Windsor Realty 67 7/7/1998 1,178$ 97.0% 93.2% 3.2% 12.8% -26.1% 47.3% Total New Jersey Region 3,950 1,210$ 94.9% 94.2% 4.8% 7.5% 5.8% 8.9% 11.0%
Philadelphia Region Beechwood Gardens 160 7/7/1998 826$ 95.9% 96.5% -0.8% 0.3% 0.3% 0.4% Castle Club 158 3/15/2000 931$ 90.0% 94.9% -0.2% -5.0% 2.9% -12.5% Chesterfield 247 9/23/1997 894$ 96.6% 96.6% -1.7% -1.8% 19.3% -17.7% Curren Terrace 318 9/23/1997 920$ 91.7% 96.0% 1.2% -3.6% 4.5% -10.6% Glen Brook 174 7/28/1999 814$ 90.6% 92.3% -0.3% -6.7% 6.7% -23.6% Glen Manor 174 9/23/1997 800$ 96.5% 95.7% 4.4% 5.0% 5.7% 4.2% Golf Club 399 3/15/2000 1,027$ 94.8% 92.4% 1.2% 6.1% 1.7% 9.4% Hill Brook Place 274 7/28/1999 891$ 89.7% 94.8% 0.9% -5.8% 10.7% -23.2% Home Properties of Bryn Mawr 316 3/15/2000 1,041$ 93.6% 94.8% -0.9% 0.5% -0.2% 1.1% Home Properties of Devon 631 3/15/2000 1,098$ 94.2% 93.5% 1.0% 1.8% 7.0% -1.8% Home Properties of Newark 432 7/16/1999 861$ 94.0% 94.6% 1.7% 5.9% 8.6% 3.7% New Orleans Park 442 7/28/1999 860$ 93.2% 95.6% 3.3% 0.4% 5.3% -4.6% Racquet Club 466 7/7/1998 1,022$ 96.0% 93.9% -0.4% 3.1% 14.6% -4.8% Racquet Club South 103 5/27/1999 873$ 95.3% 93.9% -0.1% 2.5% 0.9% 4.2% Ridley Brook 244 7/28/1999 897$ 91.6% 93.6% 1.4% 4.0% 10.8% -3.7% Sherry Lake 298 7/23/1998 1,170$ 90.7% 94.2% 0.9% -2.6% 6.4% -7.8% The Brooke at Peachtree Village 146 8/15/2005 1,091$ 95.5% 97.4% 5.3% 6.2% 4.1% 7.6% The Landings 384 11/25/1996 975$ 94.9% 96.7% 2.8% 1.8% -6.8% 8.9% Trexler Park 250 3/15/2000 1,037$ 91.2% 91.7% -0.7% -3.4% 3.1% -8.4% Trexler Park West 168 Under Construction 1,261$ 80.6% n/a n/a n/a n/a n/a Valley View 177 9/23/1997 825$ 91.1% 88.7% -1.7% 5.6% 5.8% 5.3% Village Square 128 9/23/1997 937$ 93.8% 97.7% 2.3% -1.9% 12.6% -12.0% William Henry 363 3/15/2000 1,102$ 95.0% 94.7% 3.1% 7.4% 4.3% 9.8% Total Philadelphia Region 6,452 970$ 93.6% 94.4% 1.1% 1.3% 5.8% -2.4% 14.4%
HOME PROPERTIES 4Q 2007 SUPPLEMENTAL FINANCIAL INFORMATIONHOME PROPERTIES 4Q 2007 SUPPLEMENTAL FINANCIAL INFORMATION Page 10
OWNED COMMUNITY RESULTS
FOURTH QUARTER 2007 % Growth
# of Date 4Q '07 4Q '07 Year Ago Rental Total Total Total 4Q '07Units Acquired Rent/Mo. Occup. Occup. Rates Revenue Expense NOI % Co. NOI
4Q '07 versus 4Q '06
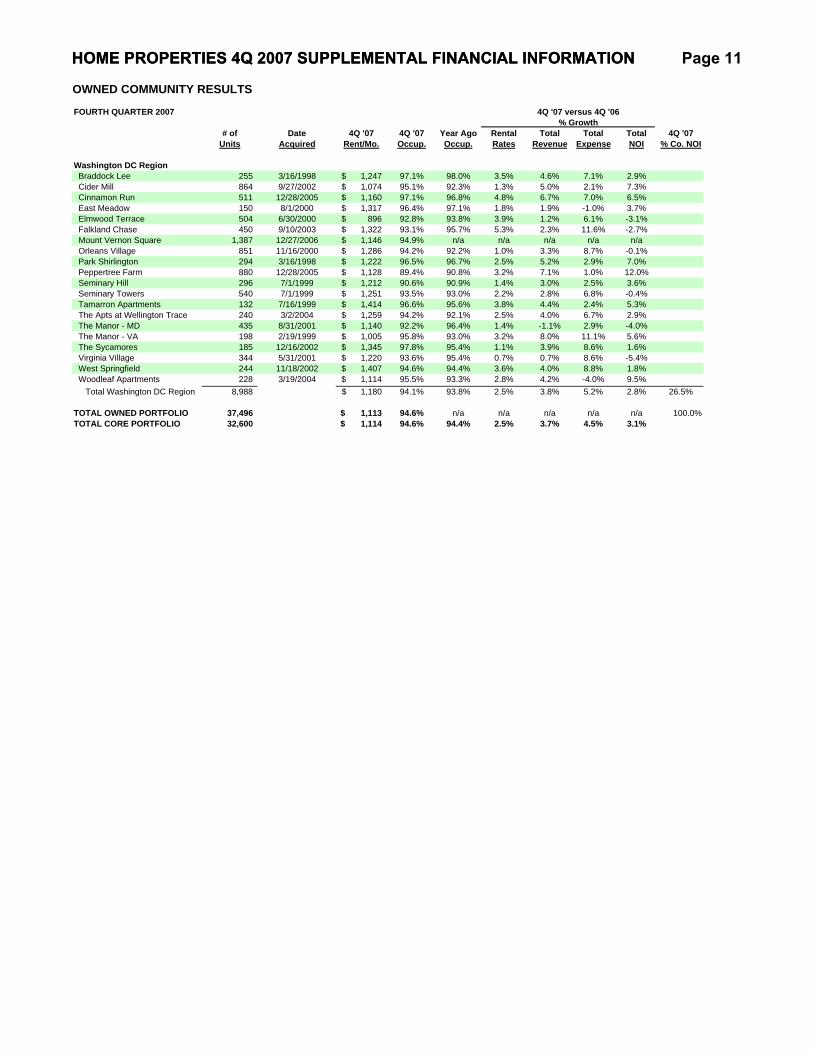
Washington DC Region Braddock Lee 255 3/16/1998 1,247$ 97.1% 98.0% 3.5% 4.6% 7.1% 2.9% Cider Mill 864 9/27/2002 1,074$ 95.1% 92.3% 1.3% 5.0% 2.1% 7.3% Cinnamon Run 511 12/28/2005 1,160$ 97.1% 96.8% 4.8% 6.7% 7.0% 6.5% East Meadow 150 8/1/2000 1,317$ 96.4% 97.1% 1.8% 1.9% -1.0% 3.7% Elmwood Terrace 504 6/30/2000 896$ 92.8% 93.8% 3.9% 1.2% 6.1% -3.1% Falkland Chase 450 9/10/2003 1,322$ 93.1% 95.7% 5.3% 2.3% 11.6% -2.7% Mount Vernon Square 1,387 12/27/2006 1,146$ 94.9% n/a n/a n/a n/a n/a Orleans Village 851 11/16/2000 1,286$ 94.2% 92.2% 1.0% 3.3% 8.7% -0.1% Park Shirlington 294 3/16/1998 1,222$ 96.5% 96.7% 2.5% 5.2% 2.9% 7.0% Peppertree Farm 880 12/28/2005 1,128$ 89.4% 90.8% 3.2% 7.1% 1.0% 12.0% Seminary Hill 296 7/1/1999 1,212$ 90.6% 90.9% 1.4% 3.0% 2.5% 3.6% Seminary Towers 540 7/1/1999 1,251$ 93.5% 93.0% 2.2% 2.8% 6.8% -0.4% Tamarron Apartments 132 7/16/1999 1,414$ 96.6% 95.6% 3.8% 4.4% 2.4% 5.3% The Apts at Wellington Trace 240 3/2/2004 1,259$ 94.2% 92.1% 2.5% 4.0% 6.7% 2.9% The Manor - MD 435 8/31/2001 1,140$ 92.2% 96.4% 1.4% -1.1% 2.9% -4.0% The Manor - VA 198 2/19/1999 1,005$ 95.8% 93.0% 3.2% 8.0% 11.1% 5.6% The Sycamores 185 12/16/2002 1,345$ 97.8% 95.4% 1.1% 3.9% 8.6% 1.6% Virginia Village 344 5/31/2001 1,220$ 93.6% 95.4% 0.7% 0.7% 8.6% -5.4% West Springfield 244 11/18/2002 1,407$ 94.6% 94.4% 3.6% 4.0% 8.8% 1.8% Woodleaf Apartments 228 3/19/2004 1,114$ 95.5% 93.3% 2.8% 4.2% -4.0% 9.5% Total Washington DC Region 8,988 1,180$ 94.1% 93.8% 2.5% 3.8% 5.2% 2.8% 26.5%
TOTAL OWNED PORTFOLIO 37,496 1,113$ 94.6% n/a n/a n/a n/a n/a 100.0%TOTAL CORE PORTFOLIO 32,600 1,114$ 94.6% 94.4% 2.5% 3.7% 4.5% 3.1%
HOME PROPERTIES 4Q 2007 SUPPLEMENTAL FINANCIAL INFORMATIONHOME PROPERTIES 4Q 2007 SUPPLEMENTAL FINANCIAL INFORMATION Page 11
OWNED COMMUNITY RESULTS
December YTD % Growth
# of Date YTD '07 YTD '07 Year Ago Rental Total Total Total YTD '07Units Acquired Rent/Mo. Occup. Occup. Rates Revenue Expense NOI % Co. NOI
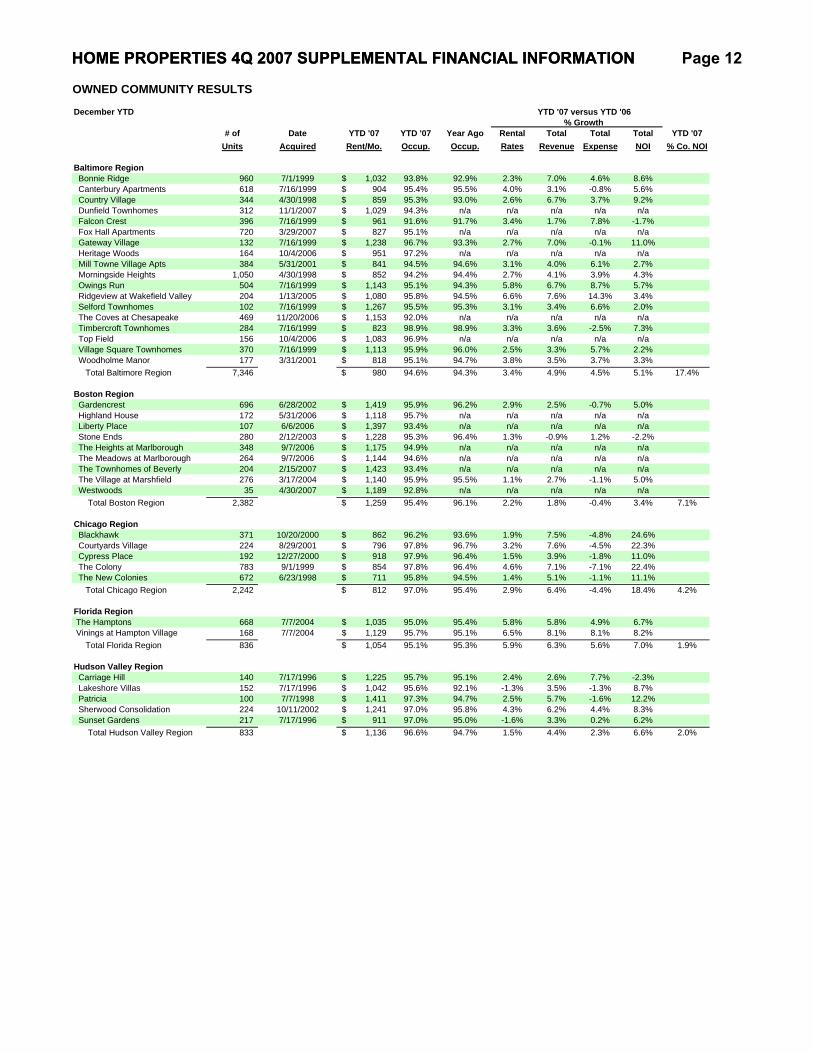
Baltimore Region Bonnie Ridge 960 7/1/1999 1,032$ 93.8% 92.9% 2.3% 7.0% 4.6% 8.6% Canterbury Apartments 618 7/16/1999 904$ 95.4% 95.5% 4.0% 3.1% -0.8% 5.6% Country Village 344 4/30/1998 859$ 95.3% 93.0% 2.6% 6.7% 3.7% 9.2% Dunfield Townhomes 312 11/1/2007 1,029$ 94.3% n/a n/a n/a n/a n/a Falcon Crest 396 7/16/1999 961$ 91.6% 91.7% 3.4% 1.7% 7.8% -1.7% Fox Hall Apartments 720 3/29/2007 827$ 95.1% n/a n/a n/a n/a n/a Gateway Village 132 7/16/1999 1,238$ 96.7% 93.3% 2.7% 7.0% -0.1% 11.0% Heritage Woods 164 10/4/2006 951$ 97.2% n/a n/a n/a n/a n/a Mill Towne Village Apts 384 5/31/2001 841$ 94.5% 94.6% 3.1% 4.0% 6.1% 2.7% Morningside Heights 1,050 4/30/1998 852$ 94.2% 94.4% 2.7% 4.1% 3.9% 4.3% Owings Run 504 7/16/1999 1,143$ 95.1% 94.3% 5.8% 6.7% 8.7% 5.7% Ridgeview at Wakefield Valley 204 1/13/2005 1,080$ 95.8% 94.5% 6.6% 7.6% 14.3% 3.4% Selford Townhomes 102 7/16/1999 1,267$ 95.5% 95.3% 3.1% 3.4% 6.6% 2.0% The Coves at Chesapeake 469 11/20/2006 1,153$ 92.0% n/a n/a n/a n/a n/a Timbercroft Townhomes 284 7/16/1999 823$ 98.9% 98.9% 3.3% 3.6% -2.5% 7.3% Top Field 156 10/4/2006 1,083$ 96.9% n/a n/a n/a n/a n/a Village Square Townhomes 370 7/16/1999 1,113$ 95.9% 96.0% 2.5% 3.3% 5.7% 2.2% Woodholme Manor 177 3/31/2001 818$ 95.1% 94.7% 3.8% 3.5% 3.7% 3.3% Total Baltimore Region 7,346 980$ 94.6% 94.3% 3.4% 4.9% 4.5% 5.1% 17.4%
Boston Region Gardencrest 696 6/28/2002 1,419$ 95.9% 96.2% 2.9% 2.5% -0.7% 5.0% Highland House 172 5/31/2006 1,118$ 95.7% n/a n/a n/a n/a n/a Liberty Place 107 6/6/2006 1,397$ 93.4% n/a n/a n/a n/a n/a Stone Ends 280 2/12/2003 1,228$ 95.3% 96.4% 1.3% -0.9% 1.2% -2.2% The Heights at Marlborough 348 9/7/2006 1,175$ 94.9% n/a n/a n/a n/a n/a The Meadows at Marlborough 264 9/7/2006 1,144$ 94.6% n/a n/a n/a n/a n/a The Townhomes of Beverly 204 2/15/2007 1,423$ 93.4% n/a n/a n/a n/a n/a The Village at Marshfield 276 3/17/2004 1,140$ 95.9% 95.5% 1.1% 2.7% -1.1% 5.0% Westwoods 35 4/30/2007 1,189$ 92.8% n/a n/a n/a n/a n/a Total Boston Region 2,382 1,259$ 95.4% 96.1% 2.2% 1.8% -0.4% 3.4% 7.1%
Chicago Region Blackhawk 371 10/20/2000 862$ 96.2% 93.6% 1.9% 7.5% -4.8% 24.6% Courtyards Village 224 8/29/2001 796$ 97.8% 96.7% 3.2% 7.6% -4.5% 22.3% Cypress Place 192 12/27/2000 918$ 97.9% 96.4% 1.5% 3.9% -1.8% 11.0% The Colony 783 9/1/1999 854$ 97.8% 96.4% 4.6% 7.1% -7.1% 22.4% The New Colonies 672 6/23/1998 711$ 95.8% 94.5% 1.4% 5.1% -1.1% 11.1% Total Chicago Region 2,242 812$ 97.0% 95.4% 2.9% 6.4% -4.4% 18.4% 4.2%
Florida Region The Hamptons 668 7/7/2004 1,035$ 95.0% 95.4% 5.8% 5.8% 4.9% 6.7% Vinings at Hampton Village 168 7/7/2004 1,129$ 95.7% 95.1% 6.5% 8.1% 8.1% 8.2% Total Florida Region 836 1,054$ 95.1% 95.3% 5.9% 6.3% 5.6% 7.0% 1.9%
Hudson Valley Region Carriage Hill 140 7/17/1996 1,225$ 95.7% 95.1% 2.4% 2.6% 7.7% -2.3% Lakeshore Villas 152 7/17/1996 1,042$ 95.6% 92.1% -1.3% 3.5% -1.3% 8.7% Patricia 100 7/7/1998 1,411$ 97.3% 94.7% 2.5% 5.7% -1.6% 12.2% Sherwood Consolidation 224 10/11/2002 1,241$ 97.0% 95.8% 4.3% 6.2% 4.4% 8.3% Sunset Gardens 217 7/17/1996 911$ 97.0% 95.0% -1.6% 3.3% 0.2% 6.2% Total Hudson Valley Region 833 1,136$ 96.6% 94.7% 1.5% 4.4% 2.3% 6.6% 2.0%
YTD '07 versus YTD '06
HOME PROPERTIES 4Q 2007 SUPPLEMENTAL FINANCIAL INFORMATIONHOME PROPERTIES 4Q 2007 SUPPLEMENTAL FINANCIAL INFORMATION Page 12
OWNED COMMUNITY RESULTS
December YTD % Growth
# of Date YTD '07 YTD '07 Year Ago Rental Total Total Total YTD '07Units Acquired Rent/Mo. Occup. Occup. Rates Revenue Expense NOI % Co. NOI
YTD '07 versus YTD '06
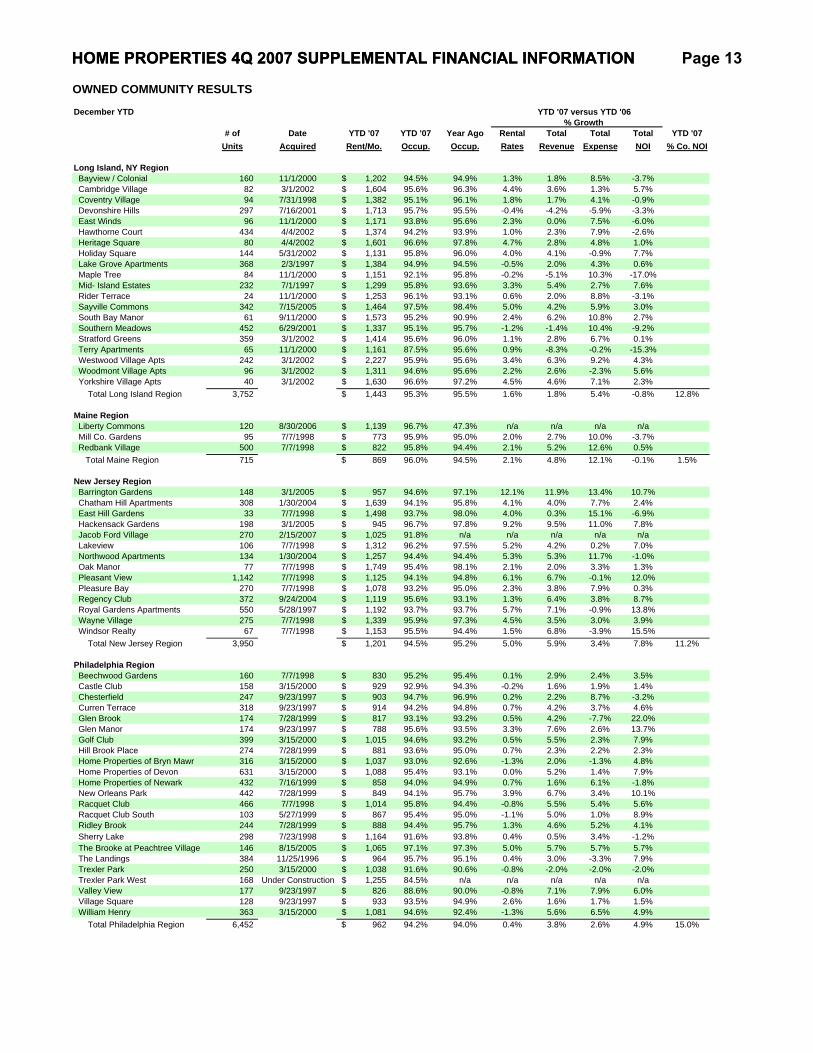
Long Island, NY Region Bayview / Colonial 160 11/1/2000 1,202$ 94.5% 94.9% 1.3% 1.8% 8.5% -3.7% Cambridge Village 82 3/1/2002 1,604$ 95.6% 96.3% 4.4% 3.6% 1.3% 5.7% Coventry Village 94 7/31/1998 1,382$ 95.1% 96.1% 1.8% 1.7% 4.1% -0.9% Devonshire Hills 297 7/16/2001 1,713$ 95.7% 95.5% -0.4% -4.2% -5.9% -3.3% East Winds 96 11/1/2000 1,171$ 93.8% 95.6% 2.3% 0.0% 7.5% -6.0% Hawthorne Court 434 4/4/2002 1,374$ 94.2% 93.9% 1.0% 2.3% 7.9% -2.6% Heritage Square 80 4/4/2002 1,601$ 96.6% 97.8% 4.7% 2.8% 4.8% 1.0% Holiday Square 144 5/31/2002 1,131$ 95.8% 96.0% 4.0% 4.1% -0.9% 7.7% Lake Grove Apartments 368 2/3/1997 1,384$ 94.9% 94.5% -0.5% 2.0% 4.3% 0.6% Maple Tree 84 11/1/2000 1,151$ 92.1% 95.8% -0.2% -5.1% 10.3% -17.0% Mid- Island Estates 232 7/1/1997 1,299$ 95.8% 93.6% 3.3% 5.4% 2.7% 7.6% Rider Terrace 24 11/1/2000 1,253$ 96.1% 93.1% 0.6% 2.0% 8.8% -3.1% Sayville Commons 342 7/15/2005 1,464$ 97.5% 98.4% 5.0% 4.2% 5.9% 3.0% South Bay Manor 61 9/11/2000 1,573$ 95.2% 90.9% 2.4% 6.2% 10.8% 2.7% Southern Meadows 452 6/29/2001 1,337$ 95.1% 95.7% -1.2% -1.4% 10.4% -9.2% Stratford Greens 359 3/1/2002 1,414$ 95.6% 96.0% 1.1% 2.8% 6.7% 0.1% Terry Apartments 65 11/1/2000 1,161$ 87.5% 95.6% 0.9% -8.3% -0.2% -15.3% Westwood Village Apts 242 3/1/2002 2,227$ 95.9% 95.6% 3.4% 6.3% 9.2% 4.3% Woodmont Village Apts 96 3/1/2002 1,311$ 94.6% 95.6% 2.2% 2.6% -2.3% 5.6% Yorkshire Village Apts 40 3/1/2002 1,630$ 96.6% 97.2% 4.5% 4.6% 7.1% 2.3% Total Long Island Region 3,752 1,443$ 95.3% 95.5% 1.6% 1.8% 5.4% -0.8% 12.8%
Maine Region Liberty Commons 120 8/30/2006 1,139$ 96.7% 47.3% n/a n/a n/a n/a Mill Co. Gardens 95 7/7/1998 773$ 95.9% 95.0% 2.0% 2.7% 10.0% -3.7% Redbank Village 500 7/7/1998 822$ 95.8% 94.4% 2.1% 5.2% 12.6% 0.5% Total Maine Region 715 869$ 96.0% 94.5% 2.1% 4.8% 12.1% -0.1% 1.5%
New Jersey Region Barrington Gardens 148 3/1/2005 957$ 94.6% 97.1% 12.1% 11.9% 13.4% 10.7% Chatham Hill Apartments 308 1/30/2004 1,639$ 94.1% 95.8% 4.1% 4.0% 7.7% 2.4% East Hill Gardens 33 7/7/1998 1,498$ 93.7% 98.0% 4.0% 0.3% 15.1% -6.9% Hackensack Gardens 198 3/1/2005 945$ 96.7% 97.8% 9.2% 9.5% 11.0% 7.8% Jacob Ford Village 270 2/15/2007 1,025$ 91.8% n/a n/a n/a n/a n/a Lakeview 106 7/7/1998 1,312$ 96.2% 97.5% 5.2% 4.2% 0.2% 7.0% Northwood Apartments 134 1/30/2004 1,257$ 94.4% 94.4% 5.3% 5.3% 11.7% -1.0% Oak Manor 77 7/7/1998 1,749$ 95.4% 98.1% 2.1% 2.0% 3.3% 1.3% Pleasant View 1,142 7/7/1998 1,125$ 94.1% 94.8% 6.1% 6.7% -0.1% 12.0% Pleasure Bay 270 7/7/1998 1,078$ 93.2% 95.0% 2.3% 3.8% 7.9% 0.3% Regency Club 372 9/24/2004 1,119$ 95.6% 93.1% 1.3% 6.4% 3.8% 8.7% Royal Gardens Apartments 550 5/28/1997 1,192$ 93.7% 93.7% 5.7% 7.1% -0.9% 13.8% Wayne Village 275 7/7/1998 1,339$ 95.9% 97.3% 4.5% 3.5% 3.0% 3.9% Windsor Realty 67 7/7/1998 1,153$ 95.5% 94.4% 1.5% 6.8% -3.9% 15.5% Total New Jersey Region 3,950 1,201$ 94.5% 95.2% 5.0% 5.9% 3.4% 7.8% 11.2%
Philadelphia Region Beechwood Gardens 160 7/7/1998 830$ 95.2% 95.4% 0.1% 2.9% 2.4% 3.5% Castle Club 158 3/15/2000 929$ 92.9% 94.3% -0.2% 1.6% 1.9% 1.4% Chesterfield 247 9/23/1997 903$ 94.7% 96.9% 0.2% 2.2% 8.7% -3.2% Curren Terrace 318 9/23/1997 914$ 94.2% 94.8% 0.7% 4.2% 3.7% 4.6% Glen Brook 174 7/28/1999 817$ 93.1% 93.2% 0.5% 4.2% -7.7% 22.0% Glen Manor 174 9/23/1997 788$ 95.6% 93.5% 3.3% 7.6% 2.6% 13.7% Golf Club 399 3/15/2000 1,015$ 94.6% 93.2% 0.5% 5.5% 2.3% 7.9% Hill Brook Place 274 7/28/1999 881$ 93.6% 95.0% 0.7% 2.3% 2.2% 2.3% Home Properties of Bryn Mawr 316 3/15/2000 1,037$ 93.0% 92.6% -1.3% 2.0% -1.3% 4.8% Home Properties of Devon 631 3/15/2000 1,088$ 95.4% 93.1% 0.0% 5.2% 1.4% 7.9% Home Properties of Newark 432 7/16/1999 858$ 94.0% 94.9% 0.7% 1.6% 6.1% -1.8% New Orleans Park 442 7/28/1999 849$ 94.1% 95.7% 3.9% 6.7% 3.4% 10.1% Racquet Club 466 7/7/1998 1,014$ 95.8% 94.4% -0.8% 5.5% 5.4% 5.6% Racquet Club South 103 5/27/1999 867$ 95.4% 95.0% -1.1% 5.0% 1.0% 8.9% Ridley Brook 244 7/28/1999 888$ 94.4% 95.7% 1.3% 4.6% 5.2% 4.1% Sherry Lake 298 7/23/1998 1,164$ 91.6% 93.8% 0.4% 0.5% 3.4% -1.2% The Brooke at Peachtree Village 146 8/15/2005 1,065$ 97.1% 97.3% 5.0% 5.7% 5.7% 5.7% The Landings 384 11/25/1996 964$ 95.7% 95.1% 0.4% 3.0% -3.3% 7.9% Trexler Park 250 3/15/2000 1,038$ 91.6% 90.6% -0.8% -2.0% -2.0% -2.0% Trexler Park West 168 Under Construction 1,255$ 84.5% n/a n/a n/a n/a n/a Valley View 177 9/23/1997 826$ 88.6% 90.0% -0.8% 7.1% 7.9% 6.0% Village Square 128 9/23/1997 933$ 93.5% 94.9% 2.6% 1.6% 1.7% 1.5% William Henry 363 3/15/2000 1,081$ 94.6% 92.4% -1.3% 5.6% 6.5% 4.9% Total Philadelphia Region 6,452 962$ 94.2% 94.0% 0.4% 3.8% 2.6% 4.9% 15.0%
HOME PROPERTIES 4Q 2007 SUPPLEMENTAL FINANCIAL INFORMATIONHOME PROPERTIES 4Q 2007 SUPPLEMENTAL FINANCIAL INFORMATION Page 13

OWNED COMMUNITY RESULTS
December YTD % Growth
# of Date YTD '07 YTD '07 Year Ago Rental Total Total Total YTD '07Units Acquired Rent/Mo. Occup. Occup. Rates Revenue Expense NOI % Co. NOI
YTD '07 versus YTD '06
Washington DC Region Braddock Lee 255 3/16/1998 1,231$ 96.0% 96.9% 2.6% 5.4% 4.5% 6.0% Cider Mill 864 9/27/2002 1,065$ 95.1% 94.3% 0.9% 3.8% -0.8% 7.3% Cinnamon Run 511 12/28/2005 1,143$ 96.5% 95.9% 2.8% 4.4% -1.4% 7.1% East Meadow 150 8/1/2000 1,315$ 95.3% 96.1% 4.2% 5.1% -2.9% 10.5% Elmwood Terrace 504 6/30/2000 880$ 92.9% 93.3% 3.7% 1.0% 2.3% -0.2% Falkland Chase 450 9/10/2003 1,294$ 94.0% 95.5% 6.1% 3.6% 5.2% 2.8% Mount Vernon Square 1,387 12/27/2006 1,131$ 94.9% n/a n/a n/a n/a n/a Orleans Village 851 11/16/2000 1,277$ 92.8% 93.9% 1.9% 3.4% 0.4% 5.5% Park Shirlington 294 3/16/1998 1,206$ 96.2% 96.2% 1.7% 4.8% -0.9% 9.0% Peppertree Farm 880 12/28/2005 1,108$ 90.4% 89.1% 1.1% 5.3% -1.9% 10.6% Seminary Hill 296 7/1/1999 1,200$ 92.7% 93.8% 1.2% 3.5% -1.8% 8.9% Seminary Towers 540 7/1/1999 1,242$ 93.8% 94.6% 2.7% 4.4% 4.2% 4.6% Tamarron Apartments 132 7/16/1999 1,397$ 95.4% 95.8% 5.4% 4.5% 4.9% 4.3% The Apts at Wellington Trace 240 3/2/2004 1,247$ 93.7% 96.2% 3.8% 0.0% 8.1% -3.4% The Manor - MD 435 8/31/2001 1,125$ 93.3% 94.9% 0.2% 1.2% 5.0% -1.3% The Manor - VA 198 2/19/1999 989$ 93.8% 95.1% 0.9% 2.6% 5.4% 0.5% The Sycamores 185 12/16/2002 1,353$ 96.3% 96.5% 5.3% 7.0% 8.7% 6.2% Virginia Village 344 5/31/2001 1,218$ 94.9% 95.6% 0.7% 4.1% 2.4% 5.5% West Springfield 244 11/18/2002 1,388$ 96.3% 95.1% 3.9% 4.3% 5.7% 3.7% Woodleaf Apartments 228 3/19/2004 1,096$ 94.6% 94.1% 4.4% 4.8% 7.7% 3.2% Total Washington DC Region 8,988 1,166$ 94.1% 94.3% 2.4% 3.8% 1.8% 5.2% 26.9%
TOTAL OWNED PORTFOLIO 37,496 1,101$ 94.7% n/a n/a n/a n/a n/a 100.0%TOTAL CORE PORTFOLIO 32,600 1,101$ 94.8% 94.7% 2.5% 4.0% 2.8% 5.0%
HOME PROPERTIES 4Q 2007 SUPPLEMENTAL FINANCIAL INFORMATIONHOME PROPERTIES 4Q 2007 SUPPLEMENTAL FINANCIAL INFORMATION Page 14
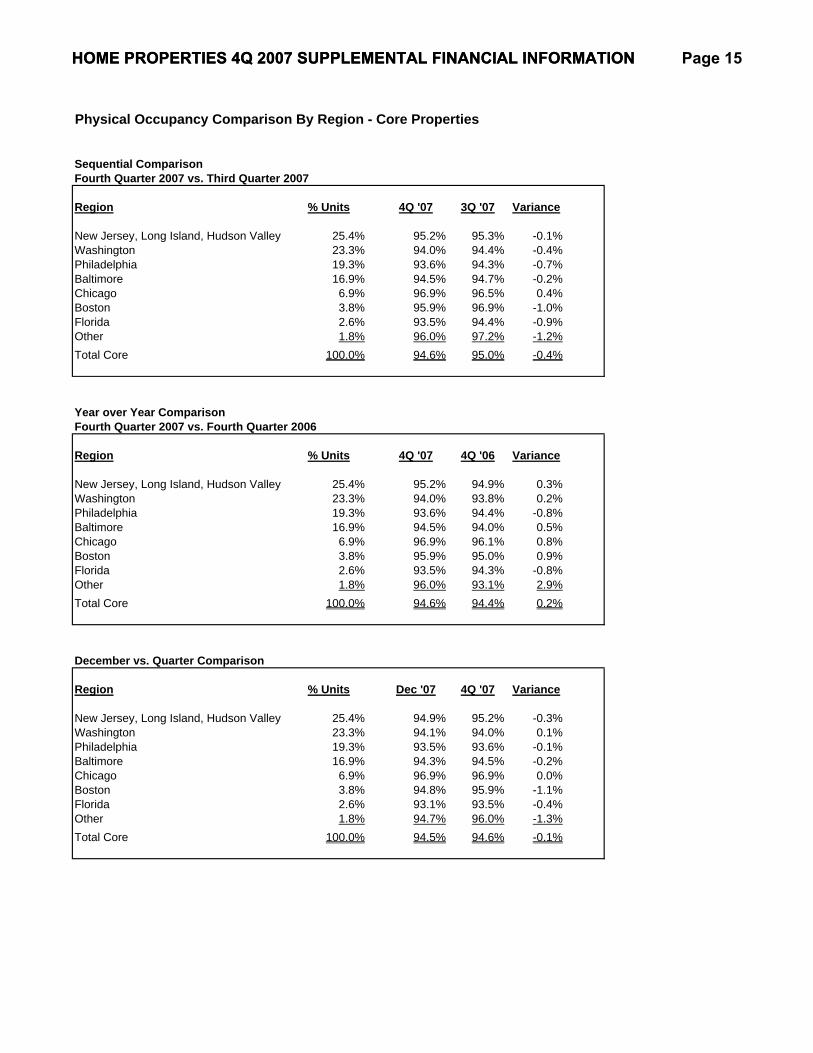
Physical Occupancy Comparison By Region - Core Properties
Sequential ComparisonFourth Quarter 2007 vs. Third Quarter 2007
Region % Units 4Q '07 3Q '07 Variance
New Jersey, Long Island, Hudson Valley 25.4% 95.2% 95.3% -0.1%Washington 23.3% 94.0% 94.4% -0.4%Philadelphia 19.3% 93.6% 94.3% -0.7%Baltimore 16.9% 94.5% 94.7% -0.2%Chicago 6.9% 96.9% 96.5% 0.4%Boston 3.8% 95.9% 96.9% -1.0%Florida 2.6% 93.5% 94.4% -0.9%Other 1.8% 96.0% 97.2% -1.2%Total Core 100.0% 94.6% 95.0% -0.4%
Year over Year ComparisonFourth Quarter 2007 vs. Fourth Quarter 2006
Region % Units 4Q '07 4Q '06 Variance
New Jersey, Long Island, Hudson Valley 25.4% 95.2% 94.9% 0.3%Washington 23.3% 94.0% 93.8% 0.2%Philadelphia 19.3% 93.6% 94.4% -0.8%Baltimore 16.9% 94.5% 94.0% 0.5%Chicago 6.9% 96.9% 96.1% 0.8%Boston 3.8% 95.9% 95.0% 0.9%Florida 2.6% 93.5% 94.3% -0.8%Other 1.8% 96.0% 93.1% 2.9%Total Core 100.0% 94.6% 94.4% 0.2%
December vs. Quarter Comparison
Region % Units Dec '07 4Q '07 Variance
New Jersey, Long Island, Hudson Valley 25.4% 94.9% 95.2% -0.3%Washington 23.3% 94.1% 94.0% 0.1%Philadelphia 19.3% 93.5% 93.6% -0.1%Baltimore 16.9% 94.3% 94.5% -0.2%Chicago 6.9% 96.9% 96.9% 0.0%Boston 3.8% 94.8% 95.9% -1.1%Florida 2.6% 93.1% 93.5% -0.4%Other 1.8% 94.7% 96.0% -1.3%Total Core 100.0% 94.5% 94.6% -0.1%
HOME PROPERTIES 4Q 2007 SUPPLEMENTAL FINANCIAL INFORMATIONHOME PROPERTIES 4Q 2007 SUPPLEMENTAL FINANCIAL INFORMATION Page 15
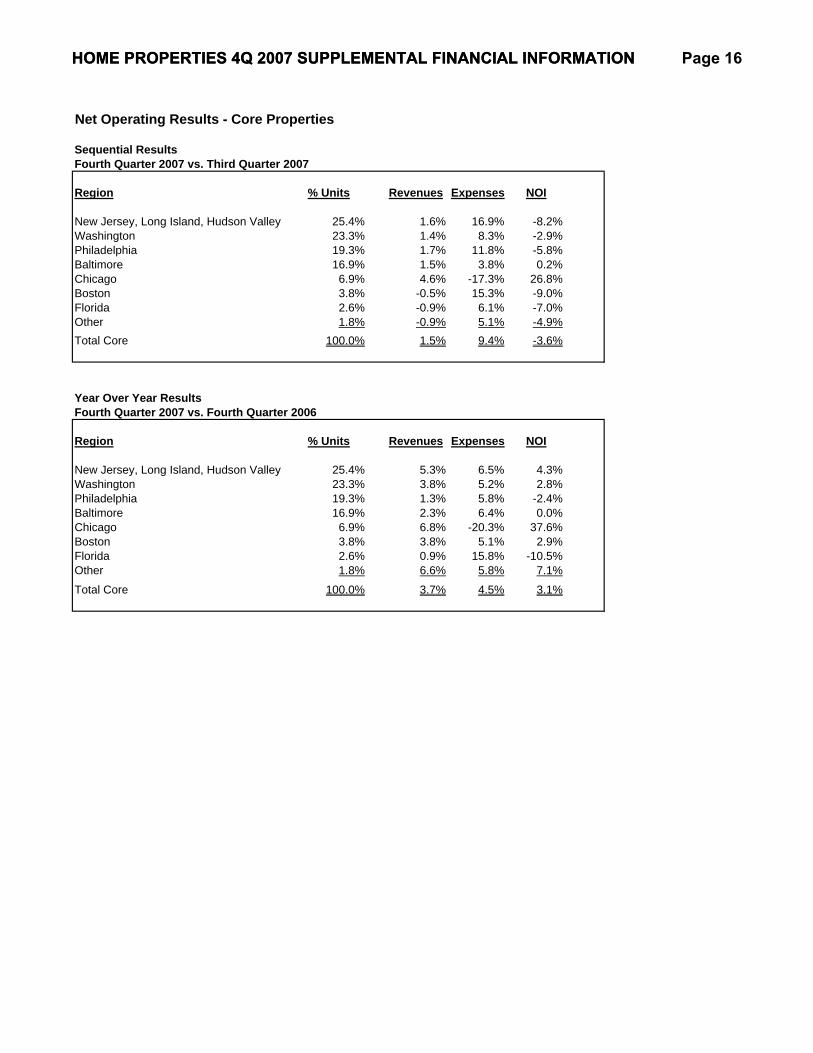
Net Operating Results - Core Properties
Sequential ResultsFourth Quarter 2007 vs. Third Quarter 2007
Region % Units Revenues Expenses NOI
New Jersey, Long Island, Hudson Valley 25.4% 1.6% 16.9% -8.2%Washington 23.3% 1.4% 8.3% -2.9%Philadelphia 19.3% 1.7% 11.8% -5.8%Baltimore 16.9% 1.5% 3.8% 0.2%Chicago 6.9% 4.6% -17.3% 26.8%Boston 3.8% -0.5% 15.3% -9.0%Florida 2.6% -0.9% 6.1% -7.0%Other 1.8% -0.9% 5.1% -4.9%Total Core 100.0% 1.5% 9.4% -3.6%
Year Over Year ResultsFourth Quarter 2007 vs. Fourth Quarter 2006
Region % Units Revenues Expenses NOI
New Jersey, Long Island, Hudson Valley 25.4% 5.3% 6.5% 4.3%Washington 23.3% 3.8% 5.2% 2.8%Philadelphia 19.3% 1.3% 5.8% -2.4%Baltimore 16.9% 2.3% 6.4% 0.0%Chicago 6.9% 6.8% -20.3% 37.6%Boston 3.8% 3.8% 5.1% 2.9%Florida 2.6% 0.9% 15.8% -10.5%Other 1.8% 6.6% 5.8% 7.1%
Total Core 100.0% 3.7% 4.5% 3.1%
HOME PROPERTIES 4Q 2007 SUPPLEMENTAL FINANCIAL INFORMATIONHOME PROPERTIES 4Q 2007 SUPPLEMENTAL FINANCIAL INFORMATION Page 16
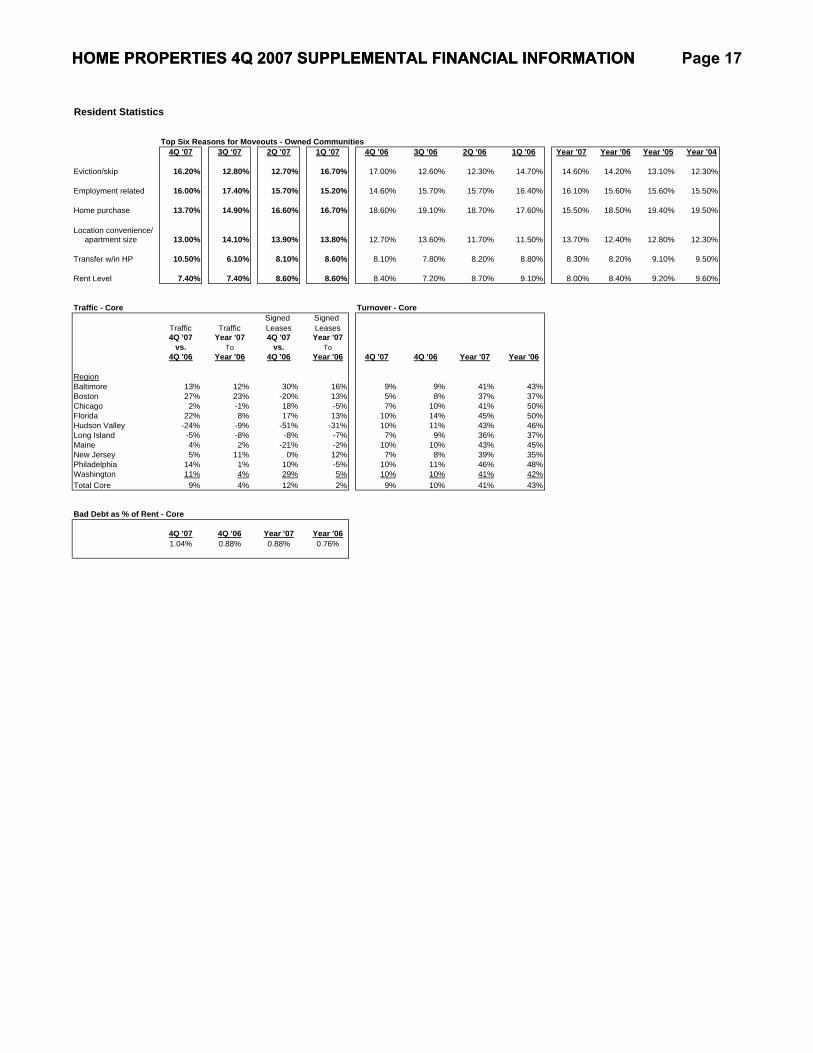
Resident Statistics
Top Six Reasons for Moveouts - Owned Communities4Q '07 3Q '07 2Q '07 1Q '07 4Q '06 3Q '06 2Q '06 1Q '06 Year '07 Year '06 Year '05 Year '04
Eviction/skip 16.20% 12.80% 12.70% 16.70% 17.00% 12.60% 12.30% 14.70% 14.60% 14.20% 13.10% 12.30%
Employment related 16.00% 17.40% 15.70% 15.20% 14.60% 15.70% 15.70% 16.40% 16.10% 15.60% 15.60% 15.50%
Home purchase 13.70% 14.90% 16.60% 16.70% 18.60% 19.10% 18.70% 17.60% 15.50% 18.50% 19.40% 19.50%
Location convenience/ apartment size 13.00% 14.10% 13.90% 13.80% 12.70% 13.60% 11.70% 11.50% 13.70% 12.40% 12.80% 12.30%
Transfer w/in HP 10.50% 6.10% 8.10% 8.60% 8.10% 7.80% 8.20% 8.80% 8.30% 8.20% 9.10% 9.50%
Rent Level 7.40% 7.40% 8.60% 8.60% 8.40% 7.20% 8.70% 9.10% 8.00% 8.40% 9.20% 9.60%
Traffic - Core Turnover - CoreSigned Signed
Traffic Traffic Leases Leases4Q '07 Year '07 4Q '07 Year '07
vs. To vs. To4Q '06 Year '06 4Q '06 Year '06 4Q '07 4Q '06 Year '07 Year '06
RegionBaltimore 13% 12% 30% 16% 9% 9% 41% 43%Boston 27% 23% -20% 13% 5% 8% 37% 37%Chicago 2% -1% 18% -5% 7% 10% 41% 50%Florida 22% 8% 17% 13% 10% 14% 45% 50%Hudson Valley -24% -9% -51% -31% 10% 11% 43% 46%Long Island -5% -8% -8% -7% 7% 9% 36% 37%Maine 4% 2% -21% -2% 10% 10% 43% 45%New Jersey 5% 11% 0% 12% 7% 8% 39% 35%Philadelphia 14% 1% 10% -5% 10% 11% 46% 48%Washington 11% 4% 29% 5% 10% 10% 41% 42%Total Core 9% 4% 12% 2% 9% 10% 41% 43%
Bad Debt as % of Rent - Core
4Q '07 4Q '06 Year '07 Year '061.04% 0.88% 0.88% 0.76%
HOME PROPERTIES 4Q 2007 SUPPLEMENTAL FINANCIAL INFORMATIONHOME PROPERTIES 4Q 2007 SUPPLEMENTAL FINANCIAL INFORMATION Page 17

Net Operating Income Detail - Core Properties ($ in thousands, except per unit data)
4Q '07 4Q '06 Qtr % YTD '07 YTD '06 YTD %Actual Actual Variance Variance Actual Actual Variance Variance
Rent 101,950$ 99,460$ 2,490$ 2.5% 404,594$ 395,140$ 9,454$ 2.4%Utility recovery 4,381 2,831 1,550 54.8% 16,565 8,610 7,955 92.4%Rent including recoveries 106,331 102,291 4,040 3.9% 421,159 403,750 17,409 4.3%Other income 4,263 4,384 (121) -2.8% 17,559 17,919 (360) -2.0%
Total income 110,594 106,675 3,919 3.7% 438,718 421,669 17,049 4.0%Operating & maintenance (47,464) (45,418) (2,046) -4.5% (183,738) (178,769) (4,969) -2.8%
Net Core NOI 63,130$ 61,257$ 1,873$ 3.1% 254,980$ 242,900$ 12,080$ 5.0%
Physical Occupancy % 94.6% 94.4% 0.2% 94.8% 94.7% 0.1%
Weighted Avg Rent 1,114$ 1,086$ 27$ 2.5% 1,101$ 1,075$ 26$ 2.5%
Seasonality Factor for NAV Calculation
To annualize net operating income in order to calculate a net asset value, the seasonality factor to apply to the quarter's effective NOI run rate is 24.8%.This will adjust for the typical seasonal variability in NOI for each quarter.
HOME PROPERTIES 4Q 2007 SUPPLEMENTAL FINANCIAL INFORMATIONHOME PROPERTIES 4Q 2007 SUPPLEMENTAL FINANCIAL INFORMATION Page 18
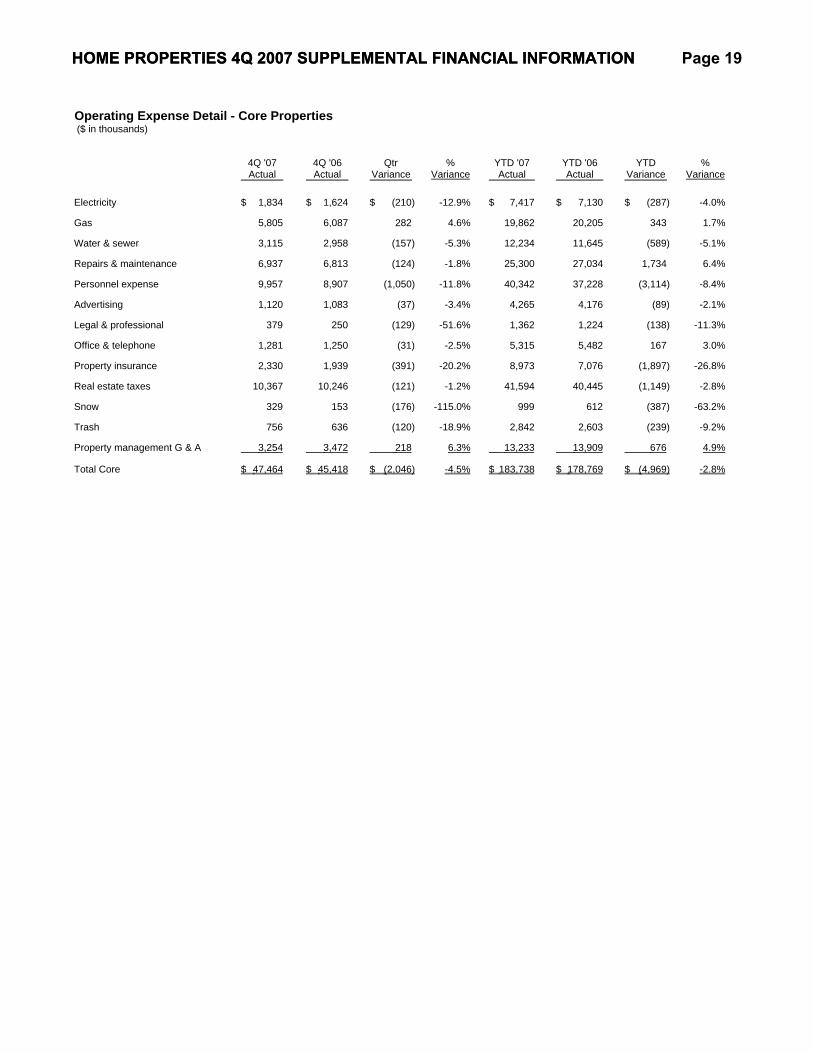
Operating Expense Detail - Core Properties ($ in thousands)
4Q '07 4Q '06 Qtr % YTD '07 YTD '06 YTD %Actual Actual Variance Variance Actual Actual Variance Variance
Electricity 1,834$ 1,624$ (210)$ -12.9% 7,417$ 7,130$ (287)$ -4.0%
Gas 5,805 6,087 282 4.6% 19,862 20,205 343 1.7%
Water & sewer 3,115 2,958 (157) -5.3% 12,234 11,645 (589) -5.1%
Repairs & maintenance 6,937 6,813 (124) -1.8% 25,300 27,034 1,734 6.4%
Personnel expense 9,957 8,907 (1,050) -11.8% 40,342 37,228 (3,114) -8.4%
Advertising 1,120 1,083 (37) -3.4% 4,265 4,176 (89) -2.1%
Legal & professional 379 250 (129) -51.6% 1,362 1,224 (138) -11.3%
Office & telephone 1,281 1,250 (31) -2.5% 5,315 5,482 167 3.0%
Property insurance 2,330 1,939 (391) -20.2% 8,973 7,076 (1,897) -26.8%
Real estate taxes 10,367 10,246 (121) -1.2% 41,594 40,445 (1,149) -2.8%
Snow 329 153 (176) -115.0% 999 612 (387) -63.2%
Trash 756 636 (120) -18.9% 2,842 2,603 (239) -9.2%
Property management G & A 3,254 3,472 218 6.3% 13,233 13,909 676 4.9%
Total Core 47,464$ 45,418$ (2,046)$ -4.5% 183,738$ 178,769$ (4,969)$ -2.8%
HOME PROPERTIES 4Q 2007 SUPPLEMENTAL FINANCIAL INFORMATIONHOME PROPERTIES 4Q 2007 SUPPLEMENTAL FINANCIAL INFORMATION Page 19
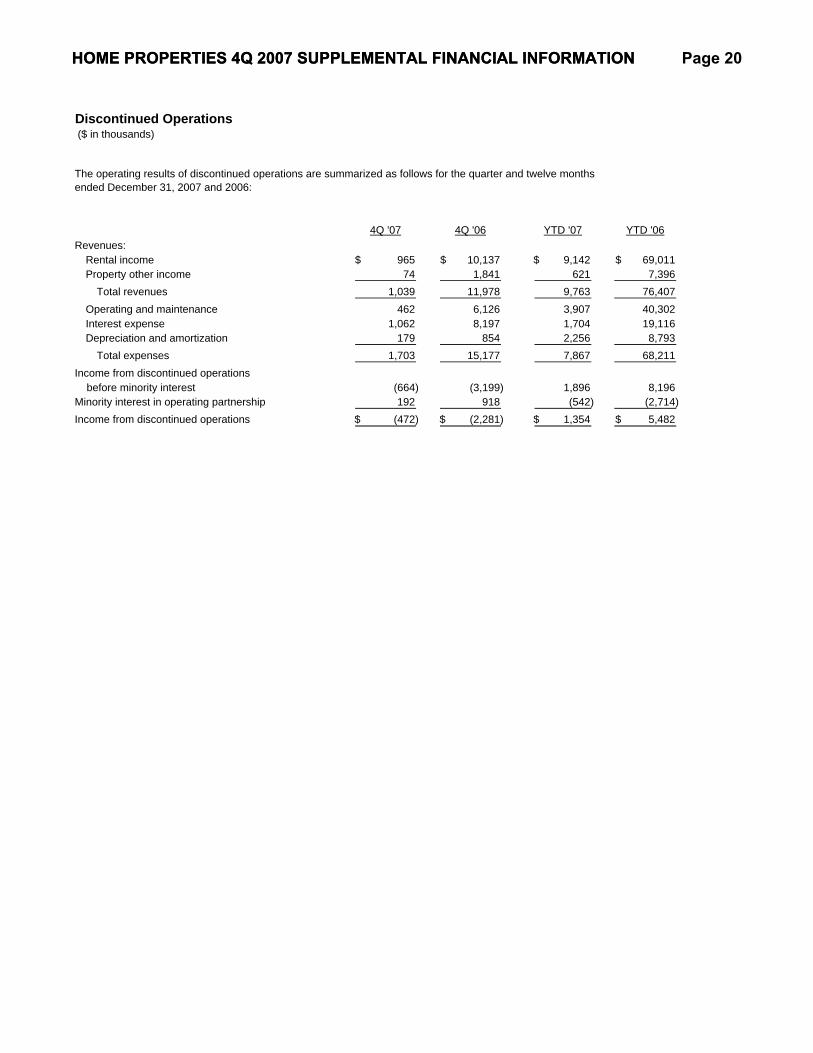
Discontinued Operations ($ in thousands)
4Q '07 4Q '06 YTD '07 YTD '06Revenues:
Rental income 965$ 10,137$ 9,142$ 69,011$ Property other income 74 1,841 621 7,396
Total revenues 1,039 11,978 9,763 76,407 Operating and maintenance 462 6,126 3,907 40,302 Interest expense 1,062 8,197 1,704 19,116 Depreciation and amortization 179 854 2,256 8,793
Total expenses 1,703 15,177 7,867 68,211 Income from discontinued operations before minority interest (664) (3,199) 1,896 8,196 Minority interest in operating partnership 192 918 (542) (2,714) Income from discontinued operations (472)$ (2,281)$ 1,354$ 5,482$
The operating results of discontinued operations are summarized as follows for the quarter and twelve months ended December 31, 2007 and 2006:
HOME PROPERTIES 4Q 2007 SUPPLEMENTAL FINANCIAL INFORMATIONHOME PROPERTIES 4Q 2007 SUPPLEMENTAL FINANCIAL INFORMATION Page 20

Summary Of Recent Acquisitions ($ in millions, except per unit data)
(1) Wgtd. Avg.Purchase # of CAP Purchase Price Per
Community Market State Date Units Rate Price Unit2007 AcquisitionsThe Townhomes of Beverly Boston MA 2/15/2007 204 5.8% $36.4 $178,598Jacob Ford Village New Jersey NJ 2/15/2007 270 5.5% $26.7 $98,811Fox Hall Apartments Baltimore MD 3/28/2007 720 5.7% $62.2 $86,436Westwoods Boston MA 4/30/2007 35 6.6% $4.0 $114,143Dunfield Townhomes Baltimore MD 11/1/2007 312 6.5% $32.2 (2) $103,061
Total YTD 1,541 5.9% $161.5 $104,800
(1) Wgtd. Avg.Purchase # of CAP Purchase Price Per
Community Market State Date Units Rate Price Unit2006 AcquisitionsHighland House Boston MA 5/31/2006 172 6.3% $17.9 $104,006Liberty Place Boston MA 6/6/2006 107 6.6% $14.9 $139,178The Heights at Marlborough Boston MA 9/7/2006 348 6.0% $48.9 $140,557The Meadows at Marlborough Boston MA 9/7/2006 264 6.4% $34.2 $129,402Heritage Woods Baltimore MD 10/4/2006 164 7.2% $14.0 $85,622Topfield Apartments Baltimore MD 10/4/2006 156 6.7% $18.4 $117,891The Coves at Chesapeake Baltimore MD 11/20/2006 469 5.7% $67.0 $142,949Mount Vernon Square NoVA/DC VA 12/27/2006 1,387 7.4% $144.8 $104,375
Total YTD 3,067 6.7% $360.1 $117,411
Total 2007 and 2006 Acquisitions 4,608 6.4% $521.6 $113,194
(1) CAP rate based on projected NOI at the time of acquisition after an allowance for a 3% management fee but before capital expenditures. (2) Purchase Price is $2.4 million less than reported in acquisition press release due to GAAP fair market value adjustment for OP Units issued at a price above current market value.
HOME PROPERTIES 4Q 2007 SUPPLEMENTAL FINANCIAL INFORMATIONHOME PROPERTIES 4Q 2007 SUPPLEMENTAL FINANCIAL INFORMATION Page 21
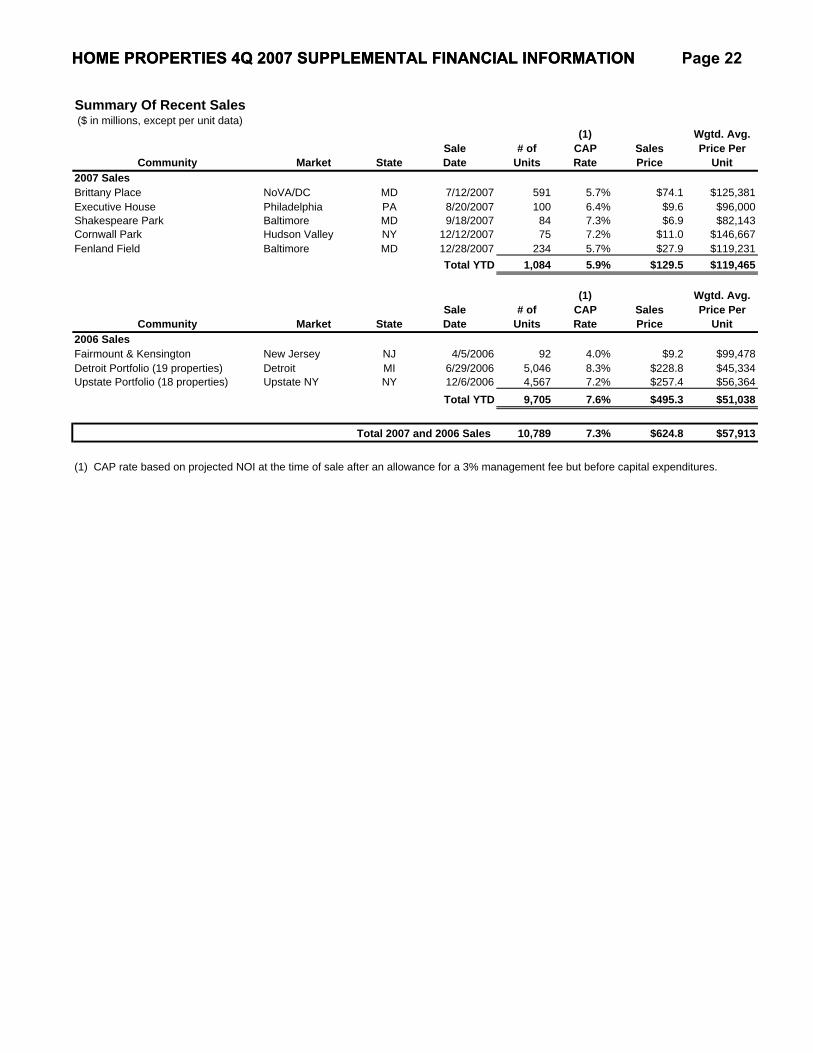
Summary Of Recent Sales ($ in millions, except per unit data)
(1) Wgtd. Avg.Sale # of CAP Sales Price Per
Community Market State Date Units Rate Price Unit2007 SalesBrittany Place NoVA/DC MD 7/12/2007 591 5.7% $74.1 $125,381Executive House Philadelphia PA 8/20/2007 100 6.4% $9.6 $96,000Shakespeare Park Baltimore MD 9/18/2007 84 7.3% $6.9 $82,143Cornwall Park Hudson Valley NY 12/12/2007 75 7.2% $11.0 $146,667Fenland Field Baltimore MD 12/28/2007 234 5.7% $27.9 $119,231
Total YTD 1,084 5.9% $129.5 $119,465
(1) Wgtd. Avg.Sale # of CAP Sales Price Per
Community Market State Date Units Rate Price Unit2006 SalesFairmount & Kensington New Jersey NJ 4/5/2006 92 4.0% $9.2 $99,478Detroit Portfolio (19 properties) Detroit MI 6/29/2006 5,046 8.3% $228.8 $45,334Upstate Portfolio (18 properties) Upstate NY NY 12/6/2006 4,567 7.2% $257.4 $56,364
Total YTD 9,705 7.6% $495.3 $51,038
Total 2007 and 2006 Sales 10,789 7.3% $624.8 $57,913
(1) CAP rate based on projected NOI at the time of sale after an allowance for a 3% management fee but before capital expenditures.
HOME PROPERTIES 4Q 2007 SUPPLEMENTAL FINANCIAL INFORMATIONHOME PROPERTIES 4Q 2007 SUPPLEMENTAL FINANCIAL INFORMATION Page 22
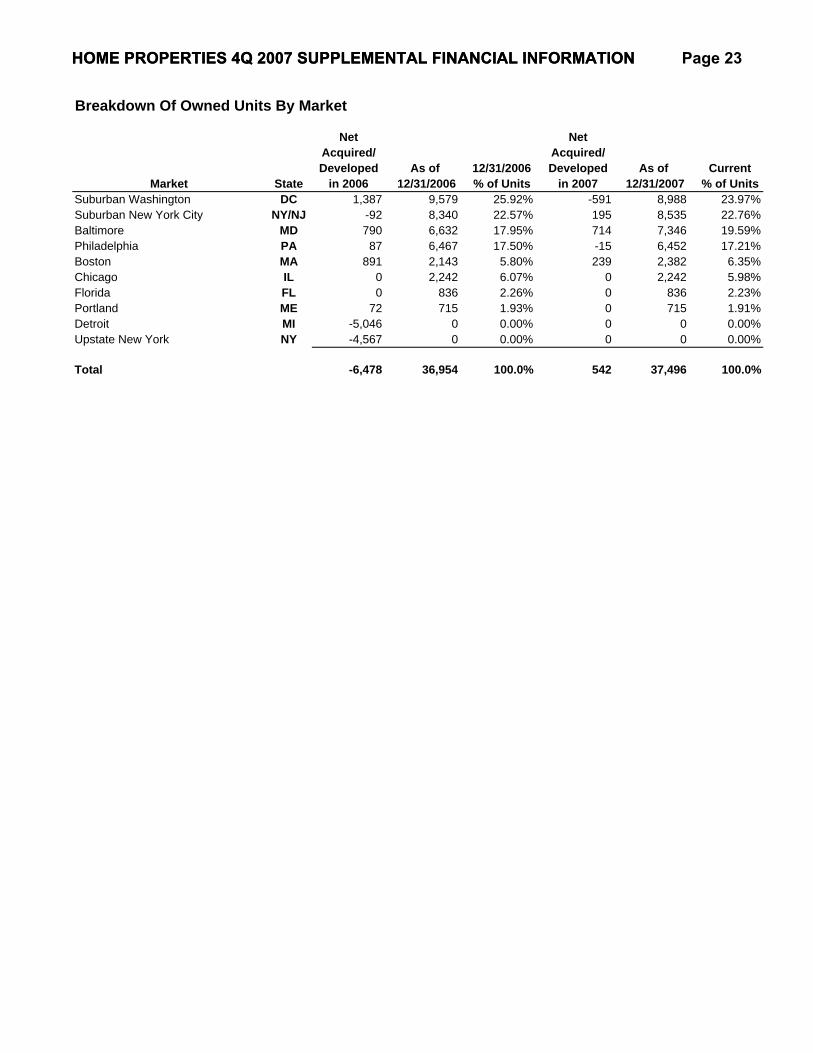
Breakdown Of Owned Units By Market
Net NetAcquired/ Acquired/Developed As of 12/31/2006 Developed As of Current
Market State in 2006 12/31/2006 % of Units in 2007 12/31/2007 % of UnitsSuburban Washington DC 1,387 9,579 25.92% -591 8,988 23.97%Suburban New York City NY/NJ -92 8,340 22.57% 195 8,535 22.76%Baltimore MD 790 6,632 17.95% 714 7,346 19.59%Philadelphia PA 87 6,467 17.50% -15 6,452 17.21%Boston MA 891 2,143 5.80% 239 2,382 6.35%Chicago IL 0 2,242 6.07% 0 2,242 5.98%Florida FL 0 836 2.26% 0 836 2.23%Portland ME 72 715 1.93% 0 715 1.91%Detroit MI -5,046 0 0.00% 0 0 0.00%Upstate New York NY -4,567 0 0.00% 0 0 0.00%
Total -6,478 36,954 100.0% 542 37,496 100.0%
HOME PROPERTIES 4Q 2007 SUPPLEMENTAL FINANCIAL INFORMATIONHOME PROPERTIES 4Q 2007 SUPPLEMENTAL FINANCIAL INFORMATION Page 23
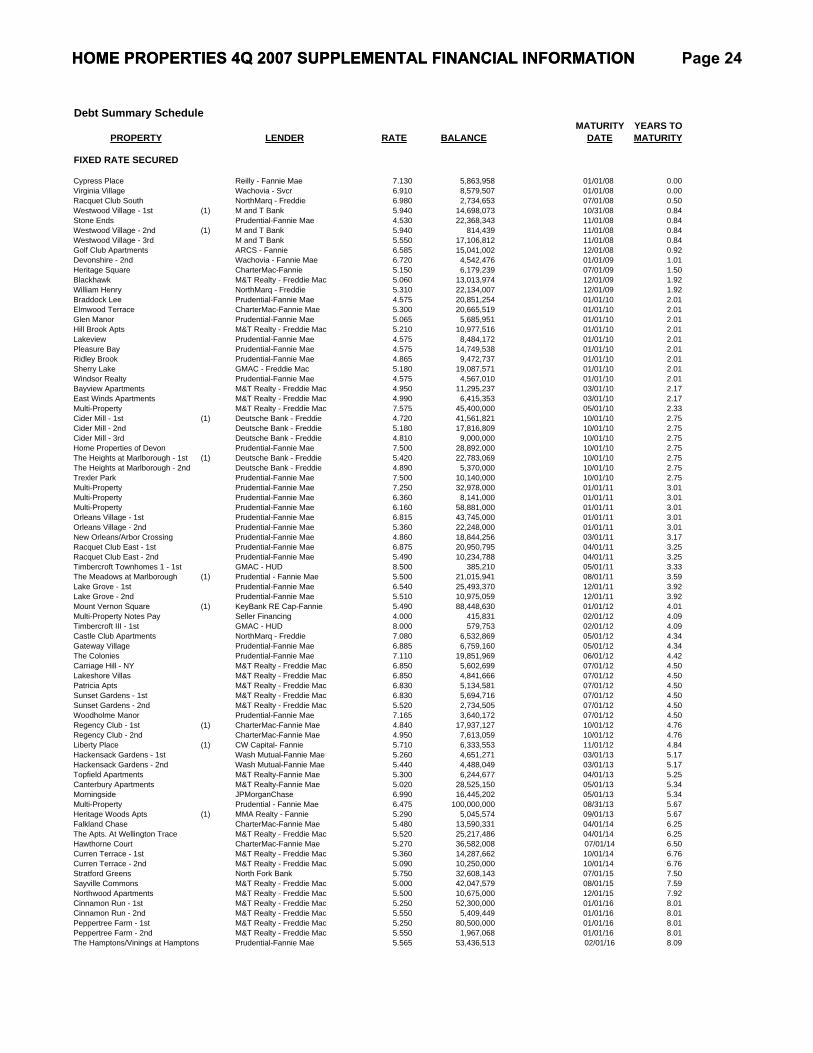
MATURITY YEARS TOPROPERTY LENDER RATE BALANCE DATE MATURITY
FIXED RATE SECURED
Cypress Place Reilly - Fannie Mae 7.130 5,863,958 01/01/08 0.00Virginia Village Wachovia - Svcr 6.910 8,579,507 01/01/08 0.00Racquet Club South NorthMarq - Freddie 6.980 2,734,653 07/01/08 0.50Westwood Village - 1st (1) M and T Bank 5.940 14,698,073 10/31/08 0.84Stone Ends Prudential-Fannie Mae 4.530 22,368,343 11/01/08 0.84Westwood Village - 2nd (1) M and T Bank 5.940 814,439 11/01/08 0.84Westwood Village - 3rd M and T Bank 5.550 17,106,812 11/01/08 0.84Golf Club Apartments ARCS - Fannie 6.585 15,041,002 12/01/08 0.92Devonshire - 2nd Wachovia - Fannie Mae 6.720 4,542,476 01/01/09 1.01Heritage Square CharterMac-Fannie 5.150 6,179,239 07/01/09 1.50Blackhawk M&T Realty - Freddie Mac 5.060 13,013,974 12/01/09 1.92William Henry NorthMarq - Freddie 5.310 22,134,007 12/01/09 1.92Braddock Lee Prudential-Fannie Mae 4.575 20,851,254 01/01/10 2.01Elmwood Terrace CharterMac-Fannie Mae 5.300 20,665,519 01/01/10 2.01Glen Manor Prudential-Fannie Mae 5.065 5,685,951 01/01/10 2.01Hill Brook Apts M&T Realty - Freddie Mac 5.210 10,977,516 01/01/10 2.01Lakeview Prudential-Fannie Mae 4.575 8,484,172 01/01/10 2.01Pleasure Bay Prudential-Fannie Mae 4.575 14,749,538 01/01/10 2.01Ridley Brook Prudential-Fannie Mae 4.865 9,472,737 01/01/10 2.01Sherry Lake GMAC - Freddie Mac 5.180 19,087,571 01/01/10 2.01Windsor Realty Prudential-Fannie Mae 4.575 4,567,010 01/01/10 2.01Bayview Apartments M&T Realty - Freddie Mac 4.950 11,295,237 03/01/10 2.17East Winds Apartments M&T Realty - Freddie Mac 4.990 6,415,353 03/01/10 2.17Multi-Property M&T Realty - Freddie Mac 7.575 45,400,000 05/01/10 2.33Cider Mill - 1st (1) Deutsche Bank - Freddie 4.720 41,561,821 10/01/10 2.75Cider Mill - 2nd Deutsche Bank - Freddie 5.180 17,816,809 10/01/10 2.75Cider Mill - 3rd Deutsche Bank - Freddie 4.810 9,000,000 10/01/10 2.75Home Properties of Devon Prudential-Fannie Mae 7.500 28,892,000 10/01/10 2.75The Heights at Marlborough - 1st (1) Deutsche Bank - Freddie 5.420 22,783,069 10/01/10 2.75The Heights at Marlborough - 2nd Deutsche Bank - Freddie 4.890 5,370,000 10/01/10 2.75Trexler Park Prudential-Fannie Mae 7.500 10,140,000 10/01/10 2.75Multi-Property Prudential-Fannie Mae 7.250 32,978,000 01/01/11 3.01Multi-Property Prudential-Fannie Mae 6.360 8,141,000 01/01/11 3.01Multi-Property Prudential-Fannie Mae 6.160 58,881,000 01/01/11 3.01Orleans Village - 1st Prudential-Fannie Mae 6.815 43,745,000 01/01/11 3.01Orleans Village - 2nd Prudential-Fannie Mae 5.360 22,248,000 01/01/11 3.01New Orleans/Arbor Crossing Prudential-Fannie Mae 4.860 18,844,256 03/01/11 3.17Racquet Club East - 1st Prudential-Fannie Mae 6.875 20,950,795 04/01/11 3.25Racquet Club East - 2nd Prudential-Fannie Mae 5.490 10,234,788 04/01/11 3.25Timbercroft Townhomes 1 - 1st GMAC - HUD 8.500 385,210 05/01/11 3.33The Meadows at Marlborough (1) Prudential - Fannie Mae 5.500 21,015,941 08/01/11 3.59Lake Grove - 1st Prudential-Fannie Mae 6.540 25,493,370 12/01/11 3.92Lake Grove - 2nd Prudential-Fannie Mae 5.510 10,975,059 12/01/11 3.92Mount Vernon Square (1) KeyBank RE Cap-Fannie 5.490 88,448,630 01/01/12 4.01Multi-Property Notes Pay Seller Financing 4.000 415,831 02/01/12 4.09Timbercroft III - 1st GMAC - HUD 8.000 579,753 02/01/12 4.09Castle Club Apartments NorthMarq - Freddie 7.080 6,532,869 05/01/12 4.34Gateway Village Prudential-Fannie Mae 6.885 6,759,160 05/01/12 4.34The Colonies Prudential-Fannie Mae 7.110 19,851,969 06/01/12 4.42Carriage Hill - NY M&T Realty - Freddie Mac 6.850 5,602,699 07/01/12 4.50Lakeshore Villas M&T Realty - Freddie Mac 6.850 4,841,666 07/01/12 4.50Patricia Apts M&T Realty - Freddie Mac 6.830 5,134,581 07/01/12 4.50Sunset Gardens - 1st M&T Realty - Freddie Mac 6.830 5,694,716 07/01/12 4.50Sunset Gardens - 2nd M&T Realty - Freddie Mac 5.520 2,734,505 07/01/12 4.50Woodholme Manor Prudential-Fannie Mae 7.165 3,640,172 07/01/12 4.50Regency Club - 1st (1) CharterMac-Fannie Mae 4.840 17,937,127 10/01/12 4.76Regency Club - 2nd CharterMac-Fannie Mae 4.950 7,613,059 10/01/12 4.76Liberty Place (1) CW Capital- Fannie 5.710 6,333,553 11/01/12 4.84Hackensack Gardens - 1st Wash Mutual-Fannie Mae 5.260 4,651,271 03/01/13 5.17Hackensack Gardens - 2nd Wash Mutual-Fannie Mae 5.440 4,488,049 03/01/13 5.17Topfield Apartments M&T Realty-Fannie Mae 5.300 6,244,677 04/01/13 5.25Canterbury Apartments M&T Realty-Fannie Mae 5.020 28,525,150 05/01/13 5.34Morningside JPMorganChase 6.990 16,445,202 05/01/13 5.34Multi-Property Prudential - Fannie Mae 6.475 100,000,000 08/31/13 5.67Heritage Woods Apts (1) MMA Realty - Fannie 5.290 5,045,574 09/01/13 5.67Falkland Chase CharterMac-Fannie Mae 5.480 13,590,331 04/01/14 6.25The Apts. At Wellington Trace M&T Realty - Freddie Mac 5.520 25,217,486 04/01/14 6.25Hawthorne Court CharterMac-Fannie Mae 5.270 36,582,008 07/01/14 6.50Curren Terrace - 1st M&T Realty - Freddie Mac 5.360 14,287,662 10/01/14 6.76Curren Terrace - 2nd M&T Realty - Freddie Mac 5.090 10,250,000 10/01/14 6.76Stratford Greens North Fork Bank 5.750 32,608,143 07/01/15 7.50Sayville Commons M&T Realty - Freddie Mac 5.000 42,047,579 08/01/15 7.59Northwood Apartments M&T Realty - Freddie Mac 5.500 10,675,000 12/01/15 7.92Cinnamon Run - 1st M&T Realty - Freddie Mac 5.250 52,300,000 01/01/16 8.01Cinnamon Run - 2nd M&T Realty - Freddie Mac 5.550 5,409,449 01/01/16 8.01Peppertree Farm - 1st M&T Realty - Freddie Mac 5.250 80,500,000 01/01/16 8.01Peppertree Farm - 2nd M&T Realty - Freddie Mac 5.550 1,967,068 01/01/16 8.01The Hamptons/Vinings at Hamptons Prudential-Fannie Mae 5.565 53,436,513 02/01/16 8.09
Debt Summary Schedule
HOME PROPERTIES 4Q 2007 SUPPLEMENTAL FINANCIAL INFORMATIONHOME PROPERTIES 4Q 2007 SUPPLEMENTAL FINANCIAL INFORMATION Page 24
MATURITY YEARS TOPROPERTY LENDER RATE BALANCE DATE MATURITY
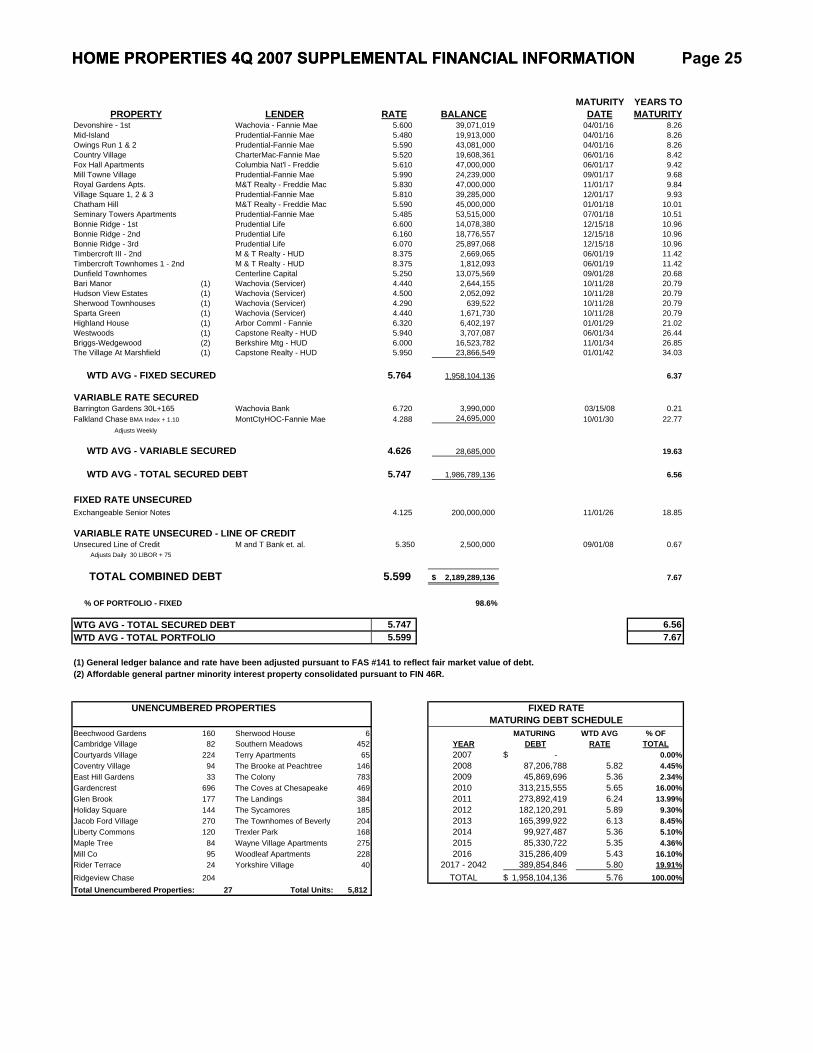
Devonshire - 1st Wachovia - Fannie Mae 5.600 39,071,019 04/01/16 8.26Mid-Island Prudential-Fannie Mae 5.480 19,913,000 04/01/16 8.26Owings Run 1 & 2 Prudential-Fannie Mae 5.590 43,081,000 04/01/16 8.26Country Village CharterMac-Fannie Mae 5.520 19,608,361 06/01/16 8.42Fox Hall Apartments Columbia Nat'l - Freddie 5.610 47,000,000 06/01/17 9.42Mill Towne Village Prudential-Fannie Mae 5.990 24,239,000 09/01/17 9.68Royal Gardens Apts. M&T Realty - Freddie Mac 5.830 47,000,000 11/01/17 9.84Village Square 1, 2 & 3 Prudential-Fannie Mae 5.810 39,285,000 12/01/17 9.93Chatham Hill M&T Realty - Freddie Mac 5.590 45,000,000 01/01/18 10.01Seminary Towers Apartments Prudential-Fannie Mae 5.485 53,515,000 07/01/18 10.51Bonnie Ridge - 1st Prudential Life 6.600 14,078,380 12/15/18 10.96Bonnie Ridge - 2nd Prudential Life 6.160 18,776,557 12/15/18 10.96Bonnie Ridge - 3rd Prudential Life 6.070 25,897,068 12/15/18 10.96Timbercroft III - 2nd M & T Realty - HUD 8.375 2,669,065 06/01/19 11.42Timbercroft Townhomes 1 - 2nd M & T Realty - HUD 8.375 1,812,093 06/01/19 11.42Dunfield Townhomes Centerline Capital 5.250 13,075,569 09/01/28 20.68Bari Manor (1) Wachovia (Servicer) 4.440 2,644,155 10/11/28 20.79Hudson View Estates (1) Wachovia (Servicer) 4.500 2,052,092 10/11/28 20.79Sherwood Townhouses (1) Wachovia (Servicer) 4.290 639,522 10/11/28 20.79Sparta Green (1) Wachovia (Servicer) 4.440 1,671,730 10/11/28 20.79Highland House (1) Arbor Comml - Fannie 6.320 6,402,197 01/01/29 21.02Westwoods (1) Capstone Realty - HUD 5.940 3,707,087 06/01/34 26.44Briggs-Wedgewood (2) Berkshire Mtg - HUD 6.000 16,523,782 11/01/34 26.85The Village At Marshfield (1) Capstone Realty - HUD 5.950 23,866,549 01/01/42 34.03
WTD AVG - FIXED SECURED 5.764 1,958,104,136 6.37
VARIABLE RATE SECUREDBarrington Gardens 30L+165 Wachovia Bank 6.720 3,990,000 03/15/08 0.21Falkland Chase BMA Index + 1.10 MontCtyHOC-Fannie Mae 4.288 24,695,000 10/01/30 22.77
Adjusts Weekly
WTD AVG - VARIABLE SECURED 4.626 28,685,000 19.63
WTD AVG - TOTAL SECURED DEBT 5.747 1,986,789,136 6.56
FIXED RATE UNSECURED Exchangeable Senior Notes 4.125 200,000,000 11/01/26 18.85
VARIABLE RATE UNSECURED - LINE OF CREDITUnsecured Line of Credit M and T Bank et. al. 5.350 2,500,000 09/01/08 0.67
Adjusts Daily 30 LIBOR + 75
TOTAL COMBINED DEBT 5.599 2,189,289,136$ 7.67
% OF PORTFOLIO - FIXED 98.6%
WTG AVG - TOTAL SECURED DEBT 5.747 6.56WTD AVG - TOTAL PORTFOLIO 5.599 7.67
(1) General ledger balance and rate have been adjusted pursuant to FAS #141 to reflect fair market value of debt.(2) Affordable general partner minority interest property consolidated pursuant to FIN 46R.
Beechwood Gardens 160 Sherwood House 6 MATURING WTD AVG % OFCambridge Village 82 Southern Meadows 452 YEAR DEBT RATE TOTALCourtyards Village 224 Terry Apartments 65 2007 -$ 0.00%Coventry Village 94 The Brooke at Peachtree 146 2008 87,206,788 5.82 4.45%East Hill Gardens 33 The Colony 783 2009 45,869,696 5.36 2.34%Gardencrest 696 The Coves at Chesapeake 469 2010 313,215,555 5.65 16.00%Glen Brook 177 The Landings 384 2011 273,892,419 6.24 13.99%Holiday Square 144 The Sycamores 185 2012 182,120,291 5.89 9.30%Jacob Ford Village 270 The Townhomes of Beverly 204 2013 165,399,922 6.13 8.45%Liberty Commons 120 Trexler Park 168 2014 99,927,487 5.36 5.10%Maple Tree 84 Wayne Village Apartments 275 2015 85,330,722 5.35 4.36%Mill Co 95 Woodleaf Apartments 228 2016 315,286,409 5.43 16.10%Rider Terrace 24 Yorkshire Village 40 2017 - 2042 389,854,846 5.80 19.91%Ridgeview Chase 204 TOTAL 1,958,104,136$ 5.76 100.00%Total Unencumbered Properties: 27 Total Units: 5,812
MATURING DEBT SCHEDULEUNENCUMBERED PROPERTIES FIXED RATE
HOME PROPERTIES 4Q 2007 SUPPLEMENTAL FINANCIAL INFORMATIONHOME PROPERTIES 4Q 2007 SUPPLEMENTAL FINANCIAL INFORMATION Page 25
Recurring Capital Expenditure Summary
MaintenanceCapitalized Expense Total
Capitalized Expenditure Cost Per Cost PerCost Per Useful Per Unit Unit Unit
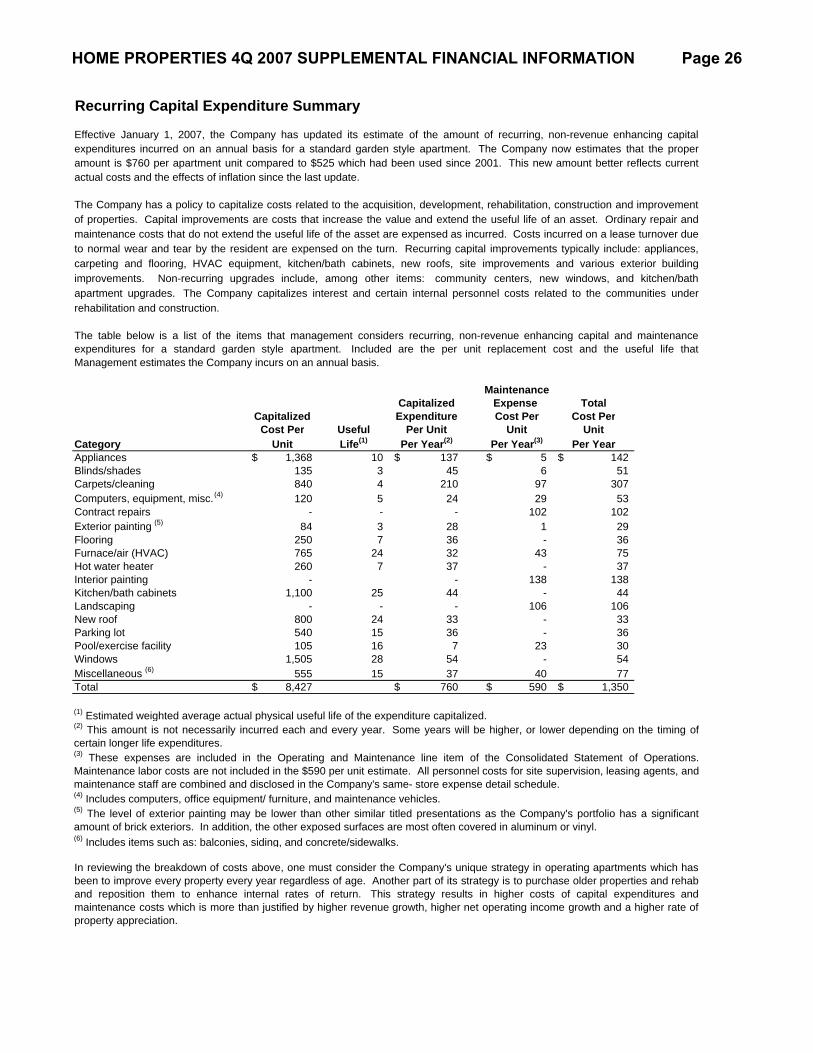
Category Unit Life(1) Per Year(2) Per Year(3) Per YearAppliances 1,368$ 10 137$ 5$ 142$ Blinds/shades 135 3 45 6 51 Carpets/cleaning 840 4 210 97 307 Computers, equipment, misc.(4) 120 5 24 29 53 Contract repairs - - - 102 102 Exterior painting (5) 84 3 28 1 29 Flooring 250 7 36 - 36 Furnace/air (HVAC) 765 24 32 43 75 Hot water heater 260 7 37 - 37 Interior painting - - 138 138 Kitchen/bath cabinets 1,100 25 44 - 44 Landscaping - - - 106 106 New roof 800 24 33 - 33 Parking lot 540 15 36 - 36 Pool/exercise facility 105 16 7 23 30 Windows 1,505 28 54 - 54 Miscellaneous (6) 555 15 37 40 77 Total 8,427$ 760$ 590$ 1,350$
(2) This amount is not necessarily incurred each and every year. Some years will be higher, or lower depending on the timing ofcertain longer life expenditures.
(5) The level of exterior painting may be lower than other similar titled presentations as the Company's portfolio has a significantamount of brick exteriors. In addition, the other exposed surfaces are most often covered in aluminum or vinyl.
(3) These expenses are included in the Operating and Maintenance line item of the Consolidated Statement of Operations.Maintenance labor costs are not included in the $590 per unit estimate. All personnel costs for site supervision, leasing agents, andmaintenance staff are combined and disclosed in the Company's same- store expense detail schedule.(4) Includes computers, office equipment/ furniture, and maintenance vehicles.
(6) Includes items such as: balconies, siding, and concrete/sidewalks.
Effective January 1, 2007, the Company has updated its estimate of the amount of recurring, non-revenue enhancing capitalexpenditures incurred on an annual basis for a standard garden style apartment. The Company now estimates that the properamount is $760 per apartment unit compared to $525 which had been used since 2001. This new amount better reflects currentactual costs and the effects of inflation since the last update.
The Company has a policy to capitalize costs related to the acquisition, development, rehabilitation, construction and improvementof properties. Capital improvements are costs that increase the value and extend the useful life of an asset. Ordinary repair andmaintenance costs that do not extend the useful life of the asset are expensed as incurred. Costs incurred on a lease turnover dueto normal wear and tear by the resident are expensed on the turn. Recurring capital improvements typically include: appliances,carpeting and flooring, HVAC equipment, kitchen/bath cabinets, new roofs, site improvements and various exterior buildingimprovements. Non-recurring upgrades include, among other items: community centers, new windows, and kitchen/bathapartment upgrades. The Company capitalizes interest and certain internal personnel costs related to the communities underrehabilitation and construction.
The table below is a list of the items that management considers recurring, non-revenue enhancing capital and maintenanceexpenditures for a standard garden style apartment. Included are the per unit replacement cost and the useful life thatManagement estimates the Company incurs on an annual basis.
(1) Estimated weighted average actual physical useful life of the expenditure capitalized.
In reviewing the breakdown of costs above, one must consider the Company's unique strategy in operating apartments which hasbeen to improve every property every year regardless of age. Another part of its strategy is to purchase older properties and rehaband reposition them to enhance internal rates of return. This strategy results in higher costs of capital expenditures andmaintenance costs which is more than justified by higher revenue growth, higher net operating income growth and a higher rate ofproperty appreciation.
HOME PROPERTIES 4Q 2007 SUPPLEMENTAL FINANCIAL INFORMATION Page 26
Capital Expenditure Summary
Non- TotalRecurring Recurring Capital
Cap Ex Per Unit(a) Cap Ex Per Unit(a) Improvements Per Unit(a)
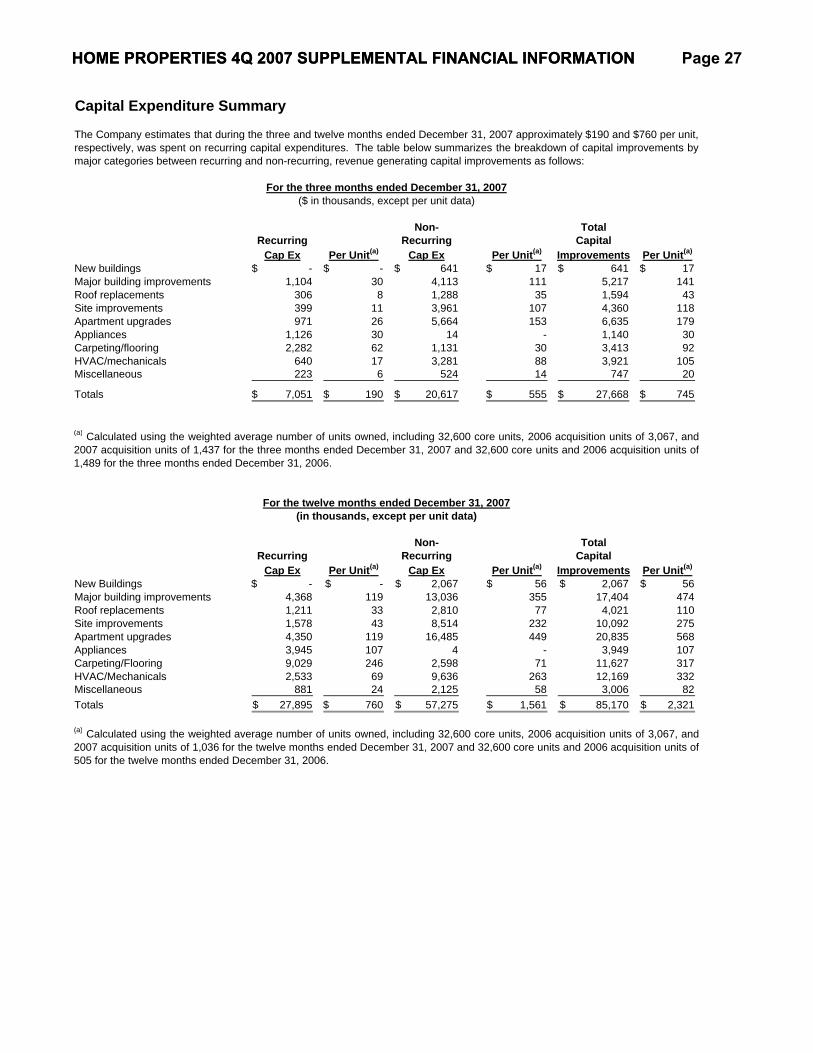
New buildings -$ -$ 641$ 17$ 641$ 17$ Major building improvements 1,104 30 4,113 111 5,217 141 Roof replacements 306 8 1,288 35 1,594 43 Site improvements 399 11 3,961 107 4,360 118 Apartment upgrades 971 26 5,664 153 6,635 179 Appliances 1,126 30 14 - 1,140 30 Carpeting/flooring 2,282 62 1,131 30 3,413 92 HVAC/mechanicals 640 17 3,281 88 3,921 105 Miscellaneous 223 6 524 14 747 20
Totals 7,051$ 190$ 20,617$ 555$ 27,668$ 745$
Non- TotalRecurring Recurring Capital
Cap Ex Per Unit(a) Cap Ex Per Unit(a) Improvements Per Unit(a)
New Buildings -$ -$ 2,067$ 56$ 2,067$ 56$ Major building improvements 4,368 119 13,036 355 17,404 474 Roof replacements 1,211 33 2,810 77 4,021 110 Site improvements 1,578 43 8,514 232 10,092 275 Apartment upgrades 4,350 119 16,485 449 20,835 568 Appliances 3,945 107 4 - 3,949 107 Carpeting/Flooring 9,029 246 2,598 71 11,627 317 HVAC/Mechanicals 2,533 69 9,636 263 12,169 332 Miscellaneous 881 24 2,125 58 3,006 82 Totals 27,895$ 760$ 57,275$ 1,561$ 85,170$ 2,321$
The Company estimates that during the three and twelve months ended December 31, 2007 approximately $190 and $760 per unit,respectively, was spent on recurring capital expenditures. The table below summarizes the breakdown of capital improvements bymajor categories between recurring and non-recurring, revenue generating capital improvements as follows:
For the twelve months ended December 31, 2007
(a) Calculated using the weighted average number of units owned, including 32,600 core units, 2006 acquisition units of 3,067, and2007 acquisition units of 1,437 for the three months ended December 31, 2007 and 32,600 core units and 2006 acquisition units of1,489 for the three months ended December 31, 2006.
For the three months ended December 31, 2007($ in thousands, except per unit data)
(in thousands, except per unit data)
(a) Calculated using the weighted average number of units owned, including 32,600 core units, 2006 acquisition units of 3,067, and2007 acquisition units of 1,036 for the twelve months ended December 31, 2007 and 32,600 core units and 2006 acquisition units of505 for the twelve months ended December 31, 2006.
HOME PROPERTIES 4Q 2007 SUPPLEMENTAL FINANCIAL INFORMATIONHOME PROPERTIES 4Q 2007 SUPPLEMENTAL FINANCIAL INFORMATION Page 27
Capital Expenditure Summary
Non- TotalRecurring Recurring Capital
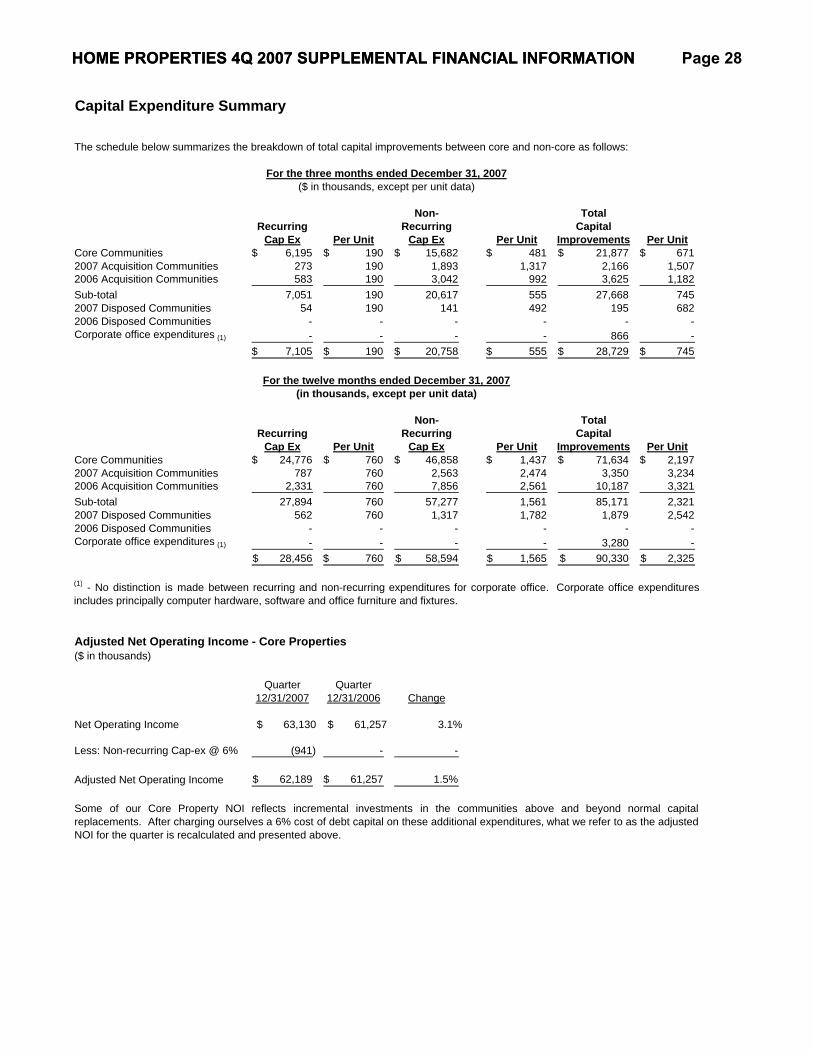
Cap Ex Per Unit Cap Ex Per Unit Improvements Per UnitCore Communities 6,195$ 190$ 15,682$ 481$ 21,877$ 671$ 2007 Acquisition Communities 273 190 1,893 1,317 2,166 1,507 2006 Acquisition Communities 583 190 3,042 992 3,625 1,182 Sub-total 7,051 190 20,617 555 27,668 745 2007 Disposed Communities 54 190 141 492 195 682 2006 Disposed Communities - - - - - - Corporate office expenditures (1) - - - - 866 -
7,105$ 190$ 20,758$ 555$ 28,729$ 745$
Non- TotalRecurring Recurring Capital
Cap Ex Per Unit Cap Ex Per Unit Improvements Per UnitCore Communities 24,776$ 760$ 46,858$ 1,437$ 71,634$ 2,197$ 2007 Acquisition Communities 787 760 2,563 2,474 3,350 3,234 2006 Acquisition Communities 2,331 760 7,856 2,561 10,187 3,321 Sub-total 27,894 760 57,277 1,561 85,171 2,321 2007 Disposed Communities 562 760 1,317 1,782 1,879 2,542 2006 Disposed Communities - - - - - - Corporate office expenditures (1) - - - - 3,280 -
28,456$ 760$ 58,594$ 1,565$ 90,330$ 2,325$
Adjusted Net Operating Income - Core Properties($ in thousands)
Quarter Quarter12/31/2007 12/31/2006 Change
Net Operating Income $ 63,130 $ 61,257 3.1%
Less: Non-recurring Cap-ex @ 6% (941) - -
Adjusted Net Operating Income 62,189$ 61,257$ 1.5%
For the twelve months ended December 31, 2007(in thousands, except per unit data)
Some of our Core Property NOI reflects incremental investments in the communities above and beyond normal capitalreplacements. After charging ourselves a 6% cost of debt capital on these additional expenditures, what we refer to as the adjustedNOI for the quarter is recalculated and presented above.
(1) - No distinction is made between recurring and non-recurring expenditures for corporate office. Corporate office expendituresincludes principally computer hardware, software and office furniture and fixtures.
For the three months ended December 31, 2007($ in thousands, except per unit data)
The schedule below summarizes the breakdown of total capital improvements between core and non-core as follows:
HOME PROPERTIES 4Q 2007 SUPPLEMENTAL FINANCIAL INFORMATIONHOME PROPERTIES 4Q 2007 SUPPLEMENTAL FINANCIAL INFORMATION Page 28
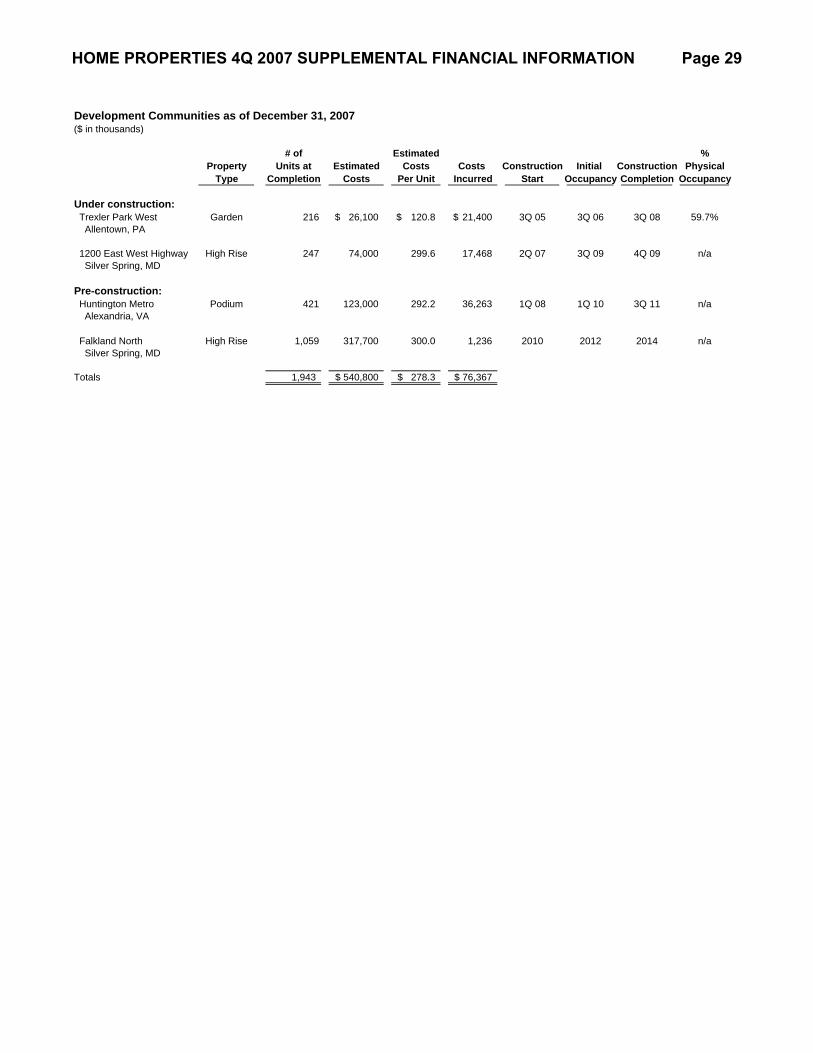
Development Communities as of December 31, 2007 ($ in thousands)
# of Estimated %Property Units at Estimated Costs Costs Construction Initial Construction Physical
Type Completion Costs Per Unit Incurred Start Occupancy Completion Occupancy
Under construction: Trexler Park West Garden 216 26,100$ 120.8$ 21,400$ 3Q 05 3Q 06 3Q 08 59.7% Allentown, PA
1200 East West Highway High Rise 247 74,000 299.6 17,468 2Q 07 3Q 09 4Q 09 n/a Silver Spring, MD
Pre-construction: Huntington Metro Podium 421 123,000 292.2 36,263 1Q 08 1Q 10 3Q 11 n/a Alexandria, VA
Falkland North High Rise 1,059 317,700 300.0 1,236 2010 2012 2014 n/a Silver Spring, MD
Totals 1,943 540,800$ 278.3$ 76,367$
HOME PROPERTIES 4Q 2007 SUPPLEMENTAL FINANCIAL INFORMATION Page 29
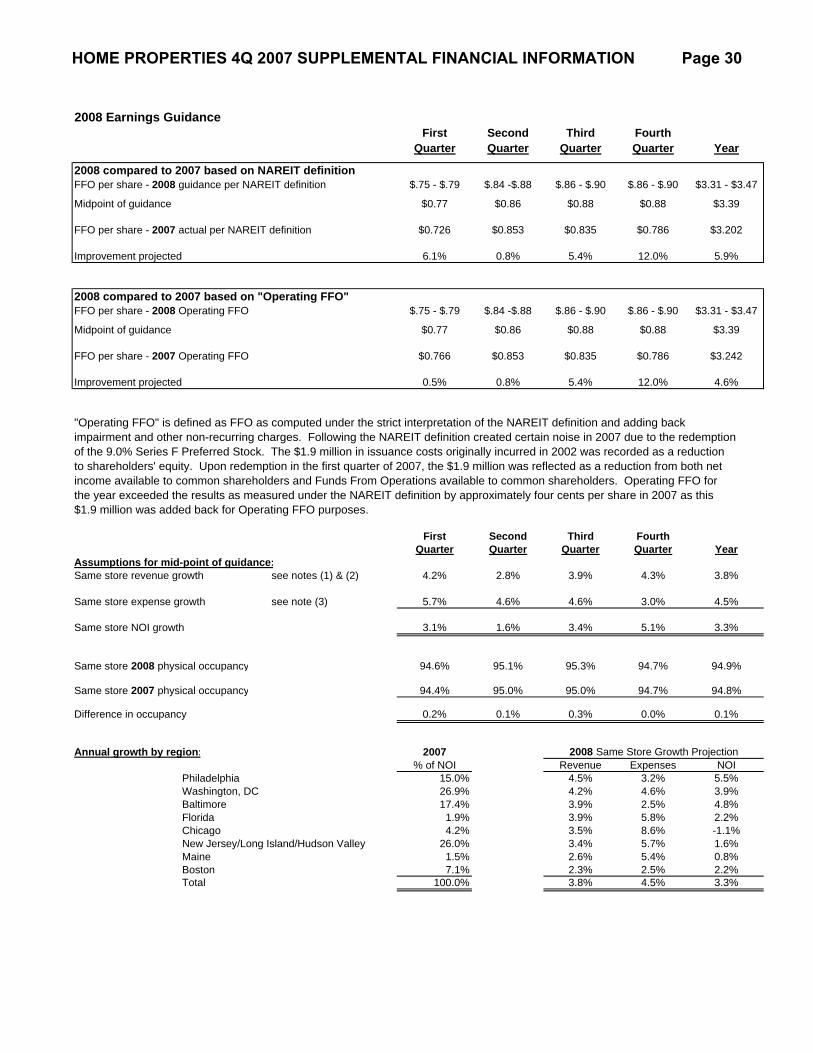
2008 Earnings GuidanceFirst Second Third Fourth
Quarter Quarter Quarter Quarter Year
2008 compared to 2007 based on NAREIT definitionFFO per share - 2008 guidance per NAREIT definition $.75 - $.79 $.84 -$.88 $.86 - $.90 $.86 - $.90 $3.31 - $3.47
Midpoint of guidance $0.77 $0.86 $0.88 $0.88 $3.39
FFO per share - 2007 actual per NAREIT definition $0.726 $0.853 $0.835 $0.786 $3.202
Improvement projected 6.1% 0.8% 5.4% 12.0% 5.9%
2008 compared to 2007 based on "Operating FFO"FFO per share - 2008 Operating FFO $.75 - $.79 $.84 -$.88 $.86 - $.90 $.86 - $.90 $3.31 - $3.47
Midpoint of guidance $0.77 $0.86 $0.88 $0.88 $3.39
FFO per share - 2007 Operating FFO $0.766 $0.853 $0.835 $0.786 $3.242
Improvement projected 0.5% 0.8% 5.4% 12.0% 4.6%
"Operating FFO" is defined as FFO as computed under the strict interpretation of the NAREIT definition and adding back impairment and other non-recurring charges. Following the NAREIT definition created certain noise in 2007 due to the redemption of the 9.0% Series F Preferred Stock. The $1.9 million in issuance costs originally incurred in 2002 was recorded as a reduction to shareholders' equity. Upon redemption in the first quarter of 2007, the $1.9 million was reflected as a reduction from both net income available to common shareholders and Funds From Operations available to common shareholders. Operating FFO forthe year exceeded the results as measured under the NAREIT definition by approximately four cents per share in 2007 as this $1.9 million was added back for Operating FFO purposes.
First Second Third FourthQuarter Quarter Quarter Quarter Year
Assumptions for mid-point of guidance:Same store revenue growth see notes (1) & (2) 4.2% 2.8% 3.9% 4.3% 3.8%
Same store expense growth see note (3) 5.7% 4.6% 4.6% 3.0% 4.5%
Same store NOI growth 3.1% 1.6% 3.4% 5.1% 3.3%
Same store 2008 physical occupancy 94.6% 95.1% 95.3% 94.7% 94.9%
Same store 2007 physical occupancy 94.4% 95.0% 95.0% 94.7% 94.8%
Difference in occupancy 0.2% 0.1% 0.3% 0.0% 0.1%
Annual growth by region: 2007% of NOI Revenue Expenses NOI
Philadelphia 15.0% 4.5% 3.2% 5.5%Washington, DC 26.9% 4.2% 4.6% 3.9%Baltimore 17.4% 3.9% 2.5% 4.8%Florida 1.9% 3.9% 5.8% 2.2%Chicago 4.2% 3.5% 8.6% -1.1%New Jersey/Long Island/Hudson Valley 26.0% 3.4% 5.7% 1.6%Maine 1.5% 2.6% 5.4% 0.8%Boston 7.1% 2.3% 2.5% 2.2%Total 100.0% 3.8% 4.5% 3.3%
2008 Same Store Growth Projection
HOME PROPERTIES 4Q 2007 SUPPLEMENTAL FINANCIAL INFORMATION Page 30
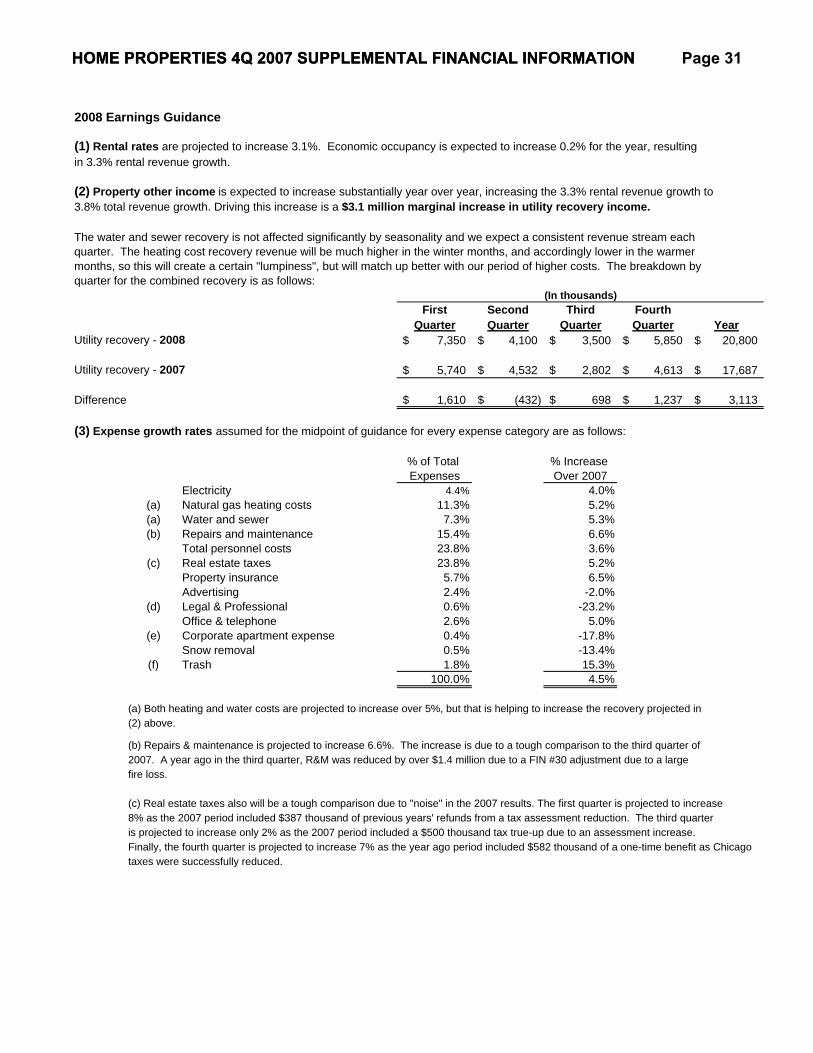
2008 Earnings Guidance
(1) Rental rates are projected to increase 3.1%. Economic occupancy is expected to increase 0.2% for the year, resultingin 3.3% rental revenue growth.
(2) Property other income is expected to increase substantially year over year, increasing the 3.3% rental revenue growth to 3.8% total revenue growth. Driving this increase is a $3.1 million marginal increase in utility recovery income.
The water and sewer recovery is not affected significantly by seasonality and we expect a consistent revenue stream each quarter. The heating cost recovery revenue will be much higher in the winter months, and accordingly lower in the warmermonths, so this will create a certain "lumpiness", but will match up better with our period of higher costs. The breakdown by quarter for the combined recovery is as follows:
First Second Third FourthQuarter Quarter Quarter Quarter Year
Utility recovery - 2008 7,350$ 4,100$ 3,500$ 5,850$ 20,800$
Utility recovery - 2007 5,740$ 4,532$ 2,802$ 4,613$ 17,687$
Difference 1,610$ (432)$ 698$ 1,237$ 3,113$
(3) Expense growth rates assumed for the midpoint of guidance for every expense category are as follows:
% of Total % Increase Expenses Over 2007
Electricity 4.4% 4.0%(a) Natural gas heating costs 11.3% 5.2%(a) Water and sewer 7.3% 5.3%(b) Repairs and maintenance 15.4% 6.6%
Total personnel costs 23.8% 3.6%(c) Real estate taxes 23.8% 5.2%
Property insurance 5.7% 6.5%Advertising 2.4% -2.0%
(d) Legal & Professional 0.6% -23.2%Office & telephone 2.6% 5.0%
(e) Corporate apartment expense 0.4% -17.8%Snow removal 0.5% -13.4%
(f) Trash 1.8% 15.3%100.0% 4.5%
(a) Both heating and water costs are projected to increase over 5%, but that is helping to increase the recovery projected in (2) above.
(b) Repairs & maintenance is projected to increase 6.6%. The increase is due to a tough comparison to the third quarter of 2007. A year ago in the third quarter, R&M was reduced by over $1.4 million due to a FIN #30 adjustment due to a largefire loss.
(c) Real estate taxes also will be a tough comparison due to "noise" in the 2007 results. The first quarter is projected to increase8% as the 2007 period included $387 thousand of previous years' refunds from a tax assessment reduction. The third quarter is projected to increase only 2% as the 2007 period included a $500 thousand tax true-up due to an assessment increase. Finally, the fourth quarter is projected to increase 7% as the year ago period included $582 thousand of a one-time benefit as Chicago taxes were successfully reduced.
(In thousands)
HOME PROPERTIES 4Q 2007 SUPPLEMENTAL FINANCIAL INFORMATIONHOME PROPERTIES 4Q 2007 SUPPLEMENTAL FINANCIAL INFORMATION Page 31
2008 Earnings Guidance
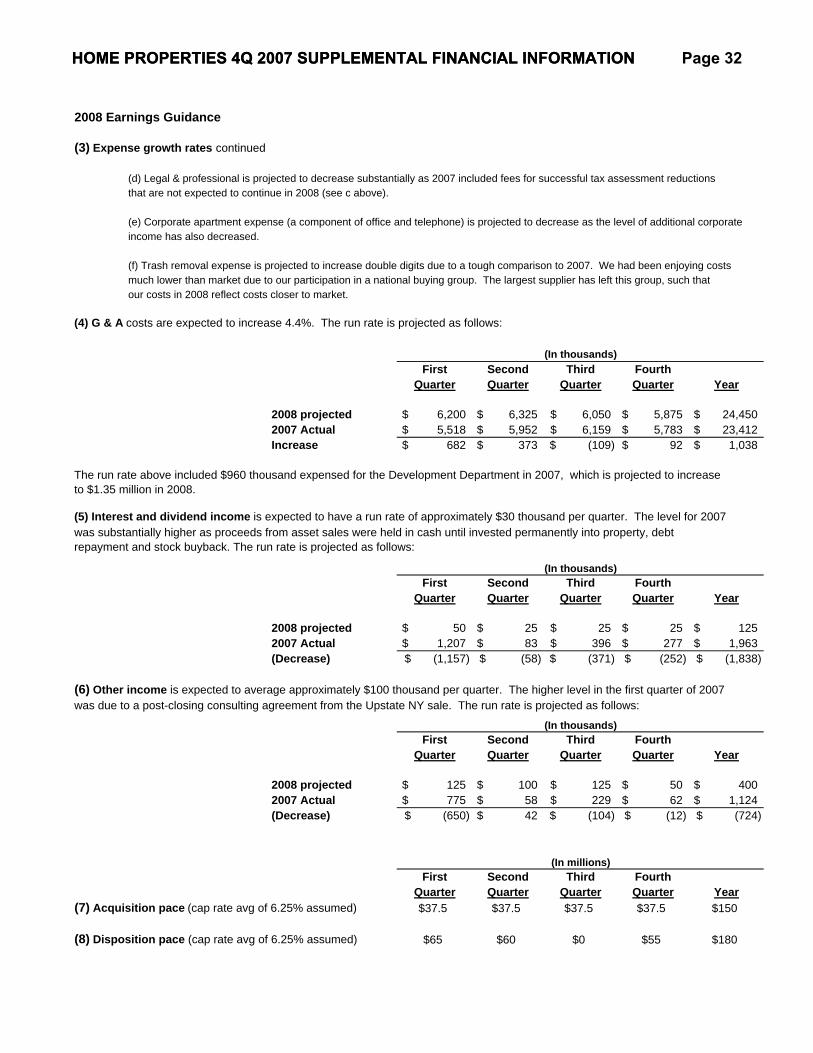
(3) Expense growth rates continued
(d) Legal & professional is projected to decrease substantially as 2007 included fees for successful tax assessment reductionsthat are not expected to continue in 2008 (see c above).
(e) Corporate apartment expense (a component of office and telephone) is projected to decrease as the level of additional corporateincome has also decreased.
(f) Trash removal expense is projected to increase double digits due to a tough comparison to 2007. We had been enjoying costsmuch lower than market due to our participation in a national buying group. The largest supplier has left this group, such thatour costs in 2008 reflect costs closer to market.
(4) G & A costs are expected to increase 4.4%. The run rate is projected as follows:
First Second Third FourthQuarter Quarter Quarter Quarter Year
2008 projected 6,200$ 6,325$ 6,050$ 5,875$ 24,450$ 2007 Actual 5,518$ 5,952$ 6,159$ 5,783$ 23,412$ Increase 682$ 373$ (109)$ 92$ 1,038$
The run rate above included $960 thousand expensed for the Development Department in 2007, which is projected to increase to $1.35 million in 2008.
(5) Interest and dividend income is expected to have a run rate of approximately $30 thousand per quarter. The level for 2007was substantially higher as proceeds from asset sales were held in cash until invested permanently into property, debtrepayment and stock buyback. The run rate is projected as follows:
First Second Third FourthQuarter Quarter Quarter Quarter Year
2008 projected 50$ 25$ 25$ 25$ 125$ 2007 Actual 1,207$ 83$ 396$ 277$ 1,963$ (Decrease) (1,157)$ (58)$ (371)$ (252)$ (1,838)$
(6) Other income is expected to average approximately $100 thousand per quarter. The higher level in the first quarter of 2007was due to a post-closing consulting agreement from the Upstate NY sale. The run rate is projected as follows:
First Second Third FourthQuarter Quarter Quarter Quarter Year
2008 projected 125$ 100$ 125$ 50$ 400$ 2007 Actual 775$ 58$ 229$ 62$ 1,124$ (Decrease) (650)$ 42$ (104)$ (12)$ (724)$
First Second Third FourthQuarter Quarter Quarter Quarter Year
(7) Acquisition pace (cap rate avg of 6.25% assumed) $37.5 $37.5 $37.5 $37.5 $150
(8) Disposition pace (cap rate avg of 6.25% assumed) $65 $60 $0 $55 $180
(In thousands)
(In millions)
(In thousands)
(In thousands)
HOME PROPERTIES 4Q 2007 SUPPLEMENTAL FINANCIAL INFORMATIONHOME PROPERTIES 4Q 2007 SUPPLEMENTAL FINANCIAL INFORMATION Page 32
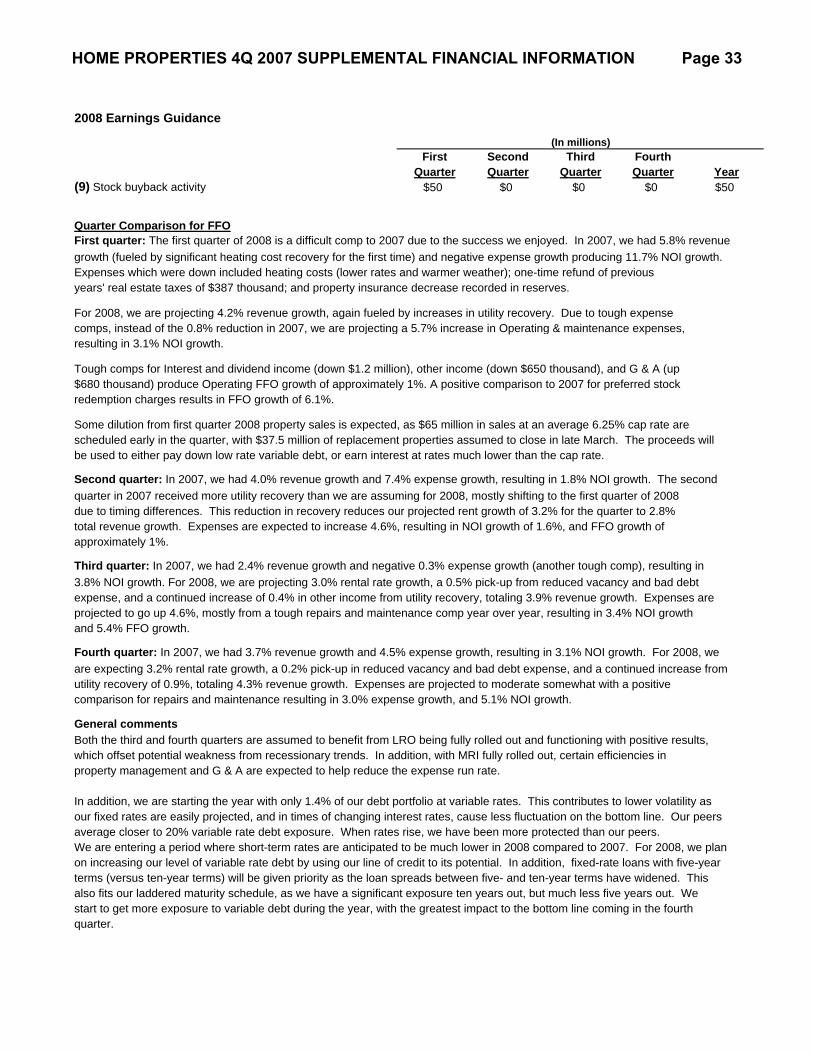
2008 Earnings Guidance
First Second Third FourthQuarter Quarter Quarter Quarter Year
(9) Stock buyback activity $50 $0 $0 $0 $50
Quarter Comparison for FFOFirst quarter: The first quarter of 2008 is a difficult comp to 2007 due to the success we enjoyed. In 2007, we had 5.8% revenuegrowth (fueled by significant heating cost recovery for the first time) and negative expense growth producing 11.7% NOI growth. Expenses which were down included heating costs (lower rates and warmer weather); one-time refund of previous years' real estate taxes of $387 thousand; and property insurance decrease recorded in reserves.
For 2008, we are projecting 4.2% revenue growth, again fueled by increases in utility recovery. Due to tough expensecomps, instead of the 0.8% reduction in 2007, we are projecting a 5.7% increase in Operating & maintenance expenses, resulting in 3.1% NOI growth.
Tough comps for Interest and dividend income (down $1.2 million), other income (down $650 thousand), and G & A (up$680 thousand) produce Operating FFO growth of approximately 1%. A positive comparison to 2007 for preferred stock redemption charges results in FFO growth of 6.1%.
Some dilution from first quarter 2008 property sales is expected, as $65 million in sales at an average 6.25% cap rate are scheduled early in the quarter, with $37.5 million of replacement properties assumed to close in late March. The proceeds will be used to either pay down low rate variable debt, or earn interest at rates much lower than the cap rate.
Second quarter: In 2007, we had 4.0% revenue growth and 7.4% expense growth, resulting in 1.8% NOI growth. The second quarter in 2007 received more utility recovery than we are assuming for 2008, mostly shifting to the first quarter of 2008due to timing differences. This reduction in recovery reduces our projected rent growth of 3.2% for the quarter to 2.8%total revenue growth. Expenses are expected to increase 4.6%, resulting in NOI growth of 1.6%, and FFO growth of approximately 1%.
Third quarter: In 2007, we had 2.4% revenue growth and negative 0.3% expense growth (another tough comp), resulting in3.8% NOI growth. For 2008, we are projecting 3.0% rental rate growth, a 0.5% pick-up from reduced vacancy and bad debt expense, and a continued increase of 0.4% in other income from utility recovery, totaling 3.9% revenue growth. Expenses areprojected to go up 4.6%, mostly from a tough repairs and maintenance comp year over year, resulting in 3.4% NOI growthand 5.4% FFO growth.
Fourth quarter: In 2007, we had 3.7% revenue growth and 4.5% expense growth, resulting in 3.1% NOI growth. For 2008, weare expecting 3.2% rental rate growth, a 0.2% pick-up in reduced vacancy and bad debt expense, and a continued increase fromutility recovery of 0.9%, totaling 4.3% revenue growth. Expenses are projected to moderate somewhat with a positive comparison for repairs and maintenance resulting in 3.0% expense growth, and 5.1% NOI growth.
General commentsBoth the third and fourth quarters are assumed to benefit from LRO being fully rolled out and functioning with positive results, which offset potential weakness from recessionary trends. In addition, with MRI fully rolled out, certain efficiencies inproperty management and G & A are expected to help reduce the expense run rate.
In addition, we are starting the year with only 1.4% of our debt portfolio at variable rates. This contributes to lower volatility asour fixed rates are easily projected, and in times of changing interest rates, cause less fluctuation on the bottom line. Our peersaverage closer to 20% variable rate debt exposure. When rates rise, we have been more protected than our peers. We are entering a period where short-term rates are anticipated to be much lower in 2008 compared to 2007. For 2008, we plan on increasing our level of variable rate debt by using our line of credit to its potential. In addition, fixed-rate loans with five-year terms (versus ten-year terms) will be given priority as the loan spreads between five- and ten-year terms have widened. Thisalso fits our laddered maturity schedule, as we have a significant exposure ten years out, but much less five years out. We start to get more exposure to variable debt during the year, with the greatest impact to the bottom line coming in the fourthquarter.
(In millions)
HOME PROPERTIES 4Q 2007 SUPPLEMENTAL FINANCIAL INFORMATION Page 33