![second supplemental ordinance [Ordinance]](https://static.fdocuments.in/doc/165x107/624f64d15eb5d005704c21d1/second-supplemental-ordinance-ordinance.jpg)
Supplemental Second Quarter 2007 Financial Information
44
This information is preliminary and based on company data available at the time of the presentation. It speaks only as of the particular date or dates included in the accompanying pages. Bank of America does not undertake an obligation to, and disclaims any duty to, correct or update any of the information provided. Any forward-looking statements in this information are subject to the forward-looking language contained in Bank of America's reports filed with the SEC pursuant to the Securities Exchange Act of 1934, which are available at the SEC's website (www.sec.gov) or at Bank of America's website (www.bankofamerica.com). Bank of America's future financial performance is subject to risks and uncertainties as described in its SEC filings. Supplemental Information Second Quarter 2007
-
Upload
quarterlyearningsreports3 -
Category
Documents
-
view
178 -
download
2
Transcript of Supplemental Second Quarter 2007 Financial Information

This information is preliminary and based on company data available at the time of the presentation. It speaks only as
of the particular date or dates included in the accompanying pages. Bank of America does not undertake an obligation
to, and disclaims any duty to, correct or update any of the information provided. Any forward-looking statements in this
information are subject to the forward-looking language contained in Bank of America's reports filed with the SEC pursuant
to the Securities Exchange Act of 1934, which are available at the SEC's website (www.sec.gov) or at Bank of America's
website (www.bankofamerica.com). Bank of America's future financial performance is subject to risks and uncertainties as
described in its SEC filings.
Supplemental InformationSecond Quarter 2007

Bank of America CorporationTable of Contents Page
Consolidated Financial Highlights 2Supplemental Financial Data 3Consolidated Statement of Income 4Consolidated Balance Sheet 5Capital Management 6Core Net Interest Income - Managed Basis 7Quarterly Average Balances and Interest Rates 8Quarterly Average Balances and Interest Rates - Isolating Hedge Income/Expense 9Year-to-Date Average Balances and Interest Rates 10Year-to-Date Average Balances and Interest Rates - Isolating Hedge Income/Expense 11Business Segment View Graphs 12Global Consumer and Small Business Banking
Total Segment Results 13Quarter-to-Date Business Results 14Year-to-Date Business Results 15Customer Relationship View 16Key Indicators 17E-commerce & BankofAmerica.com 18Credit Card Data 19
Global Corporate and Investment BankingTotal Segment Results 20Quarter-to-Date Business Results 21Year-to-Date Business Results 22Quarter-to-Date Customer Relationship View 23Year-to-Date Customer Relationship View 24Business Lending Key Indicators 25Capital Markets and Advisory Services Key Indicators 26Securities U.S. Market Share and Product Ranking Graph 27
Global Wealth and Investment ManagementTotal Segment Results 28Quarter-to-Date Business Results 29Year-to-Date Business Results 30Key Indicators 31
All OtherTotal Segment Results 32
Outstanding Loans and Leases 33Average Loans and Leases by Business Segment 34Commercial Credit Exposure by Industry 35Net Credit Default Protection by Maturity Profile and Credit Exposure Debt Rating 36Selected Emerging Markets 37Nonperforming Assets 38Quarterly Net Charge-offs/Losses and Net Charge-off/Loss Ratios 39Year-to-Date Net Charge-offs/Losses and Net Charge-off/Loss Ratios 40
Exhibit A: Non - GAAP ReconciliationsGlobal Consumer and Small Business Banking - Reconciliation 41All Other - Reconciliation 42Reconciliation of Net Charge-offs and Net Charge-off Ratios to Net Charge-offs and Net
Charge-off Ratios Excluding the Impact of SOP 03-3 43
1
Bank of America Corporation Consolidated Financial Highlights(Dollars in millions, except per share information; shares in thousands)
Second First Fourth Third SecondQuarter Quarter Quarter Quarter Quarter
2007 2006 2007 2007 2006 2006 2006
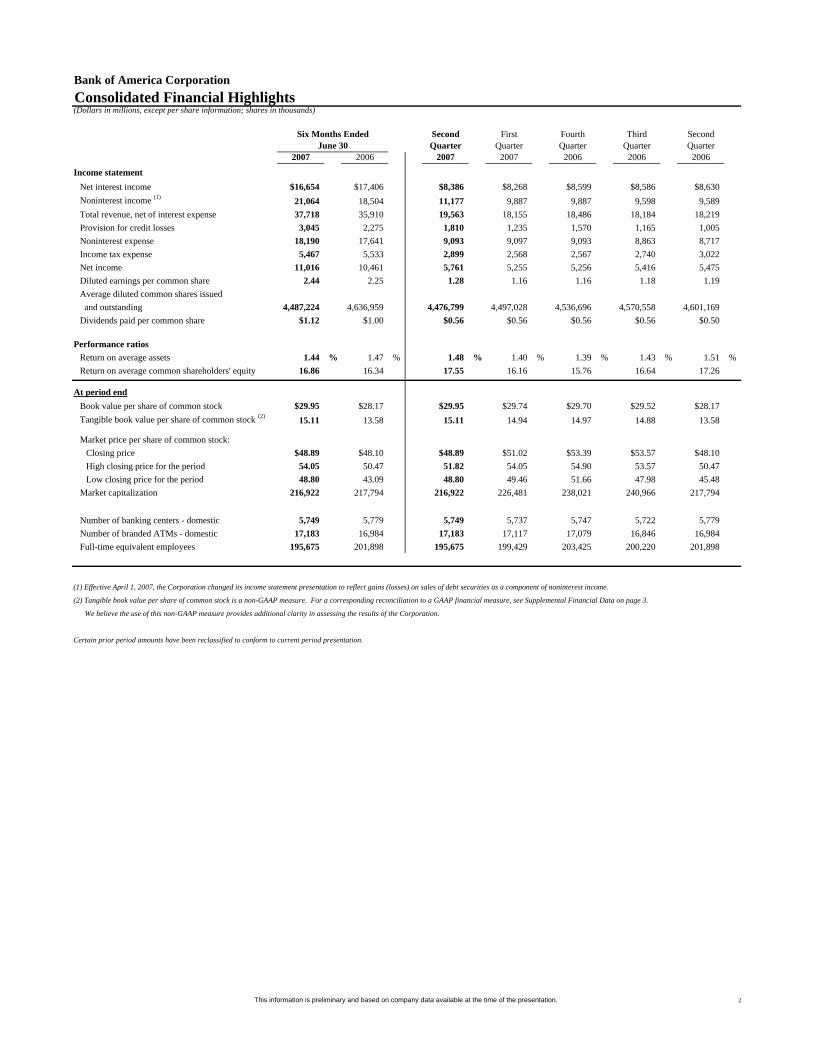
Income statement Net interest income $16,654 $17,406 $8,386 $8,268 $8,599 $8,586 $8,630Noninterest income (1) 21,064 18,504 11,177 9,887 9,887 9,598 9,589 Total revenue, net of interest expense 37,718 35,910 19,563 18,155 18,486 18,184 18,219 Provision for credit losses 3,045 2,275 1,810 1,235 1,570 1,165 1,005 Noninterest expense 18,190 17,641 9,093 9,097 9,093 8,863 8,717 Income tax expense 5,467 5,533 2,899 2,568 2,567 2,740 3,022 Net income 11,016 10,461 5,761 5,255 5,256 5,416 5,475 Diluted earnings per common share 2.44 2.25 1.28 1.16 1.16 1.18 1.19Average diluted common shares issued and outstanding 4,487,224 4,636,959 4,476,799 4,497,028 4,536,696 4,570,558 4,601,169 Dividends paid per common share $1.12 $1.00 $0.56 $0.56 $0.56 $0.56 $0.50
Performance ratios Return on average assets 1.44 % 1.47 % 1.48 % 1.40 % 1.39 % 1.43 % 1.51 %Return on average common shareholders' equity 16.86 16.34 17.55 16.16 15.76 16.64 17.26
At period endBook value per share of common stock $29.95 $28.17 $29.95 $29.74 $29.70 $29.52 $28.17Tangible book value per share of common stock (2) 15.11 13.58 15.11 14.94 14.97 14.88 13.58
Market price per share of common stock:Closing price $48.89 $48.10 $48.89 $51.02 $53.39 $53.57 $48.10High closing price for the period 54.05 50.47 51.82 54.05 54.90 53.57 50.47 Low closing price for the period 48.80 43.09 48.80 49.46 51.66 47.98 45.48
Market capitalization 216,922 217,794 216,922 226,481 238,021 240,966 217,794
Number of banking centers - domestic 5,749 5,779 5,749 5,737 5,747 5,722 5,779 Number of branded ATMs - domestic 17,183 16,984 17,183 17,117 17,079 16,846 16,984 Full-time equivalent employees 195,675 201,898 195,675 199,429 203,425 200,220 201,898
(1) Effective April 1, 2007, the Corporation changed its income statement presentation to reflect gains (losses) on sales of debt securities as a component of noninterest income.
(2) Tangible book value per share of common stock is a non-GAAP measure. For a corresponding reconciliation to a GAAP financial measure, see Supplemental Financial Data on page 3.
We believe the use of this non-GAAP measure provides additional clarity in assessing the results of the Corporation.
Certain prior period amounts have been reclassified to conform to current period presentation.
June 30Six Months Ended
This information is preliminary and based on company data available at the time of the presentation. 2
Bank of America Corporation Supplemental Financial Data (Dollars in millions)
Fully taxable-equivalent basis data
Second First Fourth Third SecondQuarter Quarter Quarter Quarter Quarter
2007 2006 2007 2007 2006 2006 2006
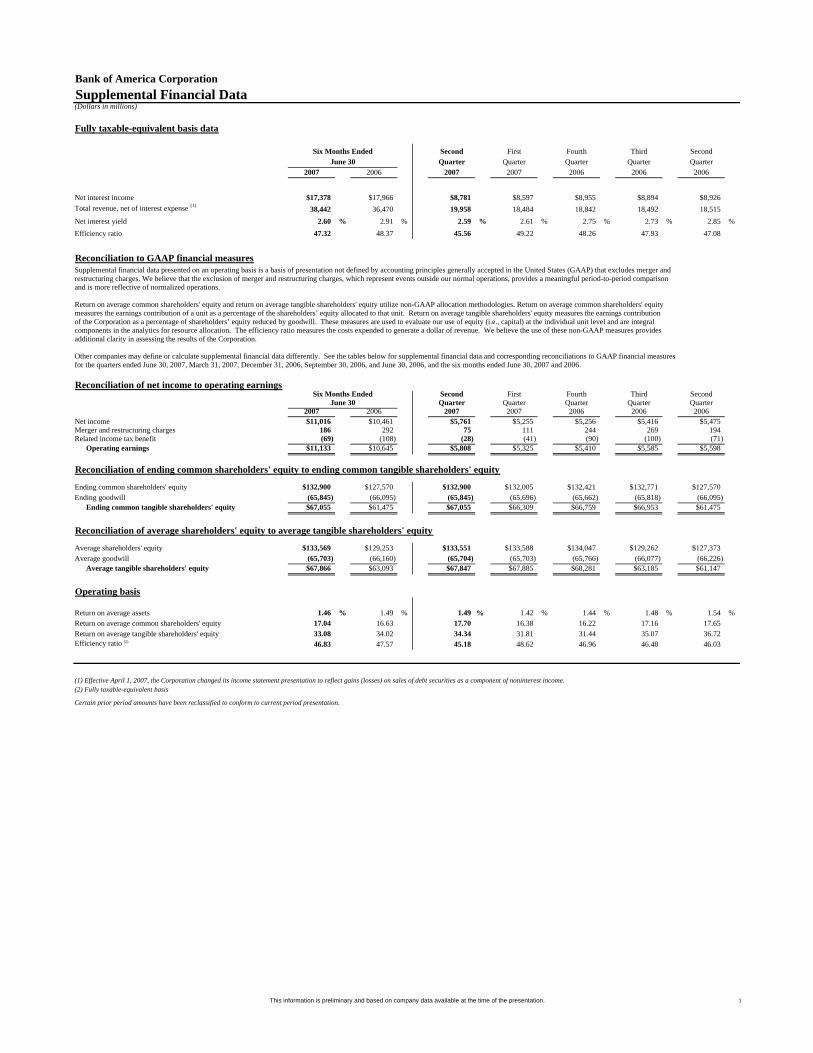
Net interest income $17,378 $17,966 $8,781 $8,597 $8,955 $8,894 $8,926Total revenue, net of interest expense (1) 38,442 36,470 19,958 18,484 18,842 18,492 18,515 Net interest yield 2.60 % 2.91 % 2.59 % 2.61 % 2.75 % 2.73 % 2.85 %Efficiency ratio 47.32 48.37 45.56 49.22 48.26 47.93 47.08
Reconciliation to GAAP financial measuresSupplemental financial data presented on an operating basis is a basis of presentation not defined by accounting principles generally accepted in the United States (GAAP) that excludes merger and restructuring charges. We believe that the exclusion of merger and restructuring charges, which represent events outside our normal operations, provides a meaningful period-to-period comparison and is more reflective of normalized operations.
Return on average common shareholders' equity and return on average tangible shareholders' equity utilize non-GAAP allocation methodologies. Return on average common shareholders' equity measures the earnings contribution of a unit as a percentage of the shareholders’ equity allocated to that unit. Return on average tangible shareholders' equity measures the earnings contribution of the Corporation as a percentage of shareholders’ equity reduced by goodwill. These measures are used to evaluate our use of equity (i.e., capital) at the individual unit level and are integral components in the analytics for resource allocation. The efficiency ratio measures the costs expended to generate a dollar of revenue. We believe the use of these non-GAAP measures provides additional clarity in assessing the results of the Corporation.
Other companies may define or calculate supplemental financial data differently. See the tables below for supplemental financial data and corresponding reconciliations to GAAP financial measuresfor the quarters ended June 30, 2007, March 31, 2007, December 31, 2006, September 30, 2006, and June 30, 2006, and the six months ended June 30, 2007 and 2006.
Reconciliation of net income to operating earningsSix Months Ended Second First Fourth Third Second
June 30 Quarter Quarter Quarter Quarter Quarter2007 2006 2007 2007 2006 2006 2006
Net income $11,016 $10,461 $5,761 $5,255 $5,256 $5,416 $5,475Merger and restructuring charges 186 292 75 111 244 269 194 Related income tax benefit (69) (108) (28) (41) (90) (100) (71)
Operating earnings $11,133 $10,645 $5,808 $5,325 $5,410 $5,585 $5,598
Reconciliation of ending common shareholders' equity to ending common tangible shareholders' equity
Ending common shareholders' equity $132,900 $127,570 $132,900 $132,005 $132,421 $132,771 $127,570Ending goodwill (65,845) (66,095) (65,845) (65,696) (65,662) (65,818) (66,095)
Ending common tangible shareholders' equity $67,055 $61,475 $67,055 $66,309 $66,759 $66,953 $61,475
Reconciliation of average shareholders' equity to average tangible shareholders' equity
Average shareholders' equity $133,569 $129,253 $133,551 $133,588 $134,047 $129,262 $127,373Average goodwill (65,703) (66,160) (65,704) (65,703) (65,766) (66,077) (66,226)
Average tangible shareholders' equity $67,866 $63,093 $67,847 $67,885 $68,281 $63,185 $61,147
Operating basis
Return on average assets 1.46 % 1.49 % 1.49 % 1.42 % 1.44 % 1.48 % 1.54 %Return on average common shareholders' equity 17.04 16.63 17.70 16.38 16.22 17.16 17.65 Return on average tangible shareholders' equity 33.08 34.02 34.34 31.81 31.44 35.07 36.72 Efficiency ratio (2) 46.83 47.57 45.18 48.62 46.96 46.48 46.03
(1) Effective April 1, 2007, the Corporation changed its income statement presentation to reflect gains (losses) on sales of debt securities as a component of noninterest income. (2) Fully taxable-equivalent basis
Certain prior period amounts have been reclassified to conform to current period presentation.
Six Months EndedJune 30
This information is preliminary and based on company data available at the time of the presentation. 3
Bank of America Corporation Consolidated Statement of Income (Dollars in millions, except per share information; shares in thousands)
Second First Fourth Third SecondQuarter Quarter Quarter Quarter Quarter
2007 2006 2007 2007 2006 2006 2006Interest income
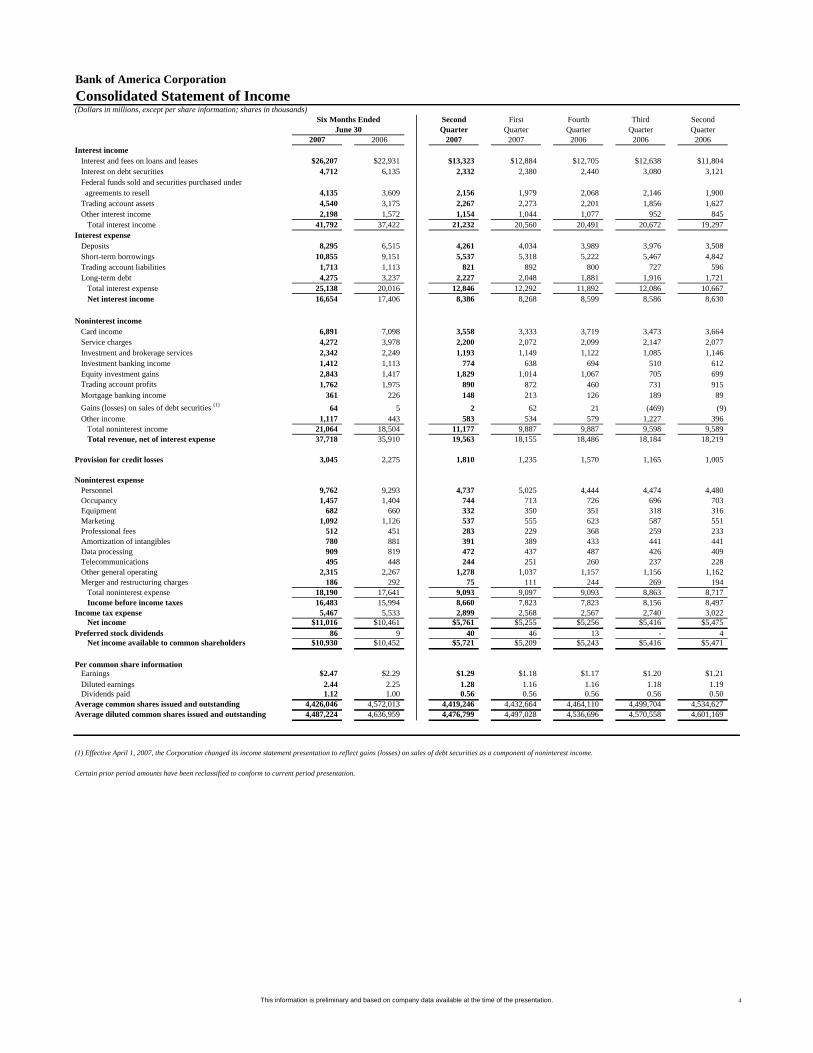
Interest and fees on loans and leases $26,207 $22,931 $13,323 $12,884 $12,705 $12,638 $11,804Interest on debt securities 4,712 6,135 2,332 2,380 2,440 3,080 3,121 Federal funds sold and securities purchased under agreements to resell 4,135 3,609 2,156 1,979 2,068 2,146 1,900 Trading account assets 4,540 3,175 2,267 2,273 2,201 1,856 1,627 Other interest income 2,198 1,572 1,154 1,044 1,077 952 845
Total interest income 41,792 37,422 21,232 20,560 20,491 20,672 19,297 Interest expense
Deposits 8,295 6,515 4,261 4,034 3,989 3,976 3,508 Short-term borrowings 10,855 9,151 5,537 5,318 5,222 5,467 4,842 Trading account liabilities 1,713 1,113 821 892 800 727 596 Long-term debt 4,275 3,237 2,227 2,048 1,881 1,916 1,721
Total interest expense 25,138 20,016 12,846 12,292 11,892 12,086 10,667 Net interest income 16,654 17,406 8,386 8,268 8,599 8,586 8,630
Noninterest income Card income 6,891 7,098 3,558 3,333 3,719 3,473 3,664 Service charges 4,272 3,978 2,200 2,072 2,099 2,147 2,077 Investment and brokerage services 2,342 2,249 1,193 1,149 1,122 1,085 1,146 Investment banking income 1,412 1,113 774 638 694 510 612 Equity investment gains 2,843 1,417 1,829 1,014 1,067 705 699 Trading account profits 1,762 1,975 890 872 460 731 915 Mortgage banking income 361 226 148 213 126 189 89 Gains (losses) on sales of debt securities (1) 64 5 2 62 21 (469) (9) Other income 1,117 443 583 534 579 1,227 396
Total noninterest income 21,064 18,504 11,177 9,887 9,887 9,598 9,589 Total revenue, net of interest expense 37,718 35,910 19,563 18,155 18,486 18,184 18,219
Provision for credit losses 3,045 2,275 1,810 1,235 1,570 1,165 1,005
Noninterest expense Personnel 9,762 9,293 4,737 5,025 4,444 4,474 4,480 Occupancy 1,457 1,404 744 713 726 696 703 Equipment 682 660 332 350 351 318 316 Marketing 1,092 1,126 537 555 623 587 551 Professional fees 512 451 283 229 368 259 233 Amortization of intangibles 780 881 391 389 433 441 441 Data processing 909 819 472 437 487 426 409 Telecommunications 495 448 244 251 260 237 228 Other general operating 2,315 2,267 1,278 1,037 1,157 1,156 1,162 Merger and restructuring charges 186 292 75 111 244 269 194
Total noninterest expense 18,190 17,641 9,093 9,097 9,093 8,863 8,717 Income before income taxes 16,483 15,994 8,660 7,823 7,823 8,156 8,497
Income tax expense 5,467 5,533 2,899 2,568 2,567 2,740 3,022 Net income $11,016 $10,461 $5,761 $5,255 $5,256 $5,416 $5,475
Preferred stock dividends 86 9 40 46 13 - 4 Net income available to common shareholders $10,930 $10,452 $5,721 $5,209 $5,243 $5,416 $5,471
Per common share information
Earnings $2.47 $2.29 $1.29 $1.18 $1.17 $1.20 $1.21Diluted earnings 2.44 2.25 1.28 1.16 1.16 1.18 1.19 Dividends paid 1.12 1.00 0.56 0.56 0.56 0.56 0.50
Average common shares issued and outstanding 4,426,046 4,572,013 4,419,246 4,432,664 4,464,110 4,499,704 4,534,627 Average diluted common shares issued and outstanding 4,487,224 4,636,959 4,476,799 4,497,028 4,536,696 4,570,558 4,601,169
(1) Effective April 1, 2007, the Corporation changed its income statement presentation to reflect gains (losses) on sales of debt securities as a component of noninterest income.
Certain prior period amounts have been reclassified to conform to current period presentation.
Six Months EndedJune 30
This information is preliminary and based on company data available at the time of the presentation. 4

Bank of America CorporationConsolidated Balance Sheet(Dollars in millions)
AssetsCash and cash equivalents $35,499 $31,549 $34,545Time deposits placed and other short-term investments 13,151 12,037 14,652 Federal funds sold and securities purchased under agreements to resell 131,658 138,646 136,645 Trading account assets 182,404 174,218 134,708 Derivative assets 29,810 25,279 25,526 Debt securities:
Available-for-sale 172,332 180,961 235,785 Held-to-maturity, at cost 995 925 61
Total debt securities 173,327 181,886 235,846 Loans and leases 758,635 723,633 667,953 Allowance for loan and lease losses (9,060) (8,732) (9,080)
Loans and leases, net of allowance 749,575 714,901 658,873 Premises and equipment, net 9,482 9,271 9,334 Mortgage servicing rights (includes $3,269; $2,963 and $3,083 measured at fair value) 3,508 3,141 3,231 Goodwill 65,845 65,696 66,095 Intangible assets 8,720 9,217 10,338 Other assets 131,380 136,316 115,400
Total assets $1,534,359 $1,502,157 $1,445,193
LiabilitiesDeposits in domestic offices:
Noninterest-bearing $172,573 $174,082 $177,209Interest-bearing 422,201 425,197 410,940
Deposits in foreign offices:Noninterest-bearing 3,006 3,346 6,765 Interest-bearing 101,629 90,176 81,951
Total deposits 699,409 692,801 676,865 Federal funds purchased and securities sold under agreements to repurchase 221,064 234,413 259,108 Trading account liabilities 75,070 77,289 57,486 Derivative liabilities 25,141 17,946 18,633 Commercial paper and other short-term borrowings 159,542 156,844 136,886 Accrued expenses and other liabilities (includes $376, $374 and $395 of reserve for unfunded lending commitments) 49,065 35,446 39,318 Long-term debt 169,317 152,562 129,056
Total liabilities 1,398,608 1,367,301 1,317,352 Shareholders' equityPreferred stock, $0.01 par value; authorized - 100,000,000 shares; issued and outstanding - 121,739; 121,739 and 1,090,189 shares 2,851 2,851 271 Common stock and additional paid-in capital, $0.01 par value; authorized - 7,500,000,000 shares; issued and outstanding - 4,436,935,963; 4,439,069,837 and 4,527,940,943 shares 60,349 60,536 65,822 Retained earnings (1) 83,223 79,996 73,393 Accumulated other comprehensive income (loss) (2) (9,957) (7,660) (10,973) Other (715) (867) (672)
Total shareholders' equity 135,751 134,856 127,841 Total liabilities and shareholders' equity $1,534,359 $1,502,157 $1,445,193
(1) Effective January 1, 2007, the Corporation adopted Financial Accounting Standards Board (FASB) Staff Position No. FAS 13-2, “Accounting for a Change or Projected Change in the Timing of Cash Flows Relating to Income Taxes Generated by a Leveraged Lease Transaction” (FSP 13-2). The adoption of FSP 13-2 reduced the beginning balance of retained earnings by $1,381 million, net of tax, with a corresponding offset decreasing the net investment in leveraged leases. Effective January 1, 2007, the Corporation adopted Statement of Financial Accounting Standards (SFAS) No. 157, "Fair Value Measurements" and SFAS No. 159, “The Fair Value Option for Financial Assets and Financial Liabilities” (SFAS 159) which reduced the beginning balance of retained earnings by $208 million, net of tax. In addition, the Corporation adopted FASB Interpretation No. 48, “Accounting for Uncertainty in Income Taxes, an interpretation of FASB Statement No. 109” (FIN 48). The adoption of FIN 48 reduced the beginning balance of retained earnings by $146 million.(2) Effective December 31, 2006, the Corporation adopted SFAS No. 158, “Employers’ Accounting for Defined Benefit Pension and Other Postretirement Plans, an amendment of FASB Statements No. 87, 88, 106, and 132(R)”, which reduced accumulated other comprehensive income (loss) by approximately $1,308 million, net of tax.
Certain prior period amounts have been reclassified to conform to current period presentation.
June 302007
June 302006
March 312007
This information is preliminary and based on company data available at the time of the presentation. 5

Bank of America CorporationCapital Management(Dollars in millions)
Second First Fourth Third SecondQuarter Quarter Quarter Quarter Quarter2007 (1) 2007 2006 2006 2006
Risk-based capital:Tier 1 capital $94,979 $91,112 $91,064 $88,085 $84,978Total capital 135,059 126,958 125,226 119,074 114,738Risk-weighted assets 1,115,150 1,062,883 1,054,533 1,039,283 1,019,828Tier 1 capital ratio 8.52 % 8.57 % 8.64 % 8.48 % 8.33 %Total capital ratio 12.11 11.94 11.88 11.46 11.25 Tangible equity ratio (2) 4.19 4.20 4.35 4.22 3.76 Tier 1 leverage ratio 6.33 6.25 6.36 6.16 6.13
(1) Preliminary data on risk-based capital(2) Tangible equity ratio equals shareholders' equity less goodwill and intangible assets divided by total assets less goodwill and intangible assets.
Share Repurchase Program
13.5 million common shares were repurchased in the second quarter of 2007 as a part of an ongoing share repurchase program.
201.6 million shares remain outstanding under the 2006 and 2007 authorized programs.
11.3 million shares were issued in the second quarter of 2007.
*Preliminary data on risk-based capital
Certain prior period amounts have been reclassified to conform to current period presentation.
Capital Management
4,4984,4374,4394,458
4,528
8.48%
8.64%
8.57%8.52%
8.33%
3,000
3,500
4,000
4,500
5,000
Jun-06 Sep-06 Dec-06 Mar-07 Jun-07*8.00%
8.50%
9.00%
Shares outstanding at period end Tier 1 capital ratio
This information is preliminary and based on company data available at the time of the presentation. 6
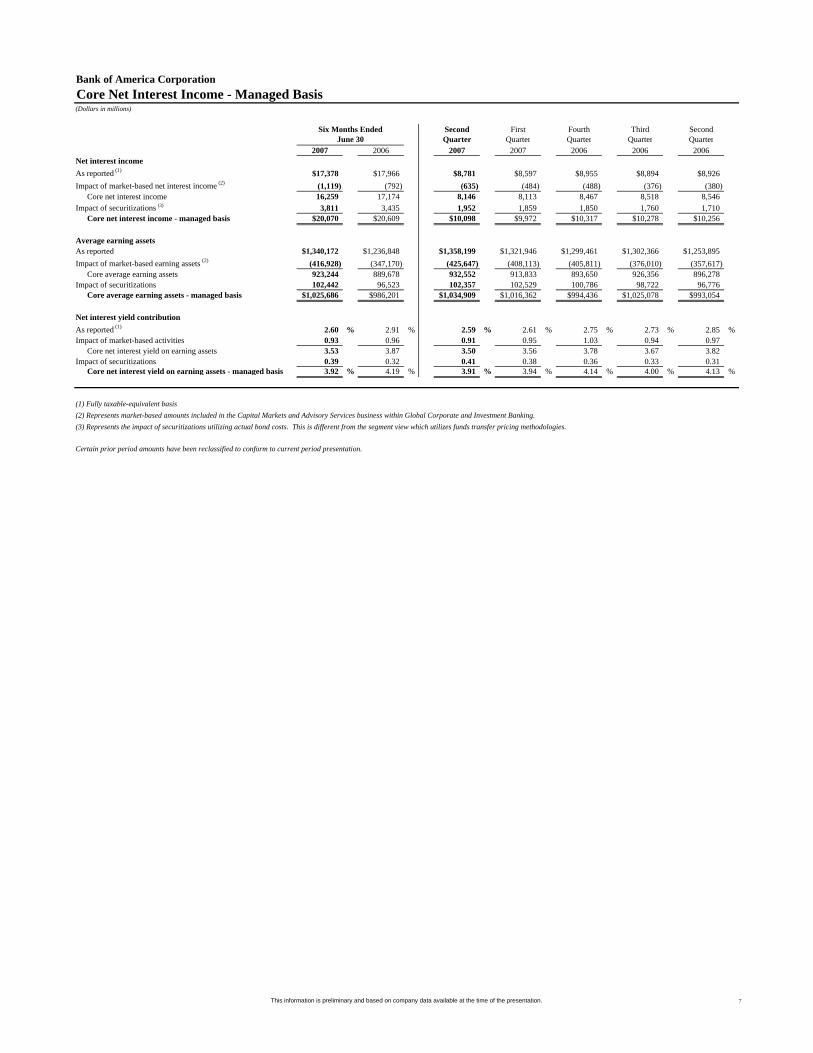
Bank of America CorporationCore Net Interest Income - Managed Basis(Dollars in millions)
Second First Fourth Third SecondQuarter Quarter Quarter Quarter Quarter
2007 2006 2007 2007 2006 2006 2006Net interest incomeAs reported (1) $17,378 $17,966 $8,781 $8,597 $8,955 $8,894 $8,926Impact of market-based net interest income (2) (1,119) (792) (635) (484) (488) (376) (380)
Core net interest income 16,259 17,174 8,146 8,113 8,467 8,518 8,546Impact of securitizations (3) 3,811 3,435 1,952 1,859 1,850 1,760 1,710
Core net interest income - managed basis $20,070 $20,609 $10,098 $9,972 $10,317 $10,278 $10,256
Average earning assetsAs reported $1,340,172 $1,236,848 $1,358,199 $1,321,946 $1,299,461 $1,302,366 $1,253,895Impact of market-based earning assets (2) (416,928) (347,170) (425,647) (408,113) (405,811) (376,010) (357,617)
Core average earning assets 923,244 889,678 932,552 913,833 893,650 926,356 896,278Impact of securitizations 102,442 96,523 102,357 102,529 100,786 98,722 96,776
Core average earning assets - managed basis $1,025,686 $986,201 $1,034,909 $1,016,362 $994,436 $1,025,078 $993,054
Net interest yield contributionAs reported (1) 2.60 % 2.91 % 2.59 % 2.61 % 2.75 % 2.73 % 2.85 %Impact of market-based activities 0.93 0.96 0.91 0.95 1.03 0.94 0.97
Core net interest yield on earning assets 3.53 3.87 3.50 3.56 3.78 3.67 3.82 Impact of securitizations 0.39 0.32 0.41 0.38 0.36 0.33 0.31
Core net interest yield on earning assets - managed basis 3.92 % 4.19 % 3.91 % 3.94 % 4.14 % 4.00 % 4.13 %
(1) Fully taxable-equivalent basis (2) Represents market-based amounts included in the Capital Markets and Advisory Services business within Global Corporate and Investment Banking.(3) Represents the impact of securitizations utilizing actual bond costs. This is different from the segment view which utilizes funds transfer pricing methodologies.
Certain prior period amounts have been reclassified to conform to current period presentation.
Six Months EndedJune 30
This information is preliminary and based on company data available at the time of the presentation. 7
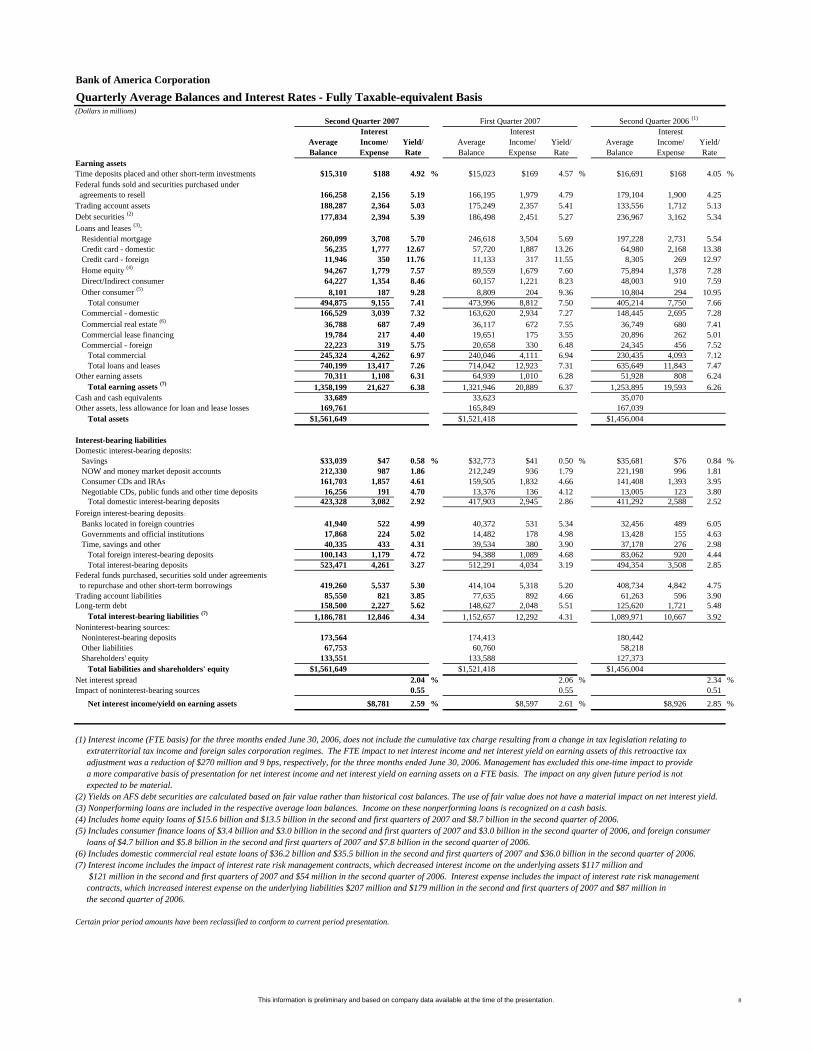
Bank of America Corporation
(Dollars in millions)
Interest Interest InterestAverage Income/ Yield/ Average Income/ Yield/ Average Income/ Yield/Balance Expense Rate Balance Expense Rate Balance Expense Rate
Earning assetsTime deposits placed and other short-term investments $15,310 $188 4.92 % $15,023 $169 4.57 % $16,691 $168 4.05 %Federal funds sold and securities purchased under agreements to resell 166,258 2,156 5.19 166,195 1,979 4.79 179,104 1,900 4.25Trading account assets 188,287 2,364 5.03 175,249 2,357 5.41 133,556 1,712 5.13Debt securities (2) 177,834 2,394 5.39 186,498 2,451 5.27 236,967 3,162 5.34Loans and leases (3):
Residential mortgage 260,099 3,708 5.70 246,618 3,504 5.69 197,228 2,731 5.54Credit card - domestic 56,235 1,777 12.67 57,720 1,887 13.26 64,980 2,168 13.38Credit card - foreign 11,946 350 11.76 11,133 317 11.55 8,305 269 12.97Home equity (4) 94,267 1,779 7.57 89,559 1,679 7.60 75,894 1,378 7.28Direct/Indirect consumer 64,227 1,354 8.46 60,157 1,221 8.23 48,003 910 7.59Other consumer (5) 8,101 187 9.28 8,809 204 9.36 10,804 294 10.95
Total consumer 494,875 9,155 7.41 473,996 8,812 7.50 405,214 7,750 7.66Commercial - domestic 166,529 3,039 7.32 163,620 2,934 7.27 148,445 2,695 7.28Commercial real estate (6) 36,788 687 7.49 36,117 672 7.55 36,749 680 7.41Commercial lease financing 19,784 217 4.40 19,651 175 3.55 20,896 262 5.01Commercial - foreign 22,223 319 5.75 20,658 330 6.48 24,345 456 7.52
Total commercial 245,324 4,262 6.97 240,046 4,111 6.94 230,435 4,093 7.12Total loans and leases 740,199 13,417 7.26 714,042 12,923 7.31 635,649 11,843 7.47
Other earning assets 70,311 1,108 6.31 64,939 1,010 6.28 51,928 808 6.24Total earning assets (7) 1,358,199 21,627 6.38 1,321,946 20,889 6.37 1,253,895 19,593 6.26
Cash and cash equivalents 33,689 33,623 35,070Other assets, less allowance for loan and lease losses 169,761 165,849 167,039
Total assets $1,561,649 $1,521,418 $1,456,004
Interest-bearing liabilitiesDomestic interest-bearing deposits:
Savings $33,039 $47 0.58 % $32,773 $41 0.50 % $35,681 $76 0.84 %NOW and money market deposit accounts 212,330 987 1.86 212,249 936 1.79 221,198 996 1.81Consumer CDs and IRAs 161,703 1,857 4.61 159,505 1,832 4.66 141,408 1,393 3.95Negotiable CDs, public funds and other time deposits 16,256 191 4.70 13,376 136 4.12 13,005 123 3.80
Total domestic interest-bearing deposits 423,328 3,082 2.92 417,903 2,945 2.86 411,292 2,588 2.52Foreign interest-bearing deposits:
Banks located in foreign countries 41,940 522 4.99 40,372 531 5.34 32,456 489 6.05Governments and official institutions 17,868 224 5.02 14,482 178 4.98 13,428 155 4.63Time, savings and other 40,335 433 4.31 39,534 380 3.90 37,178 276 2.98
Total foreign interest-bearing deposits 100,143 1,179 4.72 94,388 1,089 4.68 83,062 920 4.44Total interest-bearing deposits 523,471 4,261 3.27 512,291 4,034 3.19 494,354 3,508 2.85
Federal funds purchased, securities sold under agreements to repurchase and other short-term borrowings 419,260 5,537 5.30 414,104 5,318 5.20 408,734 4,842 4.75Trading account liabilities 85,550 821 3.85 77,635 892 4.66 61,263 596 3.90Long-term debt 158,500 2,227 5.62 148,627 2,048 5.51 125,620 1,721 5.48
Total interest-bearing liabilities (7) 1,186,781 12,846 4.34 1,152,657 12,292 4.31 1,089,971 10,667 3.92Noninterest-bearing sources:
Noninterest-bearing deposits 173,564 174,413 180,442Other liabilities 67,753 60,760 58,218Shareholders' equity 133,551 133,588 127,373
Total liabilities and shareholders' equity $1,561,649 $1,521,418 $1,456,004Net interest spread 2.04 % 2.06 % 2.34 %Impact of noninterest-bearing sources 0.55 0.55 0.51
Net interest income/yield on earning assets $8,781 2.59 % $8,597 2.61 % $8,926 2.85 %
(1) Interest income (FTE basis) for the three months ended June 30, 2006, does not include the cumulative tax charge resulting from a change in tax legislation relating to extraterritorial tax income and foreign sales corporation regimes. The FTE impact to net interest income and net interest yield on earning assets of this retroactive tax adjustment was a reduction of $270 million and 9 bps, respectively, for the three months ended June 30, 2006. Management has excluded this one-time impact to provide a more comparative basis of presentation for net interest income and net interest yield on earning assets on a FTE basis. The impact on any given future period is not expected to be material.(2) Yields on AFS debt securities are calculated based on fair value rather than historical cost balances. The use of fair value does not have a material impact on net interest yield.(3) Nonperforming loans are included in the respective average loan balances. Income on these nonperforming loans is recognized on a cash basis.(4) Includes home equity loans of $15.6 billion and $13.5 billion in the second and first quarters of 2007 and $8.7 billion in the second quarter of 2006.(5) Includes consumer finance loans of $3.4 billion and $3.0 billion in the second and first quarters of 2007 and $3.0 billion in the second quarter of 2006, and foreign consumer loans of $4.7 billion and $5.8 billion in the second and first quarters of 2007 and $7.8 billion in the second quarter of 2006.(6) Includes domestic commercial real estate loans of $36.2 billion and $35.5 billion in the second and first quarters of 2007 and $36.0 billion in the second quarter of 2006.(7) Interest income includes the impact of interest rate risk management contracts, which decreased interest income on the underlying assets $117 million and $121 million in the second and first quarters of 2007 and $54 million in the second quarter of 2006. Interest expense includes the impact of interest rate risk management contracts, which increased interest expense on the underlying liabilities $207 million and $179 million in the second and first quarters of 2007 and $87 million in the second quarter of 2006.
Certain prior period amounts have been reclassified to conform to current period presentation.
Quarterly Average Balances and Interest Rates - Fully Taxable-equivalent Basis
First Quarter 2007 Second Quarter 2006 (1)Second Quarter 2007
This information is preliminary and based on company data available at the time of the presentation. 8
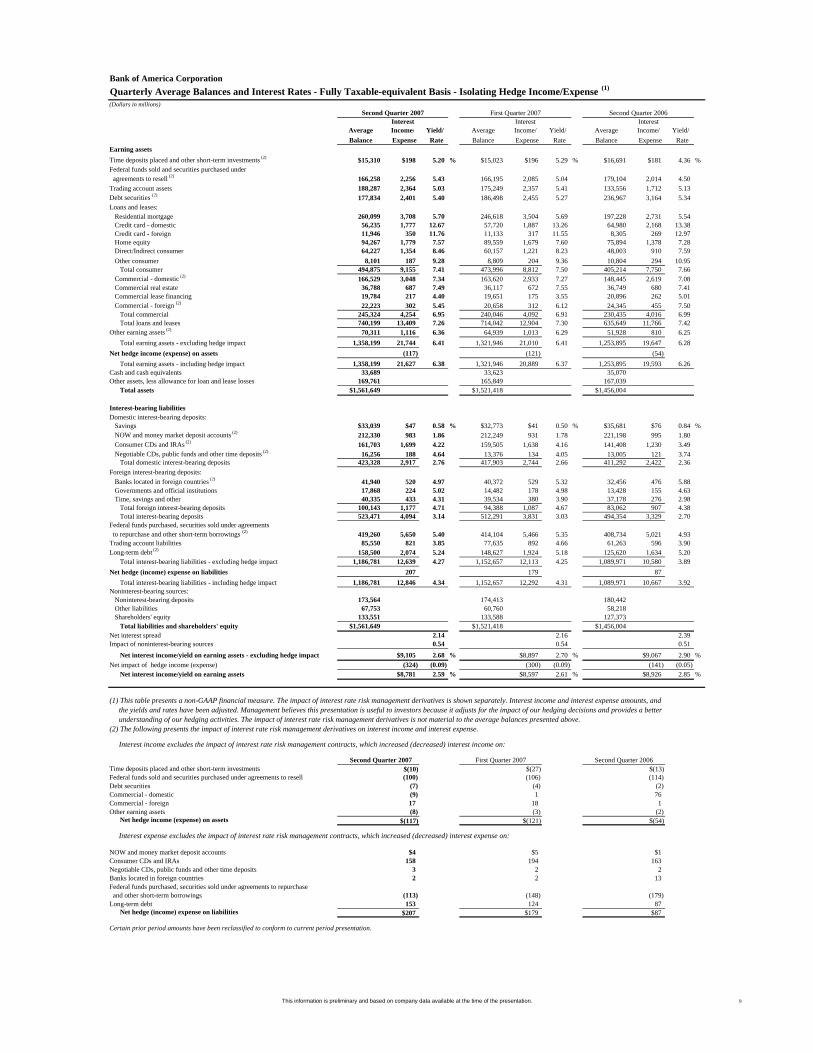
Bank of America Corporation Quarterly Average Balances and Interest Rates - Fully Taxable-equivalent Basis - Isolating Hedge Income/Expense (1)
(Dollars in millions)
Interest Interest InterestAverage Income/ Yield/ Average Income/ Yield/ Average Income/ Yield/Balance Expense Rate Balance Expense Rate Balance Expense Rate
Earning assetsTime deposits placed and other short-term investments (2) $15,310 $198 5.20 % $15,023 $196 5.29 % $16,691 $181 4.36 %Federal funds sold and securities purchased under agreements to resell (2) 166,258 2,256 5.43 166,195 2,085 5.04 179,104 2,014 4.50Trading account assets 188,287 2,364 5.03 175,249 2,357 5.41 133,556 1,712 5.13Debt securities (2) 177,834 2,401 5.40 186,498 2,455 5.27 236,967 3,164 5.34Loans and leases:
Residential mortgage 260,099 3,708 5.70 246,618 3,504 5.69 197,228 2,731 5.54Credit card - domestic 56,235 1,777 12.67 57,720 1,887 13.26 64,980 2,168 13.38Credit card - foreign 11,946 350 11.76 11,133 317 11.55 8,305 269 12.97 Home equity 94,267 1,779 7.57 89,559 1,679 7.60 75,894 1,378 7.28Direct/Indirect consumer 64,227 1,354 8.46 60,157 1,221 8.23 48,003 910 7.59Other consumer 8,101 187 9.28 8,809 204 9.36 10,804 294 10.95
Total consumer 494,875 9,155 7.41 473,996 8,812 7.50 405,214 7,750 7.66Commercial - domestic (2) 166,529 3,048 7.34 163,620 2,933 7.27 148,445 2,619 7.08Commercial real estate 36,788 687 7.49 36,117 672 7.55 36,749 680 7.41Commercial lease financing 19,784 217 4.40 19,651 175 3.55 20,896 262 5.01Commercial - foreign (2) 22,223 302 5.45 20,658 312 6.12 24,345 455 7.50
Total commercial 245,324 4,254 6.95 240,046 4,092 6.91 230,435 4,016 6.99Total loans and leases 740,199 13,409 7.26 714,042 12,904 7.30 635,649 11,766 7.42
Other earning assets (2) 70,311 1,116 6.36 64,939 1,013 6.29 51,928 810 6.25Total earning assets - excluding hedge impact 1,358,199 21,744 6.41 1,321,946 21,010 6.41 1,253,895 19,647 6.28
Net hedge income (expense) on assets (117) (121) (54)Total earning assets - including hedge impact 1,358,199 21,627 6.38 1,321,946 20,889 6.37 1,253,895 19,593 6.26
Cash and cash equivalents 33,689 33,623 35,070Other assets, less allowance for loan and lease losses 169,761 165,849 167,039
Total assets $1,561,649 $1,521,418 $1,456,004
Interest-bearing liabilitiesDomestic interest-bearing deposits:
Savings $33,039 $47 0.58 % $32,773 $41 0.50 % $35,681 $76 0.84 %NOW and money market deposit accounts (2) 212,330 983 1.86 212,249 931 1.78 221,198 995 1.80Consumer CDs and IRAs (2) 161,703 1,699 4.22 159,505 1,638 4.16 141,408 1,230 3.49Negotiable CDs, public funds and other time deposits (2) 16,256 188 4.64 13,376 134 4.05 13,005 121 3.74
Total domestic interest-bearing deposits 423,328 2,917 2.76 417,903 2,744 2.66 411,292 2,422 2.36Foreign interest-bearing deposits:
Banks located in foreign countries (2) 41,940 520 4.97 40,372 529 5.32 32,456 476 5.88Governments and official institutions 17,868 224 5.02 14,482 178 4.98 13,428 155 4.63Time, savings and other 40,335 433 4.31 39,534 380 3.90 37,178 276 2.98
Total foreign interest-bearing deposits 100,143 1,177 4.71 94,388 1,087 4.67 83,062 907 4.38Total interest-bearing deposits 523,471 4,094 3.14 512,291 3,831 3.03 494,354 3,329 2.70
Federal funds purchased, securities sold under agreements to repurchase and other short-term borrowings (2) 419,260 5,650 5.40 414,104 5,466 5.35 408,734 5,021 4.93Trading account liabilities 85,550 821 3.85 77,635 892 4.66 61,263 596 3.90Long-term debt (2) 158,500 2,074 5.24 148,627 1,924 5.18 125,620 1,634 5.20
Total interest-bearing liabilities - excluding hedge impact 1,186,781 12,639 4.27 1,152,657 12,113 4.25 1,089,971 10,580 3.89Net hedge (income) expense on liabilities 207 179 87
Total interest-bearing liabilities - including hedge impact 1,186,781 12,846 4.34 1,152,657 12,292 4.31 1,089,971 10,667 3.92Noninterest-bearing sources:
Noninterest-bearing deposits 173,564 174,413 180,442Other liabilities 67,753 60,760 58,218Shareholders' equity 133,551 133,588 127,373
Total liabilities and shareholders' equity $1,561,649 $1,521,418 $1,456,004Net interest spread 2.14 2.16 2.39Impact of noninterest-bearing sources 0.54 0.54 0.51
Net interest income/yield on earning assets - excluding hedge impact $9,105 2.68 % $8,897 2.70 % $9,067 2.90 %Net impact of hedge income (expense) (324) (0.09) (300) (0.09) (141) (0.05)
Net interest income/yield on earning assets $8,781 2.59 % $8,597 2.61 % $8,926 2.85 %
(1) This table presents a non-GAAP financial measure. The impact of interest rate risk management derivatives is shown separately. Interest income and interest expense amounts, and the yields and rates have been adjusted. Management believes this presentation is useful to investors because it adjusts for the impact of our hedging decisions and provides a better understanding of our hedging activities. The impact of interest rate risk management derivatives is not material to the average balances presented above.(2) The following presents the impact of interest rate risk management derivatives on interest income and interest expense.
Interest income excludes the impact of interest rate risk management contracts, which increased (decreased) interest income on:
Time deposits placed and other short-term investments $(10) $(27) $(13)Federal funds sold and securities purchased under agreements to resell (100) (106) (114)Debt securities (7) (4) (2)Commercial - domestic (9) 1 76Commercial - foreign 17 18 1Other earning assets (8) (3) (2)
Net hedge income (expense) on assets $(117) $(121) $(54)
Interest expense excludes the impact of interest rate risk management contracts, which increased (decreased) interest expense on:
NOW and money market deposit accounts $4 $5 $1Consumer CDs and IRAs 158 194 163Negotiable CDs, public funds and other time deposits 3 2 2Banks located in foreign countries 2 2 13Federal funds purchased, securities sold under agreements to repurchase and other short-term borrowings (113) (148) (179)Long-term debt 153 124 87
Net hedge (income) expense on liabilities $207 $179 $87
Certain prior period amounts have been reclassified to conform to current period presentation.
Second Quarter 2007 First Quarter 2007 Second Quarter 2006
Second Quarter 2007 Second Quarter 2006First Quarter 2007
This information is preliminary and based on company data available at the time of the presentation. 9
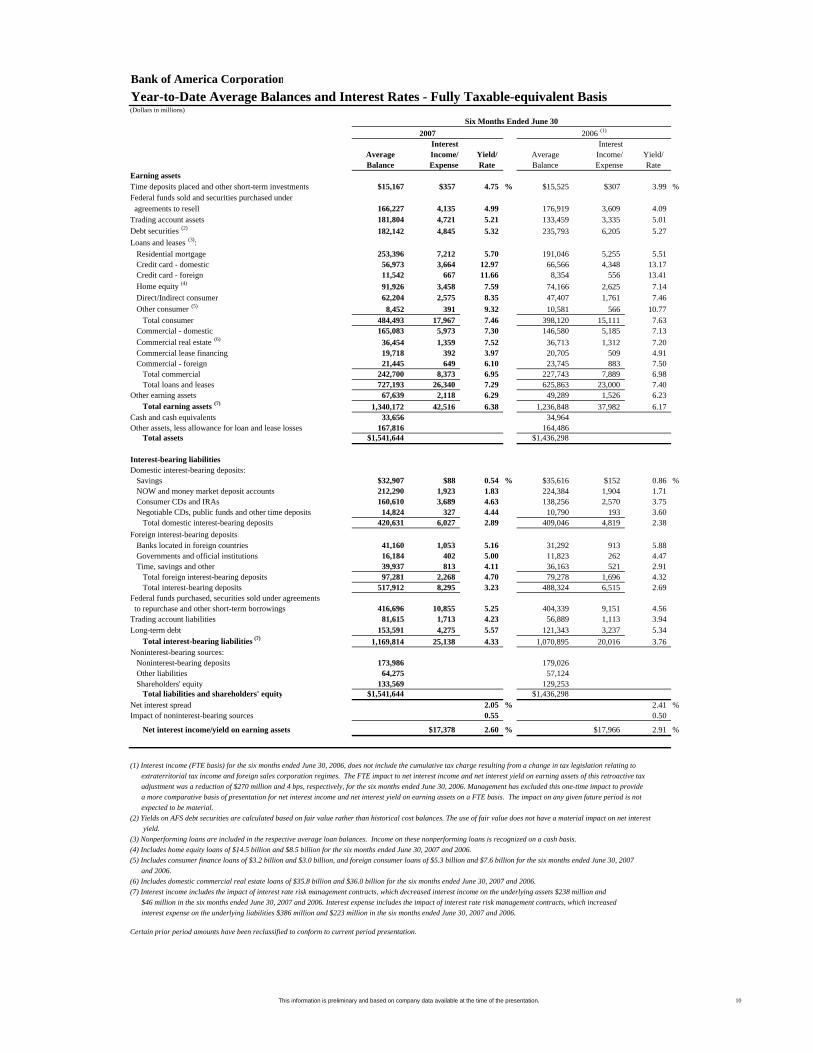
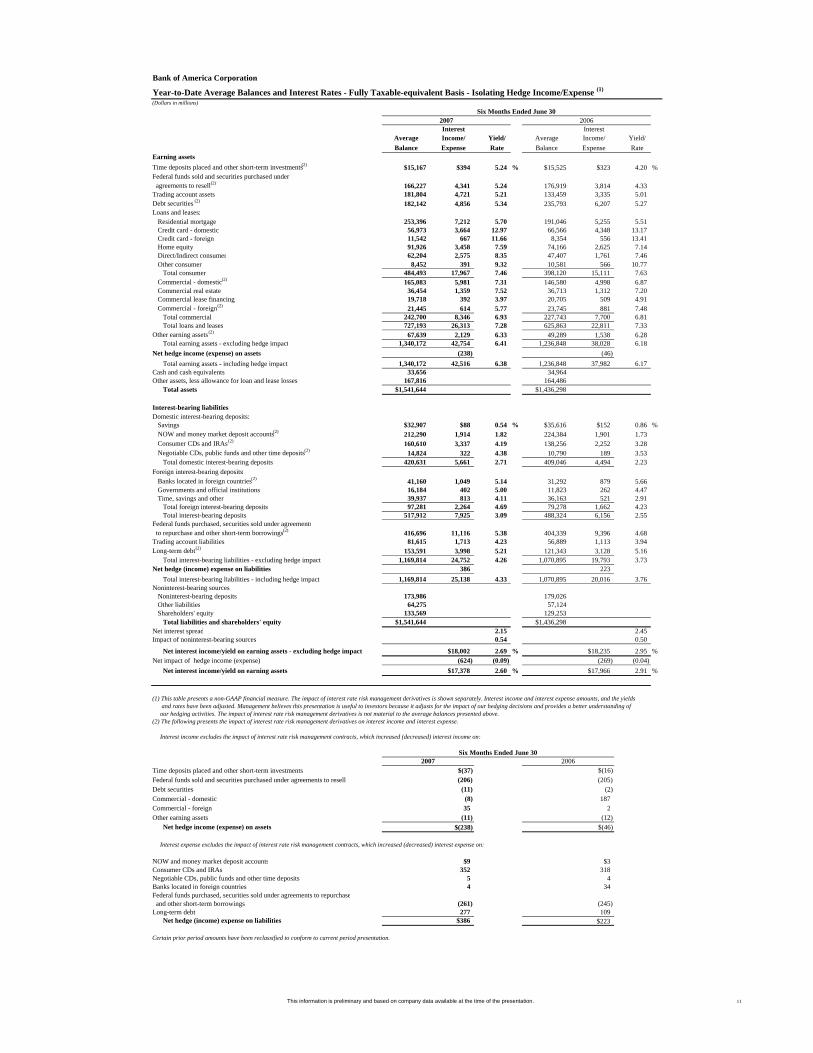
Bank of America CorporationYear-to-Date Average Balances and Interest Rates - Fully Taxable-equivalent Basis(Dollars in millions)
Interest Interest Average Income/ Yield/ Average Income/ Yield/Balance Expense Rate Balance Expense Rate
Earning assetsTime deposits placed and other short-term investments $15,167 $357 4.75 % $15,525 $307 3.99 %Federal funds sold and securities purchased under agreements to resell 166,227 4,135 4.99 176,919 3,609 4.09Trading account assets 181,804 4,721 5.21 133,459 3,335 5.01Debt securities (2) 182,142 4,845 5.32 235,793 6,205 5.27Loans and leases (3):
Residential mortgage 253,396 7,212 5.70 191,046 5,255 5.51Credit card - domestic 56,973 3,664 12.97 66,566 4,348 13.17Credit card - foreign 11,542 667 11.66 8,354 556 13.41Home equity (4) 91,926 3,458 7.59 74,166 2,625 7.14Direct/Indirect consumer 62,204 2,575 8.35 47,407 1,761 7.46Other consumer (5) 8,452 391 9.32 10,581 566 10.77
Total consumer 484,493 17,967 7.46 398,120 15,111 7.63Commercial - domestic 165,083 5,973 7.30 146,580 5,185 7.13Commercial real estate (6) 36,454 1,359 7.52 36,713 1,312 7.20Commercial lease financing 19,718 392 3.97 20,705 509 4.91Commercial - foreign 21,445 649 6.10 23,745 883 7.50
Total commercial 242,700 8,373 6.95 227,743 7,889 6.98Total loans and leases 727,193 26,340 7.29 625,863 23,000 7.40
Other earning assets 67,639 2,118 6.29 49,289 1,526 6.23Total earning assets (7) 1,340,172 42,516 6.38 1,236,848 37,982 6.17
Cash and cash equivalents 33,656 34,964Other assets, less allowance for loan and lease losses 167,816 164,486
Total assets $1,541,644 $1,436,298
Interest-bearing liabilitiesDomestic interest-bearing deposits:
Savings $32,907 $88 0.54 % $35,616 $152 0.86 %NOW and money market deposit accounts 212,290 1,923 1.83 224,384 1,904 1.71Consumer CDs and IRAs 160,610 3,689 4.63 138,256 2,570 3.75Negotiable CDs, public funds and other time deposits 14,824 327 4.44 10,790 193 3.60
Total domestic interest-bearing deposits 420,631 6,027 2.89 409,046 4,819 2.38Foreign interest-bearing deposits:
Banks located in foreign countries 41,160 1,053 5.16 31,292 913 5.88Governments and official institutions 16,184 402 5.00 11,823 262 4.47Time, savings and other 39,937 813 4.11 36,163 521 2.91
Total foreign interest-bearing deposits 97,281 2,268 4.70 79,278 1,696 4.32Total interest-bearing deposits 517,912 8,295 3.23 488,324 6,515 2.69
Federal funds purchased, securities sold under agreements to repurchase and other short-term borrowings 416,696 10,855 5.25 404,339 9,151 4.56Trading account liabilities 81,615 1,713 4.23 56,889 1,113 3.94Long-term debt 153,591 4,275 5.57 121,343 3,237 5.34
Total interest-bearing liabilities (7) 1,169,814 25,138 4.33 1,070,895 20,016 3.76Noninterest-bearing sources:
Noninterest-bearing deposits 173,986 179,026Other liabilities 64,275 57,124Shareholders' equity 133,569 129,253
Total liabilities and shareholders' equity $1,541,644 $1,436,298Net interest spread 2.05 % 2.41 %Impact of noninterest-bearing sources 0.55 0.50
Net interest income/yield on earning assets $17,378 2.60 % $17,966 2.91 %
(1) Interest income (FTE basis) for the six months ended June 30, 2006, does not include the cumulative tax charge resulting from a change in tax legislation relating to extraterritorial tax income and foreign sales corporation regimes. The FTE impact to net interest income and net interest yield on earning assets of this retroactive tax adjustment was a reduction of $270 million and 4 bps, respectively, for the six months ended June 30, 2006. Management has excluded this one-time impact to provide a more comparative basis of presentation for net interest income and net interest yield on earning assets on a FTE basis. The impact on any given future period is not expected to be material.(2) Yields on AFS debt securities are calculated based on fair value rather than historical cost balances. The use of fair value does not have a material impact on net interest yield.(3) Nonperforming loans are included in the respective average loan balances. Income on these nonperforming loans is recognized on a cash basis.(4) Includes home equity loans of $14.5 billion and $8.5 billion for the six months ended June 30, 2007 and 2006.(5) Includes consumer finance loans of $3.2 billion and $3.0 billion, and foreign consumer loans of $5.3 billion and $7.6 billion for the six months ended June 30, 2007 and 2006.(6) Includes domestic commercial real estate loans of $35.8 billion and $36.0 billion for the six months ended June 30, 2007 and 2006.(7) Interest income includes the impact of interest rate risk management contracts, which decreased interest income on the underlying assets $238 million and $46 million in the six months ended June 30, 2007 and 2006. Interest expense includes the impact of interest rate risk management contracts, which increased interest expense on the underlying liabilities $386 million and $223 million in the six months ended June 30, 2007 and 2006.
Certain prior period amounts have been reclassified to conform to current period presentation.
2007 2006 (1)Six Months Ended June 30
This information is preliminary and based on company data available at the time of the presentation. 10
Bank of America Corporation
Year-to-Date Average Balances and Interest Rates - Fully Taxable-equivalent Basis - Isolating Hedge Income/Expense (1)
(Dollars in millions)Six Months Ended June 30
2007 2006Interest Interest
Average Income/ Yield/ Average Income/ Yield/Balance Expense Rate Balance Expense Rate
Earning assetsTime deposits placed and other short-term investments (2) $15,167 $394 5.24 % $15,525 $323 4.20 %Federal funds sold and securities purchased under agreements to resell (2) 166,227 4,341 5.24 176,919 3,814 4.33Trading account assets 181,804 4,721 5.21 133,459 3,335 5.01Debt securities (2) 182,142 4,856 5.34 235,793 6,207 5.27Loans and leases:
Residential mortgage 253,396 7,212 5.70 191,046 5,255 5.51Credit card - domestic 56,973 3,664 12.97 66,566 4,348 13.17Credit card - foreign 11,542 667 11.66 8,354 556 13.41Home equity 91,926 3,458 7.59 74,166 2,625 7.14Direct/Indirect consumer 62,204 2,575 8.35 47,407 1,761 7.46Other consumer 8,452 391 9.32 10,581 566 10.77
Total consumer 484,493 17,967 7.46 398,120 15,111 7.63Commercial - domestic (2) 165,083 5,981 7.31 146,580 4,998 6.87Commercial real estate 36,454 1,359 7.52 36,713 1,312 7.20Commercial lease financing 19,718 392 3.97 20,705 509 4.91Commercial - foreign (2) 21,445 614 5.77 23,745 881 7.48
Total commercial 242,700 8,346 6.93 227,743 7,700 6.81Total loans and leases 727,193 26,313 7.28 625,863 22,811 7.33
Other earning assets (2) 67,639 2,129 6.33 49,289 1,538 6.28Total earning assets - excluding hedge impact 1,340,172 42,754 6.41 1,236,848 38,028 6.18
Net hedge income (expense) on assets (238) (46)Total earning assets - including hedge impact 1,340,172 42,516 6.38 1,236,848 37,982 6.17
Cash and cash equivalents 33,656 34,964Other assets, less allowance for loan and lease losses 167,816 164,486
Total assets $1,541,644 $1,436,298
Interest-bearing liabilitiesDomestic interest-bearing deposits:
Savings $32,907 $88 0.54 % $35,616 $152 0.86 %NOW and money market deposit accounts (2) 212,290 1,914 1.82 224,384 1,901 1.73Consumer CDs and IRAs (2) 160,610 3,337 4.19 138,256 2,252 3.28Negotiable CDs, public funds and other time deposits (2) 14,824 322 4.38 10,790 189 3.53
Total domestic interest-bearing deposits 420,631 5,661 2.71 409,046 4,494 2.23Foreign interest-bearing deposits:
Banks located in foreign countries (2) 41,160 1,049 5.14 31,292 879 5.66Governments and official institutions 16,184 402 5.00 11,823 262 4.47Time, savings and other 39,937 813 4.11 36,163 521 2.91
Total foreign interest-bearing deposits 97,281 2,264 4.69 79,278 1,662 4.23Total interest-bearing deposits 517,912 7,925 3.09 488,324 6,156 2.55
Federal funds purchased, securities sold under agreements to repurchase and other short-term borrowings (2) 416,696 11,116 5.38 404,339 9,396 4.68Trading account liabilities 81,615 1,713 4.23 56,889 1,113 3.94Long-term debt (2) 153,591 3,998 5.21 121,343 3,128 5.16
Total interest-bearing liabilities - excluding hedge impact 1,169,814 24,752 4.26 1,070,895 19,793 3.73Net hedge (income) expense on liabilities 386 223
Total interest-bearing liabilities - including hedge impact 1,169,814 25,138 4.33 1,070,895 20,016 3.76Noninterest-bearing sources
Noninterest-bearing deposits 173,986 179,026Other liabilities 64,275 57,124Shareholders' equity 133,569 129,253
Total liabilities and shareholders' equity $1,541,644 $1,436,298Net interest spread 2.15 2.45Impact of noninterest-bearing sources 0.54 0.50
Net interest income/yield on earning assets - excluding hedge impact $18,002 2.69 % $18,235 2.95 %Net impact of hedge income (expense) (624) (0.09) (269) (0.04)
Net interest income/yield on earning assets $17,378 2.60 % $17,966 2.91 %
(1) This table presents a non-GAAP financial measure. The impact of interest rate risk management derivatives is shown separately. Interest income and interest expense amounts, and the yields and rates have been adjusted. Management believes this presentation is useful to investors because it adjusts for the impact of our hedging decisions and provides a better understanding of our hedging activities. The impact of interest rate risk management derivatives is not material to the average balances presented above.(2) The following presents the impact of interest rate risk management derivatives on interest income and interest expense.
Interest income excludes the impact of interest rate risk management contracts, which increased (decreased) interest income on:
2007 2006Time deposits placed and other short-term investments $(37) $(16)Federal funds sold and securities purchased under agreements to resell (206) (205)Debt securities (11) (2)Commercial - domestic (8) 187Commercial - foreign 35 2Other earning assets (11) (12)
Net hedge income (expense) on assets $(238) $(46)
Interest expense excludes the impact of interest rate risk management contracts, which increased (decreased) interest expense on:
NOW and money market deposit accounts $9 $3Consumer CDs and IRAs 352 318Negotiable CDs, public funds and other time deposits 5 4Banks located in foreign countries 4 34Federal funds purchased, securities sold under agreements to repurchase and other short-term borrowings (261) (245)Long-term debt 277 109
Net hedge (income) expense on liabilities $386 $223
Certain prior period amounts have been reclassified to conform to current period presentation.
Six Months Ended June 30
This information is preliminary and based on company data available at the time of the presentation. 11

Bank of America CorporationBusiness Segment View
(1) Fully taxable-equivalent basis(2) Global Consumer and Small Business Banking is presented on a managed basis, specifically Card Services, with a corresponding offset to All Other.(3) Total revenue, net of interest expense for All Other was less than one percent of the Corporation's total revenue, net of interest expense for the six months ended June 30, 2007.
Net Income Six Months Ended June 30, 2007
Global Corporate and Investment Banking
28%
Global Wealth and Investment Management
10%
All Other15%
Global Consumer and Small Business Banking
47%
Total Revenue, Net of Interest Expense (1, 2, 3)
Six Months Ended June 30, 2007
Global Consumer and Small Business Banking
61%
Global Corporate and Investment Banking
29%
Global Wealth and Investment Management
10%
This information is preliminary and based on company data available at the time of the presentation. 12

Bank of America CorporationGlobal Consumer and Small Business Banking Segment Results (1, 2)
(Dollars in millions; except as noted)
Second First Fourth Third SecondQuarter Quarter Quarter Quarter Quarter
2007 2006 2007 2007 2006 2006 2006Net interest income (3) $14,179 $14,059 $7,150 $7,029 $7,156 $7,027 $6,967Noninterest income:
Card income 5,127 4,635 2,676 2,451 2,707 2,446 2,528 Service charges 2,865 2,539 1,488 1,377 1,394 1,410 1,349 Mortgage banking income 599 415 297 302 247 215 210 Gains (losses) on sales of debt securities (1) (1) - (1) (1) - - All other income 593 571 328 265 258 382 323
Total noninterest income 9,183 8,159 4,789 4,394 4,605 4,453 4,410 Total revenue, net of interest expense 23,362 22,218 11,939 11,423 11,761 11,480 11,377
Provision for credit losses (4) 5,505 3,708 3,094 2,411 2,777 2,049 1,807 Noninterest expense 9,700 9,119 4,969 4,731 4,849 4,709 4,508
Income before income taxes 8,157 9,391 3,876 4,281 4,135 4,722 5,062 Income tax expense (3) 3,003 3,462 1,417 1,586 1,526 1,736 1,858
Net income $5,154 $5,929 $2,459 $2,695 $2,609 $2,986 $3,204
Net interest yield (3) 8.27 % 8.25 % 8.29 % 8.25 % 8.39 % 8.27 % 8.15 %Return on average equity 16.67 18.42 15.80 17.56 16.64 18.84 20.14 Efficiency ratio (3) 41.52 41.04 41.62 41.42 41.23 41.02 39.62
Balance sheet (2)
AverageTotal loans and leases $312,701 $280,821 $317,246 $308,105 $299,615 $291,029 $282,390Total earning assets (5) 345,803 343,753 346,045 345,558 338,577 337,045 343,093 Total assets (5) 401,026 396,434 401,425 400,622 393,419 393,002 396,054 Total deposits 326,647 334,413 326,741 326,552 327,962 332,578 336,105 Allocated equity 62,333 64,918 62,425 62,241 62,215 62,885 63,817
Period end Total loans and leases $324,452 $285,885 $324,452 $309,992 $307,661 $294,207 $285,885Total earning assets (5) 344,765 337,138 344,765 349,737 339,604 340,133 337,138 Total assets (5) 402,195 396,150 402,195 407,697 398,313 398,226 396,150 Total deposits 326,978 338,827 326,978 334,968 329,245 332,844 338,827
Period end (in billions)
Mortgage servicing portfolio $360.1 $313.0 $360.1 $345.1 $333.0 $323.3 $313.0
(1) Global Consumer and Small Business Banking has three primary businesses: Deposits, Card Services and Consumer Real Estate. In addition, ALM/Other includes the results of ALM activities and other consumer-related businesses (e.g., insurance). (2) Presented on a managed basis, specifically Card Services. (See Exhibit A: Non-GAAP Reconciliations - Global Consumer and Small Business Banking - Reconciliation on page 41).(3) Fully taxable-equivalent basis (4) Represents the provision for credit losses on held loans combined with realized credit losses associated with the securitized loan portfolio.(5) Total earning assets and total assets include asset allocations to match liabilities (i.e., deposits).
Certain prior period amounts have been reclassified among the segments to conform to the current period presentation.
Six Months EndedJune 30
This information is preliminary and based on company data available at the time of the presentation. 13

Bank of America Corporation
(Dollars in millions)
Card Consumer ALM/Total (1) Deposits (2) Services (1) Real Estate Other
Net interest income (3) $7,150 $2,378 $4,044 $546 $182Noninterest income:
Card income 2,676 539 2,135 2 - Service charges 1,488 1,487 - 1 - Mortgage banking income 297 - - 297 - Gains (losses) on sales of debt securities - - - - - All other income 328 - 251 10 67
Total noninterest income 4,789 2,026 2,386 310 67 Total revenue, net of interest expense 11,939 4,404 6,430 856 249
Provision for credit losses (4) 3,094 56 2,857 125 56 Noninterest expense 4,969 2,254 2,058 508 149
Income before income taxes 3,876 2,094 1,515 223 44 Income tax expense (3) 1,417 765 554 82 16
Net income $2,459 $1,329 $961 $141 $28
Net interest yield (3) 8.29 % 3.03 % 7.91 % 2.07 % n/mReturn on average equity 15.80 35.80 8.74 14.92 n/mEfficiency ratio (3) 41.62 51.19 32.00 59.26 n/mAverage - total loans and leases $317,246 n/m $204,332 $101,780 n/mAverage - total deposits 326,741 $320,282 n/m n/m n/mPeriod end - total assets (5) 402,195 336,373 241,890 113,215 n/m
Card Consumer ALM/Total (1) Deposits (2) Services (1) Real Estate Other
Net interest income (3) $6,967 $2,372 $4,032 $478 $85Noninterest income:
Card income 2,528 473 2,054 1 - Service charges 1,349 1,348 - 1 - Mortgage banking income 210 - - 210 - Gains (losses) on sales of debt securities - - - - - All other income 323 - 242 11 70
Total noninterest income 4,410 1,821 2,296 223 70 Total revenue, net of interest expense 11,377 4,193 6,328 701 155
Provision for credit losses (4) 1,807 30 1,733 15 29 Noninterest expense 4,508 2,126 1,883 413 86
Income before income taxes 5,062 2,037 2,712 273 40 Income tax expense (3) 1,858 748 997 100 13
Net income $3,204 $1,289 $1,715 $173 $27
Net interest yield (3) 8.15 % 2.93 % 8.59 % 2.16 % n/mReturn on average equity 20.14 35.63 15.02 22.87 n/mEfficiency ratio (3) 39.62 50.70 29.76 58.94 n/mAverage - total loans and leases $282,390 n/m $187,898 $83,302 n/mAverage - total deposits 336,105 $329,902 n/m n/m n/mPeriod end - total assets (5) 396,150 347,735 225,289 93,395 n/m
(1) Presented on a managed basis, specifically Card Services.(2) For the three months ended June 30, 2007 and 2006, a total of $2.9 billion and $2.1 billion of deposits were migrated from Global Consumer and Small Business Banking to Global Wealth and Investment Management.(3) Fully taxable-equivalent basis(4) Represents the provision for credit losses on held loans combined with realized credit losses associated with the securitized loan portfolio.(5) Total assets include asset allocations to match liabilities (i.e., deposits). n/m = not meaningful
Certain prior period amounts have been reclassified among the segments to conform to the current period presentation.
Global Consumer and Small Business Banking Business Results
Three Months Ended June 30, 2007
Three Months Ended June 30, 2006
This information is preliminary and based on company data available at the time of the presentation. 14
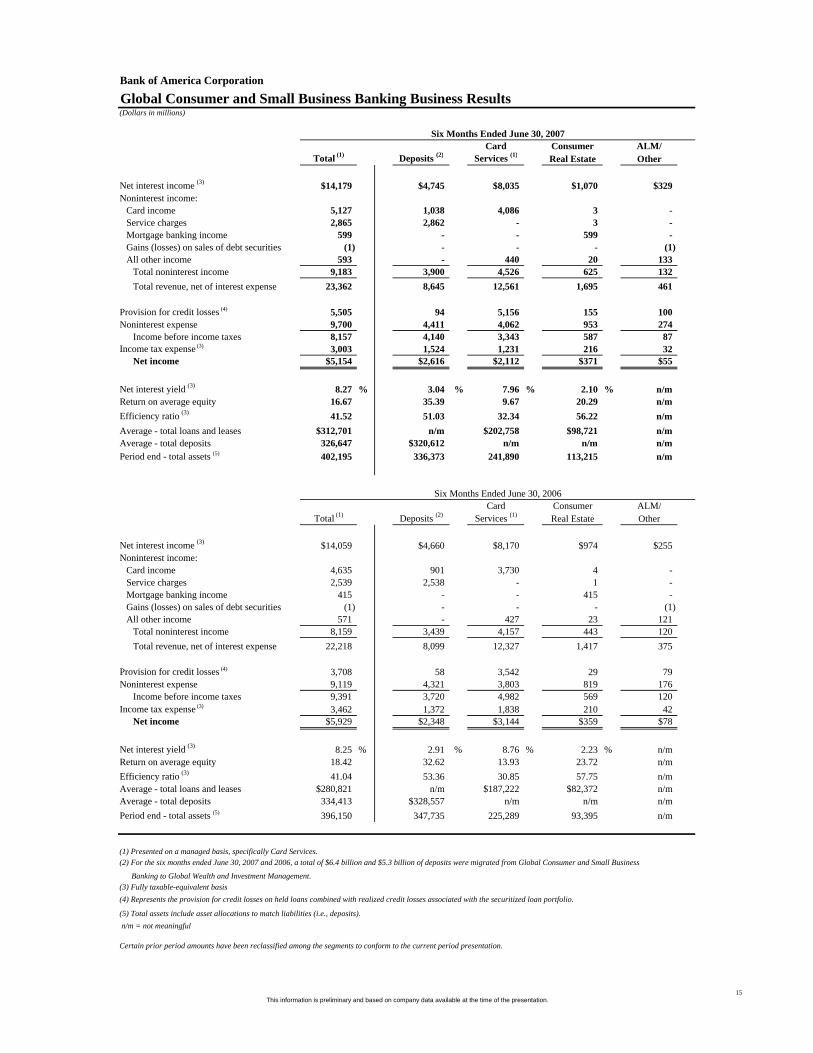
Bank of America Corporation
(Dollars in millions)
Card Consumer ALM/Total (1) Deposits (2) Services (1) Real Estate Other
Net interest income (3) $14,179 $4,745 $8,035 $1,070 $329Noninterest income:
Card income 5,127 1,038 4,086 3 - Service charges 2,865 2,862 - 3 - Mortgage banking income 599 - - 599 - Gains (losses) on sales of debt securities (1) - - - (1) All other income 593 - 440 20 133
Total noninterest income 9,183 3,900 4,526 625 132 Total revenue, net of interest expense 23,362 8,645 12,561 1,695 461
Provision for credit losses (4) 5,505 94 5,156 155 100 Noninterest expense 9,700 4,411 4,062 953 274
Income before income taxes 8,157 4,140 3,343 587 87 Income tax expense (3) 3,003 1,524 1,231 216 32
Net income $5,154 $2,616 $2,112 $371 $55
Net interest yield (3) 8.27 % 3.04 % 7.96 % 2.10 % n/mReturn on average equity 16.67 35.39 9.67 20.29 n/mEfficiency ratio (3) 41.52 51.03 32.34 56.22 n/mAverage - total loans and leases $312,701 n/m $202,758 $98,721 n/mAverage - total deposits 326,647 $320,612 n/m n/m n/mPeriod end - total assets (5) 402,195 336,373 241,890 113,215 n/m
Card Consumer ALM/Total (1) Deposits (2) Services (1) Real Estate Other
Net interest income (3) $14,059 $4,660 $8,170 $974 $255Noninterest income:
Card income 4,635 901 3,730 4 - Service charges 2,539 2,538 - 1 - Mortgage banking income 415 - - 415 - Gains (losses) on sales of debt securities (1) - - - (1) All other income 571 - 427 23 121
Total noninterest income 8,159 3,439 4,157 443 120 Total revenue, net of interest expense 22,218 8,099 12,327 1,417 375
Provision for credit losses (4) 3,708 58 3,542 29 79 Noninterest expense 9,119 4,321 3,803 819 176
Income before income taxes 9,391 3,720 4,982 569 120 Income tax expense (3) 3,462 1,372 1,838 210 42
Net income $5,929 $2,348 $3,144 $359 $78
Net interest yield (3) 8.25 % 2.91 % 8.76 % 2.23 % n/mReturn on average equity 18.42 32.62 13.93 23.72 n/mEfficiency ratio (3) 41.04 53.36 30.85 57.75 n/mAverage - total loans and leases $280,821 n/m $187,222 $82,372 n/mAverage - total deposits 334,413 $328,557 n/m n/m n/mPeriod end - total assets (5) 396,150 347,735 225,289 93,395 n/m
(1) Presented on a managed basis, specifically Card Services.(2) For the six months ended June 30, 2007 and 2006, a total of $6.4 billion and $5.3 billion of deposits were migrated from Global Consumer and Small Business
Banking to Global Wealth and Investment Management.(3) Fully taxable-equivalent basis(4) Represents the provision for credit losses on held loans combined with realized credit losses associated with the securitized loan portfolio.
(5) Total assets include asset allocations to match liabilities (i.e., deposits). n/m = not meaningful
Certain prior period amounts have been reclassified among the segments to conform to the current period presentation.
Global Consumer and Small Business Banking Business Results
Six Months Ended June 30, 2007
Six Months Ended June 30, 2006
This information is preliminary and based on company data available at the time of the presentation. 15

Bank of America Corporation
(Dollars in millions)
Mass Market and Mass Market andTotal Consumer Small Business Total Consumer Small Business
Net interest income (2) $7,150 $6,253 $897 $6,967 $6,166 $801Noninterest income 4,789 4,146 643 4,410 3,885 525
Total revenue, net of interest expense 11,939 10,399 1,540 11,377 10,051 1,326
Provision for credit losses (3) 3,094 2,634 460 1,807 1,636 171 Noninterest expense 4,969 4,511 458 4,508 4,095 413
Income before income taxes 3,876 3,254 622 5,062 4,320 742 Income tax expense (2) 1,417 1,189 228 1,858 1,586 272
Net income $2,459 $2,065 $394 $3,204 $2,734 $470
Mass Market and Mass Market andTotal Consumer Small Business Total Consumer Small Business
Net interest income (2) $14,179 $12,420 $1,759 $14,059 $12,511 $1,548Noninterest income 9,183 7,978 1,205 8,159 7,143 1,016
Total revenue, net of interest expense 23,362 20,398 2,964 22,218 19,654 2,564
Provision for credit losses (3) 5,505 4,761 744 3,708 3,392 316 Noninterest expense 9,700 8,808 892 9,119 8,266 853
Income before income taxes 8,157 6,829 1,328 9,391 7,996 1,395 Income tax expense (2) 3,003 2,514 489 3,462 2,948 514
Net income $5,154 $4,315 $839 $5,929 $5,048 $881
(1) Presented on a managed basis, specifically Card Services.(2) Fully taxable-equivalent basis(3) Represents the provision for credit losses on held loans combined with realized credit losses associated with the securitized loan portfolio.
Certain prior period amounts have been reclassified among the segments to conform to the current period presentation.
Global Consumer and Small Business Banking Business Results: Customer Relationship View (1)
Three Months Ended June 30, 2007 Three Months Ended June 30, 2006
Six Months Ended June 30, 2006Six Months Ended June 30, 2007
This information is preliminary and based on company data available at the time of the presentation. 16

Bank of America Corporation
Global Consumer and Small Business Banking - Key Indicators(Dollars in millions; except as noted)
Second First Fourth Third SecondQuarter Quarter Quarter Quarter Quarter
2007 2006 2007 2007 2006 2006 2006
Deposits Key IndicatorsAverage deposit balances
Checking $125,451 $128,053 $125,771 $125,127 $124,441 $125,809 $128,737Savings 29,882 32,129 30,029 29,732 29,889 31,058 32,303 MMS 63,352 73,929 62,554 64,159 66,066 69,049 72,242 CD's & IRA's 99,555 91,769 99,546 99,563 99,165 97,514 93,803 Foreign and other 2,372 2,677 2,382 2,364 2,330 2,600 2,817
Total average deposit balances $320,612 $328,557 $320,282 $320,945 $321,891 $326,030 $329,902
Total balances migrated to Premier Banking and Investments $6,408 $5,349 $2,857 $3,551 $3,667 $1,671 $2,111
Deposit spreads (excludes noninterest costs)Checking 4.25 % 4.18 % 4.27 % 4.24 % 4.23 % 4.19 % 4.18 %Savings 3.74 3.39 3.71 3.77 3.70 3.45 3.40MMS 3.39 2.64 3.36 3.42 3.25 2.87 2.76CD's & IRA's 1.11 1.24 1.10 1.13 1.11 1.21 1.24Foreign and other 4.34 4.26 4.28 4.41 4.27 4.23 4.25
Total deposit spreads 3.05 2.92 3.04 3.05 3.00 2.93 2.94
Net new retail checking (units in thousands) 1,204 1,304 717 487 363 744 701 Debit purchase volumes $90,990 $81,115 $47,421 $43,569 $45,121 $42,790 $42,596
Online banking (end of period) Active accounts (units in thousands) 22,190 19,208 22,190 21,813 20,552 19,913 19,208 Active billpay accounts (units in thousands) 11,567 10,188 11,567 11,285 10,832 10,589 10,188
Card Services Key IndicatorsManaged Card - US Consumer and Business Card
Gross interest yield 12.84 % 12.53 % 12.82 % 12.85 % 12.98 % 12.85 % 12.52 %Risk adjusted margin (1) 7.71 9.95 7.61 7.82 8.74 8.84 9.50 Loss rates 5.01 3.31 5.20 4.81 4.57 4.18 3.55 Average outstandings $147,976 $144,051 $147,972 $147,980 $146,939 $145,518 $143,443Ending outstandings 150,159 144,142 150,159 146,013 150,731 145,891 144,142 New account growth (in thousands) 4,567 4,485 2,432 2,135 2,488 2,516 2,328 Purchase volumes $116,900 $113,324 $61,383 $55,517 $62,073 $60,662 $59,817Delinquencies:
30 Day 5.24 % 4.73 % 5.24 % 5.44 % 5.49 % 5.14 % 4.73 %90 Day 2.65 2.30 2.65 2.88 2.66 2.38 2.30
Merchant Acquiring Business Processing volume $174,345 $185,553 $91,517 $82,828 $95,173 $97,044 $97,229 Total transactions (units in thousands) 4,011 3,956 2,099 1,912 2,102 2,101 2,069
Consumer Real Estate Key IndicatorsMortgage servicing rights at fair value period end balance $3,269 $3,083 $3,269 $2,963 $2,869 $2,932 $3,083Capitalized mortgage servicing rights (% of loans serviced) 141 bps 139 bps 141 bps 127 bps 125 bps 127 bps 139 bpsMortgage loans serviced for investors (in billions) $232 $221 $232 $234 $230 $230 $221
Global Consumer and Small Business BankingMortgage production $46,401 $36,448 $25,755 $20,646 $21,370 $19,095 $20,968Home equity production 35,857 31,804 18,547 17,310 18,460 17,497 17,103
Total CorporationMortgage production 52,621 40,584 29,172 23,449 23,701 21,222 23,372 Home equity production 43,779 39,891 22,746 21,033 21,882 21,193 21,329
(1) Reflects margin and noninterest revenue, adjusted for loss rates.
Certain prior period amounts have been reclassified among the segments to conform to the current period presentation.
Six Months EndedJune 30
This information is preliminary and based on company data available at the time of the presentation. 17
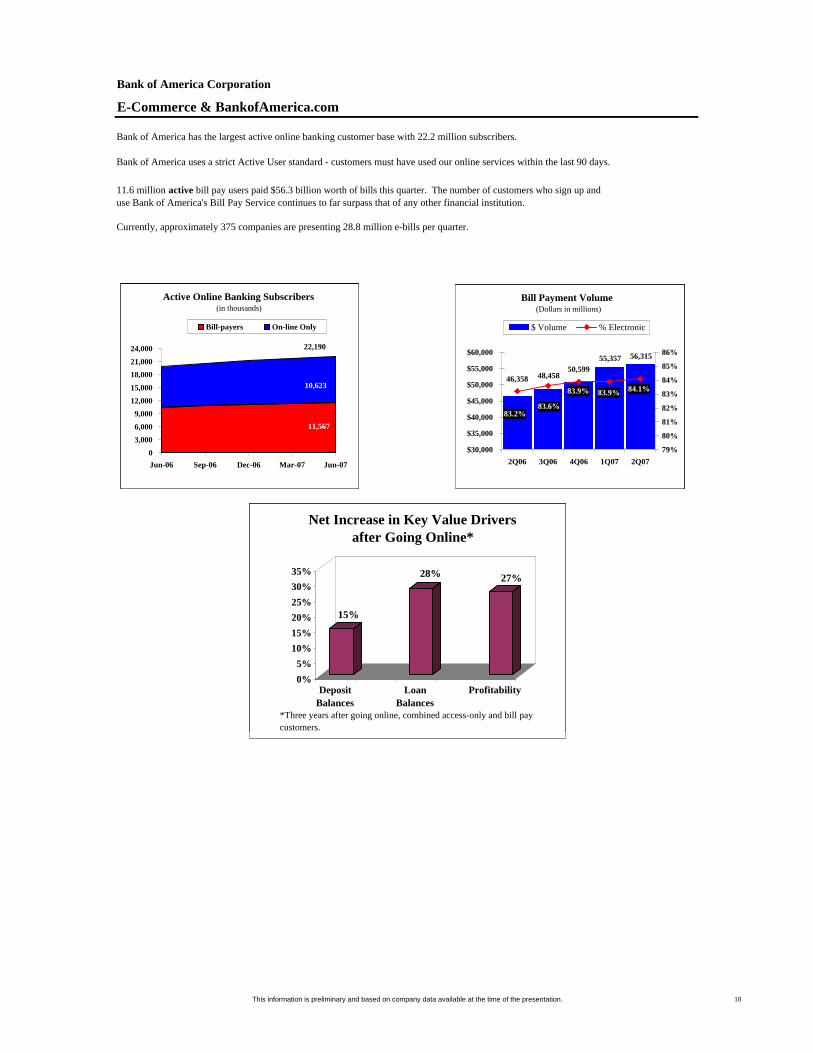
Bank of America Corporation
E-Commerce & BankofAmerica.com
Bank of America has the largest active online banking customer base with 22.2 million subscribers.
Bank of America uses a strict Active User standard - customers must have used our online services within the last 90 days.
11.6 million active bill pay users paid $56.3 billion worth of bills this quarter. The number of customers who sign up anduse Bank of America's Bill Pay Service continues to far surpass that of any other financial institution.
Currently, approximately 375 companies are presenting 28.8 million e-bills per quarter.
Bill Payment Volume(Dollars in millions)
11,02712,897
16,25314,494
9,570
0.803
0.7950.7950.7978%
$6,000
$8,000
$10,000
$12,000
$14,000
$16,000
$18,000
$20,000
1Q03 2Q03 3Q03 4Q03 1Q040.72
0.74
0.76
0.78
0.8
0.82$ Volume % Electronic
*Estimated
Active On-line Banking Subscribers(in thousands)
3,659
4435
01,0002,0003,0004,0005,0006,0007,0008,0009,000
37681 37773 37865 37956 38047
Bill-payers On-line Only
8,094
*
Bill Payment Volume(Dollars in millions)
25,728
33,148 34,360
30,09028,288
79% 0.790.795
0.8181%
$10,000
$15,000
$20,000
$25,000
$30,000
$35,000
4Q04 1Q05 2Q05 3Q05 4Q050.77
0.78
0.79
0.8
0.81
0.82
0.83$ Volume % Electronic
Active Online Banking Subscribers(in thousands)
7,281
7417
0
4,000
8,000
12,000
16,000
38322 38412 38504 38596 38687
Bill-payers On-line Only
14,338
15%
28% 27%
0%5%
10%15%20%25%30%35%
DepositBalances
LoanBalances
Profitability
Net Increase in Key Value Driversafter Going Online*
*Three years after going online, combined access-only and bill pay customers.
Bill Payment Volume(Dollars in millions)
11,02712,897
16,25314,494
9,570
0.803
0.7950.7950.7978%
$6,000
$8,000
$10,000
$12,000
$14,000
$16,000
$18,000
$20,000
1Q03 2Q03 3Q03 4Q03 1Q040.72
0.74
0.76
0.78
0.8
0.82$ Volume % Electronic
*Estimated
Active On-line Banking Subscribers(in thousands)
3,659
4435
01,0002,0003,0004,0005,0006,0007,0008,0009,000
37681 37773 37865 37956 38047
Bill-payers On-line Only
8,094
*
Bill Payment Volume(Dollars in millions)
28,28830,090
33,40033,148
25,728
0.79 0.790.795
0.81 0.807
$15,000
$20,000
$25,000
$30,000
$35,000
$40,000
4Q04 1Q05 2Q05 3Q05 4Q050.77
0.78
0.79
0.8
0.81
0.82
0.83$ Volume % Electronic
Active Online Banking Subscribers(in thousands)
7,281
7417
02,0004,0006,0008,000
10,00012,00014,00016,00018,000
38322 38412 38504 38596 38687
Bill-payers On-line Only
14,698
15%
28% 27%
0%5%
10%15%20%25%30%35%
DepositBalances
LoanBalances
Profitability
Net Increase in Key Value Driversafter Going Online*
*Three years after going online, combined access-only and bill pay customers.
Bill Payment Volume(Dollars in millions)
11,02712,897
16,25314,494
9,570
0.803
0.7950.7950.7978%
$6,000
$8,000
$10,000
$12,000
$14,000
$16,000
$18,000
$20,000
1Q03 2Q03 3Q03 4Q03 1Q040.72
0.74
0.76
0.78
0.8
0.82$ Volume % Electronic
*Estimated
Active On-line Banking Subscribers(in thousands)
3,659
4435
01,0002,0003,0004,0005,0006,0007,0008,0009,000
37681 37773 37865 37956 38047
Bill-payers On-line Only
8,094
*
Bill Payment Volume(Dollars in millions)
46,358
55,357 56,315
50,59948,458
84.1%
83.2%83.6%
83.9% 83.9%
$30,000
$35,000
$40,000
$45,000
$50,000
$55,000
$60,000
2Q06 3Q06 4Q06 1Q07 2Q0779%
80%
81%
82%
83%
84%
85%
86%
$ Volume % Electronic
Active Online Banking Subscribers(in thousands)
11,567
10,623
03,0006,0009,000
12,00015,00018,00021,000
24,000
Jun-06 Sep-06 Dec-06 Mar-07 Jun-07
Bill-payers On-line Only
22,190
15%
28% 27%
0%5%
10%15%20%25%30%35%
DepositBalances
LoanBalances
Profitability
Net Increase in Key Value Driversafter Going Online*
*Three years after going online, combined access-only and bill pay customers.
This information is preliminary and based on company data available at the time of the presentation. 18

Bank of America Corporation
(Dollars in millions)
Second First Fourth Third SecondQuarter Quarter Quarter Quarter Quarter
2007 2006 2007 2007 2006 2006 2006
Loans Period end
Held credit card outstandings $69,241 $71,566 $69,241 $65,920 $72,194 $70,067 $71,566Securitization impact 100,611 90,564 100,611 99,495 98,295 94,389 90,564
Managed credit card outstandings $169,852 $162,130 $169,852 $165,415 $170,489 $164,456 $162,130
AverageHeld credit card outstandings $68,515 $74,920 $68,181 $68,853 $70,177 $71,963 $73,285Securitization impact 98,966 86,805 99,388 98,539 95,815 92,175 88,032
Managed credit card outstandings $167,481 $161,725 $167,569 $167,392 $165,992 $164,138 $161,317
Credit QualityCharge-Offs $
Held net charge-offs $1,787 $1,433 $893 $894 $963 $923 $780Securitization impact 2,265 1,287 1,206 1,059 943 825 694
Managed credit card net losses $4,052 $2,720 $2,099 $1,953 $1,906 $1,748 $1,474
Charge-Offs %Held net charge-offs 5.26 % 3.86 % 5.25 % 5.27 % 5.44 % 5.09 % 4.27 %Securitization impact (0.38) (0.47) (0.23) (0.54) (0.88) (0.86) (0.60)
Managed credit card net losses 4.88 % 3.39 % 5.02 % 4.73 % 4.56 % 4.23 % 3.67 %
30+ Delinquency $Held delinquency $3,593 $3,874 $3,593 $3,660 $4,347 $4,234 $3,874Securitization impact 5,034 3,831 5,034 5,144 4,815 4,152 3,831
Managed delinquency $8,627 $7,705 $8,627 $8,804 $9,162 $8,386 $7,705
30+ Delinquency %Held delinquency 5.19 % 5.41 % 5.19 % 5.55 % 6.02 % 6.04 % 5.41 %Securitization impact (0.11) (0.66) (0.11) (0.23) (0.65) (0.94) (0.66)
Managed delinquency 5.08 % 4.75 % 5.08 % 5.32 % 5.37 % 5.10 % 4.75 %
90+ Delinquency $Held delinquency $1,850 $1,919 $1,850 $1,986 $2,175 $2,036 $1,919Securitization impact 2,480 1,826 2,480 2,633 2,261 1,860 1,826
Managed delinquency $4,330 $3,745 $4,330 $4,619 $4,436 $3,896 $3,745
90+ Delinquency %Held delinquency 2.67 % 2.68 % 2.67 % 3.01 % 3.01 % 2.91 % 2.68 %Securitization impact (0.12) (0.37) (0.12) (0.22) (0.41) (0.54) (0.37)
Managed delinquency 2.55 % 2.31 % 2.55 % 2.79 % 2.60 % 2.37 % 2.31 %
(1) Credit Card includes U.S. Consumer Card and foreign credit card. Does not include Business Credit Card.
Certain prior period amounts have been reclassified among the segments to conform to the current period presentation.
Credit Card Data (1)
Six Months EndedJune 30
This information is preliminary and based on company data available at the time of the presentation.
19
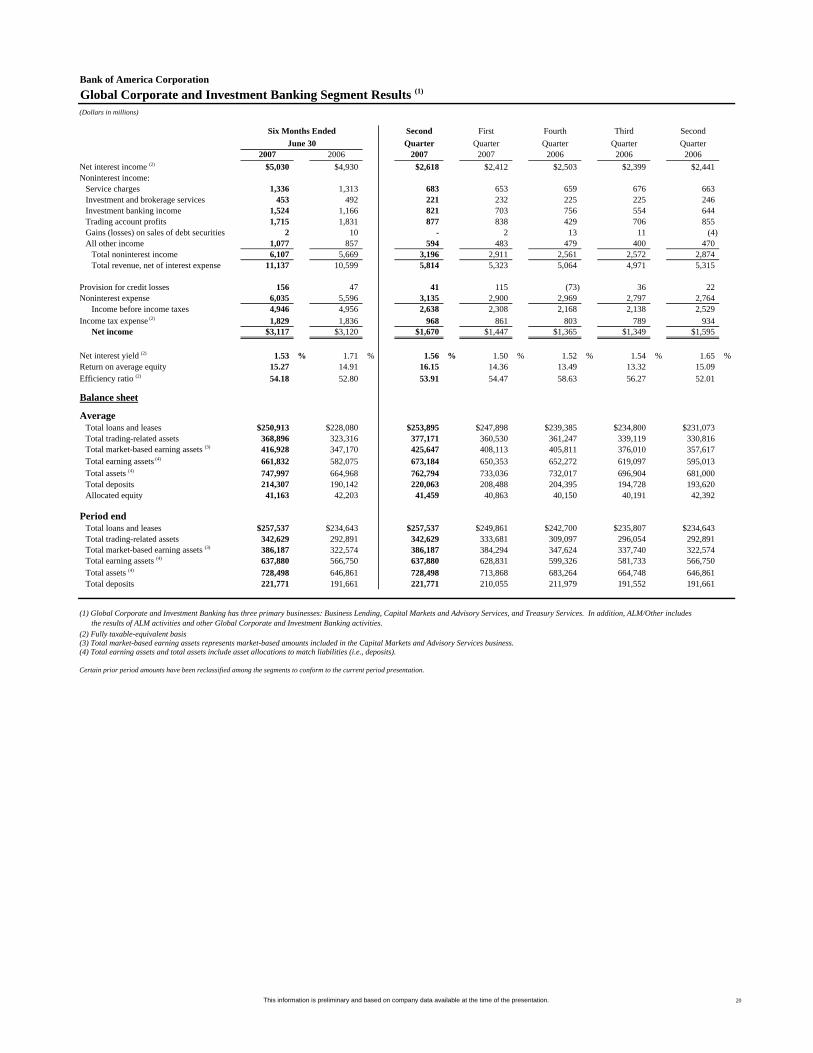
Bank of America Corporation
(Dollars in millions)
Second First Fourth Third SecondQuarter Quarter Quarter Quarter Quarter
2007 2006 2007 2007 2006 2006 2006Net interest income (2) $5,030 $4,930 $2,618 $2,412 $2,503 $2,399 $2,441Noninterest income:
Service charges 1,336 1,313 683 653 659 676 663Investment and brokerage services 453 492 221 232 225 225 246 Investment banking income 1,524 1,166 821 703 756 554 644 Trading account profits 1,715 1,831 877 838 429 706 855 Gains (losses) on sales of debt securities 2 10 - 2 13 11 (4) All other income 1,077 857 594 483 479 400 470
Total noninterest income 6,107 5,669 3,196 2,911 2,561 2,572 2,874 Total revenue, net of interest expense 11,137 10,599 5,814 5,323 5,064 4,971 5,315
Provision for credit losses 156 47 41 115 (73) 36 22 Noninterest expense 6,035 5,596 3,135 2,900 2,969 2,797 2,764
Income before income taxes 4,946 4,956 2,638 2,308 2,168 2,138 2,529Income tax expense (2) 1,829 1,836 968 861 803 789 934
Net income $3,117 $3,120 $1,670 $1,447 $1,365 $1,349 $1,595
Net interest yield (2) 1.53 % 1.71 % 1.56 % 1.50 % 1.52 % 1.54 % 1.65 %Return on average equity 15.27 14.91 16.15 14.36 13.49 13.32 15.09 Efficiency ratio (2) 54.18 52.80 53.91 54.47 58.63 56.27 52.01
Balance sheet
AverageTotal loans and leases $250,913 $228,080 $253,895 $247,898 $239,385 $234,800 $231,073Total trading-related assets 368,896 323,316 377,171 360,530 361,247 339,119 330,816 Total market-based earning assets (3) 416,928 347,170 425,647 408,113 405,811 376,010 357,617 Total earning assets (4) 661,832 582,075 673,184 650,353 652,272 619,097 595,013 Total assets (4) 747,997 664,968 762,794 733,036 732,017 696,904 681,000 Total deposits 214,307 190,142 220,063 208,488 204,395 194,728 193,620 Allocated equity 41,163 42,203 41,459 40,863 40,150 40,191 42,392
Period endTotal loans and leases $257,537 $234,643 $257,537 $249,861 $242,700 $235,807 $234,643Total trading-related assets 342,629 292,891 342,629 333,681 309,097 296,054 292,891 Total market-based earning assets (3) 386,187 322,574 386,187 384,294 347,624 337,740 322,574 Total earning assets (4) 637,880 566,750 637,880 628,831 599,326 581,733 566,750 Total assets (4) 728,498 646,861 728,498 713,868 683,264 664,748 646,861 Total deposits 221,771 191,661 221,771 210,055 211,979 191,552 191,661
(1) Global Corporate and Investment Banking has three primary businesses: Business Lending, Capital Markets and Advisory Services, and Treasury Services. In addition, ALM/Other includes the results of ALM activities and other Global Corporate and Investment Banking activities.(2) Fully taxable-equivalent basis(3) Total market-based earning assets represents market-based amounts included in the Capital Markets and Advisory Services business.(4) Total earning assets and total assets include asset allocations to match liabilities (i.e., deposits).
Certain prior period amounts have been reclassified among the segments to conform to the current period presentation.
Global Corporate and Investment Banking Segment Results (1)
Six Months EndedJune 30
This information is preliminary and based on company data available at the time of the presentation. 20
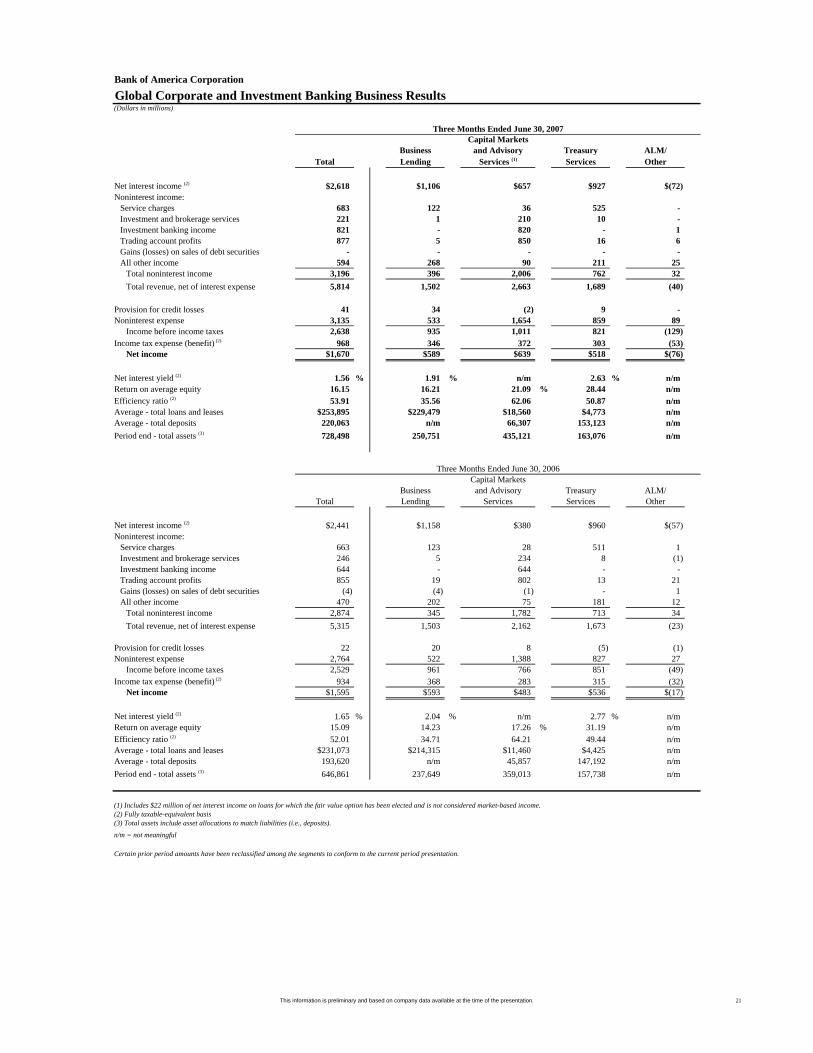
Bank of America Corporation
(Dollars in millions)
Capital MarketsBusiness and Advisory Treasury ALM/
Total Lending Services (1) Services Other
Net interest income (2) $2,618 $1,106 $657 $927 $(72)Noninterest income:
Service charges 683 122 36 525 - Investment and brokerage services 221 1 210 10 - Investment banking income 821 - 820 - 1 Trading account profits 877 5 850 16 6 Gains (losses) on sales of debt securities - - - - - All other income 594 268 90 211 25
Total noninterest income 3,196 396 2,006 762 32 Total revenue, net of interest expense 5,814 1,502 2,663 1,689 (40)
Provision for credit losses 41 34 (2) 9 - Noninterest expense 3,135 533 1,654 859 89
Income before income taxes 2,638 935 1,011 821 (129) Income tax expense (benefit) (2) 968 346 372 303 (53)
Net income $1,670 $589 $639 $518 $(76)
Net interest yield (2) 1.56 % 1.91 % n/m 2.63 % n/m Return on average equity 16.15 16.21 21.09 % 28.44 n/mEfficiency ratio (2) 53.91 35.56 62.06 50.87 n/mAverage - total loans and leases $253,895 $229,479 $18,560 $4,773 n/mAverage - total deposits 220,063 n/m 66,307 153,123 n/mPeriod end - total assets (3) 728,498 250,751 435,121 163,076 n/m
Capital MarketsBusiness and Advisory Treasury ALM/
Total Lending Services Services Other
Net interest income (2) $2,441 $1,158 $380 $960 $(57)Noninterest income:
Service charges 663 123 28 511 1 Investment and brokerage services 246 5 234 8 (1) Investment banking income 644 - 644 - - Trading account profits 855 19 802 13 21 Gains (losses) on sales of debt securities (4) (4) (1) - 1 All other income 470 202 75 181 12
Total noninterest income 2,874 345 1,782 713 34 Total revenue, net of interest expense 5,315 1,503 2,162 1,673 (23)
Provision for credit losses 22 20 8 (5) (1) Noninterest expense 2,764 522 1,388 827 27
Income before income taxes 2,529 961 766 851 (49) Income tax expense (benefit) (2) 934 368 283 315 (32)
Net income $1,595 $593 $483 $536 $(17)
Net interest yield (2) 1.65 % 2.04 % n/m 2.77 % n/m Return on average equity 15.09 14.23 17.26 % 31.19 n/mEfficiency ratio (2) 52.01 34.71 64.21 49.44 n/mAverage - total loans and leases $231,073 $214,315 $11,460 $4,425 n/mAverage - total deposits 193,620 n/m 45,857 147,192 n/mPeriod end - total assets (3) 646,861 237,649 359,013 157,738 n/m
(1) Includes $22 million of net interest income on loans for which the fair value option has been elected and is not considered market-based income.(2) Fully taxable-equivalent basis(3) Total assets include asset allocations to match liabilities (i.e., deposits).
n/m = not meaningful
Certain prior period amounts have been reclassified among the segments to conform to the current period presentation.
Global Corporate and Investment Banking Business Results
Three Months Ended June 30, 2007
Three Months Ended June 30, 2006
This information is preliminary and based on company data available at the time of the presentation. 21

Bank of America Corporation
(Dollars in millions)
Capital MarketsBusiness and Advisory Treasury ALM/
Total Lending Services (1) Services Other
Net interest income (2) $5,030 $2,181 $1,141 $1,860 $(152)Noninterest income:
Service charges 1,336 247 63 1,026 - Investment and brokerage services 453 1 431 21 - Investment banking income 1,524 - 1,523 - 1 Trading account profits 1,715 2 1,672 28 13 Gains (losses) on sales of debt securities 2 - 2 - - All other income 1,077 419 191 377 90
Total noninterest income 6,107 669 3,882 1,452 104 Total revenue, net of interest expense 11,137 2,850 5,023 3,312 (48)
Provision for credit losses 156 139 9 10 (2) Noninterest expense 6,035 1,049 3,162 1,704 120
Income before income taxes 4,946 1,662 1,852 1,598 (166) Income tax expense (benefit) (2) 1,829 615 685 591 (62)
Net income $3,117 $1,047 $1,167 $1,007 $(104)
Net interest yield (2) 1.53 % 1.89 % n/m 2.67 % n/m Return on average equity 15.27 14.61 19.81 % 27.73 n/mEfficiency ratio (2) 54.18 36.85 62.94 51.45 n/mAverage - total loans and leases $250,913 $228,978 $16,354 $4,534 n/mAverage - total deposits 214,307 n/m 62,674 151,036 n/mPeriod end - total assets (3) 728,498 250,751 435,121 163,076 n/m
Capital MarketsBusiness and Advisory Treasury ALM/
Total Lending Services Services Other
Net interest income (2) $4,930 $2,320 $792 $1,907 $(89)Noninterest income:
Service charges 1,313 249 61 1,004 (1) Investment and brokerage services 492 9 467 15 1 Investment banking income 1,166 - 1,166 - - Trading account profits 1,831 34 1,748 25 24 Gains (losses) on sales of debt securities 10 5 4 - 1 All other income 857 245 233 348 31
Total noninterest income 5,669 542 3,679 1,392 56 Total revenue, net of interest expense 10,599 2,862 4,471 3,299 (33)
Provision for credit losses 47 35 11 1 - Noninterest expense 5,596 1,028 2,861 1,644 63
Income before income taxes 4,956 1,799 1,599 1,654 (96) Income tax expense (benefit) (2) 1,836 678 592 612 (46)
Net income $3,120 $1,121 $1,007 $1,042 $(50)
Net interest yield (2) 1.71 % 2.07 % n/m 2.75 % n/m Return on average equity 14.91 13.60 18.22 % 28.24 n/mEfficiency ratio (2) 52.80 35.92 63.99 49.83 n/mAverage - total loans and leases $228,080 $212,641 $10,443 $4,125 n/mAverage - total deposits 190,142 n/m 42,719 146,881 n/mPeriod end - total assets (3) 646,861 237,649 359,013 157,738 n/m
(1) Includes $22 million of net interest income on loans for which the fair value option has been elected and is not considered market-based income.(2) Fully taxable-equivalent basis(3) Total assets include asset allocations to match liabilities (i.e., deposits).n/m = not meaningful
Certain prior period amounts have been reclassified among the segments to conform to the current period presentation.
Global Corporate and Investment Banking Business Results
Six Months Ended June 30, 2007
Six Months Ended June 30, 2006
This information is preliminary and based on company data available at the time of the presentation. 22

Bank of America Corporation
(Dollars in millions)
Corporate and Total Commercial Investment Bank Other
Net interest income (1) $2,618 $1,651 $1,071 $(104)Noninterest income:
Service charges 683 321 362 - Investment and brokerage services 221 8 213 - Investment banking income 821 20 800 1 Trading account profits 877 8 863 6Gains (losses) on sales of debt securities - - - - All other income 594 463 119 12
Total noninterest income 3,196 820 2,357 19 Total revenue, net of interest expense 5,814 2,471 3,428 (85)
Provision for credit losses 41 37 4 - Noninterest expense 3,135 828 2,230 77
Income before income taxes 2,638 1,606 1,194 (162) Income tax expense (benefit) (1) 968 595 439 (66)
Net income $1,670 $1,011 $755 $(96)
Net interest yield (1) 1.56 % 3.36 % n/m n/mReturn on average equity 16.15 25.57 16.75 % n/mEfficiency ratio (1) 53.91 33.48 65.08 n/mAverage - total loans and leases $253,895 $192,864 $60,010 n/mAverage - total deposits 220,063 86,414 133,126 n/mPeriod end - total assets (2) 728,498 213,837 494,753 n/m
Corporate and Total Commercial Investment Bank Other
Net interest income (1) $2,441 $1,717 $831 $(107)Noninterest income:
Service charges 663 308 354 1 Investment and brokerage services 246 11 236 (1) Investment banking income 644 14 630 - Trading account profits 855 22 812 21Gains (losses) on sales of debt securities (4) - (4) - All other income 470 399 62 9
Total noninterest income 2,874 754 2,090 30 Total revenue, net of interest expense 5,315 2,471 2,921 (77)
Provision for credit losses 22 46 (17) (7) Noninterest expense 2,764 764 1,936 64
Income before income taxes 2,529 1,661 1,002 (134) Income tax expense (benefit) (1) 934 626 372 (64)
Net income $1,595 $1,035 $630 $(70)
Net interest yield (1) 1.65 % 3.73 % n/m n/m Return on average equity 15.09 25.25 13.75 % n/mEfficiency ratio (1) 52.01 30.90 66.24 n/mAverage - total loans and leases $231,073 $181,113 $49,088 n/mAverage - total deposits 193,620 87,935 105,286 n/mPeriod end - total assets (2) 646,861 203,336 424,400 n/m
(1) Fully taxable-equivalent basis(2) Total assets include asset allocations to match liabilities (i.e., deposits).
n/m = not meaningful
Certain prior period amounts have been reclassified among the segments to conform to the current period presentation.
Three Months Ended June 30, 2006
Global Corporate and Investment Banking Business Results: Customer Relationship View
Three Months Ended June 30, 2007
This information is preliminary and based on company data available at the time of the presentation. 23
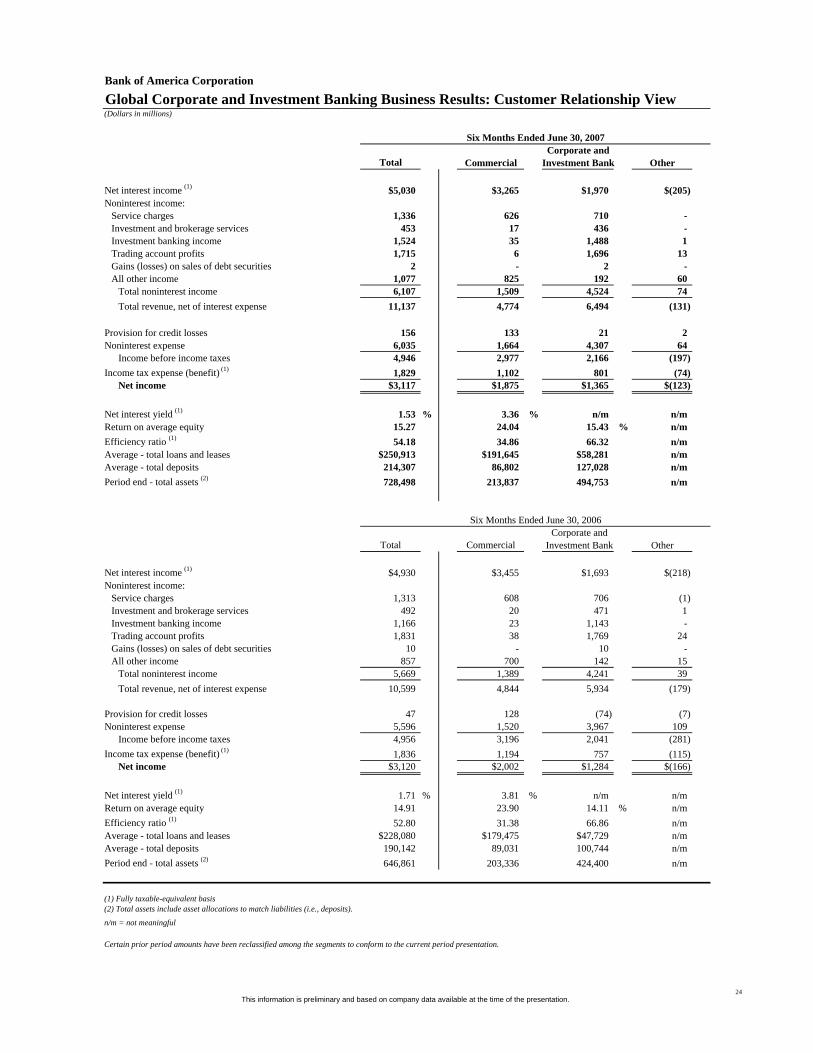
Bank of America Corporation
(Dollars in millions)
Corporate and Total Commercial Investment Bank Other
Net interest income (1) $5,030 $3,265 $1,970 $(205)Noninterest income:
Service charges 1,336 626 710 - Investment and brokerage services 453 17 436 - Investment banking income 1,524 35 1,488 1 Trading account profits 1,715 6 1,696 13Gains (losses) on sales of debt securities 2 - 2 - All other income 1,077 825 192 60
Total noninterest income 6,107 1,509 4,524 74 Total revenue, net of interest expense 11,137 4,774 6,494 (131)
Provision for credit losses 156 133 21 2Noninterest expense 6,035 1,664 4,307 64
Income before income taxes 4,946 2,977 2,166 (197) Income tax expense (benefit) (1) 1,829 1,102 801 (74)
Net income $3,117 $1,875 $1,365 $(123)
Net interest yield (1) 1.53 % 3.36 % n/m n/mReturn on average equity 15.27 24.04 15.43 % n/mEfficiency ratio (1) 54.18 34.86 66.32 n/mAverage - total loans and leases $250,913 $191,645 $58,281 n/mAverage - total deposits 214,307 86,802 127,028 n/mPeriod end - total assets (2) 728,498 213,837 494,753 n/m
Corporate and Total Commercial Investment Bank Other
Net interest income (1) $4,930 $3,455 $1,693 $(218)Noninterest income:
Service charges 1,313 608 706 (1) Investment and brokerage services 492 20 471 1 Investment banking income 1,166 23 1,143 - Trading account profits 1,831 38 1,769 24Gains (losses) on sales of debt securities 10 - 10 - All other income 857 700 142 15
Total noninterest income 5,669 1,389 4,241 39 Total revenue, net of interest expense 10,599 4,844 5,934 (179)
Provision for credit losses 47 128 (74) (7) Noninterest expense 5,596 1,520 3,967 109
Income before income taxes 4,956 3,196 2,041 (281) Income tax expense (benefit) (1) 1,836 1,194 757 (115)
Net income $3,120 $2,002 $1,284 $(166)
Net interest yield (1) 1.71 % 3.81 % n/m n/m Return on average equity 14.91 23.90 14.11 % n/mEfficiency ratio (1) 52.80 31.38 66.86 n/mAverage - total loans and leases $228,080 $179,475 $47,729 n/mAverage - total deposits 190,142 89,031 100,744 n/mPeriod end - total assets (2) 646,861 203,336 424,400 n/m
(1) Fully taxable-equivalent basis(2) Total assets include asset allocations to match liabilities (i.e., deposits).
n/m = not meaningful
Certain prior period amounts have been reclassified among the segments to conform to the current period presentation.
Six Months Ended June 30, 2006
Global Corporate and Investment Banking Business Results: Customer Relationship View
Six Months Ended June 30, 2007
This information is preliminary and based on company data available at the time of the presentation. 24
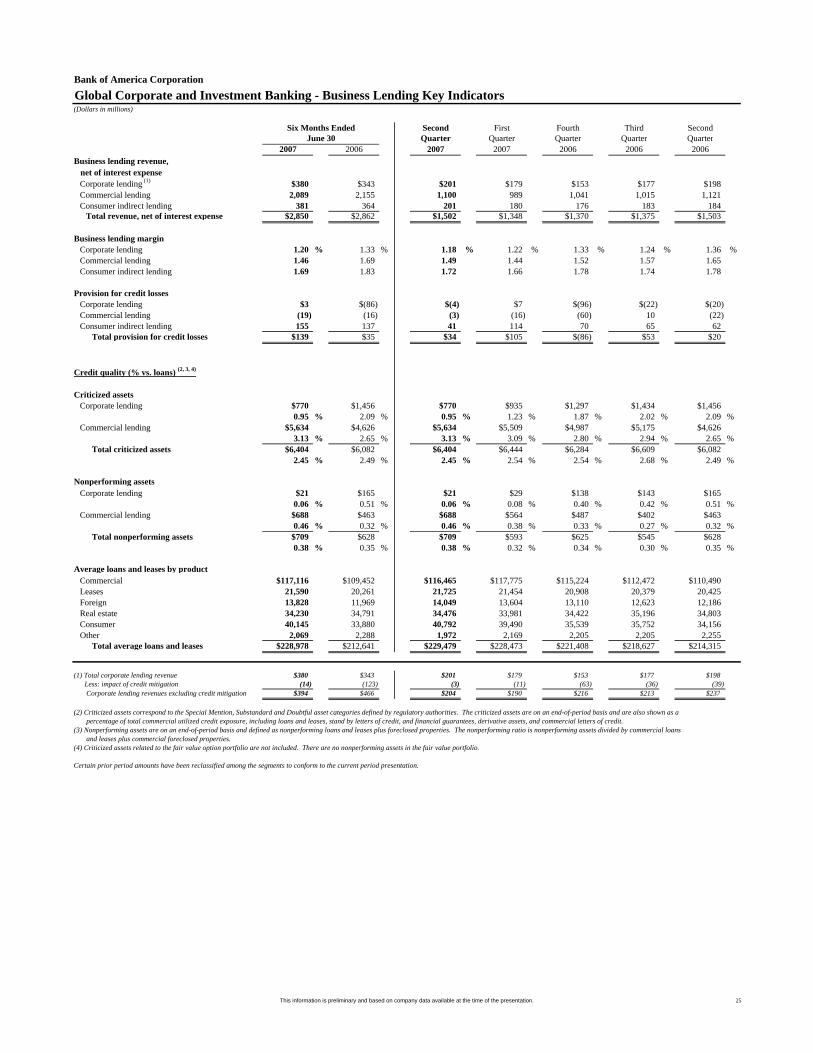
Bank of America Corporation
Global Corporate and Investment Banking - Business Lending Key Indicators(Dollars in millions)
Second First Fourth Third SecondQuarter Quarter Quarter Quarter Quarter
2007 2006 2007 2007 2006 2006 2006Business lending revenue, net of interest expense
Corporate lending (1) $380 $343 $201 $179 $153 $177 $198Commercial lending 2,089 2,155 1,100 989 1,041 1,015 1,121 Consumer indirect lending 381 364 201 180 176 183 184
Total revenue, net of interest expense $2,850 $2,862 $1,502 $1,348 $1,370 $1,375 $1,503
Business lending marginCorporate lending 1.20 % 1.33 % 1.18 % 1.22 % 1.33 % 1.24 % 1.36 %Commercial lending 1.46 1.69 1.49 1.44 1.52 1.57 1.65 Consumer indirect lending 1.69 1.83 1.72 1.66 1.78 1.74 1.78
Provision for credit lossesCorporate lending $3 $(86) $(4) $7 $(96) $(22) $(20)Commercial lending (19) (16) (3) (16) (60) 10 (22) Consumer indirect lending 155 137 41 114 70 65 62
Total provision for credit losses $139 $35 $34 $105 $(86) $53 $20
Credit quality (% vs. loans) (2, 3, 4)
Criticized assetsCorporate lending $770 $1,456 $770 $935 $1,297 $1,434 $1,456
0.95 % 2.09 % 0.95 % 1.23 % 1.87 % 2.02 % 2.09 %Commercial lending $5,634 $4,626 $5,634 $5,509 $4,987 $5,175 $4,626
3.13 % 2.65 % 3.13 % 3.09 % 2.80 % 2.94 % 2.65 %Total criticized assets $6,404 $6,082 $6,404 $6,444 $6,284 $6,609 $6,082
2.45 % 2.49 % 2.45 % 2.54 % 2.54 % 2.68 % 2.49 %
Nonperforming assetsCorporate lending $21 $165 $21 $29 $138 $143 $165
0.06 % 0.51 % 0.06 % 0.08 % 0.40 % 0.42 % 0.51 %Commercial lending $688 $463 $688 $564 $487 $402 $463
0.46 % 0.32 % 0.46 % 0.38 % 0.33 % 0.27 % 0.32 %Total nonperforming assets $709 $628 $709 $593 $625 $545 $628
0.38 % 0.35 % 0.38 % 0.32 % 0.34 % 0.30 % 0.35 %
Average loans and leases by productCommercial $117,116 $109,452 $116,465 $117,775 $115,224 $112,472 $110,490Leases 21,590 20,261 21,725 21,454 20,908 20,379 20,425 Foreign 13,828 11,969 14,049 13,604 13,110 12,623 12,186 Real estate 34,230 34,791 34,476 33,981 34,422 35,196 34,803 Consumer 40,145 33,880 40,792 39,490 35,539 35,752 34,156 Other 2,069 2,288 1,972 2,169 2,205 2,205 2,255
Total average loans and leases $228,978 $212,641 $229,479 $228,473 $221,408 $218,627 $214,315
(1) Total corporate lending revenue $380 $343 $201 $179 $153 $177 $198 Less: impact of credit mitigation (14) (123) (3) (11) (63) (36) (39) Corporate lending revenues excluding credit mitigation $394 $466 $204 $190 $216 $213 $237
(2) Criticized assets correspond to the Special Mention, Substandard and Doubtful asset categories defined by regulatory authorities. The criticized assets are on an end-of-period basis and are also shown as a percentage of total commercial utilized credit exposure, including loans and leases, stand by letters of credit, and financial guarantees, derivative assets, and commercial letters of credit.(3) Nonperforming assets are on an end-of-period basis and defined as nonperforming loans and leases plus foreclosed properties. The nonperforming ratio is nonperforming assets divided by commercial loans and leases plus commercial foreclosed properties.(4) Criticized assets related to the fair value option portfolio are not included. There are no nonperforming assets in the fair value portfolio.
Certain prior period amounts have been reclassified among the segments to conform to the current period presentation.
Six Months EndedJune 30
This information is preliminary and based on company data available at the time of the presentation. 25
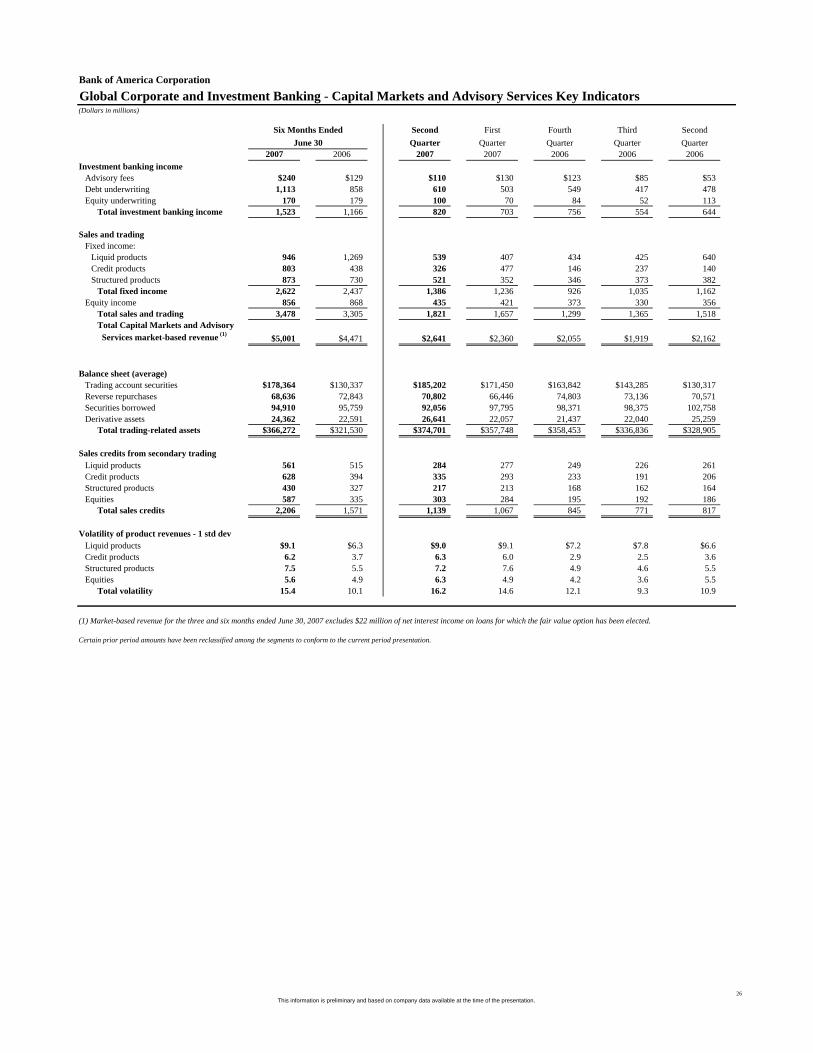
Bank of America Corporation
Global Corporate and Investment Banking - Capital Markets and Advisory Services Key Indicators(Dollars in millions)
Second First Fourth Third SecondQuarter Quarter Quarter Quarter Quarter
2007 2006 2007 2007 2006 2006 2006Investment banking income
Advisory fees $240 $129 $110 $130 $123 $85 $53Debt underwriting 1,113 858 610 503 549 417 478 Equity underwriting 170 179 100 70 84 52 113
Total investment banking income 1,523 1,166 820 703 756 554 644
Sales and tradingFixed income:
Liquid products 946 1,269 539 407 434 425 640 Credit products 803 438 326 477 146 237 140 Structured products 873 730 521 352 346 373 382
Total fixed income 2,622 2,437 1,386 1,236 926 1,035 1,162 Equity income 856 868 435 421 373 330 356
Total sales and trading 3,478 3,305 1,821 1,657 1,299 1,365 1,518 Total Capital Markets and Advisory Services market-based revenue (1) $5,001 $4,471 $2,641 $2,360 $2,055 $1,919 $2,162
Balance sheet (average)Trading account securities $178,364 $130,337 $185,202 $171,450 $163,842 $143,285 $130,317Reverse repurchases 68,636 72,843 70,802 66,446 74,803 73,136 70,571 Securities borrowed 94,910 95,759 92,056 97,795 98,371 98,375 102,758 Derivative assets 24,362 22,591 26,641 22,057 21,437 22,040 25,259
Total trading-related assets $366,272 $321,530 $374,701 $357,748 $358,453 $336,836 $328,905
Sales credits from secondary tradingLiquid products 561 515 284 277 249 226 261 Credit products 628 394 335 293 233 191 206 Structured products 430 327 217 213 168 162 164 Equities 587 335 303 284 195 192 186
Total sales credits 2,206 1,571 1,139 1,067 845 771 817
Volatility of product revenues - 1 std devLiquid products $9.1 $6.3 $9.0 $9.1 $7.2 $7.8 $6.6Credit products 6.2 3.7 6.3 6.0 2.9 2.5 3.6Structured products 7.5 5.5 7.2 7.6 4.9 4.6 5.5Equities 5.6 4.9 6.3 4.9 4.2 3.6 5.5
Total volatility 15.4 10.1 16.2 14.6 12.1 9.3 10.9
(1) Market-based revenue for the three and six months ended June 30, 2007 excludes $22 million of net interest income on loans for which the fair value option has been elected.
Certain prior period amounts have been reclassified among the segments to conform to the current period presentation.
Six Months EndedJune 30
This information is preliminary and based on company data available at the time of the presentation. 26

Bank of America Corporation
Global Corporate & Investment Banking Strategic Progress
Source: Thomson Financial except Syndicated Loans and Leveraged Loans from Loan Pricing Corporation.(1) M&A Announced Advisor Rankings
Highlights
Top 5 rankings in:Syndicated loansLeveraged loansInvestment grade debtAsset-backed securities
Banc of America Securities U.S. Market Share and Product Ranking
17.1%
9.1%
8.2%
8.3%
9.4%
5.1%
5.5%
4.3%
4.4%
18.7%
15.5%
16.3%
10.0%
9.1%
8.3%
5.8%
6.1%
3.2%
4.7%
17.1%
14.2%
13.4%
9.7%
8.9%
7.3%
7.1%
6.3%
3.8%
3.4%
20.9%
0% 5% 10% 15% 20% 25%
YTD 07
YTD 06
FY 2006
Asset-backed securities #4
Common stock underwriting #9
Convertible debt #6
Investment grade debt #3
Leveraged loans #2
U.S. municipal new issuers #10
High-yield debt #7
Syndicated loans #2
Mergers & acquisitions (1) #9
Mortgage-backed securities #6
This information is preliminary and based on company data available at the time of the presentation. 27

Bank of America Corporation
(Dollars in millions, except as noted)
Second First Fourth Third SecondQuarter Quarter Quarter Quarter Quarter
2007 2006 2007 2007 2006 2006 2006Net interest income (2) $1,884 $1,861 $958 $926 $924 $887 $922Noninterest income:
Investment and brokerage services 1,882 1,666 972 910 889 828 852All other income 130 155 78 52 86 63 79
Total noninterest income 2,012 1,821 1,050 962 975 891 931 Total revenue, net of interest expense 3,896 3,682 2,008 1,888 1,899 1,778 1,853
Provision for credit losses 9 (40) (14) 23 2 - (40)Noninterest expense 2,061 1,938 1,044 1,017 1,000 972 971
Income before income taxes 1,826 1,784 978 848 897 806 922 Income tax expense (2) 675 661 359 316 332 297 340
Net income $1,151 $1,123 $619 $532 $565 $509 $582
Net interest yield (2) 3.18 % 3.62 % 3.17 % 3.19 % 3.34 % 3.41 % 3.57 %Return on average equity 23.33 22.52 25.06 21.60 22.15 20.72 24.59 Efficiency ratio (2) 52.89 52.65 51.97 53.87 52.64 54.67 52.40
Balance sheet Average
Total loans and leases $66,908 $58,979 $67,964 $65,841 $63,935 $61,686 $59,803Total earning assets (3) 119,384 103,552 121,095 117,654 109,763 103,313 103,441 Total assets (3) 126,908 111,105 128,563 125,235 117,323 110,787 110,989 Total deposits 116,615 101,140 118,255 114,958 106,325 100,916 101,251 Allocated equity 9,946 10,058 9,910 9,982 10,123 9,743 9,491
Period endTotal loans and leases $69,217 $60,996 $69,217 $66,695 $65,535 $62,736 $60,996Total earning assets (3) 121,833 102,035 121,833 120,725 117,376 104,620 102,035 Total assets (3) 129,544 109,759 129,544 128,547 125,324 112,401 109,759 Total deposits 118,973 100,360 118,973 118,125 113,569 102,251 100,360
Client assetsAssets under management $566,267 $500,144 $566,267 $547,448 $542,977 $517,055 $500,144Client brokerage assets (4) 213,711 186,798 213,711 209,106 203,799 193,699 186,798 Assets in custody 109,360 102,236 109,360 109,163 107,902 100,130 102,236 Less: Client brokerage assets and assets in custody included in assets under management (80,784) (58,686) (80,784) (73,793) (67,509) (64,178) (58,686)
Total net client assets $808,554 $730,492 $808,554 $791,924 $787,169 $746,706 $730,492
(1) Global Wealth and Investment Management services clients through three primary businesses: The Private Bank, Columbia Management, and Premier Banking and Investments. In addition, ALM/Other primarily includes the results of ALM activities. (2) Fully taxable-equivalent basis(3) Total earning assets and total assets include asset allocations to match liabilities (i.e., deposits).(4) Client brokerage assets include non-discretionary brokerage and fee-based assets.
Certain prior period amounts have been reclassified among the segments to conform to the current period presentation.
Global Wealth and Investment Management Segment Results (1)
Six Months EndedJune 30
This information is preliminary and based on company data available at the time of the presentation. 28
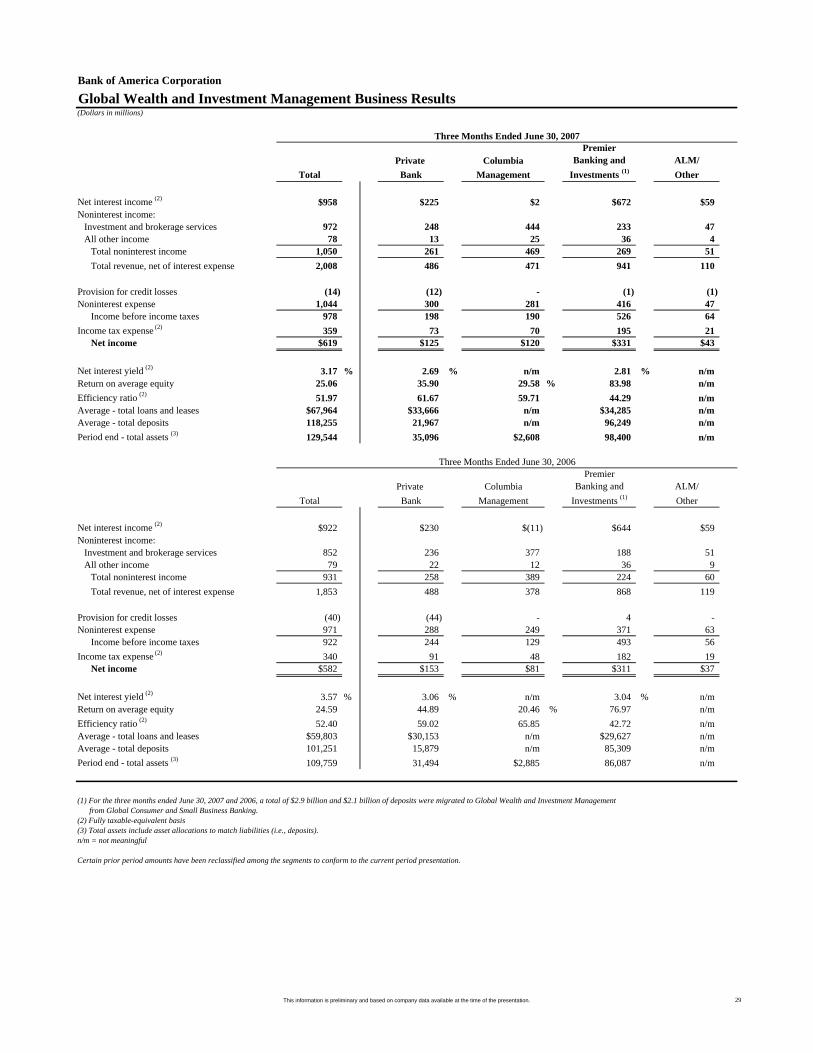
Bank of America Corporation
(Dollars in millions)
PremierPrivate Columbia Banking and ALM/
Total Bank Management Investments (1) Other
Net interest income (2) $958 $225 $2 $672 $59Noninterest income:
Investment and brokerage services 972 248 444 233 47 All other income 78 13 25 36 4
Total noninterest income 1,050 261 469 269 51 Total revenue, net of interest expense 2,008 486 471 941 110
Provision for credit losses (14) (12) - (1) (1) Noninterest expense 1,044 300 281 416 47
Income before income taxes 978 198 190 526 64 Income tax expense (2) 359 73 70 195 21
Net income $619 $125 $120 $331 $43
Net interest yield (2) 3.17 % 2.69 % n/m 2.81 % n/mReturn on average equity 25.06 35.90 29.58 % 83.98 n/mEfficiency ratio (2) 51.97 61.67 59.71 44.29 n/mAverage - total loans and leases $67,964 $33,666 n/m $34,285 n/mAverage - total deposits 118,255 21,967 n/m 96,249 n/mPeriod end - total assets (3) 129,544 35,096 $2,608 98,400 n/m
PremierPrivate Columbia Banking and ALM/
Total Bank Management Investments (1) Other
Net interest income (2) $922 $230 $(11) $644 $59Noninterest income:
Investment and brokerage services 852 236 377 188 51 All other income 79 22 12 36 9
Total noninterest income 931 258 389 224 60 Total revenue, net of interest expense 1,853 488 378 868 119
Provision for credit losses (40) (44) - 4 - Noninterest expense 971 288 249 371 63
Income before income taxes 922 244 129 493 56 Income tax expense (2) 340 91 48 182 19
Net income $582 $153 $81 $311 $37
Net interest yield (2) 3.57 % 3.06 % n/m 3.04 % n/mReturn on average equity 24.59 44.89 20.46 % 76.97 n/mEfficiency ratio (2) 52.40 59.02 65.85 42.72 n/mAverage - total loans and leases $59,803 $30,153 n/m $29,627 n/mAverage - total deposits 101,251 15,879 n/m 85,309 n/mPeriod end - total assets (3) 109,759 31,494 $2,885 86,087 n/m
(1) For the three months ended June 30, 2007 and 2006, a total of $2.9 billion and $2.1 billion of deposits were migrated to Global Wealth and Investment Management from Global Consumer and Small Business Banking.(2) Fully taxable-equivalent basis(3) Total assets include asset allocations to match liabilities (i.e., deposits).n/m = not meaningful
Certain prior period amounts have been reclassified among the segments to conform to the current period presentation.
Global Wealth and Investment Management Business Results
Three Months Ended June 30, 2007
Three Months Ended June 30, 2006
This information is preliminary and based on company data available at the time of the presentation. 29

Bank of America Corporation
(Dollars in millions)
PremierPrivate Columbia Banking and ALM/
Total Bank Management Investments (1) Other
Net interest income (2) $1,884 $448 $3 $1,330 $103Noninterest income:
Investment and brokerage services 1,882 471 867 447 97 All other income 130 24 26 71 9
Total noninterest income 2,012 495 893 518 106 Total revenue, net of interest expense 3,896 943 896 1,848 209
Provision for credit losses 9 9 - - - Noninterest expense 2,061 609 554 826 72
Income before income taxes 1,826 325 342 1,022 137 Income tax expense (2) 675 120 126 378 51
Net income $1,151 $205 $216 $644 $86
Net interest yield (2) 3.18 % 2.72 % n/m 2.83 % n/mReturn on average equity 23.33 29.15 26.28 % 81.15 n/mEfficiency ratio (2) 52.89 64.66 61.83 44.69 n/mAverage - total loans and leases $66,908 $33,192 n/m $33,702 n/mAverage - total deposits 116,615 21,669 n/m 94,904 n/mPeriod end - total assets (3) 129,544 35,096 $2,608 98,400 n/m
PremierPrivate Columbia Banking and ALM/
Total Bank Management Investments (1) Other
Net interest income (2) $1,861 $455 $(21) $1,271 $156Noninterest income:
Investment and brokerage services 1,666 457 741 367 101 All other income 155 58 22 60 15
Total noninterest income 1,821 515 763 427 116 Total revenue, net of interest expense 3,682 970 742 1,698 272
Provision for credit losses (40) (48) - 8 - Noninterest expense 1,938 584 486 765 103
Income before income taxes 1,784 434 256 925 169 Income tax expense (2) 661 161 94 342 64
Net income $1,123 $273 $162 $583 $105
Net interest yield (2) 3.62 % 3.05 % n/m 3.02 % n/mReturn on average equity 22.52 41.14 20.38 % 73.16 n/mEfficiency ratio (2) 52.65 60.21 65.46 45.08 n/mAverage - total loans and leases $58,979 $30,080 n/m $28,878 n/mAverage - total deposits 101,140 15,856 n/m 85,218 n/mPeriod end - total assets (3) 109,759 31,494 $2,885 86,087 n/m
(1) For the six months ended June 30, 2007 and 2006, a total of $6.4 billion and $5.3 billion of deposits were migrated to Global Wealth and Investment Management from Global Consumer and Small Business Banking.(2) Fully taxable-equivalent basis(3) Total assets include asset allocations to match liabilities (i.e., deposits).n/m = not meaningful
Certain prior period amounts have been reclassified among the segments to conform to the current period presentation.
Global Wealth and Investment Management Business Results
Six Months Ended June 30, 2007
Six Months Ended June 30, 2006
This information is preliminary and based on company data available at the time of the presentation. 30

Bank of America Corporation
Global Wealth and Investment Management - Key Indicators(Dollars in millions, except as noted)
Second First Fourth Third SecondQuarter Quarter Quarter Quarter Quarter
2007 2006 2007 2007 2006 2006 2006
Investment and Brokerage Services
The Private BankAsset management fees $457 $444 $240 $217 $211 $211 $228Brokerage income 14 13 8 6 6 6 8
Total $471 $457 $248 $223 $217 $217 $236
Columbia ManagementAsset management fees $865 $739 $443 $422 $416 $373 $376Brokerage income 2 2 1 1 1 1 1
Total $867 $741 $444 $423 $417 $374 $377
Premier Banking and InvestmentsAsset management fees $126 $87 $66 $60 $53 $50 $47Brokerage income 321 280 167 154 149 133 141
Total $447 $367 $233 $214 $202 $183 $188
All OtherAsset management fees $97 $101 $47 $50 $53 $54 $51Brokerage income - - - - - - -
Total $97 $101 $47 $50 $53 $54 $51
Total Global Wealth and Investment ManagementAsset management fees $1,545 $1,371 $796 $749 $733 $688 $702Brokerage income 337 295 176 161 156 140 150
Total investment and brokerage services $1,882 $1,666 $972 $910 $889 $828 $852
Assets Under Management
Assets under management by business:Private Bank $144,054 $132,178 $144,054 $140,521 $139,172 $134,917 $132,178Columbia Management 453,092 394,355 453,092 438,651 433,426 410,781 394,355 Global Products Group (1) 27,043 31,313 27,043 25,481 31,197 31,799 31,313 Premier Banking and Investments 22,183 16,116 22,183 20,312 18,640 16,804 16,116 Eliminations (2) (81,653) (75,981) (81,653) (79,568) (81,435) (79,256) (75,981) International Wealth Management 1,548 2,163 1,548 2,051 1,977 2,010 2,163
Total assets under management $566,267 $500,144 $566,267 $547,448 $542,977 $517,055 $500,144
Assets under management rollforward:Beginning balance $542,977 $482,394 $547,448 $542,977 $517,055 $500,144 $493,930Net flows (1) 8,321 10,367 6,654 1,668 15,108 10,901 10,693Market valuation/other 14,969 7,383 12,165 2,803 10,814 6,010 (4,479)
Ending balance $566,267 $500,144 $566,267 $547,448 $542,977 $517,055 $500,144
Assets under management mix:Money market/other $213,481 $192,325 $213,481 $208,482 $208,549 $198,385 $192,325Fixed income 83,425 83,699 83,425 84,504 86,665 87,125 83,699Equity 269,361 224,120 269,361 254,462 247,763 231,545 224,120
Total assets under management $566,267 $500,144 $566,267 $547,448 $542,977 $517,055 $500,144
Client Brokerage Assets $213,711 $186,798 $213,711 $209,106 $203,799 $193,699 $186,798
Premier Banking and Investments Metrics
Client facing associatesNumber of client managers 2,498 2,196 2,498 2,525 2,420 2,292 2,196 Number of financial advisors 1,888 1,869 1,888 1,927 1,954 1,905 1,869 All other 1,094 1,085 1,094 1,218 1,207 1,093 1,085
Total client facing associates 5,480 5,150 5,480 5,670 5,581 5,290 5,150
Financial Advisor Productivity (3) (in thousands) $216 $184 $114 $102 $98 $91 $95
Total client balances (4) $292,455 $255,909 $292,455 $288,138 $279,659 $265,612 $255,909
Number of Households with Banking and Brokerage Relationships (in thousands ) 256 235 256 248 244 238 235
Private Bank Metrics
Client facing associates 2,105 2,001 2,105 2,144 2,121 2,045 2,001
Total client balances (4) $227,086 $203,761 $227,086 $222,414 $219,911 $206,777 $203,761
Columbia Management Performance Metrics
# of 4 or 5 Star Funds by Morningstar 40 37 40 38 35 36 37
% of Assets Under Management in 4 or 5 Star Rated Funds (5) 51 % 59 % 51 % 58 % 57 % 61 % 59 %
Certain prior period amounts have been reclassified among the segments to conform to the current period presentation.
Six Months EndedJune 30
(1) First quarter 2007 balances were impacted by one large $5.4 billion outflow related to one large institutional client in the Global Products Group.(2) The elimination of client brokerage assets and assets in custody that are also included in assets under management.(3) Financial advisor productivity is defined as full service gross production divided by average number of total financial advisors.(4) Client balances are defined as deposits, assets under management, client brokerage assets and other assets in custody.(5) Results shown are defined by Columbia Management’s calculation using Morningstar’s Overall Rating criteria for 4 & 5 star rating. The assets under management of the Columbia Funds that had a 4 & 5 star rating were totaled then divided by the assets under management of all the funds in the ranking.
This information is preliminary and based on company data available at the time of the presentation. 31

Bank of America Corporation
All Other Results (1)
(Dollars in millions)
Second First Fourth Third SecondQuarter Quarter Quarter Quarter Quarter
2007 2006 2007 2007 2006 2006 2006Net interest income (2) $(3,715) $(2,884) $(1,945) $(1,770) $(1,628) $(1,419) $(1,404)Noninterest income:
Card income 1,397 2,129 676 721 826 841 961 Equity investment gains 2,615 1,148 1,719 896 1,031 687 577 Gains (losses) on sales of debt securities 63 (4) 2 61 9 (480) (5) All other income (313) (418) (255) (58) (120) 634 (159)
Total noninterest income 3,762 2,855 2,142 1,620 1,746 1,682 1,374Total revenue, net of interest expense 47 (29) 197 (150) 118 263 (30)
Provision for credit losses (3) (2,625) (1,440) (1,311) (1,314) (1,136) (920) (784) Merger and restructuring charges 186 292 75 111 244 269 194 All other noninterest expense 208 696 (130) 338 31 116 280
Income before income taxes 2,278 423 1,563 715 979 798 280 Income tax expense (2) 684 134 550 134 262 226 186
Net income $1,594 $289 $1,013 $581 $717 $572 $94
Balance sheet
AverageTotal loans and leases $96,671 $57,983 $101,094 $92,198 $80,663 $85,962 $62,383Total earning assets 213,153 207,468 217,875 208,381 198,849 242,911 212,348 Total assets 265,713 263,791 268,867 262,525 252,391 297,294 267,961 Total deposits 34,329 41,655 31,976 36,706 41,563 48,629 43,820
Period endTotal loans and leases $107,429 $86,429 $107,429 $97,085 $90,594 $76,399 $86,429Total earning assets 223,924 239,351 223,924 203,563 200,968 190,479 239,351 Total assets 274,122 292,423 274,122 252,045 252,836 273,836 292,423 Total deposits 31,687 46,017 31,687 29,653 38,704 39,258 46,017
(1) All Other consists of equity investment activities including Principal Investing, Corporate Investments and Strategic Investments, the residual impacts of the allowance for credit losses and the cost allocation processes, merger and restructuring charges, intersegment eliminations, and the results of certain businesses that are expected to be or have been sold or liquidated. All Other also includes certain amounts associated with ALM activities, including the residual impact of funds transfer pricing allocation methodologies, amounts associated with the change in the value of derivatives used as economic hedges of interest rate and foreign exchange rate fluctuations that do not qualify for SFAS No. 133 “Accounting for Derivative instruments and Hedging Activities, as amended” hedge accounting treatment, certain gains or losses on sales of whole mortgage loans, and gains (losses) on sales of debt securities. In addition, All Other includes the offsetting securitization impact to present Global Consumer and Small Business Banking on a managed basis. (See Exhibit A: Non-GAAP Reconciliations - All Other - Reconciliation on page 42).(2) Fully taxable-equivalent basis(3) Represents the provision for credit losses in All Other combined with the Global Consumer and Small Business Banking securitization offset.
Components of Equity Investment Gains(Dollars in millions)
Second First Fourth Third SecondQuarter Quarter Quarter Quarter Quarter
2007 2006 2007 2007 2006 2006 2006
Principal Investing $1,825 $743 $1,250 $575 $547 $604 $417Corporate and Strategic Investments 790 405 469 321 484 83 160
Total equity investment gains included in All Other 2,615 1,148 1,719 896 1,031 687 577
Total equity investment gains included in the business segments 228 269 110 118 36 18 122
Total consolidated equity investment gains $2,843 $1,417 $1,829 $1,014 $1,067 $705 $699
Certain prior period amounts have been reclassified among the segments to conform to the current period presentation.
Six Months EndedJune 30
Six Months EndedJune 30
This information is preliminary and based on company data available at the time of the presentation. 32

Bank of America Corporation
Outstanding Loans and Leases(Dollars in millions)
June 30 March 31 Increase2007 2007 (Decrease)
ConsumerResidential mortgage $269,721 $254,845 $14,876Credit card - domestic 57,036 54,490 2,546 Credit card - foreign 12,205 11,430 775 Home equity 96,467 91,723 4,744 Direct/Indirect consumer 66,181 62,126 4,055 Other consumer (1) 8,041 8,189 (148)
Total consumer 509,651 482,803 26,848
CommercialCommercial - domestic 164,620 160,190 4,430 Commercial real estate (2) 36,950 36,022 928 Commercial lease financing 20,053 19,988 65 Commercial - foreign 23,755 20,771 2,984
Total commercial loans measured at historical cost 245,378 236,971 8,407 Commercial loans measured at fair value (3) 3,606 3,859 (253)
Total commercial 248,984 240,830 8,154 Total loans and leases $758,635 $723,633 $35,002
(1) Includes foreign consumer loans of $4.7 billion and $4.7 billion, and consumer finance loans of $3.3 billion and $3.5 billion at June 30, 2007 and March 31, 2007.(2) Includes domestic commercial real estate loans of $36.2 billion and $35.4 billion, and foreign commercial real estate loans of $674 million and $606 million at June 30, 2007 and March 31, 2007. (3) Certain commercial loans are measured at fair value in accordance with SFAS 159 and include commercial - domestic loans of $2.61 billion and $2.75 billion, commercial - foreign loans of $795 million and $932 million, and commercial real estate loans of $198 million and $179 million at June 30, 2007 and March 31, 2007.
Certain prior period amounts have been reclassified to conform to current period presentation.
This information is preliminary and based on company data available at the time of the presentation. 33
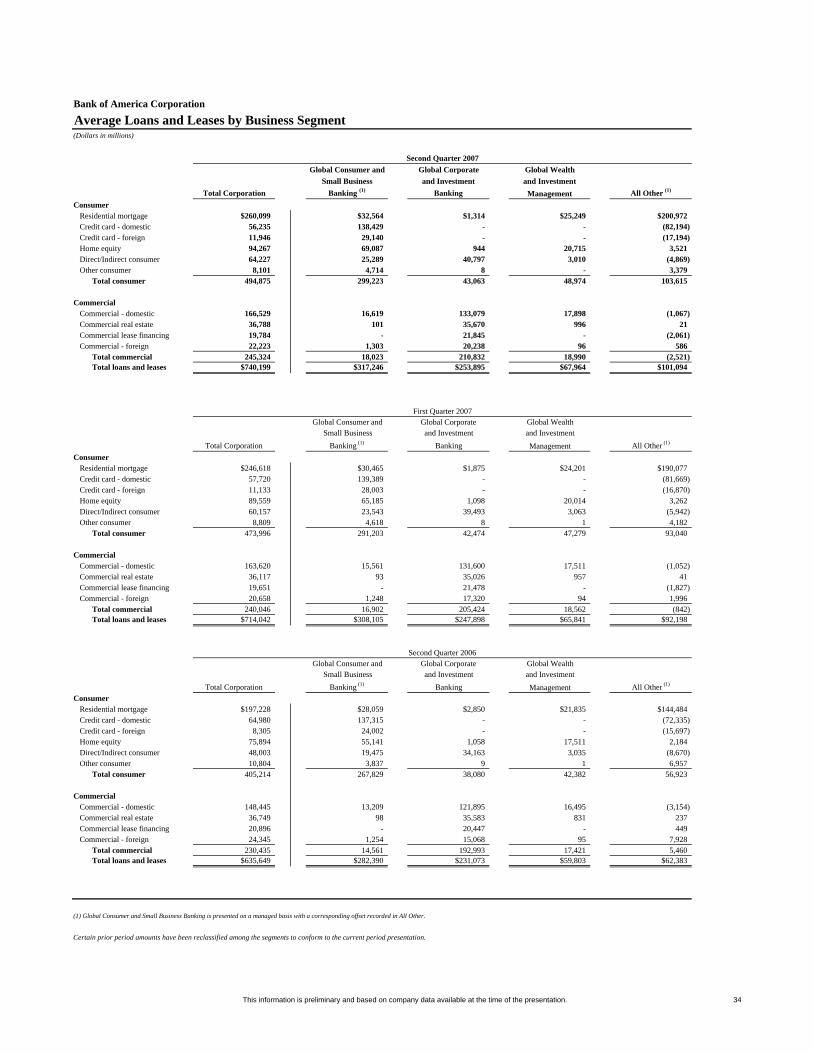
Bank of America Corporation
Average Loans and Leases by Business Segment(Dollars in millions)
Global Consumer and Global Corporate Global WealthSmall Business and Investment and Investment
Total Corporation Banking (1) Banking Management All Other (1)
ConsumerResidential mortgage $260,099 $32,564 $1,314 $25,249 $200,972Credit card - domestic 56,235 138,429 - - (82,194) Credit card - foreign 11,946 29,140 - - (17,194) Home equity 94,267 69,087 944 20,715 3,521 Direct/Indirect consumer 64,227 25,289 40,797 3,010 (4,869) Other consumer 8,101 4,714 8 - 3,379
Total consumer 494,875 299,223 43,063 48,974 103,615
CommercialCommercial - domestic 166,529 16,619 133,079 17,898 (1,067) Commercial real estate 36,788 101 35,670 996 21 Commercial lease financing 19,784 - 21,845 - (2,061) Commercial - foreign 22,223 1,303 20,238 96 586
Total commercial 245,324 18,023 210,832 18,990 (2,521) Total loans and leases $740,199 $317,246 $253,895 $67,964 $101,094
Global Consumer and Global Corporate Global WealthSmall Business and Investment and Investment
Total Corporation Banking (1) Banking Management All Other (1)
ConsumerResidential mortgage $246,618 $30,465 $1,875 $24,201 $190,077Credit card - domestic 57,720 139,389 - - (81,669) Credit card - foreign 11,133 28,003 - - (16,870) Home equity 89,559 65,185 1,098 20,014 3,262 Direct/Indirect consumer 60,157 23,543 39,493 3,063 (5,942) Other consumer 8,809 4,618 8 1 4,182
Total consumer 473,996 291,203 42,474 47,279 93,040
CommercialCommercial - domestic 163,620 15,561 131,600 17,511 (1,052) Commercial real estate 36,117 93 35,026 957 41 Commercial lease financing 19,651 - 21,478 - (1,827) Commercial - foreign 20,658 1,248 17,320 94 1,996
Total commercial 240,046 16,902 205,424 18,562 (842) Total loans and leases $714,042 $308,105 $247,898 $65,841 $92,198
Global Consumer and Global Corporate Global WealthSmall Business and Investment and Investment
Total Corporation Banking (1) Banking Management All Other (1)
ConsumerResidential mortgage $197,228 $28,059 $2,850 $21,835 $144,484Credit card - domestic 64,980 137,315 - - (72,335) Credit card - foreign 8,305 24,002 - - (15,697) Home equity 75,894 55,141 1,058 17,511 2,184 Direct/Indirect consumer 48,003 19,475 34,163 3,035 (8,670) Other consumer 10,804 3,837 9 1 6,957
Total consumer 405,214 267,829 38,080 42,382 56,923
CommercialCommercial - domestic 148,445 13,209 121,895 16,495 (3,154) Commercial real estate 36,749 98 35,583 831 237 Commercial lease financing 20,896 - 20,447 - 449 Commercial - foreign 24,345 1,254 15,068 95 7,928
Total commercial 230,435 14,561 192,993 17,421 5,460 Total loans and leases $635,649 $282,390 $231,073 $59,803 $62,383
(1) Global Consumer and Small Business Banking is presented on a managed basis with a corresponding offset recorded in All Other.
Certain prior period amounts have been reclassified among the segments to conform to the current period presentation.
Second Quarter 2007
First Quarter 2007
Second Quarter 2006
This information is preliminary and based on company data available at the time of the presentation. 34
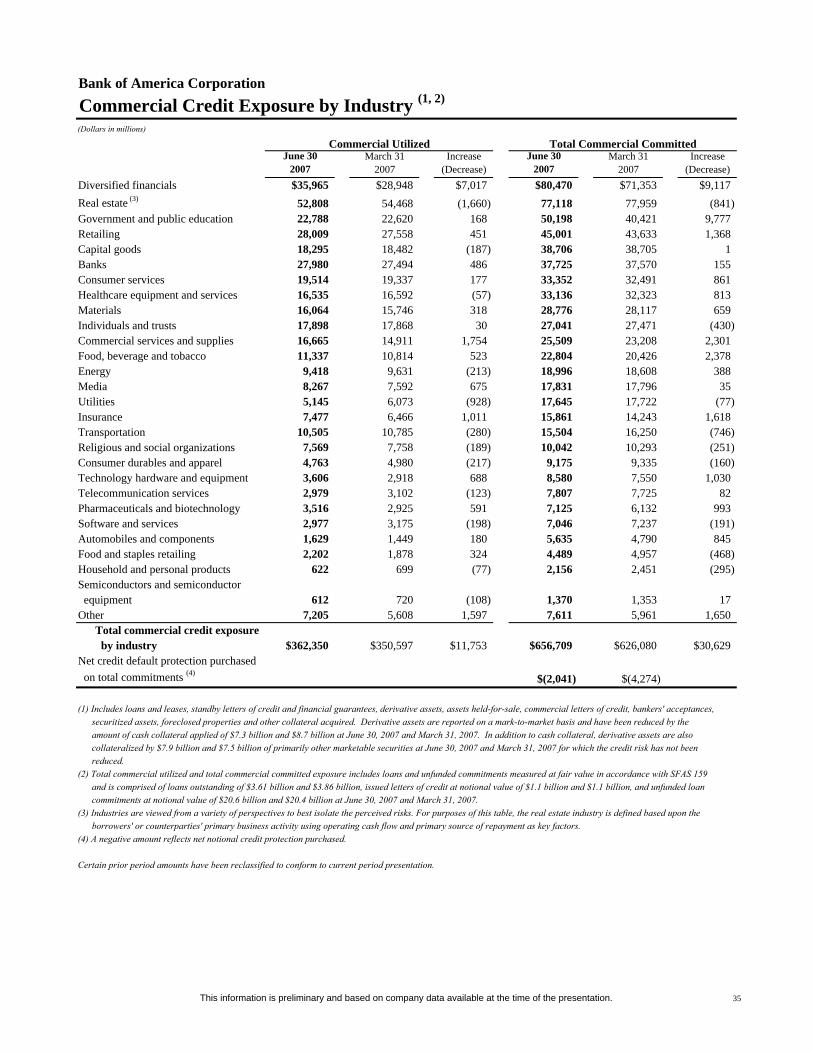
Bank of America CorporationCommercial Credit Exposure by Industry (1, 2)
(Dollars in millions)
June 30 2007
March 31 2007
Increase (Decrease)
June 30 2007
March 31 2007
Increase (Decrease)
Diversified financials $35,965 $28,948 $7,017 $80,470 $71,353 $9,117Real estate (3) 52,808 54,468 (1,660) 77,118 77,959 (841) Government and public education 22,788 22,620 168 50,198 40,421 9,777 Retailing 28,009 27,558 451 45,001 43,633 1,368 Capital goods 18,295 18,482 (187) 38,706 38,705 1 Banks 27,980 27,494 486 37,725 37,570 155 Consumer services 19,514 19,337 177 33,352 32,491 861 Healthcare equipment and services 16,535 16,592 (57) 33,136 32,323 813 Materials 16,064 15,746 318 28,776 28,117 659 Individuals and trusts 17,898 17,868 30 27,041 27,471 (430) Commercial services and supplies 16,665 14,911 1,754 25,509 23,208 2,301 Food, beverage and tobacco 11,337 10,814 523 22,804 20,426 2,378 Energy 9,418 9,631 (213) 18,996 18,608 388 Media 8,267 7,592 675 17,831 17,796 35 Utilities 5,145 6,073 (928) 17,645 17,722 (77) Insurance 7,477 6,466 1,011 15,861 14,243 1,618 Transportation 10,505 10,785 (280) 15,504 16,250 (746) Religious and social organizations 7,569 7,758 (189) 10,042 10,293 (251) Consumer durables and apparel 4,763 4,980 (217) 9,175 9,335 (160) Technology hardware and equipment 3,606 2,918 688 8,580 7,550 1,030 Telecommunication services 2,979 3,102 (123) 7,807 7,725 82 Pharmaceuticals and biotechnology 3,516 2,925 591 7,125 6,132 993 Software and services 2,977 3,175 (198) 7,046 7,237 (191) Automobiles and components 1,629 1,449 180 5,635 4,790 845 Food and staples retailing 2,202 1,878 324 4,489 4,957 (468) Household and personal products 622 699 (77) 2,156 2,451 (295) Semiconductors and semiconductor equipment 612 720 (108) 1,370 1,353 17 Other 7,205 5,608 1,597 7,611 5,961 1,650
Total commercial credit exposure by industry $362,350 $350,597 $11,753 $656,709 $626,080 $30,629
Net credit default protection purchased on total commitments (4) $(2,041) $(4,274)
(1) Includes loans and leases, standby letters of credit and financial guarantees, derivative assets, assets held-for-sale, commercial letters of credit, bankers' acceptances, securitized assets, foreclosed properties and other collateral acquired. Derivative assets are reported on a mark-to-market basis and have been reduced by the amount of cash collateral applied of $7.3 billion and $8.7 billion at June 30, 2007 and March 31, 2007. In addition to cash collateral, derivative assets are also collateralized by $7.9 billion and $7.5 billion of primarily other marketable securities at June 30, 2007 and March 31, 2007 for which the credit risk has not been reduced.(2) Total commercial utilized and total commercial committed exposure includes loans and unfunded commitments measured at fair value in accordance with SFAS 159 and is comprised of loans outstanding of $3.61 billion and $3.86 billion, issued letters of credit at notional value of $1.1 billion and $1.1 billion, and unfunded loan commitments at notional value of $20.6 billion and $20.4 billion at June 30, 2007 and March 31, 2007.(3) Industries are viewed from a variety of perspectives to best isolate the perceived risks. For purposes of this table, the real estate industry is defined based upon the borrowers' or counterparties' primary business activity using operating cash flow and primary source of repayment as key factors. (4) A negative amount reflects net notional credit protection purchased.
Certain prior period amounts have been reclassified to conform to current period presentation.
Commercial Utilized Total Commercial Committed
This information is preliminary and based on company data available at the time of the presentation. 35

Bank of America CorporationNet Credit Default Protection by Maturity Profile
June 30 March 312007 2007
Less than or equal to one year 17 % 2 %Greater than one year and less than or equal to five years 37 55Greater than five years 46 43
Total net credit default protection 100 % 100 %
Net Credit Default Protection by Credit Exposure Debt Rating (1)
(Dollars in millions)
Ratings Net Notional Percent Net Notional Percent
AAA $6 (0.3) % $6 (0.1) %AA 36 (1.8) (102) 2.4 A (598) 29.3 (1,853) 43.4 BBB (459) 22.5 (1,874) 43.8 BB (538) 26.4 (524) 12.3 B (127) 6.2 (147) 3.4 CCC and below (55) 2.7 (85) 2.0 NR (2) (306) 15.0 305 (7.2)
Total net credit default protection $(2,041) 100.0 % $(4,274) 100.0 %
(1) In order to mitigate the cost of purchasing credit protection, credit exposure can be added by selling credit protection. The distribution of debt rating for net notional credit default protection purchased is shown as a negative and the net notional credit protection sold is shown as a positive amount.(2) In addition to unrated names, "NR" includes $(286) million and $301 million in net credit default swaps index positions at June 30, 2007 and March 31, 2007. While index positions are principally investment grade, credit default swaps indices include names in and across each of the ratings categories.
Certain prior period amounts have been reclassified to conform to current period presentation.
June 30, 2007 March 31, 2007
This information is preliminary and based on company data available at the time of the presentation. 36
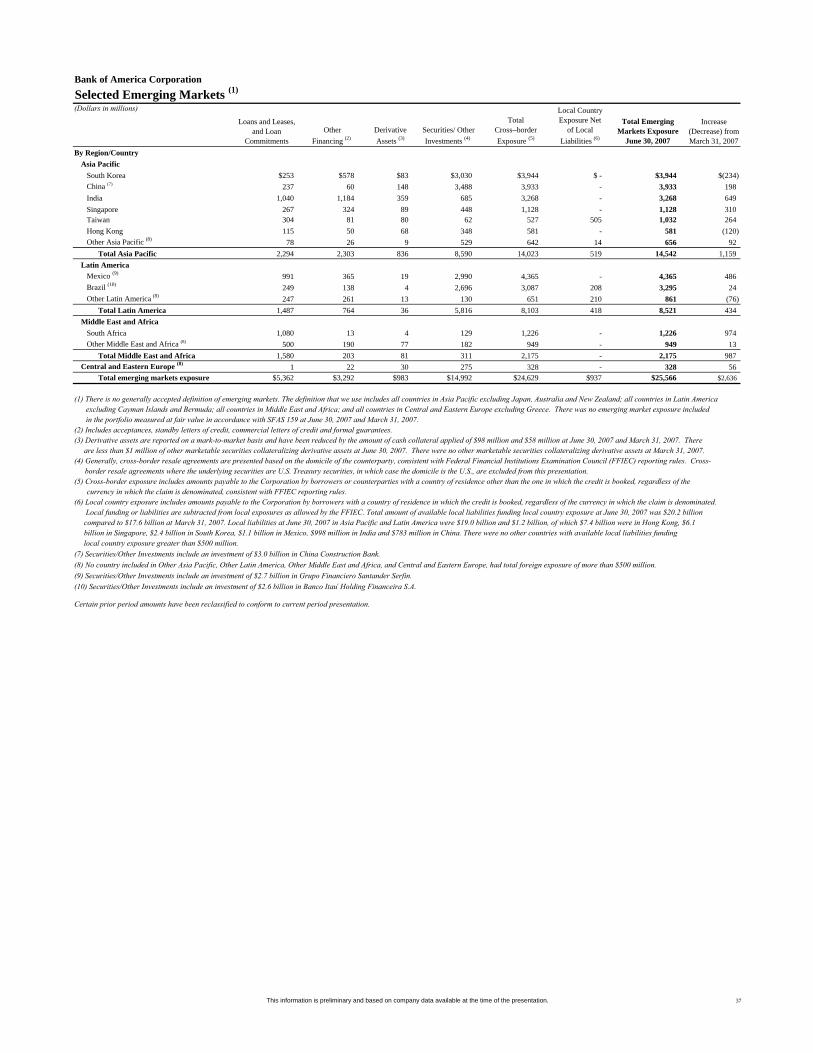
Bank of America Corporation Selected Emerging Markets (1)
(Dollars in millions)
Loans and Leases, and Loan
Commitments Other
Financing (2)Derivative Assets (3)
Securities/ Other Investments (4)
Total Cross–border Exposure (5)
Local Country Exposure Net
of Local Liabilities (6)
Total Emerging Markets Exposure
June 30, 2007
Increase (Decrease) from March 31, 2007
By Region/CountryAsia Pacific
South Korea $253 $578 $83 $3,030 $3,944 $ - $3,944 $(234)China (7) 237 60 148 3,488 3,933 - 3,933 198 India 1,040 1,184 359 685 3,268 - 3,268 649 Singapore 267 324 89 448 1,128 - 1,128 310 Taiwan 304 81 80 62 527 505 1,032 264 Hong Kong 115 50 68 348 581 - 581 (120) Other Asia Pacific (8) 78 26 9 529 642 14 656 92
Total Asia Pacific 2,294 2,303 836 8,590 14,023 519 14,542 1,159Latin America
Mexico (9) 991 365 19 2,990 4,365 - 4,365 486 Brazil (10) 249 138 4 2,696 3,087 208 3,295 24 Other Latin America (8) 247 261 13 130 651 210 861 (76)
Total Latin America 1,487 764 36 5,816 8,103 418 8,521 434Middle East and Africa
South Africa 1,080 13 4 129 1,226 - 1,226 974 Other Middle East and Africa (8) 500 190 77 182 949 - 949 13
Total Middle East and Africa 1,580 203 81 311 2,175 - 2,175 987Central and Eastern Europe (8) 1 22 30 275 328 - 328 56
Total emerging markets exposure $5,362 $3,292 $983 $14,992 $24,629 $937 $25,566 $2,636
(1) There is no generally accepted definition of emerging markets. The definition that we use includes all countries in Asia Pacific excluding Japan, Australia and New Zealand; all countries in Latin America excluding Cayman Islands and Bermuda; all countries in Middle East and Africa; and all countries in Central and Eastern Europe excluding Greece. There was no emerging market exposure included in the portfolio measured at fair value in accordance with SFAS 159 at June 30, 2007 and March 31, 2007.(2) Includes acceptances, standby letters of credit, commercial letters of credit and formal guarantees.(3) Derivative assets are reported on a mark-to-market basis and have been reduced by the amount of cash collateral applied of $98 million and $58 million at June 30, 2007 and March 31, 2007. There are less than $1 million of other marketable securities collateralizing derivative assets at June 30, 2007. There were no other marketable securities collateralizing derivative assets at March 31, 2007.(4) Generally, cross-border resale agreements are presented based on the domicile of the counterparty, consistent with Federal Financial Institutions Examination Council (FFIEC) reporting rules. Cross-
border resale agreements where the underlying securities are U.S. Treasury securities, in which case the domicile is the U.S., are excluded from this presentation.(5) Cross-border exposure includes amounts payable to the Corporation by borrowers or counterparties with a country of residence other than the one in which the credit is booked, regardless of the
currency in which the claim is denominated, consistent with FFIEC reporting rules.(6) Local country exposure includes amounts payable to the Corporation by borrowers with a country of residence in which the credit is booked, regardless of the currency in which the claim is denominated. Local funding or liabilities are subtracted from local exposures as allowed by the FFIEC. Total amount of available local liabilities funding local country exposure at June 30, 2007 was $20.2 billion compared to $17.6 billion at March 31, 2007. Local liabilities at June 30, 2007 in Asia Pacific and Latin America were $19.0 billion and $1.2 billion, of which $7.4 billion were in Hong Kong, $6.1 billion in Singapore, $2.4 billion in South Korea, $1.1 billion in Mexico, $998 million in India and $783 million in China. There were no other countries with available local liabilities funding local country exposure greater than $500 million.(7) Securities/Other Investments include an investment of $3.0 billion in China Construction Bank.(8) No country included in Other Asia Pacific, Other Latin America, Other Middle East and Africa, and Central and Eastern Europe, had total foreign exposure of more than $500 million.(9) Securities/Other Investments include an investment of $2.7 billion in Grupo Financiero Santander Serfin.(10) Securities/Other Investments include an investment of $2.6 billion in Banco Itau Holding Financeira S.A.
Certain prior period amounts have been reclassified to conform to current period presentation.
This information is preliminary and based on company data available at the time of the presentation. 37

Bank of America Corporation
Nonperforming Assets(Dollars in millions)
June 30 March 31 December 31 September 30 June 302007 2007 2006 2006 2006
Residential mortgage $867 $732 $660 $599 $537Home equity (1) 496 363 291 211 167 Direct/Indirect consumer (1) 3 2 2 1 2 Other consumer 94 133 77 86 99
Total consumer 1,460 1,230 1,030 897 805 Commercial - domestic (2) 500 501 584 544 606Commercial real estate 280 189 118 68 59 Commercial lease financing 27 21 42 35 43 Commercial - foreign 17 29 13 36 54
Total commercial 824 740 757 683 762 Total nonperforming loans and leases 2,284 1,970 1,787 1,580 1,567
Foreclosed properties 108 89 69 76 74 Total nonperforming assets (3, 4) $2,392 $2,059 $1,856 $1,656 $1,641
Loans past due 90 days or more and still accruing (4, 5) $2,798 $2,870 $3,056 $2,719 $2,433Nonperforming assets / Total assets (6) 0.16 % 0.14 % 0.13 % 0.11 % 0.11 %Nonperforming assets / Total loans, leases and foreclosed properties (6) 0.32 0.29 0.26 0.25 0.25 Nonperforming loans and leases / Total loans and leases (6) 0.30 0.27 0.25 0.24 0.23
Allowance for credit losses:Allowance for loan and lease losses $9,060 $8,732 $9,016 $8,872 $9,080Reserve for unfunded lending commitments 376 374 397 388 395
Total allowance for credit losses $9,436 $9,106 $9,413 $9,260 $9,475
Allowance for loan and lease losses / Total loans and leases measured at historical cost (6) 1.20 % 1.21 % 1.28 % 1.33 % 1.36 %
Allowance for loan and lease losses / Total nonperforming loans and leases measured at historical cost 397 443 505 562 579
Commercial criticized exposure (7) $7,187 $7,119 $7,061 $7,257 $6,925Commercial criticized exposure / Commercial utilized exposure (7) 2.17 % 2.24 % 2.20 % 2.29 % 2.19 %
(1) Home equity nonperforming loan balances of $42 million, $36 million and $33 million at December 31, 2006, September 30, 2006 and June 30, 2006, respectively, have been reclassified to home equity from direct/indirect to conform to the current period presentation. (2) Includes nonperforming small business loans of $101 million, $97 million, $79 million, $53 million and $55 million at June 30, 2007, March 31, 2007, December 31, 2006, September 30, 2006 and June 30, 2006, respectively.(3) Balances do not include nonperforming loans held-for-sale included in other assets of $73 million, $94 million, $80 million, $99 million and $114 million at June 30, 2007, March 31, 2007, December 31, 2006, September 30, 2006 and June 30, 2006, respectively.(4) Balances do not include loans measured at fair value in accordance with SFAS 159. At June 30, 2007 and March 31, 2007 there were no nonperforming loans or loans past due 90 days or more and still accruing interest measured under fair value in accordance with SFAS 159.(5) Balances do not include loans held-for-sale past due 90 days or more and still accruing interest included in other assets of $23 million and $107 million at September 30, 2006 and June 30, 2006.(6) Ratios do not include loans measured at fair value in accordance with SFAS 159 of $3.61 billion and $3.86 billion at June 30, 2007 and March 31, 2007.(7) Criticized exposure and ratios exclude assets held-for-sale and exposure measured at fair value in accordance with SFAS 159. Including assets held-for-sale and commercial loans measured at fair value, the ratios would have been 2.29 percent and 2.44 percent at June 30, 2007 and March 31, 2007. Including assets held-for-sale, the ratios would have been 2.24 percent, 2.22 percent and 2.17 percent at December 31, 2006, September 30, 2006 and June 30, 2006, respectively.
Loans are classified as domestic or foreign based upon the domicile of the borrower.
Certain prior period amounts have been reclassified to conform to current period presentation.
This information is preliminary and based on company data available at the time of the presentation. 38

Bank of America Corporation
Quarterly Net Charge-offs/Losses and Net Charge-off/Loss Ratios (1)
(Dollars in millions)
Held Basis Amount Percent Amount Percent Amount Percent Amount Percent Amount Percent
Residential mortgage $11 0.02 % $6 0.01 % $9 0.02 % $6 0.01 % $14 0.03 %Credit card - domestic 807 5.76 806 5.66 884 5.86 853 5.42 723 4.46
Credit card - foreign 86 2.88 88 3.22 79 3.03 70 2.94 57 2.72
Home equity 28 0.12 17 0.08 19 0.09 11 0.06 12 0.06
Direct/Indirect consumer 241 1.50 235 1.59 190 1.41 152 1.17 103 0.86
Other consumer 100 4.96 92 4.22 101 3.78 85 3.03 75 2.80
Total consumer 1,273 1.03 1,244 1.06 1,282 1.14 1,177 1.07 984 0.97
Commercial - domestic (4) 228 0.55 184 0.46 123 0.31 111 0.29 50 0.14
Commercial real estate (1) (0.01) 3 0.03 1 0.01 2 0.02 1 -
Commercial lease financing (11) (0.21) (1) (0.03) 12 0.22 - - (17) (0.33)
Commercial - foreign 6 0.10 (3) (0.05) (1) (0.02) (13) (0.21) 5 0.08
Total commercial 222 0.36 183 0.31 135 0.22 100 0.17 39 0.07 Total net charge-offs $1,495 0.81 $1,427 0.81 $1,417 0.82 $1,277 0.75 $1,023 0.65
By Business Segment
Global Consumer and Small Business Banking (5) $2,662 3.37 % $2,433 3.20 % $2,336 3.09 % $2,109 2.87 % $1,759 2.50 %
Global Corporate and Investment Banking 74 0.12 102 0.17 85 0.14 82 0.14 38 0.07
Global Wealth and Investment Management 4 0.03 18 0.11 2 0.01 - - (43) (0.29)
All Other (5) (1,245) (4.94) (1,126) (4.95) (1,006) (4.95) (914) (4.22) (731) (4.71)Total net charge-offs $1,495 0.81 $1,427 0.81 $1,417 0.82 $1,277 0.75 $1,023 0.65
Supplemental managed basis data
Credit card - domestic $1,786 5.17 % $1,651 4.80 % $1,615 4.61 % $1,479 4.23 % $1,227 3.58 %
Credit card - foreign 313 4.31 302 4.37 291 4.30 269 4.17 247 4.13 Total credit card managed net losses $2,099 5.02 $1,953 4.73 $1,906 4.56 $1,748 4.23 $1,474 3.67
Total commercial 222 0.36 183 0.31 135 0.22 107 0.18 52 0.09
Total managed losses 2,766 1.30 2,572 1.26 2,453 1.23 2,195 1.11 1,811 0.98
(1) Net charge-off/loss ratios are calculated as annualized held net charge-offs or managed net losses divided by average outstanding held or managed loans and leases measured at historical cost during the period for each loan and lease category.(2) Net charge-offs include the impact of SOP 03-3 which decreased net charge-offs on credit card - domestic $11 million, $10 million and $7 million, credit card - foreign $4 million, $5 million and $6 million, direct/indirect consumer $6 million, $5 million and $7 million, other consumer $4 million, $6 million and $3 million, and commercial - domestic $0, $0 and $4 million for the three months ended December 31, 2006, September 30, 2006 and June 30, 2006, respectively. The impact of SOP 03-3 was not material for the quarters ended June 30, 2007 and March 31, 2007. Refer to Exhibit A on page 43 for a reconciliation of net charge-offs and net charge-off ratios to net charge-offs and net charge-off ratios excluding the impact of SOP 03-3.(3) Historical ratios have been adjusted for home equity and direct/indirect consumer due to the reclassification of home equity loan balances from direct/indirect to home equity. The impact on net charge-offs was not material.(4) Includes small business net charge-offs of $196 million, $159 million, $115 million, $99 million and $83 million for the three months ended June 30, 2007, March 31, 2007, December 31, 2006, September 30, 2006 and June 30, 2006, or 5.23 percent, 4.59 percent, 3.44 percent, 3.16 percent and 2.84 percent of average outstanding held small business loans, respectively. Excluding the small business portfolio, the net charge-off ratio for commercial - domestic loans would have been 0.08 percent, 0.07 percent, 0.02 percent, 0.03 percent and (0.09) percent for the three months ended June 30, 2007, March 31, 2007, December 31, 2006, September 30, 2006 and June 30, 2006, respectively.(5) Global Consumer and Small Business Banking is presented on a managed basis, specifically Card Services. The securitization offset is included within All Other.
Loans are classified as domestic or foreign based upon the domicile of the borrower.
Certain prior period amounts have been reclassified to conform to current period presentation.
SecondThirdFirst Fourth
2006 (2, 3)Quarter
2006 (2, 3)Quarter
2006 (2, 3)Quarter
SecondQuarter
2007Quarter
2007
(Dollars in millions)(Dollars in millions)
Net Charge-offs
$1,023
$1,277
$1,417 $1,427
$1,495
0.81%0.81%0.82%
0.75%
0.65%
$-
$200
$400
$600
$800
$1,000
$1,200
$1,400
$1,600
$1,800
2Q06 3Q06 4Q06 1Q07 2Q070.00%
0.20%
0.40%
0.60%
0.80%
1.00%
1.20%
1.40%
Total Net Charge-offs Net Charge-off Ratios
This information is preliminary and based on company data available at the time of the presentation. 39
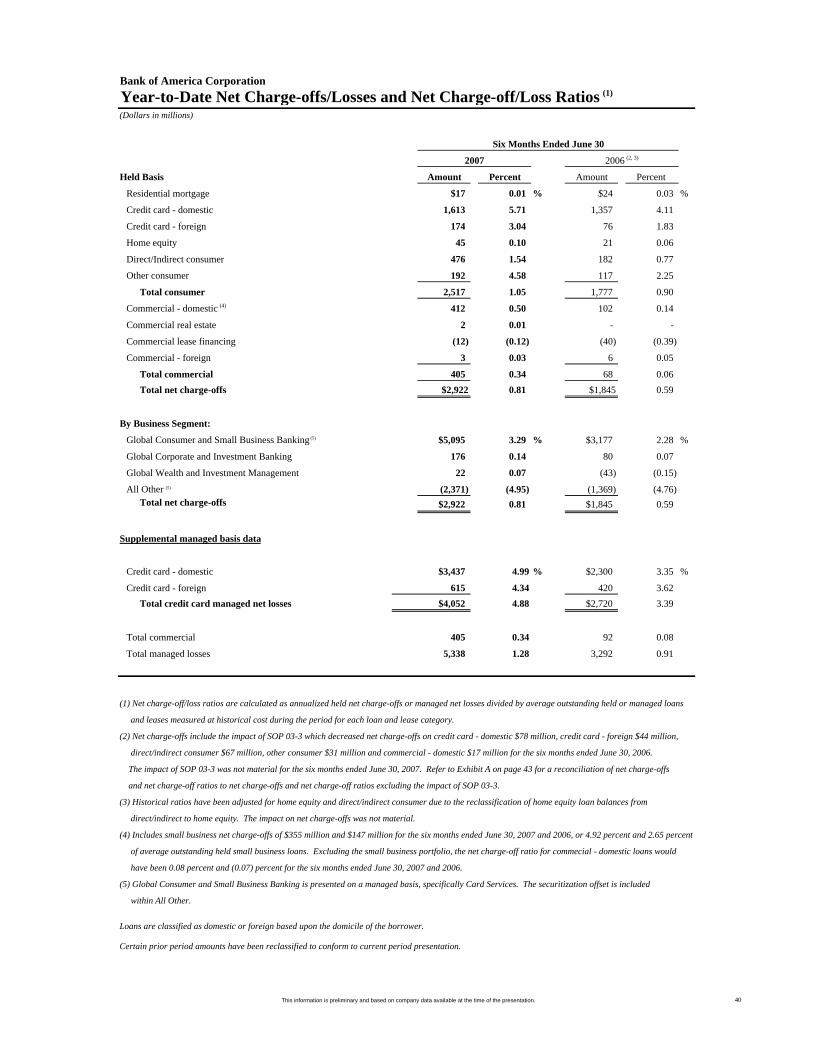
Bank of America CorporationYear-to-Date Net Charge-offs/Losses and Net Charge-off/Loss Ratios (1)
(Dollars in millions)
Held Basis Amount Percent Amount Percent
Residential mortgage $17 0.01 % $24 0.03 %
Credit card - domestic 1,613 5.71 1,357 4.11
Credit card - foreign 174 3.04 76 1.83
Home equity 45 0.10 21 0.06
Direct/Indirect consumer 476 1.54 182 0.77
Other consumer 192 4.58 117 2.25
Total consumer 2,517 1.05 1,777 0.90
Commercial - domestic (4) 412 0.50 102 0.14
Commercial real estate 2 0.01 - -
Commercial lease financing (12) (0.12) (40) (0.39)
Commercial - foreign 3 0.03 6 0.05
Total commercial 405 0.34 68 0.06 Total net charge-offs $2,922 0.81 $1,845 0.59
By Business Segment:
Global Consumer and Small Business Banking (5) $5,095 3.29 % $3,177 2.28 %
Global Corporate and Investment Banking 176 0.14 80 0.07
Global Wealth and Investment Management 22 0.07 (43) (0.15)
All Other (5) (2,371) (4.95) (1,369) (4.76) Total net charge-offs $2,922 0.81 $1,845 0.59
Supplemental managed basis data
Credit card - domestic $3,437 4.99 % $2,300 3.35 %
Credit card - foreign 615 4.34 420 3.62 Total credit card managed net losses $4,052 4.88 $2,720 3.39
Total commercial 405 0.34 92 0.08
Total managed losses 5,338 1.28 3,292 0.91
(1) Net charge-off/loss ratios are calculated as annualized held net charge-offs or managed net losses divided by average outstanding held or managed loans
and leases measured at historical cost during the period for each loan and lease category.
(2) Net charge-offs include the impact of SOP 03-3 which decreased net charge-offs on credit card - domestic $78 million, credit card - foreign $44 million,
direct/indirect consumer $67 million, other consumer $31 million and commercial - domestic $17 million for the six months ended June 30, 2006.
The impact of SOP 03-3 was not material for the six months ended June 30, 2007. Refer to Exhibit A on page 43 for a reconciliation of net charge-offs
and net charge-off ratios to net charge-offs and net charge-off ratios excluding the impact of SOP 03-3.
(3) Historical ratios have been adjusted for home equity and direct/indirect consumer due to the reclassification of home equity loan balances from
direct/indirect to home equity. The impact on net charge-offs was not material.
(4) Includes small business net charge-offs of $355 million and $147 million for the six months ended June 30, 2007 and 2006, or 4.92 percent and 2.65 percent
of average outstanding held small business loans. Excluding the small business portfolio, the net charge-off ratio for commecial - domestic loans would
have been 0.08 percent and (0.07) percent for the six months ended June 30, 2007 and 2006.
(5) Global Consumer and Small Business Banking is presented on a managed basis, specifically Card Services. The securitization offset is included
within All Other.
Loans are classified as domestic or foreign based upon the domicile of the borrower.
Certain prior period amounts have been reclassified to conform to current period presentation.
Six Months Ended June 30
2006 (2, 3)2007
This information is preliminary and based on company data available at the time of the presentation. 40
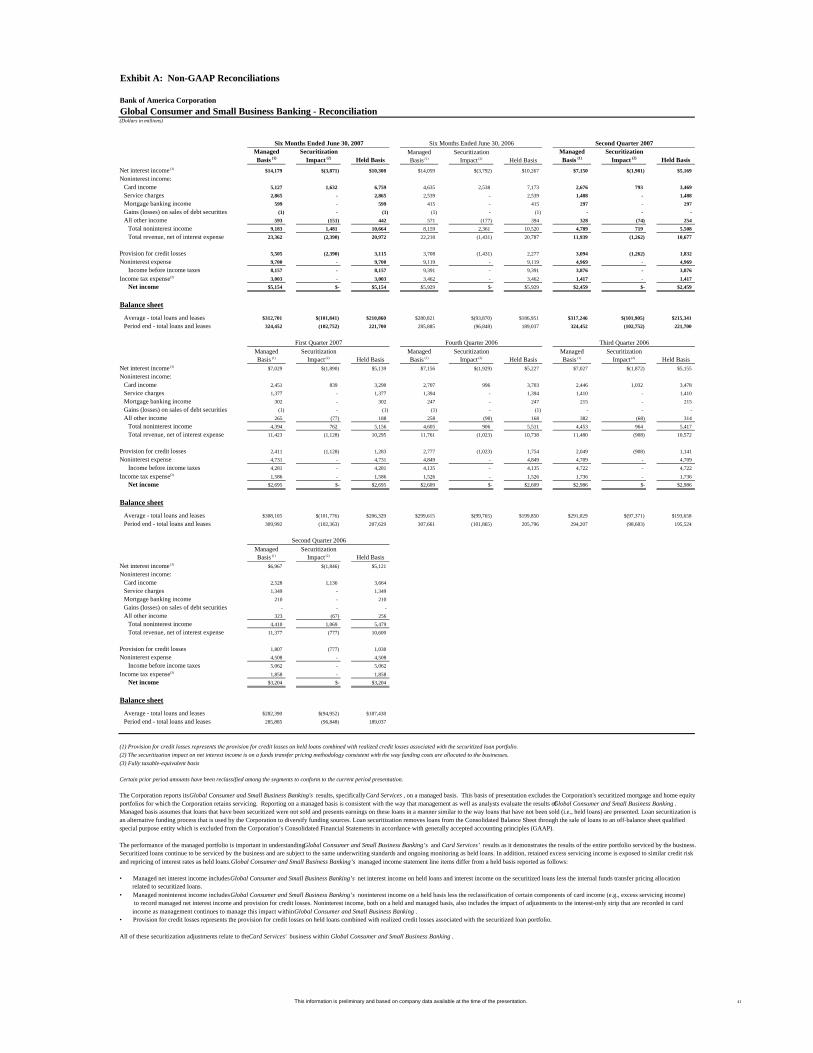
Exhibit A: Non-GAAP Reconciliations
Bank of America CorporationGlobal Consumer and Small Business Banking - Reconciliation(Dollars in millions)
Managed Basis (1)
Securitization Impact (2) Held Basis
Managed Basis (1)
Securitization Impact (2) Held Basis
Managed Basis (1)
Securitization Impact (2) Held Basis
Net interest income (3) $14,179 $(3,871) $10,308 $14,059 $(3,792) $10,267 $7,150 $(1,981) $5,169Noninterest income:
Card income 5,127 1,632 6,759 4,635 2,538 7,173 2,676 793 3,469 Service charges 2,865 - 2,865 2,539 - 2,539 1,488 - 1,488 Mortgage banking income 599 - 599 415 - 415 297 - 297 Gains (losses) on sales of debt securities (1) - (1) (1) - (1) - - - All other income 593 (151) 442 571 (177) 394 328 (74) 254
Total noninterest income 9,183 1,481 10,664 8,159 2,361 10,520 4,789 719 5,508 Total revenue, net of interest expense 23,362 (2,390) 20,972 22,218 (1,431) 20,787 11,939 (1,262) 10,677
Provision for credit losses 5,505 (2,390) 3,115 3,708 (1,431) 2,277 3,094 (1,262) 1,832 Noninterest expense 9,700 - 9,700 9,119 - 9,119 4,969 - 4,969
Income before income taxes 8,157 - 8,157 9,391 - 9,391 3,876 - 3,876 Income tax expense (3) 3,003 - 3,003 3,462 - 3,462 1,417 - 1,417
Net income $5,154 $- $5,154 $5,929 $- $5,929 $2,459 $- $2,459
Balance sheet
Average - total loans and leases $312,701 $(101,841) $210,860 $280,821 $(93,870) $186,951 $317,246 $(101,905) $215,341Period end - total loans and leases 324,452 (102,752) 221,700 285,885 (96,848) 189,037 324,452 (102,752) 221,700
Managed Basis (1)
Securitization Impact (2) Held Basis
Managed Basis (1)
Securitization Impact (2) Held Basis
Managed Basis (1)
Securitization Impact (2) Held Basis
Net interest income (3) $7,029 $(1,890) $5,139 $7,156 $(1,929) $5,227 $7,027 $(1,872) $5,155Noninterest income:
Card income 2,451 839 3,290 2,707 996 3,703 2,446 1,032 3,478 Service charges 1,377 - 1,377 1,394 - 1,394 1,410 - 1,410 Mortgage banking income 302 - 302 247 - 247 215 - 215 Gains (losses) on sales of debt securities (1) - (1) (1) - (1) - - - All other income 265 (77) 188 258 (90) 168 382 (68) 314
Total noninterest income 4,394 762 5,156 4,605 906 5,511 4,453 964 5,417 Total revenue, net of interest expense 11,423 (1,128) 10,295 11,761 (1,023) 10,738 11,480 (908) 10,572
Provision for credit losses 2,411 (1,128) 1,283 2,777 (1,023) 1,754 2,049 (908) 1,141 Noninterest expense 4,731 - 4,731 4,849 - 4,849 4,709 - 4,709
Income before income taxes 4,281 - 4,281 4,135 - 4,135 4,722 - 4,722 Income tax expense (3) 1,586 - 1,586 1,526 - 1,526 1,736 - 1,736
Net income $2,695 $- $2,695 $2,609 $- $2,609 $2,986 $- $2,986
Balance sheet
Average - total loans and leases $308,105 $(101,776) $206,329 $299,615 $(99,765) $199,850 $291,029 $(97,371) $193,658Period end - total loans and leases 309,992 (102,363) 207,629 307,661 (101,865) 205,796 294,207 (98,683) 195,524
Managed Basis (1)
Securitization Impact (2) Held Basis
Net interest income (3) $6,967 $(1,846) $5,121Noninterest income:
Card income 2,528 1,136 3,664 Service charges 1,349 - 1,349 Mortgage banking income 210 - 210 Gains (losses) on sales of debt securities - - - All other income 323 (67) 256
Total noninterest income 4,410 1,069 5,479 Total revenue, net of interest expense 11,377 (777) 10,600
Provision for credit losses 1,807 (777) 1,030 Noninterest expense 4,508 - 4,508
Income before income taxes 5,062 - 5,062 Income tax expense (3) 1,858 - 1,858
Net income $3,204 $- $3,204
Balance sheet
Average - total loans and leases $282,390 $(94,952) $187,438Period end - total loans and leases 285,885 (96,848) 189,037
(1) Provision for credit losses represents the provision for credit losses on held loans combined with realized credit losses associated with the securitized loan portfolio.(2) The securitization impact on net interest income is on a funds transfer pricing methodology consistent with the way funding costs are allocated to the businesses.(3) Fully taxable-equivalent basis
Certain prior period amounts have been reclassified among the segments to conform to the current period presentation.
The Corporation reports its Global Consumer and Small Business Banking's results, specifically Card Services , on a managed basis. This basis of presentation excludes the Corporation's securitized mortgage and home equity portfolios for which the Corporation retains servicing. Reporting on a managed basis is consistent with the way that management as well as analysts evaluate the results of Global Consumer and Small Business Banking . Managed basis assumes that loans that have been securitized were not sold and presents earnings on these loans in a manner similar to the way loans that have not been sold (i.e., held loans) are presented. Loan securitization is an alternative funding process that is used by the Corporation to diversify funding sources. Loan securitization removes loans from the Consolidated Balance Sheet through the sale of loans to an off-balance sheet qualified special purpose entity which is excluded from the Corporation’s Consolidated Financial Statements in accordance with generally accepted accounting principles (GAAP).
The performance of the managed portfolio is important in understanding Global Consumer and Small Business Banking’s and Card Services’ results as it demonstrates the results of the entire portfolio serviced by the business. Securitized loans continue to be serviced by the business and are subject to the same underwriting standards and ongoing monitoring as held loans. In addition, retained excess servicing income is exposed to similar credit risk and repricing of interest rates as held loans. Global Consumer and Small Business Banking’s managed income statement line items differ from a held basis reported as follows:
• Managed net interest income includes Global Consumer and Small Business Banking’s net interest income on held loans and interest income on the securitized loans less the internal funds transfer pricing allocation related to securitized loans.• Managed noninterest income includes Global Consumer and Small Business Banking’s noninterest income on a held basis less the reclassification of certain components of card income (e.g., excess servicing income) to record managed net interest income and provision for credit losses. Noninterest income, both on a held and managed basis, also includes the impact of adjustments to the interest-only strip that are recorded in card income as management continues to manage this impact within Global Consumer and Small Business Banking .• Provision for credit losses represents the provision for credit losses on held loans combined with realized credit losses associated with the securitized loan portfolio.
All of these securitization adjustments relate to the Card Services' business within Global Consumer and Small Business Banking .
Second Quarter 2006
Second Quarter 2007
Third Quarter 2006
Six Months Ended June 30, 2007 Six Months Ended June 30, 2006
First Quarter 2007 Fourth Quarter 2006
This information is preliminary and based on company data available at the time of the presentation. 41

Exhibit A: Non-GAAP Reconciliations - continued
Bank of America CorporationAll Other - Reconciliation(Dollars in millions)
Reported Basis (1)
Securitization Offset (2) As Adjusted
Reported Basis (1)
Securitization Offset (2) As Adjusted
Reported Basis (1)
Securitization Offset (2) As Adjusted
Net interest income (3) $(3,715) $3,871 $156 $(2,884) $3,792 $908 $(1,945) $1,981 $36Noninterest income:
Card income 1,397 (1,632) (235) 2,129 (2,538) (409) 676 (793) (117) Equity investment gains 2,615 - 2,615 1,148 - 1,148 1,719 - 1,719 Gains (losses) on sales of debt securities 63 - 63 (4) - (4) 2 - 2 All other income (313) 151 (162) (418) 177 (241) (255) 74 (181)
Total noninterest income 3,762 (1,481) 2,281 2,855 (2,361) 494 2,142 (719) 1,423 Total revenue, net of interest expense 47 2,390 2,437 (29) 1,431 1,402 197 1,262 1,459
Provision for credit losses (2,625) 2,390 (235) (1,440) 1,431 (9) (1,311) 1,262 (49) Merger and restructuring charges 186 - 186 292 - 292 75 - 75 All other noninterest expense 208 - 208 696 - 696 (130) - (130)
Income before income taxes 2,278 - 2,278 423 - 423 1,563 - 1,563
Income tax expense (3) 684 - 684 134 - 134 550 - 550 Net income $1,594 $- $1,594 $289 $- $289 $1,013 $- $1,013
Balance sheet
Average - total loans and leases $96,671 $101,841 $198,512 $57,983 $93,870 $151,853 $101,094 $101,905 $202,999Period end - total loans and leases 107,429 102,752 210,181 86,429 96,848 183,277 107,429 102,752 210,181
Reported Basis (1)
Securitization Offset (2) As Adjusted
Reported Basis (1)
Securitization Offset (2) As Adjusted
Reported Basis (1)
Securitization Offset (2) As Adjusted
Net interest income (3) $(1,770) $1,890 $120 $(1,628) $1,929 $301 $(1,419) $1,872 $453Noninterest income:
Card income 721 (839) (118) 826 (996) (170) 841 (1,032) (191) Equity investment gains 896 - 896 1,031 - 1,031 687 - 687 Gains (losses) on sales of debt securities 61 - 61 9 - 9 (480) - (480) All other income (58) 77 19 (120) 90 (30) 634 68 702
Total noninterest income 1,620 (762) 858 1,746 (906) 840 1,682 (964) 718 Total revenue, net of interest expense (150) 1,128 978 118 1,023 1,141 263 908 1,171
Provision for credit losses (1,314) 1,128 (186) (1,136) 1,023 (113) (920) 908 (12) Merger and restructuring charges 111 - 111 244 - 244 269 - 269 All other noninterest expense 338 - 338 31 - 31 116 - 116
Income before income taxes 715 - 715 979 - 979 798 - 798
Income tax expense (3) 134 - 134 262 - 262 226 - 226 Net income $581 $- $581 $717 $- $717 $572 $- $572
Balance sheet
Average - total loans and leases $92,198 $101,776 $193,974 $80,663 $99,765 $180,428 $85,962 $97,371 $183,333Period end - total loans and leases 97,085 102,363 199,448 90,594 101,865 192,459 76,399 98,683 175,082
Reported Basis (1)
Securitization Offset (2) As Adjusted
Net interest income (3) $(1,404) $1,846 $442Noninterest income:
Card income 961 (1,136) (175) Equity investment gains 577 - 577 Gains (losses) on sales of debt securities (5) - (5) All other income (159) 67 (92)
Total noninterest income 1,374 (1,069) 305 Total revenue, net of interest expense (30) 777 747
Provision for credit losses (784) 777 (7) Merger and restructuring charges 194 - 194 All other noninterest expense 280 - 280
Income before income taxes 280 - 280
Income tax expense (3) 186 - 186 Net income $94 $- $94
Balance sheet
Average - total loans and leases $62,383 $94,952 $157,335Period end - total loans and leases 86,429 96,848 183,277
(1) Provision for credit losses represents the provision for credit losses in All Other combined with the Global Consumer and Small Business Banking securitization offset. (2) The securitization offset on net interest income is on a funds transfer pricing methodology consistent with the way funding costs are allocated to the businesses.(3) Fully taxable-equivalent basis
Certain prior period amounts have been reclassified among the segments to conform to the current period presentation.
Second Quarter 2006
Six Months Ended June 30, 2007 Six Months Ended June 30, 2006 Second Quarter 2007
First Quarter 2007 Fourth Quarter 2006 Third Quarter 2006
This information is preliminary and based on company data available at the time of the presentation. 42

Exhibit A: Non-GAAP Reconciliations - continued
Reconciliation of Net Charge-offs and Net Charge-off Ratios to Net Charge-offs and Net Charge-off Ratios Excluding the Impact of SOP 03-3 (1, 2)
Net Charge-offs and Net Charge-off Ratios As Reported Second Quarter 2006
Average Outstanding Average Outstanding Average Outstanding Average Outstanding
(Dollars in millions) Amount Loans and Leases Percent (3)Amount Loans and Leases Percent (3)
Amount Loans and Leases Percent (3)Amount Loans and Leases Percent (3)
Residential mortgage $24 $191,046 0.03 % $9 $225,985 0.02 % $6 $222,889 0.01 % $14 $197,228 0.03 %Credit card - domestic 1,357 66,566 4.11 884 59,802 5.86 853 62,508 5.42 723 64,980 4.46Credit card - foreign 76 8,354 1.83 79 10,375 3.03 70 9,455 2.94 57 8,305 2.72Home equity 21 74,166 0.06 19 84,904 0.09 11 79,899 0.06 12 75,894 0.06Direct/Indirect consumer 182 47,407 0.77 190 53,481 1.41 152 51,536 1.17 103 48,003 0.86Other consumer 117 10,581 2.25 101 10,597 3.78 85 11,076 3.03 75 10,804 2.80 Total consumer 1,777 398,120 0.90 1,282 445,144 1.14 1,177 437,363 1.07 984 405,214 0.97Commercial - domestic 102 146,580 0.14 123 158,604 0.31 111 153,007 0.29 50 148,445 0.14Commercial real estate - 36,713 - 1 36,851 0.01 2 37,471 0.02 1 36,749 -Commercial lease financing (40) 20,705 (0.39) 12 21,159 0.22 - 20,875 - (17) 20,896 (0.33)Commercial - foreign 6 23,745 0.05 (1) 21,840 (0.02) (13) 24,761 (0.21) 5 24,345 0.08 Total commercial 68 227,743 0.06 135 238,454 0.22 100 236,114 0.17 39 230,435 0.07 Total net charge-offs $1,845 $625,863 0.59 $1,417 $683,598 0.82 $1,277 $673,477 0.75 $1,023 $635,649 0.65
Impact of SOP 03-3 (4)
Residential mortgage $ - $ - $ - $ -Credit card - domestic 78 11 10 7Credit card - foreign 44 4 5 6Home equity - - - -Direct/Indirect consumer 67 6 5 7Other consumer 31 4 6 3 Total consumer 220 25 26 23 Commercial - domestic 17 - - 4Commercial real estate - - - -Commercial lease financing - - - -Commercial - foreign - - - - Total commercial 17 - - 4 Total net charge-offs $237 $25 $26 $27
Net Charge-offs and Net Charge-off Ratios Excluding the Impact of SOP 03-3Residential mortgage $24 $191,046 0.03 % $9 $225,985 0.02 % $6 $222,889 0.01 % $14 $197,228 0.03 %Credit card - domestic 1,435 66,566 4.35 895 59,802 5.93 863 62,508 5.48 730 64,980 4.50Credit card - foreign 120 8,354 2.90 83 10,375 3.22 75 9,455 3.13 63 8,305 3.02Home equity 21 74,166 0.06 19 84,904 0.09 11 79,899 0.06 12 75,894 0.06Direct/Indirect consumer 249 47,407 1.06 196 53,481 1.45 157 51,536 1.22 110 48,003 0.91Other consumer 148 10,581 2.85 105 10,597 3.93 91 11,076 3.22 78 10,804 2.93 Total consumer 1,997 398,120 1.01 1,307 445,144 1.17 1,203 437,363 1.09 1,007 405,214 1.00Commercial - domestic 119 146,580 0.16 123 158,604 0.31 111 153,007 0.29 54 148,445 0.15Commercial real estate - 36,713 - 1 36,851 0.01 2 37,471 0.02 1 36,749 -Commercial lease financing (40) 20,705 (0.39) 12 21,159 0.22 - 20,875 - (17) 20,896 (0.33)Commercial - foreign 6 23,745 0.05 (1) 21,840 (0.02) (13) 24,761 (0.21) 5 24,345 0.08 Total commercial 85 227,743 0.08 135 238,454 0.22 100 236,114 0.17 43 230,435 0.07 Total net charge-offs $2,082 $625,863 0.67 $1,442 $683,598 0.84 $1,303 $673,477 0.77 $1,050 $635,649 0.66
(1) Average outstanding loans and leases and historical ratios have been adjusted for home equity and direct/indirect consumer due to the reclassification of home equity loan balances from direct/indirect to home equity. The impact on net charge-offs was not material.(2) The impact of SOP 03-3 was immaterial for the three months ended March 31, 2007 and June 30, 2007, and for the six months ended June 30, 2007.(3) Percentage amounts are calculated as annualized net charge-offs divided by average outstanding loans and leases during the period for each loan category. (4) The impact of SOP 03-3 on average outstanding loans and leases for the three months ended June 30, 2006, September 30, 2006 and December 31, 2006, and for the six months ended June 30, 2006 was immaterial.
Certain prior period amounts have been reclassified to conform to current period presentation.
Fourth Quarter 2006 Third Quarter 2006Six Months Ended June 30, 2006
This information is preliminary and based on company data available at the time of the presentation. 43