Collected Supplemental Figures...
20
Supplemental Figure 1: Expression profiling of biniou mutant embryos The 1,164 genes with differential expres- sion were clustered by K-medians clustering, using Pearson uncentered correlations to calculate the distance metric (TIGR-Mev, (Saeed et al. 2003)). Each row corresponds to one gene, each column corresponds to one developmental condition, in the following order from left to right: biniou loss-of- function 5-6 hrs, 6-7hrs, 7-8hr, 8-9hrs, 9-10hrs and 13-14hrs, ectopic biniou 4-5hrs, 5-6hrs, 6-7hrs. All measurements are ratios of biniou mutant embryos over stage matched wild type embryos. Yellow represents increased expression in mutant compared to wild-type, blue represents decreased expression, and black is no change. The degree of change is indicated by the scale on the bottom (log2). The data falls into four major clusters, two of which have significantly reduced levels of expression (clusters 1 & 2), indicating a genetic dependency on biniou for their expression. Genes known to be expressed in visceral muscle are indicated. Cluster 2 contains a number of genes that only change expression late in development, suggesting a role in later aspects of VM morphogen- esis or function. Some of these genes are also likely to be secondary responses to the lack of VM at these late stages. For example, HLH54F is specifically expressed in the longitudinal muscle and does not change expression in biniou mutants at early stages of development when the trunk VM cells are still present. Rather this gene is only differentially expressed at later stages when the longitudinal VM migration is blocked due to a lack of trunk VM. Surprisingly few genes had increased expression with ectopic expression of biniou. We believe that this result is biological as bagpipe is ectopically expressed. The fact that Biniou is not sufficient to ectopically express many genes likely reflects the need for extensive combinatorial regulation, which is strongly supported by our ChIP-on-chip experi- ments. bin 5-6 bin 6-7 bin 7-8 bin 8-9 bin 9-10 bin 13-14 overexp 4-5 overexp 5-6 overexp 6-7 bin 5-6 bin 6-7 bin 7-8 bin 8-9 bin 9-10 bin 13-14 overexp 4-5 overexp 5-6 overexp 6-7 bin 5-6 bin 6-7 bin 7-8 bin 8-9 bin 9-10 bin 13-14 overexp 4-5 overexp 5-6 overexp 6-7 4) 2) 1) 3) jakobsen et al 1
Transcript of Collected Supplemental Figures...
Supplemental Figure 4Supplemental Figure 2 Supplemental Figure 5 Supplemental Figure 7B
Supplemental Figure 7: Biniou targets a large number of transcription factors
and components of signaling cascades
Supplemental Figure 7ASupplemental Figure 6
Supplemental Figure 4: Endogenous expression of the CG2330 gene
Supplemental Figure 3
Supplemental Figure 2:
Biniou ChIP binding to the three characterised Biniou-regulated enhancers
Supplemental Figure 1:
Expression profiling of biniou mutant
embryos
The 1,164 genes with differential expres-sion were clustered by K-medians clustering, using Pearson uncentered correlations to calculate the distance metric (TIGR-Mev, (Saeed et al. 2003)). Each row corresponds to one gene, each column corresponds to one developmental condition, in the following order from left to right: biniou loss-of-function 5-6 hrs, 6-7hrs, 7-8hr, 8-9hrs, 9-10hrs and 13-14hrs, ectopic biniou 4-5hrs, 5-6hrs, 6-7hrs. All measurements are ratios of biniou mutant embryos over stage matched wild type embryos. Yellow represents increased expression in mutant compared to wild-type, blue represents decreased expression, and black is no change. The degree of change is indicated by the scale on the bottom (log2). The data falls into four major clusters, two of which have significantly reduced levels of expression (clusters 1 & 2), indicating a genetic dependency on biniou for their expression. Genes known to be expressed in visceral muscle are indicated. Cluster 2 contains a number of genes that only change expression late in development, suggesting a role in later aspects of VM morphogen-esis or function. Some of these genes are also likely to be secondary responses to the lack of VM at these late stages. For example, HLH54F is specifically expressed in the longitudinal muscle and does not change expression in biniou mutants at early stages of development when the trunk VM cells are still present. Rather this gene is only differentially expressed at later stages when the longitudinal VM migration is blocked due to a lack of trunk VM. Surprisingly few genes had increased expression with ectopic expression of biniou. We believe that this result is biological as bagpipe is ectopically expressed. The fact that Biniou is not sufficient to ectopically express many genes likely reflects the need for extensive combinatorial regulation, which is strongly supported by our ChIP-on-chip experi-ments.
(A-C) Schematic overview of genomic regions containing characterised Biniou-enhancers: The gene is depicted at the bottom of the panel, with exons in black and introns in grey. Genomic fragments on the tiling arrays are indicated as stacks of four horizontal grey bars in their corresponding genomic position. Each single bar represents the results from one ChIP-on-chip time-period, with the earliest (6-8 hrs, stages 10-11) positioned at the top of the stack and the latest (12-14 hrs, stage 15) at the bottom of the stack. Blue arrow represents the direction of developmental time. The red bars indicate Biniou binding, light red bars indicate binding just below our stringent cut-off. The green double-headed arrows indicate the known enhancers. Note, Biniou binds to all three characterised Bagpipe enhancers, indicating a potential regulatory connection in other VM subtypes, in addition to the trunk VM.
Motif clover_result_bin_early_regions clover_result_bin_contin_regions clover_result_bin_late_regions
Score Pval Score Pval Score Pval
OVER - REPRESENTED RESULTS
FLYREG_Aef1 16.5 0
FLYREG_BEAF-32 -3.49 0 -4.03 0 -3.77 0.001
FLYREG_BEAF-32B -4.25 0.007 -3.86 0.01
FLYREG_Top2 32.3 0.001 104 0 58.7 0
FLYREG_Trl 6.7 0.001 42.8 0 11.3 0
FLYREG_bin -2.07 0 -1.97 0 -2.12 0
FLYREG_ey 15.7 0.002
FLYREG_hkb 7.99 0.007
FLYREG_kni -2.04 0
FLYREG_toy 8.19 0.001
JASPAR_CORE_MA0011 Broad-complex_2 ZN-FINGER, C2H2
-2.96 0.01
JASPAR_CORE_MA0012 Broad-complex_3 ZN-FINGER, C2H2
-0.349 0.009 4.77 0 2.13 0
JASPAR_CORE_MA0013 Broad-complex_4 ZN-FINGER, C2H2
6.28 0 2.28 0.003
JASPAR_FAMILY_MF0002 bZIPCREB/G-box-like subclass bZIP
-4.3 0.005
JASPAR_FAMILY_MF0003 REL classREL
15.2 0.006
JASPAR_FAMILY_MF0005 Forkheadclass Forkhead
25.8 0.001 98.4 0 44.2 0
JASPAR_FAMILY_MF0011 HMG classHMG
0.591 0.001 3.43 0.007
Michal_Adf1_01 98.7 0.002
Michal_Dref_01 -3.82 0.002 -4.55 0.001 -4.07 0.001
Michal_Mad_01 33.6 0
Michal_Mef2_01 12.2 0 30.3 0
Michal_pan_01 36.5 0.006
Michal_pho_01 12.4 0
Michal_srp_01 -3.38 0.001 -3.93 0 -3.64 0.001
Michal_z_01 0.779 0
TRANSFAC_CF2II_01;CF2-II;CF2-II;CF2-II; Species: fruit fly, Drosophilamelanogaster.
11.3 0.001 21.9 0 17.4 0
TRANSFAC_CF2II_02;CF2-II;CF2-II;CF2-II; Species: fruit fly, Drosophilamelanogaster.
13 0.002 19.6 0.005 20.8 0
TRANSFAC_CROC_01;Croc;Crocodileregulator of head development;Croc;Species: fruit fly, Drosophilamelanogaster.
27.6 0
TRANSFAC_DL_01;dl;dorsal;Dl;Species: fruit fly, Drosophilamelanogaster.
13 0.003 12 0.001
TRANSFAC_HAIRY_01;Hairy;Hairy;H;Species: fruit fly, Drosophilamelanogaster.
5.83 0.01
TRANSFAC_HSF_01;HSF;heat shockfactor (Drosophila);HSTF; Species:fruit fly, Drosophila melanogaster.
-2.2 0.004
TRANSFAC_HSF_04;HSF;heat shockfactor (Drosophila);HSTF; Species:fruit fly, Drosophila melanogaster.
6.36 0
TRANSFAC_TATA_01; TATA; cellularand viral TATA box elements;TBP;Species: human, Homo sapiens.;TBP;Species: mouse, Mus musculus.;TBP;Species: fruit fly, Drosophilamelanogaster.
-2.37 0.005
bin 5
-6
bin 6
-7
bin 7
-8
bin 8
-9
bin 9
-10
bin 1
3-14
over
exp
4-5
over
exp
5-6
over
exp
6-7
bin 5
-6
bin 6
-7
bin 7
-8
bin 8
-9
bin 9
-10
bin 1
3-14
over
exp
4-5
over
exp
5-6
over
exp
6-7
bin 5
-6
bin 6
-7
bin 7
-8
bin 8
-9
bin 9
-10
bin 1
3-14
over
exp
4-5
over
exp
5-6
over
exp
6-7
ttk-V
ME
1 kb
ttk
ttk-VME
fd64a-V
ME
1 kb
LATE
EARLY
fd64a CG1134
fd64a-e-VME
fd64a-l-VME
HL
H5
4F-V
ME
1 kb
HLH54F CG5009
HLH54F-VME
otk-V
ME
1 kbotk
otk-VME
mib
2-V
ME
1 kb
mib2 CG10449
mib2-VME
ken-V
ME
1 kb
kenCG4581
ken-VME
1 kb
5' 3'ßTub60D
1 kbdpp
5' 3'
1 kb
5' 3'bap
1 2
3
C
B
A
4)2)1)
3)
F
E
D
C
B
A
CG
2330
Stage 11 Stage 13 Stage 15/16
bap
6-8
bin 6
-8
bin 8
-10
bin 1
0-12
bin 1
2-14
Mef
2 6-
8
Mef
2 8-
10
Mef
2 10
-12
bap
6-8
bin 6
-8
bin 8
-10
bin 1
0-12
bin 1
2-14
Mef
2 6-
8
Mef
2 8-
10
Mef
2 10
-12
bap
6-8
bin 6
-8
bin 8
-10
bin 1
0-12
bin 1
2-14
Mef
2 6-
8
Mef
2 8-
10
Mef
2 10
-12
Continuously-bound Late-boundEarly-bound
In situ hybridisation using a DIG-labelled probe directed against the coding region of CG2330. There is no detectable expression at stage 11, with weak expression initiating at stage 12. From stage 13-16 CG2330 is expressed in the trunk VM, somatic muscle and pharyngeal muscle. It is not possible from these in situs to distinguish between trunk circular or longitudinal muscle. However, the Biniou-bound enhancer drives specific expression in the longitudinal VM (manuscript Fig. 1D’).
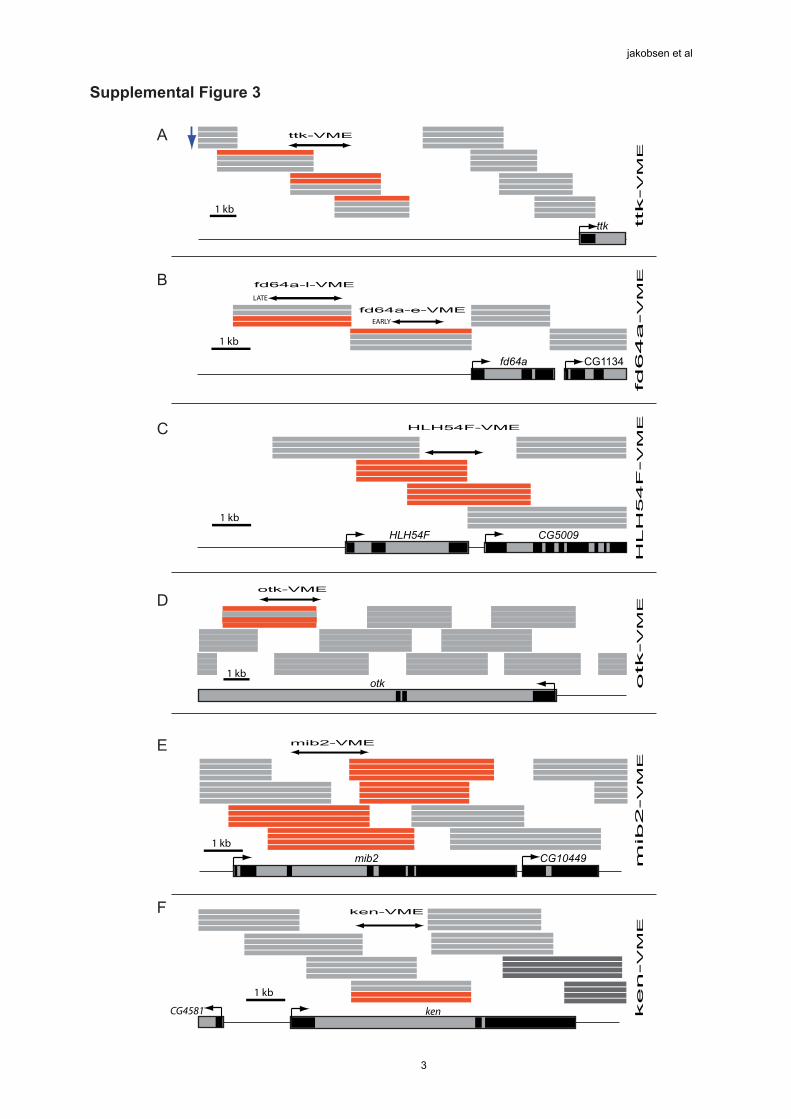
The 143 newly identified Biniou direct target genes are highly enriched in a number of functional classes of genes. Most notable is the enrichment of ‘transcriptional regulators’: A comparison to a curated database (FlyTF (Adryan and Teichmann 2006)) identified ~20% of Biniou target genes as transcription factors (Supple. Fig. 7A). This group provides a useful resource to further explore the transcriptional network governing VM development. Biniou also targets components of many of the major developmental signalling pathways, which likely impart spatial inputs to Biniou-bound CRMs (supple. Fig. 7B): FGF (bnl, stumps), EGF (star), Hh (pxb), Wg (pan (dTCF)), Notch-Delta (neur). Biniou also binds to CRMs of two components of the semaphorin signalling pathway: off-track (Fig. 2E: otk) and mical. Both genes are expressed in the nervous system, where they play a role in receiving and integrating axonal guidance cues (Winberg et al. 2001; Terman et al. 2002). As these genes were unexpected targets for a muscle specific transcription factor, we re-examined their expression to determine if they are also expressed in the developing visceral muscle. In situ hybridization of off-track revealed that it is expressed in the circular VM during the stages of VM migra-tion, and that this expression depends on biniou activity (Fig. 5E). Moreover, the Binou-bound enhancer recapitulates the endogenous genes’ expression (Fig. 2E).
Biniou direct target genes implicated in cell signalling
Flybase ID Gene Pathway
FBgn0004364 18 wheeler (18w) Toll-likeFBgn0022131 atypical protein kinase C (aPKC) GPCR-signaling
transductionFBgn0014135 branchless (bnl) FGFFBgn0000490 Decapentaplegic (dpp) DppFBgn0000463 Delta (Dl) Notch/DeltaFBgn0000546 Ecdysone receptor (EcR) EcdysoneFBgn0024222 immune response deficient 5 (ird5) TollFBgn0034590 Magi Maguk proteinFBgn0002932 Neuralized (neur) Notch/DeltaFBgn0019664 pangolin (pan) WgFBgn0003177 polychaetoid (pyd) Maguk proteinFBgn0053207 Pxb HhFBgn0053529 Rapgap1 RTK/RASFBgn0026181 Rho-kinase (rok) Rho signalingFBgn0003310 Star (S) EGFFBgn0020299 stumps FGFFBgn0041184 Suppressor of cytokine signaling at 36E (Socs36E) JNKFBgn0033134 Tetraspanin 42El (Tsp42El) membrane signaling
complex
Biniou direct target genes annotated as TFs (www.FlyTF.org)
Flybase ID Gene
FBgn0015903 apontic (apt)FBgn0004862 bagpipe (bap)FBgn0010460 bunched (bun)FBgn0000251 caudal (cad)FBgn0008649 delilah (dei)FBgn0011763 DP transcription factor (Dp)FBgn0000492 Drop (Dr)FBgn0002633 E(spl) region transcript m7 (HLHm7)FBgn0000546 Ecdysone receptor (EcR)FBgn0001981 escargot (esg)FBgn0004895 forkhead domain 64A (fd64A)FBgn0004914 Hepatocyte nuclear factor 4 (Hnf4)FBgn0022740 HLH54F (HLH54F)FBgn0001235 homothorax (hth)FBgn0000448 Hormone receptor-like in 46 (Hr46)FBgn0001269 invected (inv)FBgn0011236 ken and barbie (ken)FBgn0008651 ladybird late (lbl)FBgn0039039 lame duck (lmd)FBgn0005630 longitudinals lacking (lola)FBgn0040765 luna (luna)FBgn0030505 NFAT (NFAT)FBgn0003002 odd paired (opa)FBgn0019664 pangolin (pan)FBgn0003118 pointed (pnt)FBgn0003460 sine oculis (so)FBgn0004579 spalt major (salm)FBgn0003866 teashirt (tsh)FBgn0003870 tramtrak (ttk)FBgn0003862 trithorax (trx)FBgn0016076 vrille (vri)FBgn0004606 Zn finger homeodomain 1 (zfh1)
Biniou & Mef2 co-bound enhancers
jakobsen et al
1

Supplemental Figure 4Supplemental Figure 2 Supplemental Figure 5 Supplemental Figure 7B
Supplemental Figure 7: Biniou targets a large number of transcription factors
and components of signaling cascades
Supplemental Figure 7ASupplemental Figure 6
Supplemental Figure 4: Endogenous expression of the CG2330 gene
Supplemental Figure 3
Supplemental Figure 2:
Biniou ChIP binding to the three characterised Biniou-regulated enhancers
Supplemental Figure 1:
Expression profiling of biniou mutant
embryos
The 1,164 genes with differential expres-sion were clustered by K-medians clustering, using Pearson uncentered correlations to calculate the distance metric (TIGR-Mev, (Saeed et al. 2003)). Each row corresponds to one gene, each column corresponds to one developmental condition, in the following order from left to right: biniou loss-of-function 5-6 hrs, 6-7hrs, 7-8hr, 8-9hrs, 9-10hrs and 13-14hrs, ectopic biniou 4-5hrs, 5-6hrs, 6-7hrs. All measurements are ratios of biniou mutant embryos over stage matched wild type embryos. Yellow represents increased expression in mutant compared to wild-type, blue represents decreased expression, and black is no change. The degree of change is indicated by the scale on the bottom (log2). The data falls into four major clusters, two of which have significantly reduced levels of expression (clusters 1 & 2), indicating a genetic dependency on biniou for their expression. Genes known to be expressed in visceral muscle are indicated. Cluster 2 contains a number of genes that only change expression late in development, suggesting a role in later aspects of VM morphogen-esis or function. Some of these genes are also likely to be secondary responses to the lack of VM at these late stages. For example, HLH54F is specifically expressed in the longitudinal muscle and does not change expression in biniou mutants at early stages of development when the trunk VM cells are still present. Rather this gene is only differentially expressed at later stages when the longitudinal VM migration is blocked due to a lack of trunk VM. Surprisingly few genes had increased expression with ectopic expression of biniou. We believe that this result is biological as bagpipe is ectopically expressed. The fact that Biniou is not sufficient to ectopically express many genes likely reflects the need for extensive combinatorial regulation, which is strongly supported by our ChIP-on-chip experi-ments.
(A-C) Schematic overview of genomic regions containing characterised Biniou-enhancers: The gene is depicted at the bottom of the panel, with exons in black and introns in grey. Genomic fragments on the tiling arrays are indicated as stacks of four horizontal grey bars in their corresponding genomic position. Each single bar represents the results from one ChIP-on-chip time-period, with the earliest (6-8 hrs, stages 10-11) positioned at the top of the stack and the latest (12-14 hrs, stage 15) at the bottom of the stack. Blue arrow represents the direction of developmental time. The red bars indicate Biniou binding, light red bars indicate binding just below our stringent cut-off. The green double-headed arrows indicate the known enhancers. Note, Biniou binds to all three characterised Bagpipe enhancers, indicating a potential regulatory connection in other VM subtypes, in addition to the trunk VM.
Motif clover_result_bin_early_regions clover_result_bin_contin_regions clover_result_bin_late_regions
Score Pval Score Pval Score Pval
OVER - REPRESENTED RESULTS
FLYREG_Aef1 16.5 0
FLYREG_BEAF-32 -3.49 0 -4.03 0 -3.77 0.001
FLYREG_BEAF-32B -4.25 0.007 -3.86 0.01
FLYREG_Top2 32.3 0.001 104 0 58.7 0
FLYREG_Trl 6.7 0.001 42.8 0 11.3 0
FLYREG_bin -2.07 0 -1.97 0 -2.12 0
FLYREG_ey 15.7 0.002
FLYREG_hkb 7.99 0.007
FLYREG_kni -2.04 0
FLYREG_toy 8.19 0.001
JASPAR_CORE_MA0011 Broad-complex_2 ZN-FINGER, C2H2
-2.96 0.01
JASPAR_CORE_MA0012 Broad-complex_3 ZN-FINGER, C2H2
-0.349 0.009 4.77 0 2.13 0
JASPAR_CORE_MA0013 Broad-complex_4 ZN-FINGER, C2H2
6.28 0 2.28 0.003
JASPAR_FAMILY_MF0002 bZIPCREB/G-box-like subclass bZIP
-4.3 0.005
JASPAR_FAMILY_MF0003 REL classREL
15.2 0.006
JASPAR_FAMILY_MF0005 Forkheadclass Forkhead
25.8 0.001 98.4 0 44.2 0
JASPAR_FAMILY_MF0011 HMG classHMG
0.591 0.001 3.43 0.007
Michal_Adf1_01 98.7 0.002
Michal_Dref_01 -3.82 0.002 -4.55 0.001 -4.07 0.001
Michal_Mad_01 33.6 0
Michal_Mef2_01 12.2 0 30.3 0
Michal_pan_01 36.5 0.006
Michal_pho_01 12.4 0
Michal_srp_01 -3.38 0.001 -3.93 0 -3.64 0.001
Michal_z_01 0.779 0
TRANSFAC_CF2II_01;CF2-II;CF2-II;CF2-II; Species: fruit fly, Drosophilamelanogaster.
11.3 0.001 21.9 0 17.4 0
TRANSFAC_CF2II_02;CF2-II;CF2-II;CF2-II; Species: fruit fly, Drosophilamelanogaster.
13 0.002 19.6 0.005 20.8 0
TRANSFAC_CROC_01;Croc;Crocodileregulator of head development;Croc;Species: fruit fly, Drosophilamelanogaster.
27.6 0
TRANSFAC_DL_01;dl;dorsal;Dl;Species: fruit fly, Drosophilamelanogaster.
13 0.003 12 0.001
TRANSFAC_HAIRY_01;Hairy;Hairy;H;Species: fruit fly, Drosophilamelanogaster.
5.83 0.01
TRANSFAC_HSF_01;HSF;heat shockfactor (Drosophila);HSTF; Species:fruit fly, Drosophila melanogaster.
-2.2 0.004
TRANSFAC_HSF_04;HSF;heat shockfactor (Drosophila);HSTF; Species:fruit fly, Drosophila melanogaster.
6.36 0
TRANSFAC_TATA_01; TATA; cellularand viral TATA box elements;TBP;Species: human, Homo sapiens.;TBP;Species: mouse, Mus musculus.;TBP;Species: fruit fly, Drosophilamelanogaster.
-2.37 0.005
bin 5
-6
bin 6
-7
bin 7
-8
bin 8
-9
bin 9
-10
bin 1
3-14
over
exp
4-5
over
exp
5-6
over
exp
6-7
bin 5
-6
bin 6
-7
bin 7
-8
bin 8
-9
bin 9
-10
bin 1
3-14
over
exp
4-5
over
exp
5-6
over
exp
6-7
bin 5
-6
bin 6
-7
bin 7
-8
bin 8
-9
bin 9
-10
bin 1
3-14
over
exp
4-5
over
exp
5-6
over
exp
6-7
ttk-V
ME
1 kb
ttk
ttk-VME
fd64a-V
ME
1 kb
LATE
EARLY
fd64a CG1134
fd64a-e-VME
fd64a-l-VME
HL
H5
4F-V
ME
1 kb
HLH54F CG5009
HLH54F-VME
otk-V
ME
1 kbotk
otk-VME
mib
2-V
ME
1 kb
mib2 CG10449
mib2-VME
ken-V
ME
1 kb
kenCG4581
ken-VME
1 kb
5' 3'ßTub60D
1 kbdpp
5' 3'
1 kb
5' 3'bap
1 2
3
C
B
A
4)2)1)
3)
F
E
D
C
B
A
CG
2330
Stage 11 Stage 13 Stage 15/16
bap
6-8
bin 6
-8
bin 8
-10
bin 1
0-12
bin 1
2-14
Mef
2 6-
8
Mef
2 8-
10
Mef
2 10
-12
bap
6-8
bin 6
-8
bin 8
-10
bin 1
0-12
bin 1
2-14
Mef
2 6-
8
Mef
2 8-
10
Mef
2 10
-12
bap
6-8
bin 6
-8
bin 8
-10
bin 1
0-12
bin 1
2-14
Mef
2 6-
8
Mef
2 8-
10
Mef
2 10
-12
Continuously-bound Late-boundEarly-bound
In situ hybridisation using a DIG-labelled probe directed against the coding region of CG2330. There is no detectable expression at stage 11, with weak expression initiating at stage 12. From stage 13-16 CG2330 is expressed in the trunk VM, somatic muscle and pharyngeal muscle. It is not possible from these in situs to distinguish between trunk circular or longitudinal muscle. However, the Biniou-bound enhancer drives specific expression in the longitudinal VM (manuscript Fig. 1D’).
The 143 newly identified Biniou direct target genes are highly enriched in a number of functional classes of genes. Most notable is the enrichment of ‘transcriptional regulators’: A comparison to a curated database (FlyTF (Adryan and Teichmann 2006)) identified ~20% of Biniou target genes as transcription factors (Supple. Fig. 7A). This group provides a useful resource to further explore the transcriptional network governing VM development. Biniou also targets components of many of the major developmental signalling pathways, which likely impart spatial inputs to Biniou-bound CRMs (supple. Fig. 7B): FGF (bnl, stumps), EGF (star), Hh (pxb), Wg (pan (dTCF)), Notch-Delta (neur). Biniou also binds to CRMs of two components of the semaphorin signalling pathway: off-track (Fig. 2E: otk) and mical. Both genes are expressed in the nervous system, where they play a role in receiving and integrating axonal guidance cues (Winberg et al. 2001; Terman et al. 2002). As these genes were unexpected targets for a muscle specific transcription factor, we re-examined their expression to determine if they are also expressed in the developing visceral muscle. In situ hybridization of off-track revealed that it is expressed in the circular VM during the stages of VM migra-tion, and that this expression depends on biniou activity (Fig. 5E). Moreover, the Binou-bound enhancer recapitulates the endogenous genes’ expression (Fig. 2E).
Biniou direct target genes implicated in cell signalling
Flybase ID Gene Pathway
FBgn0004364 18 wheeler (18w) Toll-likeFBgn0022131 atypical protein kinase C (aPKC) GPCR-signaling
transductionFBgn0014135 branchless (bnl) FGFFBgn0000490 Decapentaplegic (dpp) DppFBgn0000463 Delta (Dl) Notch/DeltaFBgn0000546 Ecdysone receptor (EcR) EcdysoneFBgn0024222 immune response deficient 5 (ird5) TollFBgn0034590 Magi Maguk proteinFBgn0002932 Neuralized (neur) Notch/DeltaFBgn0019664 pangolin (pan) WgFBgn0003177 polychaetoid (pyd) Maguk proteinFBgn0053207 Pxb HhFBgn0053529 Rapgap1 RTK/RASFBgn0026181 Rho-kinase (rok) Rho signalingFBgn0003310 Star (S) EGFFBgn0020299 stumps FGFFBgn0041184 Suppressor of cytokine signaling at 36E (Socs36E) JNKFBgn0033134 Tetraspanin 42El (Tsp42El) membrane signaling
complex
Biniou direct target genes annotated as TFs (www.FlyTF.org)
Flybase ID Gene
FBgn0015903 apontic (apt)FBgn0004862 bagpipe (bap)FBgn0010460 bunched (bun)FBgn0000251 caudal (cad)FBgn0008649 delilah (dei)FBgn0011763 DP transcription factor (Dp)FBgn0000492 Drop (Dr)FBgn0002633 E(spl) region transcript m7 (HLHm7)FBgn0000546 Ecdysone receptor (EcR)FBgn0001981 escargot (esg)FBgn0004895 forkhead domain 64A (fd64A)FBgn0004914 Hepatocyte nuclear factor 4 (Hnf4)FBgn0022740 HLH54F (HLH54F)FBgn0001235 homothorax (hth)FBgn0000448 Hormone receptor-like in 46 (Hr46)FBgn0001269 invected (inv)FBgn0011236 ken and barbie (ken)FBgn0008651 ladybird late (lbl)FBgn0039039 lame duck (lmd)FBgn0005630 longitudinals lacking (lola)FBgn0040765 luna (luna)FBgn0030505 NFAT (NFAT)FBgn0003002 odd paired (opa)FBgn0019664 pangolin (pan)FBgn0003118 pointed (pnt)FBgn0003460 sine oculis (so)FBgn0004579 spalt major (salm)FBgn0003866 teashirt (tsh)FBgn0003870 tramtrak (ttk)FBgn0003862 trithorax (trx)FBgn0016076 vrille (vri)FBgn0004606 Zn finger homeodomain 1 (zfh1)
Biniou & Mef2 co-bound enhancers
jakobsen et al
2
Supplemental Figure 4Supplemental Figure 2 Supplemental Figure 5 Supplemental Figure 7B
Supplemental Figure 7: Biniou targets a large number of transcription factors
and components of signaling cascades
Supplemental Figure 7ASupplemental Figure 6
Supplemental Figure 4: Endogenous expression of the CG2330 gene
Supplemental Figure 3
Supplemental Figure 2:
Biniou ChIP binding to the three characterised Biniou-regulated enhancers
Supplemental Figure 1:
Expression profiling of biniou mutant
embryos
The 1,164 genes with differential expres-sion were clustered by K-medians clustering, using Pearson uncentered correlations to calculate the distance metric (TIGR-Mev, (Saeed et al. 2003)). Each row corresponds to one gene, each column corresponds to one developmental condition, in the following order from left to right: biniou loss-of-function 5-6 hrs, 6-7hrs, 7-8hr, 8-9hrs, 9-10hrs and 13-14hrs, ectopic biniou 4-5hrs, 5-6hrs, 6-7hrs. All measurements are ratios of biniou mutant embryos over stage matched wild type embryos. Yellow represents increased expression in mutant compared to wild-type, blue represents decreased expression, and black is no change. The degree of change is indicated by the scale on the bottom (log2). The data falls into four major clusters, two of which have significantly reduced levels of expression (clusters 1 & 2), indicating a genetic dependency on biniou for their expression. Genes known to be expressed in visceral muscle are indicated. Cluster 2 contains a number of genes that only change expression late in development, suggesting a role in later aspects of VM morphogen-esis or function. Some of these genes are also likely to be secondary responses to the lack of VM at these late stages. For example, HLH54F is specifically expressed in the longitudinal muscle and does not change expression in biniou mutants at early stages of development when the trunk VM cells are still present. Rather this gene is only differentially expressed at later stages when the longitudinal VM migration is blocked due to a lack of trunk VM. Surprisingly few genes had increased expression with ectopic expression of biniou. We believe that this result is biological as bagpipe is ectopically expressed. The fact that Biniou is not sufficient to ectopically express many genes likely reflects the need for extensive combinatorial regulation, which is strongly supported by our ChIP-on-chip experi-ments.
(A-C) Schematic overview of genomic regions containing characterised Biniou-enhancers: The gene is depicted at the bottom of the panel, with exons in black and introns in grey. Genomic fragments on the tiling arrays are indicated as stacks of four horizontal grey bars in their corresponding genomic position. Each single bar represents the results from one ChIP-on-chip time-period, with the earliest (6-8 hrs, stages 10-11) positioned at the top of the stack and the latest (12-14 hrs, stage 15) at the bottom of the stack. Blue arrow represents the direction of developmental time. The red bars indicate Biniou binding, light red bars indicate binding just below our stringent cut-off. The green double-headed arrows indicate the known enhancers. Note, Biniou binds to all three characterised Bagpipe enhancers, indicating a potential regulatory connection in other VM subtypes, in addition to the trunk VM.
Motif clover_result_bin_early_regions clover_result_bin_contin_regions clover_result_bin_late_regions
Score Pval Score Pval Score Pval
OVER - REPRESENTED RESULTS
FLYREG_Aef1 16.5 0
FLYREG_BEAF-32 -3.49 0 -4.03 0 -3.77 0.001
FLYREG_BEAF-32B -4.25 0.007 -3.86 0.01
FLYREG_Top2 32.3 0.001 104 0 58.7 0
FLYREG_Trl 6.7 0.001 42.8 0 11.3 0
FLYREG_bin -2.07 0 -1.97 0 -2.12 0
FLYREG_ey 15.7 0.002
FLYREG_hkb 7.99 0.007
FLYREG_kni -2.04 0
FLYREG_toy 8.19 0.001
JASPAR_CORE_MA0011 Broad-complex_2 ZN-FINGER, C2H2
-2.96 0.01
JASPAR_CORE_MA0012 Broad-complex_3 ZN-FINGER, C2H2
-0.349 0.009 4.77 0 2.13 0
JASPAR_CORE_MA0013 Broad-complex_4 ZN-FINGER, C2H2
6.28 0 2.28 0.003
JASPAR_FAMILY_MF0002 bZIPCREB/G-box-like subclass bZIP
-4.3 0.005
JASPAR_FAMILY_MF0003 REL classREL
15.2 0.006
JASPAR_FAMILY_MF0005 Forkheadclass Forkhead
25.8 0.001 98.4 0 44.2 0
JASPAR_FAMILY_MF0011 HMG classHMG
0.591 0.001 3.43 0.007
Michal_Adf1_01 98.7 0.002
Michal_Dref_01 -3.82 0.002 -4.55 0.001 -4.07 0.001
Michal_Mad_01 33.6 0
Michal_Mef2_01 12.2 0 30.3 0
Michal_pan_01 36.5 0.006
Michal_pho_01 12.4 0
Michal_srp_01 -3.38 0.001 -3.93 0 -3.64 0.001
Michal_z_01 0.779 0
TRANSFAC_CF2II_01;CF2-II;CF2-II;CF2-II; Species: fruit fly, Drosophilamelanogaster.
11.3 0.001 21.9 0 17.4 0
TRANSFAC_CF2II_02;CF2-II;CF2-II;CF2-II; Species: fruit fly, Drosophilamelanogaster.
13 0.002 19.6 0.005 20.8 0
TRANSFAC_CROC_01;Croc;Crocodileregulator of head development;Croc;Species: fruit fly, Drosophilamelanogaster.
27.6 0
TRANSFAC_DL_01;dl;dorsal;Dl;Species: fruit fly, Drosophilamelanogaster.
13 0.003 12 0.001
TRANSFAC_HAIRY_01;Hairy;Hairy;H;Species: fruit fly, Drosophilamelanogaster.
5.83 0.01
TRANSFAC_HSF_01;HSF;heat shockfactor (Drosophila);HSTF; Species:fruit fly, Drosophila melanogaster.
-2.2 0.004
TRANSFAC_HSF_04;HSF;heat shockfactor (Drosophila);HSTF; Species:fruit fly, Drosophila melanogaster.
6.36 0
TRANSFAC_TATA_01; TATA; cellularand viral TATA box elements;TBP;Species: human, Homo sapiens.;TBP;Species: mouse, Mus musculus.;TBP;Species: fruit fly, Drosophilamelanogaster.
-2.37 0.005
bin 5
-6
bin 6
-7
bin 7
-8
bin 8
-9
bin 9
-10
bin 1
3-14
over
exp
4-5
over
exp
5-6
over
exp
6-7
bin 5
-6
bin 6
-7
bin 7
-8
bin 8
-9
bin 9
-10
bin 1
3-14
over
exp
4-5
over
exp
5-6
over
exp
6-7
bin 5
-6
bin 6
-7
bin 7
-8
bin 8
-9
bin 9
-10
bin 1
3-14
over
exp
4-5
over
exp
5-6
over
exp
6-7
ttk-V
ME
1 kb
ttk
ttk-VME
fd64a-V
ME
1 kb
LATE
EARLY
fd64a CG1134
fd64a-e-VME
fd64a-l-VME
HL
H5
4F-V
ME
1 kb
HLH54F CG5009
HLH54F-VME
otk-V
ME
1 kbotk
otk-VME
mib
2-V
ME
1 kb
mib2 CG10449
mib2-VME
ken-V
ME
1 kb
kenCG4581
ken-VME
1 kb
5' 3'ßTub60D
1 kbdpp
5' 3'
1 kb
5' 3'bap
1 2
3
C
B
A
4)2)1)
3)
F
E
D
C
B
A
CG
2330
Stage 11 Stage 13 Stage 15/16
bap
6-8
bin 6
-8
bin 8
-10
bin 1
0-12
bin 1
2-14
Mef
2 6-
8
Mef
2 8-
10
Mef
2 10
-12
bap
6-8
bin 6
-8
bin 8
-10
bin 1
0-12
bin 1
2-14
Mef
2 6-
8
Mef
2 8-
10
Mef
2 10
-12
bap
6-8
bin 6
-8
bin 8
-10
bin 1
0-12
bin 1
2-14
Mef
2 6-
8
Mef
2 8-
10
Mef
2 10
-12
Continuously-bound Late-boundEarly-bound
In situ hybridisation using a DIG-labelled probe directed against the coding region of CG2330. There is no detectable expression at stage 11, with weak expression initiating at stage 12. From stage 13-16 CG2330 is expressed in the trunk VM, somatic muscle and pharyngeal muscle. It is not possible from these in situs to distinguish between trunk circular or longitudinal muscle. However, the Biniou-bound enhancer drives specific expression in the longitudinal VM (manuscript Fig. 1D’).
The 143 newly identified Biniou direct target genes are highly enriched in a number of functional classes of genes. Most notable is the enrichment of ‘transcriptional regulators’: A comparison to a curated database (FlyTF (Adryan and Teichmann 2006)) identified ~20% of Biniou target genes as transcription factors (Supple. Fig. 7A). This group provides a useful resource to further explore the transcriptional network governing VM development. Biniou also targets components of many of the major developmental signalling pathways, which likely impart spatial inputs to Biniou-bound CRMs (supple. Fig. 7B): FGF (bnl, stumps), EGF (star), Hh (pxb), Wg (pan (dTCF)), Notch-Delta (neur). Biniou also binds to CRMs of two components of the semaphorin signalling pathway: off-track (Fig. 2E: otk) and mical. Both genes are expressed in the nervous system, where they play a role in receiving and integrating axonal guidance cues (Winberg et al. 2001; Terman et al. 2002). As these genes were unexpected targets for a muscle specific transcription factor, we re-examined their expression to determine if they are also expressed in the developing visceral muscle. In situ hybridization of off-track revealed that it is expressed in the circular VM during the stages of VM migra-tion, and that this expression depends on biniou activity (Fig. 5E). Moreover, the Binou-bound enhancer recapitulates the endogenous genes’ expression (Fig. 2E).
Biniou direct target genes implicated in cell signalling
Flybase ID Gene Pathway
FBgn0004364 18 wheeler (18w) Toll-likeFBgn0022131 atypical protein kinase C (aPKC) GPCR-signaling
transductionFBgn0014135 branchless (bnl) FGFFBgn0000490 Decapentaplegic (dpp) DppFBgn0000463 Delta (Dl) Notch/DeltaFBgn0000546 Ecdysone receptor (EcR) EcdysoneFBgn0024222 immune response deficient 5 (ird5) TollFBgn0034590 Magi Maguk proteinFBgn0002932 Neuralized (neur) Notch/DeltaFBgn0019664 pangolin (pan) WgFBgn0003177 polychaetoid (pyd) Maguk proteinFBgn0053207 Pxb HhFBgn0053529 Rapgap1 RTK/RASFBgn0026181 Rho-kinase (rok) Rho signalingFBgn0003310 Star (S) EGFFBgn0020299 stumps FGFFBgn0041184 Suppressor of cytokine signaling at 36E (Socs36E) JNKFBgn0033134 Tetraspanin 42El (Tsp42El) membrane signaling
complex
Biniou direct target genes annotated as TFs (www.FlyTF.org)
Flybase ID Gene
FBgn0015903 apontic (apt)FBgn0004862 bagpipe (bap)FBgn0010460 bunched (bun)FBgn0000251 caudal (cad)FBgn0008649 delilah (dei)FBgn0011763 DP transcription factor (Dp)FBgn0000492 Drop (Dr)FBgn0002633 E(spl) region transcript m7 (HLHm7)FBgn0000546 Ecdysone receptor (EcR)FBgn0001981 escargot (esg)FBgn0004895 forkhead domain 64A (fd64A)FBgn0004914 Hepatocyte nuclear factor 4 (Hnf4)FBgn0022740 HLH54F (HLH54F)FBgn0001235 homothorax (hth)FBgn0000448 Hormone receptor-like in 46 (Hr46)FBgn0001269 invected (inv)FBgn0011236 ken and barbie (ken)FBgn0008651 ladybird late (lbl)FBgn0039039 lame duck (lmd)FBgn0005630 longitudinals lacking (lola)FBgn0040765 luna (luna)FBgn0030505 NFAT (NFAT)FBgn0003002 odd paired (opa)FBgn0019664 pangolin (pan)FBgn0003118 pointed (pnt)FBgn0003460 sine oculis (so)FBgn0004579 spalt major (salm)FBgn0003866 teashirt (tsh)FBgn0003870 tramtrak (ttk)FBgn0003862 trithorax (trx)FBgn0016076 vrille (vri)FBgn0004606 Zn finger homeodomain 1 (zfh1)
Biniou & Mef2 co-bound enhancers
jakobsen et al
3

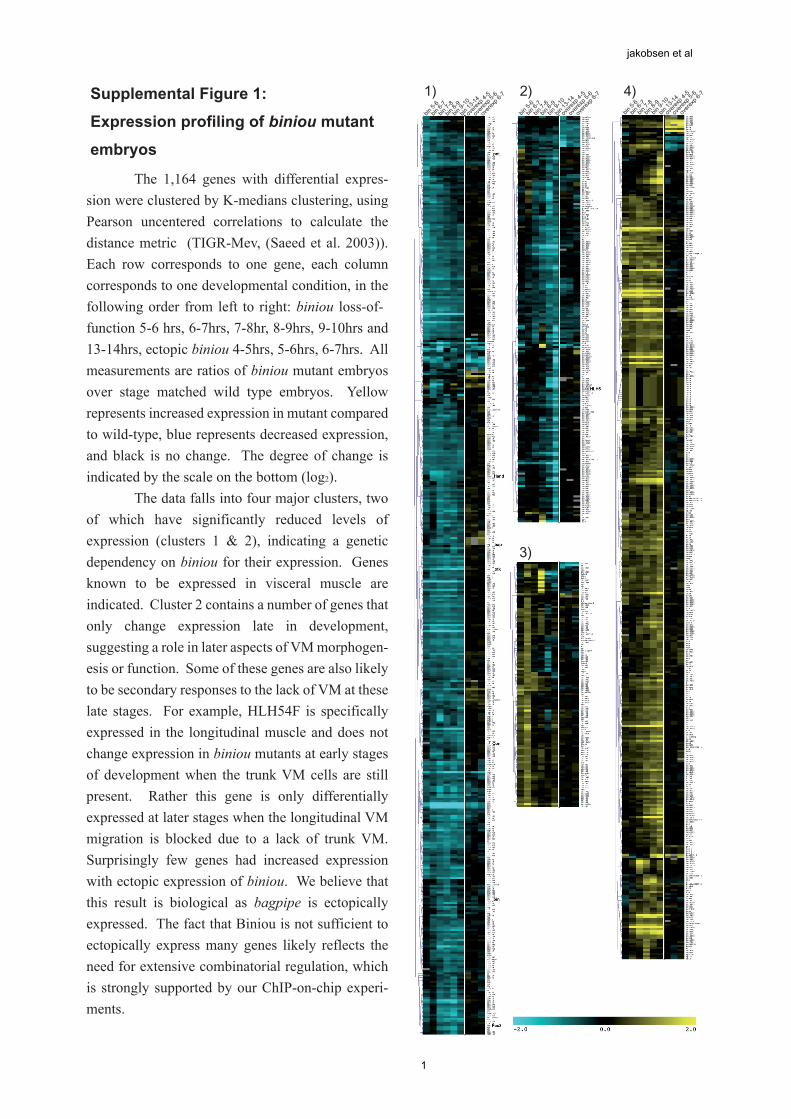
Supplemental Figure 3: Biniou enhancer binding determines the timing
of enhancer activity
(A more detailed description of the genomic location and spatial expression of the
enhancers shown in manuscript Fig. 2)
(A-F) Schematic overview of the genomic regions used in Figure 2 (manuscript): Thegene is depicted at the bottom of the panel, with exons in black and introns in grey.
Genomic fragments on the tiling arrays are indicated as stacks of four horizontal grey
bars in their corresponding genomic position. Each single bar represents the resultsfrom one ChIP-on-chip time-period, with the earliest (10-11) positioned at the top of
the stack and the latest (stage 15) at the bottom of the stack. Blue arrow representsthe direction of developmental time. The red bars indicate Biniou binding. The black
double headed arrow represents the cloned region used to make transgenic reporter
lines. All enhancer regions are named by the gene locus followed by –VME (VisceralMuscle Enhancer)
(A) The VME region 5’ to the ttk locus initiates expression at stage 10 in the trunkand hindgut VM, followed shortly thereafter by expression in the somatic mesoderm.
The visceral mesoderm expression if absent by stage 13, and all traceable enhanceractivity in the somatic muscle is absent by stage 15. The time-span of enhancer
expression in the VM (stages 10-12) match the specific Biniou binding during theearly ChIP time points (note only the upper bars in supple. Fig. 3A are red, lower are
grey)
(B) The fd64a-early-VME initiates expression at stage 10 specifically in the hindgutVM, and switches off activity at late stages of development. (There is also transientexpression detectable in cells at the ventral side of the embryo at stage 13).
In contrast the fd64a-late-VME is expressed from stage 13 to 15 in a subset of cellswithin the anterior and posterior regions of the trunk VM. Note, the time-span of
Biniou binding to both enhancers reflects the timing of enhancer activity (supple. Fig.
3B: fd64a-early-VME ChIP enrichments at stages 10-11 only (red bars), while thelate-VME has ChIP binding only at the last two time-periods (stages 13-15, red bars).
In the case of fd64a, Biniou impinges on two different regulatory modules, which
both have restricted temporal and spatial expression.
(C) The HLH54F-VME drives specific expression in the caudal VM from stages 10-16, recapitulating the full expression of the endogenous gene.
jakobsen et al
4

(D) The otk-VME, located in the last intron of this gene, drives expression in thetrunk VM and hindgut VM from stages 11-16. Interestingly, this enhancer’sexpression coincides with regions of the trunk VM that demarcate the future
compartments of the midgut. This enhancer nicely recapitulates the endogenousgenes expression in the VM (compare manuscript Fig. 2E to 5E)
(E) The intronic VME for the mib2 gene initiates expression at early stage 11 in thetrunk and hindgut VM as well as the somatic muscle. At stage 13 expression is also
detected in the foregut VM. At stage 15-16 the somatic muscle expression ismaintained, however there is no detectable expression in the trunk VM, despite
continued Biniou enhancer binding. Both the VM and somatic muscle expression of
this enhancer closely matches the expression of the mib2 gene.
(F) The ken-VME initiates expression in the salivary glands and in some segmentallyclusters of neuronal cells. At stage 14-15 enhancer expression initiates in the anterior
part of the foregut VM, matching the late binding of Biniou detected by ChIP (red
bars). Fluorescent in situ hybridisation with biniou showed specific co-localisation inthe foregut VM at stages 14 and 15 (see manuscript Fig. 2I).
jakobsen et al
5

Supplemental Figure 4Supplemental Figure 2 Supplemental Figure 5 Supplemental Figure 7B
Supplemental Figure 7: Biniou targets a large number of transcription factors
and components of signaling cascades
Supplemental Figure 7ASupplemental Figure 6
Supplemental Figure 4: Endogenous expression of the CG2330 gene
Supplemental Figure 3
Supplemental Figure 2:
Biniou ChIP binding to the three characterised Biniou-regulated enhancers
Supplemental Figure 1:
Expression profiling of biniou mutant
embryos
The 1,164 genes with differential expres-sion were clustered by K-medians clustering, using Pearson uncentered correlations to calculate the distance metric (TIGR-Mev, (Saeed et al. 2003)). Each row corresponds to one gene, each column corresponds to one developmental condition, in the following order from left to right: biniou loss-of-function 5-6 hrs, 6-7hrs, 7-8hr, 8-9hrs, 9-10hrs and 13-14hrs, ectopic biniou 4-5hrs, 5-6hrs, 6-7hrs. All measurements are ratios of biniou mutant embryos over stage matched wild type embryos. Yellow represents increased expression in mutant compared to wild-type, blue represents decreased expression, and black is no change. The degree of change is indicated by the scale on the bottom (log2). The data falls into four major clusters, two of which have significantly reduced levels of expression (clusters 1 & 2), indicating a genetic dependency on biniou for their expression. Genes known to be expressed in visceral muscle are indicated. Cluster 2 contains a number of genes that only change expression late in development, suggesting a role in later aspects of VM morphogen-esis or function. Some of these genes are also likely to be secondary responses to the lack of VM at these late stages. For example, HLH54F is specifically expressed in the longitudinal muscle and does not change expression in biniou mutants at early stages of development when the trunk VM cells are still present. Rather this gene is only differentially expressed at later stages when the longitudinal VM migration is blocked due to a lack of trunk VM. Surprisingly few genes had increased expression with ectopic expression of biniou. We believe that this result is biological as bagpipe is ectopically expressed. The fact that Biniou is not sufficient to ectopically express many genes likely reflects the need for extensive combinatorial regulation, which is strongly supported by our ChIP-on-chip experi-ments.
(A-C) Schematic overview of genomic regions containing characterised Biniou-enhancers: The gene is depicted at the bottom of the panel, with exons in black and introns in grey. Genomic fragments on the tiling arrays are indicated as stacks of four horizontal grey bars in their corresponding genomic position. Each single bar represents the results from one ChIP-on-chip time-period, with the earliest (6-8 hrs, stages 10-11) positioned at the top of the stack and the latest (12-14 hrs, stage 15) at the bottom of the stack. Blue arrow represents the direction of developmental time. The red bars indicate Biniou binding, light red bars indicate binding just below our stringent cut-off. The green double-headed arrows indicate the known enhancers. Note, Biniou binds to all three characterised Bagpipe enhancers, indicating a potential regulatory connection in other VM subtypes, in addition to the trunk VM.
Motif clover_result_bin_early_regions clover_result_bin_contin_regions clover_result_bin_late_regions
Score Pval Score Pval Score Pval
OVER - REPRESENTED RESULTS
FLYREG_Aef1 16.5 0
FLYREG_BEAF-32 -3.49 0 -4.03 0 -3.77 0.001
FLYREG_BEAF-32B -4.25 0.007 -3.86 0.01
FLYREG_Top2 32.3 0.001 104 0 58.7 0
FLYREG_Trl 6.7 0.001 42.8 0 11.3 0
FLYREG_bin -2.07 0 -1.97 0 -2.12 0
FLYREG_ey 15.7 0.002
FLYREG_hkb 7.99 0.007
FLYREG_kni -2.04 0
FLYREG_toy 8.19 0.001
JASPAR_CORE_MA0011 Broad-complex_2 ZN-FINGER, C2H2
-2.96 0.01
JASPAR_CORE_MA0012 Broad-complex_3 ZN-FINGER, C2H2
-0.349 0.009 4.77 0 2.13 0
JASPAR_CORE_MA0013 Broad-complex_4 ZN-FINGER, C2H2
6.28 0 2.28 0.003
JASPAR_FAMILY_MF0002 bZIPCREB/G-box-like subclass bZIP
-4.3 0.005
JASPAR_FAMILY_MF0003 REL classREL
15.2 0.006
JASPAR_FAMILY_MF0005 Forkheadclass Forkhead
25.8 0.001 98.4 0 44.2 0
JASPAR_FAMILY_MF0011 HMG classHMG
0.591 0.001 3.43 0.007
Michal_Adf1_01 98.7 0.002
Michal_Dref_01 -3.82 0.002 -4.55 0.001 -4.07 0.001
Michal_Mad_01 33.6 0
Michal_Mef2_01 12.2 0 30.3 0
Michal_pan_01 36.5 0.006
Michal_pho_01 12.4 0
Michal_srp_01 -3.38 0.001 -3.93 0 -3.64 0.001
Michal_z_01 0.779 0
TRANSFAC_CF2II_01;CF2-II;CF2-II;CF2-II; Species: fruit fly, Drosophilamelanogaster.
11.3 0.001 21.9 0 17.4 0
TRANSFAC_CF2II_02;CF2-II;CF2-II;CF2-II; Species: fruit fly, Drosophilamelanogaster.
13 0.002 19.6 0.005 20.8 0
TRANSFAC_CROC_01;Croc;Crocodileregulator of head development;Croc;Species: fruit fly, Drosophilamelanogaster.
27.6 0
TRANSFAC_DL_01;dl;dorsal;Dl;Species: fruit fly, Drosophilamelanogaster.
13 0.003 12 0.001
TRANSFAC_HAIRY_01;Hairy;Hairy;H;Species: fruit fly, Drosophilamelanogaster.
5.83 0.01
TRANSFAC_HSF_01;HSF;heat shockfactor (Drosophila);HSTF; Species:fruit fly, Drosophila melanogaster.
-2.2 0.004
TRANSFAC_HSF_04;HSF;heat shockfactor (Drosophila);HSTF; Species:fruit fly, Drosophila melanogaster.
6.36 0
TRANSFAC_TATA_01; TATA; cellularand viral TATA box elements;TBP;Species: human, Homo sapiens.;TBP;Species: mouse, Mus musculus.;TBP;Species: fruit fly, Drosophilamelanogaster.
-2.37 0.005
bin 5
-6
bin 6
-7
bin 7
-8
bin 8
-9
bin 9
-10
bin 1
3-14
over
exp
4-5
over
exp
5-6
over
exp
6-7
bin 5
-6
bin 6
-7
bin 7
-8
bin 8
-9
bin 9
-10
bin 1
3-14
over
exp
4-5
over
exp
5-6
over
exp
6-7
bin 5
-6
bin 6
-7
bin 7
-8
bin 8
-9
bin 9
-10
bin 1
3-14
over
exp
4-5
over
exp
5-6
over
exp
6-7
ttk-V
ME
1 kb
ttk
ttk-VME
fd64a-V
ME
1 kb
LATE
EARLY
fd64a CG1134
fd64a-e-VME
fd64a-l-VME
HL
H5
4F-V
ME
1 kb
HLH54F CG5009
HLH54F-VME
otk-V
ME
1 kbotk
otk-VME
mib
2-V
ME
1 kb
mib2 CG10449
mib2-VME
ken-V
ME
1 kb
kenCG4581
ken-VME
1 kb
5' 3'ßTub60D
1 kbdpp
5' 3'
1 kb
5' 3'bap
1 2
3
C
B
A
4)2)1)
3)
F
E
D
C
B
A
CG
2330
Stage 11 Stage 13 Stage 15/16
bap
6-8
bin 6
-8
bin 8
-10
bin 1
0-12
bin 1
2-14
Mef
2 6-
8
Mef
2 8-
10
Mef
2 10
-12
bap
6-8
bin 6
-8
bin 8
-10
bin 1
0-12
bin 1
2-14
Mef
2 6-
8
Mef
2 8-
10
Mef
2 10
-12
bap
6-8
bin 6
-8
bin 8
-10
bin 1
0-12
bin 1
2-14
Mef
2 6-
8
Mef
2 8-
10
Mef
2 10
-12
Continuously-bound Late-boundEarly-bound
In situ hybridisation using a DIG-labelled probe directed against the coding region of CG2330. There is no detectable expression at stage 11, with weak expression initiating at stage 12. From stage 13-16 CG2330 is expressed in the trunk VM, somatic muscle and pharyngeal muscle. It is not possible from these in situs to distinguish between trunk circular or longitudinal muscle. However, the Biniou-bound enhancer drives specific expression in the longitudinal VM (manuscript Fig. 1D’).
The 143 newly identified Biniou direct target genes are highly enriched in a number of functional classes of genes. Most notable is the enrichment of ‘transcriptional regulators’: A comparison to a curated database (FlyTF (Adryan and Teichmann 2006)) identified ~20% of Biniou target genes as transcription factors (Supple. Fig. 7A). This group provides a useful resource to further explore the transcriptional network governing VM development. Biniou also targets components of many of the major developmental signalling pathways, which likely impart spatial inputs to Biniou-bound CRMs (supple. Fig. 7B): FGF (bnl, stumps), EGF (star), Hh (pxb), Wg (pan (dTCF)), Notch-Delta (neur). Biniou also binds to CRMs of two components of the semaphorin signalling pathway: off-track (Fig. 2E: otk) and mical. Both genes are expressed in the nervous system, where they play a role in receiving and integrating axonal guidance cues (Winberg et al. 2001; Terman et al. 2002). As these genes were unexpected targets for a muscle specific transcription factor, we re-examined their expression to determine if they are also expressed in the developing visceral muscle. In situ hybridization of off-track revealed that it is expressed in the circular VM during the stages of VM migra-tion, and that this expression depends on biniou activity (Fig. 5E). Moreover, the Binou-bound enhancer recapitulates the endogenous genes’ expression (Fig. 2E).
Biniou direct target genes implicated in cell signalling
Flybase ID Gene Pathway
FBgn0004364 18 wheeler (18w) Toll-likeFBgn0022131 atypical protein kinase C (aPKC) GPCR-signaling
transductionFBgn0014135 branchless (bnl) FGFFBgn0000490 Decapentaplegic (dpp) DppFBgn0000463 Delta (Dl) Notch/DeltaFBgn0000546 Ecdysone receptor (EcR) EcdysoneFBgn0024222 immune response deficient 5 (ird5) TollFBgn0034590 Magi Maguk proteinFBgn0002932 Neuralized (neur) Notch/DeltaFBgn0019664 pangolin (pan) WgFBgn0003177 polychaetoid (pyd) Maguk proteinFBgn0053207 Pxb HhFBgn0053529 Rapgap1 RTK/RASFBgn0026181 Rho-kinase (rok) Rho signalingFBgn0003310 Star (S) EGFFBgn0020299 stumps FGFFBgn0041184 Suppressor of cytokine signaling at 36E (Socs36E) JNKFBgn0033134 Tetraspanin 42El (Tsp42El) membrane signaling
complex
Biniou direct target genes annotated as TFs (www.FlyTF.org)
Flybase ID Gene
FBgn0015903 apontic (apt)FBgn0004862 bagpipe (bap)FBgn0010460 bunched (bun)FBgn0000251 caudal (cad)FBgn0008649 delilah (dei)FBgn0011763 DP transcription factor (Dp)FBgn0000492 Drop (Dr)FBgn0002633 E(spl) region transcript m7 (HLHm7)FBgn0000546 Ecdysone receptor (EcR)FBgn0001981 escargot (esg)FBgn0004895 forkhead domain 64A (fd64A)FBgn0004914 Hepatocyte nuclear factor 4 (Hnf4)FBgn0022740 HLH54F (HLH54F)FBgn0001235 homothorax (hth)FBgn0000448 Hormone receptor-like in 46 (Hr46)FBgn0001269 invected (inv)FBgn0011236 ken and barbie (ken)FBgn0008651 ladybird late (lbl)FBgn0039039 lame duck (lmd)FBgn0005630 longitudinals lacking (lola)FBgn0040765 luna (luna)FBgn0030505 NFAT (NFAT)FBgn0003002 odd paired (opa)FBgn0019664 pangolin (pan)FBgn0003118 pointed (pnt)FBgn0003460 sine oculis (so)FBgn0004579 spalt major (salm)FBgn0003866 teashirt (tsh)FBgn0003870 tramtrak (ttk)FBgn0003862 trithorax (trx)FBgn0016076 vrille (vri)FBgn0004606 Zn finger homeodomain 1 (zfh1)
Biniou & Mef2 co-bound enhancers
jakobsen et al
6

Supplemental Figure 4Supplemental Figure 2 Supplemental Figure 5 Supplemental Figure 7B
Supplemental Figure 7: Biniou targets a large number of transcription factors
and components of signaling cascades
Supplemental Figure 7ASupplemental Figure 6
Supplemental Figure 4: Endogenous expression of the CG2330 gene
Supplemental Figure 3
Supplemental Figure 2:
Biniou ChIP binding to the three characterised Biniou-regulated enhancers
Supplemental Figure 1:
Expression profiling of biniou mutant
embryos
The 1,164 genes with differential expres-sion were clustered by K-medians clustering, using Pearson uncentered correlations to calculate the distance metric (TIGR-Mev, (Saeed et al. 2003)). Each row corresponds to one gene, each column corresponds to one developmental condition, in the following order from left to right: biniou loss-of-function 5-6 hrs, 6-7hrs, 7-8hr, 8-9hrs, 9-10hrs and 13-14hrs, ectopic biniou 4-5hrs, 5-6hrs, 6-7hrs. All measurements are ratios of biniou mutant embryos over stage matched wild type embryos. Yellow represents increased expression in mutant compared to wild-type, blue represents decreased expression, and black is no change. The degree of change is indicated by the scale on the bottom (log2). The data falls into four major clusters, two of which have significantly reduced levels of expression (clusters 1 & 2), indicating a genetic dependency on biniou for their expression. Genes known to be expressed in visceral muscle are indicated. Cluster 2 contains a number of genes that only change expression late in development, suggesting a role in later aspects of VM morphogen-esis or function. Some of these genes are also likely to be secondary responses to the lack of VM at these late stages. For example, HLH54F is specifically expressed in the longitudinal muscle and does not change expression in biniou mutants at early stages of development when the trunk VM cells are still present. Rather this gene is only differentially expressed at later stages when the longitudinal VM migration is blocked due to a lack of trunk VM. Surprisingly few genes had increased expression with ectopic expression of biniou. We believe that this result is biological as bagpipe is ectopically expressed. The fact that Biniou is not sufficient to ectopically express many genes likely reflects the need for extensive combinatorial regulation, which is strongly supported by our ChIP-on-chip experi-ments.
(A-C) Schematic overview of genomic regions containing characterised Biniou-enhancers: The gene is depicted at the bottom of the panel, with exons in black and introns in grey. Genomic fragments on the tiling arrays are indicated as stacks of four horizontal grey bars in their corresponding genomic position. Each single bar represents the results from one ChIP-on-chip time-period, with the earliest (6-8 hrs, stages 10-11) positioned at the top of the stack and the latest (12-14 hrs, stage 15) at the bottom of the stack. Blue arrow represents the direction of developmental time. The red bars indicate Biniou binding, light red bars indicate binding just below our stringent cut-off. The green double-headed arrows indicate the known enhancers. Note, Biniou binds to all three characterised Bagpipe enhancers, indicating a potential regulatory connection in other VM subtypes, in addition to the trunk VM.
Motif clover_result_bin_early_regions clover_result_bin_contin_regions clover_result_bin_late_regions
Score Pval Score Pval Score Pval
OVER - REPRESENTED RESULTS
FLYREG_Aef1 16.5 0
FLYREG_BEAF-32 -3.49 0 -4.03 0 -3.77 0.001
FLYREG_BEAF-32B -4.25 0.007 -3.86 0.01
FLYREG_Top2 32.3 0.001 104 0 58.7 0
FLYREG_Trl 6.7 0.001 42.8 0 11.3 0
FLYREG_bin -2.07 0 -1.97 0 -2.12 0
FLYREG_ey 15.7 0.002
FLYREG_hkb 7.99 0.007
FLYREG_kni -2.04 0
FLYREG_toy 8.19 0.001
JASPAR_CORE_MA0011 Broad-complex_2 ZN-FINGER, C2H2
-2.96 0.01
JASPAR_CORE_MA0012 Broad-complex_3 ZN-FINGER, C2H2
-0.349 0.009 4.77 0 2.13 0
JASPAR_CORE_MA0013 Broad-complex_4 ZN-FINGER, C2H2
6.28 0 2.28 0.003
JASPAR_FAMILY_MF0002 bZIPCREB/G-box-like subclass bZIP
-4.3 0.005
JASPAR_FAMILY_MF0003 REL classREL
15.2 0.006
JASPAR_FAMILY_MF0005 Forkheadclass Forkhead
25.8 0.001 98.4 0 44.2 0
JASPAR_FAMILY_MF0011 HMG classHMG
0.591 0.001 3.43 0.007
Michal_Adf1_01 98.7 0.002
Michal_Dref_01 -3.82 0.002 -4.55 0.001 -4.07 0.001
Michal_Mad_01 33.6 0
Michal_Mef2_01 12.2 0 30.3 0
Michal_pan_01 36.5 0.006
Michal_pho_01 12.4 0
Michal_srp_01 -3.38 0.001 -3.93 0 -3.64 0.001
Michal_z_01 0.779 0
TRANSFAC_CF2II_01;CF2-II;CF2-II;CF2-II; Species: fruit fly, Drosophilamelanogaster.
11.3 0.001 21.9 0 17.4 0
TRANSFAC_CF2II_02;CF2-II;CF2-II;CF2-II; Species: fruit fly, Drosophilamelanogaster.
13 0.002 19.6 0.005 20.8 0
TRANSFAC_CROC_01;Croc;Crocodileregulator of head development;Croc;Species: fruit fly, Drosophilamelanogaster.
27.6 0
TRANSFAC_DL_01;dl;dorsal;Dl;Species: fruit fly, Drosophilamelanogaster.
13 0.003 12 0.001
TRANSFAC_HAIRY_01;Hairy;Hairy;H;Species: fruit fly, Drosophilamelanogaster.
5.83 0.01
TRANSFAC_HSF_01;HSF;heat shockfactor (Drosophila);HSTF; Species:fruit fly, Drosophila melanogaster.
-2.2 0.004
TRANSFAC_HSF_04;HSF;heat shockfactor (Drosophila);HSTF; Species:fruit fly, Drosophila melanogaster.
6.36 0
TRANSFAC_TATA_01; TATA; cellularand viral TATA box elements;TBP;Species: human, Homo sapiens.;TBP;Species: mouse, Mus musculus.;TBP;Species: fruit fly, Drosophilamelanogaster.
-2.37 0.005
bin 5
-6
bin 6
-7
bin 7
-8
bin 8
-9
bin 9
-10
bin 1
3-14
over
exp
4-5
over
exp
5-6
over
exp
6-7
bin 5
-6
bin 6
-7
bin 7
-8
bin 8
-9
bin 9
-10
bin 1
3-14
over
exp
4-5
over
exp
5-6
over
exp
6-7
bin 5
-6
bin 6
-7
bin 7
-8
bin 8
-9
bin 9
-10
bin 1
3-14
over
exp
4-5
over
exp
5-6
over
exp
6-7
ttk-V
ME
1 kb
ttk
ttk-VME
fd64a-V
ME
1 kb
LATE
EARLY
fd64a CG1134
fd64a-e-VME
fd64a-l-VME
HL
H5
4F-V
ME
1 kb
HLH54F CG5009
HLH54F-VME
otk-V
ME
1 kbotk
otk-VME
mib
2-V
ME
1 kb
mib2 CG10449
mib2-VME
ken-V
ME
1 kb
kenCG4581
ken-VME
1 kb
5' 3'ßTub60D
1 kbdpp
5' 3'
1 kb
5' 3'bap
1 2
3
C
B
A
4)2)1)
3)
F
E
D
C
B
A
CG
2330
Stage 11 Stage 13 Stage 15/16
bap
6-8
bin 6
-8
bin 8
-10
bin 1
0-12
bin 1
2-14
Mef
2 6-
8
Mef
2 8-
10
Mef
2 10
-12
bap
6-8
bin 6
-8
bin 8
-10
bin 1
0-12
bin 1
2-14
Mef
2 6-
8
Mef
2 8-
10
Mef
2 10
-12
bap
6-8
bin 6
-8
bin 8
-10
bin 1
0-12
bin 1
2-14
Mef
2 6-
8
Mef
2 8-
10
Mef
2 10
-12
Continuously-bound Late-boundEarly-bound
In situ hybridisation using a DIG-labelled probe directed against the coding region of CG2330. There is no detectable expression at stage 11, with weak expression initiating at stage 12. From stage 13-16 CG2330 is expressed in the trunk VM, somatic muscle and pharyngeal muscle. It is not possible from these in situs to distinguish between trunk circular or longitudinal muscle. However, the Biniou-bound enhancer drives specific expression in the longitudinal VM (manuscript Fig. 1D’).
The 143 newly identified Biniou direct target genes are highly enriched in a number of functional classes of genes. Most notable is the enrichment of ‘transcriptional regulators’: A comparison to a curated database (FlyTF (Adryan and Teichmann 2006)) identified ~20% of Biniou target genes as transcription factors (Supple. Fig. 7A). This group provides a useful resource to further explore the transcriptional network governing VM development. Biniou also targets components of many of the major developmental signalling pathways, which likely impart spatial inputs to Biniou-bound CRMs (supple. Fig. 7B): FGF (bnl, stumps), EGF (star), Hh (pxb), Wg (pan (dTCF)), Notch-Delta (neur). Biniou also binds to CRMs of two components of the semaphorin signalling pathway: off-track (Fig. 2E: otk) and mical. Both genes are expressed in the nervous system, where they play a role in receiving and integrating axonal guidance cues (Winberg et al. 2001; Terman et al. 2002). As these genes were unexpected targets for a muscle specific transcription factor, we re-examined their expression to determine if they are also expressed in the developing visceral muscle. In situ hybridization of off-track revealed that it is expressed in the circular VM during the stages of VM migra-tion, and that this expression depends on biniou activity (Fig. 5E). Moreover, the Binou-bound enhancer recapitulates the endogenous genes’ expression (Fig. 2E).
Biniou direct target genes implicated in cell signalling
Flybase ID Gene Pathway
FBgn0004364 18 wheeler (18w) Toll-likeFBgn0022131 atypical protein kinase C (aPKC) GPCR-signaling
transductionFBgn0014135 branchless (bnl) FGFFBgn0000490 Decapentaplegic (dpp) DppFBgn0000463 Delta (Dl) Notch/DeltaFBgn0000546 Ecdysone receptor (EcR) EcdysoneFBgn0024222 immune response deficient 5 (ird5) TollFBgn0034590 Magi Maguk proteinFBgn0002932 Neuralized (neur) Notch/DeltaFBgn0019664 pangolin (pan) WgFBgn0003177 polychaetoid (pyd) Maguk proteinFBgn0053207 Pxb HhFBgn0053529 Rapgap1 RTK/RASFBgn0026181 Rho-kinase (rok) Rho signalingFBgn0003310 Star (S) EGFFBgn0020299 stumps FGFFBgn0041184 Suppressor of cytokine signaling at 36E (Socs36E) JNKFBgn0033134 Tetraspanin 42El (Tsp42El) membrane signaling
complex
Biniou direct target genes annotated as TFs (www.FlyTF.org)
Flybase ID Gene
FBgn0015903 apontic (apt)FBgn0004862 bagpipe (bap)FBgn0010460 bunched (bun)FBgn0000251 caudal (cad)FBgn0008649 delilah (dei)FBgn0011763 DP transcription factor (Dp)FBgn0000492 Drop (Dr)FBgn0002633 E(spl) region transcript m7 (HLHm7)FBgn0000546 Ecdysone receptor (EcR)FBgn0001981 escargot (esg)FBgn0004895 forkhead domain 64A (fd64A)FBgn0004914 Hepatocyte nuclear factor 4 (Hnf4)FBgn0022740 HLH54F (HLH54F)FBgn0001235 homothorax (hth)FBgn0000448 Hormone receptor-like in 46 (Hr46)FBgn0001269 invected (inv)FBgn0011236 ken and barbie (ken)FBgn0008651 ladybird late (lbl)FBgn0039039 lame duck (lmd)FBgn0005630 longitudinals lacking (lola)FBgn0040765 luna (luna)FBgn0030505 NFAT (NFAT)FBgn0003002 odd paired (opa)FBgn0019664 pangolin (pan)FBgn0003118 pointed (pnt)FBgn0003460 sine oculis (so)FBgn0004579 spalt major (salm)FBgn0003866 teashirt (tsh)FBgn0003870 tramtrak (ttk)FBgn0003862 trithorax (trx)FBgn0016076 vrille (vri)FBgn0004606 Zn finger homeodomain 1 (zfh1)
Biniou & Mef2 co-bound enhancers
jakobsen et al
7

Supplemental Figure 5: Over-represented motifs distinguish between
the three temporal groups of Biniou-bound enhancers
Each temporal group of Biniou-bound enhancers (manuscript Fig. 2A) wassearched for overrepresented known transcription factor binding motifs (TFBSs)
using the Clover program (Frith et al. 2004). The ChIP bound regions were repeatmasked. A set of 104 matrices for transcription factors from Drosophila
melanogaster was obtained from FlyReg (Bergman et al. 2005), Transfac (Matys et
al. 2006), Jaspar (Vlieghe et al. 2006) and the literature. Clover was used to searcheach temporal group (early, continuously and late bound) using default parameters
with all matrices. This analysis reported 33 different transcription factor signatures tobe over-represented in at least one of the three temporal groups, compared to
background (unenriched regions of the genome covered on the tiling array). The
results shown in the table contain the clover score, and also the Pval. We use the Pvalas the determining factor for significant enrichment.
The majority of motifs are enriched in all three groups, however the following arespecific to smaller sub-groups:
Early-bound enhancers: knirps (kni), Broad complex Zn finger
Early and Continuous: Beaf-32, HMG class, Mef2Continuous-bound: Aef1, toy, Rel, Mad, Pho, croc, pan, ey, hairy, HSF,
TBP
Continuous and late: BEAF-32, Broad complex Zn finger, Dl(All: Biniou, CF2II + others)
jakobsen et al
8

Supplemental Figure 4Supplemental Figure 2 Supplemental Figure 5 Supplemental Figure 7B
Supplemental Figure 7: Biniou targets a large number of transcription factors
and components of signaling cascades
Supplemental Figure 7ASupplemental Figure 6
Supplemental Figure 4: Endogenous expression of the CG2330 gene
Supplemental Figure 3
Supplemental Figure 2:
Biniou ChIP binding to the three characterised Biniou-regulated enhancers
Supplemental Figure 1:
Expression profiling of biniou mutant
embryos
The 1,164 genes with differential expres-sion were clustered by K-medians clustering, using Pearson uncentered correlations to calculate the distance metric (TIGR-Mev, (Saeed et al. 2003)). Each row corresponds to one gene, each column corresponds to one developmental condition, in the following order from left to right: biniou loss-of-function 5-6 hrs, 6-7hrs, 7-8hr, 8-9hrs, 9-10hrs and 13-14hrs, ectopic biniou 4-5hrs, 5-6hrs, 6-7hrs. All measurements are ratios of biniou mutant embryos over stage matched wild type embryos. Yellow represents increased expression in mutant compared to wild-type, blue represents decreased expression, and black is no change. The degree of change is indicated by the scale on the bottom (log2). The data falls into four major clusters, two of which have significantly reduced levels of expression (clusters 1 & 2), indicating a genetic dependency on biniou for their expression. Genes known to be expressed in visceral muscle are indicated. Cluster 2 contains a number of genes that only change expression late in development, suggesting a role in later aspects of VM morphogen-esis or function. Some of these genes are also likely to be secondary responses to the lack of VM at these late stages. For example, HLH54F is specifically expressed in the longitudinal muscle and does not change expression in biniou mutants at early stages of development when the trunk VM cells are still present. Rather this gene is only differentially expressed at later stages when the longitudinal VM migration is blocked due to a lack of trunk VM. Surprisingly few genes had increased expression with ectopic expression of biniou. We believe that this result is biological as bagpipe is ectopically expressed. The fact that Biniou is not sufficient to ectopically express many genes likely reflects the need for extensive combinatorial regulation, which is strongly supported by our ChIP-on-chip experi-ments.
(A-C) Schematic overview of genomic regions containing characterised Biniou-enhancers: The gene is depicted at the bottom of the panel, with exons in black and introns in grey. Genomic fragments on the tiling arrays are indicated as stacks of four horizontal grey bars in their corresponding genomic position. Each single bar represents the results from one ChIP-on-chip time-period, with the earliest (6-8 hrs, stages 10-11) positioned at the top of the stack and the latest (12-14 hrs, stage 15) at the bottom of the stack. Blue arrow represents the direction of developmental time. The red bars indicate Biniou binding, light red bars indicate binding just below our stringent cut-off. The green double-headed arrows indicate the known enhancers. Note, Biniou binds to all three characterised Bagpipe enhancers, indicating a potential regulatory connection in other VM subtypes, in addition to the trunk VM.
Motif clover_result_bin_early_regions clover_result_bin_contin_regions clover_result_bin_late_regions
Score Pval Score Pval Score Pval
OVER - REPRESENTED RESULTS
FLYREG_Aef1 16.5 0
FLYREG_BEAF-32 -3.49 0 -4.03 0 -3.77 0.001
FLYREG_BEAF-32B -4.25 0.007 -3.86 0.01
FLYREG_Top2 32.3 0.001 104 0 58.7 0
FLYREG_Trl 6.7 0.001 42.8 0 11.3 0
FLYREG_bin -2.07 0 -1.97 0 -2.12 0
FLYREG_ey 15.7 0.002
FLYREG_hkb 7.99 0.007
FLYREG_kni -2.04 0
FLYREG_toy 8.19 0.001
JASPAR_CORE_MA0011 Broad-complex_2 ZN-FINGER, C2H2
-2.96 0.01
JASPAR_CORE_MA0012 Broad-complex_3 ZN-FINGER, C2H2
-0.349 0.009 4.77 0 2.13 0
JASPAR_CORE_MA0013 Broad-complex_4 ZN-FINGER, C2H2
6.28 0 2.28 0.003
JASPAR_FAMILY_MF0002 bZIPCREB/G-box-like subclass bZIP
-4.3 0.005
JASPAR_FAMILY_MF0003 REL classREL
15.2 0.006
JASPAR_FAMILY_MF0005 Forkheadclass Forkhead
25.8 0.001 98.4 0 44.2 0
JASPAR_FAMILY_MF0011 HMG classHMG
0.591 0.001 3.43 0.007
Michal_Adf1_01 98.7 0.002
Michal_Dref_01 -3.82 0.002 -4.55 0.001 -4.07 0.001
Michal_Mad_01 33.6 0
Michal_Mef2_01 12.2 0 30.3 0
Michal_pan_01 36.5 0.006
Michal_pho_01 12.4 0
Michal_srp_01 -3.38 0.001 -3.93 0 -3.64 0.001
Michal_z_01 0.779 0
TRANSFAC_CF2II_01;CF2-II;CF2-II;CF2-II; Species: fruit fly, Drosophilamelanogaster.
11.3 0.001 21.9 0 17.4 0
TRANSFAC_CF2II_02;CF2-II;CF2-II;CF2-II; Species: fruit fly, Drosophilamelanogaster.
13 0.002 19.6 0.005 20.8 0
TRANSFAC_CROC_01;Croc;Crocodileregulator of head development;Croc;Species: fruit fly, Drosophilamelanogaster.
27.6 0
TRANSFAC_DL_01;dl;dorsal;Dl;Species: fruit fly, Drosophilamelanogaster.
13 0.003 12 0.001
TRANSFAC_HAIRY_01;Hairy;Hairy;H;Species: fruit fly, Drosophilamelanogaster.
5.83 0.01
TRANSFAC_HSF_01;HSF;heat shockfactor (Drosophila);HSTF; Species:fruit fly, Drosophila melanogaster.
-2.2 0.004
TRANSFAC_HSF_04;HSF;heat shockfactor (Drosophila);HSTF; Species:fruit fly, Drosophila melanogaster.
6.36 0
TRANSFAC_TATA_01; TATA; cellularand viral TATA box elements;TBP;Species: human, Homo sapiens.;TBP;Species: mouse, Mus musculus.;TBP;Species: fruit fly, Drosophilamelanogaster.
-2.37 0.005
bin 5
-6
bin 6
-7
bin 7
-8
bin 8
-9
bin 9
-10
bin 1
3-14
over
exp
4-5
over
exp
5-6
over
exp
6-7
bin 5
-6
bin 6
-7
bin 7
-8
bin 8
-9
bin 9
-10
bin 1
3-14
over
exp
4-5
over
exp
5-6
over
exp
6-7
bin 5
-6
bin 6
-7
bin 7
-8
bin 8
-9
bin 9
-10
bin 1
3-14
over
exp
4-5
over
exp
5-6
over
exp
6-7
ttk-V
ME
1 kb
ttk
ttk-VME
fd64a-V
ME
1 kb
LATE
EARLY
fd64a CG1134
fd64a-e-VME
fd64a-l-VME
HL
H5
4F-V
ME
1 kb
HLH54F CG5009
HLH54F-VME
otk-V
ME
1 kbotk
otk-VME
mib
2-V
ME
1 kb
mib2 CG10449
mib2-VME
ken-V
ME
1 kb
kenCG4581
ken-VME
1 kb
5' 3'ßTub60D
1 kbdpp
5' 3'
1 kb
5' 3'bap
1 2
3
C
B
A
4)2)1)
3)
F
E
D
C
B
A
CG
2330
Stage 11 Stage 13 Stage 15/16
bap
6-8
bin 6
-8
bin 8
-10
bin 1
0-12
bin 1
2-14
Mef
2 6-
8
Mef
2 8-
10
Mef
2 10
-12
bap
6-8
bin 6
-8
bin 8
-10
bin 1
0-12
bin 1
2-14
Mef
2 6-
8
Mef
2 8-
10
Mef
2 10
-12
bap
6-8
bin 6
-8
bin 8
-10
bin 1
0-12
bin 1
2-14
Mef
2 6-
8
Mef
2 8-
10
Mef
2 10
-12
Continuously-bound Late-boundEarly-bound
In situ hybridisation using a DIG-labelled probe directed against the coding region of CG2330. There is no detectable expression at stage 11, with weak expression initiating at stage 12. From stage 13-16 CG2330 is expressed in the trunk VM, somatic muscle and pharyngeal muscle. It is not possible from these in situs to distinguish between trunk circular or longitudinal muscle. However, the Biniou-bound enhancer drives specific expression in the longitudinal VM (manuscript Fig. 1D’).
The 143 newly identified Biniou direct target genes are highly enriched in a number of functional classes of genes. Most notable is the enrichment of ‘transcriptional regulators’: A comparison to a curated database (FlyTF (Adryan and Teichmann 2006)) identified ~20% of Biniou target genes as transcription factors (Supple. Fig. 7A). This group provides a useful resource to further explore the transcriptional network governing VM development. Biniou also targets components of many of the major developmental signalling pathways, which likely impart spatial inputs to Biniou-bound CRMs (supple. Fig. 7B): FGF (bnl, stumps), EGF (star), Hh (pxb), Wg (pan (dTCF)), Notch-Delta (neur). Biniou also binds to CRMs of two components of the semaphorin signalling pathway: off-track (Fig. 2E: otk) and mical. Both genes are expressed in the nervous system, where they play a role in receiving and integrating axonal guidance cues (Winberg et al. 2001; Terman et al. 2002). As these genes were unexpected targets for a muscle specific transcription factor, we re-examined their expression to determine if they are also expressed in the developing visceral muscle. In situ hybridization of off-track revealed that it is expressed in the circular VM during the stages of VM migra-tion, and that this expression depends on biniou activity (Fig. 5E). Moreover, the Binou-bound enhancer recapitulates the endogenous genes’ expression (Fig. 2E).
Biniou direct target genes implicated in cell signalling
Flybase ID Gene Pathway
FBgn0004364 18 wheeler (18w) Toll-likeFBgn0022131 atypical protein kinase C (aPKC) GPCR-signaling
transductionFBgn0014135 branchless (bnl) FGFFBgn0000490 Decapentaplegic (dpp) DppFBgn0000463 Delta (Dl) Notch/DeltaFBgn0000546 Ecdysone receptor (EcR) EcdysoneFBgn0024222 immune response deficient 5 (ird5) TollFBgn0034590 Magi Maguk proteinFBgn0002932 Neuralized (neur) Notch/DeltaFBgn0019664 pangolin (pan) WgFBgn0003177 polychaetoid (pyd) Maguk proteinFBgn0053207 Pxb HhFBgn0053529 Rapgap1 RTK/RASFBgn0026181 Rho-kinase (rok) Rho signalingFBgn0003310 Star (S) EGFFBgn0020299 stumps FGFFBgn0041184 Suppressor of cytokine signaling at 36E (Socs36E) JNKFBgn0033134 Tetraspanin 42El (Tsp42El) membrane signaling
complex
Biniou direct target genes annotated as TFs (www.FlyTF.org)
Flybase ID Gene
FBgn0015903 apontic (apt)FBgn0004862 bagpipe (bap)FBgn0010460 bunched (bun)FBgn0000251 caudal (cad)FBgn0008649 delilah (dei)FBgn0011763 DP transcription factor (Dp)FBgn0000492 Drop (Dr)FBgn0002633 E(spl) region transcript m7 (HLHm7)FBgn0000546 Ecdysone receptor (EcR)FBgn0001981 escargot (esg)FBgn0004895 forkhead domain 64A (fd64A)FBgn0004914 Hepatocyte nuclear factor 4 (Hnf4)FBgn0022740 HLH54F (HLH54F)FBgn0001235 homothorax (hth)FBgn0000448 Hormone receptor-like in 46 (Hr46)FBgn0001269 invected (inv)FBgn0011236 ken and barbie (ken)FBgn0008651 ladybird late (lbl)FBgn0039039 lame duck (lmd)FBgn0005630 longitudinals lacking (lola)FBgn0040765 luna (luna)FBgn0030505 NFAT (NFAT)FBgn0003002 odd paired (opa)FBgn0019664 pangolin (pan)FBgn0003118 pointed (pnt)FBgn0003460 sine oculis (so)FBgn0004579 spalt major (salm)FBgn0003866 teashirt (tsh)FBgn0003870 tramtrak (ttk)FBgn0003862 trithorax (trx)FBgn0016076 vrille (vri)FBgn0004606 Zn finger homeodomain 1 (zfh1)
Biniou & Mef2 co-bound enhancers
jakobsen et al
9

Supplemental Figure 6: Combinatorial binding of Biniou & Mef2
We performed ChIP-on-chip experiments with Mef2 at the same stages of
development as Biniou, on the same microarray platform as reported previously(Sandmann et al. 2006). The Mef2 binding data was integrated with the Biniou
binding data for all 292 Biniou-bound genomic regions. To assess the relative
occupation of Mef2 on each of the three temporal groups of Biniou-enhancers, weclustered each group to distinguish regions that are bound by co-bound by Mef2 from
those that or not. For each cluster, the Biniou-ChIP experiments are shown on the left
with a white line separating the Mef2 ChIP time-series on the right (Both Bin andMef2 contain ChIPs at 6-8 hrs, 8-10hrs and 10-12 hrs). The intensity of yellow
reflects the degree of enrichment, shown in the scale (log2).
There is substantial combinatorial binding of Biniou and Mef2 on the early-
bound and continuous-bound enhancers, matching the enrichment of Mef2 motifs in
these groups (indicated by the red lines to the left of the upper clusters). 65.1% of theBiniou early-bound enhancers are cobound by Mef2 and 50.4% of the continuous-
bound enhancers are co-bound by Biniou and Mef2, at the same stages ofdevelopment. In contrast, only 20.1% of the Biniou late-bound enhancers are co-
bound by Mef2. This was surprising as Mef2 plays a prominent role in muscle
differentiation. Interestingly, we do not find significant Biniou binding to a largeclass of enhancers for muscle contractile proteins that are regulated by Mef2 (e.g.
Mlc1, Mlc2). We suggest that there may be two independent differentiation programsduring VM development, one governed by Mef2 regulating more general muscle
proteins, and a second, more VM specific, program driven by Biniou.
jakobsen et al
10

Supplemental Figure 4Supplemental Figure 2 Supplemental Figure 5 Supplemental Figure 7B
Supplemental Figure 7: Biniou targets a large number of transcription factors
and components of signaling cascades
Supplemental Figure 7ASupplemental Figure 6
Supplemental Figure 4: Endogenous expression of the CG2330 gene
Supplemental Figure 3
Supplemental Figure 2:
Biniou ChIP binding to the three characterised Biniou-regulated enhancers
Supplemental Figure 1:
Expression profiling of biniou mutant
embryos
The 1,164 genes with differential expres-sion were clustered by K-medians clustering, using Pearson uncentered correlations to calculate the distance metric (TIGR-Mev, (Saeed et al. 2003)). Each row corresponds to one gene, each column corresponds to one developmental condition, in the following order from left to right: biniou loss-of-function 5-6 hrs, 6-7hrs, 7-8hr, 8-9hrs, 9-10hrs and 13-14hrs, ectopic biniou 4-5hrs, 5-6hrs, 6-7hrs. All measurements are ratios of biniou mutant embryos over stage matched wild type embryos. Yellow represents increased expression in mutant compared to wild-type, blue represents decreased expression, and black is no change. The degree of change is indicated by the scale on the bottom (log2). The data falls into four major clusters, two of which have significantly reduced levels of expression (clusters 1 & 2), indicating a genetic dependency on biniou for their expression. Genes known to be expressed in visceral muscle are indicated. Cluster 2 contains a number of genes that only change expression late in development, suggesting a role in later aspects of VM morphogen-esis or function. Some of these genes are also likely to be secondary responses to the lack of VM at these late stages. For example, HLH54F is specifically expressed in the longitudinal muscle and does not change expression in biniou mutants at early stages of development when the trunk VM cells are still present. Rather this gene is only differentially expressed at later stages when the longitudinal VM migration is blocked due to a lack of trunk VM. Surprisingly few genes had increased expression with ectopic expression of biniou. We believe that this result is biological as bagpipe is ectopically expressed. The fact that Biniou is not sufficient to ectopically express many genes likely reflects the need for extensive combinatorial regulation, which is strongly supported by our ChIP-on-chip experi-ments.
(A-C) Schematic overview of genomic regions containing characterised Biniou-enhancers: The gene is depicted at the bottom of the panel, with exons in black and introns in grey. Genomic fragments on the tiling arrays are indicated as stacks of four horizontal grey bars in their corresponding genomic position. Each single bar represents the results from one ChIP-on-chip time-period, with the earliest (6-8 hrs, stages 10-11) positioned at the top of the stack and the latest (12-14 hrs, stage 15) at the bottom of the stack. Blue arrow represents the direction of developmental time. The red bars indicate Biniou binding, light red bars indicate binding just below our stringent cut-off. The green double-headed arrows indicate the known enhancers. Note, Biniou binds to all three characterised Bagpipe enhancers, indicating a potential regulatory connection in other VM subtypes, in addition to the trunk VM.
Motif clover_result_bin_early_regions clover_result_bin_contin_regions clover_result_bin_late_regions
Score Pval Score Pval Score Pval
OVER - REPRESENTED RESULTS
FLYREG_Aef1 16.5 0
FLYREG_BEAF-32 -3.49 0 -4.03 0 -3.77 0.001
FLYREG_BEAF-32B -4.25 0.007 -3.86 0.01
FLYREG_Top2 32.3 0.001 104 0 58.7 0
FLYREG_Trl 6.7 0.001 42.8 0 11.3 0
FLYREG_bin -2.07 0 -1.97 0 -2.12 0
FLYREG_ey 15.7 0.002
FLYREG_hkb 7.99 0.007
FLYREG_kni -2.04 0
FLYREG_toy 8.19 0.001
JASPAR_CORE_MA0011 Broad-complex_2 ZN-FINGER, C2H2
-2.96 0.01
JASPAR_CORE_MA0012 Broad-complex_3 ZN-FINGER, C2H2
-0.349 0.009 4.77 0 2.13 0
JASPAR_CORE_MA0013 Broad-complex_4 ZN-FINGER, C2H2
6.28 0 2.28 0.003
JASPAR_FAMILY_MF0002 bZIPCREB/G-box-like subclass bZIP
-4.3 0.005
JASPAR_FAMILY_MF0003 REL classREL
15.2 0.006
JASPAR_FAMILY_MF0005 Forkheadclass Forkhead
25.8 0.001 98.4 0 44.2 0
JASPAR_FAMILY_MF0011 HMG classHMG
0.591 0.001 3.43 0.007
Michal_Adf1_01 98.7 0.002
Michal_Dref_01 -3.82 0.002 -4.55 0.001 -4.07 0.001
Michal_Mad_01 33.6 0
Michal_Mef2_01 12.2 0 30.3 0
Michal_pan_01 36.5 0.006
Michal_pho_01 12.4 0
Michal_srp_01 -3.38 0.001 -3.93 0 -3.64 0.001
Michal_z_01 0.779 0
TRANSFAC_CF2II_01;CF2-II;CF2-II;CF2-II; Species: fruit fly, Drosophilamelanogaster.
11.3 0.001 21.9 0 17.4 0
TRANSFAC_CF2II_02;CF2-II;CF2-II;CF2-II; Species: fruit fly, Drosophilamelanogaster.
13 0.002 19.6 0.005 20.8 0
TRANSFAC_CROC_01;Croc;Crocodileregulator of head development;Croc;Species: fruit fly, Drosophilamelanogaster.
27.6 0
TRANSFAC_DL_01;dl;dorsal;Dl;Species: fruit fly, Drosophilamelanogaster.
13 0.003 12 0.001
TRANSFAC_HAIRY_01;Hairy;Hairy;H;Species: fruit fly, Drosophilamelanogaster.
5.83 0.01
TRANSFAC_HSF_01;HSF;heat shockfactor (Drosophila);HSTF; Species:fruit fly, Drosophila melanogaster.
-2.2 0.004
TRANSFAC_HSF_04;HSF;heat shockfactor (Drosophila);HSTF; Species:fruit fly, Drosophila melanogaster.
6.36 0
TRANSFAC_TATA_01; TATA; cellularand viral TATA box elements;TBP;Species: human, Homo sapiens.;TBP;Species: mouse, Mus musculus.;TBP;Species: fruit fly, Drosophilamelanogaster.
-2.37 0.005
bin 5
-6
bin 6
-7
bin 7
-8
bin 8
-9
bin 9
-10
bin 1
3-14
over
exp
4-5
over
exp
5-6
over
exp
6-7
bin 5
-6
bin 6
-7
bin 7
-8
bin 8
-9
bin 9
-10
bin 1
3-14
over
exp
4-5
over
exp
5-6
over
exp
6-7
bin 5
-6
bin 6
-7
bin 7
-8
bin 8
-9
bin 9
-10
bin 1
3-14
over
exp
4-5
over
exp
5-6
over
exp
6-7
ttk-V
ME
1 kb
ttk
ttk-VME
fd64a-V
ME
1 kb
LATE
EARLY
fd64a CG1134
fd64a-e-VME
fd64a-l-VME
HL
H5
4F-V
ME
1 kb
HLH54F CG5009
HLH54F-VME
otk-V
ME
1 kbotk
otk-VME
mib
2-V
ME
1 kb
mib2 CG10449
mib2-VME
ken-V
ME
1 kb
kenCG4581
ken-VME
1 kb
5' 3'ßTub60D
1 kbdpp
5' 3'
1 kb
5' 3'bap
1 2
3
C
B
A
4)2)1)
3)
F
E
D
C
B
A
CG
2330
Stage 11 Stage 13 Stage 15/16
bap
6-8
bin 6
-8
bin 8
-10
bin 1
0-12
bin 1
2-14
Mef
2 6-
8
Mef
2 8-
10
Mef
2 10
-12
bap
6-8
bin 6
-8
bin 8
-10
bin 1
0-12
bin 1
2-14
Mef
2 6-
8
Mef
2 8-
10
Mef
2 10
-12
bap
6-8
bin 6
-8
bin 8
-10
bin 1
0-12
bin 1
2-14
Mef
2 6-
8
Mef
2 8-
10
Mef
2 10
-12
Continuously-bound Late-boundEarly-bound
In situ hybridisation using a DIG-labelled probe directed against the coding region of CG2330. There is no detectable expression at stage 11, with weak expression initiating at stage 12. From stage 13-16 CG2330 is expressed in the trunk VM, somatic muscle and pharyngeal muscle. It is not possible from these in situs to distinguish between trunk circular or longitudinal muscle. However, the Biniou-bound enhancer drives specific expression in the longitudinal VM (manuscript Fig. 1D’).
The 143 newly identified Biniou direct target genes are highly enriched in a number of functional classes of genes. Most notable is the enrichment of ‘transcriptional regulators’: A comparison to a curated database (FlyTF (Adryan and Teichmann 2006)) identified ~20% of Biniou target genes as transcription factors (Supple. Fig. 7A). This group provides a useful resource to further explore the transcriptional network governing VM development. Biniou also targets components of many of the major developmental signalling pathways, which likely impart spatial inputs to Biniou-bound CRMs (supple. Fig. 7B): FGF (bnl, stumps), EGF (star), Hh (pxb), Wg (pan (dTCF)), Notch-Delta (neur). Biniou also binds to CRMs of two components of the semaphorin signalling pathway: off-track (Fig. 2E: otk) and mical. Both genes are expressed in the nervous system, where they play a role in receiving and integrating axonal guidance cues (Winberg et al. 2001; Terman et al. 2002). As these genes were unexpected targets for a muscle specific transcription factor, we re-examined their expression to determine if they are also expressed in the developing visceral muscle. In situ hybridization of off-track revealed that it is expressed in the circular VM during the stages of VM migra-tion, and that this expression depends on biniou activity (Fig. 5E). Moreover, the Binou-bound enhancer recapitulates the endogenous genes’ expression (Fig. 2E).
Biniou direct target genes implicated in cell signalling
Flybase ID Gene Pathway
FBgn0004364 18 wheeler (18w) Toll-likeFBgn0022131 atypical protein kinase C (aPKC) GPCR-signaling
transductionFBgn0014135 branchless (bnl) FGFFBgn0000490 Decapentaplegic (dpp) DppFBgn0000463 Delta (Dl) Notch/DeltaFBgn0000546 Ecdysone receptor (EcR) EcdysoneFBgn0024222 immune response deficient 5 (ird5) TollFBgn0034590 Magi Maguk proteinFBgn0002932 Neuralized (neur) Notch/DeltaFBgn0019664 pangolin (pan) WgFBgn0003177 polychaetoid (pyd) Maguk proteinFBgn0053207 Pxb HhFBgn0053529 Rapgap1 RTK/RASFBgn0026181 Rho-kinase (rok) Rho signalingFBgn0003310 Star (S) EGFFBgn0020299 stumps FGFFBgn0041184 Suppressor of cytokine signaling at 36E (Socs36E) JNKFBgn0033134 Tetraspanin 42El (Tsp42El) membrane signaling
complex
Biniou direct target genes annotated as TFs (www.FlyTF.org)
Flybase ID Gene
FBgn0015903 apontic (apt)FBgn0004862 bagpipe (bap)FBgn0010460 bunched (bun)FBgn0000251 caudal (cad)FBgn0008649 delilah (dei)FBgn0011763 DP transcription factor (Dp)FBgn0000492 Drop (Dr)FBgn0002633 E(spl) region transcript m7 (HLHm7)FBgn0000546 Ecdysone receptor (EcR)FBgn0001981 escargot (esg)FBgn0004895 forkhead domain 64A (fd64A)FBgn0004914 Hepatocyte nuclear factor 4 (Hnf4)FBgn0022740 HLH54F (HLH54F)FBgn0001235 homothorax (hth)FBgn0000448 Hormone receptor-like in 46 (Hr46)FBgn0001269 invected (inv)FBgn0011236 ken and barbie (ken)FBgn0008651 ladybird late (lbl)FBgn0039039 lame duck (lmd)FBgn0005630 longitudinals lacking (lola)FBgn0040765 luna (luna)FBgn0030505 NFAT (NFAT)FBgn0003002 odd paired (opa)FBgn0019664 pangolin (pan)FBgn0003118 pointed (pnt)FBgn0003460 sine oculis (so)FBgn0004579 spalt major (salm)FBgn0003866 teashirt (tsh)FBgn0003870 tramtrak (ttk)FBgn0003862 trithorax (trx)FBgn0016076 vrille (vri)FBgn0004606 Zn finger homeodomain 1 (zfh1)
Biniou & Mef2 co-bound enhancers
jakobsen et al
11
Supplemental Figure 4Supplemental Figure 2 Supplemental Figure 5 Supplemental Figure 7B
Supplemental Figure 7: Biniou targets a large number of transcription factors
and components of signaling cascades
Supplemental Figure 7ASupplemental Figure 6
Supplemental Figure 4: Endogenous expression of the CG2330 gene
Supplemental Figure 3
Supplemental Figure 2:
Biniou ChIP binding to the three characterised Biniou-regulated enhancers
Supplemental Figure 1:
Expression profiling of biniou mutant
embryos
The 1,164 genes with differential expres-sion were clustered by K-medians clustering, using Pearson uncentered correlations to calculate the distance metric (TIGR-Mev, (Saeed et al. 2003)). Each row corresponds to one gene, each column corresponds to one developmental condition, in the following order from left to right: biniou loss-of-function 5-6 hrs, 6-7hrs, 7-8hr, 8-9hrs, 9-10hrs and 13-14hrs, ectopic biniou 4-5hrs, 5-6hrs, 6-7hrs. All measurements are ratios of biniou mutant embryos over stage matched wild type embryos. Yellow represents increased expression in mutant compared to wild-type, blue represents decreased expression, and black is no change. The degree of change is indicated by the scale on the bottom (log2). The data falls into four major clusters, two of which have significantly reduced levels of expression (clusters 1 & 2), indicating a genetic dependency on biniou for their expression. Genes known to be expressed in visceral muscle are indicated. Cluster 2 contains a number of genes that only change expression late in development, suggesting a role in later aspects of VM morphogen-esis or function. Some of these genes are also likely to be secondary responses to the lack of VM at these late stages. For example, HLH54F is specifically expressed in the longitudinal muscle and does not change expression in biniou mutants at early stages of development when the trunk VM cells are still present. Rather this gene is only differentially expressed at later stages when the longitudinal VM migration is blocked due to a lack of trunk VM. Surprisingly few genes had increased expression with ectopic expression of biniou. We believe that this result is biological as bagpipe is ectopically expressed. The fact that Biniou is not sufficient to ectopically express many genes likely reflects the need for extensive combinatorial regulation, which is strongly supported by our ChIP-on-chip experi-ments.
(A-C) Schematic overview of genomic regions containing characterised Biniou-enhancers: The gene is depicted at the bottom of the panel, with exons in black and introns in grey. Genomic fragments on the tiling arrays are indicated as stacks of four horizontal grey bars in their corresponding genomic position. Each single bar represents the results from one ChIP-on-chip time-period, with the earliest (6-8 hrs, stages 10-11) positioned at the top of the stack and the latest (12-14 hrs, stage 15) at the bottom of the stack. Blue arrow represents the direction of developmental time. The red bars indicate Biniou binding, light red bars indicate binding just below our stringent cut-off. The green double-headed arrows indicate the known enhancers. Note, Biniou binds to all three characterised Bagpipe enhancers, indicating a potential regulatory connection in other VM subtypes, in addition to the trunk VM.
Motif clover_result_bin_early_regions clover_result_bin_contin_regions clover_result_bin_late_regions
Score Pval Score Pval Score Pval
OVER - REPRESENTED RESULTS
FLYREG_Aef1 16.5 0
FLYREG_BEAF-32 -3.49 0 -4.03 0 -3.77 0.001
FLYREG_BEAF-32B -4.25 0.007 -3.86 0.01
FLYREG_Top2 32.3 0.001 104 0 58.7 0
FLYREG_Trl 6.7 0.001 42.8 0 11.3 0
FLYREG_bin -2.07 0 -1.97 0 -2.12 0
FLYREG_ey 15.7 0.002
FLYREG_hkb 7.99 0.007
FLYREG_kni -2.04 0
FLYREG_toy 8.19 0.001
JASPAR_CORE_MA0011 Broad-complex_2 ZN-FINGER, C2H2
-2.96 0.01
JASPAR_CORE_MA0012 Broad-complex_3 ZN-FINGER, C2H2
-0.349 0.009 4.77 0 2.13 0
JASPAR_CORE_MA0013 Broad-complex_4 ZN-FINGER, C2H2
6.28 0 2.28 0.003
JASPAR_FAMILY_MF0002 bZIPCREB/G-box-like subclass bZIP
-4.3 0.005
JASPAR_FAMILY_MF0003 REL classREL
15.2 0.006
JASPAR_FAMILY_MF0005 Forkheadclass Forkhead
25.8 0.001 98.4 0 44.2 0
JASPAR_FAMILY_MF0011 HMG classHMG
0.591 0.001 3.43 0.007
Michal_Adf1_01 98.7 0.002
Michal_Dref_01 -3.82 0.002 -4.55 0.001 -4.07 0.001
Michal_Mad_01 33.6 0
Michal_Mef2_01 12.2 0 30.3 0
Michal_pan_01 36.5 0.006
Michal_pho_01 12.4 0
Michal_srp_01 -3.38 0.001 -3.93 0 -3.64 0.001
Michal_z_01 0.779 0
TRANSFAC_CF2II_01;CF2-II;CF2-II;CF2-II; Species: fruit fly, Drosophilamelanogaster.
11.3 0.001 21.9 0 17.4 0
TRANSFAC_CF2II_02;CF2-II;CF2-II;CF2-II; Species: fruit fly, Drosophilamelanogaster.
13 0.002 19.6 0.005 20.8 0
TRANSFAC_CROC_01;Croc;Crocodileregulator of head development;Croc;Species: fruit fly, Drosophilamelanogaster.
27.6 0
TRANSFAC_DL_01;dl;dorsal;Dl;Species: fruit fly, Drosophilamelanogaster.
13 0.003 12 0.001
TRANSFAC_HAIRY_01;Hairy;Hairy;H;Species: fruit fly, Drosophilamelanogaster.
5.83 0.01
TRANSFAC_HSF_01;HSF;heat shockfactor (Drosophila);HSTF; Species:fruit fly, Drosophila melanogaster.
-2.2 0.004
TRANSFAC_HSF_04;HSF;heat shockfactor (Drosophila);HSTF; Species:fruit fly, Drosophila melanogaster.
6.36 0
TRANSFAC_TATA_01; TATA; cellularand viral TATA box elements;TBP;Species: human, Homo sapiens.;TBP;Species: mouse, Mus musculus.;TBP;Species: fruit fly, Drosophilamelanogaster.
-2.37 0.005
bin 5
-6
bin 6
-7
bin 7
-8
bin 8
-9
bin 9
-10
bin 1
3-14
over
exp
4-5
over
exp
5-6
over
exp
6-7
bin 5
-6
bin 6
-7
bin 7
-8
bin 8
-9
bin 9
-10
bin 1
3-14
over
exp
4-5
over
exp
5-6
over
exp
6-7
bin 5
-6
bin 6
-7
bin 7
-8
bin 8
-9
bin 9
-10
bin 1
3-14
over
exp
4-5
over
exp
5-6
over
exp
6-7
ttk-V
ME
1 kb
ttk
ttk-VME
fd64a-V
ME
1 kb
LATE
EARLY
fd64a CG1134
fd64a-e-VME
fd64a-l-VME
HL
H5
4F-V
ME
1 kb
HLH54F CG5009
HLH54F-VME
otk-V
ME
1 kbotk
otk-VME
mib
2-V
ME
1 kb
mib2 CG10449
mib2-VME
ken-V
ME
1 kb
kenCG4581
ken-VME
1 kb
5' 3'ßTub60D
1 kbdpp
5' 3'
1 kb
5' 3'bap
1 2
3
C
B
A
4)2)1)
3)
F
E
D
C
B
A
CG
2330
Stage 11 Stage 13 Stage 15/16
bap
6-8
bin 6
-8
bin 8
-10
bin 1
0-12
bin 1
2-14
Mef
2 6-
8
Mef
2 8-
10
Mef
2 10
-12
bap
6-8
bin 6
-8
bin 8
-10
bin 1
0-12
bin 1
2-14
Mef
2 6-
8
Mef
2 8-
10
Mef
2 10
-12
bap
6-8
bin 6
-8
bin 8
-10
bin 1
0-12
bin 1
2-14
Mef
2 6-
8
Mef
2 8-
10
Mef
2 10
-12
Continuously-bound Late-boundEarly-bound
In situ hybridisation using a DIG-labelled probe directed against the coding region of CG2330. There is no detectable expression at stage 11, with weak expression initiating at stage 12. From stage 13-16 CG2330 is expressed in the trunk VM, somatic muscle and pharyngeal muscle. It is not possible from these in situs to distinguish between trunk circular or longitudinal muscle. However, the Biniou-bound enhancer drives specific expression in the longitudinal VM (manuscript Fig. 1D’).
The 143 newly identified Biniou direct target genes are highly enriched in a number of functional classes of genes. Most notable is the enrichment of ‘transcriptional regulators’: A comparison to a curated database (FlyTF (Adryan and Teichmann 2006)) identified ~20% of Biniou target genes as transcription factors (Supple. Fig. 7A). This group provides a useful resource to further explore the transcriptional network governing VM development. Biniou also targets components of many of the major developmental signalling pathways, which likely impart spatial inputs to Biniou-bound CRMs (supple. Fig. 7B): FGF (bnl, stumps), EGF (star), Hh (pxb), Wg (pan (dTCF)), Notch-Delta (neur). Biniou also binds to CRMs of two components of the semaphorin signalling pathway: off-track (Fig. 2E: otk) and mical. Both genes are expressed in the nervous system, where they play a role in receiving and integrating axonal guidance cues (Winberg et al. 2001; Terman et al. 2002). As these genes were unexpected targets for a muscle specific transcription factor, we re-examined their expression to determine if they are also expressed in the developing visceral muscle. In situ hybridization of off-track revealed that it is expressed in the circular VM during the stages of VM migra-tion, and that this expression depends on biniou activity (Fig. 5E). Moreover, the Binou-bound enhancer recapitulates the endogenous genes’ expression (Fig. 2E).
Biniou direct target genes implicated in cell signalling
Flybase ID Gene Pathway
FBgn0004364 18 wheeler (18w) Toll-likeFBgn0022131 atypical protein kinase C (aPKC) GPCR-signaling
transductionFBgn0014135 branchless (bnl) FGFFBgn0000490 Decapentaplegic (dpp) DppFBgn0000463 Delta (Dl) Notch/DeltaFBgn0000546 Ecdysone receptor (EcR) EcdysoneFBgn0024222 immune response deficient 5 (ird5) TollFBgn0034590 Magi Maguk proteinFBgn0002932 Neuralized (neur) Notch/DeltaFBgn0019664 pangolin (pan) WgFBgn0003177 polychaetoid (pyd) Maguk proteinFBgn0053207 Pxb HhFBgn0053529 Rapgap1 RTK/RASFBgn0026181 Rho-kinase (rok) Rho signalingFBgn0003310 Star (S) EGFFBgn0020299 stumps FGFFBgn0041184 Suppressor of cytokine signaling at 36E (Socs36E) JNKFBgn0033134 Tetraspanin 42El (Tsp42El) membrane signaling
complex
Biniou direct target genes annotated as TFs (www.FlyTF.org)
Flybase ID Gene
FBgn0015903 apontic (apt)FBgn0004862 bagpipe (bap)FBgn0010460 bunched (bun)FBgn0000251 caudal (cad)FBgn0008649 delilah (dei)FBgn0011763 DP transcription factor (Dp)FBgn0000492 Drop (Dr)FBgn0002633 E(spl) region transcript m7 (HLHm7)FBgn0000546 Ecdysone receptor (EcR)FBgn0001981 escargot (esg)FBgn0004895 forkhead domain 64A (fd64A)FBgn0004914 Hepatocyte nuclear factor 4 (Hnf4)FBgn0022740 HLH54F (HLH54F)FBgn0001235 homothorax (hth)FBgn0000448 Hormone receptor-like in 46 (Hr46)FBgn0001269 invected (inv)FBgn0011236 ken and barbie (ken)FBgn0008651 ladybird late (lbl)FBgn0039039 lame duck (lmd)FBgn0005630 longitudinals lacking (lola)FBgn0040765 luna (luna)FBgn0030505 NFAT (NFAT)FBgn0003002 odd paired (opa)FBgn0019664 pangolin (pan)FBgn0003118 pointed (pnt)FBgn0003460 sine oculis (so)FBgn0004579 spalt major (salm)FBgn0003866 teashirt (tsh)FBgn0003870 tramtrak (ttk)FBgn0003862 trithorax (trx)FBgn0016076 vrille (vri)FBgn0004606 Zn finger homeodomain 1 (zfh1)
Biniou & Mef2 co-bound enhancers
jakobsen et al
12

Supplemental Figure 8
Supplemental Figure 8: Two independently raised polyclonal antibodies
against Biniou give similar ChIP results
To examine the similarity between the Biniou antibodies we examined the
enrichments of a known Biniou-bound region compared to a negative region by real-time
PCR. In these assays, variability in enrichment levels was just as frequently caused by
differences in chromatin preparations, as by the antibodies. The similarity of the ChIP
results obtained with the two antibodies was also assessed more globally by plotting the
mean of the enrichment values for the two repeats performed with antibody-1 (RDI)
against the mean of the enrichment obtained with antibody-2 (REP). All features with a
-1
-0.5
0
0.5
1
1.5
2
2.5
3
3.5
-0.5 0 0.5 1 1.5 2 2.5 3 3.5
AB IP mean >0.7 log2-enrich
Regression Statistics
Multiple R 0.604345036
R Square 0.365232923
Adjusted R Square 0.364292527
Standard Error 0.369906419
Observations 677
AB IP mean >1.0 log2-enrich
Regression Statistics
Multiple R 0.725939354
R Square 0.526987945
Adjusted R Square 0.524992114
Standard Error 0.361571851
Observations 239
B
A
-1
jakobsen et al
13
single repeat log2-enrichment above 0.7 in the 6-8 hrs time point are displayed, mean for
the RDI-antibody on the Y-axis, and the mean for REP-antibody on the X-axis (Supple.
Fig. 8A). The enrichment ratios for both antibodies are very similar for ratios >0.7 log2.
To quantify the degree of similarity we performed a regression analysis on all features
with a mean for both antibodies >0.7 or >1.0 log2 (cut-offs shown as green and red bars,
respectively, in Supple. Fig. 8A). This analysis indicates that the ChIP results from both
antibodies are highly correlated. As observed for expression profiling analysis, the
correlation co-efficient is higher for features with higher enrichment values (Supple. Fig.
8B).
We also analysed the data using both a paired and unpaired SAM test. These
showed only very minor differences in the number of regions found to be significantly
bound, again indicating that the ChIP is very reproducible between the two antibodies. As
there were no clear differences between the antibodies, all four hybridisations (two for
each antibody) were used as biological replicates for the detection of significantly bound
regions. Thus, by pooling all sources of variance, a genomic region needs to be robustly
enriched in multiple experiments to be called significant.
jakobsen et al
14

Supplemental Methods:
Experimental methods for expression profiling biniou mutants:
Homozygous biniou loss of function mutant embryos (biniou1l allele) were isolated
from their balancer siblings using an automated embryo sorter (Furlong et al. 2001a;
Furlong et al. 2001b). Wild-type embryos (Canton S) were collected and processed in
parallel. One-hour collections were sorted at stage 9-10 and aged to the appropriate stage
after sorting. For each one-hour developmental time-period five individual embryo
collections and sorts were conducted. A small aliquot of all samples was isolated and
formaldehyde fixed to estimate the staging of wild type and mutant embryos. The four
samples with the tightest staging were used to extract RNA, which was hybridised to
arrays containing one 60-oilgo for every predicted Drosophila gene (INDAC oligos). For
ectopic expression of Biniou, embryos were collected from transheterozygous parents of
the following genotype: twi-24B-Gal4 X UAS-Biniou-HA. The HA-tag had no apparent
affect on Biniou activity, determined by the ability of Biniou-HA to ectopically express
FasIII. All samples were hybridised in pairs of wild type and mutants, with appropriate
dye swaps to reduce the effect of dye biases.
The microarray data was normalised using print-tip LOWESS normalisation. A
one-class SAM analysis was performed on four independent biological repeats for each
time point. Genes with a q < 0.01 and a fold enrichment of log2 > 0.7 or < −0.7 at one or
more time-point were considered to be differentially expressed. For the ectopic
expression, we only considered genes with elevated expression (q<0.01 and fold change
log2 > 0.7).
Target gene assignment
All genes within 60kb of a Biniou-bound region (30kb 5’ and 3’) were assigned a
score, which was the product of four variables: distance between the gene and the bound
region (D = distance), a change in expression in biniou mutant embryos (L=loss of
function), a change of expression in embryos with ectopic biniou expression (E=ectopic),
and additional information on the gene’s expression pattern (S, for supporting data, based
on the BDGP in situ database (Tomancak et al. 2002), Flybase, or the literature). 60kb
was selected as the distance to sample around a ChIP-bound region as the gene density in
jakobsen et al
15

Drosophila is relatively high. This distance will cover on average 10 genes in vicinity of
the enhancer and therefore should include the correct target gene.
All sampled genes received a score between 0 and 1 for each of the variables
described above. Distance scores are linearly related to the physical distance between an
enriched region and each neighboring gene. This transformation method was found to
perform at least as well as a more complex sigmoidal. A perfect distance score of 1 was
obtained for genes with loci overlapping the position of enriched regions. Neutral scores
of 0.6 (e.g. for genes with no change in the expression profiling experiments or where no
in-situ information is available) were found to be optimal through iterative optimization of
the algorithm (Sandmann et al., 2006, 2007).
A total score of 0.217 was chosen as a cut-off for target gene assignment. This
ensured that a ChIP-bound region was not assigned to a gene based on proximity alone.
At least one piece of supporting evidence is necessary to overcome this threshold, since a
perfect distance score of 1 and neutral scores of 0.6 in all other categories produces a total
score of 0.216 (1 * 0.6 * 0.6 * 0.6 = 0.216).
An example of an assignment of a ChIP-bound region to a gene is shown below. If
the assignment was based solely on proximity, CG3407 would be assigned as the target
gene of this Bagpipe-bound region (indicated in red). With our automated assignment,
slp1 receives the highest score, although this gene is located ~9.5 kb from the ChIP-bound
region. This Bagpipe-bound region is sufficient to drive reporter gene expression in a
pattern that recapitulates the endogenous slp1 genes expression in the visceral muscle,
validating the automated gene assignment (manuscript Fig. 4C). This example clearly
demonstrates the importance of using an assignment approach not based on proximity
alone. Using this method, the three known Biniou-bound enhancers were correctly
assigned to the appropriate target gene. In addition, all enhancers shown in Figure 1, 2
and 4 (main manuscript) recapitulate all or some of the assigned target genes expression.
jakobsen et al
16

Target gene assignment: Visualization of the genomic environment of an enriched region with both ChIP-on-chip and expression profiling data displayed
A) The genes are depicted above or below the ChIP-on-chip data, reflecting if they are on the plus or minus strand, respectively. Expression profiling data of biniou mutant embryos is shown for each time-point above or below the gene (Genomic fragments on the tiling arrays are indicated as stacks of five horizontal grey bars in their corresponding genomic position. Each single bar represents the results from one ChIP-on-chip time-period, with Bagpipe (10-11) positioned at the top of the stack, then Biniou (10-11) and the latest time-period (stage 15) at the bottom of the stack. The red bar indicates Bagpipe binding. Note, there is no Biniou binding to this genomic region. The black double headed arrow represents the cloned region used to make transgenic reporter lines. Scores are shown for each gene (D: score, gene distance to enriched fragment, L: loss-of-function, E: ectopic expression, S: supplemental score, Total score in red). The Bagpipe-bound region was assigned to slp1, as this gene has the highest total score.
B) Flow-scheme for automated gene assignment.
Estimating overrepresentation of binding sites in Biniou-bound regions: We used all known Biniou, Mef2, Tinman and Bagpipe sites to generate a position
weight matrix using the MEME algorithm (Bailey and Elkan 1994).
MEME was run with the following parameters:
meme footprints_fasta_file -dna -bfile DrosophilaBackground.freq -nostatus -
nmotifs 1 -maxw 14 -revcomp -minw 6 -mod anr
DrosophilaBackground.freq:
jakobsen et al
17

A 0.3 C 0.2 G 0.2 T 0.3
The following position weight matrices (PWMs) were generated and used to search for
enrichment into different groups of Biniou-bound CRMS using MAST (Bailey and
Gribskov 1998b; Bailey and Gribskov 1998a).
We performed a filtering step, where only Biniou sites matching the RYAAAYA, Mef2 sites containing an invariable TANNNNTA motif, and Tinman sites with an invariable CACTT motif were considered. The optimal p-value cut-off was determined by benchmarking MAST on a set of enhancer sequences known to contain functional binding sites. The p-values used were: 2e-04 for Biniou and Bagpipe, 1.5e-04 for Mef2 and 3.4e-04 for Tinman.
MAST was used to scan the genomic sequence of all the fragments on the tiling
array. Predicted motifs were counted within the Biniou pulled down regions and the non-
pulled down (background) regions. The significance of enrichment of predicted sites was
estimated by a binomial exact test using the R statistical programming environment.
jakobsen et al
18

References:
Adryan, B. and Teichmann, S.A. 2006. FlyTF: a systematic review of site-specific transcription factors in the fruit fly Drosophila melanogaster. Bioinformatics 22(12): 1532-1533. Bailey, T.L. and Elkan, C. 1994. Fitting a mixture model by expectation maximization to discover motifs in biopolymers. Proc Int Conf Intell Syst Mol Biol 2: 28-36. Bailey, T.L. and Gribskov, M. 1998a. Combining evidence using p-values: application to sequence homology searches. Bioinformatics 14(1): 48-54. Bailey, T.L. and Gribskov, M. 1998b. Methods and statistics for combining motif match scores. J Comput Biol 5(2): 211-221. Bergman, C.M., Carlson, J.W., and Celniker, S.E. 2005. Drosophila DNase I footprint database: a systematic genome annotation of transcription factor binding sites in the fruitfly, Drosophila melanogaster. Bioinformatics 21(8): 1747-1749.
Frith, M.C., Fu, Y., Yu, L., Chen, J.F., Hansen, U., and Weng, Z. 2004. Detection of functional DNA motifs via statistical over-representation. Nucleic Acids Res 32(4): 1372-1381. Furlong, E.E., Andersen, E.C., Null, B., White, K.P., and Scott, M.P. 2001a. Patterns of gene expression during Drosophila mesoderm development. Science 293(5535): 1629-1633.
Furlong, E.E., Profitt, D., and Scott, M.P. 2001b. Automated sorting of live transgenic embryos. Nat Biotechnol 19(2): 153-156.
Matys, V., Kel-Margoulis, O.V., Fricke, E., Liebich, I., Land, S., Barre-Dirrie, A., Reuter, I., Chekmenev, D., Krull, M., Hornischer, K., Voss, N., Stegmaier, P., Lewicki-Potapov, B., Saxel, H., Kel, A.E., and Wingender, E. 2006. TRANSFAC and its module TRANSCompel: transcriptional gene regulation in eukaryotes. Nucleic Acids Res 34(Database issue): D108-110.
Saeed, A.I., Sharov, V., White, J., Li, J., Liang, W., Bhagabati, N., Braisted, J., Klapa, M., Currier, T., Thiagarajan, M., Sturn, A., Snuffin, M., Rezantsev, A., Popov, D., Ryltsov, A., Kostukovich, E., Borisovsky, I., Liu, Z., Vinsavich, A., Trush, V., and Quackenbush, J. 2003. TM4: a free, open-source system for microarray data management and analysis. Biotechniques 34(2): 374-378. Sandmann, T., Jensen, L.J., Jakobsen, J.S., Karzynski, M.M., Eichenlaub, M.P., Bork, P., and Furlong, E.E. 2006. A temporal map of transcription factor activity: mef2 directly regulates target genes at all stages of muscle development. Dev Cell 10(6): 797-807.
Sandmann T, Girardot C, Brehme M, Tongprasit W, Stolc V, and Furlong EE. 2007. A core transcriptional network for early mesoderm development in Drosophila melanogaster. Genes & Dev. Feb 15; 21 (4): 436-449. Terman, J.R., Mao, T., Pasterkamp, R.J., Yu, H.H., and Kolodkin, A.L. 2002. MICALs, a family of conserved flavoprotein oxidoreductases, function in plexin-mediated axonal repulsion. Cell 109(7): 887-900. Tomancak, P., Beaton, A., Weiszmann, R., Kwan, E., Shu, S., Lewis, S.E., Richards, S., Ashburner, M., Hartenstein, V., Celniker, S.E., and Rubin, G.M. 2002. Systematic
jakobsen et al
19

determination of patterns of gene expression during Drosophila embryogenesis. Genome Biol 3(12): RESEARCH0088.
Vlieghe, D., Sandelin, A., De Bleser, P.J., Vleminckx, K., Wasserman, W.W., van Roy, F., and Lenhard, B. 2006. A new generation of JASPAR, the open-access repository for transcription factor binding site profiles. Nucleic Acids Res 34(Database issue): D95-97. Winberg, M.L., Tamagnone, L., Bai, J., Comoglio, P.M., Montell, D., and Goodman, C.S. 2001. The transmembrane protein Off-track associates with Plexins and functions downstream of Semaphorin signaling during axon guidance. Neuron 32(1): 53-62.
jakobsen et al
20