Hastings Town Centre and White Rock Area Action Plan ... · topic areas: ... 1 Strategic...
51
Hastings Town Centre and White Rock Area Action Plan – Sustainability Appraisal Scoping Report Updated - October 2016
Transcript of Hastings Town Centre and White Rock Area Action Plan ... · topic areas: ... 1 Strategic...

Hastings Town Centre and White Rock Area Action Plan –
Sustainability Appraisal Scoping Report
Updated - October 2016

2
Contents
1.0 INTRODUCTION ............................................................................................... 3 1.1 Background........................................................................................................ 3 1.2 Sustainability Appraisal Scoping Report ............................................................. 3 1.3 Purpose of this report ......................................................................................... 7 1.4 Background to Hastings and the AAP area ........................................................ 7 1.5 Sustainable Community Strategy ..................................................................... 10 1.6 Hastings Local Plan Objectives ....................................................................... 10 1.7 Council Strategic Priorities ............................................................................... 10 1.8 Appraisal Methodology .................................................................................... 11 1.9 Sustainability Appraisal Stage A ...................................................................... 12 1.10 Scoping Report ................................................................................................ 12
2.0 TASK 1: IDENTIFY OTHER RELEVANT POLICIES, PLANS AND
PROGRAMMES, AND SUSTAINABILITY OBJECTIVES ................................. 13 2.1 Regulations and guidance ................................................................................ 13 2.2 Methodology .................................................................................................... 13 2.3 Key messages from the context review ............................................................ 16
3.0 TASK 2: COLLECTING BASELINE INFORMATION ........................................ 19
3.1 Regulations and guidance ................................................................................ 19 3.2 Methodology .................................................................................................... 19 3.3 Data availability and ‘gaps’ ............................................................................... 26 3.4 Likely future trends under the ‘business as usual’ option ................................. 28
4.0 TASK 3: IDENTIFYING SUSTAINABILITY ISSUES ......................................... 30
4.1 Regulations and guidance ................................................................................ 30 4.2 Methodology .................................................................................................... 30
5.0 TASK 4: DEVELOPING THE SUSTAINABILITY APPRAISAL AND
STRATEGIC ENVIRONMENTAL ASSESSMENT OBJECTIVES ..................... 31 5.1 Regulations and guidance ................................................................................ 31 5.2 Methodology .................................................................................................... 31 5.3 The Sustainability Appraisal Framework .......................................................... 32
6.0 TASK 5 – CONSULTING ON THE SCOPE OF THE SUSTAINABILITY
APPRAISAL AND STRATEGIC ENVIRONMENTAL ASSESSMENT ............... 33 6.1 Regulations and guidance ................................................................................ 33 6.2 Remaining stages of the SEA/SA process ....................................................... 34
APPENDIX A – SUSTAINABILITY ISSUES APPENDIX B – THE SUSTAINABILITY APPRAISAL FRAMEWORK

3
1.0 Introduction
1.1 Background 1.1.1 Hastings Borough Council (HBC) is preparing an Area Action Plan (AAP) for
the Hastings Town Centre and White Rock area. The AAP is a key document being prepared as part of the Hastings Local Plan process. The preparation of the AAP follows the adoption of the Hastings Planning Strategy (February 2014) and Development Management Plan (September 2015). These two documents cover the whole of the Borough of Hastings. The AAP will be the first area-specific document and will set out the overall strategy for future development within the Town Centre and White Rock area and will cover the period to 2028. Once adopted the AAP will form part of the statutory planning framework for the town, and will be used in the determination of planning applications.
1.2 Sustainability Appraisal Scoping Report 1.2.1 The Strategic Environmental Assessment Directive (EU Directive
2001/42/EC1) is a European Union requirement that seeks to provide a high level of protection to the environment by integrating environmental considerations into the preparation of certain plans and programmes. The Directive applies to Hastings Town Centre and White Rock AAP as it a) sets the framework for future development consent, b) is likely to have a significant effect on the environment.
1.2.2 The overarching objective of the SEA Directive is ‘to contribute to the integration of environmental considerations into the preparation and adoption of plans and programmes with a view to promoting sustainable development, by ensuing that, in accordance with the Directive, an environmental assessment is carried out of certain plans and programmes which are likely to have significant effects on the environment’.
1.2.3 The SEA is an iterative process that will be applied throughout the development of the AAP to ensure that potential significant effects arising from its production are identified, assessed and mitigated.
1.2.4 The SEA Regulations state that SEA must assess effects on the following topic areas:
Biodiversity;
Population;
Human health;
Fauna;
Flora;
Soil;
Water;
Air;
Climatic factors;
Material assets;
1 Strategic Environmental Assessment Directive 2001/42/EC : http://eur-lex.europa.eu/legal-
content/EN/ALL/?uri=CELEX:32001L0042

4
Cultural heritage, including architectural and archaeological heritage;
Landscape; and
The inter-relationships between the above
1.2.5 A sustainability appraisal (SA) must be carried out by local planning authorities during the preparation of all proposals in a Local Plan, as required by Section 19 of the Planning and Compulsory Purchase Act 2004. The purpose of an SA is to promote sustainable development through better integration of sustainability considerations during the preparation of plans. The National Planning Policy Framework (NPPF) identifies three dimensions to sustainable development, economic, social and environmental, where planning can perform a number of roles:
‘an economic role – contributing to building a strong, responsive and competitive economy, by ensuring that sufficient land of the right type is available in the right places and at the right time to support growth and innovation; and by identifying and coordinating development requirements, including the provision of infrastructure;
a social role – supporting strong, vibrant and healthy communities, by providing the supply of housing required to meet the needs of present and future generations; and by creating a high quality built environment, with accessible local services that reflect the community’s needs and support its health, social and cultural well-being; and
an environmental role – contributing to protecting and enhancing our natural, built and historic environment; and, as part of this, helping to improve biodiversity, use natural resources prudently, minimise waste and pollution, and mitigate and adapt to climate change including moving to a low carbon economy’.
1.2.6 Hastings Town Centre and White Rock (AAP) is subject to both SA and SEA
requirements. Both the SA and SEA have distinct roles but it is possible to meet the requirements of both pieces of legislation within a single appraisal process, which is the approach that has been taken within this Scoping Report. Where reference is made within this document to Sustainability Appraisal, it also implies where appropriate the Strategic Environmental Assessment regulations.
1.2.7 The purpose of SA (incorporating the requirements of SEA) is to appraise the
environmental, social and economic effects of the policies and proposals in Local Plans, and make recommendations for improvements or mitigation as and when necessary. The SA process helps to ensure that decisions are made in accordance with the principles of sustainable development, with SEA providing for a high level of protection to the environment and ensuring the integration of environmental considerations into the plan making process.
Key outputs of the SA/SEA process are as follows:
Scoping Report – is used to consult Statutory Consultees on the scope of the SA (documenting Stage A work);

5
Sustainability Appraisal Report – is used in the public consultation on the Pre-submission Public Consultation version of the draft plan. The SA Report will fully incorporate the requirements to produce an Environmental Report under the SEA Directive.
1.2.8 Table 1 below sets out how the requirements of the SEA Regulations
(Schedule 2, Regulation 12(3)) have been met in this Scoping Report, or will be met in future documents.

6
Environmental Report requirements Section of this report
a) An outline of the contents, main objectives of the plan and relationship with other relevant plans and programmes
Section 2, pages 13-16 Background Paper 1 – Policy review
b) The relevant aspects of the current state of the environment and the likely evolution without implementation of the plan
Section 3, pages 19-28 Background Paper 2 – Baseline Information
c) the environmental characteristics of areas likely to be significantly affected
Section 3, pages 19-28 Background Paper 2 – Baseline Information
d) Any existing environmental problems which are relevant to the plan including, in particular, those relating to any areas of a particular environmental importance, such as areas designated pursuant to Directives 79/409/EEC and 92/43/EEC
Section 4, page 30 Appendix A
e) The environmental protection objectives established at international, community or national level, which are relevant to the plan and the way those objectives and any environmental considerations have been taken into account during its preparation
Section 5, pages 31-32 Appendix B
f) The likely significant effects on the environment, including on issues such as biodiversity, population, human health, fauna flora, soil, water, air, climatic factors, material assets, cultural heritage, including architectural and archaeological heritage, landscape and the interrelationship between these factors.
In the final Sustainability Appraisal Report
g) The measures envisaged to prevent, reduce and as fully as possible offset any significant adverse effects on the environment of implementing the plan or programme
Will form part of final Sustainability Appraisal Report
h) An outline of the reasons for selecting the alternatives dealt with, and a description of how the assessment was undertaken including any difficulties encountered in compiling the required information
Will form part of final Sustainability Appraisal Report
i) A description of measures envisaged concerning monitoring in accordance with Article 10
Will form part of final Sustainability Appraisal Report
j) A non-technical summary of the information provided under the above headings
To accompany the final Sustainability Appraisal Report
Consulting:
Authorities with environmental responsibilities when deciding on the scope and level of detail of the information which must be included in the environmental report (Article 5.4)
Consultation on the SA Scoping Report – between Friday 22nd July – Friday 2nd September 2016
Table 1: Compliance with the SEA Directive

7
1.3 Purpose of this report 1.3.1 This Scoping Report forms part of the Council’s duty to undertake
Sustainability Appraisal (SA) and Strategic Environmental Assessment (SEA) of the Hastings Town Centre and White Rock Area Action Plan (AAP), prepared as part of the Hastings Local Plan 2011-2028. Its purpose is to identify the scope and level of detail of the information to be included in the final sustainability appraisal report prepared alongside the AAP.
1.3.2 Scoping Reports have been prepared in previous years (2008, 2011) in support of other emerging Local Plan documents. This Report is an update of these earlier versions, and is tailored to be proportionate and relevant to the Hastings Town Centre and White Rock AAP.
1.3.3 Its purpose is to describe the methodology and scope of the appraisal work to be conducted and the proposed framework by which the strategic options and detailed policies will be appraised.
1.4 Background to Hastings and the AAP area 1.4.1 Hastings currently has a population of approximately 90,000 residents all
living within a distinctive urban environment. Hastings is located on the South Coast within East Sussex and is famous for historic references to the Norman Conquest and the Battle of Hastings as well as having a rich architectural heritage. Hastings history is partly shaped by the sea, and although the fishing industry is in decline Hastings still has Europe’s largest beach-launched fishing fleet. The Borough of Hastings is surrounded by the rural district of Rother, and bordered by the High Weald AONB to the north, Combe Haven Valley to the west and Fairlight to the east.
1.4.2 Tourism continues to play an important part in the town’s economy. However, employment is currently concentrated in the health and public services, retail and education sectors with nearly 43% jobs in these sectors compared to the rest of the South East (26%). The town has a small number of large firms, with the majority of firms employing 10 or fewer people. Whilst much has been done, deprivation is still an issue in Hastings (13th most deprived Local Authority area in England out of a total of 354).
1.4.3 Hastings has over 13km of beach and coastline and approximately 300 hectares of open/recreational space. However, there is a limit to the amount of land available for development and a highly protected landscape and countryside surrounding the Borough act as a constraint to outward expansion. The town is 50 miles from the M25 with links to London, Gatwick and Heathrow but has poor road and rail connections to commercial opportunities compared to the rest of the South East.
1.4.4 The Hastings Local Plan currently comprises of the Hastings Planning Strategy (2014) which is the principle document, and the Hastings Local Plan Development Management Plan (2015) developed to take forward a vision for the development of the Borough to 2028.
The overall Planning Strategy vision is:

8
‘By 2028 Hastings, founded upon our unique heritage, natural environment and seaside location, and supported by social, economic, cultural and environmental regeneration will be a safe and thriving place to live, work and visit, that offers a high quality of life, and has a strong economy and sustainable future’.
1.4.5 The Hastings Planning Strategy (2014) provides the strategic framework for development within the Borough for the period 2011-2028. This includes the provision of at least 3,400 new homes, and 70,000 sq. m. of employment space over the plan period. The Planning Strategy maintains Hastings Town Centre as the main retail centre in the Borough as a sub-regional centre with a variety of shops and other facilities. The Planning Strategy identifies the provision of 20,500 sq. m. of additional comparison retail within the Town Centre for the period 2014-2028.
1.4.6 The Area Action Plan will take forward the objectives and aspirations of the adopted Hastings Planning Strategy (2014) using robust evidence and widespread local engagement and will form part of the Local Plan once adopted.

Figure 1: Proposed boundary area for Hastings Town Centre and White Rock AAP

1.5 Sustainable Community Strategy 1.5.1 The Local Plan will be a key driver in helping to deliver Hastings and St
Leonards Sustainable Community Strategy Refreshed Strategy (2009 to 2026). There are 8 themes that provide the focus for the Sustainable Community Strategy activities and priorities:
A Safer Town
An Economically Successful Town
A Learning Town
An Inclusive Town
A Healthier Town
A Town with a Decent Home for Everyone
A Town That’s Good to Live In
A Town Where We Protect Our Environment and Respond to the Challenges of Climate Change
1.6 Hastings Local Plan Objectives 1.6.1 The Local Plan will also help to deliver the Council’s strategic priorities, as set
out within the Hastings Planning Strategy (2014):
Objective 1: Achieve and sustain a thriving economy
Objective 2: Ensure everyone has the opportunity to live in a decent home, which they can afford, in a community in which they want to live
Objective 3: Safeguard and improve the town’s environment
Objective 4: Addressing the impacts of climate change
Objective 5: Supporting sustainable communities
Objective 6: Provision of an efficient and effective transport system
Objective 7: Making best use of the Seafront and promoting tourism
1.7 Council Strategic Priorities 1.7.1 The key priorities of the council are currently set out within the corporate plan
2017/18 and are:
Creating decent homes: To facilitate the supply of secure, affordable and well-designed homes, through strategic planning policies, planning conditions, regulation of the private rented sector, tackling and eliminating bad landlords, and by working with social housing providers.
An attractive town: To maintain visually interesting, well-maintained, uncluttered, clean and functional urban public spaces, especially along the seafront and in our town centres, integrated with high quality protected green spaces accessible to all.
A greener town: To promote practices that minimise our carbon footprint through our policies and our own operations, protect and enhance biodiversity, and limit damaging consequences of human intervention on the natural environment.
Transforming the way we work: To maximise the benefits provided by new technology, to take opportunities for smarter ‘One Team’ working and continue our drive to be more Customer First focused and efficient in the design and delivery of services.

11
1.8 Appraisal Methodology 1.8.1 National Planning Policy Guidance shows the five different stages in the
sustainability appraisal process and the relationship to the Local Plan preparation. This Scoping Report forms Stage A. Section 6 of this report sets out the next steps covering Stages B to E.
Figure 2: Sustainability Appraisal Process
2
2 National Planning Practice Guidance

12
1.9 Sustainability Appraisal Stage A
1.10 Scoping Report 1.10.1 The first stage in the appraisal process (Stage A) is the scoping stage. The
primary purpose of the scoping report is to set out the framework which will be used in undertaking the sustainability appraisal. It aims to set out the context and objectives for the sustainability appraisal and establishes a baseline of information, of existing environmental, social and economic characteristics of the area, including current trends.
The scoping report consists of the following stages:
Identify other relevant policies, plans and programmes and sustainability objectives (Task 1)
Collect baseline information (Task 2)
Identify sustainability issues and problems (Task 3)
Develop the sustainability appraisal framework (Task 4)
Consult the consultation bodies on the scope of the sustainability appraisal report
13
2.0 Task 1: Identify other relevant policies, plans and programmes, and sustainability objectives
2.1 Regulations and guidance 2.1.1 In preparing the Hastings Town Centre and White Rock AAP, the Council
must take account of the relationships between this plan and other policies, plans, programmes and sustainability objectives. This process is referred to as the ‘policy review’. The SEA Regulations also require environmental protection objectives established at international, European or national levels to be taken into account as part of this review.
The aim of the policy review is also to:
assist in the development of an evidence base (Task 2) by identifying possible sources of data;
capture information on environmental and sustainable development issues (Task 3) as identified by the policies being reviewed; and
contribute to the development of the objectives constituting the appraisal framework (Task 4) against which the Area Action Plan being prepared, will be assessed.
2.2 Methodology 2.2.1 The policy context has changed significantly since the publication of the last
Scoping Report in 2011, and as such it has been comprehensibly reviewed. Relevant international, national, regional and local plans and programmes that might influence the Hastings Town Centre and White Rock AAP have been identified and are outlined in Table 3 below. This includes existing development plan documents and other plans and polices produced by Hastings Borough Council. At a local level, the Hastings and St Leonards Sustainable Community Strategy 2009-2026, and adoption of the Hastings Planning Strategy (2014) form key strategic references.
2.2.2 The main objectives of the policy documents reviewed were grouped according to their international, national and local status, together with an indication of how the proposed AAP might address these objectives and requirements. The policy review does not contain an exhaustive list of relevant documents. Rather, a ‘fit for purpose’ approach has been adopted that highlights the most relevant sustainability issues that could affect, or be affected, by the proposed AAP.
2.2.3 We will continue to keep this policy framework under review. In particular, we will monitor changes in relevant international and national legislation, policy and planning guidance, and other policy documents likely to emerge over the plan preparation period.
2.2.4 The table below summaries the Plans, Policies and Programmes identified. The full policy review is set out in Background Paper 1.
International
Johannesburg Declaration on Sustainable Development (2002)
Kyoto Protocol on Climate Change (1997)

14
European Landscape Convention (ELC)
European
Strategic Environmental Assessment (SEA) Directive (2001/43/EC)
EU Water Framework Directive (WFD) (2000/60/EC)
EU Habitat Directive (EU Directive on the Conservation of Natural Habitats and of Wild Fauna and Flora 92/43/EEC)
European Communities Directive on the Conservation of Wild Bird. Directive 2009/147/EC
EU Biodiversity Strategy to 2020
EU Ambient Air Quality Directive (2008/50/EC)
EU Directive 2009/28/EC on the promotion of the use of energy from renewable sources
Bathing Water Directive 2006/7/EC
EU Waste Framework Directive
National
National Planning Policy Framework (2012) and Planning Practice Guidance
Beyond Copenhagen: The UK Government’s International Climate Change Action Plan (2010)
World Class Places (2009)
Climate Resilient Infrastructure: Preparing for a Changing Climate (Defra, 2011)
Biodiversity 2020: A strategy for England’s wildlife and ecosystem services (DCLG)
UK Post 2010 Biodiversity Framework (2012)
Natural Environment White Paper – ‘The Natural Choice: securing the value of nature’ (2011)
The Culture White Paper, DCMS, (March 2016)
Climate Change Act 2008
Flood and Water Management Act (2010)
Waste Management Plan for England (2013)
Skills for Sustainable Growth (BIS, 2010)
Fixing the foundations: creating a more prosperous nation, (2015)
Warm homes, green homes: A strategy for Household Energy Management (2010)
draft Cycling and Walking Investment Strategy (2016)
The UK Low Carbon Transition Plan (2009)
The Renewable Energy Strategy (2009)
Stern Report – Review of the Economics of Climate Change (2006)
Air Quality Strategy for England (Defra, 2007)
The Pitt Review: Learning Lessons from the 2007 Floods
Historic Environment Good Practice Advice in Planning Note 1, 2 & 3
Self-build and Custom Housebuilding Act 2015
Safeguarding our soils: A Strategy for England, Defra
Regional / Catchment

15
South East Local Enterprise Partnership – East Sussex Growth Deal
South East Biodiversity Strategy (2009)
South East River Basin District – River Basin Management Plan (Updated December 2015)
Southern Water – Water Resource Management Plan (2015-2040) & Drought Plan (2013-16)
Cuckmere and Sussex Havens Catchment Flood Management Plan (EA, 2009)
East Sussex County Council
East Sussex County Council Plan 2016/17
East Sussex, South Downs and Brighton & Hove Waste & Minerals Local Plan (adopted 19 February 2013) and emerging Waste and Minerals Site Plan (consultation 28 October – 23 December 2015) and accompanying Policies Map
East Sussex County Council Waste Development Framework & Brighton and Hove City Council Local Development Framework Supplementary Planning Document (SPD); Construction and Demolition Waste (2005)
Pride of Place: Working Towards a Better Future for Local People and Local Communities – A Sustainable Community Strategy for East Sussex 2008-2026
East Sussex Environment Strategy (July 2011)
East Sussex County Council Climate Change Strategy (2009)
East Sussex Local Transport Plan – LPT3, 2011 to 2026
East Sussex Cultural Strategy (2013-2023)
East Sussex Safer Communities Partnerships’ Business Plan 2015 to 2016
East Sussex Local Flood Risk Management Strategy 2013-2016
Local
Hastings and Rother Task Force – Strategic Priorities (Six Point Plan) 2012
Hastings & St Leonards Sustainable Community Strategy 2009-2026
Hastings Borough Council Corporate Plan and Service Priorities (2015/16 – 2017/18)
Hastings Planning Strategy (2014)
Development Management Plan (2015)
Hastings & St Leonards Town-wide Climate Change Strategy and Action Plan (2012)
Hastings Empty Homes Strategy 2009-2013
Hastings & St Leonards Housing Strategy 2015-18
Hastings & St Leonards Homelessness Strategy 2016-2018
Hastings and St. Leonards Anti-Poverty Strategy (2011)
Hastings & Bexhill Economic Development and Inclusion Strategy 2008-2013
Culture-Led Regeneration - A Strategy for Hastings 2016 – 2021
Hastings Walking and Cycling Strategy (2014)
Hastings Leisure Facilities Strategy (2015-2020)
Hastings Open Spaces Plan 2006
Hastings Sport and Physical Activity Strategy (2012-2015)

16
Hastings and St Leonards Play Space Strategy (2015-2017)
Safer Hastings Partnership Community Safety Plan 2014-17
Nature Conservation Strategy (1996)
Hastings Local Biodiversity Action Plan (2007)
Green Infrastructure Study (2012)
Hastings Local Plan – Development Management Plan – Habitat Regulations Assessment (Screening) Report (2014)
Refreshed Seafront Strategy (2014-2020) and accompanying Action Plan (2015-2017)
Renewable Energy and Low Carbon Development Study (2009)
The Economic Impact of Tourism (2013)
Hastings Town Centre and White Rock – Retail and Leisure Assessment & Urban Design Analysis, Bilfinger GVA (2016)
Hastings Level 1 Strategic Flood Risk Assessment (2014)
Hastings Surface Water Management Plan – draft Study Report (March 2011)
Hastings Heritage Strategy and Conservation Area Appraisals
Table 3: Summary of relevant Plans, Policies and Programmes
2.3 Key messages from the context review
2.3.1 The review of plans, policies, programmes and strategies identified a number
of key messages that should be taken into account in developing the Hastings Town Centre and White Rock Area Action Plan. The key messages derived from the context review are important as they aid the identification of the ‘key sustainability issues’ that will be a focus of the SA.
Key messages from this review Communities and well-being
The need to create strong, vibrant and healthy communities, by providing the supply of housing required to meet demand is a priority of the National Planning Policy Framework. The provision of decent, sustainably constructed, affordable homes is a key theme throughout the context review, as identified in the Hastings & St. Leonards Housing Strategy (2015-18) as is the efficient use of previously developed land and buildings, a key objective of the Hastings Empty Homes Strategy (2009-2013).
Communities must have access to a range of local services that reflect their needs that are accessible by public transport. The Hastings Walking and Cycling Strategy (2014) builds on this with key objectives to create a safer, convenient, efficient and attractive walking and cycling network that supports access within and to Hastings.
The Government’s ‘World Class Places’ vision for all places to be planned, designed and developed to provide everyone, including future generations, with a decent quality of life and fair chances, green infrastructure is a core element of the vision. The Safer Hastings

17
Partnership Community Safety Plan includes priorities to reduce crime and fear of crime, encouraging developments that design out crime.
The environment
The protection and enhancement of the natural, built and historic environment forms the basis for a number of key messages highlighted throughout the context review. International and European legislation focuses on increased use of renewable energy resources, energy efficiency and the protection and management of natural resources, particularly water resource management.
The National Planning Policy Framework is clear that pursuing sustainable development includes moving from a net loss of biodiversity to achieving net gains for nature, and that planning should contribute to conserving and enhance the natural environment including reducing pollution, this is also included with Biodiversity 2020 Strategy (2011).
The need to tackle climate change is integrated into the objectives of many policy documents, at international level in the Kyoto Protocol on Climate Change, consideration to climate change mitigation is considered in national strategies Beyond Copenhagen: The UK Government’s International Climate Change Action Plan, the Natural Environment White Paper – ‘The Natural Choice: securing the value of nature (2011); the Stern Review which promoted the use of sustainable drainage in new development to reduce the risk of flooding and more locally the in the Hastings and St. Leonards Town-wide Climate Change Strategy and Action Plan (2012).
At a sub-regional level key messages include minimising the amount of waste created and getting more waste re-used and recycled, promoting the use of open spaces for healthy and active lifestyles. The East Sussex, South Downs and Brighton & Hove Waste & Minerals Local Plan a planning policy framework for waste disposal and management at a County level.
Efforts to reduce pollution, notably water, air, noise and soil pollution are requirements of European legislation, for instance through the Water Framework Directive (WFD), EU Ambient Air Quality Directive and at a national level Safeguarding our Soil: A Strategy for England.
Promoting sustainable transport is a core principle within the National Planning Policy Framework. Promoting non-car based forms of transport, is highlighted within the governments draft Cycling and Walking Investment Strategy (2016) linked to reducing road congestion, pollution levels and improved health as is within the Hastings Walking and Cycling Strategy (2014).
The economy
There is a need to develop and sustain a vibrant economy. More specifically, the viability and vitality of town centres is a key objective of the National Planning Policy Framework, as is building a strong, responsive and competitive economy.
Strategies highlight the close interrelationship between Hastings and Rother and a shared approach to future prosperity. The vision within the Hastings Planning Strategy makes clear reference to economic regeneration, the aim of creating a thriving place to live, work and visit with a strong economy. A consistent approach to economic regeneration

18
and promoting inward investment is taken within the Six Point Plan, for Hastings and Rother as well as the Hastings and Rother Employment Strategy and Land Review (2008). The need to invest in the regeneration of the most deprived areas to narrow the deprivation gap is also a key message.
Developing Hastings Town Centre as the focus for employment in office, retail, leisure, cultural and service sectors is a key objective of the Local Plan. The importance of planning for future retail needs, providing choice and a diverse retail offer is highlighted with the Bilfinger GVA study - Hastings Town Centre and White Rock, Retail and Leisure Assessment and Urban Design Analysis (2016).
The context review highlights the importance of tourism to the economy of Hastings within the Economic Impact of Tourism in Hastings (2013) and links to regeneration objectives. The need for enhanced tourism facilities, promotion of diversity and reduced seasonality is a specific message from the review. Giving priority to the retention of visitor accommodation along the Seafront is also of concern (Retaining Hotels and Guesthouses in Hastings, 2009).
There is a need for sustainable growth and extending social mobility with improved skills levels – Skills for Growth, BIS, (2010) as also identified within the SELEP Strategic Economic Plan.

19
3.0 Task 2 - Collecting baseline information
3.1 Regulations and guidance 3.1.1 Baseline information is required for SA/SEA to enable the effects of the plan
to be predicted and monitored. The baseline information refers to existing characteristics of the study area likely to be affected by the plan, and their likely evolution without intervention of new policies. This entails gathering information on the social, economic and environmental characteristics of the study area and beyond to provide the basis against which the likely effects of alternative proposals can be assessed.
3.1.2 Understanding these characteristics will help us to comprehensively develop the baseline information to:
identify the existing situation, trends, and the likely situation in the absence of the plan;
compare with any established thresholds or targets;
establish whether particularly sensitive or important elements are affected e.g. rare habitats, non-renewable resources etc
establish whether problems are permanent or temporary, reversible or irreversible;
establish how difficult it would be to mitigate against any damage; and
identify significant cumulative or synergistic effects over time, and future expectations
3.2 Methodology 3.2.1 A preliminary set of baseline data has been extracted from a wide range of
sources. These have come from Government and Government agency publications and websites, as well as census data and the East Sussex in figures website. At a local level the Local Plan Monitoring Report, Corporate Plan and Hastings Borough Council Strategies and website have provided useful sources of data. No primary research has been conducted. To provide the level of detail required for the SA of the AAP, data available for the relevant wards (Gensing, Central St. Leonards, Castle) have been used, where available. See Background Paper 2 for baseline data.
3.2.2 A range of indicators have been identified that will allow environmental, social and economic conditions from a wide range of sources to be monitored over time. These are set out in full in Appendix B of this report, and provide information on the following subject areas:
Population
Access to services
Community strength
Community safety
Deprivation
Economy, jobs and prosperity
Education, learning and skills
Health and wellbeing
Housing

20
Environment and Climate Change – transport, green space, heritage, soil and land, waste, water, air and climatic factors
3.2.3 The indicators and data will provide the basis for predicting and monitoring
effects of the AAP. They will also be used to help identify sustainability problems, and the alternative ways of dealing with them.
3.2.4 The indicators have helped to:
provide local evidence for the issues highlighted in the Policy Review in (Task 1)
identify key environmental and other sustainable development issues for Hastings Town Centre and White Rock Area (Task 3); and
develop the sustainable development and strategic environmental assessment objectives in section 5 (Task 4)
3.2.5 The collection of baseline data should not be viewed as a one off exercise at
Stage A, it is likely that further data collection will be needed at later stages as the SA progresses. In determining the level of data collected the key determining factor is the level of detail needed to appraise the plan against the SA objectives. This baseline information will continue to be updated and revisited at appropriate stages in the future.
3.2.6 A summary of the key characteristics of Hastings Town Centre and White Rock Area is shown below in a descriptive format.
Hastings Town Centre and White Rock area – a spatial overview
3.2.7 Hastings Town Centre and White Rock area has been identified as having a pivotal role to play in the continued economic and cultural regeneration of the Borough as the largest retail, leisure, service and tourism destination, and employment centre within the Borough. Hastings Town Centre is located between the historic Old Town, including Hastings Castle to the east and St. Leonards-on-Sea to the west. These areas form an important part of the Borough’s civic and cultural identity. The Priory Meadow Shopping Centre and adjacent pedestrianised shopping streets dominate the character of the Town Centre.
3.2.8 The Hastings Town Centre and White Rock Retail and Leisure Assessment and Urban Design Analysis Report (March 2016) forms an important part of the evidence base for the AAP and identifies 6 character areas within the AAP area.
1) Summerfields – land north of Bohemia Road, including Summerfields Wood Local Nature Reserve, Horntye Park, Summerfields Leisure Centre, Hastings Museum and Art Gallery, the police station, ambulance station, fire station and the Travelodge;
2) White Rock Gardens – this area includes the public open space south of Bohemia Road and north of St. Margaret’s Road divided by Falaise Road as well as the former Convent of the Holy Child Jesus;
3) Seafront St. Leonards – This area includes the seafront promenade, A259 road and terraced buildings from Warrior Square in the west to the Pier in the east;
21
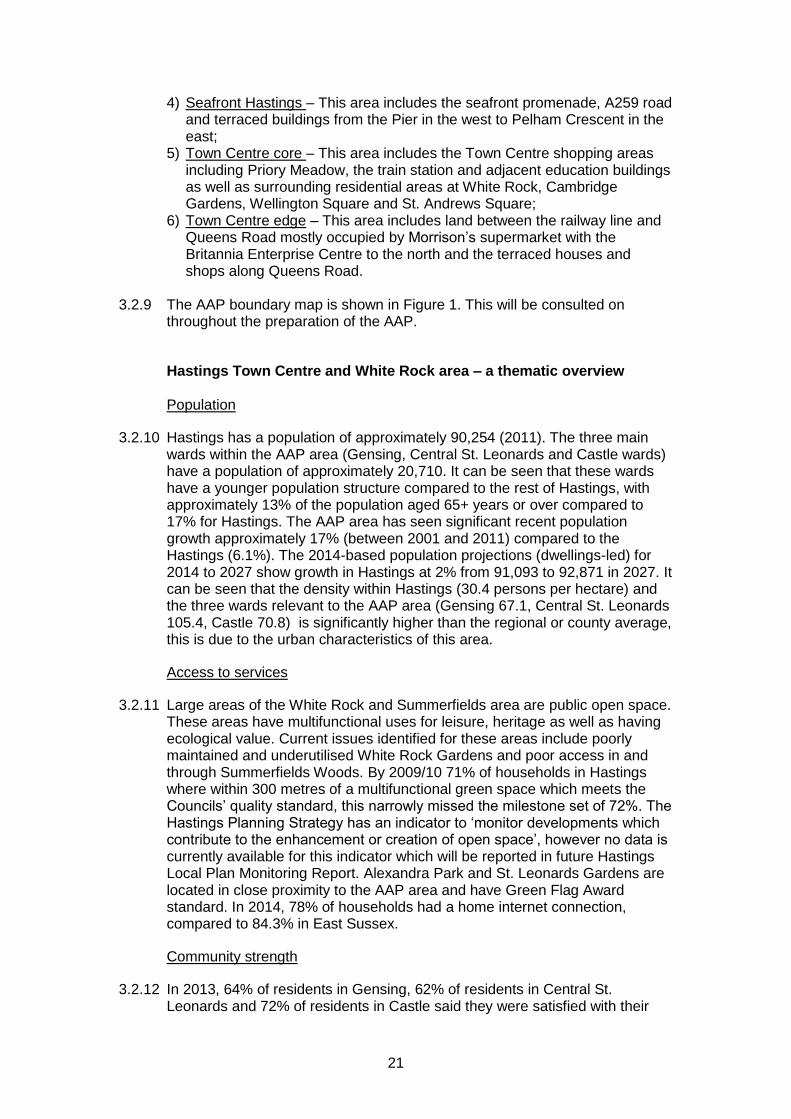
4) Seafront Hastings – This area includes the seafront promenade, A259 road and terraced buildings from the Pier in the west to Pelham Crescent in the east;
5) Town Centre core – This area includes the Town Centre shopping areas including Priory Meadow, the train station and adjacent education buildings as well as surrounding residential areas at White Rock, Cambridge Gardens, Wellington Square and St. Andrews Square;
6) Town Centre edge – This area includes land between the railway line and Queens Road mostly occupied by Morrison’s supermarket with the Britannia Enterprise Centre to the north and the terraced houses and shops along Queens Road.
3.2.9 The AAP boundary map is shown in Figure 1. This will be consulted on
throughout the preparation of the AAP.
Hastings Town Centre and White Rock area – a thematic overview
Population
3.2.10 Hastings has a population of approximately 90,254 (2011). The three main wards within the AAP area (Gensing, Central St. Leonards and Castle wards) have a population of approximately 20,710. It can be seen that these wards have a younger population structure compared to the rest of Hastings, with approximately 13% of the population aged 65+ years or over compared to 17% for Hastings. The AAP area has seen significant recent population growth approximately 17% (between 2001 and 2011) compared to the Hastings (6.1%). The 2014-based population projections (dwellings-led) for 2014 to 2027 show growth in Hastings at 2% from 91,093 to 92,871 in 2027. It can be seen that the density within Hastings (30.4 persons per hectare) and the three wards relevant to the AAP area (Gensing 67.1, Central St. Leonards 105.4, Castle 70.8) is significantly higher than the regional or county average, this is due to the urban characteristics of this area.
Access to services
3.2.11 Large areas of the White Rock and Summerfields area are public open space. These areas have multifunctional uses for leisure, heritage as well as having ecological value. Current issues identified for these areas include poorly maintained and underutilised White Rock Gardens and poor access in and through Summerfields Woods. By 2009/10 71% of households in Hastings where within 300 metres of a multifunctional green space which meets the Councils’ quality standard, this narrowly missed the milestone set of 72%. The Hastings Planning Strategy has an indicator to ‘monitor developments which contribute to the enhancement or creation of open space’, however no data is currently available for this indicator which will be reported in future Hastings Local Plan Monitoring Report. Alexandra Park and St. Leonards Gardens are located in close proximity to the AAP area and have Green Flag Award standard. In 2014, 78% of households had a home internet connection, compared to 84.3% in East Sussex.
Community strength
3.2.12 In 2013, 64% of residents in Gensing, 62% of residents in Central St. Leonards and 72% of residents in Castle said they were satisfied with their

22
local area, this compares to 75% of residents that said they were satisfied in Hastings. In 2013, respondents to the Place Survey were least satisfied with the local area in Central St. Leonards and Gensing wards.
3.2.13 In terms of community cohesion 67% of Gensing respondents agree that people from different backgrounds get on well together, this compares to 69% in Central St. Leonards and 81% in Castle.
Community safety
3.2.14 Hastings has an 86.2 recorded crime rate per 1,000 population in 2015/16. This compares to 71.4 in the previous year with Hastings now having the 3rd highest crime rate across East Sussex. 54% of people surveyed in Hastings felt safe outside in their local area after dark. This is an improvement against 2009 figures for Hastings (39%). A review of wards showed residences living in Old Hastings felt most safe (70%) whilst those living in Gensing (42%) and Central St. Leonards (43%) were most likely to feel unsafe.
Deprivation
3.2.15 Hastings is one of the most deprived local authorities in England (20th most deprived area out of 326) (2015 rank of average score). Deprivation is widespread throughout the town. All wards within the AAP area are amongst the 10% most deprived neighbourhoods in the country. Hastings also has significantly high levels of child poverty. In 2013, 28.8% of children under the age of 16 were living in poverty, compared to 17.7% in East Sussex as a whole. This figure is even more acute within the wards that represent the AAP area.
Economy, jobs and prosperity
3.2.16 Economic activity is relatively low within the wards that represent the AAP area (average 72%) compared to the England and Wales average (76.8%). Unemployment is significantly high within the AAP ward areas (average 14%) compared to the rest of Hastings (9.4%) and nearly twice that of the UK average (7.6%).
3.2.17 In March 2016, 2.5% of Hastings residents were on Out-of-Work Benefits, compared to 1.8% across the UK. There are significantly more people claiming Out-of-Work Benefits within the AAP area wards, (Gensing 3.9%), Central St. Leonards (4.3%) and Castle (4.1%) however these figures are an improvement on the previous year. As at March 2016, allowance (JSA) claimants in the AAP ward areas is significantly high at around 3.4% compared to Hastings (2.1%) and the rest of the county (1.1%). However this has reduced against the previous 12 months (March 2015), where the AAP representing wards averaged 5%.
3.2.18 Average (mean) household income in the AAP ward areas was £27,298 in 2015, this compares to £30,100 in Hastings and £35,991 in the rest of East Sussex. It can be seen that a relatively low proportion of residents within the AAP area are engaged in high-value employment (average 35%) including managers and senior officials, professionals, associate professionals and technical, compared to England and Wales (40.9%).
Education, learning and skills

23
3.2.19 In 2011/12, the percentage of pupils achieving 5+ GCSEs within the three AAP wards (Gensing 42.1%, Central St. Leonards 41.2%, Castle 36.2%) was significantly lower than that of Hastings (48.8%) and the rest of East Sussex (57.8%).
3.2.20 In 2011, approximately 22% of working age people 16 and over had no qualification within the AAP wards which is comparative to East Sussex (22.6%) and slightly better than Hastings (25.4%). This is an improvement against figures from the previous Census (2001) when 31.6% of working age population had no qualification.
Health and wellbeing
3.2.21 St. Leonards has the highest percentage of people of all localities reporting that their health is bad or very bad (13.9%); Gensing (8.5%) and Castle wards (7.9%) align more with Hastings 7.4% which is still higher than East Sussex (5.8%) or the South East (4.4%). Premature mortality from all caused is significantly higher in Hastings, compared to East Sussex and is acute in Gensing (200, where a 100 is expected). Mortality rate from suicide and injury of undetermined intent is notably stark in Gensing (300) and Central St. Leonards (303) compared to Hastings (147) and East Sussex (100). Where 100 represents the expected rate.
Transport
3.2.22 The lower super output areas that represent the AAP area have a high proportion of residents who do not own a car (approximately 53%), which may reflect accessibility to the main transport interchange with the train station within the Town Centre. Hastings has a high proportion of residents that live and work in the Borough. Residents that travel less that 10km to work (59.1%) is much higher than the South East figure (46.9%) which may be lower due to those willing to commute longer distances to London. Home working has seen growth over the last 10 years with 8.7% of the population working from home in 2001, compared to 10.9% in 2011.
3.2.23 Although some improvements have been made, rail links are still considered to be poor in Hastings, especially to key commercial hubs. Information relating to bus passenger trips is now not available.
Housing
3.2.24 The average house price in 2015 Q1 in Hastings was £173,565. This is significantly lower than the East Sussex average £260,428, and the South East at £307,882. A house price/affordability ratio update 2014 showed a figure of 7.33 for Hastings, as compared to 10.55 for East Sussex, and 9.17 for the South East. However, due to relatively low average incomes in Hastings, the affordability of property for local people is still an issue.
3.2.25 Data on housing spaces by accommodation type shows significantly high proportion of ‘part of a converted or shared house (including bed sits) within the AAP area, notably within Gensing (40.8%) and Central St. Leonards (42.7%) and to a lesser extent in Castle (34.1%). This reflects the demand for low cost rental accommodation and the role the private rental sector has in meeting housing needs within the Borough.

24
3.2.26 In 2011, the Council introduced an additional HMO Licensing Scheme to all privately rented property situated in Castle, Gensing, Braybrooke and Central St. Leonards wards to ensure minimum acceptable home standards are met. The Corporate Plan 2014/15 shows that at year end 250 licenses had been issued within these four wards achieving the target set by Housing and Planning Services.
3.2.27 In 2015/16 there were 19 shared ownership and 75 social rented dwelling completions (34% of total housing completions), none of these affordable completions were within the AAP area.
Green space
3.2.28 Hastings has three open spaces managed to Green Flag Award standard, all outside of the AAP area. Alexandra Park adjoins the AAP area to the north east, St. Leonards Gardens is within walking distance to the AAP area to the west, and Hastings Country Park Nature Reserve which is located in the east of the Borough. Whilst Hastings Town Centre has limited public green space, the White Rock area is predominantly open space, including White Rock Gardens which includes a mix of indoor and outdoor leisure facilities. Summerfields Wood (7.30ha) is also located in this area and is semi-natural woodland, Local Nature Reserve, Local Wildlife Site.
Heritage
3.2.29 Hastings has over 900 listed buildings, with 18 conservation areas, 2 historic parks, over 300 archaeological sites/monuments/finds locations, and 17 archaeological notification areas within the town. There are 67 Listed Building Listings within the AAP area comprising 142 identified buildings/assets. Listed assets in the AAP area include a drinking fountain, a war memorial and a lifting shaft winding gear. There are 7 conservation areas either in whole or in part within the AAP area. There are 6 Buildings at Risk within the Borough, 2 of these are within the AAP area, including the United Reformed Church, Cambridge Road and Pelham Arcade, 1-12 and 12A Pelham Place.
Soil and Land
3.2.30 In 2015/16 the number of new homes build on previously developed land was 273 (98%) of the total completions. This is a year on year improvement since 2011/12. In 2014/15 Havelock Place (office block) was completed (2320m2) on previously developed land which is located within the AAP area.
Waste
3.2.31 Latest figures within the Corporate Plan show that in March 2015, 28% of household waste was sent for reuse, recycling and composting. This is an improvement against 2012/13 figures where 18.9% was recycled and 5.6% composted. The target for the year end is 30%.
Water
3.2.32 Cycle 2 2015 water quality classification for Combe Haven between Powermill Stream confluence and Coast has an overall classification of ‘poor’ (Ecological ‘poor’, chemical ‘good’) this shows that water quality has got worse against cycle 1 2009 classification when the overall water quality was

25
‘moderate’. Conversely, bathing water quality at Hastings has improved from ‘poor’ in 2014, to ‘good’ in 2015.
Air and climatic factors
3.2.33 Hastings has one air quality management area (AQMA) - Bexhill Road – which is designated for exceeding PM10

26
3.3 Data availability and ‘gaps’ 3.3.1 It is important to highlight gaps in the baseline data at this stage to ensure
that consideration is given to the inclusion of this data in the formation of a monitoring framework.
3.3.2 The AAP boundary has evolved from an initial historical boundary used for the town centre in previous development plans and carried forward into the Hastings Planning Strategy and Hastings Development Plan. This initial boundary was extended to include geographical and land-use considerations, including the Pier, and White Rock area and through discussions with the White Rock Trust. The boundary cut across focus areas identified within the Hastings Planning Strategy and does not exactly fit into wards or lower super output areas. Statistics have therefore been used to closely match the boundary where available. At ward level, the AAP area is relevant to Gensing, Central St. Leonards and Castle. However, the extent of the boundary will be consulted on at appropriate stages throughout the development of the AAP.
3.3.3 Data gaps or limitations include:
Many of the indicators use Census 2011 data which is now 5 years old;
The last ‘Place Survey’ for the Borough took place in 2013;
A number of indicators were drawn from the Hastings and St. Leonards Sustainable Community Strategy 2009-2026 which included targets which are now out of date. No replacement targets are available in many cases;
No Borough data available for estimated traffic flow levels;
Average distance travelled to work only available at Borough level and range of distances travelled has changed from comparison data (2001);
Bus usage data is only available at County level, no data currently available for Hastings;
No data currently available for the number of renewable energy schemes installed; limited data on the location of existing district heating networks;
Change in areas of biodiversity importance has potential for double counting due to overlapping of different designations;
3.3.4 The Hastings Planning Strategy (2014) and Hastings Development
Management Plan (2015) are recently adopted and as such monitoring frameworks that have been established to report on their implementation have not had time to embed. There are therefore a number of new indicators where there is no data currently available:
No data currently available for access to open space. The Planning Strategy (indicator 19) includes a new indicator ‘Monitor developments which contribute to the enhancement or creation of open space’, no data currently available;
New Planning Strategy indicator (39) net completions of community facilities no data currently available;
Total amount of comparison retail floorspace (m2) developed, new indicator no data currently available;
Change in areas of greenspace as identified on the Policies Map affected by development (by type);

27
Number and % of Hotels, B&Bs and other tourist accommodation which have national quality accreditation, new indicator no data currently available;
New Planning Strategy indicator (48), net additional completions a) visitor accommodation and b) caravan/camping/chalet sites, no data available;
New Planning Strategy indicator (50), net additional visitor attractions in the Borough with particular focus along the seafront. This will be reported in future Authority Monitoring Reports. However, recent major new developments along the seafront include the opening of the Hastings Pier (27th April 2016) and the Source Skate Park (13th February 2016);
New Development Management Plan indicator (2) net number of non-A1 uses granted planning permission and/or implemented in Hastings Town Centre. Will be reported in future Authority Monitoring Reports;
New Development Management Plan indicators 6, change of use away from A, B and D use classes. Will be reported in future Authority Monitoring Reports;
New Development Management Plan indicator 7, amount of new cultural related development within the four Cultural Quarters (White Rock and America Ground Cultural Quarter, Academic Cultural Quarter relevant to the Town Centre & White Rock Area Action Plan), no information currently available;
New Development Management Plan indicator 8, amount of development resulting in the loss of a cultural asset within the four Cultural Quarters (White Rock and America Ground Cultural Quarter, Academic Cultural Quarter relevant to the Town Centre & White Rock Area Action Plan), no information currently available;

28
3.4 Likely future trends under the ‘business as usual’ option 3.4.1 Baseline information as described above and shown in Background paper 2
identifies the current state of Hastings Town Centre and White Rock area, and includes trend data where available. Analysis of this data provides us with a view of the likely future trends within the AAP area, should policies and proposals in the Hastings Town Centre and White Rock Area Action Plan not be implemented.
Future trends
3.4.2 The Hastings Local Plan provides for significant change in Hastings up to 2028, including the provision of at least 3,400 new homes, and additional commercial development to support a change in the local economy.
3.4.3 It is very difficult to predict the nature of future trends, as they depend on a wide range of factors including the global and national economic climate, and decisions made at regional and county level. From the baseline assessment it appears that the following trends are likely to continue:
Social
3.4.4 The population of Hastings is predicted to increase by 2% by 2027 based on 2014-based population projections (dwelling-led). However, the AAP area has seen significant increases in population growth over the last ten years compared to the rest of Hastings and indeed the South East and this trend is likely to continue. The increased population will require more services (health, education, recreation, shopping), access to parks and open space, public transport, waste management etc. as well as placing more demand on existing services. Although the AAP area currently has a younger age structure compared to the rest of Hastings, increases are expected in the elderly and retirement age population.
3.4.5 Deprivation is likely to continue to be widespread throughout Hastings, health being a notable issue within the AAP area. Together with an older population profile this could potentially put pressure on existing services and facilities, such as healthcare provision. There have been some notable recent improvements in education achievement within the AAP area and this is likely to continue over the next 15 years which could be positively influenced if access to higher education is retained.
3.4.6 House prices in Hastings remain the lowest in the South East, and although the affordability ratio is improving, the need for more affordable homes still remains as income levels in the town are low. Trend data shows increasing numbers of homeless households in priority need is also highlighted. It is likely that the affordability of housing in the AAP area may not see any improvement and may even deteriorate.
3.4.7 It remains to be seen if the Council can promote an appropriate amount of larger higher value homes, and raise the overall standard of general market housing provision in Hastings Town Centre and White Rock area.
Environment

29
3.4.8 Although trend data shows satisfaction with the local area is improving there is still much to be done, with respondents to the Place Survey (2013) being least satisfied within Central St. Leonards and Gensing wards. Crime and the fear of crime continue to be a problem within the AAP wards. The AAP will need to facilitate improvements to create safe and attractive environments.
3.4.9 Overall water quality within the main river covering the Borough has got worse since 2009 and is now in ‘poor’ ecological status. Water quality is unlikely to improve without intervention. Recycling levels have reduced over the last 5 years this reflects a general decline in recycling across Britain. Hastings has a good track record of developing on previously developed land; this is likely to continue as there are limits to the amount of land available for development and regeneration purposes.
3.4.10 All new development will need to be designed and built within the context of a changing climate.
Economic Trends
3.4.11 It will be important for Hastings Town Centre to safeguard and enhance its retail offer, as failure to attract indigenous and inward investment may result in Hastings economy continuing to be weak. Competing centres such as Ashford, Eastbourne and Tunbridge Wells may also absorb the consumer spending share that is currently benefiting Hastings.
3.4.12 The AAP area contains some of the most deprived communities in the country, with substantial population increases expected economic growth and concentrated regeneration efforts will be essential to facilitate new employment opportunities. A lack of economic growth is likely to be felt most within these deprived areas, where wages and average household income is low.
3.4.13 It can be seen that there is a concentration of public sector jobs within the town, which makes the economy more vulnerable to economic changes. There is a need for the economy to diversity into higher value sectors such as finance, real estate, scientific and technological sectors as failure to do so may result in continuing low average wage levels.

30
4.0 Task 3 - Identifying Sustainability Issues
4.1 Regulations and guidance
4.1.1 Government guidance advises that the Local Plan should be informed by sustainability issues, including environmental problems as defined by the SEA Regulations, identified through the scoping process. Such issues should be identified having regard to the policy review (task 1), the baseline information identified (task 2), as well as through consultation with relevant organisations and stakeholders.
4.2 Methodology 4.2.1 Identifying sustainability issues in this way provides an opportunity to define
key issues that the AAP will specifically need to address, and to develop sustainable plan objectives and options for resolving these. Analysis of key sustainability issues relevant to Hastings Town Centre and White Rock AAP has been carried out. This work has been based on consultation and discussion with HBC planning officers, review of previous SA/SEA work, review of relevant plans and programmes, and analysis of the baseline data. The analysis of the sustainability issues is iterative and an on-going process. As the SA develops with further stakeholder involvement the analysis of key issues is likely to evolve, which in turn will influence the baseline and SA framework.
4.2.2 The sustainability issues for Hastings were originally identified through the following means:
Review of previous SA/SEA work
Discussions with planning officers
Through the context review (task 1)
An analysis of the baseline (task 2) 4.2.3 A detailed account of these is shown in Appendix A at the end of this report.
Please note that this list is by no means exhaustive, but an attempt to acknowledge those that are a priority within Hastings Town Centre and White Rock area.

31
5.0 Task 4 - Developing the Sustainability Appraisal and Strategic Environmental Assessment objectives
5.1 Regulations and guidance 5.1.1 A framework of SA/SEA objectives is a recognised way of allowing the social,
economic and environmental effects of Local Plans and their alternatives to be tested. The objectives should be compatible with government policy and guidance and be informed by local strategic policy, such as Council priorities.
5.1.2 To fulfil the requirements of the SEA Directive, the SA objectives must take into account biodiversity, population, human health, fauna, flora, soil, water, air, climatic factors, material assets, cultural heritage, landscape, but focus on the key issues in the local area.
5.1.3 The SA objectives should be distinct from Local Plan objectives, although it is acknowledged that in some cases, they may overlap.
5.2 Methodology
5.2.1 The draft SEA/SA objectives are listed below. They were originally developed during earlier scoping processes, in relation to earlier Local Plan documents, notably the Hastings Planning Strategy (2014) and the Hastings Development Management Plan (2015). The objectives have taken into account:
the revised policy review of Task 1
the revised baseline information of Task 2
the revised sustainability issues and environmental problems of Task 3
feedback from consultation on previous draft scoping reports
quality assurance advice and external best practice 5.2.2 The original objectives have been reviewed and found to still be fit for
purpose, with only very minor changes needed. This will have the benefit of providing consistency across the SA/SEA frameworks used for the Local Plan.
Social
1. More opportunities are provided for everyone to live in a decent, sustainably constructed and affordable home suitable to their needs;
2. The health and well-being of the population is improved and inequalities in health are reduced;
3. Levels of poverty and social exclusion are reduced and the deprivation gap is closed between the more deprived areas in Hastings and the rest of the town;
4. Opportunities are available for everyone to acquire new skills, and the education and skills of the population improve;
5. All sectors of the community have improved accessibility to services, facilities, jobs, and social, cultural and recreational opportunities, including access to the countryside and the historic environment;
6. Safe and secure environments are created and there is a reduction in crime and the fear of crime;
7. Vibrant and locally distinctive communities are created and sustained.

32
Environment
8. Land and buildings are used more efficiently and the best use is made of previously developed land;
9. Biodiversity is protected, conserved and enhanced; 10. The risk of flooding (fluvial & tidal) and coastal erosion is managed and
reduced now and in the future; 11. Parks and gardens, countryside, coast and the historic environment/
townscape and landscape are protected, enhanced and made more accessible;
12. Air pollution from transport and land use planning is reduced and air quality continues to improve;
13. The causes of climate change are addressed through reducing emissions of greenhouse gases through zero/low carbon development (mitigation) and ensuring the town is prepared for its impacts (adaptation);
14. The risk of pollution to all water resources is reduced, water quality is improved and water consumption is reduced;
15. The use of sustainable energy and renewable energy technologies is maximised in new development, and in existing buildings;
16. Through waste re-use, recycling and minimisation the amount of waste for disposal is reduced;
17. Road congestion and pollution levels are reduced, and there is less car dependency and greater travel choice.
Economy
18. There are high and stable levels of employment and rewarding and satisfying employment opportunities for all;
19. Economic revival in the more deprived areas is stimulated and successfully achieved;
20. The sustained economic growth of Hastings Town Centre is achieved and linked closely to social regeneration;
21. Indigenous and inward investment is encouraged and accommodated
5.3 The Sustainability Appraisal Framework 5.3.1 The Sustainability Appraisal Framework provides a way in which sustainability
effects can be described, analysed and compared as part of the Sustainability Appraisal process. Indicators that can be used to monitor the achievement of the sustainability objectives are included in the framework.
5.3.2 As the Area Action Plan is being progressed, each emerging policy will be assessed against the sustainability objectives. The framework also consists of prompt questions to assist within the decision-making and sustainability appraisal process.
5.3.3 The complete framework is available in Appendix B.

33
6.0 Task 5 - Consulting on the scope of the Sustainability Appraisal and Strategic Environmental Assessment
6.1 Regulations and guidance 6.1.1 The Government have designated the Environment Agency, Historic England
(formerly English Heritage) and Natural England as ‘authorities with environmental responsibilities’3. These organisations must be consulted on by the plan making authorities on the content of the SA Scoping Report and SEA requirements. The regulations also specifies that the consultation bodies are to be given a period of 5 weeks in which to respond from the date they receive the Scoping Report.
6.1.2 This version of the Scoping Report will be consulted on with the three statutory environmental bodies, and other key stakeholders that the Council believe have a valuable input and interest in the SA Scoping Reports preparation. These consultees are listed below.
6.1.3 Consultation on this version of the SA Scope Report begins on 22nd July 2016 with a closing date of the 2nd September 2016 (which is 6 weeks).
List of consultees
Environment Agency
Historic England
Natural England
East Sussex County Council
Rother District Council
Sussex Wildlife Trust
3 Environmental Assessment of Plans and Programmes Regulations 2004

34
6.2 Remaining stages of the SEA/SA process 6.2.1 Following the preparation of a Scoping Report, Stages B, C and D of the SA
process need to be undertaken. These correspond specifically with the Plan preparation process. A summary of these steps is shown below
Stage B: Developing and refining alternatives and assessing effects
B1 – Test the Area Action Plan objectives against the sustainability appraisal framework B2 - Develop the Area Action Plan options including reasonable alternatives B3 – Evaluate the likely effects of the Area Action Plan and alternatives B4 – Consider ways of mitigating adverse effects and maximising beneficial effects B5 – Propose measures to monitor the significant effects of implementing the Area Action Plan
Stage C: Prepare the Sustainability Appraisal Report C1 – Prepare the SA Report
Stage D: Seek representations on the sustainability appraisal report from consultation bodies and the public
D1 – Public participation on the issues and options of the AAP and the SA/SEA Report
D2(i) – Appraise significant changes 6.2.2 This Scoping Report, updated as appropriate, will provide the framework for
assessing how the Council is delivering sustainable development throughout all stages of AAP preparation. Objectives and indicators set out here will be used to appraise and monitor the development of the AAP.
6.2.3 Future reports prepared as part of the SA/SEA process will evidence this assessment as different stages of the AAP are completed, resulting in the preparation of a final Sustainability Report that will be subject to consultation alongside the AAP (stage C).
6.2.4 Both documents will be subject to full consultation and be duly considered at the Examination in Public of the AAP (stage D).

Appendix A - Sustainability Issues
Sustainability Issue Description/supporting information Action/issues for the AAP
SOCIAL ISSUES
Increasing population, and planning for increase in older people and student population
Approximately 91,542 people live within the Borough of Hastings (2015). The 2014-based population projections (dwelling-led) for the period 2014 to 2027 shows 2% population growth from 91,093 in 2014 to 92,871 in 2027. It can be seen that the three wards that relate to the AAP area have seen significant growth (Gensing 13.4%, Central St. Leonards 23.5% and Castle 14.7%) compared to Borough (6.1%) and regional (7.9%) increases between 2001 and 2011. It can be seen that Hastings has a young population structure compared to the other East Sussex boroughs, and the AAP wards have a younger population structure compared to the rest of Hastings, with 13% of the population aged 65+ years or over compared to 17% for Hastings. However, population projections show that by 2027 the age structure will shift with growth in the older age group (65+ years) which reflects the national trend with people living longer. More recently the University of Brighton has made a decision to close the Hastings campus, however Hastings Borough Council, together with Rother and ESCC are working to keep a university presence in Hastings and therefore the student population will need to be a considered.
Consider population growth in AAP policies and infrastructure requirements needed to support increase in population and potential for ageing and student population.

36
Access to services Access to services such as health care, education, shops, GPs, public transport, employment, training, parks and open space is a major issue. A lack of mobility can cause real hardship, reducing opportunities for employment and education as well as access to leisure and cultural activities. Limited public transport can contribute to increasing the isolation of communities and individuals.
The AAP should ensure that places and communities are well connected with good transport services and networks that link people to schools, health, leisure, shopping, health leisure, shopping and the natural environment without having to rely on private car use. It should also make provision for a green network providing connectivity between existing and proposed spaces.
Housing need and affordability
The need for affordable housing in Hastings is acute; in 2005 the Housing Needs Survey estimated 596 new affordable homes were needed per annum to meet demand. As at 2015, the average house cost £173,565 in Hastings, with an affordability ratio of 7.33 (2014 figure) due to the relatively low average incomes. There are currently over 1,000 households on the housing waiting list in Hastings. It is clear that the AAP therefore has an important role to play in addressing some of this unmet housing need.
Ensure that local requirements for housing are met, and that everyone has the opportunity of a decent, affordable home. The AAP will need to assist in the delivery of affordable housing.
Unfit dwellings Poor housing conditions impact on the quality of people’s lives, from health through to education and employment opportunities. As at January 2016 the total dwelling stock was 43,782 within the Borough and based on dwelling-led projections this is set to rise to 45,902 by 2025. Census data (2011) reports that most of the homes in Hastings are owner occupied (55.2%), compared to approximately 31% in the AAP area. Private rented accommodation makes up 58% of homes within the AAP area in comparison to Hastings as a whole (28.8%) and East Sussex (17.8%). Most properties that are non-decent are found in the private rental sector.
The AAP will need to provide additional homes that provide a range of housing options for existing and future residents, including affordable housing and there is a need to improve and make best use of existing housing stock.

37
The 2007 House Condition Survey, shows that a large number of homes within Hastings were constructed Pre-1919 (46.7%) compared to the national figure (24.9%), which has contributed to high levels of housing unfitness.
Fuel poverty and energy efficiency
The built environment is a significant energy user and contributes to greenhouse gas emissions. The energy efficiency of much housing stock is poor, resulting in high fuel bills. New buildings provide an opportunity to ensure that buildings are constructed to be energy efficient and sustainable, to minimise their impact on the environment. Households experiencing fuel poverty are more likely to be found in the town centre area. The House Condition Survey (2007) identified that 6.1% of households in the town (2100 dwellings) were in fuel poverty.
Incorporate sustainable design and construction, energy efficiency into new development, and the AAP to exploit opportunities for CHP and district heating schemes and contribute to the alleviation of fuel poverty.
Eradication of deprivation hotspots
Deprivation is widespread throughout the Borough with many of the wards being affected in one way or another. Hastings ranks as the 20th most deprived areas in England (out of 326) (2015 rank of average score). All wards within the AAP area are amongst the 10% most deprived neighbourhoods in the country. The Council has prioritised a multi-agency approach to tackling the issues of deprivation. The AAP can promote and support the regeneration efforts addressing pockets of deprivation.
Consider issues of social exclusion and accessibility for disadvantaged groups. The AAP will need to promote development that contributes to socially inclusive communities and locate development in locations that are accessible for all.
Finding room for growth Hastings Town Centre and White Rock area has a tight urban grain and there are limits to the amount of land available for new development and regeneration. The Council is therefore committed to making best use of brownfield land in the urban area and to the re-use of empty homes. In 2014/15, 97 empty homes were brought back into use within Hastings and a total of 55 neglected or derelict dwellings
Develop housing and employment opportunities that take account of current government guidance about mixed use developments. Consider the reuse and refurbishment of existing buildings. Ensure all new developments follow sustainable urban design principles.

38
have been improved through S215 planning enforcement powers.
Health inequalities and provision
The average life expectancy from birth in Hastings is 77.2 years for men and 81.6 years for women. Whilst this represents an increase from the 2007-09 figures, it compares negatively against the national average of 79.3 year for men and 83 years for women. The 2011 Census showed that 10% of residents within the AAP wards described their health as ‘bad and very bad’ health in comparison with 5.8% in East Sussex. St. Leonards has the highest percentage of people of all localities reporting that their health is bad or very bad. Premature mortality from suicide and injury of undetermined intent is acute in the AAP ward area, with a rate of 309 in Gensing, 303 in Central St. Leonards and 198 in Castle this compares to 147 in Hastings, and 100 (as expected) in East Sussex.
There are indirect links between health and the direct land use issues the AAP will tackle (e.g. access to open space, leisure and recreational opportunities, walking and cycling routes). The AAP will need to facilitate and encourage walking and cycling by creating accessible and connected neighbourhoods. Improving energy efficiency and measures to eradicate fuel poverty will also help to reduce health inequalities.
Educational achievement The town has received and invested heavily in recent regeneration activities, notably the University of Brighton Hastings Campus and the Sussex Coast College within the AAP area. However, in March 2016 the University of Brighton announced a significant review of their university presence in Hastings which now brings uncertainty to its long term future. Hastings Borough Council will work with partners to ensure a continued university presence in the town as part of the regeneration of the town and to continue the positive effect on education that these facilities have brought. The % of pupils achieving 5+ GCSEs within the AAP wards is around 39% in 2011/12, compared to 48.4% across Hastings as a
The University campus has provides an important impetus for regeneration within Hastings. In light of recent announcements by the University, a key element of the AAP will be the retention of education/university facilities.

39
whole. The percentage of working age people 16 and over (highest level of qualification) within the AAP area is approximately 22.4% in 2011 which is equivalent to the East Sussex average, and an improvement from 30.74% of people with no qualification in 2001.
Fear of crime and community safety
There were 86.2 recorded crimes per 1,000 population in 2015/16, which is an increase against the previous year (71.4). Hastings has the 3rd highest crime rate across East Sussex. A review of wards shows residences living in Old Hastings felt most safe (70%), whilst those living in Gensing and Central St. Leonards were most likely to feel unsafe (42% felt unsafe in Gensing, 43% felt unsafe in Central St. Leonards, 30% felt unsafe in Castle).
Good design achieved through AAP policies can help to design out crime and reduce the fear of crime. Mixed use development should be promoted, to encourage natural surveillance, improved pedestrian flows and vitality.
ENVIRONMENTAL ISSUES
Increase in traffic and its impact on the environment
Most of the air pollution in East Sussex is generated by road traffic, which is the largest source of greenhouse gases and carbon dioxide emissions (CO2) which affect health and climate change. Over half the population within Hastings travel less than 10km (59.1%) from home to work. Working from home has also increased from 8.7% from the 2001 census to 14.4% in 2011. New development has the potential to significantly increase traffic and congestion, the AAP has an opportunity to reconfigure traffic movement and promote accessibility by pedestrians.
The AAP will include policies to reduce the need to travel in particular by the private car by taking an integrated approach to land use and transport. Support the initiatives of Local Transport Plan
Protect, conserve and enhance biodiversity
There are a number of nationally and internationally important wildlife sites in the town - Hastings Cliffs Special Area of Conservation (SAC) (protected through EU legislation), 3 Sites of Special Scientific Interest (SSSI), 8 Local Nature Reserves (LNR), and 25 Local Wildlife sites. Summerfields Woods is a semi-natural woodland, Local Nature Reserve, Local Wildlife Site within
Include polices which protect and enhance biodiversity and protect and enhance existing sites and features for their ecological and/or geological importance.

40
the AAP area. Development pressure will continue to place increasing pressure on the natural environment. White Rock Gardens and Summerfields Woods are multi-functional public green spaces valued for heritage, biodiversity and recreational value.
Growth in waste and recycling
Hastings Borough Council is a waste collection authority and is responsible for collecting refuse and materials for recycling from local households. 29,390 tonnes of household waste was collected in 2012/13. This figure is lower than the amount of waste collected every year from 2008/09, showing a declining trend. In 2012/13, 18.9% of all waste collected was recycled, and 5.6% composted. This compares to 20% of waste being recycled across East Sussex and 18.6% composted.
Continue to encourage the use of recycled materials in new development. Ensure that the layout of and design of new developments supports waste recycling and reduction.
Protecting our cultural heritage
There are 18 conservation areas within Hastings, 7 of which are within in whole or in part within the AAP area. There are 67 Listed Buildings within the AAP area comprising 142 identified buildings/assets, two of these buildings are at risk within the AAP area (2 United Reformed Church, Cambridge Road; Pelham Arcade, 1-12 and 12A Pelham Place). The town has a rich heritage of historic buildings. Future development in the town must be undertaken in a way so as to protect and enhance these valuable assets and contribute to the sustainable regeneration of the town.
Protect and enhance conservation areas, Listed Buildings and buildings of local architectural importance and their settings, the town’s landscapes and archaeological features and contribute to the character, distinctiveness and sense of place of the town and landscapes.
Reducing water consumption
The South East is an area of “Water Stress” as defined by the Environment Agency. It is very important therefore that water consumption is reduced as much as possible, and that new development is designed to help achieve this.
Encourage new development to achieve greater water efficiency.
Minimising the risk of The 2014 Strategic Flood Risk Assessment (SFRA) reports that New development should seek improvements

41
flooding and raising water quality
flooding in Hastings cannot be attributed to a single source rather a combination of factors such as surge, tide locking, surface water runoff, high river flows and deficiencies/problems with the sewer network. The most significant flood risk problems exist towards the west of the town around the Bulverhythe area. In relation to the AAP area the Surface Water Management Plan identifies the Town Centre as a surface water flooding hotspot. Groundwater flooding is also a problem and can occur where a high water table in the gravel beds can be pushed higher by the tide. This type of flooding covers a significant area of the town, and in low lying parts of St. Leonards. Sewer flooding where the hydraulic capacity of the system becomes surcharged during a storm is a recognised problem in Hastings Town Centre. The nearest main river to the AAP area is Combe Haven between Powdermill Stream confluence and Coast located to the west in West St. Leonards, which is a heavily modified water body. The water quality for this water body has got worse since 2009 and now has a ‘poor’ overall classification, with poor ecological status and good chemical status. Only Hastings was classified as poor in the South East River Basin District in 2014, bathing water quality has improved to good (in 2015) through a multi-agency targeted approach.
to water quality through good urban design principles, use of sustainable urban drainage and by recognising the impacts of land use within the wider water catchment area.
Improving air quality There is a link between respiratory health and poor air quality. Statistics show that mortality rate from all chronic obstructive pulmonary disease (COPD) is significantly high in the three AAP wards, where 100 is the norm (East Sussex), Gensing is 171, Central St. Leonards is 168 and Castle is 144.
The AAP may provide an opportunity to reduce traffic congestion by considering the effectiveness of traffic flows and movement around the AAP area, including reconfiguration of junctions if this alleviates congestion. AAP policies can reduce the need

42
Rising level of road traffic, economic activity and new homes are all sources of air pollution. The National Air Quality Strategy provides standards for eight pollutants, the three main pollutants of concern in Sussex are particulate matter, ozone and nitrogen dioxide. Compliance with the standards means there is no measureable health effects attributable to air pollution. Air quality in the Borough is generally good, however the Council has declared an Air Quality Management Area on Bexhill Road for exceeding PM10 (particulate matter) for national levels.
to travel by car by facilitating easy movement by foot and cycle around the AAP area to protect the environment and human health from air pollution.
Addressing climate change
Greenhouse gas emissions, notably carbon dioxide (CO2) are the main causes of climate change. The Hastings annual emissions are 384.6 kilo tonnes for 2009, broken down into 35% industrial and commercial sources, 45% from domestic (housing) sources and 20% from road transport. In the town each person produces approximately 4.44 tonnes of CO2 emissions per annum, a large percentage of this is generated from energy use through the home for heating, hot water, lighting and appliances. The built environment provides a real opportunity to deliver substantial cuts in carbon emissions, and to reduce the environmental impact of new buildings through the use of sustainable design and construction techniques.
The AAP will need to consider the implications of climate change on the built and natural environment, ensuring new development is located and designed to minimise susceptibility to the impacts of climate change, including consideration of environmental impacts, resource efficiency, mitigation and adaptation. This will mean utilising good urban design principles, layout, built form and promoting the use of low and zero carbon technology to reduce carbon emissions. Reduce flood risk from new development through the use of sustainable drainage systems.
4 Hastings and St. Leonards Town-wide Climate Change Strategy and Action Plan 2012

43
ECONOMIC ISSUES
Reducing unemployment Hastings has a high unemployment rate which is linked to a relatively low economic base. Unemployment is a significant issue within the AAP area (Gensing 12.5%, Central St. Leonards 15.7% and Castle 13.6%). This compares to Hastings were 9.4% of the economically active are unemployed and 7.6% in England and Wales (Census 2011). As at April 2016, Hastings still had the highest number of Universal Credit & Job Seeker Allowance claimants (1,385) and claimant rate (2.4%) in the county. The Borough has the second highest claimant rate of all districts in the South East, and third highest in the SE Local Enterprise Partnership (SE LEP), after Thanet and Tendring in Essex. As at March 2016, Gensing has a claimant rate of 3.9%, Central St. Leonards 4.3 and Castle 4.1%. Central St. Leonards has one of the highest claimant rates in the South East. Hastings residence-based pay in 2015 was £446 for a full-time earner, this compares to workplace based earnings which averaged £478 per week, i.e. people working in Hastings, earn more that working residents, (Earning.. in brief, East Sussex in Figures, January 2016). The average (mean) household income in 2015 in Hastings was £30,100, this compares to East Sussex where the average mean income is £35,991.
The AAP will need to protect and support the provision of local quality employment opportunities. Enable improvements in infrastructure to meet the needs of the economy. Promote economic development that creates quality job opportunities.
Economic output The economic output of Hastings as a whole is currently constrained by a relatively weak economic base. Data shows that the labour market within Hastings is dominated by the public sector. In 2014, 25.7% of working age people were employed in the public sector, compared to 19.5% at County level, and 18.7%
Alongside allocated employment sites within the Hastings Development Management Plan, the AAP can help facilitate the development of quality employment opportunities by the allocation of opportunity sites to support retail

44
nationally. There is a need to diversity the economic base so that it is less reliant on public sector and provides more diverse opportunities for employment. Hastings retail sector is performing well, with good comparison goods market share and sales. However, evidence (Bilfinger GVA Study) has identified a relatively weak convenience goods offer in the Town Centre and a need to strengthen in-centre foodstore provision over the Plan period.
and leisure growth.
Movement and transport There is low car ownership within the AAP area, with approximately 53% of residents not owning a car, compared to 33% in Hastings and 21.9% across East Sussex. The AAP area is defined by its typography with steep gradients from the seafront to White Rock Gardens rising to 54 metres above sea level in the north. This can act as a barrier in terms of access for all and there is a need to priorities improved and increased pedestrian and cycle movement, both within and to the Town Centre and to the seafront across the A259. In 2011, there were a recorded 11,840 out commuters compared to 8,011 in commuters – with 24,810 people who live and work in Hastings.
The AAP needs to make sure that all new development is accessible and located near transport links, providing for easy access via public transport, cycling and walking, and to support the proposals in the Local Transport Plan 3.

45
Appendix B – The Sustainability Appraisal Framework
Objective Headline indicator
Decision making criteria – does the plan/option…
Indicator
SOCIAL
1. More opportunities are provided for everyone to live in a decent, sustainably constructed and affordable home suitable to their needs
Property affordability – ratio of average house price to average local earnings
Increase access to good quality and affordable housing for all? Improve the quality of the housing stock and reduce the number of non-decent homes? Reduce homelessness and ensure the provision of housing for the homeless? Promote the adoption of sustainable design and construction practices in housing (energy/water/ land/materials efficiency/incorporation of biodiversity etc)? Encourage mixed use and a range of housing tenure?
Affordable housing completions
Housing completions
Property affordability – ratio of house price to average local earnings
Condition of housing stock (non-decent dwellings)
Number of empty homes bought back into use
Number of households accepted as homeless
Housing density
Housing tenure
Property values
Household size
2. The health and well-being of the population is improved and inequalities in health are reduced
Life expectancy (from birth)
Reduce death rates? Promote healthy living and reduce health inequalities? Improve access to high quality health facilities?
Death rates from circulatory disease, cancer, suicide
Life expectancy
% of households with limiting long-term illness
General level of health - % of the population describe their health as

46
Encourage healthy, active lifestyles and provide opportunities for sport and recreation (formal and informal) Promote good design that minimises adverse impacts on health and well-being from crime and road traffic accidents
“not good”
Number of cyclist traffic accidents
% of adults who regularly participate in sport or active recreation
3. Levels of poverty and social exclusion are reduced and the deprivation gap is closed between the more deprived areas in Hastings and the rest of the town
Narrow the gap – Proportion of the population who live in areas that rank within the most deprived 10% and 20% nationally
Reduce poverty and social exclusion in those areas and communities most affected?
Proportion of population that live in areas that rank within the most deprived 10-20% in the country.
Child poverty – Proportion of children under 16 who live in low-income households
% of households in fuel poverty
4. Opportunities are available for everyone to acquire new skills, and the education and skills of the population improve
Qualifications of working age people
Improve the qualifications and skills of adults? Address the skills gap and enable skills progression? Improve the qualifications and skills of young people? Contribute to meeting identified skills shortages Improve access to high quality educational/training opportunities and facilities?
% of working age population with NVQ Level 3 or above
% of working age population with NVQ Level 4 or above (or equivalent)
5. All sectors of the community have improved accessibility to services, facilities, jobs, and social, cultural and
Resident’s satisfaction
Improve accessibility and affordability to essential local services? (employment, public transport, education, open space, health services and shops) Promote compact, mixed-use development with
Residents satisfaction - % of residents who are satisfied with their local area as a place to live
% of households within 300m of an accessible open space

47
recreational opportunities, including access to the countryside and the historic environment
good accessibility to local facilities and services? Make access easier for those without access to a car?
% of adults with internet connection
% of voluntary and community sector activity
6. Safe and secure environments are created and there is a reduction in crime and the fear of crime
Recorded crime per 1000 population
Reduce actual levels of crime? Reduce the fear of crime?
Recorded crime per 1000 population
% of people who feel safe in their local area in the day and at night time
7. Vibrant and locally distinctive communities are created and sustained
% of people satisfied with their local area as a place to live
Encourage the involvement of communities in the planning and management of their neighbourhoods? Improve residential amenity and sense of place?
% of people satisfied with their local area as a place to live
% of people who feel their area is a place where people from other backgrounds can live harmoniously
ENVIRONMENT
8. Land and buildings are used more efficiently and the best use is made of previously developed land
Development on previously developed land
Reduce the amount of derelict and underused land? Encourage the re-use of existing buildings and the re-use of materials in construction
% of residential development completed on brownfield land
% of employment development completed on brownfield land
Number of empty homes bought back into use
9. Biodiversity is protected, conserved and enhanced
Change in areas and populations of biodiversity importance
Maintain, protect and enhance the town’s sites designated for their nature conservation interests? Protect, conserve and enhance the town’s priority species and habitats, and ensure achievement of local biodiversity targets? Encourage the development of new biodiversity
Condition of SSSI’s
% of open spaces managed to green flag award standard
Change in areas and populations of biodiversity importance
Change in wild bird populations

48
assets within/alongside developments?
10. The risk of flooding (fluvial and tidal) and coastal erosion is managed and reduced, now and in the future
% of planning applications permitted where the Environment Agency have objected on flood risk or water quality grounds
Minimise the risk of flooding from rivers, watercourses and the coast, to people and flooding? Make use of Sustainable Drainage Systems (SUDs)? Ensure that development does not increase flood risk to others? Prevent inappropriate development in the flood plain?
% of planning applications permitted where the Environment Agency have objected on flood risk or water quality grounds
% of planning applications where the Environment Agency has objected on the grounds of inadequate/lack of FRA
Number of developments/properties installing SUDs
11. Parks and gardens, countryside, and the historic environment/ townscape and landscape are protected, enhanced and made more accessible
The number of buildings at risk
Protect, enhance and restore the town’s natural environmental assets (e.g. greenspace network) Support local character and distinctiveness through good design? Protect, enhance and restore the town’s cultural and heritage assets? Encourage access to historic and cultural heritage? Will it enhance and increase access to the natural environment, parks and open spaces and the coast?
Number and % of listed buildings (Grades I and II)
% of open spaces managed to green flag award standard
The number of buildings at risk (English Heritage risk register)
% of households within 300m of an accessible open space
12. Air pollution from transport and land use planning is reduced, and air quality continues to improve
Number of days when air pollution is moderate or high
Improve and maintain air quality? Promote more sustainable transport patterns including walking, cycling and public transport?
Road traffic growth
% car ownership
Designated air management areas
Number of days when air pollution is moderate or high

49
Reduce the need to travel through the location and design of new development and the provision of public transport infrastructure? Avoid locating development where air quality could negatively impact upon people’s health?
13. The causes of climate change are addressed through reducing emissions of greenhouse gases through zero/low carbon development (mitigation) and ensure the town is prepared for its impacts (adaptation)
Emissions of CO2
by sector Reduce emissions of greenhouse gases by reducing energy consumption? Contribute to a reduction of CO2 to contribute to national targets? Promote efficient land use patterns that minimise the need to travel? Promote sustainable drainage systems in new development? Reduce vulnerability of the built environment to the effects of climate change?
Emissions of CO2 by sector
14. The risk of pollution to all water resources is reduced, water quality is improved and water consumption is reduced
Per capita consumption of water
Reduce water consumption? Increase the use of water conservation and grey water recycling technologies? Ensure water demand does not outstrip available supply?
Number of qualifying developments/ properties installing SUDs
Per capita consumption of water
15. The use of sustainable energy and renewable energy technologies is maximised in new
Household energy use per capita
Promote the incorporation of energy efficiency measures in existing buildings and in new development? Reduce the incidences of fuel poverty through
Household energy use per capita (gas and electricity)
Renewable energy capacity installed
Number of households in fuel poverty
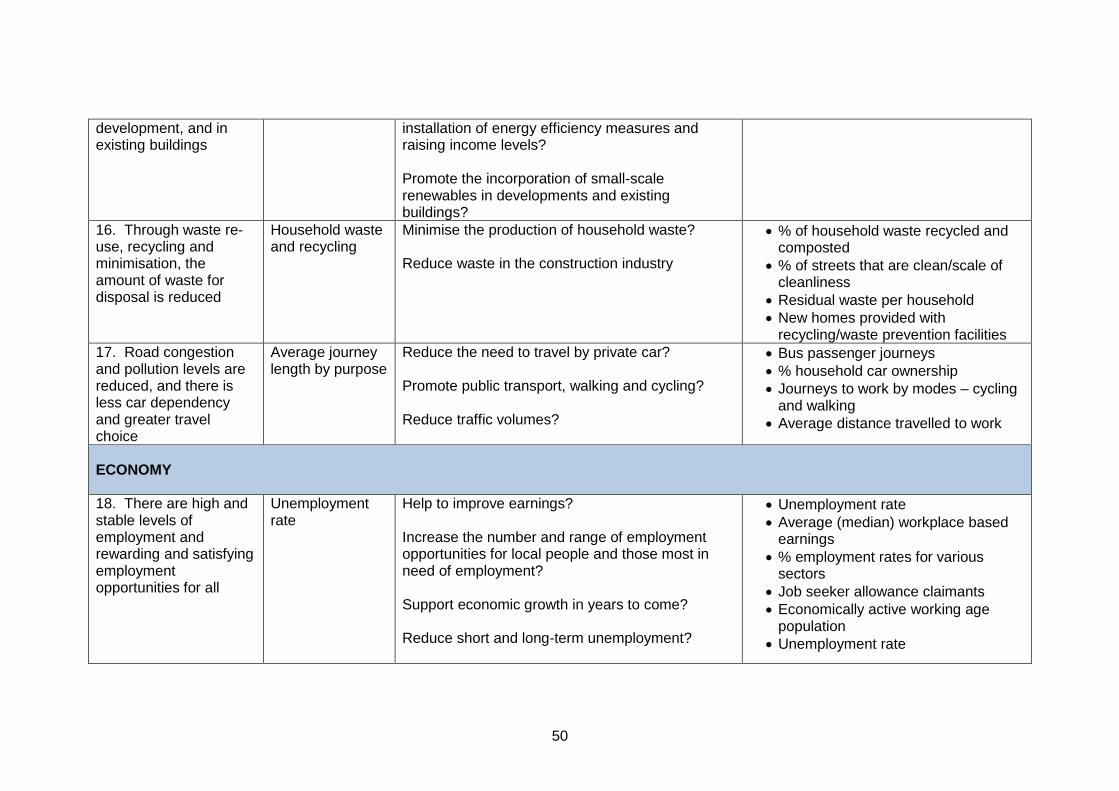
50
development, and in existing buildings
installation of energy efficiency measures and raising income levels? Promote the incorporation of small-scale renewables in developments and existing buildings?
16. Through waste re-use, recycling and minimisation, the amount of waste for disposal is reduced
Household waste and recycling
Minimise the production of household waste? Reduce waste in the construction industry
% of household waste recycled and composted
% of streets that are clean/scale of cleanliness
Residual waste per household
New homes provided with recycling/waste prevention facilities
17. Road congestion and pollution levels are reduced, and there is less car dependency and greater travel choice
Average journey length by purpose
Reduce the need to travel by private car? Promote public transport, walking and cycling? Reduce traffic volumes?
Bus passenger journeys
% household car ownership
Journeys to work by modes – cycling and walking
Average distance travelled to work
ECONOMY
18. There are high and stable levels of employment and rewarding and satisfying employment opportunities for all
Unemployment rate
Help to improve earnings? Increase the number and range of employment opportunities for local people and those most in need of employment? Support economic growth in years to come? Reduce short and long-term unemployment?
Unemployment rate
Average (median) workplace based earnings
% employment rates for various sectors
Job seeker allowance claimants
Economically active working age population
Unemployment rate

51
Provide good quality employment opportunities accessible to all sections of the population?
19. Economic revival in the more deprived areas of the town is stimulated and successfully achieved
Change in VAT registered businesses
Improve economic performance in advantaged and disadvantaged areas? Support the regeneration of deprived areas?
Employment floorspace development by type
Vacant commercial floorspace
% change in VAT registered businesses
20. The sustained economic growth of Hastings Town Centre is achieved and linked closely to social regeneration
Change in VAT registered businesses
Encourage investment, including inward investment? Promote and support town centres and local centres, local employment opportunities and mixed use development?
% change in VAT registered businesses
21. Indigenous and inward investment is encouraged and accommodated
Change in VAT registered premises
Make land and property available for business development?
Employment floorspace development by type
Vacant commercial floorspace
% change in VAT registered businesses