
Half year ended 30 September 2021 11 NOVEMBER 2021
32
11 NOVEMBER 2021 Half year results presentation Half year ended 30 September 2021
Transcript of Half year ended 30 September 2021 11 NOVEMBER 2021

11 NOVEMBER 2021
Half year results presentation
Hal f ye ar e nde d 3 0 Se pt e mbe r 2021

DisclaimerThe information and opinions provided in this presentation are provided as of the date of this presentation. Certain statements in this presentation constituteforward looking statements (including beliefs or opinions). Any statement in this presentation that is not a statement of historical fact including, withoutlimitation, those regarding Auto Trader Group plc’s future expectations, operations, financial performance, financial condition and business is a forward lookingstatement. Such forward looking statements are subject to risks and uncertainties that may cause actual results to differ materially from those expressed orimplied by such forward looking statements. These risks and uncertainties include, among other factors, changing economic, financial, business or other marketconditions. These and other factors could adversely affect the outcome and financial effects of the plans and events described in this presentation. As a resultyou are cautioned not to place reliance on such forward looking statements. Nothing in this presentation should be construed as a profit forecast.
2

Strategic overview
We have achieved our highest ever six-monthly revenue and profits
Consumer engagement and retailer numbers are at record levels, our competitive position has strengthened and product uptake by customers has been strong
In April 2021, we launched our Retailer Stores product as part of our successful annual pricing event, these have seen strong traffic volumes throughout H1
We implemented a new higher-level advertising package and a product that allows our retailers to reach car buyers outside their local area (Market Extension). Both have seen good levels of adoption, contributing to a record level of spending by our retailer customers
Our strategic focus on supporting an increasingly online car buying journey continues to gather pace:
3
o Vehicles can be advertised nationally for local delivery (Market Extension and Motor Trade Delivery)
o Car owners can get a guaranteed trade-in price (through Guaranteed Part-exchange and Instant Offer)
o Online reservations are being trialled with a small number of customerso Our online finance solution, offering finance collaboratively with car retailers
(Retailer Finance), is scheduled for trial later this financial year
Financial results
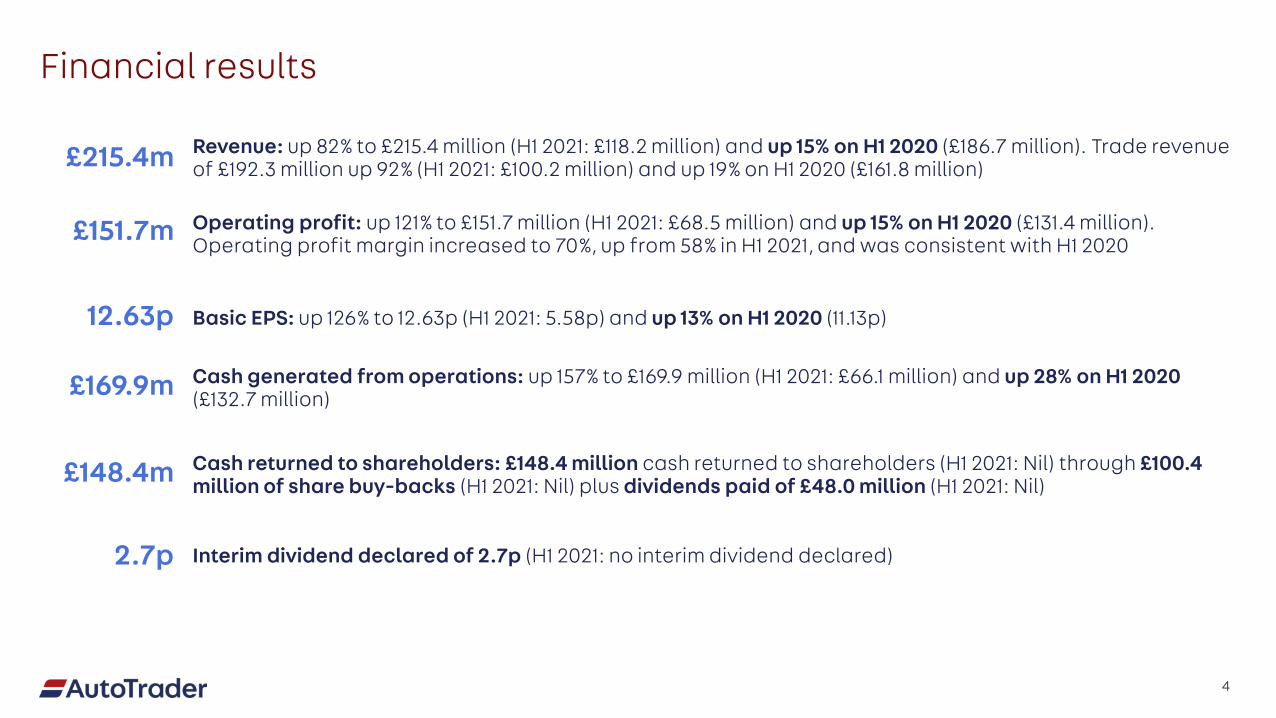
Revenue: up 82% to £215.4 million (H1 2021: £118.2 million) and up 15% on H1 2020 (£186.7 million). Trade revenue of £192.3 million up 92% (H1 2021: £100.2 million) and up 19% on H1 2020 (£161.8 million)
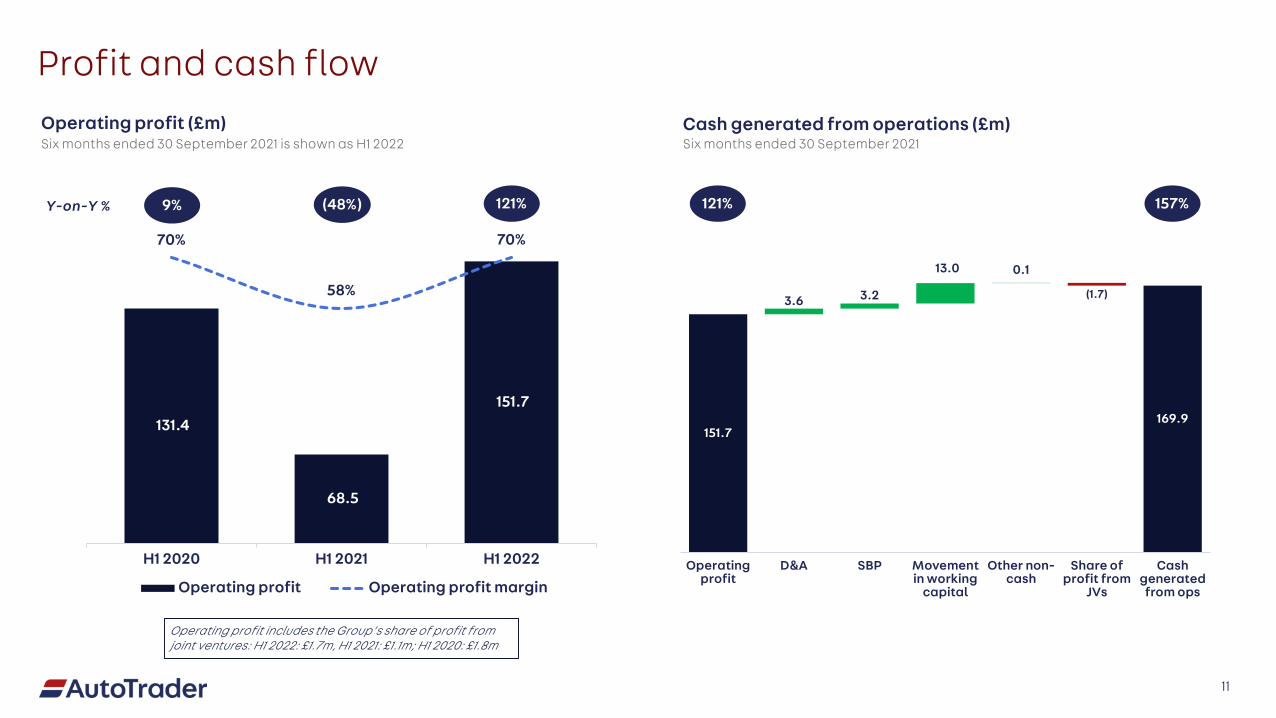
Operating profit: up 121% to £151.7 million (H1 2021: £68.5 million) and up 15% on H1 2020 (£131.4 million).Operating profit margin increased to 70%, up from 58% in H1 2021, and was consistent with H1 2020
Interim dividend declared of 2.7p (H1 2021: no interim dividend declared)
Cash generated from operations: up 157% to £169.9 million (H1 2021: £66.1 million) and up 28% on H1 2020 (£132.7 million)
Basic EPS: up 126% to 12.63p (H1 2021: 5.58p) and up 13% on H1 2020 (11.13p)
£215.4m
£151.7m
2.7p
12.63p
£169.9m
Cash returned to shareholders: £148.4 million cash returned to shareholders (H1 2021: Nil) through £100.4 million of share buy-backs (H1 2021: Nil) plus dividends paid of £48.0 million (H1 2021: Nil)£148.4m
4

Operational results
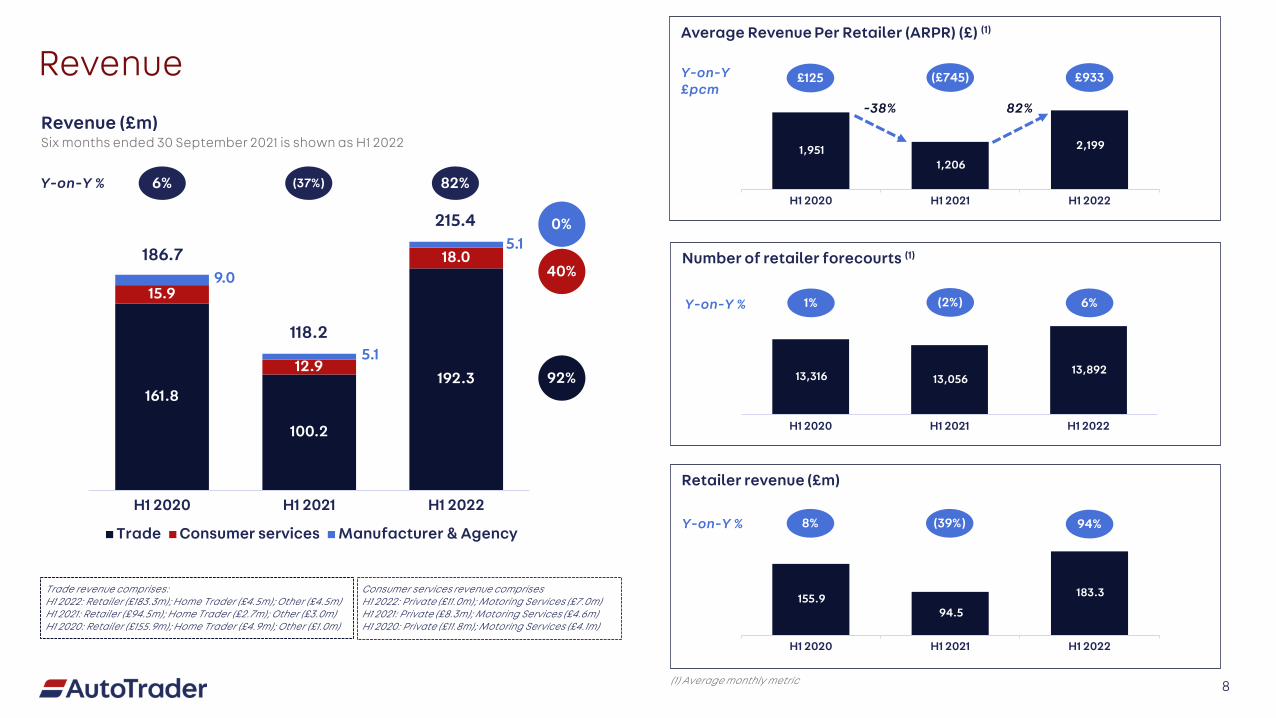
ARPR: up £993 to £2,199 on average per month (H1 2021: £1,206) and up 13% on H1 2020; Excluding COVID-19 discounts in the prior year, underlying ARPR increased by £353 per month, with good growth from all three ARPR levers
Retailer forecourts: the average number of forecourts in the period was up by 6% to 13,892 (H1 2021: 13,056)
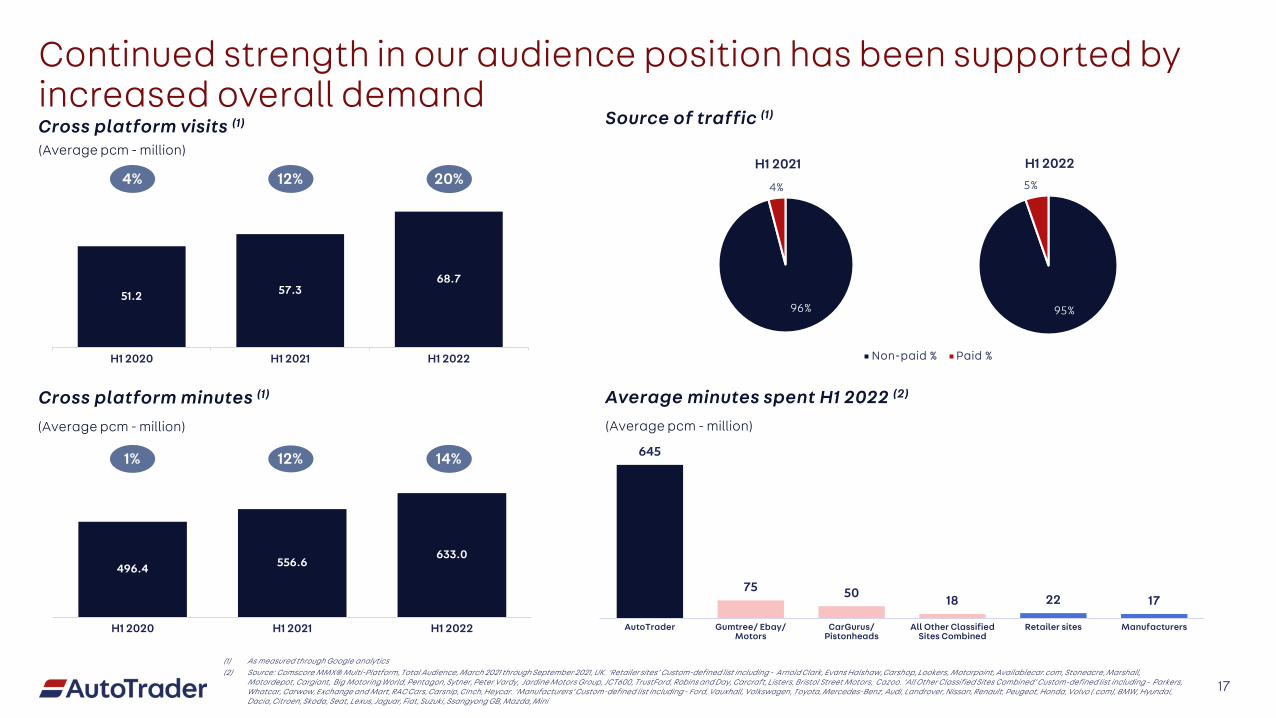
Cross platform visits: up 20% to 68.7 million per month on average (H1 2021: 57.3 million)
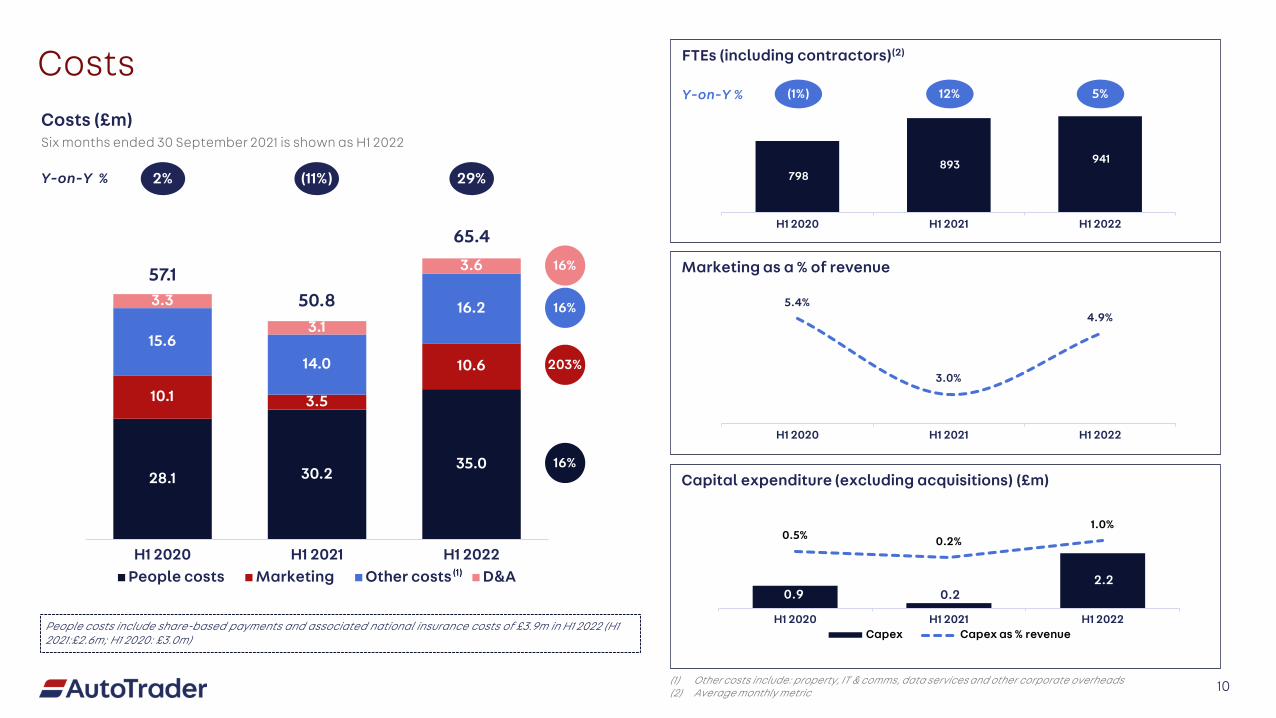
Number of employees (FTEs): increased to 941 on average during the period (H1 2021: 893) partly due to the acquisition of AutoConvert in July 2020
436,000
13,892
69m
941
£2,199
Cross platform minutes: up 14% to 633 million per month on average (H1 2021: 557 million). Our share of cross platform minutes remains strong at over 75% (H1 2021: over 75%) and we grew to be almost 9x larger than our nearest competitor (H1 2021: 7x larger)
633m
5
Physical car stock on site: down 9% to 436,000 cars (H1 2021: 478,000) on average. Our listings product for new cars declined to 39,000 on average (H1 2021: 46,000). The remaining decline was due to stock offers in the prior year
Cultural KPIs
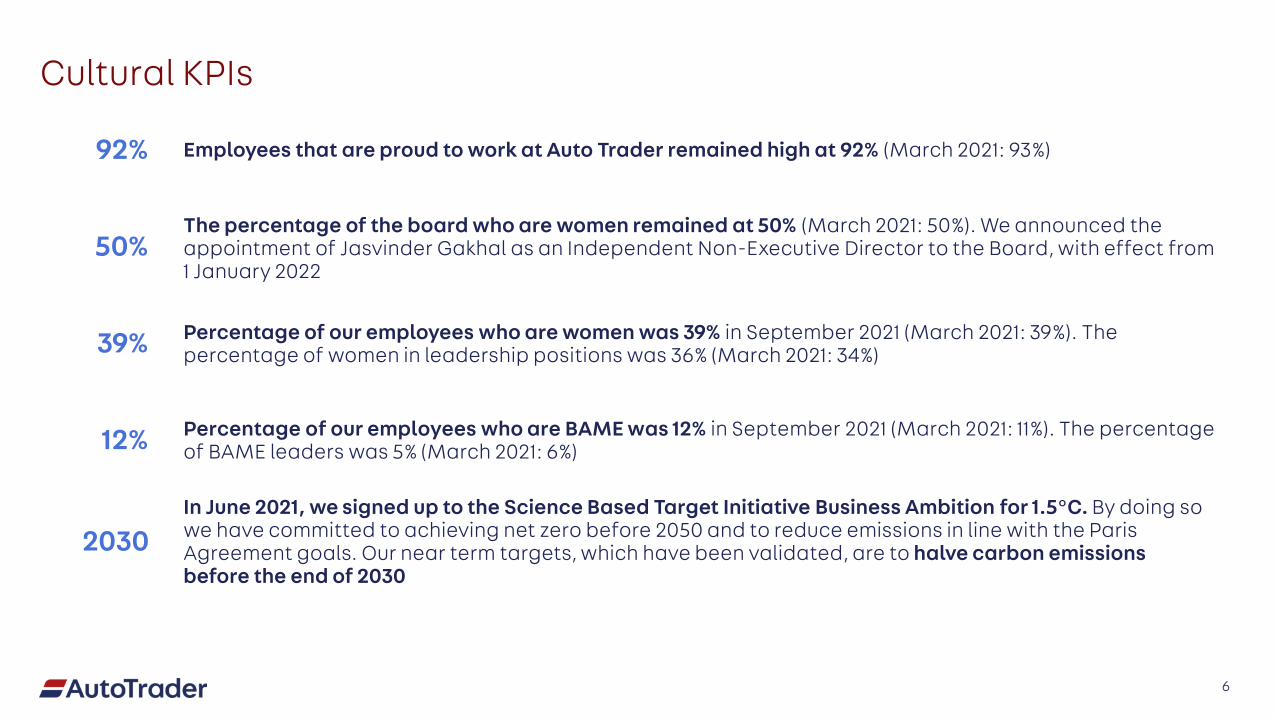
The percentage of the board who are women remained at 50% (March 2021: 50%). We announced the appointment of Jasvinder Gakhal as an Independent Non-Executive Director to the Board, with effect from 1 January 2022
Employees that are proud to work at Auto Trader remained high at 92% (March 2021: 93%)
Percentage of our employees who are women was 39% in September 2021 (March 2021: 39%). The percentage of women in leadership positions was 36% (March 2021: 34%)
Percentage of our employees who are BAME was 12% in September 2021 (March 2021: 11%). The percentage of BAME leaders was 5% (March 2021: 6%)
In June 2021, we signed up to the Science Based Target Initiative Business Ambition for 1.5°C. By doing so we have committed to achieving net zero before 2050 and to reduce emissions in line with the Paris Agreement goals. Our near term targets, which have been validated, are to halve carbon emissions before the end of 2030
92%
50%
39%
12%
6
2030

Financials
155.9 94.5
183.3
H1 2020 H1 2021 H1 2022
1,951 1,206
2,199
H1 2020 H1 2021 H1 2022
13,316 13,056 13,892
H1 2020 H1 2021 H1 2022
161.8
100.2
192.3
15.9
12.9
18.09.0
5.1
5.1
H1 2020 H1 2021 H1 2022
Trade Consumer services Manufacturer & Agency
RevenueRevenue (£m)Six months ended 30 September 2021 is shown as H1 2022
Trade revenue comprises:H1 2022: Retailer (£183.3m); Home Trader (£4.5m); Other (£4.5m)H1 2021: Retailer (£94.5m); Home Trader (£2.7m); Other (£3.0m)H1 2020: Retailer (£155.9m); Home Trader (£4.9m); Other (£1.0m)
(37%) 82%6%
0%
40%
92%
(1) Average monthly metric
8% (39%) 94%
Number of retailer forecourts (1)
Y-on-Y % 1% (2%) 6%
Retailer revenue (£m)
Y-on-Y %
215.4
118.2
186.7
Consumer services revenue comprisesH1 2022: Private (£11.0m); Motoring Services (£7.0m) H1 2021: Private (£8.3m); Motoring Services (£4.6m) H1 2020: Private (£11.8m); Motoring Services (£4.1m)
£125 (£745) £933
Average Revenue Per Retailer (ARPR) (£) (1)
Y-on-Y £pcm
-38% 82%
Y-on-Y %
8

50 49 74
(5)
(156)
16080 57
119
(695)
640
H1 2020 H1 2021 H1 2022
Price Stock Product COVID related discounts
200
250
300
350
400
450
500
12,000
12,500
13,000
13,500
14,000
14,500
15,000
Ap
rM
ay Jun
Jul
Aug Se
pO
ctN
ovD
ec Jan
Feb
Mar
Ap
rM
ay Jun
Jul
Aug Se
pO
ctN
ovD
ec Jan
Feb
Mar
Ap
rM
ay Jun
Jul
Aug Se
p
2020 2021 2022
Live
phy
sica
l car
sto
ck ('
000)
Ave
rage
reta
ilers
Average retailers Live physical used car stock (12 month average)
Live physical car stock (12 month average)
ARPR, stock and retailers
£125(£) (£745) £993
ARPR leversGrowth in Average Revenue Per Retailer per month (£)
Physical car stock and retailer forecourts
7%(%) (38%) 82%
Y-on-Y average retailersY-on-Y average live physical car stock
4% 1% (9%)
6%(0%)1%
9
798 893 941
H1 2020 H1 2021 H1 2022
28.1 30.235.0
10.1 3.5
10.615.6
14.0
16.23.3
3.1
3.6
H1 2020 H1 2021 H1 2022People costs Marketing Other costs D&A
Costs(1%) 5%
Costs (£m)
FTEs (including contractors)(2)
(1) Other costs include: property, IT & comms, data services and other corporate overheads(2) Average monthly metric
Y-on-Y %
Marketing as a % of revenue
Capital expenditure (excluding acquisitions) (£m)
12%
(11%) 29%2%
16%
203%
16%
16%57.150.8
65.4
Y-on-Y %
Six months ended 30 September 2021 is shown as H1 2022
People costs include share-based payments and associated national insurance costs of £3.9m in H1 2022 (H1 2021:£2.6m; H1 2020: £3.0m)
10
5.4%
3.0%
4.9%
H1 2020 H1 2021 H1 2022
0.9 0.2 2.2
0.5% 0.2%1.0%
-3.0%
-2.0%
-1.0%
0.0%
1.0%
2.0%
H1 2020 H1 2021 H1 2022Capex Capex as % revenue
151.7169.9
3.6 3.2
13.0 0.1
(1.7)
Operatingprofit
D&A SBP Movementin working
capital
Other non-cash
Share ofprofit from
JVs
Cashgenerated
from ops
131.4
68.5
151.7
70%
58%
70%
H1 2020 H1 2021 H1 2022
Operating profit Operating profit margin
Profit and cash flowOperating profit (£m) Cash generated from operations (£m)
9% (48%) 121%
Six months ended 30 September 2021 is shown as H1 2022 Six months ended 30 September 2021
Operating profit includes the Group’s share of profit from joint ventures: H1 2022: £1.7m, H1 2021: £1.1m; H1 2020: £1.8m
Y-on-Y % 121% 157%
11
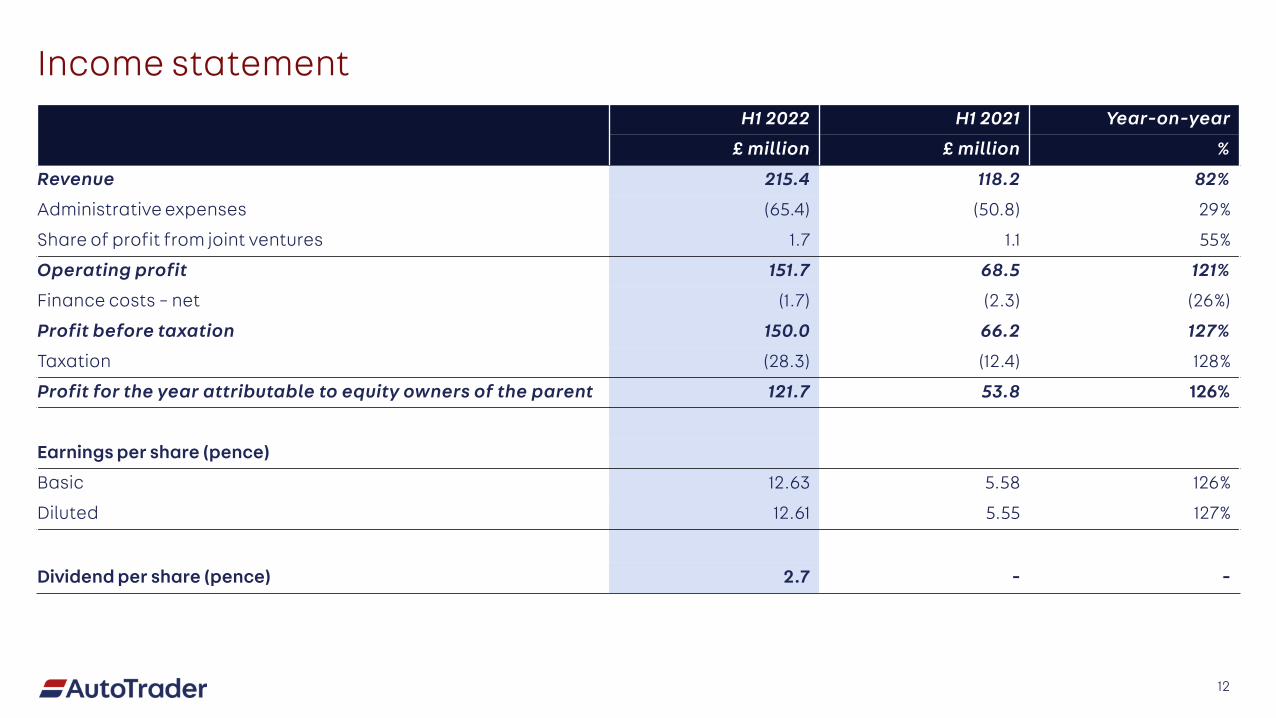
Income statementH1 2022 H1 2021 Year-on-year
£ million £ million %
Revenue 215.4 118.2 82%
Administrative expenses (65.4) (50.8) 29%
Share of profit from joint ventures 1.7 1.1 55%
Operating profit 151.7 68.5 121%
Finance costs – net (1.7) (2.3) (26%)
Profit before taxation 150.0 66.2 127%
Taxation (28.3) (12.4) 128%
Profit for the year attributable to equity owners of the parent 121.7 53.8 126%
Earnings per share (pence)
Basic 12.63 5.58 126%
Diluted 12.61 5.55 127%
Dividend per share (pence) 2.7 - -
12

15.79.2
March 2021 Cashgenerated
from ops
Capex Leasepayments
Contributionsto Pension
Scheme (DB)
Net interest Tax paid Dividendreceived from
JV
Proceeds fromexercise of
share-basedincentives
Dividends Share buy-backs (inc
costs)
September2021
Net cash and capital allocation policy
Reconciliation of net cash position (1) (£m)
The Group’s capital allocation policy remains broadly unchanged: continuing to invest in the business enabling it to grow whilst returning around one third of net income to shareholders in the form of dividends. Surplus cash following these activities will be used to continue our share buyback programme
During the period, 15.8m shares were repurchased at an average price of 636.1p for consideration of £100.4m plus costs of £0.5m
With effect from 24 September 2021, the Company reduced the total commitments of its Syndicated Revolving Credit Facility (‘RCF’) by £150m from £400m to £250m. The facility will terminate in two tranches: £52.2m will mature in June 2023 with the remaining £197.8m maturing in June 2025
An interim dividend of 2.7p has been declared
Gross bank debt reduced by £30m through the period £0m(£30m)Gross bank debt
(1) Net cash/bank (debt) represents gross bank debt before amortised debt costs less cash and does not include amounts relating to leases
Capital allocation policy
13
169.9 (2.2) (0.1)(1.6) (1.0) (27.8)
(48.0)4.9 0.3
(100.9)

UK Car Market
(120%)
(70%)
(20%)
30%
80%
130%
180%
230%
280%
330%
-
0.5
1.0
1.5
2.0
2.5
3.0
Apr
May Ju
nJu
lA
ug Sep
Oct
Nov
Dec Ja
nFe
bM
arA
prM
ay Jun
Jul
Aug Se
pO
ctN
ovD
ec Jan
Feb
Mar
Apr
May Ju
nJu
lA
ug Sep2020 2021 2022
YoY
grow
th
Num
ber o
f new
car
regi
stra
tion
s (m
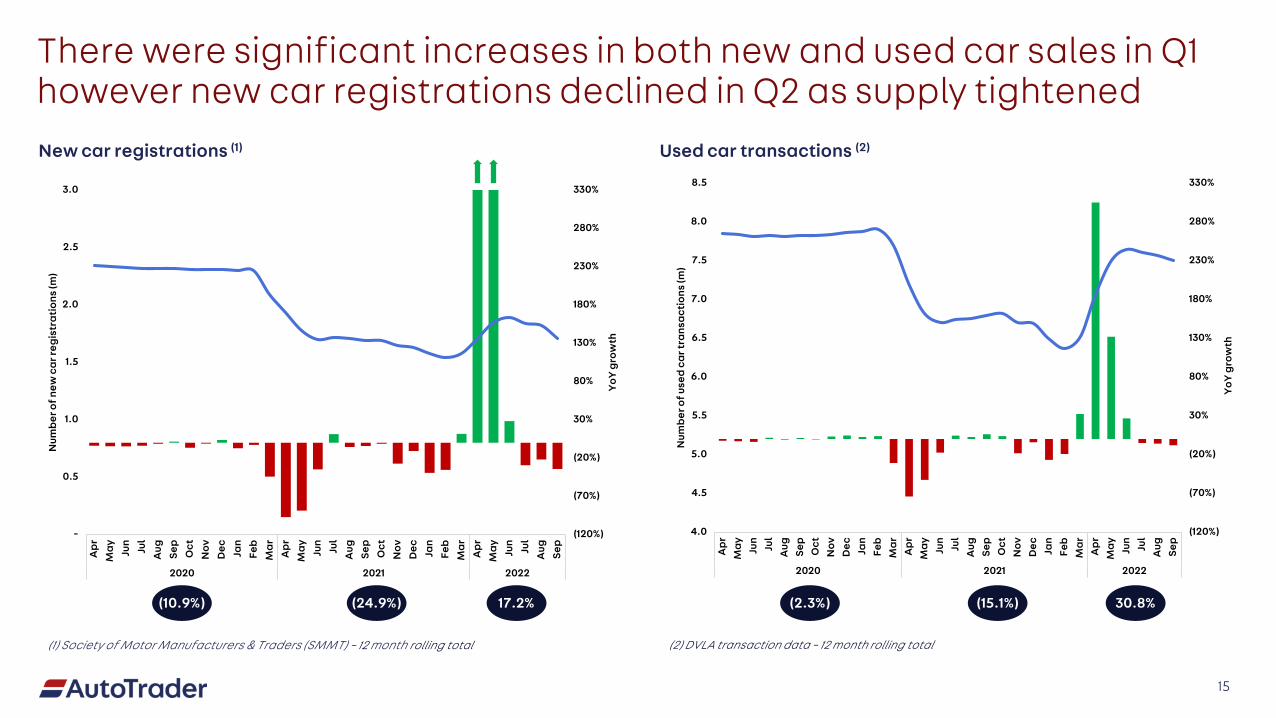
)There were significant increases in both new and used car sales in Q1 however new car registrations declined in Q2 as supply tightened
(1) Society of Motor Manufacturers & Traders (SMMT) – 12 month rolling total (2) DVLA transaction data – 12 month rolling total
15
(10.9%) (24.9%)
New car registrations (1) Used car transactions (2)
(2.3%) (15.1%)17.2% 30.8%
(120%)
(70%)
(20%)
30%
80%
130%
180%
230%
280%
330%
4.0
4.5
5.0
5.5
6.0
6.5
7.0
7.5
8.0
8.5
Apr
May Ju
nJu
lA
ug Sep
Oct
Nov
Dec Ja
nFe
bM
arA
prM
ay Jun
Jul
Aug Se
pO
ctN
ovD
ec Jan
Feb
Mar
Apr
May Ju
nJu
lA
ug Sep
2020 2021 2022
YoY
grow
th
Num
ber o
f use
d ca
r tra
nsac
tion
s (m
)

(10.0%)
(5.0%)
0.0%
5.0%
10.0%
15.0%
20.0%
25.0%
30.0%
£9,000
£10,000
£11,000
£12,000
£13,000
£14,000
£15,000
£16,000
Ap
r
Ma
y
Jun
Jul
Aug
Sep
Oct
No
v
De
c
Jan
Feb
Ma
r
Ap
r
Ma
y
Jun
Jul
Aug
Sep
Oct
No
v
De
c
Jan
Feb
Ma
r
Ap
r
Ma
y
Jun
Jul
Aug
Sep
Oct
No
v
De
c
Jan
Feb
Ma
r
Ap
r
Ma
y
Jun
Jul
Aug
Sep
2019 2020 2021 2022
Year-on-year price growth Year-on-year impact caused by mix Average advertised price
Exceptional levels of demand and restricted supply has led to record levels of price growth for used cars
(0.5%)4.4%Like-for-like price increase 6.3%
16
10.8%
95%
5%
H1 2022
Non-paid % Paid %
496.4 556.6633.0
H1 2020 H1 2021 H1 2022
51.2 57.368.7
H1 2020 H1 2021 H1 20220.0
10.0
20.0
30.0
40.0
50.0
60.0
70.0
80.0
(1) As measured through Google analytics(2) Source: Comscore MMX® Multi-Platform, Total Audience, March 2021 through September 2021, UK. ‘Retailer sites’ Custom-defined list including - Arnold Clark, Evans Halshaw, Carshop, Lookers, Motorpoint, Availablecar.com, Stoneacre, Marshall,
Motordepot, Cargiant, Big Motoring World, Pentagon, Sytner, Peter Vardy, Jardine Motors Group, JCT600, TrustFord, Robins and Day, Carcraft, Listers, Bristol Street Motors, Cazoo. ‘All Other Classified Sites Combined’ Custom-defined list including - Parkers, Whatcar, Carwow, Exchange and Mart, RAC Cars, Carsnip, Cinch, Heycar. ‘Manufacturers’ Custom-defined list including - Ford, Vauxhall, Volkswagen, Toyota, Mercedes-Benz, Audi, Landrover, Nissan, Renault, Peugeot, Honda, Volvo (.com), BMW, Hyundai, Dacia, Citroen, Skoda, Seat, Lexus, Jaguar, Fiat, Suzuki, Ssangyong GB, Mazda, Mini
Cross platform visits (1)
(Average pcm - million)
20%12%4%
Average minutes spent H1 2022 (2)
14%12%1%
Cross platform minutes (1)
(Average pcm - million) (Average pcm - million)
17
Source of traffic (1)
Continued strength in our audience position has been supported by increased overall demand
96%
4%
H1 2021
645
75 50 18 22 17
AutoTrader Gumtree/ Ebay/Motors
CarGurus/Pistonheads
All Other ClassifiedSites Combined
Retailer sites Manufacturers

ProductUpdate

We executed our annual pricing event in April 2021, introducing Retailer Stores, creating a digital forecourt experience on Auto Trader
Retailer Stores offer retailers their own dedicated, customisablelocation on Auto Trader and we have seen over 28m visits to these pages in H1 2022
Provides a digital forecourt for retailers to showcase their business, brand and stock
Over time, we envisage these pages will become an area that customers can use as part of their own ecommerce journey
19

We have evolved our advertising package structure and launched a new product, Market Extension
The package structure change gives a consistent cross-platform search experience powered by a relevancy algorithm
UltraGet ultra visibility with double the search advantage for the most visibility and response available
SuperGet ahead in search with our new search advantage mechanism
EnhancedEnhance your performance with vehicles displayed in promoted positions within search
StandardGet your adverts into the top tier of search meaning you appear above starter on all devices
StarterA good place to start, your vehicles appear on the UK’s largest automotive platform
20
Market Extension allows retailers to sell outside their local area and appear in regional searches
Both products give retailers the choice to capture a greater share of consumer engagement on Auto Trader
We have increased the penetration of our higher yielding packages with 25% of retailer stock on a package above Standard in September 2021 (September 2020: 22%) and over 4% of retailer stock on Market Extension in September 2021

We have connected our Instant Offer product with Guaranteed Part-exchange (‘GPX’), creating an additional source of stock for retailers via Dealer Auction
Customers who subscribe to GPX, have access to our B2B auction platform, Dealer Auction, where the vehicles acquired through Instant Offer are auctioned
These products enable consumers to get an accurate and guaranteed price for their existing vehicle whilst shopping on Auto Trader, eliminating either the need to haggle over a part-exchange or look for other disposal routes for their current vehicle
Over the past six months, we have provided c.520,000 guaranteed valuations and purchased c.5,000 cars on Instant Offer. At the reporting date we had c.500 customers using the GPX product, with 20% of them paying
21
GPX customers have access to Dealer Auction
Cars sourced from GPX and Instant
Offer
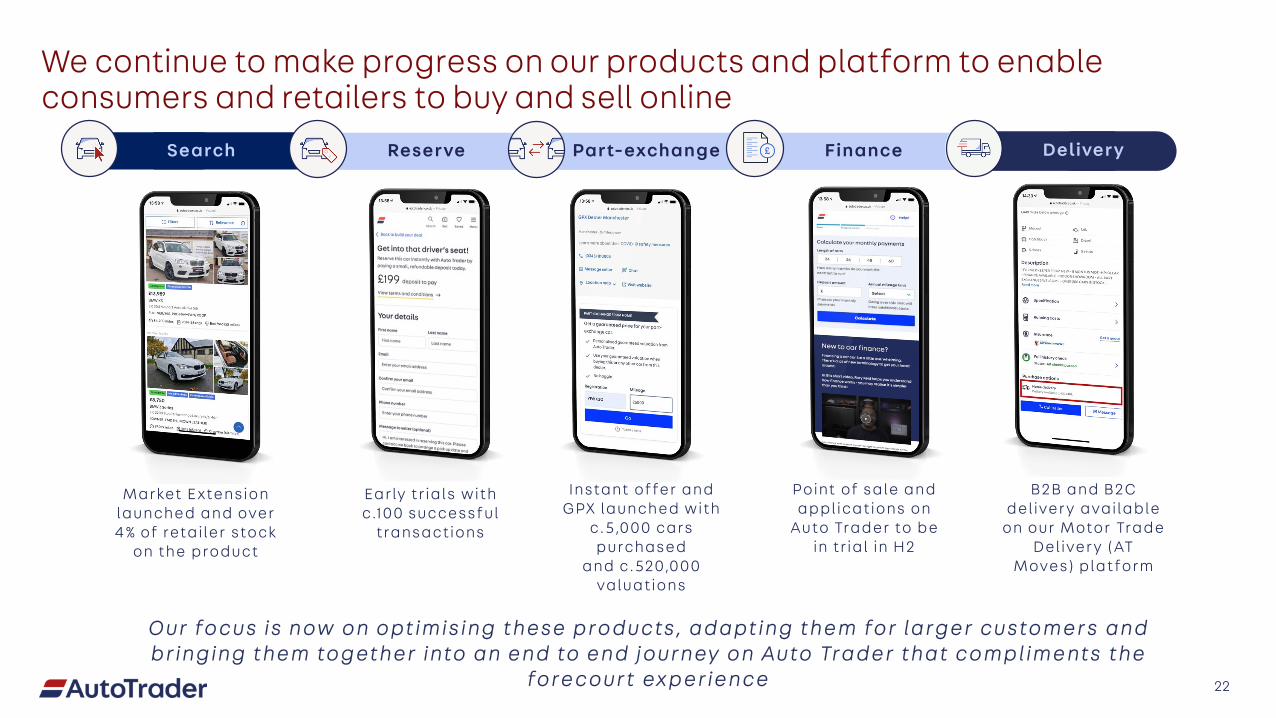
We continue to make progress on our products and platform to enable consumers and retailers to buy and sell online
22
Search Reserve Part-exchange Finance Delivery
Market Extension launched and over 4% of retailer stock
on the product
Point of sale and applications on
Auto Trader to be in trial in H2
Our foc us is now on optimis i ng these produc ts, adapting the m for large r c ustome r s and br inging the m togethe r into an e nd to e nd j our ney on Auto Trade r that c omplime nts the
forec our t experienc e
Early trials withc.100 successful
transactions
Instant offer and GPX launched with
c.5,000 cars purchased
and c.520,000 valuations
B2B and B2C deliver y available
on our Motor Trade Deliver y (AT
Moves) platform

Outlook
Outlook
The Board is confident for the second half of the year. The majority of revenues are recurring in nature and most of the significant growth events for the year have been successfully delivered in the first half. Notable events were our annual pricing event, the launch and initial uptake of new products, which have occurred alongside low levels of retailer churn.
For the full year, we now expect modest year on year growth in retailer forecourt numbers and low double-digit ARPR growth on FY20 levels. The stock lever, which shows the year on year movement, is likely to represent a small headwind for the full year, as we lap a strong second half last year.
Operating profit margins for the full year are expected to be in line with FY20 levels.
24

Q&A

Appendix
27
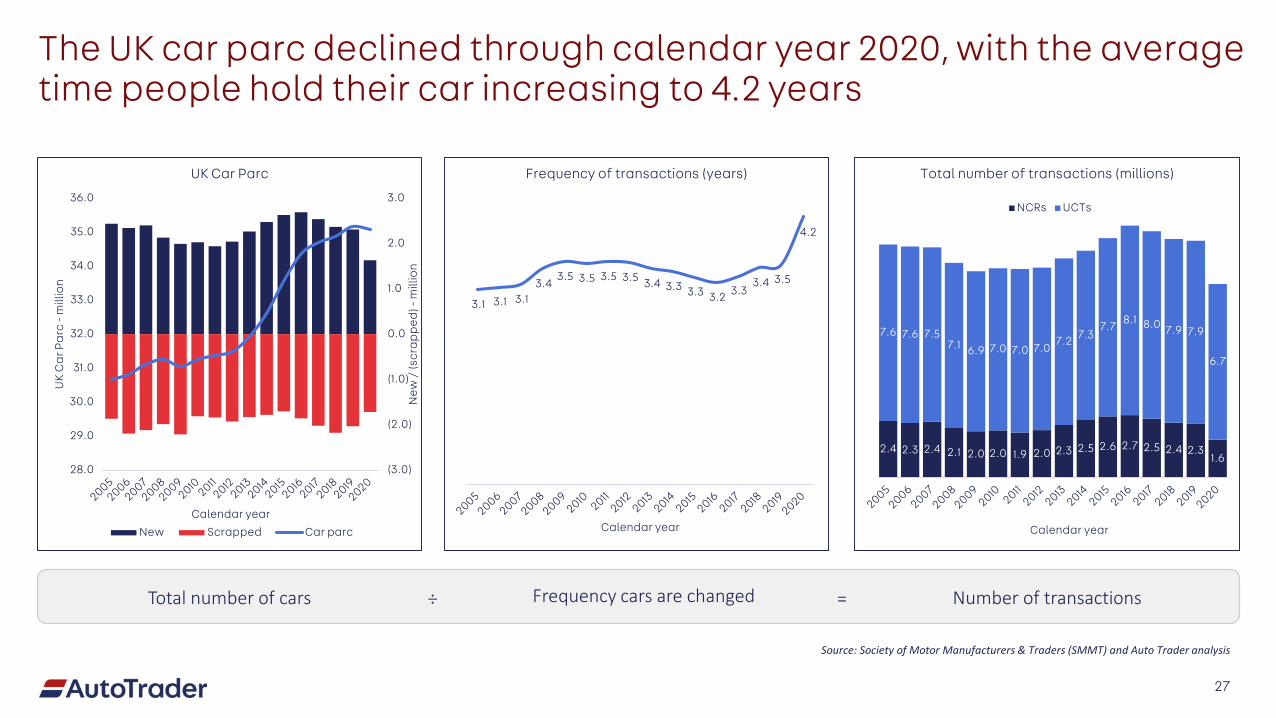
Total number of cars Frequency cars are changed Number of transactions=÷
3.1 3.1 3.1 3.4
3.5 3.5 3.5 3.5 3.4 3.3 3.3 3.2 3.3 3.4 3.5
4.2
Calendar year
Frequency of transactions (years)
(3.0)
(2.0)
(1.0)
0.0
1.0
2.0
3.0
28.0
29.0
30.0
31.0
32.0
33.0
34.0
35.0
36.0
New
/ (s
cra
pp
ed) -
mill
ion
UK
Ca
r Pa
rc -
mill
ion
Calendar year
UK Car Parc
New Scrapped Car parc
2.4 2.3 2.4 2.1 2.0 2.0 1.9 2.0 2.3 2.5 2.6 2.7 2.5 2.4 2.31.6
7.6 7.6 7.57.1 6.9 7.0 7.0 7.0
7.2 7.37.7 8.1 8.0 7.9 7.9
6.7
Calendar year
Total number of transactions (millions)
NCRs UCTs
The UK car parc declined through calendar year 2020, with the average time people hold their car increasing to 4.2 years
Source: Society of Motor Manufacturers & Traders (SMMT) and Auto Trader analysis

28
0%
5%
10%
15%
20%
25%
30%
35%
40%
45%
50%
0 to 10 11 to 20 21 to 30 31 to 100 101 to 1000 Over 1000
% o
f cus
tom
ers
Total # cars advertised on Auto Trader
Mar-17 Sep-21
1. Independent and Franchise customers only
12-month rolling average: New & churn retailers (1)
We saw reduced levels of retailer churn in the last 12 months, leading to a higher percentage of smaller sized forecourts in our customer base
100
120
140
160
180
200
220
240
260
280
Vo
lum
e o
f ret
aile
rs
New Churn
Distribution of customers by stock bands (1)

Cashflow statement
29
H1 2022 H1 2021£ million £ million
Profit before tax 150.0 66.2Depreciation & amortisation 3.6 3.1Share-based payments charge (excl. associated NI) 3.2 1.8Share of profit from joint ventures (1.7) (1.1)Finance costs - net 1.7 2.3Other non-cash items 0.1 0.1Changes in working capital 13.0 (6.3)Cash generated from operations 169.9 66.1
Tax paid (27.8) (18.0)Capital expenditure (2.2) (0.2)Acquisition of subsidiary - (10.0)Payment of lease liabilities (1.6) (1.2)Contributions to defined benefit pension scheme (0.1) (0.1)Proceeds from interest on cash and cash equivalents - 0.1Dividend received from joint ventures 4.9 -Drawdown/(repayment) of revolving credit facility (30.0) (223.5)Payment of interest on borrowings (1.0) (1.8)Payment of refinancing fees - (0.5)Dividends paid (48.0) -Proceeds from issue of shares (net of bookrunner fees) - 183.2Purchase of own shares (100.4) -Payment of fees on repurchase of own shares (0.5) -Payment of fees on issue of own shares - (0.3)Proceeds from exercise of share-based payments 0.3 -
Net increase/ (decrease) in cash (36.5) (6.2)

Notes
30

Notes
31