
HAEMONETICS CORPORATION FORM 10-Q SECURITIES AND …
50
Use these links to rapidly review the document INDEX UNITED STATES SECURITIES AND EXCHANGE COMMISSION Washington, D.C. 20549 FORM 10-Q Quarterly Report Pursuant to Section 13 or 15(d) of the Securities Exchange Act of 1934 For the quarter ended: December 29, 2007 Commission File Number: 1-10730 HAEMONETICS CORPORATION (Exact name of registrant as specified in its charter) Massachusetts (State or other jurisdiction of incorporation or organization) 04-2882273 (IRS Employer Identification No.) 400 Wood Road, Braintree, MA 02184 (Address of principal executive offices) (Registrant's telephone number, including area code): (781) 848-7100 Indicate by check mark whether the registrant (1.) has filed all reports required to be filed by Section 13 or 15(d) of the Securities Exchange Act of 1934 during the preceding 12 months (or for such shorter period that the registrant was required to file such reports) (2.) has been subject to the filing requirements for at least the past 90 days. Yes ☒ No o Indicate by check mark whether the registrant is a large accelerated filer, an accelerated filer, or a non-accelerated filer. See definition of "accelerated filer and large accelerated filer" in Rule 12b-2 of the Exchange Act (Check one): Large accelerated filer ☒ Accelerated filer o Non-accelerated filer o Indicate by check mark whether the registrant is a shell company (as defined in Rule 12b-2 of the Exchange Act.) Yes o No ☒ The number of shares of $.01 par value common stock outstanding as of December 29, 2007: 25,621,738
Transcript of HAEMONETICS CORPORATION FORM 10-Q SECURITIES AND …

Use these links to rapidly review the documentINDEX
UNITED STATESSECURITIES AND EXCHANGE COMMISSION
Washington, D.C. 20549
FORM 10-Q
Quarterly Report Pursuant to Section 13 or 15(d) of the Securities Exchange Act of 1934
For the quarter ended: December 29, 2007 Commission File Number: 1-10730
HAEMONETICS CORPORATION(Exact name of registrant as specified in its charter)
Massachusetts(State or other jurisdiction
of incorporation or organization)
04-2882273(IRS Employer Identification No.)
400 Wood Road, Braintree, MA 02184(Address of principal executive offices)
(Registrant's telephone number, including area code): (781) 848-7100
Indicate by check mark whether the registrant (1.) has filed all reports required to be filed by Section 13 or 15(d) of the Securities Exchange Act of 1934during the preceding 12 months (or for such shorter period that the registrant was required to file such reports) (2.) has been subject to the filing requirements forat least the past 90 days.
Yes ☒ No o
Indicate by check mark whether the registrant is a large accelerated filer, an accelerated filer, or a non-accelerated filer. See definition of "accelerated filerand large accelerated filer" in Rule 12b-2 of the Exchange Act (Check one):
Large accelerated filer ☒ Accelerated filer o Non-accelerated filer o
Indicate by check mark whether the registrant is a shell company (as defined in Rule 12b-2 of the Exchange Act.)
Yes o No ☒
The number of shares of $.01 par value common stock outstanding as of December 29, 2007:
25,621,738

HAEMONETICS CORPORATION
INDEX
PAGE
PART I. FINANCIAL INFORMATION
ITEM 1. Financial Statements Unaudited Consolidated Statements of Income—Three and Nine Months Ended December 29, 2007 and December 30, 2006 2
Unaudited Consolidated Balance Sheets—December 29, 2007 and March 31, 2007 3
Unaudited Consolidated Statement of Stockholders' Equity—Nine Months Ended December 29, 2007 4
Unaudited Consolidated Statements of Cash Flows—Nine Months Ended December 29, 2007 and December 30, 2006 5
Notes to Unaudited Consolidated Financial Statements 6
ITEM 2. Management's Discussion and Analysis of Financial Condition and Results of Operations 22
ITEM 3. Quantitative and Qualitative Disclosures about Market Risk 37
ITEM 4. Controls and Procedures 37
PART II. OTHER INFORMATION 39
ITEM 6. Exhibits 39
Signatures 40
1

ITEM 1. FINANCIAL STATEMENTS
HAEMONETICS CORPORATION AND SUBSIDIARIESCONSOLIDATED INCOME STATEMENTS
(Unaudited in thousands, except per share data)
Three months ended
Nine months ended
December 29,2007
December 30,2006
December 29,2007
December 30,2006
Net revenues $ 134,587 $ 113,527 $ 377,701 $ 332,688Cost of goods sold 68,029 57,108 189,761 163,735 Gross profit 66,558 56,419 187,940 168,953 Operating expenses: Research and development 5,529 5,804 18,532 17,345Selling, general and administrative 41,432 33,610 119,418 105,483In process research & development — — — 9,073 Total operating expenses 46,961 39,414 137,950 131,901 Operating income 19,597 17,005 49,990 37,052Interest income, net 1,070 1,583 4,037 4,715Other income, net 225 817 1,905 2,152 Income before provision for income taxes 20,892 19,405 55,932 43,919Provision for income taxes 6,538 2,503 17,733 14,595 Net income $ 14,354 $ 16,902 $ 38,199 $ 29,324 Basic income per common share Net income $ 0.56 $ 0.64 $ 1.48 $ 1.09Income per common share assuming dilution Net income $ 0.54 $ 0.62 $ 1.43 $ 1.06Weighted average shares outstanding Basic 25,500 26,527 25,881 26,838 Diluted 26,437 27,367 26,776 27,754
The accompanying notes are an integral part of these consolidated financial statements
2
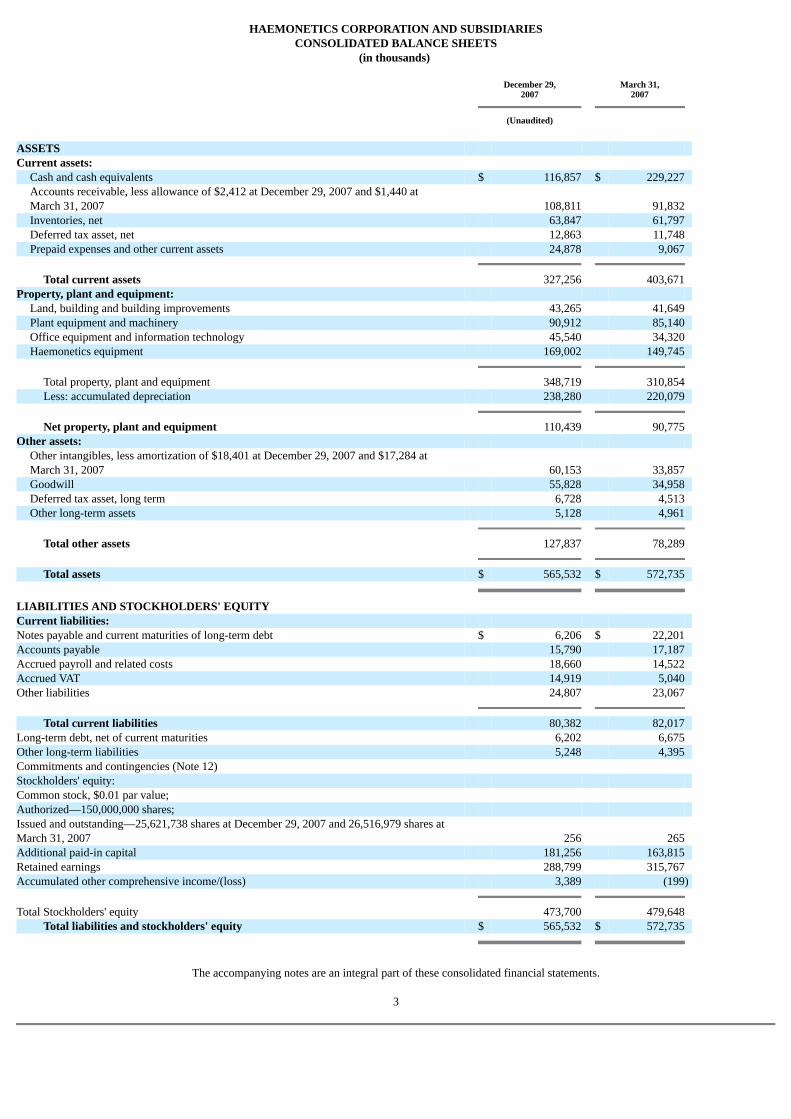
HAEMONETICS CORPORATION AND SUBSIDIARIESCONSOLIDATED BALANCE SHEETS
(in thousands)
December 29,2007
March 31,2007
(Unaudited)
ASSETS Current assets: Cash and cash equivalents $ 116,857 $ 229,227
Accounts receivable, less allowance of $2,412 at December 29, 2007 and $1,440 atMarch 31, 2007 108,811 91,832
Inventories, net 63,847 61,797 Deferred tax asset, net 12,863 11,748 Prepaid expenses and other current assets 24,878 9,067 Total current assets 327,256 403,671 Property, plant and equipment: Land, building and building improvements 43,265 41,649 Plant equipment and machinery 90,912 85,140 Office equipment and information technology 45,540 34,320 Haemonetics equipment 169,002 149,745 Total property, plant and equipment 348,719 310,854 Less: accumulated depreciation 238,280 220,079 Net property, plant and equipment 110,439 90,775 Other assets:
Other intangibles, less amortization of $18,401 at December 29, 2007 and $17,284 atMarch 31, 2007 60,153 33,857
Goodwill 55,828 34,958 Deferred tax asset, long term 6,728 4,513 Other long-term assets 5,128 4,961 Total other assets 127,837 78,289 Total assets $ 565,532 $ 572,735 LIABILITIES AND STOCKHOLDERS' EQUITY Current liabilities: Notes payable and current maturities of long-term debt $ 6,206 $ 22,201 Accounts payable 15,790 17,187 Accrued payroll and related costs 18,660 14,522 Accrued VAT 14,919 5,040 Other liabilities 24,807 23,067 Total current liabilities 80,382 82,017 Long-term debt, net of current maturities 6,202 6,675 Other long-term liabilities 5,248 4,395 Commitments and contingencies (Note 12) Stockholders' equity: Common stock, $0.01 par value; Authorized—150,000,000 shares; Issued and outstanding—25,621,738 shares at December 29, 2007 and 26,516,979 shares atMarch 31, 2007 256 265 Additional paid-in capital 181,256 163,815 Retained earnings 288,799 315,767 Accumulated other comprehensive income/(loss) 3,389 (199) Total Stockholders' equity 473,700 479,648 Total liabilities and stockholders' equity $ 565,532 $ 572,735
The accompanying notes are an integral part of these consolidated financial statements.
3

HAEMONETICS CORPORATION AND SUBSIDIARIESCONSOLIDATED STATEMENTS OF STOCKHOLDERS' EQUITY AND
OTHER COMPREHENSIVE INCOME(Unaudited in thousands)
Shares
$'s
Capital
Earnings
Accumulated OtherComprehensiveIncome/(Loss)
Equity
Income
Balance, March 31, 2007 26,517 $ 265 $ 163,815 $ 315,767 (199) $ 479,648
Employee stock purchase plan 56 1 2,208 — — 2,209
Exercise of stock options and relatedtax benefit 502 5 17,925 — — 17,930
Shares repurchased (1,463) (15) (9,814) (65,167) (74,996)
Issuance of restricted stock, net ofcancellations 10 — — — —
Stock Compensation expense — — 7,122 — — 7,122 Net income — — — 38,199 — 38,199 38,199
Foreign currency translationadjustment — — — — 5,251 5,251 5,251
Unrealized loss on derivatives — — — — (1,663) (1,663) (1,663) Comprehensive income — — — — — — 41,787 Balance, December 29, 2007 25,622 $ 256 $ 181,256 $ 288,799 $ 3,389 $ 473,700
The accompanying notes are an integral part of these consolidated financial statements.
4

HAEMONETICS CORPORATION AND SUBSIDIARIESCONSOLIDATED STATEMENTS OF CASH FLOWS
(Unaudited in thousands)
Nine Months Ended
December 29,2007
December 30,2006
Cash Flows from Operating Activities: Net income $ 38,199 $ 29,324
Adjustments to reconcile net income to net cash provided by operating activities: Non cash items: Depreciation and amortization 22,398 21,026 Stock compensation expense 7,122 7,420 Gain on sales of plant, property and equipment (739) (818) Loss/(gain) from hedging activities (1,582) (3,336) In-process research and development — 9,298
Change in operating assets and liabilities: (Increase)/Decrease in accounts receivable, net (13,377) 4,161 (Increase) in inventories (2,559) (6,492) Decrease in prepaid income taxes 651 229 (Increase)/Decrease in other assets and other long-term liabilities, net (9,165) 1,384 Decrease/(Increase) in accounts payable and accrued expenses 4,806 (2,729) Net cash provided by operating activities 45,754 59,467
Cash Flows from Investing Activities: Capital expenditures on property, plant and equipment (42,497) (26,985) Proceeds from sale of property, plant and equipment 3,149 2,588 Acquisition of HaemoScope (45,080) — Acquisition of Infonale, Inc. (1,300) — Acquisition of Arryx, Inc. — (23,227) Net cash (used in) investing activities (85,728) (47,624)
Cash Flows from Financing Activities: Payments on long-term real estate mortgage (473) (435) Net decrease in short-term revolving credit agreements (10,651) (2,769) Payments on long-term credit agreements (5,714) (5,713) Employee stock purchase plan 2,209 1,937 Exercise of stock options 14,896 8,906 Excess tax benefit on exercise of stock options 1,310 1,745 Stock Repurchase (74,996) (40,000) Net cash used in provided by financing activities (73,419) (36,329)Effect of Exchange Rates on Cash and Cash Equivalents 1,023 1,526 Net (Decrease) in Cash and Cash Equivalents (112,370) (22,960)Cash and Cash Equivalents at Beginning of Year 229,227 250,667 Cash and Cash Equivalents at End of Period $ 116,857 $ 227,707
Non-cash Investing and Financing Activities: Transfers from inventory to fixed assets for placements of Haemonetics equipment $ 1,672 $ 2,602 Supplemental Disclosures of Cash Flow Information: Interest paid $ 849 $ 1,292
Income taxes paid $ 22,544 $ 13,054
The accompanying notes are an integral part of these consolidated financial statements
5

1. BASIS OF PRESENTATION
Our accompanying unaudited consolidated financial statements have been prepared in accordance with generally accepted accounting principles ("GAAP")in the United States for interim financial information and with the instructions to Form 10-Q and Article 10 of Regulation S-X. Accordingly, they do not includeall of the information and footnotes required by GAAP for complete financial statements. In the opinion of our management, all adjustments (consisting ofnormal recurring accruals) considered necessary for a fair presentation have been included. All significant intercompany transactions have been eliminated.Certain reclassifications were made to prior year balances to conform with the presentation of the financial statements for the nine months ended December 29,2007. Additionally, the FY07 amounts have been restated in accordance with Accounting Principles Board, Opinion No. 18, "The Equity Method of Accountingfor Investments in Common Stock" to reflect our investment in Arryx, Inc. for periods prior to the acquisition on July 18, 2006. Operating results for the three andnine month periods ended December 29, 2007 are not necessarily indicative of the results that may be expected for the full fiscal year ending March 29, 2008, orany other interim period. These unaudited consolidated financial statements should be read in conjunction with our audited consolidated financial statements andfootnotes included in our annual report on Form 10-K for the fiscal year ended March 31, 2007.
Our fiscal year ends on the Saturday closest to the last day of March. Fiscal years 2008 and 2007 include 52 weeks with all four quarters including 13 weeks.
Revenue Recognition
Our revenue recognition policy is to recognize revenues from product sales, software and services in accordance with SAB No. 104, "Revenue Recognition"which requires that revenues are recognized when persuasive evidence of an arrangement exists, product delivery, including customer acceptance, unlessperfunctory, has occurred or services have been rendered, the price is fixed or determinable and collectibility is reasonably assured.
Multiple element arrangements
When more than one element such as equipment, disposables and services are contained in a single arrangement, we allocate revenue between the elementsbased on each element's relative fair value, provided that each element meets the criteria for treatment as a separate unit of accounting. An item is considered aseparate unit of accounting if it has value to the customer on a stand alone basis and there is objective and reliable evidence of the fair value of the undelivereditems. The fair value of the undelivered elements is determined by the price charged when the element is sold separately, or in cases when the item is not soldseparately, by the using other objective evidence as defined in Emerging Issues Task Force (EITF) Issue No. 00-21, "Revenue Arrangements with MultipleDeliverables."
Product Revenues
Product sales consist of the sale of our equipment devices, the related disposables used in these devices and intravenous solutions manufactured forpharmaceutical companies. On product sales to customers, revenue is recognized when both the title and risk of loss have transferred to the customer asdetermined by the shipping terms and all post delivery obligations have been achieved to the full satisfaction of the customer. Examples of common post deliveryobligations are installation and training. For product sales to distributors, we recognize revenue for both equipment and disposables upon shipment of theseproducts to our distributors. Our standard contracts with our distributors state that title to the equipment passes to the distributors at point of shipment to adistributor's location.
6

1. BASIS OF PRESENTATION (Continued)
The distributors are responsible for shipment to the end customer along with installation, training and acceptance of the equipment by the end customer. Allshipments to distributors are at contract prices and payment is not contingent upon resale of the product.
Software and Service Revenues
Software sales consist of the sale of our donor management information technology developed by our subsidiary, 5D and the newly acquired InformationData Management, Inc. ("IDM") business.
2. RECENT ACCOUNTING PRONOUNCEMENTS
In December 2007, the FASB issued SFAS No. 141 (revised 2007), "Business Combinations" ("SFAS 141(R)"). In SFAS 141(R), the FASB retained thefundamental requirements of Statement No. 141 to account for all business combinations using the acquisition method (formerly the purchase method) and for anacquiring entity to be identified in all business combinations. However, the new standard requires the acquiring entity in a business combination to recognize all(and only) the assets acquired and liabilities assumed in the transaction; establishes the acquisition-date fair value as the measurement objective for all assetsacquired and liabilities assumed; and requires the acquirer to disclose to investors and other users all of the information they need to evaluate and understand thenature and financial effect of the business combination. SFAS 141(R) is effective for annual periods beginning on or after December 15, 2008. We are currentlyevaluating the potential impact of FASB No. 141(R) on our financial position and results of operations. This statement is effective for our fiscal year 2010.
In December 2007, the FASB issued FASB No. 160 "Noncontrolling Interests in Consolidated Financial Statements—an amendment of ARB No.51" ofwhich the objective is to improve the relevance, comparability, and transparency of the financial information that a reporting entity provides in its consolidatedfinancial statements by establishing accounting and reporting standards by requiring all entities to report noncontrolling (minority) interests in subsidiaries in thesame way—as equity in the consolidated financial statements. Moreover, Statement 160 eliminates the diversity that currently exists in accounting fortransactions between an entity and noncontrolling interests by requiring they be treated as equity transactions. FASB No. 160 is effective for annual periodsbeginning on or after December 15, 2008. We are currently evaluating the potential impact of FASB No. 160 on our financial position and results of operations.This statement is effective for our fiscal year 2010.
In February 2007, the FASB issued FASB No. 159, "The Fair Value Option for Financial Assets and Financial Liabilities-Including an amendment of FASBStatement No. 115" ("FASB No. 159"). The new statement allows entities to choose, at specified election dates, to measure eligible financial assets and liabilitiesat fair value that are not otherwise required to be measured at fair value. If a company elects the fair value option for an eligible item, changes in that item's fairvalue in subsequent reporting periods must be recognized in current earnings. FASB No. 159 is effective for fiscal years beginning after November 15, 2007. Weare currently evaluating the potential impact of FASB No. 159 on our financial position and results of operations. This statement is effective for our fiscal year2009.
In September 2006, the FASB issued FASB No. 157, "Fair Value Measurements" ("FASB No. 157"), which addresses how companies should measure fairvalue when they are required to use a fair value measure for recognition or disclosure purposes under generally accepted accounting principles. FASB No. 157defines fair value, establishes a framework for measuring fair value in generally accepted accounting principles and expands disclosures about fair valuemeasurements. FASB No. 157 is effective for financial statements issued for fiscal years beginning after November 15, 2007 and should be applied prospectively,except in the case of a limited number of financial instruments
7

2. RECENT ACCOUNTING PRONOUNCEMENTS (Continued)
that require retrospective application. We are currently evaluating the potential impact of FASB No. 157 on our financial position and results of operations. Thisstatement is effective for our fiscal year 2009.
3. EARNINGS PER SHARE ("EPS")
The following table provides a reconciliation of the numerators and denominators of the basic and diluted earnings per share computations, as required byFASB Statement No. 128, "Earnings Per Share." Basic EPS is computed by dividing net income by weighted average shares outstanding. Diluted EPS includesthe effect of potentially dilutive common shares.
For the Three Months Ended
December 29, 2007
December 30, 2006
(in thousands, except per share amounts)
Basic EPS Net income $ 14,354 $ 16,902Weighted average shares 25,500 26,527 Basic income per share $ 0.56 $ 0.64
Diluted EPS Net income $ 14,354 $ 16,902Basic weighted average shares 25,500 26,527Dilutive effect of stock options 937 840 Diluted weighted average shares 26,437 27,367Diluted income per share $ 0.54 $ 0.62
For the Nine Months Ended
December 29, 2007
December 30, 2006
(in thousands, except per share amounts)
Basic EPS Net income $ 38,199 $ 29,324Weighted average shares 25,881 26,838 Basic income per share $ 1.48 $ 1.09
Diluted EPS Net income $ 38,199 $ 29,324Basic weighted average shares 25,881 26,838Dilutive effect of stock options 895 916 Diluted weighted average shares 26,776 27,754Diluted income per share $ 1.43 $ 1.06
4. STOCK-BASED COMPENSATION
Stock-based compensation expense of $7.1 million and $7.4 million was recognized for the nine months ended December 29, 2007 and December 30, 2006,respectively. The related income tax benefit
8
4. STOCK-BASED COMPENSATION (Continued)
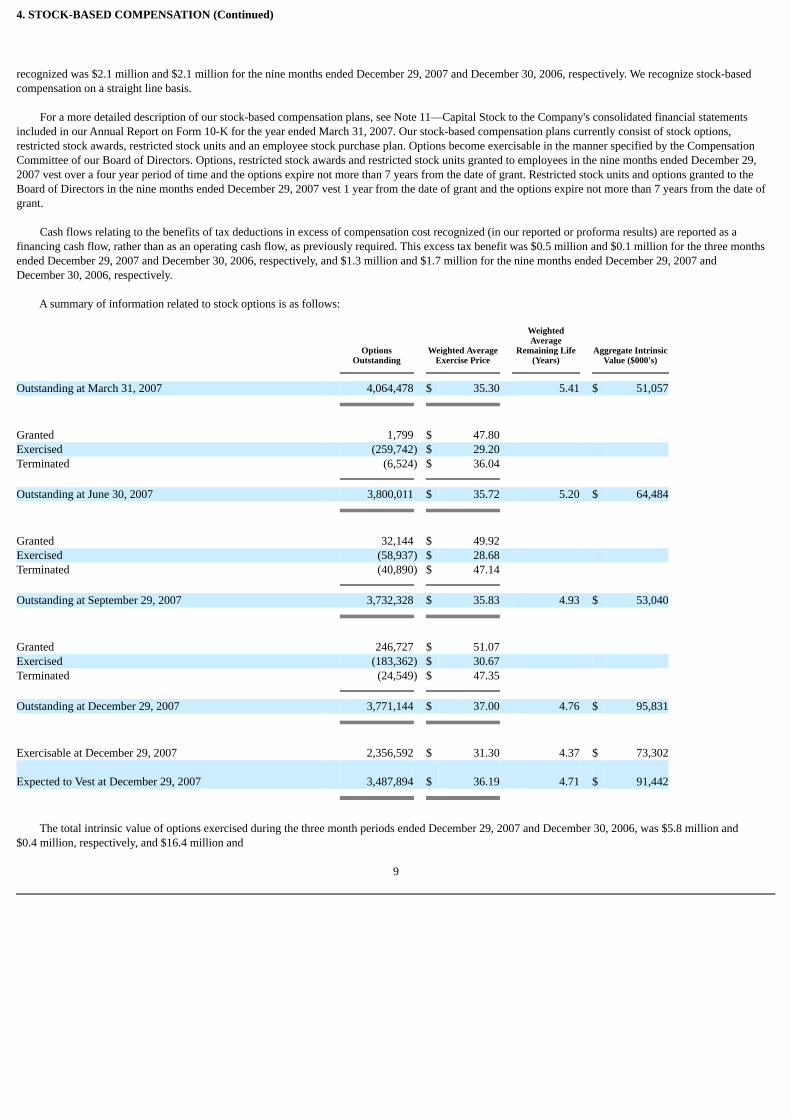
recognized was $2.1 million and $2.1 million for the nine months ended December 29, 2007 and December 30, 2006, respectively. We recognize stock-basedcompensation on a straight line basis.
For a more detailed description of our stock-based compensation plans, see Note 11—Capital Stock to the Company's consolidated financial statementsincluded in our Annual Report on Form 10-K for the year ended March 31, 2007. Our stock-based compensation plans currently consist of stock options,restricted stock awards, restricted stock units and an employee stock purchase plan. Options become exercisable in the manner specified by the CompensationCommittee of our Board of Directors. Options, restricted stock awards and restricted stock units granted to employees in the nine months ended December 29,2007 vest over a four year period of time and the options expire not more than 7 years from the date of grant. Restricted stock units and options granted to theBoard of Directors in the nine months ended December 29, 2007 vest 1 year from the date of grant and the options expire not more than 7 years from the date ofgrant.
Cash flows relating to the benefits of tax deductions in excess of compensation cost recognized (in our reported or proforma results) are reported as afinancing cash flow, rather than as an operating cash flow, as previously required. This excess tax benefit was $0.5 million and $0.1 million for the three monthsended December 29, 2007 and December 30, 2006, respectively, and $1.3 million and $1.7 million for the nine months ended December 29, 2007 andDecember 30, 2006, respectively.
A summary of information related to stock options is as follows:
OptionsOutstanding
Weighted AverageExercise Price
WeightedAverage
Remaining Life(Years)
Aggregate IntrinsicValue ($000's)
Outstanding at March 31, 2007 4,064,478 $ 35.30 5.41 $ 51,057
Granted 1,799 $ 47.80 Exercised (259,742) $ 29.20 Terminated (6,524) $ 36.04 Outstanding at June 30, 2007 3,800,011 $ 35.72 5.20 $ 64,484
Granted 32,144 $ 49.92 Exercised (58,937) $ 28.68 Terminated (40,890) $ 47.14 Outstanding at September 29, 2007 3,732,328 $ 35.83 4.93 $ 53,040
Granted 246,727 $ 51.07 Exercised (183,362) $ 30.67 Terminated (24,549) $ 47.35 Outstanding at December 29, 2007 3,771,144 $ 37.00 4.76 $ 95,831
Exercisable at December 29, 2007 2,356,592 $ 31.30 4.37 $ 73,302
Expected to Vest at December 29, 2007 3,487,894 $ 36.19 4.71 $ 91,442
The total intrinsic value of options exercised during the three month periods ended December 29, 2007 and December 30, 2006, was $5.8 million and$0.4 million, respectively, and $16.4 million and
9
4. STOCK-BASED COMPENSATION (Continued)
$8.7 million for the nine month periods ended December 29, 2007 and December 30, 2006, respectively.
As of December 29, 2007 and December 30, 2006, there was $16.2 million and $19.6 million, respectively, of total unrecognized compensation cost relatedto non vested stock options. That cost is expected to be recognized over a weighted average period of 2.3 years and 1.5 years. The total fair value of sharessubject to options than fully vested during the nine months ended December 29, 2007 was $34.0 million and during the nine months ended December 30, 2006was $24.8 million.
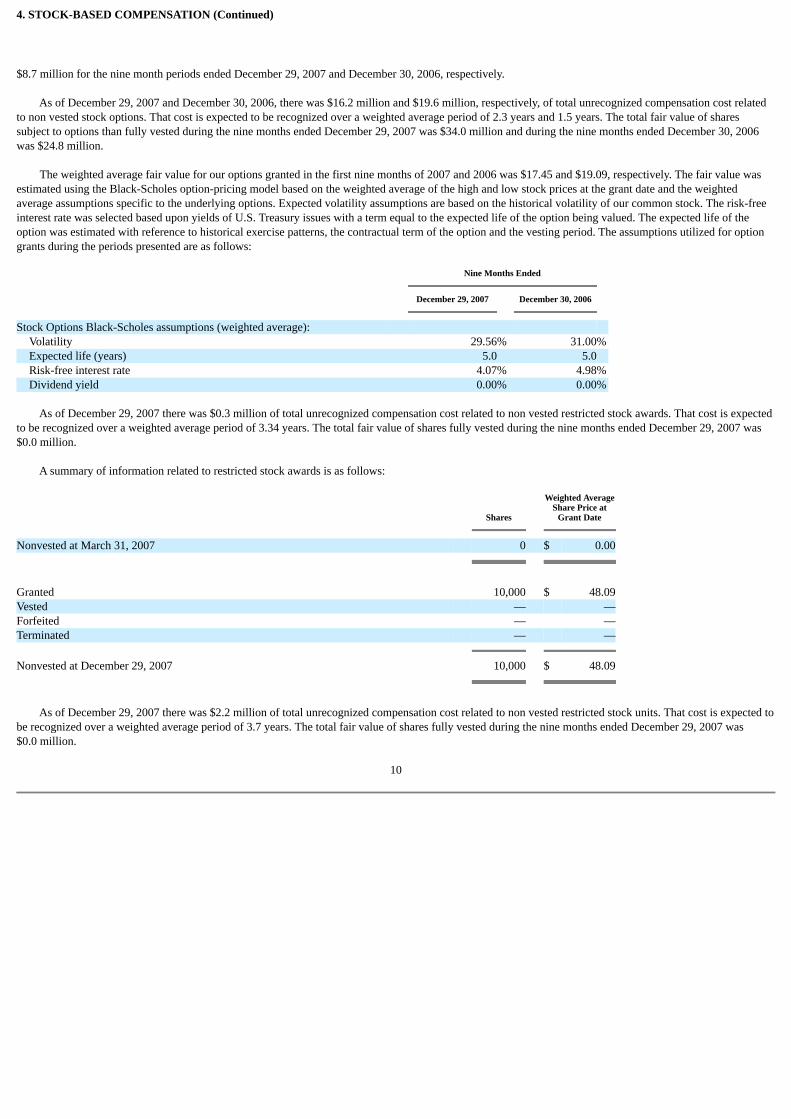
The weighted average fair value for our options granted in the first nine months of 2007 and 2006 was $17.45 and $19.09, respectively. The fair value wasestimated using the Black-Scholes option-pricing model based on the weighted average of the high and low stock prices at the grant date and the weightedaverage assumptions specific to the underlying options. Expected volatility assumptions are based on the historical volatility of our common stock. The risk-freeinterest rate was selected based upon yields of U.S. Treasury issues with a term equal to the expected life of the option being valued. The expected life of theoption was estimated with reference to historical exercise patterns, the contractual term of the option and the vesting period. The assumptions utilized for optiongrants during the periods presented are as follows:
Nine Months Ended
December 29, 2007
December 30, 2006
Stock Options Black-Scholes assumptions (weighted average): Volatility 29.56% 31.00% Expected life (years) 5.0 5.0 Risk-free interest rate 4.07% 4.98% Dividend yield 0.00% 0.00%
As of December 29, 2007 there was $0.3 million of total unrecognized compensation cost related to non vested restricted stock awards. That cost is expectedto be recognized over a weighted average period of 3.34 years. The total fair value of shares fully vested during the nine months ended December 29, 2007 was$0.0 million.
A summary of information related to restricted stock awards is as follows:
Shares
Weighted AverageShare Price at
Grant Date
Nonvested at March 31, 2007 0 $ 0.00
Granted 10,000 $ 48.09Vested — —Forfeited — —Terminated — — Nonvested at December 29, 2007 10,000 $ 48.09
As of December 29, 2007 there was $2.2 million of total unrecognized compensation cost related to non vested restricted stock units. That cost is expected tobe recognized over a weighted average period of 3.7 years. The total fair value of shares fully vested during the nine months ended December 29, 2007 was$0.0 million.
10

4. STOCK-BASED COMPENSATION (Continued)
A summary of information related to restricted stock units is as follows:
Shares
Weighted AverageShare Price
Nonvested at March 31, 2007 0 $ 0.00
Granted 3,305 $ 50.16Vested — —Forfeited — — Nonvested at September 29, 2007 3,305 $ 50.16
Granted 53,657 $ 51.53Vested — —Forfeited — — Nonvested at December 29, 2007 56,962 $ 51.43
As of December 29, 2007, there was $0.1 million of total unrecognized compensation expense, net of estimated forfeitures, related to Employee StockPurchase Plan ("ESPP") shares. That cost is expected to be recognized during 2007.
During the nine months ended December 29, 2007 and December 30, 2006, there were 55,766 and 48,043 shares purchased under the ESPP, respectively.They were purchased at $39.6087 and $40.1614 per share under the ESPP.
5. ACCOUNTING FOR SHIPPING AND HANDLING COSTS
Shipping and handling costs are included in costs of goods sold with the exception of $2.8 million and $1.8 million for the three month periods endedDecember 29, 2007 and December 30, 2006, respectively, and $7.2 million and $5.1 million for the nine month periods ended December 29, 2007 andDecember 30, 2006, respectively, that are included in selling, general and administrative expenses. Freight is classified in costs of goods sold when the customeris charged for freight and in selling, general and administration when the customer is not explicitly charged for freight.
6. FOREIGN CURRENCY
We enter into forward exchange contracts to hedge the anticipated cash flows from forecasted foreign currency denominated revenues, principally JapaneseYen and Euro. The purpose of our hedging strategy is to lock in foreign exchange rates for twelve months to minimize, for this period of time, the unforeseenimpact on our results of operations of fluctuations in foreign exchange rates. We also enter into forward contracts that settle within 35 days to hedge certain inter-company receivables denominated in foreign currencies. These derivative financial instruments are not used for trading purposes. The cash flows related to thegains and losses on these foreign currency hedges are classified in the consolidated statements of cash flows as part of cash flows from operating activities.
11
7. PRODUCT WARRANTIES
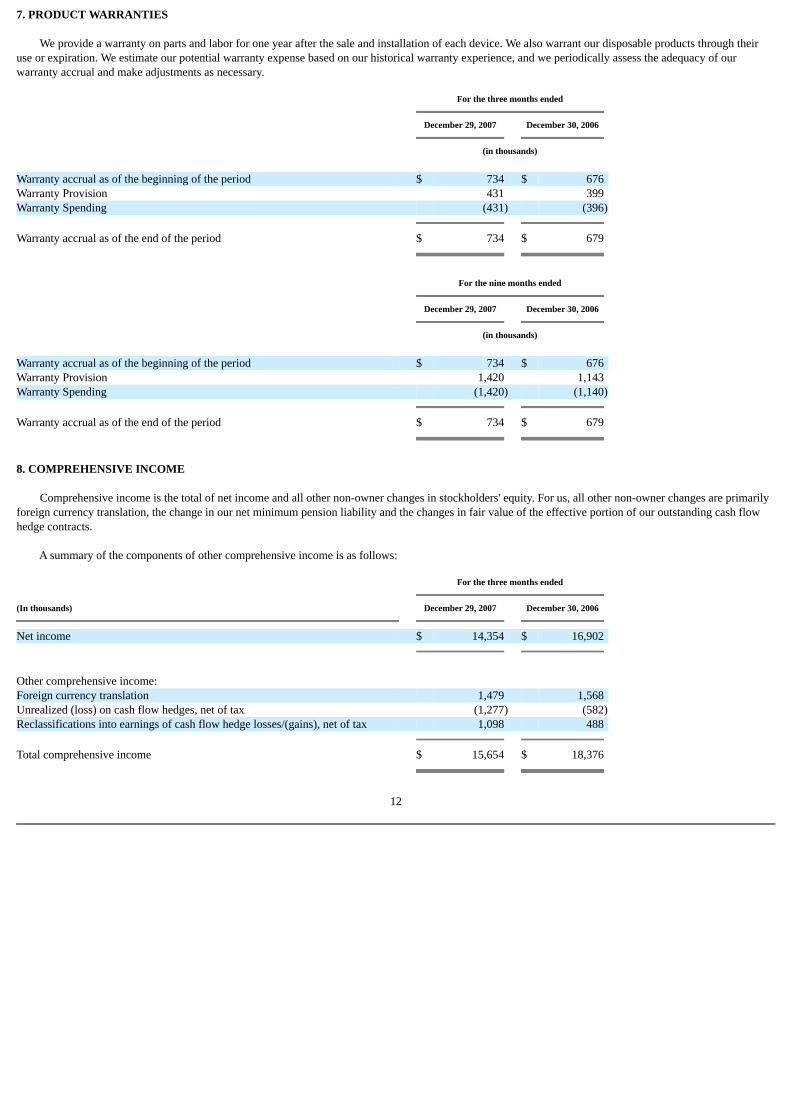
We provide a warranty on parts and labor for one year after the sale and installation of each device. We also warrant our disposable products through theiruse or expiration. We estimate our potential warranty expense based on our historical warranty experience, and we periodically assess the adequacy of ourwarranty accrual and make adjustments as necessary.
For the three months ended
December 29, 2007
December 30, 2006
(in thousands)
Warranty accrual as of the beginning of the period $ 734 $ 676 Warranty Provision 431 399 Warranty Spending (431) (396) Warranty accrual as of the end of the period $ 734 $ 679
For the nine months ended
December 29, 2007
December 30, 2006
(in thousands)
Warranty accrual as of the beginning of the period $ 734 $ 676 Warranty Provision 1,420 1,143 Warranty Spending (1,420) (1,140) Warranty accrual as of the end of the period $ 734 $ 679
8. COMPREHENSIVE INCOME
Comprehensive income is the total of net income and all other non-owner changes in stockholders' equity. For us, all other non-owner changes are primarilyforeign currency translation, the change in our net minimum pension liability and the changes in fair value of the effective portion of our outstanding cash flowhedge contracts.
A summary of the components of other comprehensive income is as follows:
For the three months ended
(In thousands)
December 29, 2007
December 30, 2006
Net income $ 14,354 $ 16,902
Other comprehensive income: Foreign currency translation 1,479 1,568 Unrealized (loss) on cash flow hedges, net of tax (1,277) (582)Reclassifications into earnings of cash flow hedge losses/(gains), net of tax 1,098 488 Total comprehensive income $ 15,654 $ 18,376
12
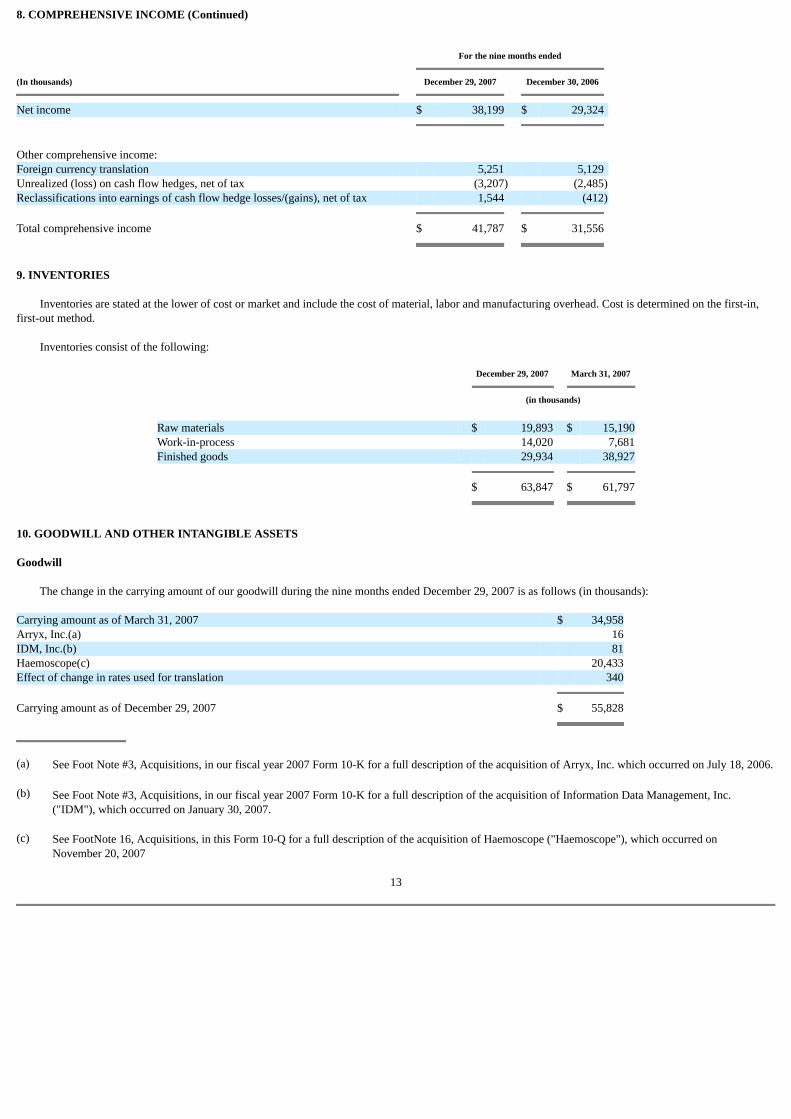
8. COMPREHENSIVE INCOME (Continued)
For the nine months ended
(In thousands)
December 29, 2007
December 30, 2006
Net income $ 38,199 $ 29,324
Other comprehensive income: Foreign currency translation 5,251 5,129 Unrealized (loss) on cash flow hedges, net of tax (3,207) (2,485)Reclassifications into earnings of cash flow hedge losses/(gains), net of tax 1,544 (412) Total comprehensive income $ 41,787 $ 31,556
9. INVENTORIES
Inventories are stated at the lower of cost or market and include the cost of material, labor and manufacturing overhead. Cost is determined on the first-in,first-out method.
Inventories consist of the following:
December 29, 2007
March 31, 2007
(in thousands)
Raw materials $ 19,893 $ 15,190Work-in-process 14,020 7,681Finished goods 29,934 38,927 $ 63,847 $ 61,797
10. GOODWILL AND OTHER INTANGIBLE ASSETS
Goodwill
The change in the carrying amount of our goodwill during the nine months ended December 29, 2007 is as follows (in thousands):
Carrying amount as of March 31, 2007 $ 34,958Arryx, Inc.(a) 16IDM, Inc.(b) 81Haemoscope(c) 20,433Effect of change in rates used for translation 340 Carrying amount as of December 29, 2007 $ 55,828
(a) See Foot Note #3, Acquisitions, in our fiscal year 2007 Form 10-K for a full description of the acquisition of Arryx, Inc. which occurred on July 18, 2006.
(b) See Foot Note #3, Acquisitions, in our fiscal year 2007 Form 10-K for a full description of the acquisition of Information Data Management, Inc.("IDM"), which occurred on January 30, 2007.
(c) See FootNote 16, Acquisitions, in this Form 10-Q for a full description of the acquisition of Haemoscope ("Haemoscope"), which occurred onNovember 20, 2007
13

10. GOODWILL AND OTHER INTANGIBLE ASSETS (Continued)
Other Intangible Assets
As of December 29, 2007
Gross CarryingAmount
(in thousands)
AccumulatedAmortization(in thousands)
Weighted AverageUseful Life (in years)
Amortized Intangibles Patents $ 11,559 $ 3,824 12Other technology 40,877 9,791 11Customer contracts and related relationships 25,591 4,786 12 Subtotal 78,027 18,401
Indefinite Life Intangibles Trade name 527 0 Indefinite Total Intangibles $ 78,554 $ 18,401
As of March 31, 2007
Gross CarryingAmount
(in thousands)
AccumulatedAmortization(in thousands)
Weighted AverageUseful Life (in years)
Amortized Intangibles Patents $ 13,834 $ 4,679 13Other technology 23,665 8,833 14Customer contracts and related relationships 13,138 3,771 14 Subtotal 50,637 17,284 14Indefinite Life Intangibles Trade name 504 n/a Indefinite Total Intangibles $ 51,141 $ 17,284
On November 20, 2007 the Company acquired Haemoscope Corporation's TEG® Thrombelastograph® Hemostasis Analyzer business for $45 million cash.Haemoscope Corporation is a provider of whole blood hemostasis monitoring systems. The TEG system can predict a patient's risk of bleeding and thromboticcomplications and enable personalized therapy. The purchase price was principally allocated to intangible assets including other technology, customerrelationships and goodwill. This purchase price allocation is preliminary and has not been finalized The results of the Haemoscope's operations have beenincluded in our consolidated financial statements for periods after the acquisition date.
On July 9, 2007, the Company acquired the assets of Infonalé, Inc. (Infonalé) for approximately $1.3 million in cash plus contingent consideration basedupon future operating performance. Infonalé is a leading developer of IT software and consulting services for optimizing hospital blood use and management. Thepurchase price was principally allocated to intangible assets including other technology and goodwill. The results of the Infonalé operations are included in ourconsolidated results for periods after the acquisition date.
Other changes to the net carrying value of our intangible assets from March 31, 2007 to December 29, 2007, reflect the capitalization of software costsassociated with our next generation Donor apheresis platform (see Footnote #17), amortization expense and the effect of exchange rate changes in the translationof our intangible assets held by our international subsidiaries, and the sale of certain patents that had histrorical cost of $2.7 million and a carrying value of$1.0 million.
Amortization expense for amortized other intangible assets was $0.9 million and $0.7 million for the three months ended December 29, 2007 andDecember 30, 2006, respectively and $2.6 million and $2.0 million for the nine months ended December 29, 2007 and December 30, 2006, respectively. Annualamortization expense is expected to approximate $3.9 million for fiscal year 2008, $5.7 million for fiscal years 2009 and 2010, and $7.0 million for fiscal years2011 and 2012.
14

11. INCOME TAXES
Our reported tax rate includes two principal components: an expected annual tax rate and discrete items that are recorded in the quarter that an event arises.Events or items that give rise to discrete recognition include finalizing audit examinations for open tax years, a statute of limitation's expiration, and a stockacquisition.
The reported tax rate was 31.3% and 12.9% the three month periods ended December 29, 2007 and December 30, 2006. The reported tax rate was 31.7% and33.2% for the nine month periods ended December 29, 2007 and December 30, 2006.
For the three months ended December 29, 2007, the reported tax rate includes a 35.1% expected annual tax rate. The reported income tax also includes twodiscrete items: a reduction in tax reserves associated with the expiration of the statute of limitations, partly offset by additional income taxes associated with thefinalization of certain income tax returns for FY07 in the amount of $1.0 million. The income tax rate for the three months ended December 30, 2006, reflectedthe settlement of a tax audit.
For the nine months ended December 29, 2007, the reported tax rate includes a 35.1% expected annual tax rate. The reported income tax rate also includesseveral discrete items, among them: a reduction in tax reserves associated with the expiration of the statute of limitations in several jurisdictions, $0.4 million inforeign tax credits associated with certain dividends, partly offset by additional income taxes associated with the finalization of certain income tax returns in theamount of $1.8 million. The income tax rate for the three months ended December 30, 2006, reflected the settlement of a tax audit.
We expect our annual tax rate to be approximately 35.1% for the remainder of fiscal year 2008. Our full year reported tax rate is expected to be lower orbetween 32% and 33% as a result of the discrete items discussed above.
We adopted the provisions of FASB Interpretation No. 48, "Accounting for Uncertainty in Income Taxes"—an Interpretation of FASB Statement 109,(FIN 48) effective April 1, 2007. FIN 48 provides a comprehensive model for the financial statement recognition, measurement, presentation and disclosure ofuncertain tax positions taken or expected to be taken in income tax returns. Unrecognized tax benefits represent tax positions for which reserves have beenestablished.
As of April 1, 2007, our unrecognized tax benefits totaled approximately $6.5 million which, if recognized, would favorably affect our effective tax rate infuture periods. No adjustment was made to the liability for unrecognized tax benefits as of April 1,2007 or December 29, 2007 or current year's tax provision inconnection with the adoption of FIN48. Each year the statute of limitations for income tax returns filed in various jurisdictions closes, sometimes withoutadjustments. During the nine months ended December 29, 2007 our unrecognized tax benefits were reduced by $2.0 million as a result of the expiration of thestatute of limitations in several jurisdictions. This was offset in part by the establishment of reserves of $0.5 million for various matters including interest. Totalunrecognized tax benefits on December 29, 2007 were $5.2 million.
Our historic practice has been and continues to be to recognize interest and penalties related to Federal, state, and foreign income tax matters in income taxexpense. Approximately $0.8 million and $0.7 million is accrued for interest at December 29, 2007 and March 31, 2007, respectively.
We conduct business globally and, as a result, file consolidated and separate Federal, state, and foreign income tax returns in multiple jurisdictions. In thenormal course of business, we are subject to examination by taxing authorities throughout the world in jurisdictions including the U.S., Japan,
15

11. INCOME TAXES (Continued)
Germany, France, the United Kingdom, and Switzerland. With few exceptions, we are no longer subject to U.S. federal, state and local, or foreign income taxexaminations for years before 2005.
12. COMMITMENTS AND CONTINGENCIES
We are presently engaged in various legal actions, and although ultimate liability cannot be determined at the present time, we believe, based on consultationwith counsel, that any such liability will not materially affect our consolidated financial position or our results of operations.
13. DEFINED BENEFIT PENSION PLANS
Certain of the Company's foreign subsidiaries have defined benefit pension plans covering substantially all full time employees at those subsidiaries. Netperiodic benefit costs for the plans in the aggregate include the following components:
For the three months ended
December 29, 2007
December 30, 2006
(in thousands)
Service Cost $ 152 $ 160 Interest cost on benefit obligation 56 48 Expected return on plan assets (19) (45)Amortization of unrecognized prior service cost, unrecognized gain andunrecognized initial obligation (4) 2 Net periodic benefit cost $ 185 $ 164
For the nine months ended
December 29, 2007
December 30, 2006
(in thousands)
Service Cost $ 438 $ 509 Interest cost on benefit obligation 160 154 Expected return on plan assets (55) (136)Amortization of unrecognized prior service cost, unrecognized gain andunrecognized initial obligation (10) 5 Net periodic benefit cost $ 533 $ 531
14. SEGMENT INFORMATION
Segment Definition Criteria
We manage our business on the basis of one operating segment: the design, manufacture and marketing of automated blood management systems. Our chiefoperating decision-maker uses consolidated results to make operating and strategic decisions. Manufacturing processes, as well as the regulatory environment inwhich we operate, are largely the same for all product lines.
Enterprise Wide Disclosures About Product and Services
We have three families of products: (1) those that serve the blood donor, (2) those that serve the patient and (3) our services and software products which areused in connection with our donor and patient products. Under the donor family of products we have included blood bank, red cell and
16
14. SEGMENT INFORMATION (Continued)
plasma collection products. The patient products include autologous blood salvage products targeting surgical patients who lose blood while in the operatingroom and while in recovery.
Donor
The blood bank products include machines, single use disposables and solutions that perform "apheresis," (the separation of whole blood into its componentsand subsequent collection of certain components, including platelets and plasma) as well as the washing of red blood cells for certain procedures. The maindevices used for these blood component therapies are the MCS®+ mobile collection systems and the ACP® 215 automated cell processing system. In addition,the blood bank product line includes generic solutions that we produce for pharmaceutical companies pursuant to contracts.
Red cell products include machines, single use disposables and solutions that perform apheresis for the collection of red blood cells. The devices used for thecollection of red blood cells is the MCS®+ mobile collection system and the newly released Cymbal device.
Plasma collection products are machines, disposables and solutions that perform apheresis for the separation of whole blood components and subsequentcollection of plasma. The devices used in automated plasma collection are the PCS®2 plasma collection system.
Patient
Patient products include machines and single use disposables that perform surgical blood salvage in orthopedic and cardiovascular surgical applications.Patient products include the OrthoPAT®, Cell Saver® and cardioPAT autologous blood recovery systems, and the Smart Suction Harmony which is a suctiondevice designed to operate together with these blood recovery systems, as well as with competitive blood recovery systems and the TEG® Thrombelastograph®.Cell Saver technologies are used in cardiovascular procedures, specifically higher blood loss surgeries and trauma. The cardioPAT is used for cardiovascularsurgeries where there is less bleeding, and is used post-operatively as well. OrthoPAT technology is used for lower, slower blood loss orthopedic procedures,where bleeding takes place during and after surgery. These technologies perform a procedure whereby shed blood is collected, cleansed and made available to betransfused back to the patient. The TEG® Thrombelastograph® system is a Hemastasis monitoring system that can predict a patient's risk of bleeding.
Software Solutions and Services
Software solutions and services revenue includes revenue generated from our software offerings and from equipment repairs performed under preventivemaintenance contracts or emergency service billings and miscellaneous sales, including parts. Software solutions provide software support and collection and datamanagement systems, to plasma collectors, blood banks and the U.S. Department of Defense.
17

14. SEGMENT INFORMATION (Continued)
Revenues from External Customers:
Three Months Ended
(in thousands)
December 29, 2007
December 30, 2006
Disposables Revenues by Product Family Donor: Plasma $ 41,253 $ 32,362 Blood Bank 33,207 30,954 Red Cell 12,478 11,132 $ 86,938 $ 74,448
Patient: Surgical & Diagnostic $ 18,981 $ 16,989 OrthoPAT 9,086 7,491 $ 28,067 $ 24,480 Disposables Revenue $ 115,005 $ 98,928
Equipment $ 8,485 $ 5,194Software Solutions & Services $ 11,097 $ 9,405 Total revenues from external customers $ 134,587 $ 113,527
Nine Months Ended
(in thousands)
December 29, 2007
December 30, 2006
Disposables Revenues by Product Family Donor: Plasma $ 114,789 $ 96,253 Blood Bank 100,399 93,998 Red Cell 34,257 32,105 $ 249,445 $ 222,356
Patient: Surgical & Diagnostic $ 50,907 $ 49,298 OrthoPAT 25,122 22,132 $ 76,029 $ 71,430 Disposables Revenue $ 325,474 $ 293,786
Equipment $ 22,286 $ 15,207Software Solutions & Services $ 29,941 $ 23,695 Total revenues from external customers $ 377,701 $ 332,688
18
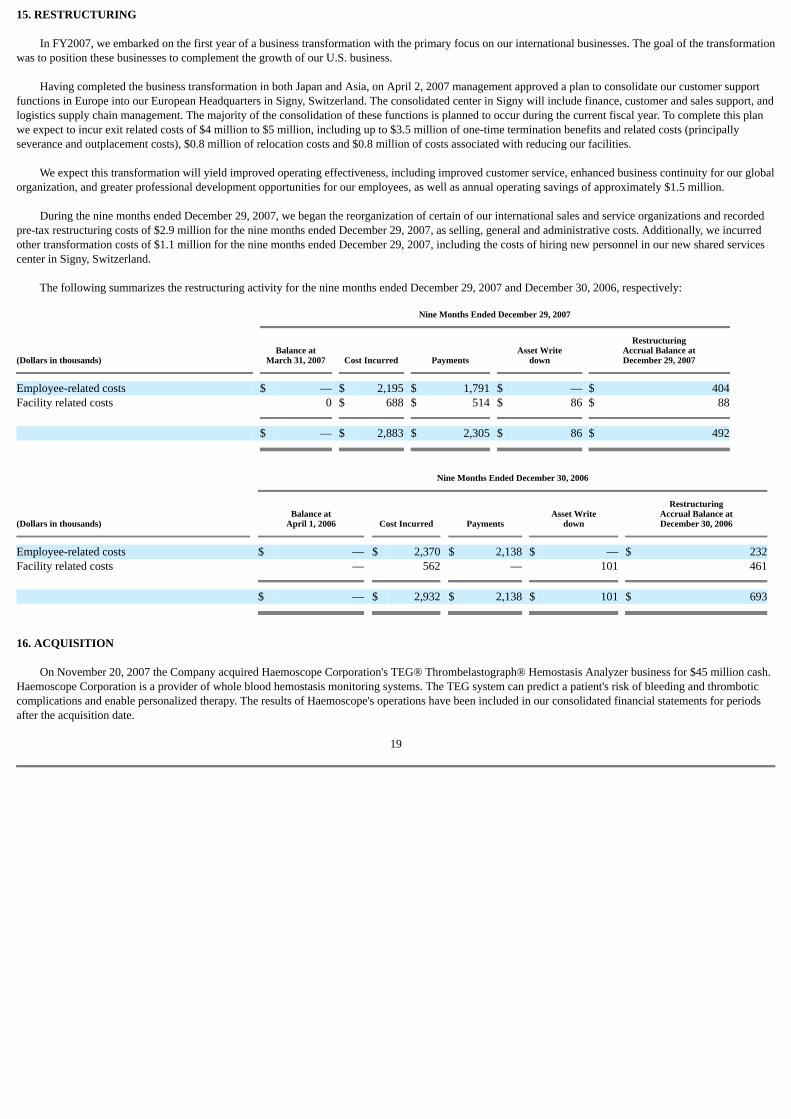
15. RESTRUCTURING
In FY2007, we embarked on the first year of a business transformation with the primary focus on our international businesses. The goal of the transformationwas to position these businesses to complement the growth of our U.S. business.
Having completed the business transformation in both Japan and Asia, on April 2, 2007 management approved a plan to consolidate our customer supportfunctions in Europe into our European Headquarters in Signy, Switzerland. The consolidated center in Signy will include finance, customer and sales support, andlogistics supply chain management. The majority of the consolidation of these functions is planned to occur during the current fiscal year. To complete this planwe expect to incur exit related costs of $4 million to $5 million, including up to $3.5 million of one-time termination benefits and related costs (principallyseverance and outplacement costs), $0.8 million of relocation costs and $0.8 million of costs associated with reducing our facilities.
We expect this transformation will yield improved operating effectiveness, including improved customer service, enhanced business continuity for our globalorganization, and greater professional development opportunities for our employees, as well as annual operating savings of approximately $1.5 million.
During the nine months ended December 29, 2007, we began the reorganization of certain of our international sales and service organizations and recordedpre-tax restructuring costs of $2.9 million for the nine months ended December 29, 2007, as selling, general and administrative costs. Additionally, we incurredother transformation costs of $1.1 million for the nine months ended December 29, 2007, including the costs of hiring new personnel in our new shared servicescenter in Signy, Switzerland.
The following summarizes the restructuring activity for the nine months ended December 29, 2007 and December 30, 2006, respectively:
Nine Months Ended December 29, 2007
(Dollars in thousands)
Balance atMarch 31, 2007
Cost Incurred
Payments
Asset Writedown
RestructuringAccrual Balance atDecember 29, 2007
Employee-related costs $ — $ 2,195 $ 1,791 $ — $ 404Facility related costs 0 $ 688 $ 514 $ 86 $ 88 $ — $ 2,883 $ 2,305 $ 86 $ 492
Nine Months Ended December 30, 2006
(Dollars in thousands)
Balance atApril 1, 2006
Cost Incurred
Payments
Asset Writedown
RestructuringAccrual Balance atDecember 30, 2006
Employee-related costs $ — $ 2,370 $ 2,138 $ — $ 232Facility related costs — 562 — 101 461 $ — $ 2,932 $ 2,138 $ 101 $ 693
16. ACQUISITION
On November 20, 2007 the Company acquired Haemoscope Corporation's TEG® Thrombelastograph® Hemostasis Analyzer business for $45 million cash.Haemoscope Corporation is a provider of whole blood hemostasis monitoring systems. The TEG system can predict a patient's risk of bleeding and thromboticcomplications and enable personalized therapy. The results of Haemoscope's operations have been included in our consolidated financial statements for periodsafter the acquisition date.
19
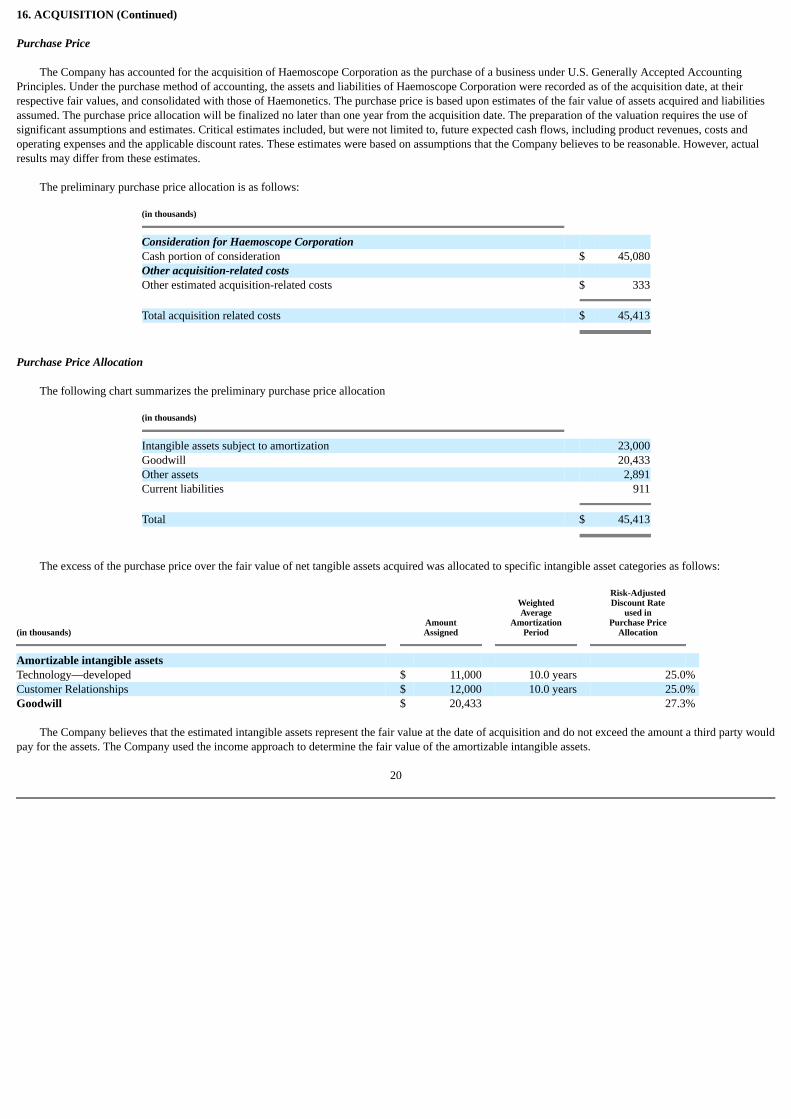
16. ACQUISITION (Continued)
Purchase Price
The Company has accounted for the acquisition of Haemoscope Corporation as the purchase of a business under U.S. Generally Accepted AccountingPrinciples. Under the purchase method of accounting, the assets and liabilities of Haemoscope Corporation were recorded as of the acquisition date, at theirrespective fair values, and consolidated with those of Haemonetics. The purchase price is based upon estimates of the fair value of assets acquired and liabilitiesassumed. The purchase price allocation will be finalized no later than one year from the acquisition date. The preparation of the valuation requires the use ofsignificant assumptions and estimates. Critical estimates included, but were not limited to, future expected cash flows, including product revenues, costs andoperating expenses and the applicable discount rates. These estimates were based on assumptions that the Company believes to be reasonable. However, actualresults may differ from these estimates.
The preliminary purchase price allocation is as follows:
(in thousands)
Consideration for Haemoscope Corporation Cash portion of consideration $ 45,080Other acquisition-related costs Other estimated acquisition-related costs $ 333 Total acquisition related costs $ 45,413
Purchase Price Allocation
The following chart summarizes the preliminary purchase price allocation
(in thousands)
Intangible assets subject to amortization 23,000Goodwill 20,433Other assets 2,891Current liabilities 911 Total $ 45,413
The excess of the purchase price over the fair value of net tangible assets acquired was allocated to specific intangible asset categories as follows:
(in thousands)
AmountAssigned
WeightedAverage
AmortizationPeriod
Risk-AdjustedDiscount Rate
used inPurchase Price
Allocation
Amortizable intangible assets Technology—developed $ 11,000 10.0 years 25.0%Customer Relationships $ 12,000 10.0 years 25.0%Goodwill $ 20,433 27.3%
The Company believes that the estimated intangible assets represent the fair value at the date of acquisition and do not exceed the amount a third party wouldpay for the assets. The Company used the income approach to determine the fair value of the amortizable intangible assets.
20

16. ACQUISITION (Continued)
Various factors contributed to the establishment of goodwill, including: the value of Haemoscope Corporation's highly trained work force as of theacquisition date, the expected business plans and associated revenue from future products. The goodwill acquired is deductible for tax purposes.
The developed technology acquired represents the value associated with currently marketed product, the TEG system. This system includes a patenteddevice, application software and assays. The system is used by hospitals and laboratories to predict a patient's risk of bleeding. We also acquired the customerrelationships that Haemoscope developed. Haemoscope conducted the majority of its business on the basis of purchase orders and repeat purchases ofconsumables. These customer relationships are predicated on the technology that the customer has invested in, both through the initial purchase of the TEGdevice, but also the investment in the training and staff development associated with using a technology like TEG. The Company used the income approach toestimate the fair value of the developed technology and customer relationships as of the acquisition date. The Company determined that the estimated useful lifeof the intangible assets is approximately 10 years.
17. CAPITALIZATION OF SOFTWARE DEVELOPMENT COSTS
The Company is implementing an Enterprise Resource Planning (ERP) system. In Fiscal 2007, we began our plan to implement the system in three phasesover three years.
The cost of software that is developed for internal use is accounted for pursuant to AICPA Statement of Position 98-1, "Accounting for the Costs ofComputer Software Developed or Obtained for Internal Use" ("SOP 98-1"). Pursuant to SOP 98-1, the Company capitalizes costs incurred during the applicationdevelopment stage of software developed for internal use, and expenses costs incurred during the preliminary project and the post-implementation operationstages of development. The Company capitalized $6.5 million and $4.3 million, respectively, during the nine month periods ended December 29, 2007 andDecember 30, 2006, in costs incurred for acquisition of the software license and related software development costs for new internal software development thatwas in the application stage. The total capitalized costs incurred to date include $1.8 million for the cost of the software license and $13.4 million in third partydevelopment costs and internal personnel.
SFAS No. 86, "Accounting for the Cost of Computer Software to be Sold, Leased or Otherwise Marketed", specifies that costs incurred internally inresearching and developing a computer software product should be charged to expense until technological feasibility has been established for the product. Oncetechnological feasibility is established, all software costs should be capitalized until the product is available for general release to customers. In connection withthe development of our next generation Donor apheresis platform, the Company capitalized $3.7 million during the nine month period ended December 29, 2007and $9.6 million in total software development costs. All costs capitalized were incurred after a detailed design of the software was developed and research anddevelopment activities on the underlying device were completed. We will begin to amortize these costs when the device is released for sale in fiscal 2011.Additionally, the Company capitalized $1.7 million of other software development costs for ongoing initiatives. We will begin to amortize these costs when theproducts are released for sale during fiscal 2009.
21

ITEM 2. MANAGEMENT'S DISCUSSION AND ANALYSIS OF FINANCIAL CONDITION AND RESULTS OF OPERATIONS
This Management's Discussion and Analysis of Financial Condition and Results of Operations ("MD&A") should be read in conjunction with both ourinterim consolidated financial statements and notes thereto which appear elsewhere in this Quarterly Report on Form 10-Q and the MD&A contained in our fiscalyear 2007 Annual Report on Form 10-K filed with the Securities and Exchange Commission (the "SEC") on May 25, 2007. The following discussion may containforward-looking statements and should be read in conjunction with the "Cautionary Statement Regarding Forward-Looking Information" beginning onpage 35.
Our Business
Haemonetics is a blood management solutions company for our customers. Anchored by our reputable device technologies, we also provide informationsystems and valued added services to provide customer solutions which support improved clinical outcomes and efficiency in the blood supply chain.
We design, manufacture and market automated systems for the collection, processing and surgical salvage of donor and patient blood, including the single-use disposables used with our systems and related information services and data management software. Our systems allow users to collect and process only theblood component(s) they target, plasma, platelets, or red blood cells, increasing donor and patient safety as well as collection efficiencies. Our systems consist ofproprietary disposable sets that operate on our specialized equipment. Our data management systems are used by blood collectors to improve the safety andefficiency of blood collection logistics by eliminating previously manual functions at commercial plasma and not-for-profit blood banks.
We either sell our devices to customers (resulting in equipment revenue) or place our devices with customers subject to certain conditions. When the deviceremains our property, the customer has the right to use it for a period of time as long as the customer meets certain conditions we have established, which amongother things, generally include one or more of the following:
• Purchase and consumption of a minimum level of disposable products
• Payment of monthly rental fees
• An asset utilization performance metric, such as performing a minimum level of procedures per month per device.
Our disposable revenue stream (including sales of disposables and fees for the use of our equipment) accounted for approximately 85.4% and 87.1% of ourtotal revenues for the third quarter of fiscal year 2008 and 2007, respectively and 86.2% and 88.3% of our total revenues for the first nine months of fiscal year2008 and 2007, respectively.
22

Financial Summary
For the three months ended
For the nine months ended
(in thousands, except per sharedata)
December 29,2007
December 30,2006
% Increase/(Decrease)
Q3FY08 vs.Q3FY07
December 29,2007
December 30,2006
% Increase/Decrease)
YTDFY08 vs.YTDFY07
Net revenues $ 134,587 $ 113,527 18.6% $ 377,701 $ 332,688 13.5%Gross profit $ 66,558 $ 56,419 18.0% $ 187,940 $ 168,953 11.2% % of net revenues 49.5% 49.7% 49.8% 50.8%
Operating income $ 19,597 $ 17,005 15.2% $ 49,990 $ 37,052 34.9% % of net revenues 14.6% 15.0% 13.2% 11.1%
Interest expense $ 7 $ (342) (102.0)%$ (353) $ (1,187) (70.3)%Interest income $ 1,063 $ 1,925 (44.8)%$ 4,390 $ 5,902 (25.6)%Other income, net $ 225 $ 816 (72.4)%$ 1,905 $ 2,153 (11.5)%
Income before taxes $ 20,892 $ 19,404 7.7% $ 55,932 $ 43,920 27.4%
Provision for income tax $ 6,538 $ 2,503 161.3% $ 17,733 $ 14,595 21.5% % of pre-tax income 31.3% 12.9% 31.7% 33.2%
Net income $ 14,354 $ 16,902 (15.1)%$ 38,199 $ 29,324 30.3% % of net revenues 10.7% 14.9% 10.1% 8.8%
Earnings per share—diluted $ 0.543 $ 0.620 (12.4)%$ 1.427 $ 1.060 34.6%
Net revenues increased 18.6% and 13.5%, respectively for the third quarter and the first nine months of fiscal year 2008 over the comparable period of fiscalyear 2007. The effects of foreign exchange accounted for an increase of 4.2% and 1.1% for the third quarter and the first nine months, respectively. The remainingincrease of 14.3% for the quarter and 12.6% for the first nine months is mainly due to increases in our disposables revenue, software revenues and equipmentsales. The increase in disposable revenue for the quarter resulted primarily from disposable unit increases across all of our Donor and Patient product lines, andreflects the acquired Haemoscope business which took place in the current quarter. The software growth was due to organic growth, the acquisition of IDM, Inc.which took place in Q4FY07.
Gross profit increased 18.0% and 11.2%, respectively for the third quarter and the first nine months of fiscal year 2008 over the comparable period of fiscalyear 2007. The favorable effects of foreign exchange accounted for an increase of 4.7% for the quarter. Foreign exchange had no impact on the increase in grossprofit for the nine month period. The remaining increase of 13.0% for the quarter and 11.5% for the first nine months was due primarily to increased sales offsetpartly by changes in product mix.
Operating income increased 15.2% and 34.9%, respectively for the third quarter and the first nine months of fiscal year 2008 over the comparable period offiscal year 2007. The favorable effects of foreign exchange accounted for an increase of operating income of 6.1% for the quarter and a decrease of 10.0% for thefirst nine months. Without the effects of foreign exchange operating income increased 8.3% for the quarter and 43.4% for the first nine months. These increaseswere a result of the gross profit changes described above offset by higher operating expenses of 12.3% which are largely related to the acquisistions of IDM andHaemoscope and to increases in ERP spending as we achieved our major go live milestones and for three nine months ended and in process research anddevelopment charge of $9.1 million taken in the second quarter of fiscal 2007 in connection with the acquisition of Arryx, Inc., and
23
Net income decreased 15.1% for the third quarter and increased 30.3% for the first nine months of fiscal year 2008 over the comparable period of fiscal year2007. The main factors that affected net income were the increases in operating income due to the reasons mentioned above and to a lower tax rate.
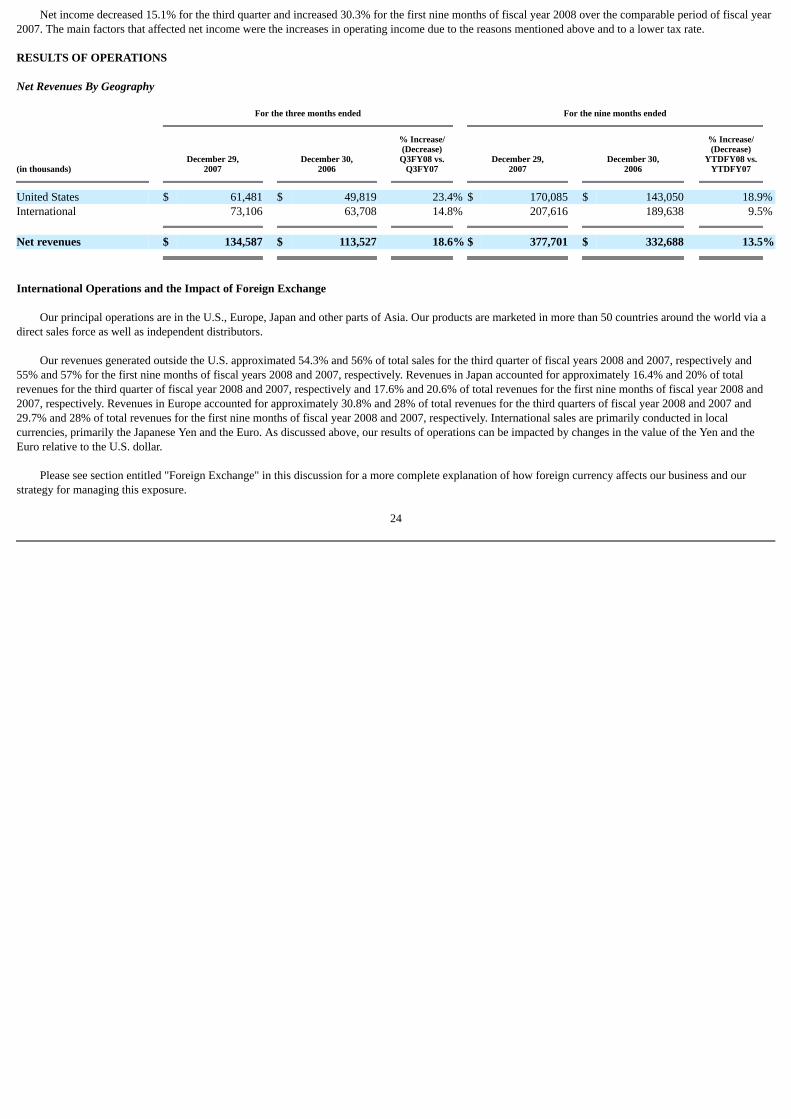
RESULTS OF OPERATIONS
Net Revenues By Geography
For the three months ended
For the nine months ended
(in thousands)
December 29,2007
December 30,2006
% Increase/(Decrease)
Q3FY08 vs.Q3FY07
December 29,2007
December 30,2006
% Increase/(Decrease)
YTDFY08 vs.YTDFY07
United States $ 61,481 $ 49,819 23.4% $ 170,085 $ 143,050 18.9%International 73,106 63,708 14.8% 207,616 189,638 9.5% Net revenues $ 134,587 $ 113,527 18.6% $ 377,701 $ 332,688 13.5%
International Operations and the Impact of Foreign Exchange
Our principal operations are in the U.S., Europe, Japan and other parts of Asia. Our products are marketed in more than 50 countries around the world via adirect sales force as well as independent distributors.
Our revenues generated outside the U.S. approximated 54.3% and 56% of total sales for the third quarter of fiscal years 2008 and 2007, respectively and55% and 57% for the first nine months of fiscal years 2008 and 2007, respectively. Revenues in Japan accounted for approximately 16.4% and 20% of totalrevenues for the third quarter of fiscal year 2008 and 2007, respectively and 17.6% and 20.6% of total revenues for the first nine months of fiscal year 2008 and2007, respectively. Revenues in Europe accounted for approximately 30.8% and 28% of total revenues for the third quarters of fiscal year 2008 and 2007 and29.7% and 28% of total revenues for the first nine months of fiscal year 2008 and 2007, respectively. International sales are primarily conducted in localcurrencies, primarily the Japanese Yen and the Euro. As discussed above, our results of operations can be impacted by changes in the value of the Yen and theEuro relative to the U.S. dollar.
Please see section entitled "Foreign Exchange" in this discussion for a more complete explanation of how foreign currency affects our business and ourstrategy for managing this exposure.
24
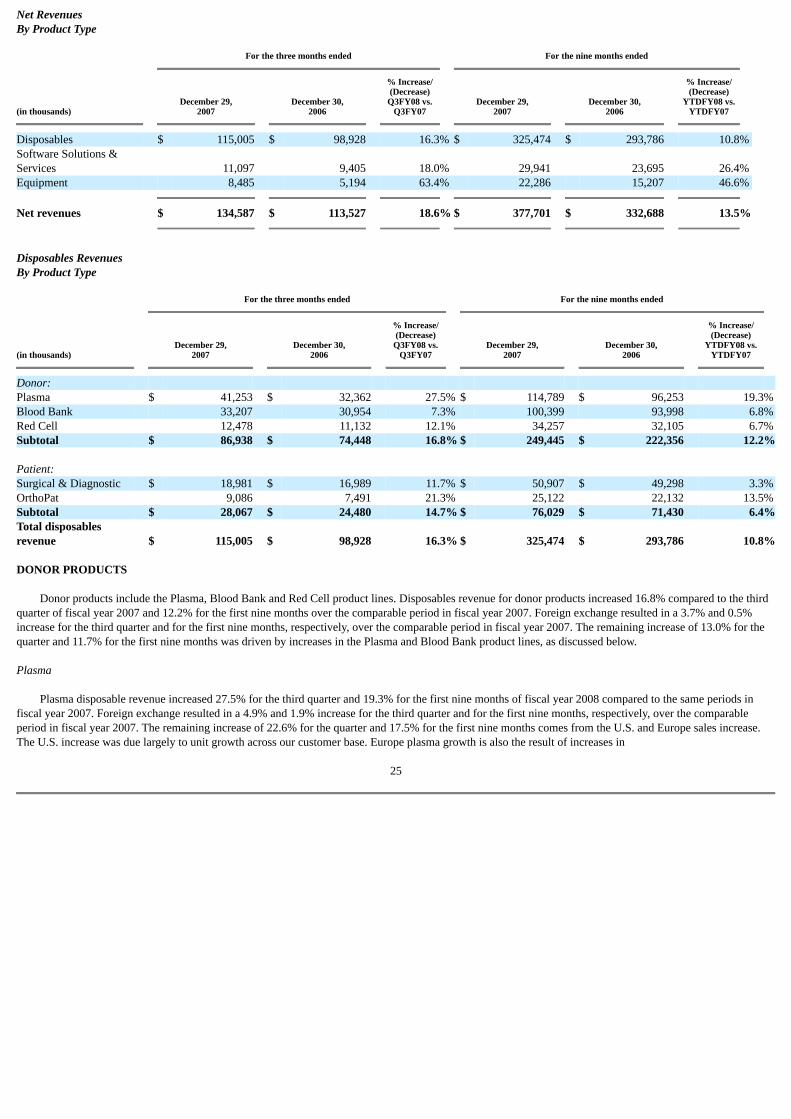
Net RevenuesBy Product Type
For the three months ended
For the nine months ended
(in thousands)
December 29,2007
December 30,2006
% Increase/(Decrease)
Q3FY08 vs.Q3FY07
December 29,2007
December 30,2006
% Increase/(Decrease)
YTDFY08 vs.YTDFY07
Disposables $ 115,005 $ 98,928 16.3% $ 325,474 $ 293,786 10.8%Software Solutions &Services 11,097 9,405 18.0% 29,941 23,695 26.4%Equipment 8,485 5,194 63.4% 22,286 15,207 46.6% Net revenues $ 134,587 $ 113,527 18.6% $ 377,701 $ 332,688 13.5%
Disposables RevenuesBy Product Type
For the three months ended
For the nine months ended
(in thousands)
December 29,2007
December 30,2006
% Increase/(Decrease)
Q3FY08 vs.Q3FY07
December 29,2007
December 30,2006
% Increase/(Decrease)
YTDFY08 vs.YTDFY07
Donor: Plasma $ 41,253 $ 32,362 27.5% $ 114,789 $ 96,253 19.3%Blood Bank 33,207 30,954 7.3% 100,399 93,998 6.8%Red Cell 12,478 11,132 12.1% 34,257 32,105 6.7%Subtotal $ 86,938 $ 74,448 16.8% $ 249,445 $ 222,356 12.2%
Patient: Surgical & Diagnostic $ 18,981 $ 16,989 11.7% $ 50,907 $ 49,298 3.3%OrthoPat 9,086 7,491 21.3% 25,122 22,132 13.5%Subtotal $ 28,067 $ 24,480 14.7% $ 76,029 $ 71,430 6.4%Total disposablesrevenue $ 115,005 $ 98,928 16.3% $ 325,474 $ 293,786 10.8%
DONOR PRODUCTS
Donor products include the Plasma, Blood Bank and Red Cell product lines. Disposables revenue for donor products increased 16.8% compared to the thirdquarter of fiscal year 2007 and 12.2% for the first nine months over the comparable period in fiscal year 2007. Foreign exchange resulted in a 3.7% and 0.5%increase for the third quarter and for the first nine months, respectively, over the comparable period in fiscal year 2007. The remaining increase of 13.0% for thequarter and 11.7% for the first nine months was driven by increases in the Plasma and Blood Bank product lines, as discussed below.
Plasma
Plasma disposable revenue increased 27.5% for the third quarter and 19.3% for the first nine months of fiscal year 2008 compared to the same periods infiscal year 2007. Foreign exchange resulted in a 4.9% and 1.9% increase for the third quarter and for the first nine months, respectively, over the comparableperiod in fiscal year 2007. The remaining increase of 22.6% for the quarter and 17.5% for the first nine months comes from the U.S. and Europe sales increase.The U.S. increase was due largely to unit growth across our customer base. Europe plasma growth is also the result of increases in
25

collections by our customers as the demand for source plasma strengthened, as well as the new business established with Octapharma Europe and HemaAG.
Blood Bank
Blood bank disposable revenue for donor products increased 7.3% and 6.8%, respectively, for the third quarter and the first nine months of fiscal year 2008compared to the same periods in of fiscal year 2007. Foreign exchange resulted in a 2.9% increase in blood bank disposables revenue during the quarter and a0.9% decrease in the first nine months over the comparable period in fiscal year 2007.
Without the effect of currency, blood bank revenue increased 4.3% for the quarter and 7.7% for the first nine months over fiscal year 2007. In the quarter andthe first nine months, Europe, Asia and Japan account for the increase. The increase in Europe is distributed across most of our markets. The Asia sales increase islargely in China as our business there moves from distribution sales to direct sales amid stronger market conditions for platelets. The Japan increase is largely dueto a price increase.
Red Cell
Red Cell disposable revenue increased 12.1% compared to the third quarter of fiscal year 2007 and 6.7% compared to the first nine months of fiscal year2007. Foreign exchange accounted for an increase of 2.5% in the quarter and 0.7% for the first nine months over the comparable period in fiscal year 2007. Of theremaining increase of 9.7% for the quarter and 6.0% for the first nine months, it is split between Europe and the U.S.
PATIENT PRODUCTS
The patient product line includes the following brand platforms: the Cell Saver® brand, the newly acquired Haemoscope products and the OrthoPAT®brand. Patient disposables revenue increased 14.7% compared to the third quarter of fiscal year 2007 and 6.4% compared to the first nine months of fiscal year2007. Foreign exchange resulted in a 4.0% and 1.5% increase in patient disposables revenue during the quarter and the first nine months, respectively. Theremaining increase of 10.7% for the quarter and 5.0% for the first nine months was the result of increases in OrthoPAT product lines, as discussed below.
Surgical & Diagnostic
Surgical disposables and diagnostic revenue increased 11.7% as compared to the third quarter of fiscal year 2007 and 3.3% as compared to the first ninemonths of fiscal 2007. Foreign exchange resulted in a 4.5% increase in surgical and diagnostic disposable revenue during the quarter and a 1.6% increase for thefirst nine months. Surgical and diagnstic disposables revenue consists principally of Cell Saver products and the newly acquired Haemoscope products. Withoutthe effect of currency, surgical disposables and diagnostic revenue increased 7.3% for the quarter and 1.7% for the first nine months. The increase for the quarterand the first nine months largely comes from the acquisition of Haemoscope during the current quarter and sales gains in Europe.
OrthoPAT
OrthoPAT disposables revenue increased 21.3% as compared to the third quarter of fiscal year 2007 and 13.5% for the first nine months of fiscal 2007.Foreign exchange resulted in a 3.0% increase in OrthoPAT disposables revenue during the quarter and a 1.2% increase in OrthoPAT disposables revenue for thefirst nine months. Without foreign exchange, revenues increased by 18.5% for the quarter and 12.4% for the first nine months. Growth was largely in the U.S. andEurope. The sales increase in the U.S. is attributable to unit growth in both existing sites and new accounts. Europe's growth is attributed to sales initiativesfocused on the penetration of this technology.
26
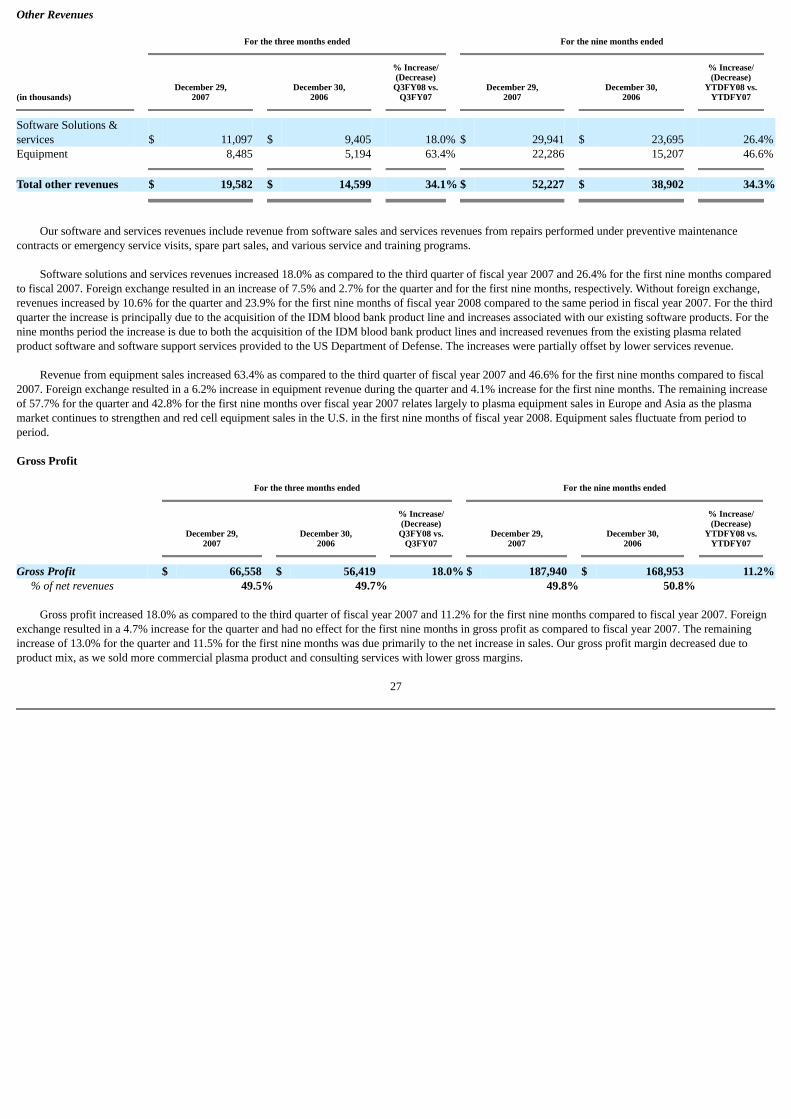
Other Revenues
For the three months ended
For the nine months ended
(in thousands)
December 29,2007
December 30,2006
% Increase/(Decrease)
Q3FY08 vs.Q3FY07
December 29,2007
December 30,2006
% Increase/(Decrease)
YTDFY08 vs.YTDFY07
Software Solutions &services $ 11,097 $ 9,405 18.0% $ 29,941 $ 23,695 26.4%Equipment 8,485 5,194 63.4% 22,286 15,207 46.6% Total other revenues $ 19,582 $ 14,599 34.1% $ 52,227 $ 38,902 34.3%
Our software and services revenues include revenue from software sales and services revenues from repairs performed under preventive maintenancecontracts or emergency service visits, spare part sales, and various service and training programs.
Software solutions and services revenues increased 18.0% as compared to the third quarter of fiscal year 2007 and 26.4% for the first nine months comparedto fiscal 2007. Foreign exchange resulted in an increase of 7.5% and 2.7% for the quarter and for the first nine months, respectively. Without foreign exchange,revenues increased by 10.6% for the quarter and 23.9% for the first nine months of fiscal year 2008 compared to the same period in fiscal year 2007. For the thirdquarter the increase is principally due to the acquisition of the IDM blood bank product line and increases associated with our existing software products. For thenine months period the increase is due to both the acquisition of the IDM blood bank product lines and increased revenues from the existing plasma relatedproduct software and software support services provided to the US Department of Defense. The increases were partially offset by lower services revenue.
Revenue from equipment sales increased 63.4% as compared to the third quarter of fiscal year 2007 and 46.6% for the first nine months compared to fiscal2007. Foreign exchange resulted in a 6.2% increase in equipment revenue during the quarter and 4.1% increase for the first nine months. The remaining increaseof 57.7% for the quarter and 42.8% for the first nine months over fiscal year 2007 relates largely to plasma equipment sales in Europe and Asia as the plasmamarket continues to strengthen and red cell equipment sales in the U.S. in the first nine months of fiscal year 2008. Equipment sales fluctuate from period toperiod.
Gross Profit
For the three months ended
For the nine months ended
December 29,2007
December 30,2006
% Increase/(Decrease)
Q3FY08 vs.Q3FY07
December 29,2007
December 30,2006
% Increase/(Decrease)
YTDFY08 vs.YTDFY07
Gross Profit $ 66,558 $ 56,419 18.0% $ 187,940 $ 168,953 11.2% % of net revenues 49.5% 49.7% 49.8% 50.8%
Gross profit increased 18.0% as compared to the third quarter of fiscal year 2007 and 11.2% for the first nine months compared to fiscal year 2007. Foreignexchange resulted in a 4.7% increase for the quarter and had no effect for the first nine months in gross profit as compared to fiscal year 2007. The remainingincrease of 13.0% for the quarter and 11.5% for the first nine months was due primarily to the net increase in sales. Our gross profit margin decreased due toproduct mix, as we sold more commercial plasma product and consulting services with lower gross margins.
27

Operating Expenses
For the three months ended
For the nine months ended
(in thousands)
December 29,2007
December 30,2006
% Increase/(Decrease)
Q3FY08 vs.Q3FY07
December 29,2007
December 30,2006
% Increase/(Decrease)
YTDFY08 vs.YTDFY07
Research anddevelopment $ 5,529 $ 5,804 -4.7% $ 18,532 $ 17,345 6.8%% of net revenues 4.1% 5.1% 4.9% 5.2% Selling, general andadministrative $ 41,432 $ 33,610 23.3% $ 119,418 $ 105,483 13.2%% of net revenues 30.8% 29.6% 31.6% 31.6% In-process R&D $ 0 $ 0 $ 0 $ 9,073 -100.0%Total OperatingExpenses $ 46,961 $ 39,414 $ 137,950 $ 131,901 % of net revenues 34.9% 34.7% 36.5% 39.6%
Research and Development
Research and development expenses decreased 4.7% as compared to current quarter of fiscal year 2007 and increased 6.8% for the first nine months ascompared to fiscal year 2007. The significant factors in the increase during the first nine months related to Arryx and IDM, acquisitions that took place in secondquarter and fourth quarter of fiscal year 2007, respectively. The decrease in the quarter is a result of lower spending in certain core technology projects.
Selling, General and Administrative
During the third quarter of fiscal year 2008, selling, general and administrative expenses increased 23.3% and 13.5% for the first nine months. Foreignexchange resulted in a 4.8% increase in selling, general and administrative during the quarter and a 3.1% increase during the first nine months. Excluding theimpact of foreign exchange, selling, general and administrative expense increased 18.7% for the third quarter and 10.5% for the first nine months as compared tothe comparable period in fiscal year 2007. The increase was due largely to the acquisition of IDM and Haemoscope and phase I ERP expenses of $1.6 million forthe quarter relating to internal personnel and third party consulting costs and training along with selling, marketing and handling costs to support the 13.5%increase in sales.
In Process Research and Development
Purchased Research and Development
The $9.1 million purchased research and development that was charged to operating expenses during the second quarter of fiscal year 2007 in connectionwith the acquisition of Arryx, Inc. It relates to an in process research and development project for the advancement and development of the technology in theblood collection and testing applications, and for licensing the technology outside of the blood collection and testing marketplace. The project includes work toreduce the size of the technology, including reducing the size of the laser, and developing mechanisms to label samples and collections.
For purposes of valuing the acquired purchased research development, the Company estimated total costs to complete the current development of a platformof approximately $11.0 million. For the in-process project the Company acquired in connection with the acquisition of Arryx, Inc., it used a risk-adjusted discountrate of 29% to discount the projected cash flows. The Company believes that the
28

estimated purchased research and development amounts so determined represent the fair value at the date of acquisition and do not exceed the amount a thirdparty would pay for the projects.
Operating Income
For the three months ended
For the nine months ended
(in thousands)
December 29,2007
December 30,2006
(Decrease)Q3FY08 vs.
Q3FY07
December 29,2007
December 30,2006
% IncreaseYTDFY08 vs.
YTDFY07
Operating income $ 19,597 $ 17,005 15.2% $ 49,990 $ 37,052 34.9%% of net revenues 14.6% 15.0% 13.2% 11.1%
Operating income increased 15.2% and 34.9%, respectively, as compared to the third quarter and first nine months of fiscal year 2007. Foreign exchangeresulted in a 6.1% increase in operating income during the quarter and 10.0% decrease during the first nine months. Without the effects of foreign currency,operating income increased 8.3% for the quarter and 43.4% for the first nine months due primarily to sales and gross profit growth, the reduction in the in-processresearch and development charge as described above, partially offset by increases in operating expenses.
Other income, net
For the three months ended
For the nine months ended
(in thousands)
December 29,2007
December 30,2006
% Increase/(Decrease)
Q3FY08 vs.Q3FY07
December 29,2007
December 30,2006
% Increase/(Decrease)
YTDFY08 vs.YTDFY07
Interest Income, net 1,070 1,583 4,037 4,715 Other income, net 225 816 1,905 2,153 Total other income, net $ 1,295 $ 2,399 -46.0% $ 5,942 $ 6,868 -13.5%
Total other income, net decreased 46% during the third quarter of fiscal year 2008 as compared to the third quarter of fiscal year 2007 and decreased 13.5%during the nine month periods of fiscal year 2008 as compared to the nine month periods of fiscal year 2007 due (i) to the net of the decrease in interest incomedue to lower invested cash resulting from the Company's share repurchase programs in fiscal years 2007 and 2008 and the acquisition of Haemoscope's TEG®Thrombelastograph® Hemostasis Analyzer business, and (ii) decrease in interest expense due to lower average fixed rate debt outstanding, and (iii) a decrease inother income associated with hedge points and an increase in foreign exchange transaction losses.
Income Taxes
For the three months ended
For the nine months ended
December 29,2007
December 30,2006
% Increase/(Decrease)
Q3FY08 vs.Q3FY07
December 29,2007
December 30,2006
% Increase/(Decrease)
YTDFY08 vs.YTDFY07
Reported Income Tax Rate 31.3% 12.9% 18.4% 31.7% 33.2% -1.5%
Our reported tax rate includes two principal components: an expected annual tax rate and discrete items that are recorded in the quarter that an event arises.Events or items that give rise to discrete recognition include finalizing audit examinations for open tax years, a statute of limitation's expiration, and a stockacquisition.
29

The reported tax rate was 31.3% and 12.9% for the three month periods ended December 29, 2007 and December 30, 2006. The reported tax rate was 31.7%and 33.2% for the nine month periods ended December 29, 2007 and December 30, 2006.
For the three months ended December 29, 2007, the reported tax rate includes a 35.1% expected annual tax rate. The reported income tax also includes twodiscrete items: a reduction in tax reserves associated with the expiration of the statute of limitations, partly offset by additional income taxes associated with thefinalization of certain income tax returns for FY07 in the amount of $1.0 million. The income tax rate for the three months ended December 30, 2006, reflectedthe settlement of a tax audit.
For the nine months ended December 29, 2007, the reported tax rate includes a 35.1% expected annual tax rate. The reported income tax rate also includesseveral discrete items, among them: a reduction in tax reserves associated with the expiration of the statute of limitations in several jurisdictions, $0.4 million inforeign tax credits associated with certain dividends, partly offset by additional income taxes associated with the finalization of certain income tax returns in theamount of $1.8 million. The income tax rate for the three months ended December 30, 2006, reflected the settlement of a tax audit.
We expect our annual tax rate to be approximately 35.1% for the remainder of fiscal year 2008. Our full year reported tax rate is expected to be lower orbetween 32% and 33% as a result of the discrete items discussed above.
We adopted the provisions of FASB Interpretation No. 48, "Accounting for Uncertainty in Income Taxes"—an Interpretation of FASB Statement 109,(FIN 48) effective April 1, 2007. FIN 48 provides a comprehensive model for the financial statement recognition, measurement, presentation and disclosure ofuncertain tax positions taken or expected to be taken in income tax returns. Unrecognized tax benefits represent tax positions for which reserves have beenestablished.
As of April 1, 2007, our unrecognized tax benefits totaled approximately $6.5 million which, if recognized, would favorably affect our effective tax rate infuture periods. No adjustment was made to the liability for unrecognized tax benefits as of April 1,2007 or December 29, 2007 or current year's tax provision inconnection with the adoption of FIN48. Each year the statute of limitations for income tax returns filed in various jurisdictions closes, sometimes withoutadjustments. During the nine months ended December 29, 2007 our unrecognized tax benefits were reduced by $2.0 million as a result of the expiration of thestatute of limitations in several jurisdictions. This was offset in part by the establishment of reserves of $0.5 million for various matters including interest. Totalunrecognized tax benefits on December 29, 2007 were $5.2 million.
Our historic practice has been and continues to be to recognize interest and penalties related to Federal, state, and foreign income tax matters in income taxexpense. Approximately $0.8 million and $0.7 million is accrued for interest at December 29, 2007 and March 31, 2007, respectively.
We conduct business globally and, as a result, file consolidated and separate Federal, state, and foreign income tax returns in multiple jurisdictions. In thenormal course of business, we are subject to examination by taxing authorities throughout the world in jurisdictions including the U.S., Japan, Germany, France,the United Kingdom, and Switzerland. With few exceptions, we are no longer subject to U.S. federal, state and local, or foreign income tax examinations for yearsbefore 2005.
30
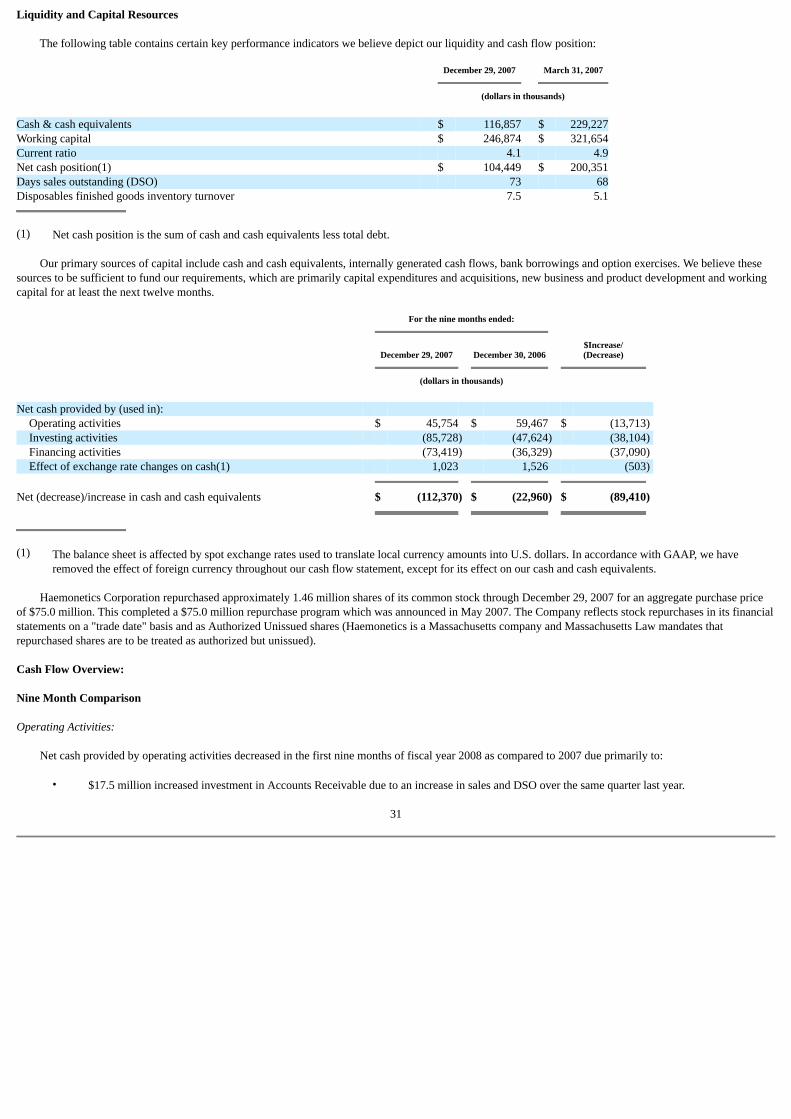
Liquidity and Capital Resources
The following table contains certain key performance indicators we believe depict our liquidity and cash flow position:
December 29, 2007
March 31, 2007
(dollars in thousands)
Cash & cash equivalents $ 116,857 $ 229,227Working capital $ 246,874 $ 321,654Current ratio 4.1 4.9Net cash position(1) $ 104,449 $ 200,351Days sales outstanding (DSO) 73 68Disposables finished goods inventory turnover 7.5 5.1
(1) Net cash position is the sum of cash and cash equivalents less total debt.
Our primary sources of capital include cash and cash equivalents, internally generated cash flows, bank borrowings and option exercises. We believe thesesources to be sufficient to fund our requirements, which are primarily capital expenditures and acquisitions, new business and product development and workingcapital for at least the next twelve months.
For the nine months ended:
December 29, 2007
December 30, 2006
$Increase/(Decrease)
(dollars in thousands)
Net cash provided by (used in): Operating activities $ 45,754 $ 59,467 $ (13,713) Investing activities (85,728) (47,624) (38,104) Financing activities (73,419) (36,329) (37,090) Effect of exchange rate changes on cash(1) 1,023 1,526 (503) Net (decrease)/increase in cash and cash equivalents $ (112,370) $ (22,960) $ (89,410)
(1) The balance sheet is affected by spot exchange rates used to translate local currency amounts into U.S. dollars. In accordance with GAAP, we haveremoved the effect of foreign currency throughout our cash flow statement, except for its effect on our cash and cash equivalents.
Haemonetics Corporation repurchased approximately 1.46 million shares of its common stock through December 29, 2007 for an aggregate purchase priceof $75.0 million. This completed a $75.0 million repurchase program which was announced in May 2007. The Company reflects stock repurchases in its financialstatements on a "trade date" basis and as Authorized Unissued shares (Haemonetics is a Massachusetts company and Massachusetts Law mandates thatrepurchased shares are to be treated as authorized but unissued).
Cash Flow Overview:
Nine Month Comparison
Operating Activities:
Net cash provided by operating activities decreased in the first nine months of fiscal year 2008 as compared to 2007 due primarily to:
• $17.5 million increased investment in Accounts Receivable due to an increase in sales and DSO over the same quarter last year.
31

• $4.0 million decrease in Inventory due to the higher level of sales. We plan to increase our investment in inventory in the near term.
• The payment of refundable VAT associated with the formation of our European shared services center of $4.2 million
Investing Activities:
Net cash used in investing activities increased during the first nine months of fiscal year 2008 as compared to 2007 due primarily to:
• $46.4 million in cash used for acquisitions during the first nine months of fiscal year 2008 compared to $23.2 million used in the same period infiscal 2007.
• $15.5 million of increased capital expenditures predominatly related to the increase in the installed base of devices and investments in our ERPsystem.
Financing Activities:
Net cash used by financing activities increased by $37.0 million, primarily due to share repurchases.
• $75 million used to repurchase shares of Company common stock in for the first nine months of fiscal 2008 as compared to the $40.0 million usedin the same period in fiscal 2007.
Inflation
We do not believe that inflation had a significant impact on our results of operations for the periods presented. Historically, we believe we have been able tomitigate the effects of inflation by improving our manufacturing and purchasing efficiencies, by increasing employee productivity and by adjusting the sellingprices of products.
Foreign Exchange
Approximately 55.0% of our sales are generated outside the U.S. in local currencies, yet our reporting currency is the U.S. dollar. Our primary foreigncurrency exposures in relation to the U.S. dollar are the Japanese Yen and the Euro. Foreign exchange risk arises because we engage in business in foreigncountries in local currency. Exposure is partially mitigated by producing and sourcing product in local currency and expenses incurred by local sales offices.However, whenever the U.S. dollar strengthens relative to the other major currencies, there is an adverse affect on our results of operations and alternatively,whenever the U.S. dollar weakens relative to the other major currencies there is a positive effect on our results of operations.
It is our policy to minimize for a period of time, the unforeseen impact on our financial results of fluctuations in foreign exchange rates by using derivativefinancial instruments known as forward contracts to hedge the anticipated cash flows from forecasted foreign currency denominated sales. Hedging through theuse of forward contracts does not eliminate the volatility of foreign exchange rates, but because we generally enter into forward contracts one year out, rates arefixed for a one-year period, thereby facilitating financial planning and resource allocation. We enter into forward contracts that mature one month prior to theanticipated timing of the forecasted foreign currency denominated sales. These contracts are designated as cash flow hedges and are intended to lock in theexpected cash flows of forecasted foreign currency denominated sales at the available spot rate. Actual spot rate gains and losses on these contracts are recordedin sales, at the same time the underlying transactions being hedged are recorded.
We compute a composite rate index for purposes of measuring, comparatively, the change in foreign currency hedge spot rates from the hedge spot rates ofthe corresponding period in the prior
32

year. The relative value of currencies in the index is weighted by sales in those currencies. The composite was set at 1.00 based upon the weighted rates atMarch 31, 1997. The composite rate is presented in the period corresponding to the maturity of the underlying forward contracts.
The favorable or (unfavorable) changes are in comparison to the same period of the prior year. A favorable change is presented when we will obtainrelatively more U.S. dollars for each of the underlying foreign currencies than we did in the prior period. An unfavorable change is presented when we obtainrelatively fewer U.S. dollars for each of the underlying foreign currencies than we did in the prior period. These indexed hedge rates impact sales, and as a resultalso gross profit, operating income and net income, in our consolidated financial statements. The final impact of currency
33

fluctuations on the results of operations is dependent on the local currency amounts hedged and the actual local currency results.
Composite IndexHedge Spot Rates
Favorable/(Unfavorable)Change versus Prior Year
FY2003 Q1 1.09 (8.9)% Q2 1.08 (10.3)% Q3 1.10 (8.1)% Q4 1.17 (11.0)% 2003 Total 1.11 (9.5)%
FY2004 Q1 1.13 (3.6)% Q2 1.05 3.6% Q3 1.06 3.2% Q4 1.01 15.9% 2004 Total 1.06 4.9%
FY2005 Q1 0.97 15.7% Q2 0.99 5.1% Q3 0.92 15.5% Q4 0.89 14.1% 2005 Total 0.94 12.7%
FY2006 Q1 0.92 5.2% Q2 0.91 9.1% Q3 0.87 5.7% Q4 0.86 2.8% 2006 Total 0.89 5.1%
FY2007 Q1 0.89 3.6% Q2 0.92 (1.1)% Q3 0.96 (9.4)% Q4 0.95 (9.3)% 2007 Total 0.93 (4.2)%
FY2008 Q1 0.92 (3.1)% Q2 0.93 (1.0)% Q3 0.93 3.3% Q4 0.93 2.4% 2008 Total 0.93 0.4%
FY2009 Q1 0.92 0.5% Q2 0.90 3.4% Q3 0.86 8.3% Q4 0.83* 12.1%
NOTE: * Represents hedges through January FY09 only.
Recent Accounting Pronouncements
In December 2007, the FASB issued SFAS No. 141 (revised 2007), "Business Combinations" ("SFAS 141(R)"). In SFAS 141(R), the FASB retained thefundamental requirements of Statement No. 141 to account for all business combinations using the acquisition method (formerly the purchase
34

method) and for an acquiring entity to be identified in all business combinations. However, the new standard requires the acquiring entity in a businesscombination to recognize all (and only) the assets acquired and liabilities assumed in the transaction; establishes the acquisition-date fair value as themeasurement objective for all assets acquired and liabilities assumed; and requires the acquirer to disclose to investors and other users all of the information theyneed to evaluate and understand the nature and financial effect of the business combination. SFAS 141(R) is effective for annual periods beginning on or afterDecember 15, 2008. We are currently evaluating the potential impact of FASB No. 141(R) on our financial position and results of operations. This statement iseffective for our fiscal year 2010.
In December 2007, the FASB issued FASB No. 160 "Noncontrolling Interests in Consolidated Financial Statements—an amendment of ARB No.51" ofwhich the objective is to improve the relevance, comparability, and transparency of the financial information that a reporting entity provides in its consolidatedfinancial statements by establishing accounting and reporting standards by requiring all entities to report noncontrolling (minority) interests in subsidiaries in thesame way—as equity in the consolidated financial statements. Moreover, Statement 160 eliminates the diversity that currently exists in accounting fortransactions between an entity and noncontrolling interests by requiring they be treated as equity transactions. FASB No. 160 is effective for annual periodsbeginning on or after December 15, 2008. We are currently evaluating the potential impact of FASB No. 160 on our financial position and results of operations.This statement is effective for our fiscal year 2010.
In February 2007, the FASB issued FAS No. 159, "The Fair Value Option for Financial Assets and Financial Liabilities-Including an amendment of FASBStatement No. 115" ("FAS No. 159"). The new statement allows entities to choose, at specified election dates, to measure eligible financial assets and liabilities atfair value that are not otherwise required to be measured at fair value. If a company elects the fair value option for an eligible item, changes in that item's fairvalue in subsequent reporting periods must be recognized in current earnings. FAS No. 159 is effective for fiscal years beginning after November 15, 2007. Weare currently evaluating the potential impact of FAS No. 159 on our financial position and results of operations. This statement is effective for our fiscal year2009.
In September 2006, the FASB issued FAS No. 157, "Fair Value Measurements" ("FAS No. 157"), which addresses how companies should measure fair valuewhen they are required to use a fair value measure for recognition or disclosure purposes under generally accepted accounting principles. FAS No. 157 definesfair value, establishes a framework for measuring fair value in generally accepted accounting principles and expands disclosures about fair value measurements.FAS No. 157 is effective for financial statements issued for fiscal years beginning after November 15, 2007 and should be applied prospectively, except in thecase of a limited number of financial instruments that require retrospective application. We are currently evaluating the potential impact of FAS No. 157 on ourfinancial position and results of operations. This statement is effective for our fiscal year 2009.
Cautionary Statement Regarding Forward-Looking Information
Statements contained in this report, as well as oral statements we make which are prefaced with the words "may," "will," "expect," "anticipate," "continue,""estimate," "project," "intend," "designed," and similar expressions, are intended to identify forward looking statements regarding events, conditions, andfinancial trends that may affect our future plans of operations, business strategy, results of operations, and financial position. These statements are based on ourcurrent expectations and estimates as to prospective events and circumstances about which we can give no firm assurance. Further, any forward-looking statementspeaks only as of the date on which such statement is made, and we undertake no obligation to update any forward-looking statement to reflect events orcircumstances after the date on which such statement is made. As it is not possible to predict every new factor that may emerge, forward-looking statementsshould not be relied upon as a prediction of our actual future financial condition or results. These forward-looking statements, like any forward-
35

looking statements, involve risks and uncertainties that could cause actual results to differ materially from those projected or anticipated. Such risks anduncertainties include technological advances in the medical field and our standards for transfusion medicine and our ability to successfully implement productsthat incorporate such advances and standards, product demand and market acceptance of our products, regulatory uncertainties, the effect of economic andpolitical conditions, the impact of competitive products and pricing, the impact of industry consolidation, foreign currency exchange rates, changes in customers'ordering patterns, the effect of industry consolidation as seen in the Plasma market, the effect of communicable diseases and the effect of uncertainties in marketsoutside the U.S. (including Europe and Asia) in which we operate. The foregoing list should not be construed as exhaustive.
36

ITEM 3. QUANTITATIVE AND QUALITATIVE DISCLOSURES ABOUT MARKET RISK
The Company's exposures relative to market risk are due to foreign exchange risk and interest rate risk.
FOREIGN EXCHANGE RISK
See the section entitled Foreign Exchange for a discussion of how foreign currency affects our business. It is our policy to minimize for a period of time, theunforeseen impact on our financial results of fluctuations in foreign exchange rates by using derivative financial instruments known as forward contracts to hedgeanticipated cash flows from forecasted foreign currency denominated sales. We do not use the financial instruments for speculative or trading activities. AtDecember 29, 2007, we had the following significant foreign exchange contracts to hedge the anticipated cash flows from forecasted foreign currencydenominated sales outstanding:
Hedged Currency
(BUY) / SELLLocal Currency
Weighted SpotContract Rate
Weighted ForwardContract Rate
Fair Value
Maturity
Euro 5,871,000 $ 1.310 $ 1.325 $ (730,778) Jan-Feb 2008Euro 9,080,000 $ 1.345 $ 1.358 $ (823,622) Mar-May 2008Euro 7,871,000 $ 1.370 $ 1.378 $ (536,886) Jun-Aug 2008Euro 8,000,000 $ 1.440 $ 1.440 $ (52,160) Sep-Nov 2008Japanese Yen 860,000,000 119.3 per US$ 114.3 per US$ $ (34,343) Jan-Feb 2008Japanese Yen 1,331,000,000 120.6 per US$ 115.8 per US$ $ (279,072) Mar-May 2008Japanese Yen 1,370,000,000 116.7 per US$ 112.4 per US$ $ (28,304) Jun-Aug 2008JapaneseYen 1,220,000,000 112.9 per US$ 109.2 per US$ $ 203,204 Sep-Nov2008
Total: $ (2,281,961)
We estimate the change in the fair value of all forward contracts assuming both a 10% strengthening and weakening of the U.S. dollar relative to all othermajor currencies. In the event of a 10% strengthening of the U.S. dollar, the change in fair value of all forward contracts would result in a $12.7 million increasein the fair value of the forward contracts; whereas a 10% weakening of the US dollar would result in a $13.7 million decrease in the fair value of the forwardcontracts.
INTEREST RATE RISK
All of our long-term debt is at fixed rates. Accordingly, a change in interest rates has an insignificant effect on our interest expense amounts. The fair valueof our long-term debt, however, does change in response to interest rate movements due to its fixed rate nature. These changes reflect the premium (when marketinterest rates decline below the contract fixed interest rates) or discount (when market interest rates rise above the fixed interest rate) that an investor in these longterm obligations would pay in the market interest rate environment.
At December 29, 2007, the fair value of our long-term debt was approximately $0.7 million higher than the value of the debt reflected on our financialstatements. This higher fair market is entirely related to the $7.0 million remaining principal balance of the original $10.0 million, 8.41% real estate mortgage dueJanuary, 2016.
Using scenario analysis, if the interest rate on all long-term maturities changed by 10% from the rate levels that existed at December 29, 2007 the fair valueof our long-term debt would change by approximately $0.1 million.
ITEM 4. CONTROLS AND PROCEDURES
We conducted an evaluation, as of December 29, 2007, under the supervision and with the participation of our management, including our Chief ExecutiveOfficer and Chief Financial Officer
37

(the Company's principal executive officer and principal financial officer, respectively) regarding the effectiveness of the design and operation of our disclosurecontrols and procedures as defined in Rule 13a-15 of the Securities Exchange Act of 1934 (the "Exchange Act"). Based upon that evaluation, the Chief ExecutiveOfficer and Chief Financial Officer concluded that our disclosure controls and procedures are effective.
In fiscal 2007, the Company initiated a company-wide implementation of Oracle, a global enterprise resource planning (ERP) system (see Footnote #17).During the three months ended December 29, 2007, the Company successfully completed Phase I of our implementation of Oracle in the U.S. The U.S.implementation was the final major go-live milestone of the Phase I ERP implementation. Oracle is now implemented in the U.S., Europe, Japan and Asia. TheERP implementation replaced our existing order entry, fulfillment, service and financial systems, resulting in significant changes to our business processes andtherefore our controls. These changes are intended to improve customer service and controls and reduce manual processes. As with any significant change wehave identified certain control deficiencies resulting from business process, system and user issues. The governance surrounding our implementation process isdesigned to identify and remediate issues of this nature, and includes participation from global users, functional leaders and ERP implementation leads. We havemonitoring controls in place to ensure the ongoing reliability of our financial reporting. We believe the controls, as implemented, are appropriate and functioningeffectively.
Other than the change mentioned above, no other change in the Company's internal control over financial reporting occurred during the three months endedDecember 29, 2007 that has materially affected, or is reasonably likely to materially affect, the Company's internal control over financial reporting.
38
PART II—OTHER INFORMATION
Item 1. Legal Proceedings
Not applicable
Item 1A. Risk Factors
In addition to the other information set forth in this report, careful consideration should be given to the factors discussed in Part 1, "Item 1A. Risk Factors" inthe Company's Annual Report on Form 10-K for the year ended March 31, 2007, which could materially affect the Company's business, financial condition orfuture results. The risks described in the Company's Annual Report on Form 10-K are not the only risks facing the Company. Additional risks and uncertaintiesnot currently known to the Company or that it currently deems to be immaterial also may materially adversely affect its business, financial condition and/oroperating results.
Item 2. Unregistered Sales of Equity Securities and Use of Proceeds
Not applicable.
Item 3. Defaults upon Senior Securities
Not applicable.
Item 4. Submission of Matters to a Vote of Security Holders
None
Item 5. Other Information
None
Item 6. Exhibits
31.1 Certification pursuant to Section 302 of Sarbanes-Oxley Act of 2002, of Brad Nutter, President and ChiefExecutive Officer of the Company
31.2 Certification pursuant to Section 302 of Sarbanes-Oxley of 2002, of Christopher Lindop, Vice President and ChiefFinancial Officer of the Company
32.1 Certification Pursuant to 18 United States Code Section 1350, as adopted Pursuant to Section 906 of the Sarbanes-Oxley Act of 2002, of Brad Nutter, President and Chief Executive Officer of the Company
32.2 Certification Pursuant to 18 United States Code Section 1350, as adopted Pursuant to Section 906 of the Sarbanes-Oxley Act of 2002, of Christopher Lindop, Vice President and Chief Financial Officer of the Company
39

SIGNATURES
Pursuant to the requirements of the Securities Exchange Act of 1934, the Registrant has duly caused this report to be signed on its behalf by the undersignedthereunto duly authorized.
HAEMONETICS CORPORATION
Date: February 5, 2008 By: /s/ BRAD NUTTER
Brad Nutter, President and Chief Executive Officer(Principal Executive Officer)
Date: February 5, 2008 By: /s/ CHRISTOPHER LINDOP
Christopher Lindop, Vice President and ChiefFinancial Officer (Principal Financial Officer)
40


QuickLinks -- Click here to rapidly navigate through this document
Exhibit 31.1
CERTIFICATION
I, Brad Nutter, certify that:
1. I have reviewed this quarterly report on Form 10-Q of Haemonetics Corporation;
2. Based on my knowledge, this report does not contain any untrue statement of a material fact or omit to state a material fact necessary to make thestatements made, in light of the circumstances under which such statements were made, not misleading with respect to the period covered by this report;
3. Based on my knowledge, the financial statements, and other financial information included in this quarterly report, fairly present in all material respectsthe financial condition, results of operations and cash flows of the registrant as of, and for, the periods presented in this report;
4. The registrant's other certifying officer and I are responsible for establishing and maintaining disclosure controls and procedures (as defined in ExchangeAct Rules 13a-15(e) and 15d-15(e)) and internal control over financial reporting (as defined in Exchange Act Rules 13a-15(f) and 15d-15(f)) for theregistrant and have:
a) Designed such disclosure controls and procedures, or caused such disclosure controls and procedures to be designed under our supervision, toensure that material information relating to the registrant, including its consolidated subsidiaries, is made known to us by others within thoseentities, particularly during the period in which this report is being prepared;
b) Designed such internal control over financial reporting, or caused such internal control over financial reporting to be designed under oursupervision, to provide reasonable assurance regarding the reliability of financial reporting and the preparation of financial statements for externalpurposes in accordance with generally accepted accounting principles;
c) Evaluated the effectiveness of the registrant's disclosure controls and procedures and presented in this report our conclusions about theeffectiveness of the disclosure controls and procedures as of the end of the period covered by this report based on such evaluation; and
d) Disclosed in this report any change in the registrant's internal control over financial reporting that occurred during the registrant's most recentfiscal quarter (the registrant's fourth fiscal quarter in the case of an annual report) that has materially affected, or is reasonably likely to materiallyaffect the registrant's internal control over financial reporting; and
5. The registrant's other certifying officer and I have disclosed, based on our most recent evaluation of internal control over financial reporting, to theregistrant's auditors and the audit committee of registrant's board of directors (or persons performing the equivalent functions):
a) All significant deficiencies and material weaknesses in the design or operation of internal control over financial reporting which are reasonablylikely to adversely affect the registrant's ability to record, process, summarize and report financial information; and
b) Any fraud, whether or not material, that involves management or other employees who have a significant role in the registrant's internal controlover financial reporting.
Date: February 5, 2008
/s/ BRAD NUTTER
Brad Nutter, President and ChiefExecutive Officer (Principal Executive Officer)

QuickLinks
Exhibit 31.1

QuickLinks -- Click here to rapidly navigate through this document
Exhibit 31.2
CERTIFICATION
I, Christopher Lindop, certify that:
1. I have reviewed this quarterly report on Form 10-Q of Haemonetics Corporation;
2. Based on my knowledge, this report does not contain any untrue statement of a material fact or omit to state a material fact necessary to make thestatements made, in light of the circumstances under which such statements were made, not misleading with respect to the period covered by this report;
3. Based on my knowledge, the financial statements, and other financial information included in this quarterly report, fairly present in all material respectsthe financial condition, results of operations and cash flows of the registrant as of, and for, the periods presented in this report;
4. The registrant's other certifying officer and I are responsible for establishing and maintaining disclosure controls and procedures (as defined in ExchangeAct Rules 13a-15(e) and 15d-15(e)) and internal control over financial reporting (as defined in Exchange Act Rules 13a-15(f) and 15d-15(f)) for theregistrant and have:
a) Designed such disclosure controls and procedures, or caused such disclosure controls and procedures to be designed under our supervision, toensure that material information relating to the registrant, including its consolidated subsidiaries, is made known to us by others within thoseentities, particularly during the period in which this report is being prepared;
b) Designed such internal control over financial reporting, or caused such internal control over financial reporting to be designed under oursupervision, to provide reasonable assurance regarding the reliability of financial reporting and the preparation of financial statements for externalpurposes in accordance with generally accepted accounting principles;
c) Evaluated the effectiveness of the registrant's disclosure controls and procedures and presented in this report our conclusions about theeffectiveness of the disclosure controls and procedures as of the end of the period covered by this report based on such evaluation; and
d) Disclosed in this report any change in the registrant's internal control over financial reporting that occurred during the registrant's most recentfiscal quarter (the registrant's fourth fiscal quarter in the case of an annual report) that has materially affected, or is reasonably likely to materiallyaffect the registrant's internal control over financial reporting; and
5. The registrant's other certifying officer and I have disclosed, based on our most recent evaluation of internal control over financial reporting, to theregistrant's auditors and the audit committee of registrant's board of directors (or persons performing the equivalent functions):
a) All significant deficiencies and material weaknesses in the design or operation of internal control over financial reporting which are reasonablylikely to adversely affect the registrant's ability to record, process, summarize and report financial information; and
b) Any fraud, whether or not material, that involves management or other employees who have a significant role in the registrant's internal controlover financial reporting.
Date: February 5, 2008
/s/ CHRISTOPHER LINDOP
Christopher Lindop, Vice President and ChiefFinancial Officer (Principal Financial Officer)

QuickLinks
Exhibit 31.2

QuickLinks -- Click here to rapidly navigate through this document
Exhibit 32.1
Certification Pursuant To18 USC. Section 1350,
As Adopted Pursuant ToSection 906 of the Sarbanes/Oxley Act of 2002
In connection with the Quarterly Report of Haemonetics Corporation (the "Company") on Form 10-Q for the period ending December 29, 2007 as filed withthe Securities and Exchange Commission on the date hereof (the "Report"), I, Brad Nutter, President and Chief Executive Officer of the Company, certify,pursuant to Section 1350 of Chapter 63 of Title 18, United States Code, that this Report fully complies with the requirements of Section 13(a) or 15(d) of theSecurities Exchange Act of 1934 and that the information contained in this Report fairly presents, in all material respects, the financial condition and results ofoperations of the Company.
Date: February 5, 2008
/s/ BRAD NUTTER
Brad Nutter,President and Chief Executive Officer
A signed original of this written statement required by Section 906, or other document authenticating, acknowledging, or otherwise adopting the signaturethat appears in typed form within the electronic version of this written statement required by Section 906, has been provided to Haemonetics and will be retainedby Haemonetics and furnished to the Securities and Exchange Commission or its staff upon request.

QuickLinks
Exhibit 32.1

QuickLinks -- Click here to rapidly navigate through this document
Exhibit 32.2
Certification Pursuant To18 USC. Section 1350,
As Adopted Pursuant ToSection 906 of the Sarbanes/Oxley Act of 2002
In connection with the Quarterly Report of Haemonetics Corporation (the "Company") on Form 10-Q for the period ending December 29, 2007 as filed withthe Securities and Exchange Commission on the date hereof (the "Report"), I, Christopher Lindop, Vice President and Chief Financial Officer of the Company,certify, pursuant to Section 1350 of Chapter 63 of Title 18, United States Code, that this Report fully complies with the requirements of Section 13(a) or 15(d) ofthe Securities Exchange Act of 1934 and that the information contained in this Report fairly presents, in all material respects, the financial condition and results ofoperations of the Company.
Date: February 5, 2008
/s/ CHRISTOPHER LINDOP
Christopher Lindop,Vice President and Chief Financial Officer
A signed original of this written statement required by Section 906, or other document authenticating, acknowledging, or otherwise adopting the signaturethat appears in typed form within the electronic version of this written statement required by Section 906, has been provided to Haemonetics and will be retainedby Haemonetics and furnished to the Securities and Exchange Commission or its staff upon request.

QuickLinks
Exhibit 32.2