Ground Tire Rubber (GTR) as a Stabilizer for Subgrade · PDF fileGround Tire Rubber (GTR) as a...
42
Ground Tire Rubber (GTR) as a Stabilizer for Subgrade Soils FDOT Contract Number: BDK81 977-03 Paul Cosentino, Ph.D., P.E. PI Albert Bleakley, Ph.D., P.E. PI Alex Armstrong T.J. Misilo III Amir Sajjadi David Horhota, Ph.D., P.E. PM July 31, 2014
Transcript of Ground Tire Rubber (GTR) as a Stabilizer for Subgrade · PDF fileGround Tire Rubber (GTR) as a...

Ground Tire Rubber (GTR) as
a Stabilizer for Subgrade SoilsFDOT Contract Number: BDK81 977-03
Paul Cosentino, Ph.D., P.E. PI
Albert Bleakley, Ph.D., P.E. PI
Alex Armstrong
T.J. Misilo III
Amir Sajjadi
David Horhota, Ph.D., P.E. PM
July 31, 2014

Problem Statement
GTR supplies may increase when not used
in Hot Mix
Are other highway applications possible?

Outline
Objectives
Task overview
Results

Objective
Determine the key pavement engineering
properties of GTR and stabilized Florida
subgrade soil blends

TasksTask 1 Literature Search
Task 2 Determine GTR Sources
Task 3 Determine Subgrade Sources
Task 4 Test Program Development
Task 5 Database Development
Task 6 Sampling
Task 7 Testing
Task 8 Data Reduction
Task 9 Data Analysis
Task 10 Technology Transfer

Literature SearchDensity
Decreased with increase of GTR
LBRDecreased with increase of GTR
Smaller sizes of GTR result in larger decreases of CBR/LBR
Resilient Modulus
Decreased with increase of GTR
PermeabilityIncreased slightly with maximum percentages of rubber
ConsolidationNo literature on Consolidation of granular soils was found
Creep
Minimum failure strain at ~3%
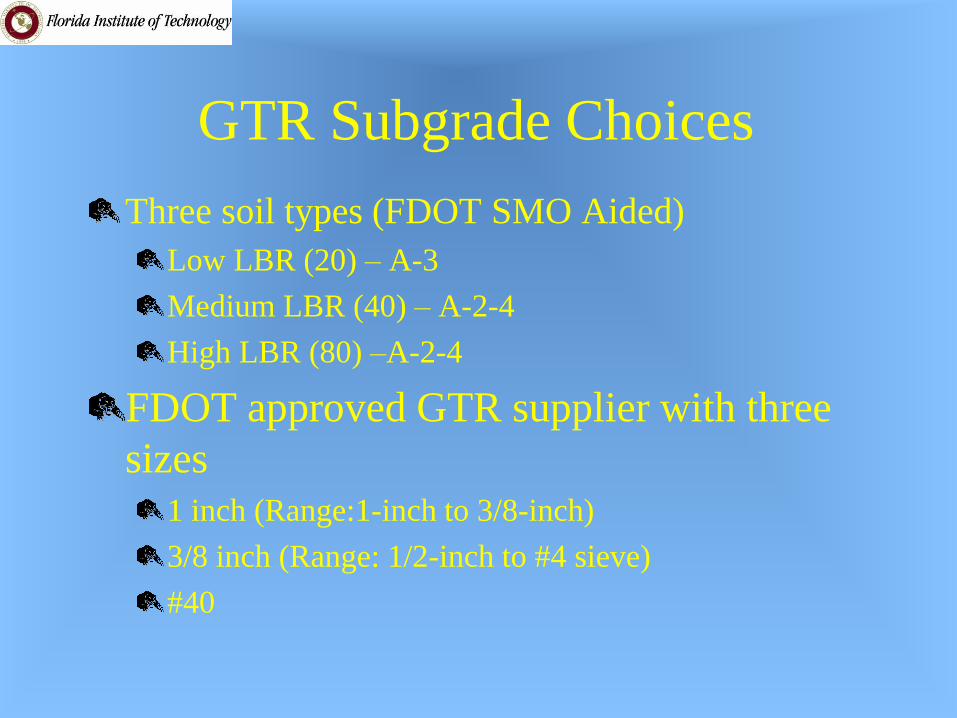
GTR Subgrade Choices
Three soil types (FDOT SMO Aided)
Low LBR (20) – A-3
Medium LBR (40) – A-2-4
High LBR (80) –A-2-4
FDOT approved GTR supplier with three
sizes1 inch (Range:1-inch to 3/8-inch)
3/8 inch (Range: 1/2-inch to #4 sieve)
#40
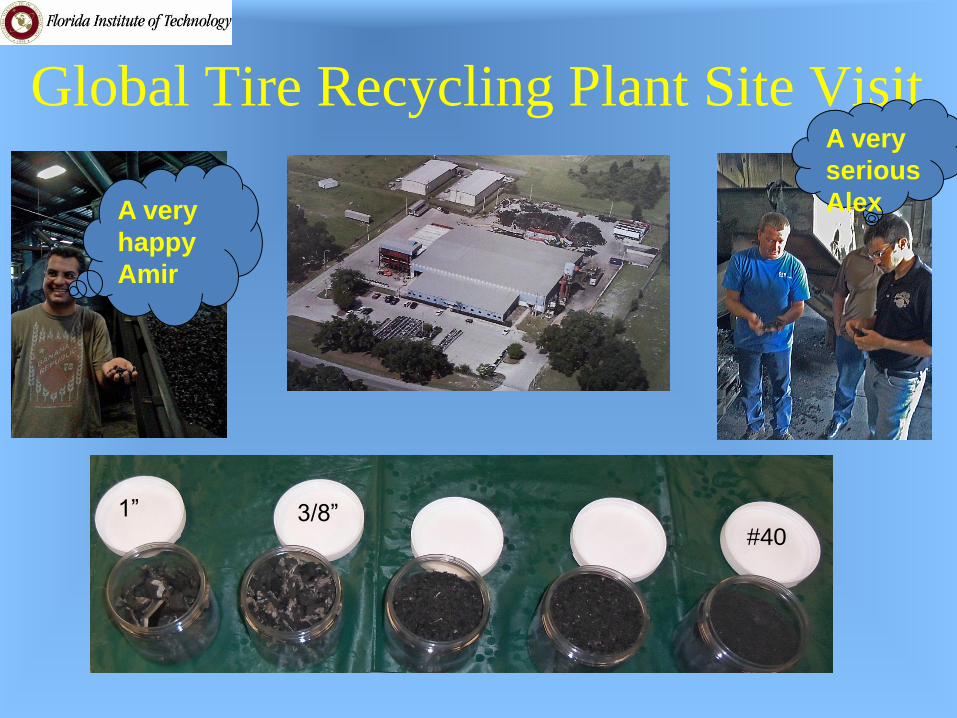
Global Tire Recycling Plant Site Visit
1” 3/8”#40
A very
happy
Amir
A very
serious
Alex

Testing Program
1. Atterberg Limits
2. Optimum Moisture Content
3. Sieve Analysis
4. Volumetric Mixing
5. LBR
6. Resilient Modulus
7. Creep
8. Permeability
9. Consolidation
Subgrade Only
Subgrade GTR Blends
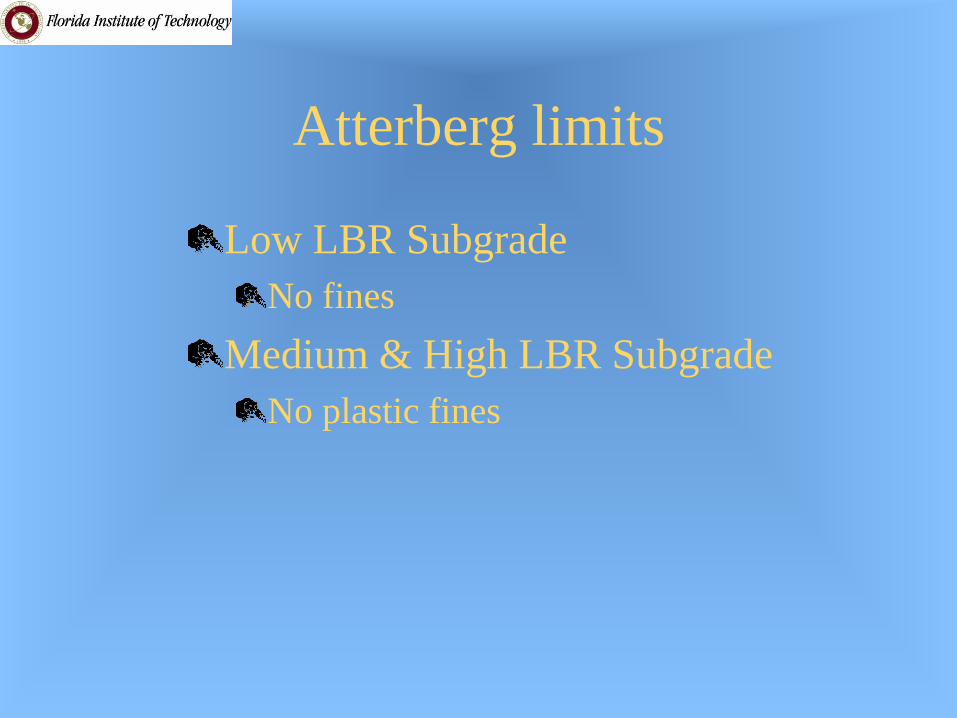
Atterberg limits
Low LBR Subgrade
No fines
Medium & High LBR Subgrade
No plastic fines
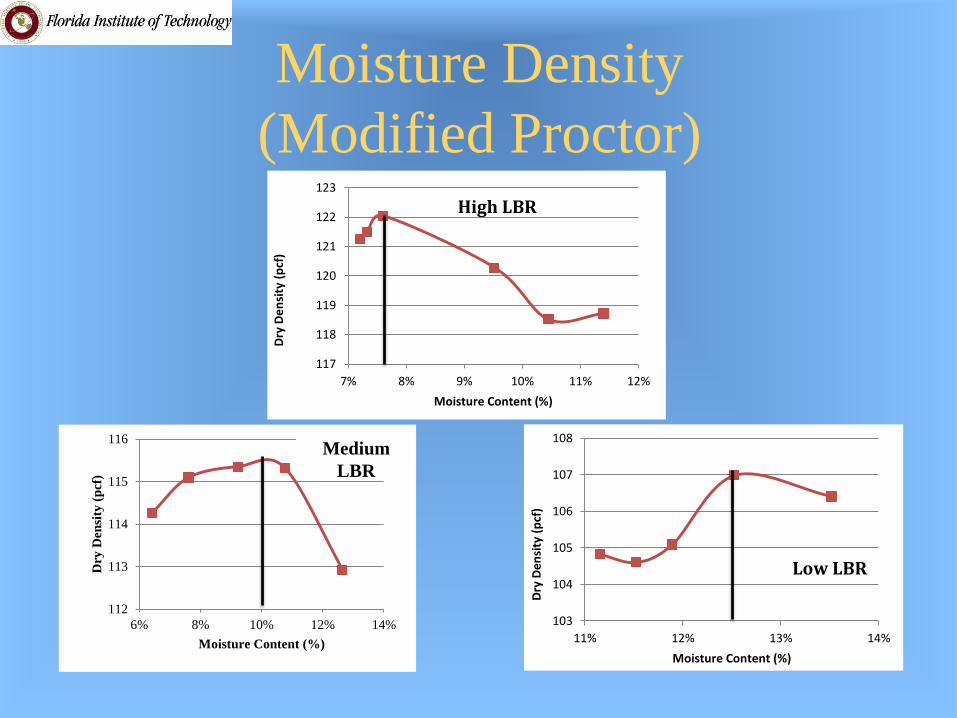
Moisture Density
(Modified Proctor)
117
118
119
120
121
122
123
7% 8% 9% 10% 11% 12%
Dry
De
nsi
ty (
pcf
)
Moisture Content (%)
High LBR
112
113
114
115
116
6% 8% 10% 12% 14%
Dry
Den
sity
(p
cf)
Moisture Content (%)
Medium
LBR
103
104
105
106
107
108
11% 12% 13% 14%
Dry
De
nsi
ty (
pcf
)
Moisture Content (%)
Low LBR

Test Results:
Optimum Moisture Content
Source
Maximum
Dry Density
Optimum
Moisture
Content
(pcf) (%)
Low LBR 107 12.5%
Medium LBR 115 10.0%
High LBR 122 7.5%
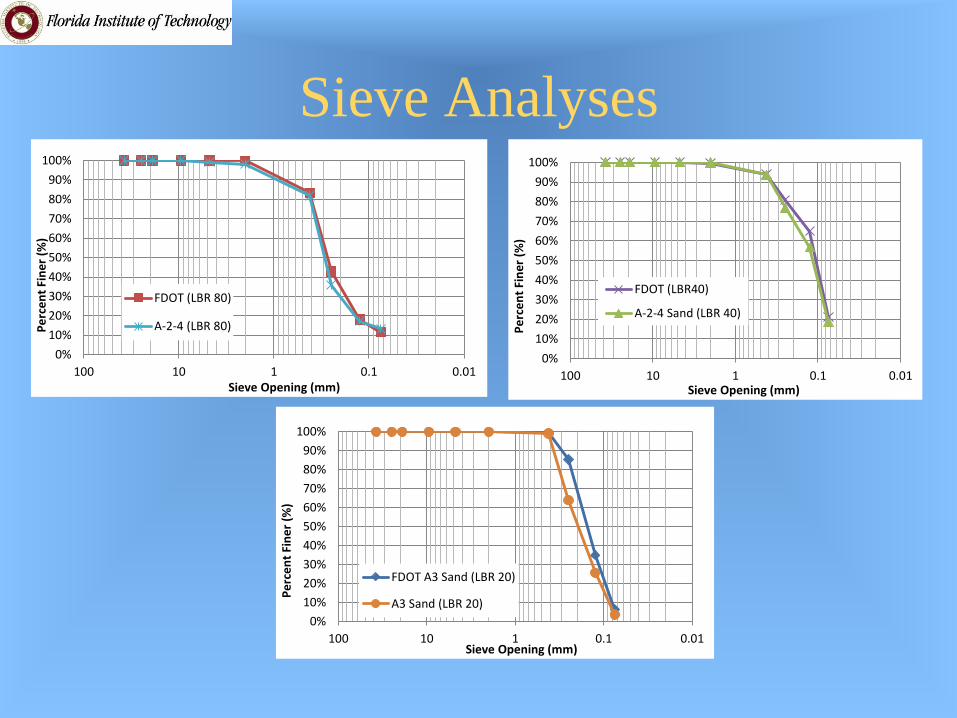
Sieve Analyses
0%
10%
20%
30%
40%
50%
60%
70%
80%
90%
100%
0.010.1110100
Pe
rce
nt
Fin
er
(%)
Sieve Opening (mm)
FDOT (LBR 80)
A-2-4 (LBR 80)
0%
10%
20%
30%
40%
50%
60%
70%
80%
90%
100%
0.010.1110100
Pe
rce
nt
Fin
er
(%)
Sieve Opening (mm)
FDOT (LBR40)
A-2-4 Sand (LBR 40)
0%
10%
20%
30%
40%
50%
60%
70%
80%
90%
100%
0.010.1110100
Pe
rce
nt
Fin
er
(%)
Sieve Opening (mm)
FDOT A3 Sand (LBR 20)
A3 Sand (LBR 20)

Sieve Analysis Results
Grain Size
Characteristic
Low LBR
Material
Medium
LBR
Material
High
LBR
Material
Uniformity Coefficient 2.2 2.0 4.1
Curvature Coefficient 1.1 63.9 1.4
Passing # 200 5% 20% 12%
AASHTO
ClassificationA-3 A-2-4 A-2-4
USCS Classification SP SM SM

Volumetric Blending
Mixing by volume used in the field
4%, 8%, 16%, 24%, 32% GTR by volume
Corresponds to
1/2”, 1”, 2”, 3” and 4” GTR layers in a 12” lift
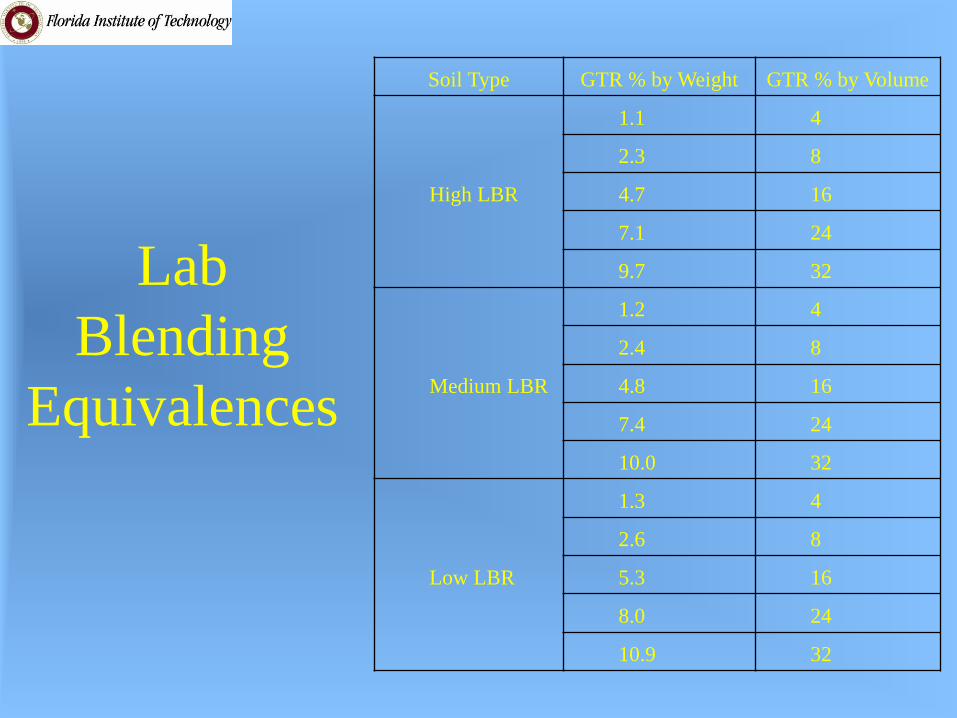
Lab
Blending
Equivalences
Soil Type GTR % by Weight GTR % by Volume
High LBR
1.1 4
2.3 8
4.7 16
7.1 24
9.7 32
Medium LBR
1.2 4
2.4 8
4.8 16
7.4 24
10.0 32
Low LBR
1.3 4
2.6 8
5.3 16
8.0 24
10.9 32

Blending

LBR

LBR (cont.)Limerock Bearing Ratio
15 lb surcharge for subgrade

Limerock Bearing Ratio Results
Subgrades
Soil Soaked LBR
High LBR 88
Med LBR 38
Low LBR 20
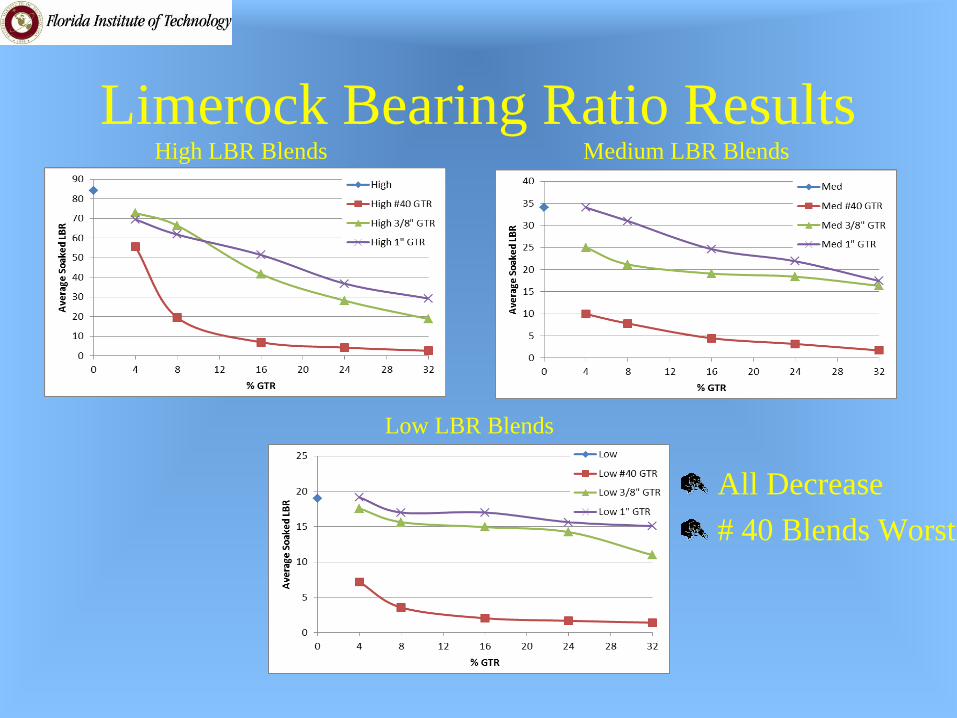
Limerock Bearing Ratio ResultsHigh LBR Blends Medium LBR Blends
Low LBR Blends
All Decrease
# 40 Blends Worst

Limerock Bearing Ratio ResultsHigh LBR Blends Medium LBR Blends
Low LBR Blends
Largest Decrease # 40
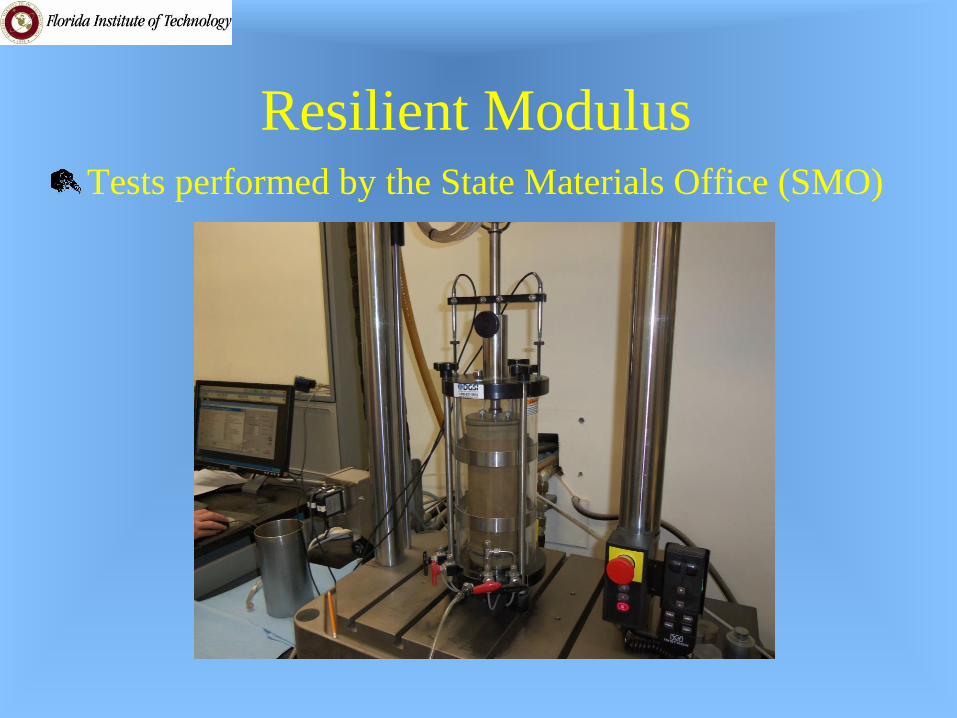
Resilient ModulusTests performed by the State Materials Office (SMO)

% GTR vs. Resilient Modulus
0
5000
10000
15000
20000
0 4 8 12 16 20 24 28 32
Mr
(psi
)
% GTR
1-inch
3/8 inch
#40
0
5,000
10,000
15,000
20,000
0 4 8 12 16 20 24 28 32
Mr
(psi
)
% GTR
0
5,000
10,000
15,000
20,000
0 4 8 12 16 20 24 28 32
Mr
(psi
)
% GTR
3/8 inch
3/8 inch
#40
#40
1-inch
1-inch
Medium LBR
Low LBR
High LBR
All Decrease
Low Mr Decrease <
Medium LBR < High
LBR
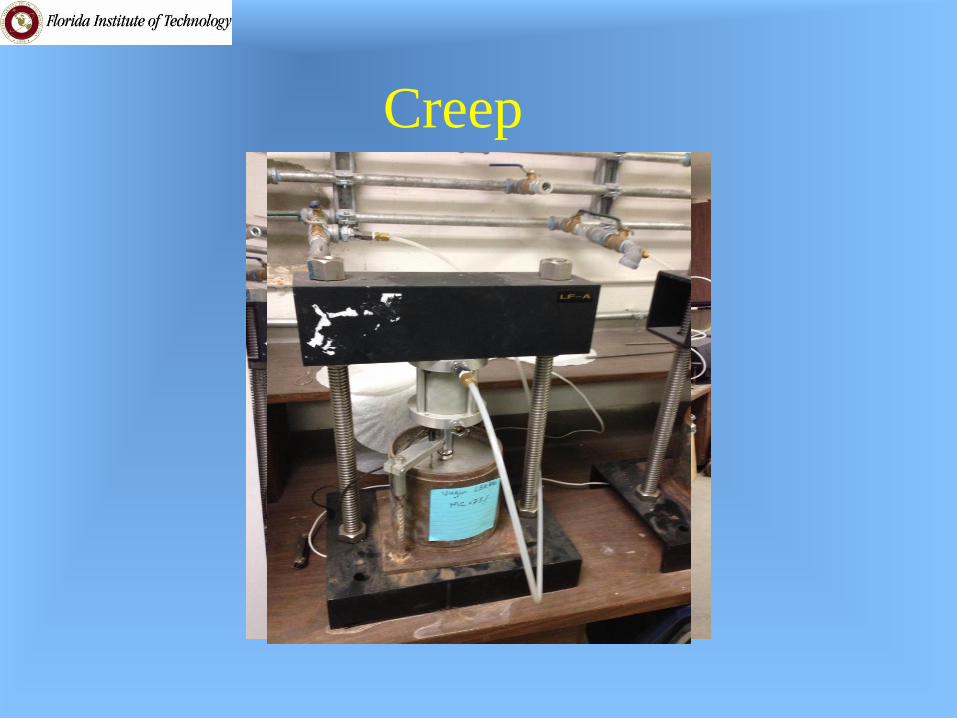
Creep

High LBR Material
Strain vs. Duration High LBR Material
0
0.002
0.004
0.006
0.008
0.01
0.012
0.01 0.1 1
Str
ain
(in
/in
)
Duration (day)
30-Year Deflection Projection
High LBR Material
y = 0.0002ln(x) + 0.01
y = 0.0004ln(x) + 0.0461
0
0.005
0.01
0.015
0.02
0.025
0.03
0.035
0.04
0.045
0.05
0.01 1 100 10000
Def
lecti
on
(in
)
Duration (day)
Virgin Material
16% GTR 1"
32% GTR 1"
16% GTR 3/8 "
32% GTR 3/8 "
16% GTR # 40
32% GTR # 40
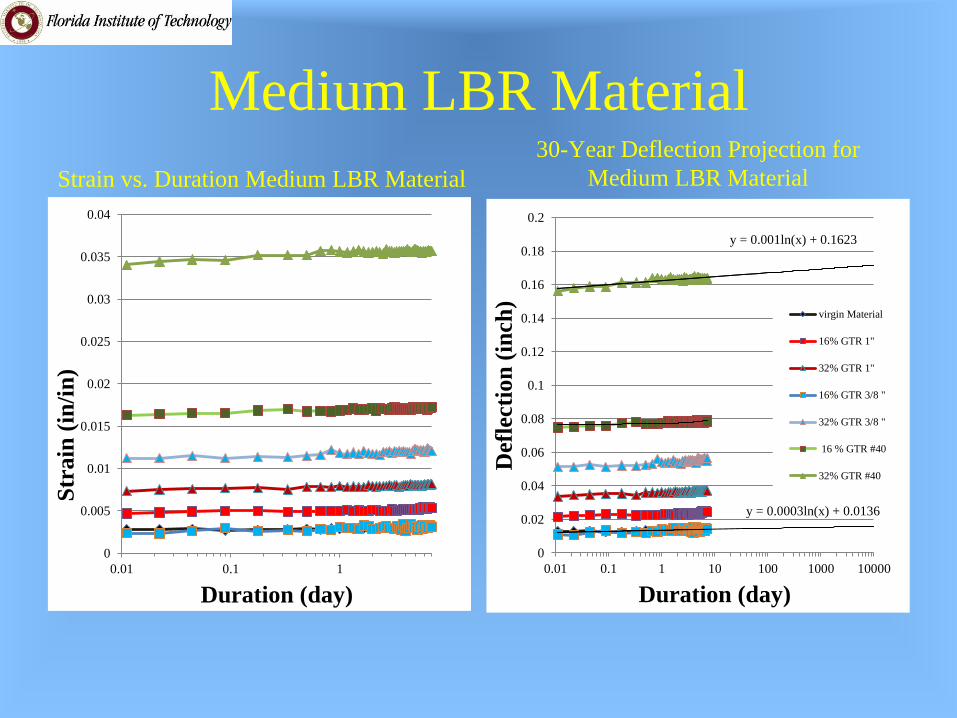
Medium LBR Material
Strain vs. Duration Medium LBR Material
0
0.005
0.01
0.015
0.02
0.025
0.03
0.035
0.04
0.01 0.1 1
Str
ain
(in
/in
)
Duration (day)
30-Year Deflection Projection for
Medium LBR Material
y = 0.0003ln(x) + 0.0136
y = 0.001ln(x) + 0.1623
0
0.02
0.04
0.06
0.08
0.1
0.12
0.14
0.16
0.18
0.2
0.01 0.1 1 10 100 1000 10000
Def
lecti
on
(in
ch)
Duration (day)
virgin Material
16% GTR 1"
32% GTR 1"
16% GTR 3/8 "
32% GTR 3/8 "
16 % GTR #40
32% GTR #40

Low LBR Material
Strain vs. Duration Low LBR Material
0
0.005
0.01
0.015
0.02
0.025
0.03
0.035
0.04
0.045
0.05
0.01 0.1 1
Str
ain
(in
/in
)
Duration (day)
30-Year Deflection Projection for Low
LBR Material
y = 0.0007ln(x) + 0.0501
y = 0.0019ln(x) + 0.202
0
0.05
0.1
0.15
0.2
0.25
0.01 1 100 10000
Def
lecti
on
(in
)
Duration (day)
Virgin Material
16% GTR 1"
32% GTR 1"
16% GTR 3/8 "
32% GTR 3/8 "
16% GTR # 40
32 % GTR # 40
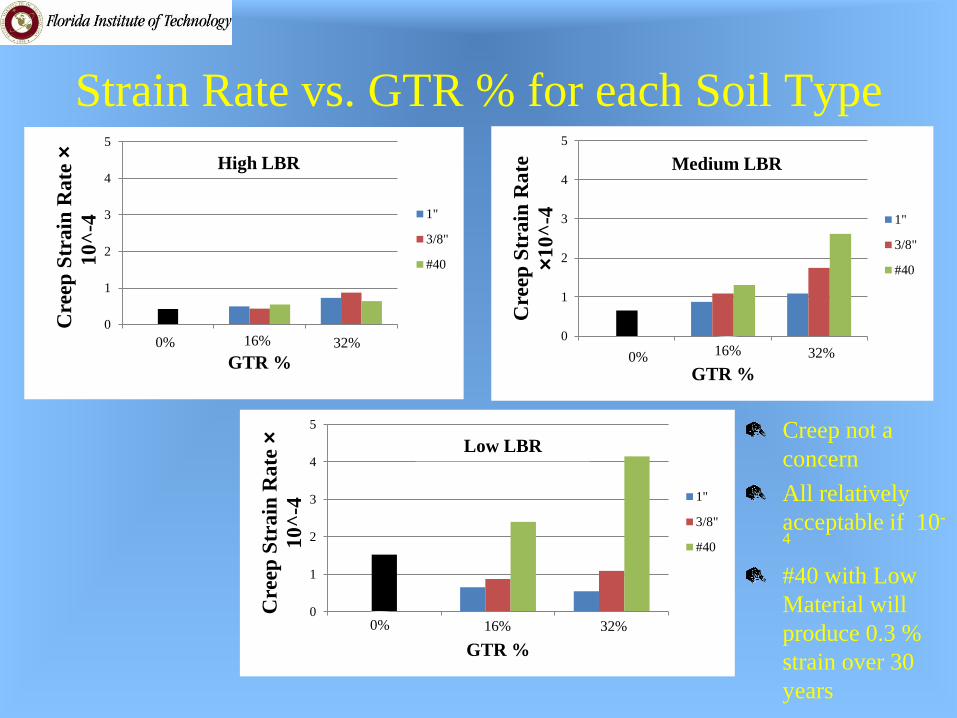
Strain Rate vs. GTR % for each Soil Type
0
1
2
3
4
5
1 2 3
Cre
ep S
tra
in R
ate
×1
0^
-4
GTR %
1"
3/8"
#40
High LBR
32%16%0%0
1
2
3
4
5
1 2 3
Cre
ep S
tra
in R
ate
×1
0^
-4
GTR %
1"
3/8"
#40
Medium LBR
0% 32%16%
0
1
2
3
4
5
1 2 3
Cre
ep S
train
Ra
te ×
10
^-4
GTR %
1"
3/8"
#40
Low LBR
32%16%0%
Creep not a
concern
All relatively
acceptable if 10-
4
#40 with Low
Material will
produce 0.3 %
strain over 30
years
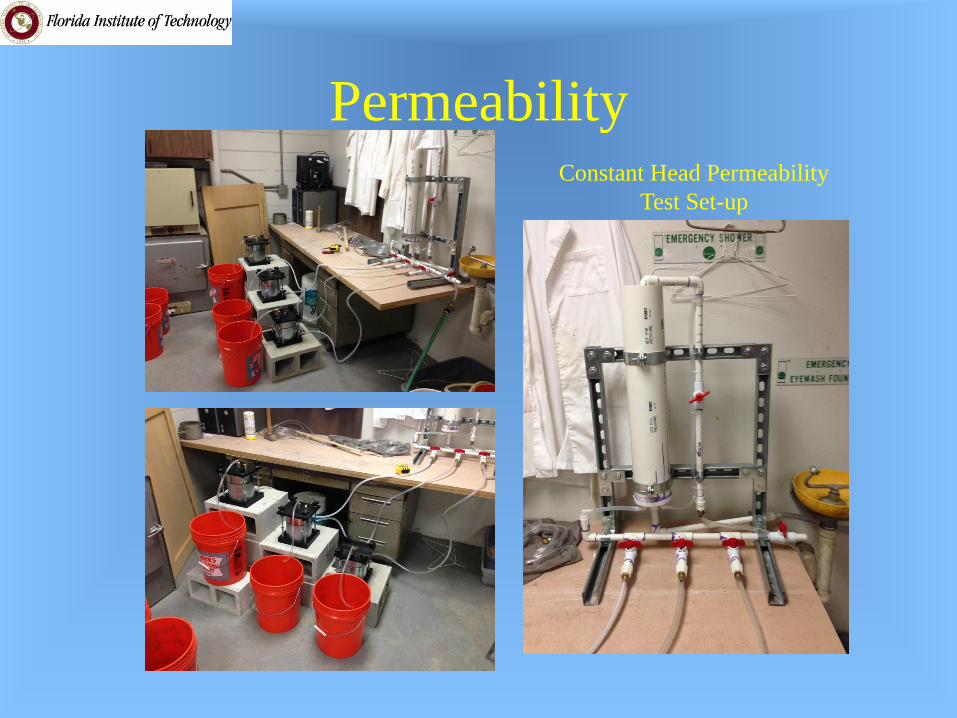
PermeabilityConstant Head Permeability
Test Set-up

Test Results:
Constant Head Permeability
• Virgin Material
– One Order of Magnitude Differences
Soil
Hydraulic
Conductivity, k
(cm/sec)
High LBR 1.2 x 10⁻⁵
Medium LBR 2.8 x 10⁻⁶
Low LBR 3.7 x 10⁻⁴
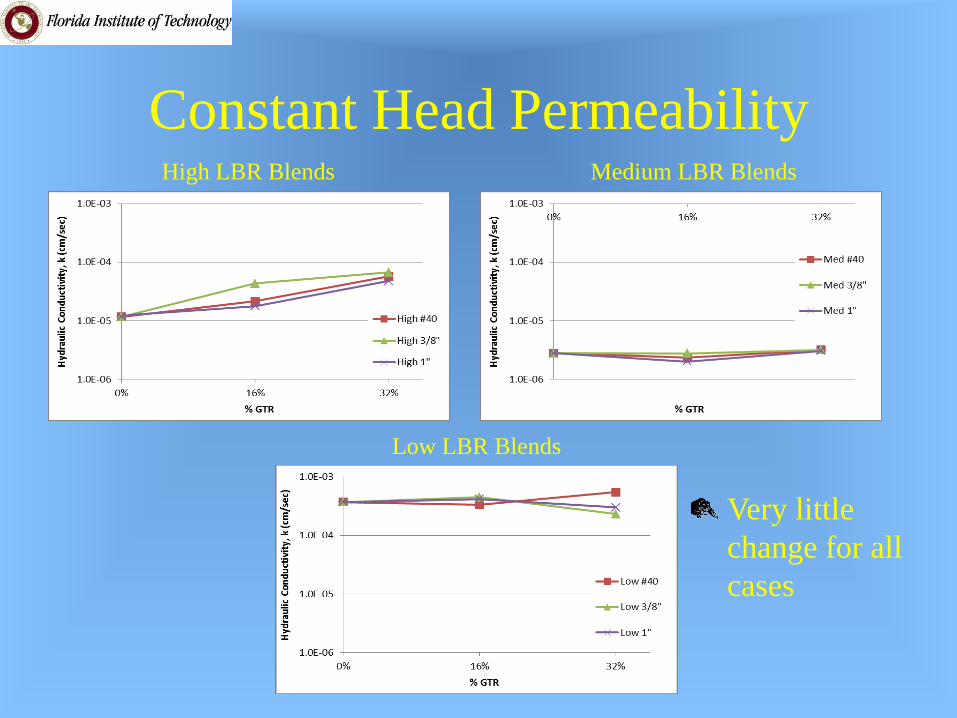
Constant Head PermeabilityHigh LBR Blends Medium LBR Blends
Low LBR Blends
Very little
change for all
cases

Low LBR Material
0.E+00
1.E-04
2.E-04
3.E-04
4.E-04
5.E-04
6.E-04
7.E-04
8.E-04
9.E-04
0% 4% 8% 12% 16% 20% 24% 28% 32%
Per
mea
bil
ity
, k
% GTR
Low Soil #40 GTR
0.E+00
1.E-04
2.E-04
3.E-04
4.E-04
5.E-04
6.E-04
7.E-04
8.E-04
9.E-04
0% 4% 8% 12% 16% 20% 24% 28% 32%
Per
mea
bil
ity
, k
% GTR
Low Soil 3/8" GTR
0.E+00
1.E-04
2.E-04
3.E-04
4.E-04
5.E-04
6.E-04
7.E-04
8.E-04
9.E-04
0% 4% 8% 12% 16% 20% 24% 28% 32%
Per
mea
bil
ity
, k
% GTR
Low Soil 1" GTR
Soil GTR k (cm/sec)
Low LBR 0 3.7E-04Med LBR 0 4.2E-06High LBR 0 6.3E-06
Typical results
No significant change
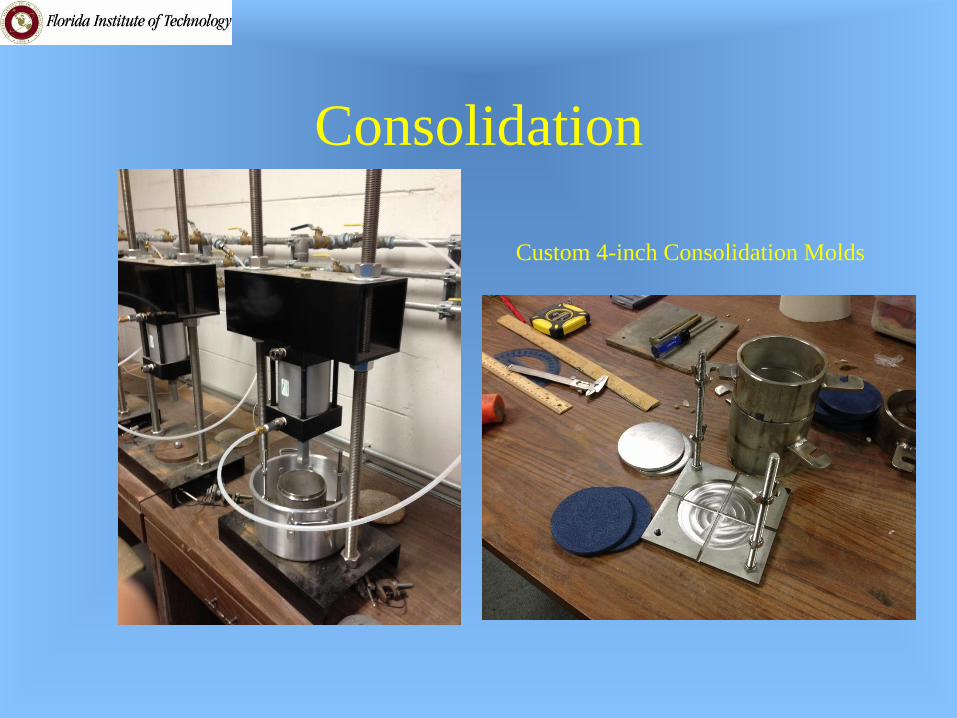
Consolidation
Custom 4-inch Consolidation Molds

Consolidation
• Virgin Material Slope
Soil
Compression Index,
Cc
High LBR 0.010
Med LBR 0.007
Low LBR 0.008

Consolidation Results
High LBR Blends Medium LBR Blends
Low LBR Blends
1” and 3/8 “ produce
no change
# 40 blend causes
change
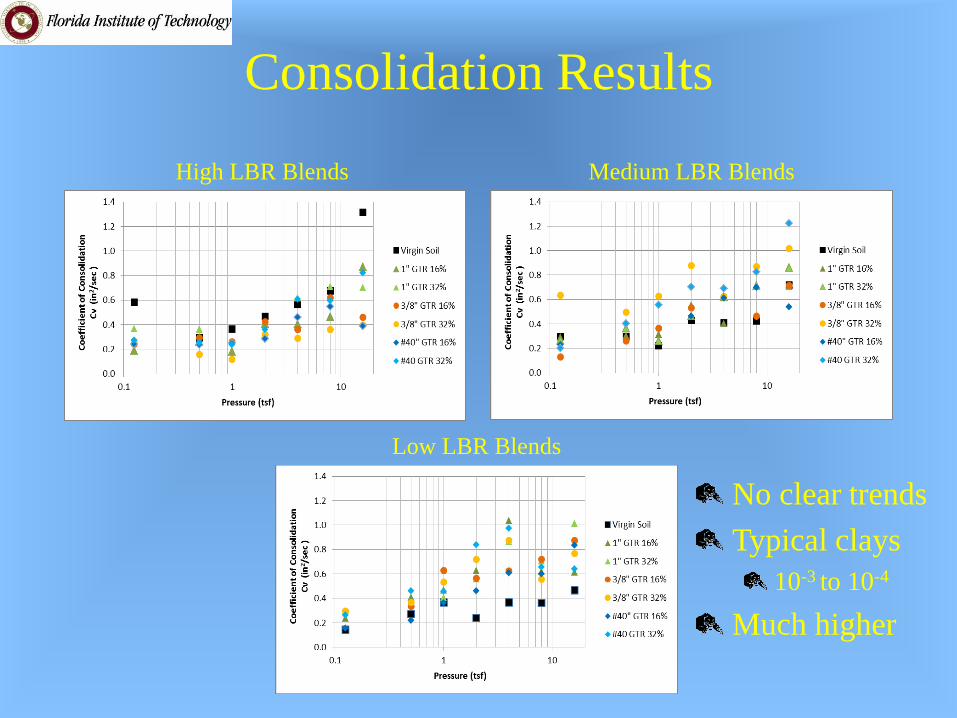
Consolidation Results
High LBR Blends Medium LBR Blends
Low LBR Blends
No clear trends
Typical clays
10-3 to 10-4
Much higher
Summary
With increasing GTR %:
Density decreases
LBR decreases
Resilient Modulus decreases
No significant Creep
Not Consolidating
No significant change in Permeability

ConclusionsGTR Subgrade blends are not desirable for highway use
LBR
Decreases linearly with an increase of GTR
#40 mesh GTR blends produced largest LBR decrease
Low and Medium LBR subgrade blends were classified as unsuitable for use as a subgrade material
High LBR subgrade blends with 1-inch GTR and 3/8-inch GTR produce acceptable LBR’s up to 8% GTR by volume
#40 GTR High LBR blends produce acceptable LBR’s only at 4% GTR by volume

ConclusionsConstant Head Permeability
High LBR soil blends produce a small increase in k
Low and Medium LBR soil blends showed no
significant k changes
Consolidation
Compressibility of 1”and 3/8” blends showed no
change compared to virgin material
Compressibility of #40 mesh GTR blends increased by
three to five magnitudes over the virgin material
Cv values in the soil/GTR blends were three to four
orders of magnitude larger than typical remolded clays
Recommendations
Blends of High LBR Subgrade with
minimal GTR concentrations could be
suitable for the subgrade layer
Could be suitable as a possible lightweight,
non-structural backfill due to decrease in
density and increase in internal friction
angle

Questions ?