154 AGGREGATE SUBGRADE THICKNESS DETERMINATION · 154 AGGREGATE SUBGRADE THICKNESS DETERMINATION...
71
154 AGGREGATE SUBGRADE THICKNESS DETERMINATION PHYSICAL RESEARCH REPORT NO. 154 August 2009
Transcript of 154 AGGREGATE SUBGRADE THICKNESS DETERMINATION · 154 AGGREGATE SUBGRADE THICKNESS DETERMINATION...
154
AGGREGATE SUBGRADE THICKNESS DETERMINATION
PHYSICAL RESEARCH REPORT NO. 154 August 2009
Technical Report Documentation Page 1. Report No. IL-PRR-154
2. Government Accession No. 3. Recipient's Catalog No.
4. Title and Subtitle 5. Report Date
August 2009 Aggregate Subgrade Thickness Determination
6. Performing Organization Code
8. Performing Organization Report N o. 7. Author(s) Greg Heckel, P.E.
PRR-154
9. Performing Organization Name and Address 10. Work Unit ( TRAIS)
Illinois Department of Transportation District 6 126 E. Ash St.
11. Contract or Grant No.
Springfield IL 62704
13. Type of Report and Period Covered
Final Report
12. Sponsoring Agency Name and Address
Illinois Department of Transportation District 6 126 E. Ash St.
August 2003 to August 2005
Springfield IL 62704
14. Sponsoring Agency Code
15. Supplementary Notes
Experimental Features Project IL 03-01
16. Abstract
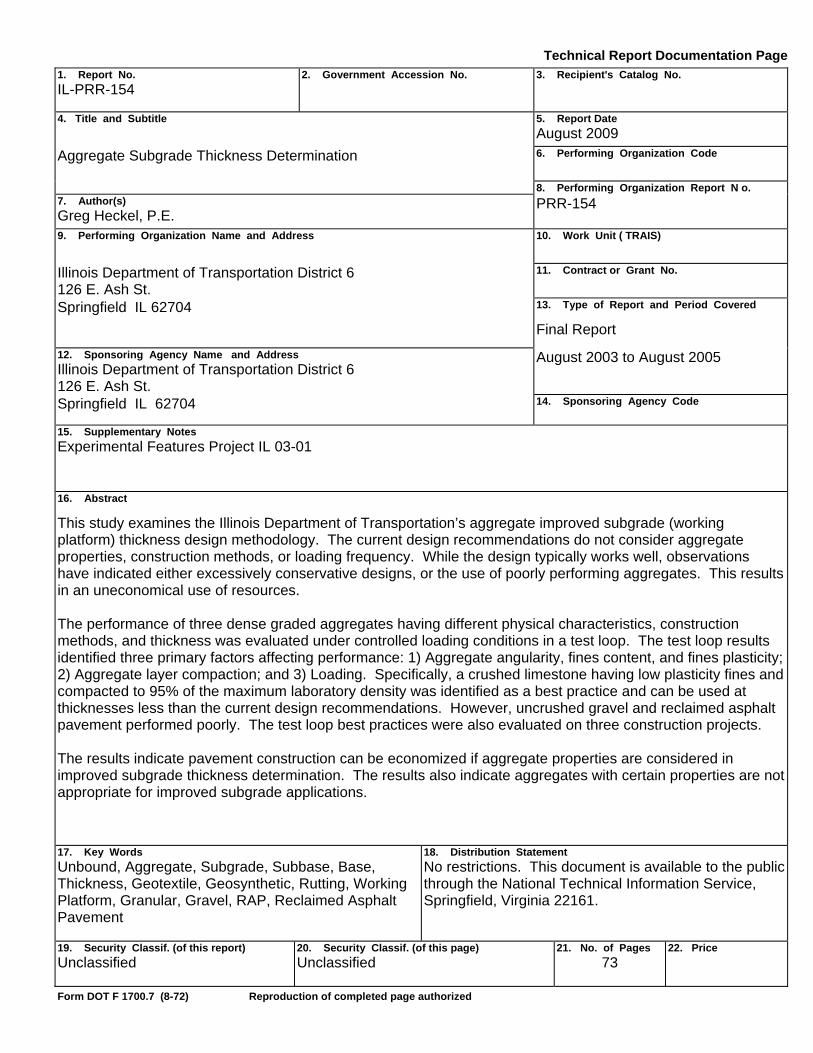
This study examines the Illinois Department of Transportation’s aggregate improved subgrade (working platform) thickness design methodology. The current design recommendations do not consider aggregate properties, construction methods, or loading frequency. While the design typically works well, observations have indicated either excessively conservative designs, or the use of poorly performing aggregates. This results in an uneconomical use of resources. The performance of three dense graded aggregates having different physical characteristics, construction methods, and thickness was evaluated under controlled loading conditions in a test loop. The test loop results identified three primary factors affecting performance: 1) Aggregate angularity, fines content, and fines plasticity; 2) Aggregate layer compaction; and 3) Loading. Specifically, a crushed limestone having low plasticity fines and compacted to 95% of the maximum laboratory density was identified as a best practice and can be used at thicknesses less than the current design recommendations. However, uncrushed gravel and reclaimed asphalt pavement performed poorly. The test loop best practices were also evaluated on three construction projects. The results indicate pavement construction can be economized if aggregate properties are considered in improved subgrade thickness determination. The results also indicate aggregates with certain properties are not appropriate for improved subgrade applications.
17. Key Words
Unbound, Aggregate, Subgrade, Subbase, Base, Thickness, Geotextile, Geosynthetic, Rutting, Working Platform, Granular, Gravel, RAP, Reclaimed Asphalt Pavement
18. Distribution Statement No restrictions. This document is available to the public through the National Technical Information Service, Springfield, Virginia 22161.
19. Security Classif. (of this report) Unclassified
20. Security Classif. (of this page) Unclassified
21. No. of Pages
73
22. Price
Form DOT F 1700.7 (8-72) Reproduction of completed page authorized
AGGREGATE SUBGRADE THICKNESS DETERMINATION
Experimental Features Project IL 03-01
Final Report
by
Greg Heckel, PE Geotechnical Engineer
Illinois Department of Transportation District 6
Published by
Illinois Department of Transportation Bureau of Materials and Physical Research
Springfield, Illinois 62704
August 2009

This page intentionally left blank.
i
Table of Contents
Executive Summary .......................................................................................................... ii Acknowledgements iii Abbreviations, Acronyms, and Definitions ........................................................................ iv List of Figures.................................................................................................................... v List of Tables ..................................................................................................................... v 1. Introduction .................................................................................................................. 1
1.1 Overview ................................................................................................................. 1 1.2 Background on IDOT’s Current Thickness Determination ...................................... 1
2. Phase 1: Test Loop ...................................................................................................... 3 2.1 Construction ........................................................................................................... 3 2.2 Subgrade Soil and Aggregates ............................................................................... 4 2.3 Test Loading and Rut Measurement ...................................................................... 5 2.4 Test Loop Rutting Data Analysis ............................................................................ 5
2.4.1 Uncrushed Gravel ............................................................................................ 6 2.4.2 Reclaimed Ashpalt Pavement .......................................................................... 7 2.4.3 Crushed Limestone (CLS) CA-6 with no Geotextile ......................................... 9 2.4.4 Crushed Limestone (CLS) CA-6 with Geotextile ............................................ 12 2.4.5 Oversize CLS Material Capped with CLS CA-6 ............................................. 14 2.4.6 Oversize material capped with RAP .............................................................. 17
2.5 Phase 1 Test Loop Conclusions ............................................................................ 17 3 Phase 2: Field Verification .......................................................................................... 18
3.1 Illinois 97 Contract 72773 .................................................................................... 19 3.1.1 Subgrade Conditions and Aggregate Information ........................................... 19 3.1.2 Loading and Rutting Information ..................................................................... 20
3.2 IL 29 Expressway Contract 72536 ........................................................................ 21 3.2.1 Subrgrade Conditions and Aggregate Information ......................................... 21 3.2.2 Loading and Rutting Data .............................................................................. 21
3.3 IL 96 Contract 72240 ............................................................................................ 22 3.3.1 Subgrade and Aggregate ............................................................................... 22 3.3.2 Loading and Rutting ....................................................................................... 23
3.4 Field Verification Conclusions .............................................................................. 23 4 Conclusions................................................................................................................. 23 5 Recommendations ...................................................................................................... 24 6 References .................................................................................................................. 25 Appendix A: Project and Aggregate Source Locations ................................................ A-1 Appendix B: Test Loop Subgrade and Aggregate Data ............................................... B-1 Appendix C: Test Location Summary & Complete Test Loop Rutting Data ................. C-1 Appendix D: IL 97 Complete Subgrade and Aggregate Property Data ........................ D-1 Appendix E: IL 29 Expressway Complete Subgrade and Aggregate Property Data .... E-1 Appendix F: IL 96 Complete Subgrade and Aggregate Property Data ........................ F-1
ii
Executive Summary
The Illinois Department of Transportation spends approximately 29 million dollars per year for aggregates in improved subgrade (working platform) applications. For the standard design and the special treatment of unstable subgrades, IDOT has been referencing aggregate layer thickness recommendations in the Department’s Subgrade Stability Manual for over 20 years. Anecdotal evidence from years of experience suggests the recommendations are either too conservative, or demonstrate poor performance depending on the aggregate properties and construction practices used. This project attempts to objectively evaluate those recommendations. An adjustment in aggregate thickness based on aggregate properties has the potential to save IDOT approximately 9 million dollars annually. Focusing on aggregate properties can also avoid the use of aggregates not suitable for improved subgrade construction. A test loop was constructed incorporating dense graded gravel, crushed limestone, reclaimed asphalt pavement, and oversized crushed limestone capped with the various dense graded aggregates. Each material was represented by different thicknesses and different compactive efforts. Each test location within the test loop was loaded with up to 270 passes of a loaded tandem axle truck. Rut depths for each test location were measured at regular intervals during loading. The test loop results identified three primary factors affecting the performance of an aggregate subgrade: 1. Aggregate properties such as angularity, fines content, and fines plasticity. 2. Aggregate layer compaction. 3. The number of load passes. It was also noted for subgrade IBVs of 3 or greater, aggregate properties, rather than subgrade characteristics and aggregate thickness, are likely to control performance. Specifically, a crushed limestone CA-6 compacted to 95 percent of the maximum laboratory density was identified as a best practice and can be used at thicknesses less than indicated in the Subgrade Stability Manual. Gravel and recycled asphalt pavement (RAP) materials showed the poorest performance. The test loop best practices were also evaluated on three construction projects. The resulting data confirmed test loop results. The results from this project indicate pavement construction can be economized if aggregate properties are considered in improved subgrade thickness determination. The results also indicate aggregates with certain properties are not appropriate for improved subgrade applications, even though they are not currently restricted by IDOT specifications.
iii
Acknowledgements Completion of this project required the assistance of many individuals for tasks including monitoring construction, field testing, checking rut depth, laboratory testing, and report preparation. Thanks to Scott Armistead, Clint Barnhart, Lyndsay Cassad, Wesley Clark, Larry Fagg, Jeff Grandone, Mark Gawedzinski, Paul Guthrie, Kiley Gwaltney, Barney Hildebrandt, Jerry Iams, Sadie Jones, Brian Laningham, Marshall Metcalf, Greg Mishler, Matt Mueller, Brian Pfeifer, Kurt Schmuck, Amy Schutzbach, Mike Tappan, Fred Tinsley, Dave Vereen, Riyad Wahab, and Kevin Wombles. This project was completed using District 6 construction funds. The support of Region 4 Engineer Christine Reed, Project Implementation Engineer Bill Frey, and Materials Engineer Ron Archambeau is appreciated.
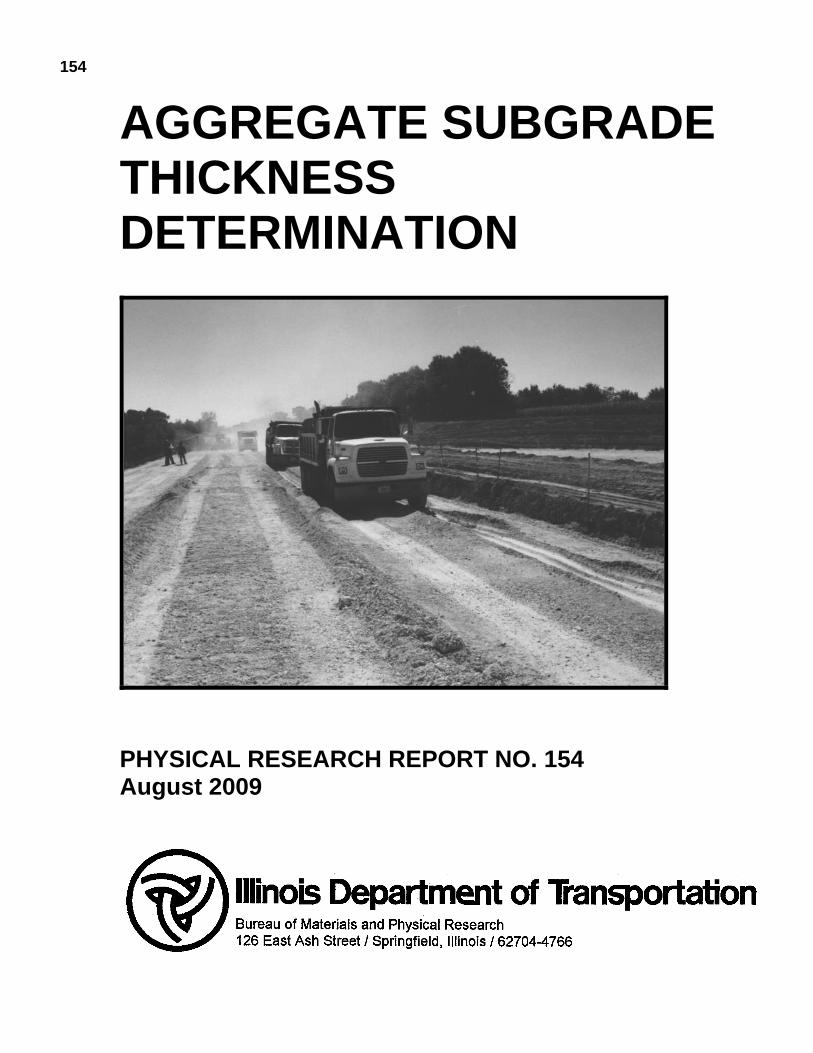
Cover Loading the no geotextile Type B / Type A CLS transition area on Phase I test loop. Photographed by Greg Heckel on October 2, 2003.
Units This Report predominantly uses US Customary Units because they are common to both the construction methods and references. However, SI units are used to facilitate precise measurements of rut depth. Some useful conversions are shown below:
1 inch = 25 mm 1 pcf = 16.02 kg/m³ 1 foot = 0.305 m 1 tsf = 13.9 psi = 95.8 kPa
The contents of this Report reflect the views of the author, who is responsible for the facts and accuracy of the data presented in this report. The contents do not necessarily reflect the official views or policies of IDOT. This report does not constitute a standard, specification, or regulation at IDOT. The Illinois Department of Transportation does not endorse products, manufacturers, or material producers. Product or producer names appear in this report because they are considered essential to the object of this report.
iv
Abbreviations, Acronyms, and Definitions AASHTO American Association of State Highway and Transportation Officials CA-6 IDOT Coarse Aggregate gradation number 6 - Dense graded
aggregate. CL Clay Loam based on IDOT Textural Classification CLS Crushed Limestone CTRL Control Section DCP Dynamic Cone Penetrometer DD Dry Density determined in the field according to AASHTO T 310 IBR Illinois Bearing Ratio according to IDOT Geotechnical Manual
Attachment IIA - Considered equivalent to Lab California Bearing Ratio (CBR) according to AASHTO T-193
IBV Immediate Bearing Value - Determined using the dynamic cone penetrometer and is considered equivalent to Field CBR
IDOT Illinois Department of Transportation Geo Geotextile section HMA Hot Mix Asphalt LL Liquid Limit according to AASHTO T 89 MC Moisture Content according to AASHTO T 265 NBL or NB Northbound lanes NP Non-Plastic according to AASHTO T 90 OMC Optimum Moisture Content corresponding to the maximum laboratory
dry density determined according to AASHTO T 99 PCF Pounds Per Cubic Foot PCR Primary Crusher Run oversize aggregate PCRB Primary crusher run oversize aggregate capped with CLS Type B PCRR Primary crusher run oversize aggregate capped with RAP PI Plasticity Index according to AASHTO T 90 Qu Unconfined Compressive Strength RAP Reclaimed Asphalt Pavement SBL or SB Southbound lanes SDD Standard Dry Density – Maximum laboratory dry density determined
according to AASHTO T 99 SaCL Sandy Clay Loam based on IDOT Textural Classification SiCL Silty Clay Loam based on IDOT Textural Classification SiL Silt Loam based on IDOT Textural Classification SSM IDOT Subgrade Stability Manual (IDOT, 1982/2005) TSF Tons per Square Foot Type A or “A”
CA-6 Compacted to 95% of the maximum laboratory density determined according to AASHTO T 99
Type B or “B”
CA-6 Compacted to the satisfaction of the Engineer
v
List of Figures
Figure 1. Aggregate Thickness Recommendations Based on Thompson et al. .............. 2
Figure 2. Example Plan and Profile View from Northbound Lane .................................... 4
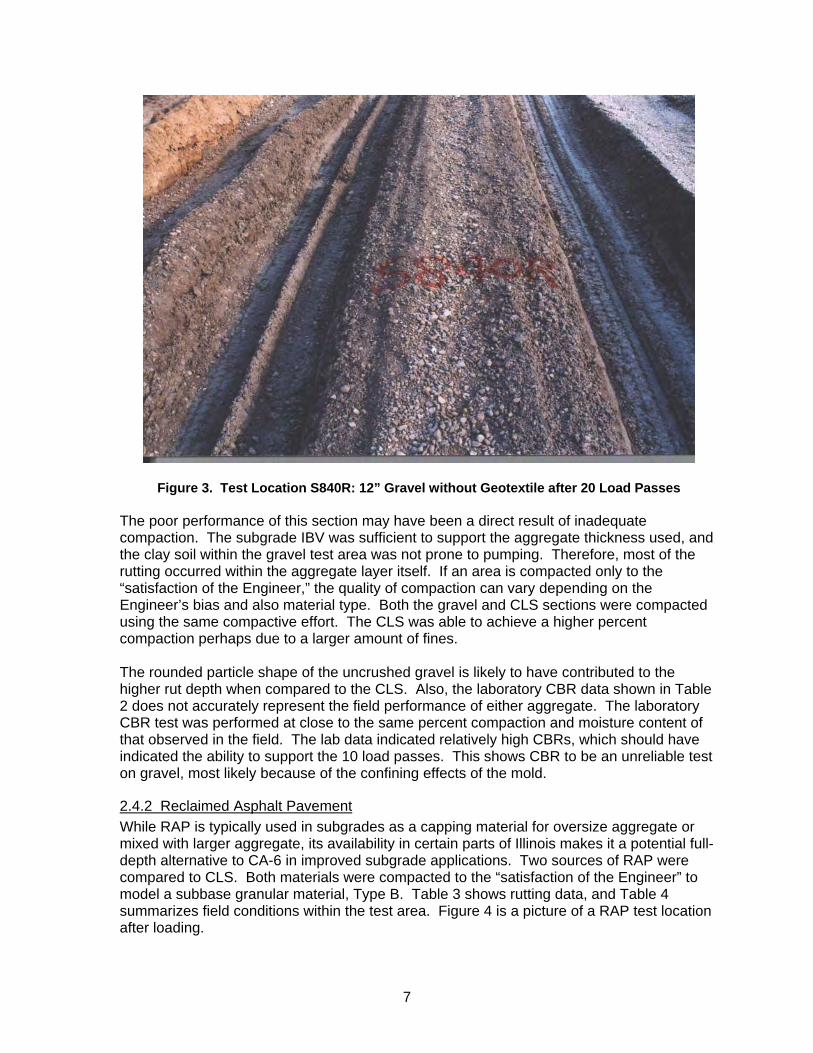
Figure 3. Test Location S840R: 12” Gravel without Geotextile after 20 Load Passes ..... 7
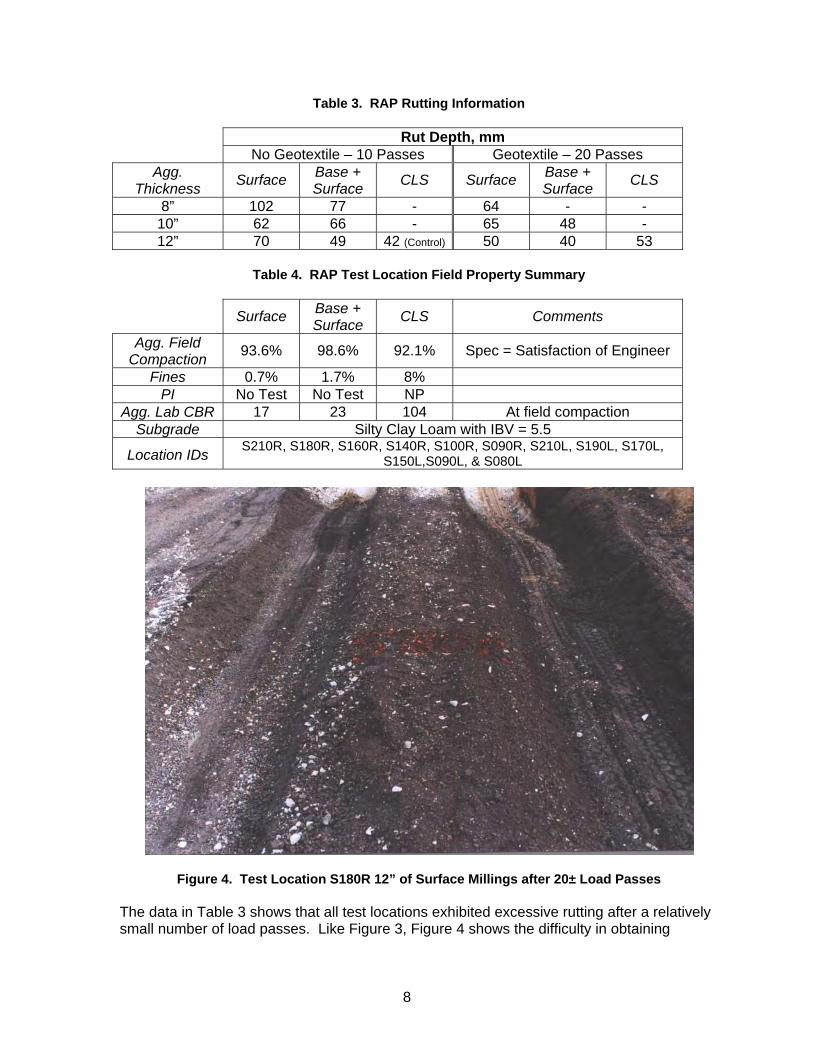
Figure 4. Test Location S180R 12” of Surface Millings after 20± Load Passes. .............. 8
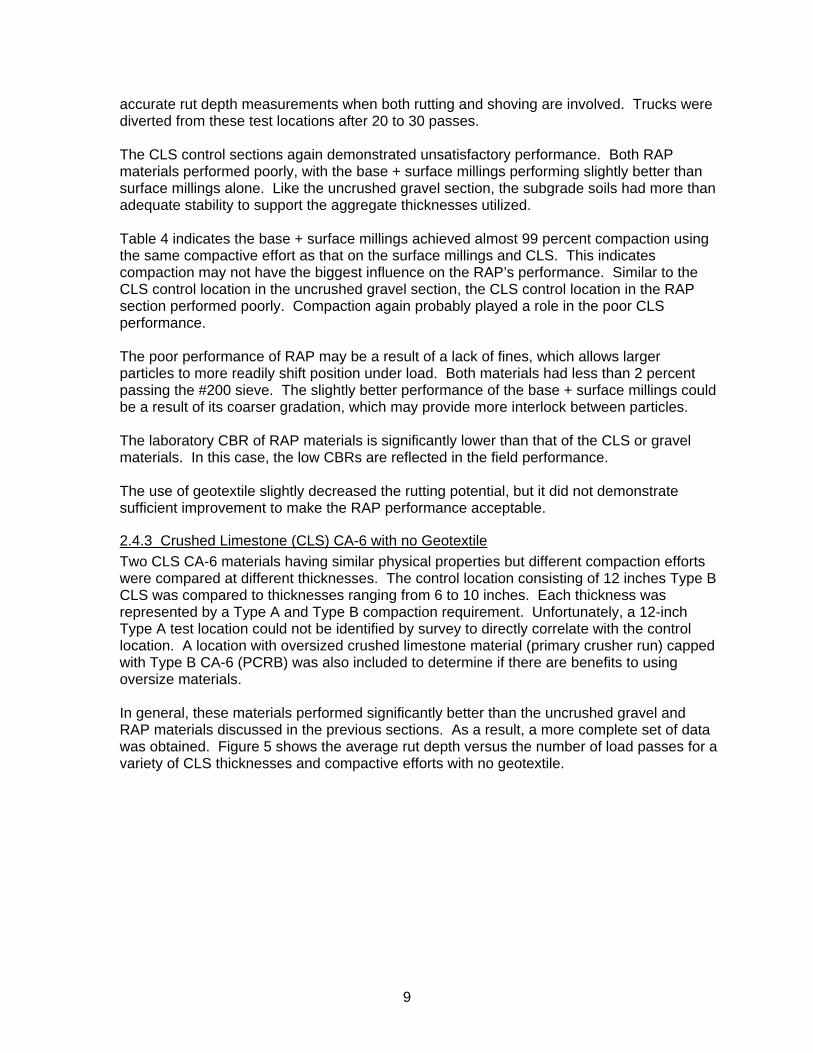
Figure 5. Crushed Limestone CA-6 Rut Depth versus Load Passes with no Geotextile.
........................................................................................................................................ 10
Figure 6. Loading Transition area between Type A (foreground) and Type B
(background) CLS CA-6. . .............................................................................................. 11
Figure 7. Average Rut Depth Versus Load Passes for CLS CA-6 over Geotextile ........ 12
Figure 8. Type B CLS With and Without Geotextile Rut Depth vs. Load Passes .......... 13
Figure 9. Type A CLS With and Without Geotextile Rut Depth vs. Load Passes .......... 14
Figure 10. Rut Depth vs. Load Passes for CLS Oversize Materials Capped with CA-6 15
Figure 11. Oversize CLS Capped with CLS CA-6 With and Without Geotextile Rut
Depth vs. Load Passes. .................................................................................................. 16
Figure 12. Rut Depth versus Load Passes for RAP and CLS CA-6 Capping Materials. 17
List of Tables
Table 1. Uncrushed CA-6 Gravel Rutting Information ...................................................... 6 Table 2. Uncrushed Gravel Test Location Field Property Summary ................................ 6 Table 3. RAP Rutting Information .................................................................................... 8 Table 4. RAP Test Location Field Property Summary ..................................................... 8 Table 5. CLS Test Location Field Property Summary .................................................... 11 Table 6. Oversize CLS Capped with CLS CA-6 Test Location Field Property Summary 16 Table 7. IL 97 Rutting Data ............................................................................................ 20 Table 8. IL 29 Rutting Data for 8-inch Type A CLS. ....................................................... 22 Table 9. Improved Subgrade Thickness Preliminary Recommendations ...................... 25
1
1. Introduction
1.1 Overview The Illinois Department of Transportation (IDOT) requires hot mix asphalt (HMA) and concrete pavements be constructed on an improved subgrade layer. This layer typically consists of either a modified soil or aggregate. IDOT mechanistic pavement design procedures do not include any contribution of the improved subgrade to the structural design of the pavement. The only purpose of the improved subgrade is to provide a stable working platform on which to construct pavement layers. Current IDOT pavement design policy requires this layer to be a minimum 12 inches thick regardless of the material used (IDOT, 2002). IDOT uses approximately 1.9 million tons of aggregate in improved subgrade applications annually. With an average cost per ton in 2006 of $15, IDOT spends approximately $29,000,000 per year for aggregate improved subgrades. The thickness, and by extension the quantity, of aggregate required is currently determined independent of aggregate properties, construction methods, and anticipated loading. For example if a 30 percent reduction in thickness can be achieved by considering these items, IDOT could realize an annual savings of approximately $9,000,000. IDOT specifications and various special provisions allow a wide variety of aggregates for improved subgrade applications. For example, aggregates can range from uncrushed gravels to crushed limestone (CLS) with up to 12 percent fines. Depending on the construction specification, some aggregates have limits on fines plasticity, and others have no limit. Compaction can also range from “satisfaction of the Engineer” to having a specific density requirement. Anecdotal evidence based on years of experience with the different types of aggregates available throughout the state suggests IDOT could achieve greater economy in the use of aggregates. Cost savings could be achieved directly by reducing the required thickness of the aggregate layer when a better performing aggregate is used. Savings could also be achieved indirectly by reducing the use of aggregates that perform poorly in improved subgrade applications. This project examines the relationship between aggregate properties, construction methods, loading, and rutting under controlled construction conditions. Experimental work has been performed in two phases. The first was a test loop including various aggregate types, thickness, and compaction requirements subjected to controlled loading. The test loop also included a comparison between areas with and without geotextile. The first phase test loop identified materials, methods, and thicknesses that performed well. The second phase applied those concepts to three actual construction projects to check “real world” performance. Appendix A shows the locations of projects in each phase.
1.2 Background on IDOT’s Current Thickness Determination In 1977, the University of Illinois completed a comprehensive, multi-year study of subgrade stability. The study’s final report (Thompson et al. 1977) discusses characterizing field conditions, requirements for stability, and a variety of remedial actions that can be taken to improve stability. The study recommends a minimum subgrade Immediate Bearing Value (IBV) requirement of 6 to 8 to limit rutting to 0.5-inch or less and support compaction of
2
successive paving layers. The study was adopted by IDOT and was issued as policy in the 1982 Subgrade Stability Manual. Removing unstable soils and replacing them with granular materials is a common remedial action used on IDOT projects. The granular layer thickness recommendations were determined by Thompson et al. by relating an existing flexible pavement design equation, finite element analyses, and lab studies on soils. Equation 1 shows the modified Corps of Engineers design procedure used in the 1977 study.
Equation 1 ⎟⎟⎠
⎞⎜⎜⎝
⎛−=
πpIBVPFt 1
1.81
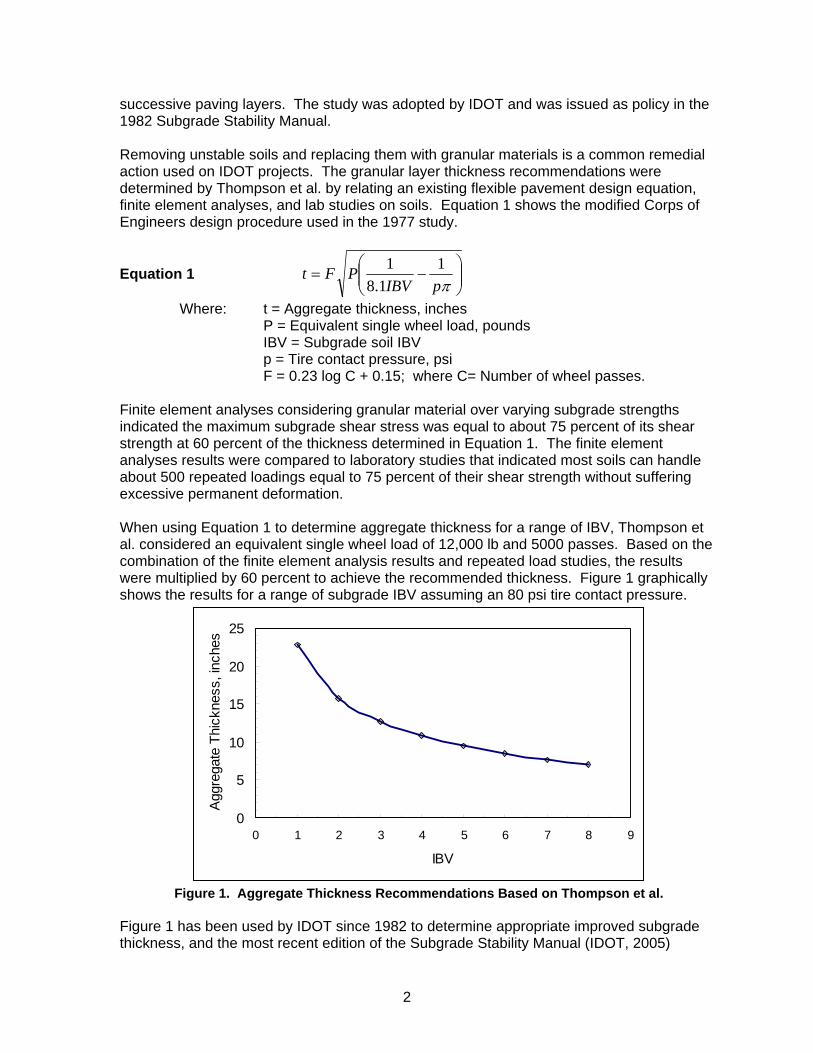
Where: t = Aggregate thickness, inches P = Equivalent single wheel load, pounds IBV = Subgrade soil IBV p = Tire contact pressure, psi F = 0.23 log C + 0.15; where C= Number of wheel passes. Finite element analyses considering granular material over varying subgrade strengths indicated the maximum subgrade shear stress was equal to about 75 percent of its shear strength at 60 percent of the thickness determined in Equation 1. The finite element analyses results were compared to laboratory studies that indicated most soils can handle about 500 repeated loadings equal to 75 percent of their shear strength without suffering excessive permanent deformation. When using Equation 1 to determine aggregate thickness for a range of IBV, Thompson et al. considered an equivalent single wheel load of 12,000 lb and 5000 passes. Based on the combination of the finite element analysis results and repeated load studies, the results were multiplied by 60 percent to achieve the recommended thickness. Figure 1 graphically shows the results for a range of subgrade IBV assuming an 80 psi tire contact pressure.
0
5
10
15
20
25
0 1 2 3 4 5 6 7 8 9
IBV
Aggr
egat
e Th
ickn
ess,
inch
es
Figure 1. Aggregate Thickness Recommendations Based on Thompson et al.
Figure 1 has been used by IDOT since 1982 to determine appropriate improved subgrade thickness, and the most recent edition of the Subgrade Stability Manual (IDOT, 2005)
3
reaffirms this chart’s use. The minimum 12-inch improved subgrade thickness requirement is based on the assumption that most Illinois soils have an in-situ moisture content wet of optimum resulting in an in-situ IBV around 3 (IDOT, 2002). Figure 1 indicates an IBV of 3 requires a thickness of 12 inches. Although aggregate properties are not directly input, both Thompson et al. and the Subgrade Stability Manual (IDOT, 1982/2005) discuss the importance of aggregate properties to performance. They recommended a minimum Illinois Bearing Ratio (IBR) of 15 to 20 and an aggregate with low moisture sensitivity. Low moisture sensitivity was characterized by having crushed materials with a lower fines content having a low Plasticity Index (PI). While it has been used for over two decades, there is no record of any formal correlation of the empirical procedure described above with actual field performance. All information regarding field performance is anecdotal and can be biased based on a particular construction practice, material availability, and subjectivity of visual observations. This project provides an objective evaluation of field performance.
2. Phase 1: Test Loop A 1,100-ft test loop was incorporated into the US 67 Expressway construction project south of Jacksonville, Illinois (contract 72530). Adjacent sections of northbound and southbound subgrade in cut sections were selected for the test loop. Remedial action using aggregate was needed at this location because there was insufficient clay content in surficial soils for lime modification, and there were localized unstable areas.
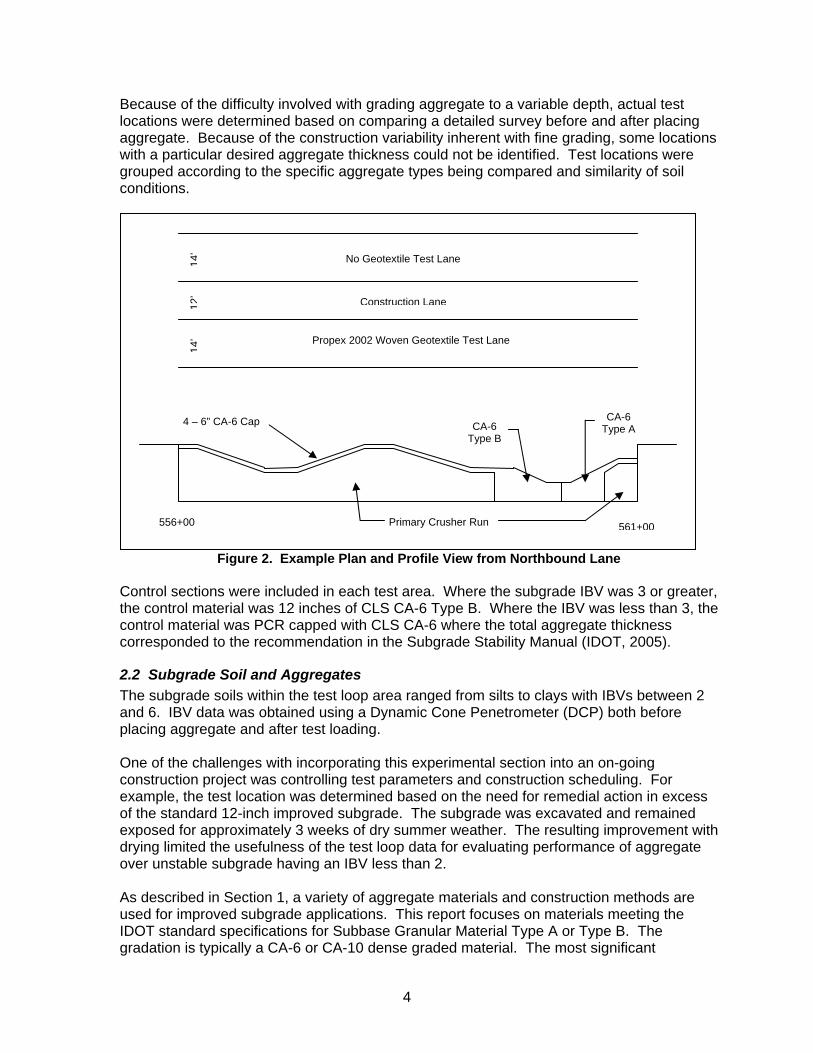
2.1 Construction Beginning in August 2003, the sections were excavated to a depth 2 feet below top of subgrade elevation over the full 40-foot width of pavement and shoulders. Each section was divided longitudinally into three lanes. The left and right lanes were considered test lanes. One test lane incorporated a Propex 2002 woven geotextile, and the other had no geotextile. The center lane was used as a construction lane enabling material to be delivered without loading the test lanes on either side. Several test locations having various aggregate types and thicknesses ranging from 6 inches to 24 inches were incorporated into the test loop. The aggregate thickness was determined based on the soil IBV and soil classification. A thickness range from 12 to 24 inches was used where IBV was below 3. Thicknesses ranged from 6 to 12 inches where IBV was higher than 3. Figure 2 shows an example plan and profile view from the northbound lane section. The bottom of the undercut was not compacted prior to placing aggregate. Aggregate gradations with a top particle size of 1.5 inches were typically placed in 6-inch layers on the test lanes using an excavator and were compacted using a smooth-drum vibratory roller. Compaction effort varied depending on the requirements of a particular test segment. Primary crusher run (PCR) was spread from previously placed material using a tracked bulldozer and was seated using a smooth-drum vibratory roller. Larger aggregates were capped with smaller aggregate. Grading to the desired aggregate thickness was performed using a small motor grader. Compaction was performed with a smooth-drum vibratory roller. Aggregates were compacted between 2 and 6 days prior to loading. This served as an example of a severe case where aggregate set-up may not occur.
4
Because of the difficulty involved with grading aggregate to a variable depth, actual test locations were determined based on comparing a detailed survey before and after placing aggregate. Because of the construction variability inherent with fine grading, some locations with a particular desired aggregate thickness could not be identified. Test locations were grouped according to the specific aggregate types being compared and similarity of soil conditions.
Figure 2. Example Plan and Profile View from Northbound Lane
Control sections were included in each test area. Where the subgrade IBV was 3 or greater, the control material was 12 inches of CLS CA-6 Type B. Where the IBV was less than 3, the control material was PCR capped with CLS CA-6 where the total aggregate thickness corresponded to the recommendation in the Subgrade Stability Manual (IDOT, 2005).
2.2 Subgrade Soil and Aggregates The subgrade soils within the test loop area ranged from silts to clays with IBVs between 2 and 6. IBV data was obtained using a Dynamic Cone Penetrometer (DCP) both before placing aggregate and after test loading. One of the challenges with incorporating this experimental section into an on-going construction project was controlling test parameters and construction scheduling. For example, the test location was determined based on the need for remedial action in excess of the standard 12-inch improved subgrade. The subgrade was excavated and remained exposed for approximately 3 weeks of dry summer weather. The resulting improvement with drying limited the usefulness of the test loop data for evaluating performance of aggregate over unstable subgrade having an IBV less than 2. As described in Section 1, a variety of aggregate materials and construction methods are used for improved subgrade applications. This report focuses on materials meeting the IDOT standard specifications for Subbase Granular Material Type A or Type B. The gradation is typically a CA-6 or CA-10 dense graded material. The most significant
No Geotextile Test Lane
Construction Lane
Propex 2002 Woven Geotextile Test Lane
14’
14’
12’
Primary Crusher Run
4 – 6” CA-6 Cap CA-6 Type B
CA-6 Type A
556+00 561+00
5
difference between the Type A and Type B is the compaction requirement. Type B requires compaction to the satisfaction of the Engineer, while Type A requires compaction to 95 percent of the maximum laboratory density determined according to AASHTO T 99. There is also a significant difference in the PI requirements for fines contained in uncrushed gravel and other crushed aggregate materials. Uncrushed gravel fines have a maximum PI of 9, while crushed material fines have no maximum PI specification. Subbase granular material is also used as a capping material when oversize aggregate is utilized. Aggregate types used in the test loop included dense graded aggregate (IDOT Gradation CA-6) consisting of both uncrushed gravel and CLS, reclaimed asphalt pavement (RAP), and PCR rockfill capped with CLS CA-6 and RAP. The CLS CA-6 had close to 12 percent fines, but all fines were non-plastic. The gravel CA-6 had roughly half the fines content as the CLS, but the fines had a high PI. Two sources of RAP were used. One was from surface millings only, and the other slightly coarser material was from a combination of surface and base course millings. Both RAP materials had less than 2 percent fines. PCR material consisted of well-graded CLS with a top size of approximately 9 inches. Appendix B includes a complete summary of all soil and aggregate properties.
2.3 Test Loading and Rut Measurement The test loop was loaded on October 2, 2003. Four tandem axle trucks made up to 270 passes over the test locations. The average gross truck weight was 48.6 kips. Using a 25-75 percent front-rear load split, the load on the dual wheel tandem axle was 36.5 kips, and the load on the front single axle was 12.2 kips. The average tire pressure on the tandem axle was 95 psi, and the average tire pressure on the front axle was 106 psi. Unfortunately, the size of the tires was not recorded. Ten to twenty passes were made on each test location between each rut measurement. Rut measurements were made using a straight edge in four locations within each test location. Two measurements were taken on each side in an effort to minimize the potential for erroneous data. When the magnitude of rutting became problematic to traverse, trucks were diverted onto the center construction lane. Trucks made loops between northbound and southbound lanes. Outside test lanes would be loaded while ruts were measured on the inside test lanes and vice versa. Trucks ran continuously for approximately 7 hours, with the exception of short hourly breaks and lunch. The maximum 270 passes were sufficient to model most construction situations. For example, approximately 60 equivalent load passes would be required to supply material to pave a 6-inch thick HMA lift over 1000 feet of 24-foot wide roadway.
2.4 Test Loop Rutting Data Analysis As discussed in Section 2.1, some desired test locations were not identified prior to loading. In some cases, this resulted in an inability to make the desired comparisons. Care was also taken to remove as many outside variables as possible when grouping results for comparison. For example, only locations with similar subgrade conditions and construction conditions were directly compared. The following sections discuss test loop results for each aggregate type.
6
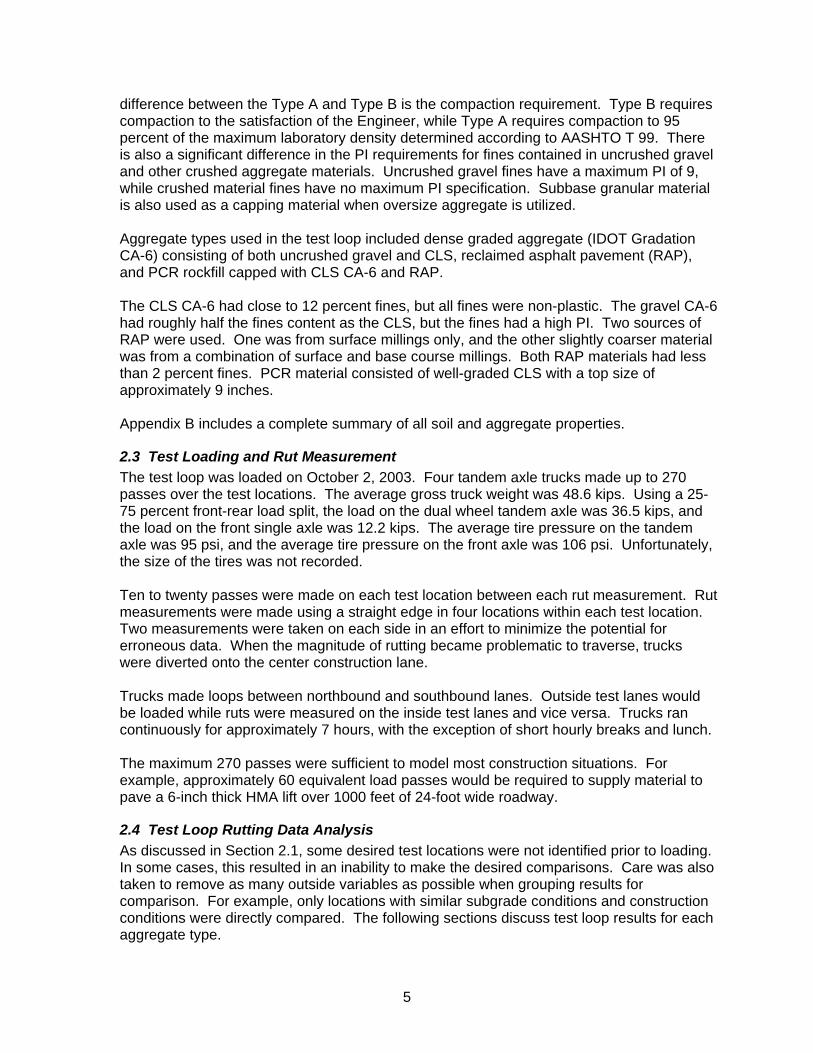
2.4.1 Uncrushed Gravel Uncrushed gravel CA-6 has been compared to the control CLS CA-6. Both materials were compacted to the satisfaction of the Engineer to model a Subbase Granular Material Type B. No Type A gravel was included in this study. Table 1 shows rutting data and Table 2 summarizes field conditions within the test area.
Table 1. Uncrushed CA-6 Gravel Rutting Information
Rut Depth After 10 Load Passes, mm No Geotextile Geotextile
Agg. Thickness Gravel CLS Gravel CLS 8” No Test No Test 167 96
10” 180 135 153 No Test 12” 143 46 (Control) No Test 52
Table 2. Uncrushed Gravel Test Location Field Property Summary
Gravel CLS Comment
Agg. Field Compaction 91.8% 93.4% Spec = Satisfaction of
Engineer Fines 6.9% 8%
PI 19 NP Agg. Lab CBR 68 104 At field compaction
Subgrade Clay with IBV = 5 Location IDs S750R, S830R, S840R, S870R, S760L, S820L, S850L, S860L
The data shown in Table 1 indicates all locations exhibited significant rutting. The gravel CA-6 performed poorly and there was no significant difference between the lanes with and without geotextile. The CLS CA-6 also performed poorly. The control location showed almost 50 mm of rutting after only 10 passes. Figure 3 visually shows the magnitude of rutting representative of these locations. Accurately measuring rut depth was difficult in these situations because there was a combination of rutting and shoving. As a result, no meaningful data was obtained following the 10 load pass measurements. Trucks were diverted to the construction lane after about 20 passes because of difficulty driving through the ruts.
7
Figure 3. Test Location S840R: 12” Gravel without Geotextile after 20 Load Passes The poor performance of this section may have been a direct result of inadequate compaction. The subgrade IBV was sufficient to support the aggregate thickness used, and the clay soil within the gravel test area was not prone to pumping. Therefore, most of the rutting occurred within the aggregate layer itself. If an area is compacted only to the “satisfaction of the Engineer,” the quality of compaction can vary depending on the Engineer’s bias and also material type. Both the gravel and CLS sections were compacted using the same compactive effort. The CLS was able to achieve a higher percent compaction perhaps due to a larger amount of fines. The rounded particle shape of the uncrushed gravel is likely to have contributed to the higher rut depth when compared to the CLS. Also, the laboratory CBR data shown in Table 2 does not accurately represent the field performance of either aggregate. The laboratory CBR test was performed at close to the same percent compaction and moisture content of that observed in the field. The lab data indicated relatively high CBRs, which should have indicated the ability to support the 10 load passes. This shows CBR to be an unreliable test on gravel, most likely because of the confining effects of the mold.
2.4.2 Reclaimed Asphalt Pavement While RAP is typically used in subgrades as a capping material for oversize aggregate or mixed with larger aggregate, its availability in certain parts of Illinois makes it a potential full-depth alternative to CA-6 in improved subgrade applications. Two sources of RAP were compared to CLS. Both materials were compacted to the “satisfaction of the Engineer” to model a subbase granular material, Type B. Table 3 shows rutting data, and Table 4 summarizes field conditions within the test area. Figure 4 is a picture of a RAP test location after loading.
8
Table 3. RAP Rutting Information
Rut Depth, mm No Geotextile – 10 Passes Geotextile – 20 Passes
Agg. Thickness Surface Base +
Surface CLS Surface Base + Surface CLS
8” 102 77 - 64 - - 10” 62 66 - 65 48 - 12” 70 49 42 (Control) 50 40 53
Table 4. RAP Test Location Field Property Summary
Surface Base +
Surface CLS Comments
Agg. Field Compaction 93.6% 98.6% 92.1% Spec = Satisfaction of Engineer
Fines 0.7% 1.7% 8% PI No Test No Test NP
Agg. Lab CBR 17 23 104 At field compaction Subgrade Silty Clay Loam with IBV = 5.5
Location IDs S210R, S180R, S160R, S140R, S100R, S090R, S210L, S190L, S170L, S150L,S090L, & S080L
Figure 4. Test Location S180R 12” of Surface Millings after 20± Load Passes The data in Table 3 shows that all test locations exhibited excessive rutting after a relatively small number of load passes. Like Figure 3, Figure 4 shows the difficulty in obtaining
9
accurate rut depth measurements when both rutting and shoving are involved. Trucks were diverted from these test locations after 20 to 30 passes. The CLS control sections again demonstrated unsatisfactory performance. Both RAP materials performed poorly, with the base + surface millings performing slightly better than surface millings alone. Like the uncrushed gravel section, the subgrade soils had more than adequate stability to support the aggregate thicknesses utilized. Table 4 indicates the base + surface millings achieved almost 99 percent compaction using the same compactive effort as that on the surface millings and CLS. This indicates compaction may not have the biggest influence on the RAP’s performance. Similar to the CLS control location in the uncrushed gravel section, the CLS control location in the RAP section performed poorly. Compaction again probably played a role in the poor CLS performance. The poor performance of RAP may be a result of a lack of fines, which allows larger particles to more readily shift position under load. Both materials had less than 2 percent passing the #200 sieve. The slightly better performance of the base + surface millings could be a result of its coarser gradation, which may provide more interlock between particles. The laboratory CBR of RAP materials is significantly lower than that of the CLS or gravel materials. In this case, the low CBRs are reflected in the field performance. The use of geotextile slightly decreased the rutting potential, but it did not demonstrate sufficient improvement to make the RAP performance acceptable.
2.4.3 Crushed Limestone (CLS) CA-6 with no Geotextile Two CLS CA-6 materials having similar physical properties but different compaction efforts were compared at different thicknesses. The control location consisting of 12 inches Type B CLS was compared to thicknesses ranging from 6 to 10 inches. Each thickness was represented by a Type A and Type B compaction requirement. Unfortunately, a 12-inch Type A test location could not be identified by survey to directly correlate with the control location. A location with oversized crushed limestone material (primary crusher run) capped with Type B CA-6 (PCRB) was also included to determine if there are benefits to using oversize materials. In general, these materials performed significantly better than the uncrushed gravel and RAP materials discussed in the previous sections. As a result, a more complete set of data was obtained. Figure 5 shows the average rut depth versus the number of load passes for a variety of CLS thicknesses and compactive efforts with no geotextile.
10
0
10
20
30
40
50
60
70
80
0 30 60 90 120 150 180 210 240 270
Load Passes
Ave
rage
Rut
Dep
th (m
m)
12" PCRB
12" B CTRL
10" B
6" B
6" A
8" A
10" A
Figure 5. Crushed Limestone CA-6 Rut Depth versus Load Passes with no Geotextile
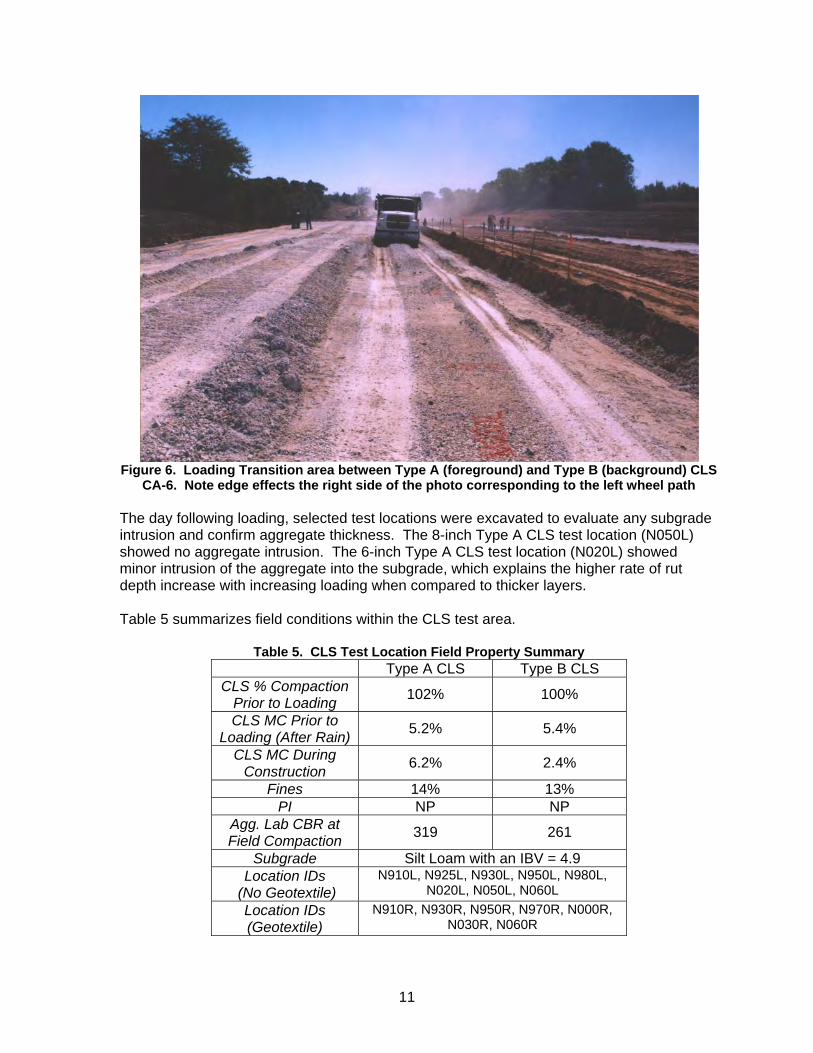
The data shown in Figure 5 indicates Type A materials outperform Type B materials. The rutting observed within the 12-inch Type B CLS control section was similar to that observed within the uncrushed gravel and RAP CLS control locations. However, the Type A material outperformed the control material at every thickness down to 6 inches. The oversize material capped with Type B material performed only slightly better than the control. With the exception of the 8-inch Type A CLS, all of the materials exceeded the maximum 0.5-inch (12.5 mm) rut depth allowed by IDOT policy (IDOT, 2005). Complete rutting data is shown in Appendix C. After approximately 20 load passes, the left most wheel path over the length of the Type B material showed approximately two times the rutting depth as the right wheel path as shown in Figure 6. The likely reason for these edge effects is inadequate compaction along the left edge. To compensate for this, the Type B data rutting data described in this section represents the average of the 2 rut depth measurements opposite the edge, with the largest two measurements along the edge discarded. The test location representing the 8-inch Type B material (N950L) has also been discarded because, even after compensating for edge effects, the rut measurement after 20 passes was 112 mm. This value is unrealistically high, especially given the measurements obtained at the 6-inch test location. A review of subgrade data indicates the high rut depth may have been due to a localized area with IBV less than 3.
11
Figure 6. Loading Transition area between Type A (foreground) and Type B (background) CLS
CA-6. Note edge effects the right side of the photo corresponding to the left wheel path The day following loading, selected test locations were excavated to evaluate any subgrade intrusion and confirm aggregate thickness. The 8-inch Type A CLS test location (N050L) showed no aggregate intrusion. The 6-inch Type A CLS test location (N020L) showed minor intrusion of the aggregate into the subgrade, which explains the higher rate of rut depth increase with increasing loading when compared to thicker layers. Table 5 summarizes field conditions within the CLS test area.
Table 5. CLS Test Location Field Property Summary Type A CLS Type B CLS
CLS % Compaction Prior to Loading 102% 100%
CLS MC Prior to Loading (After Rain) 5.2% 5.4%
CLS MC During Construction 6.2% 2.4%
Fines 14% 13% PI NP NP
Agg. Lab CBR at Field Compaction 319 261
Subgrade Silt Loam with an IBV = 4.9 Location IDs
(No Geotextile) N910L, N925L, N930L, N950L, N980L,
N020L, N050L, N060L Location IDs (Geotextile)
N910R, N930R, N950R, N970R, N000R, N030R, N060R
12
The percent compaction data prior to loading in Table 5 seems to contradict the hypothesis that compaction had a significant influence on performance. The Type B CLS showed a percent compaction close to that of the Type A CLS, even though Type A materials had significantly better performance. During compaction, preliminary density and moisture content tests were performed on Type A CLS to insure the 95 percent compaction specification was achieved. The roller operator was also instructed to make additional passes on the Type A CLS. The poor performance of the Type B CLS with a high percent compaction may be related to a 1.5-inch rainfall that occurred between construction and loading. As shown in Table 5, water infiltration increased the Type B CLS moisture content 3 percent. By comparison, the moisture content of the Type A CLS, which was delivered with a higher moisture content, showed a decrease in moisture content during the same period. The information in Table 5 also indicates the fines content exceeds the IDOT specification of 12 percent for a CA-6 gradation. While this could be a result of the sampling technique used on the small, end-dumped construction stockpiles, it is likely the actual fines content is close to 12 percent. The increase in moisture content combined with the high fines content likely caused unstable conditions within the Type B aggregate independent of density. If more time had passed between the rainfall and loading, performance of CLS Type B locations may have been better.
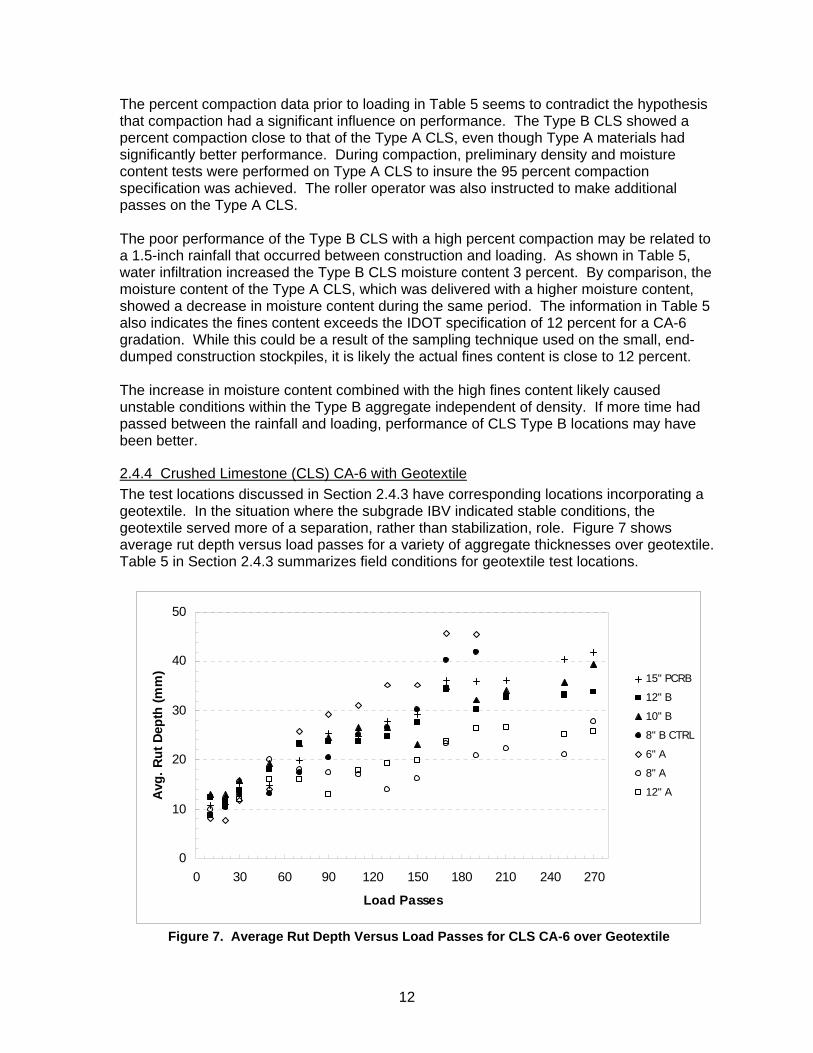
2.4.4 Crushed Limestone (CLS) CA-6 with Geotextile The test locations discussed in Section 2.4.3 have corresponding locations incorporating a geotextile. In the situation where the subgrade IBV indicated stable conditions, the geotextile served more of a separation, rather than stabilization, role. Figure 7 shows average rut depth versus load passes for a variety of aggregate thicknesses over geotextile. Table 5 in Section 2.4.3 summarizes field conditions for geotextile test locations.
0
10
20
30
40
50
0 30 60 90 120 150 180 210 240 270
Load Passes
Avg
. Rut
Dep
th (m
m) 15" PCRB
12" B
10" B
8" B CTRL
6" A
8" A
12" A
Figure 7. Average Rut Depth Versus Load Passes for CLS CA-6 over Geotextile
13
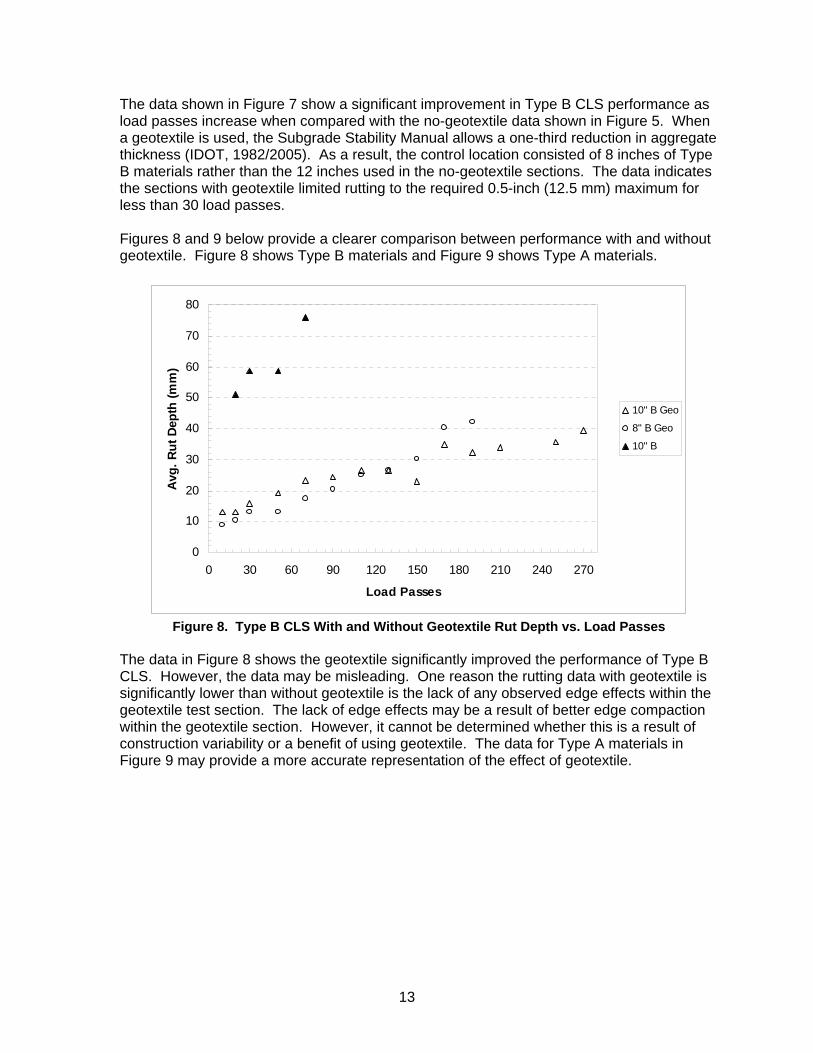
The data shown in Figure 7 show a significant improvement in Type B CLS performance as load passes increase when compared with the no-geotextile data shown in Figure 5. When a geotextile is used, the Subgrade Stability Manual allows a one-third reduction in aggregate thickness (IDOT, 1982/2005). As a result, the control location consisted of 8 inches of Type B materials rather than the 12 inches used in the no-geotextile sections. The data indicates the sections with geotextile limited rutting to the required 0.5-inch (12.5 mm) maximum for less than 30 load passes. Figures 8 and 9 below provide a clearer comparison between performance with and without geotextile. Figure 8 shows Type B materials and Figure 9 shows Type A materials.
0
10
20
30
40
50
60
70
80
0 30 60 90 120 150 180 210 240 270
Load Passes
Avg.
Rut
Dep
th (m
m)
10" B Geo
8" B Geo
10" B
Figure 8. Type B CLS With and Without Geotextile Rut Depth vs. Load Passes
The data in Figure 8 shows the geotextile significantly improved the performance of Type B CLS. However, the data may be misleading. One reason the rutting data with geotextile is significantly lower than without geotextile is the lack of any observed edge effects within the geotextile test section. The lack of edge effects may be a result of better edge compaction within the geotextile section. However, it cannot be determined whether this is a result of construction variability or a benefit of using geotextile. The data for Type A materials in Figure 9 may provide a more accurate representation of the effect of geotextile.
14
0
10
20
30
40
50
60
70
80
0 30 60 90 120 150 180 210 240 270
Load Passes
Avg.
Rut
Dep
th (m
m)
6" A Geo
8" A Geo
6" A
8" A
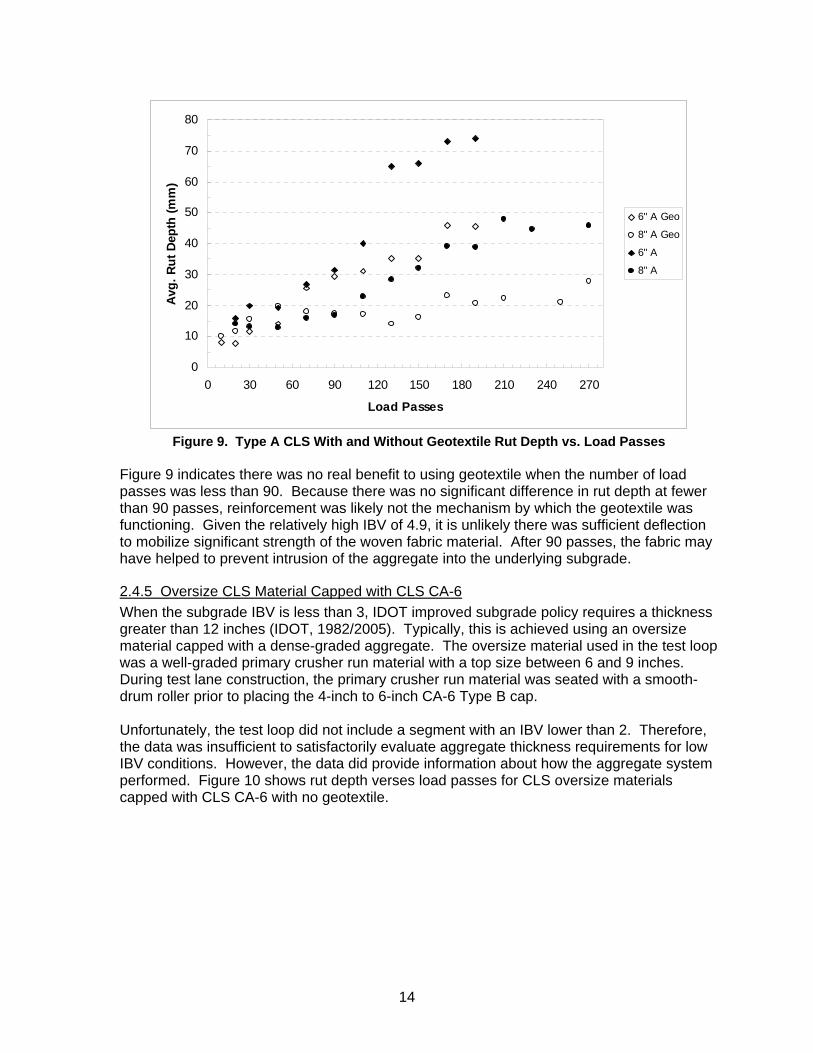
Figure 9. Type A CLS With and Without Geotextile Rut Depth vs. Load Passes
Figure 9 indicates there was no real benefit to using geotextile when the number of load passes was less than 90. Because there was no significant difference in rut depth at fewer than 90 passes, reinforcement was likely not the mechanism by which the geotextile was functioning. Given the relatively high IBV of 4.9, it is unlikely there was sufficient deflection to mobilize significant strength of the woven fabric material. After 90 passes, the fabric may have helped to prevent intrusion of the aggregate into the underlying subgrade.
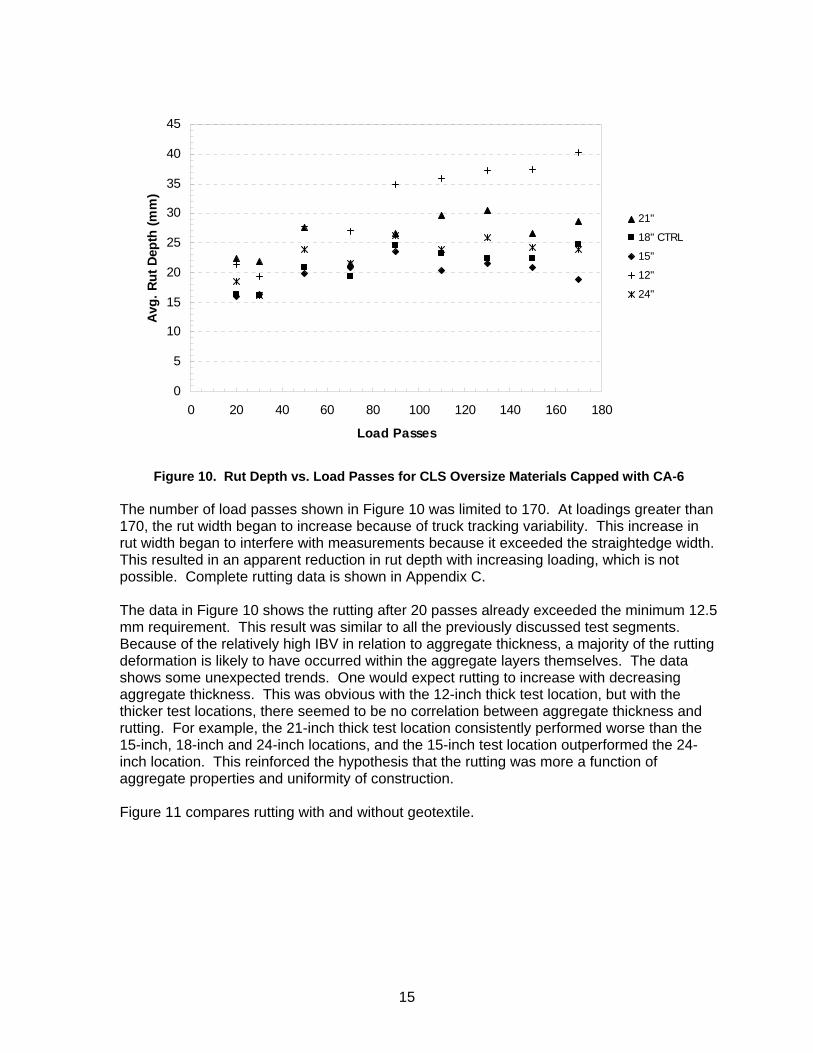
2.4.5 Oversize CLS Material Capped with CLS CA-6 When the subgrade IBV is less than 3, IDOT improved subgrade policy requires a thickness greater than 12 inches (IDOT, 1982/2005). Typically, this is achieved using an oversize material capped with a dense-graded aggregate. The oversize material used in the test loop was a well-graded primary crusher run material with a top size between 6 and 9 inches. During test lane construction, the primary crusher run material was seated with a smooth-drum roller prior to placing the 4-inch to 6-inch CA-6 Type B cap. Unfortunately, the test loop did not include a segment with an IBV lower than 2. Therefore, the data was insufficient to satisfactorily evaluate aggregate thickness requirements for low IBV conditions. However, the data did provide information about how the aggregate system performed. Figure 10 shows rut depth verses load passes for CLS oversize materials capped with CLS CA-6 with no geotextile.
15
0
5
10
15
20
25
30
35
40
45
0 20 40 60 80 100 120 140 160 180
Load Passes
Avg.
Rut
Dep
th (m
m)
21"
18" CTRL
15"
12"
24"
Figure 10. Rut Depth vs. Load Passes for CLS Oversize Materials Capped with CA-6
The number of load passes shown in Figure 10 was limited to 170. At loadings greater than 170, the rut width began to increase because of truck tracking variability. This increase in rut width began to interfere with measurements because it exceeded the straightedge width. This resulted in an apparent reduction in rut depth with increasing loading, which is not possible. Complete rutting data is shown in Appendix C. The data in Figure 10 shows the rutting after 20 passes already exceeded the minimum 12.5 mm requirement. This result was similar to all the previously discussed test segments. Because of the relatively high IBV in relation to aggregate thickness, a majority of the rutting deformation is likely to have occurred within the aggregate layers themselves. The data shows some unexpected trends. One would expect rutting to increase with decreasing aggregate thickness. This was obvious with the 12-inch thick test location, but with the thicker test locations, there seemed to be no correlation between aggregate thickness and rutting. For example, the 21-inch thick test location consistently performed worse than the 15-inch, 18-inch and 24-inch locations, and the 15-inch test location outperformed the 24-inch location. This reinforced the hypothesis that the rutting was more a function of aggregate properties and uniformity of construction. Figure 11 compares rutting with and without geotextile.
16
0
5
10
15
20
25
30
35
40
45
0 20 40 60 80 100 120 140 160 180
Load Passes
Avg.
Rut
Dep
th (m
m)
12" GEO
15" GEO
18" GEO
12"
15"
18"
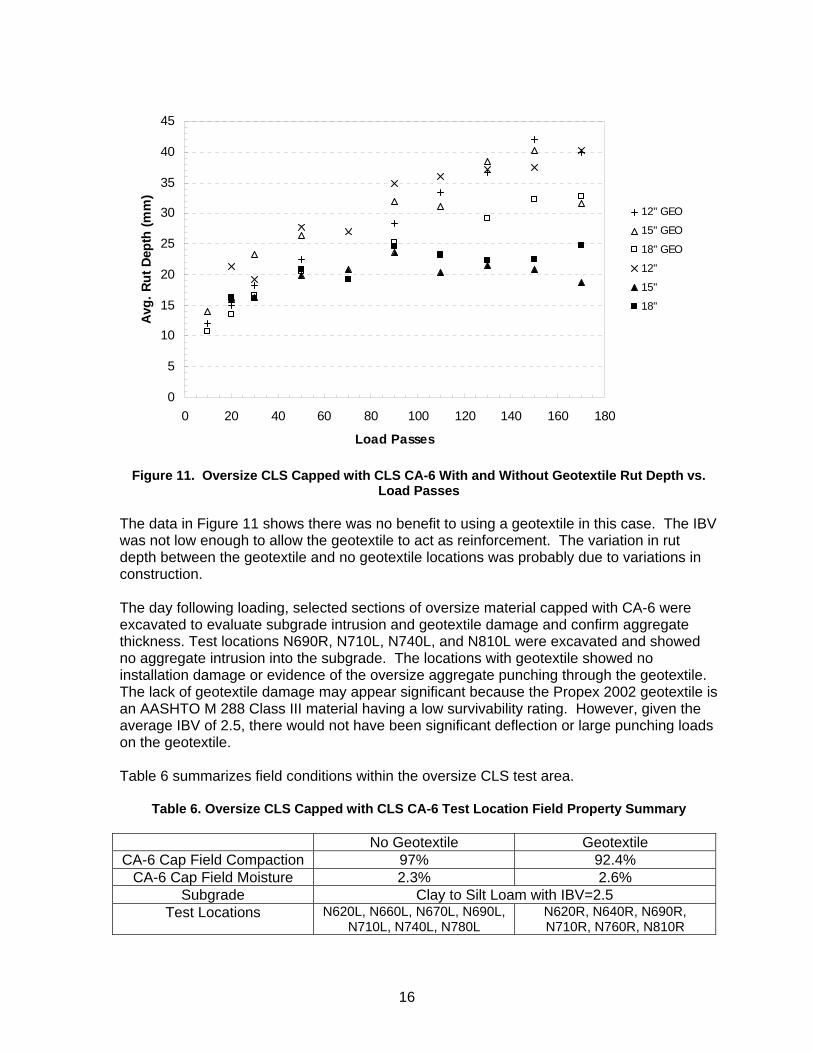
Figure 11. Oversize CLS Capped with CLS CA-6 With and Without Geotextile Rut Depth vs.
Load Passes The data in Figure 11 shows there was no benefit to using a geotextile in this case. The IBV was not low enough to allow the geotextile to act as reinforcement. The variation in rut depth between the geotextile and no geotextile locations was probably due to variations in construction. The day following loading, selected sections of oversize material capped with CA-6 were excavated to evaluate subgrade intrusion and geotextile damage and confirm aggregate thickness. Test locations N690R, N710L, N740L, and N810L were excavated and showed no aggregate intrusion into the subgrade. The locations with geotextile showed no installation damage or evidence of the oversize aggregate punching through the geotextile. The lack of geotextile damage may appear significant because the Propex 2002 geotextile is an AASHTO M 288 Class III material having a low survivability rating. However, given the average IBV of 2.5, there would not have been significant deflection or large punching loads on the geotextile. Table 6 summarizes field conditions within the oversize CLS test area.
Table 6. Oversize CLS Capped with CLS CA-6 Test Location Field Property Summary
No Geotextile Geotextile CA-6 Cap Field Compaction 97% 92.4%
CA-6 Cap Field Moisture 2.3% 2.6% Subgrade Clay to Silt Loam with IBV=2.5
Test Locations N620L, N660L, N670L, N690L, N710L, N740L, N780L
N620R, N640R, N690R, N710R, N760R, N810R
17
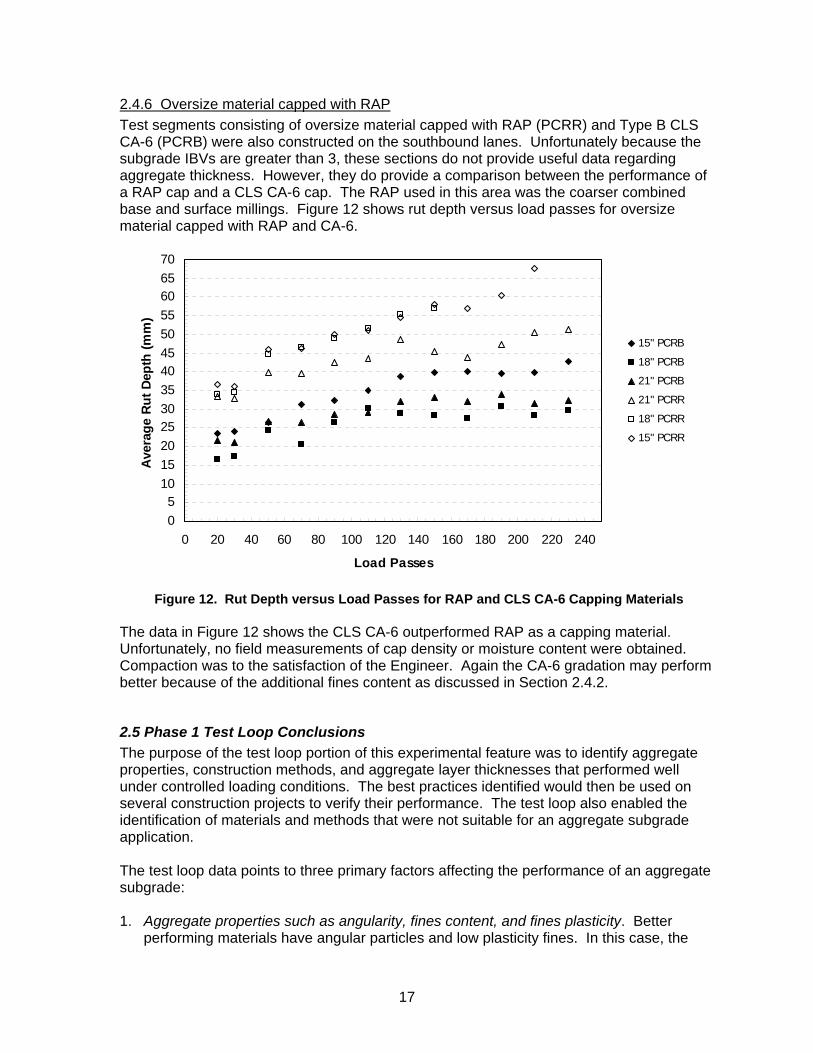
2.4.6 Oversize material capped with RAP Test segments consisting of oversize material capped with RAP (PCRR) and Type B CLS CA-6 (PCRB) were also constructed on the southbound lanes. Unfortunately because the subgrade IBVs are greater than 3, these sections do not provide useful data regarding aggregate thickness. However, they do provide a comparison between the performance of a RAP cap and a CLS CA-6 cap. The RAP used in this area was the coarser combined base and surface millings. Figure 12 shows rut depth versus load passes for oversize material capped with RAP and CA-6.
05
10152025303540455055606570
0 20 40 60 80 100 120 140 160 180 200 220 240
Load Passes
Ave
rage
Rut
Dep
th (m
m)
15" PCRB
18" PCRB
21" PCRB
21" PCRR
18" PCRR
15" PCRR
Figure 12. Rut Depth versus Load Passes for RAP and CLS CA-6 Capping Materials
The data in Figure 12 shows the CLS CA-6 outperformed RAP as a capping material. Unfortunately, no field measurements of cap density or moisture content were obtained. Compaction was to the satisfaction of the Engineer. Again the CA-6 gradation may perform better because of the additional fines content as discussed in Section 2.4.2.
2.5 Phase 1 Test Loop Conclusions The purpose of the test loop portion of this experimental feature was to identify aggregate properties, construction methods, and aggregate layer thicknesses that performed well under controlled loading conditions. The best practices identified would then be used on several construction projects to verify their performance. The test loop also enabled the identification of materials and methods that were not suitable for an aggregate subgrade application. The test loop data points to three primary factors affecting the performance of an aggregate subgrade: 1. Aggregate properties such as angularity, fines content, and fines plasticity. Better
performing materials have angular particles and low plasticity fines. In this case, the
18
CLS CA-6 had a relatively high fines content, but other factors like angularity and low plasticity probably offset the quantity of fines. The high fines content in CLS CA-6, however, may have contributed to overall performance not meeting the 12.5-mm maximum rut depth requirement. The poor performance of the uncrushed gravel was likely significantly affected by the rounded shape of particles providing little or no interlock and the high plasticity of fines. The poor performance of RAP materials was likely affected by their lack of fines.
2. Aggregate layer compaction during placement. The data shows compaction had a significant effect on performance. The denser a material was at the time of placement, the better it performed, and the better it tolerated rainfall without a loss in performance. This was clearly shown in the performance difference between Type A CLS materials which were compacted to a specified density and Type B CLS materials compacted to the subjective “satisfaction of the Engineer”.
3. The number of loading passes. The data in the figures show, as expected, that rutting increased with the number of loading passes. The material properties mentioned in items 1 and 2 above had a large effect on the rate of rut depth increase.
Notice the subgrade IBV is absent from the above list. In many cases, the aggregate thicknesses evaluated were greater than needed given the subgrade IBV values within each test segment. Additionally, excavation following loading indicated little or no permanent deformation of the subgrade soils. These items indicated that, at IBV values of 3 or greater, the aggregate properties were likely to control performance. The data also showed the use of geotextile did not necessarily improve performance. Therefore, the use of geotextile was not considered a primary factor in test loop performance given the subgrade IBV and aggregate thicknesses used. As mentioned earlier, there was a 1.5-inch rainfall 4 days prior to test loading. The rainfall may have exaggerated the effect of aggregate properties and compaction discussed in the three primary items above. The performance of the Type A CLS was not significantly affected by the rainfall. Other materials reacted poorly to the increase in moisture content. It is possible a longer wait between rainfall and loading would have improved performance, but during actual construction conditions, the schedule may not allow such a delay. The information obtained from the test loop confirmed the one-size-fits-all approach to IDOT’s improved subgrade policy does not result in consistent, satisfactory performance. All the materials used in the test loop are currently used in various areas of the state. The current chart shown in the Subgrade Stability Manual does not accurately predict performance for all combinations of aggregate type and construction methods.
3. Phase 2: Field Verification The test loop results identified “best practices” which result in the least amount of rutting with the greatest number of loading applications. These “best practices” are summarized below: 1. At subgrade IBVs of 3 or greater, 8 inches of Type A CLS CA-6 with low plasticity fines
compacted to 95 percent of the maximum laboratory density. 2. At subgrade IBVs of 2 or less, the remedial treatment thickness guidelines can be
reduced by 20 percent when well-graded, oversized aggregate is capped with Type B CLS CA-6.
19
Projects where the pavement is constructed of full-depth HMA were desired because they represent the most severe subgrade loading conditions. An original group of six candidate projects was reduced to three. The three eliminated projects primarily utilized lime modification for improved subgrade with aggregate reserved for remedial action locations. Due to project scheduling, economics, or site conditions, deep lime modification, improved drainage, or disking and drying were used instead of aggregate for remedial action on the eliminated projects. The three remaining projects included significant lengths of improved subgrade utilizing aggregate instead of lime. Typical construction procedures were used to construct experimental sections within each project. Contractors were not required to alter any loading patterns. As a result, each project represents a “real-world” situation. While the sections below concentrate on rutting as a result of loading during paving, the process of delivering, spreading and compacting aggregate also heavily loads subgrades and aggregate layers. In all cases, the aggregate layer is constructed using 2 lifts with the first lift supporting construction of the second. As a result, the loading described in the following sections only represents the portion of the total loading on an aggregate layer that occurred during HMA paving. The following sections describe the construction, loading, and rutting results for three projects.
3.1 Illinois 97 Contract 72773 The Illinois 97 project realigned IL 97 over a distance of approximately 2,450 ft to a new intersection with IL 125 west of Springfield. The roadway was constructed between May and August 2004. The roadway cross-section consisted of two 12-ft wide lanes with 8-ft wide paved shoulders and a minimum 3-ft deep ditch on both sides. The IL 97 pavement design consisted of 13 inches full-depth HMA pavement over an experimental improved subgrade of 8 inches Type A CLS CA-6. No control section was included in this project.
3.1.1 Subgrade Conditions and Aggregate Information The project included both cut and fill sections. A majority of subgrade soils consisted of clay, silty clay, and silty clay loam. The IBV within the top 18 inches ranged from 3 to 18 with an average of 9. One 450-ft long section within a cut area required remedial treatment. The soils consisted of wet silt with an IBV range between less than 1 and 3. Because of the number of locations having an IBV of 1, a total aggregate layer thickness of 20 inches was selected representing a 20 percent reduction in Subgrade Stability Manual recommended thickness shown in Figure 1 (IDOT, 1982/2005). The total remedial aggregate thickness consisted of 12 inches of crushed limestone PCR material capped with the planned 8-inch Type A CLS CA-6 used on the rest of the project. Geotextiles were not used. A transverse drain was installed at the downslope end of the undercut to provide drainage. The majority of the CLS CA-6 was delivered from Material Service in Athens, and a small quantity was delivered from Central Stone in Florence. The Florence operation also provided material for the test loop phase of this study. The Athens material fines had a PI between 4 and 10 depending on the source ledge. Field compaction exceeded 100 percent of the maximum laboratory density in all cases.
20
Appendix D includes detailed subgrade and aggregate data.
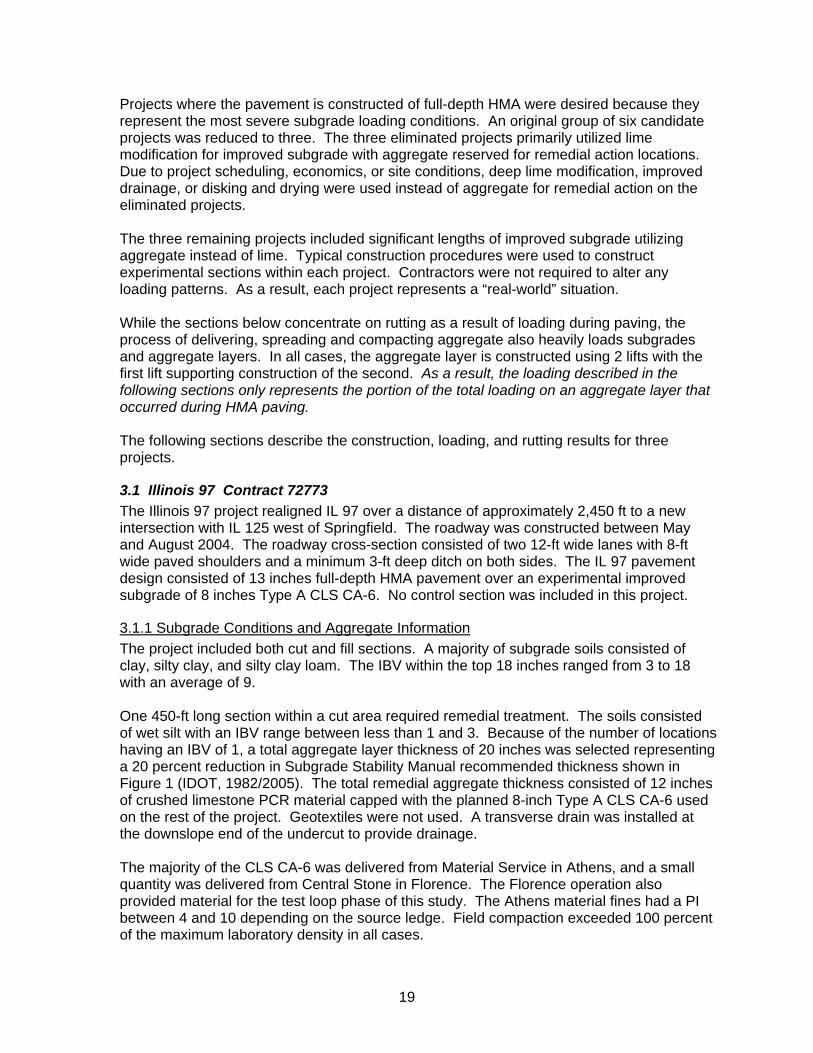
3.1.2 Loading and Rutting Information Paving was performed one lane width at a time, beginning on the south end of the project. There was a truck access point at Station 27+825, which was the approximate midpoint of paving. As a result, locations farthest from the access had the lowest number of load passes, and locations closest to the access were the most heavily loaded and included turning movements. Aggregate was delivered using a majority of tandem axle trucks with some semis. To account for the variable loading, one semi was assumed equivalent to 2 35-kip tandem axle load passes. The number of passes was determined based on a known starting point and an estimated 65 lineal feet of paving per truck. Observations of rutting were made on the second day of paving. As with the test loop, 4 measurements of rutting were obtained using a straight edge at selected locations. Table 7 summarizes the IL 97 rutting data. The table shows the 4 individual rut depth measurements at each location. The loading shown in the table represents the maximum estimated loading prior to HMA placement, but it does not include loading during aggregate layer construction.
Table 7. IL 97 Rutting Data Station Aggregate & Subgrade Loading Rut, mm Comments 27+487
NB 12” PCR w/ 8” Type A CLS
over Silt w/ IBV = 2 7 passes 0/0/0/0 Typical of undercut area
27+512 NB
12” PCR w/ 8” Type A CLS over Silt w/ IBV < 1 8 passes 5/5/2/5
27+750 NB
8” Type A CLS over possible localized silt
pocket in fill w/ IBV = 9
27 passes
18/18/15/18
Pumpy area
27+775 NB
8” Type A CLS over SiCL w/ IBV = 13±
28 passes 15/5/12/2 Typical performance
example
27+775 SB
8” Type A CLS over possible localized silt
pocket in fill w/ IBV = 13±
28 passes
12/10/10/12
Slight pumping noted
27+840 SB
8” Type A CLS over SiCL w/ IBV = 7±
32 passes
29/12/35/25 with shoving
Wet, low side of superelevation & truck
turning area 27+900
SB 8” Type A CLS over SiCL
w/ IBV = 9 3 passes 0/5/10/0 Typical performance example
The shaded rows in Table 7 represent the typical performance observed for the 8-inch Type A CLS CA-6 over untreated subgrade. The observations indicate satisfactory performance over a majority of aggregate. In areas exhibiting some pumping, rutting was either below or did not significantly exceed the 12.5 mm maximum allowable depth. The worst performing location corresponded to the mid-project truck entrance where trucks were turning to back up to the paver. The worst rutting at that location was located on the poorly-drained low side of the superelevation. This condition likely would have also caused problems for a 12-inch aggregate layer, so it did not necessarily reflect poorly on the reduction in aggregate thickness.
21
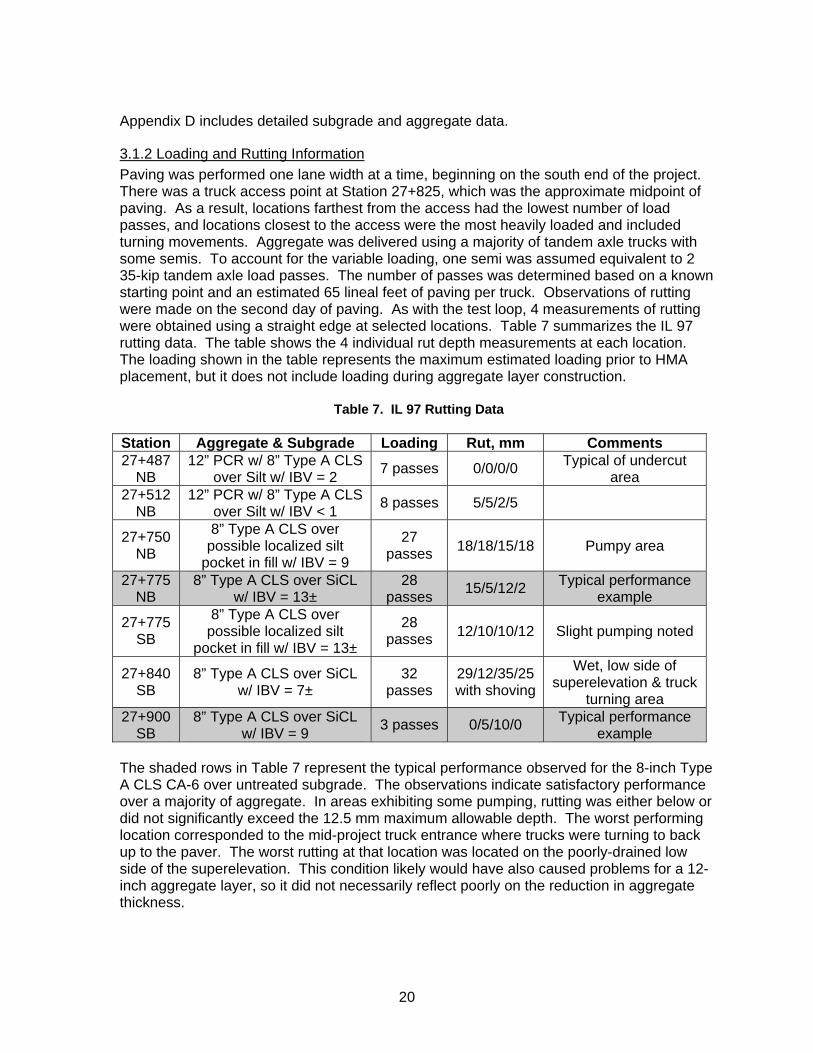
3.2 IL 29 Expressway Contract 72536 The IL 29 project included constructing approximately 6 miles of new expressway northwest of Taylorville. The experimental section was located in the transition from a rural section with a lime modified improved subgrade to an urban section with an aggregate improved subgrade. Construction within the experimental area occurred in July and August 2005. A 550± ft long section of the southbound lanes between Stations 1168+22 and 1173+79, including a side road intersection, was selected for the experimental use of 8 inches of Type A CLS. Unlike the IL 97 project, a 220-ft long control section between Stations 1166+00 and 1168+22 was included utilizing 12 inches Type B CLS. The pavement design was 13.25 inches full-depth HMA over either aggregate or lime modified improved subgrade. Within the experimental area, the pavement cross-section included two 12-ft lanes, a 6-ft wide HMA left shoulder, and concrete curb and gutter on the right. A ditch was included with the storm sewer to control surface runoff.
3.2.1 Subgrade Conditions and Aggregate Information The subgrade within the experimental and control sections was constructed over an existing ditch requiring both cut and fill over the width of the proposed cross-section. However, soil conditions were somewhat consistent because the cut material was used for fill within the same area. The predominant soil type was silty clay and silty clay loam. The east half of the experimental section between Stations 1169+50 and 1172+50 included some loam till used to correct grade prior to placing aggregate. The average IBV within the top 18 inches of the control and experimental sections was 9. Aggregate consisted of CLS CA-6 with 8 percent passing the #200 sieve and a fines PI of 10±. Both the experimental and control sections utilized the same aggregate. Within the experimental section, the Type A CLS was compacted to over 100 percent of the maximum laboratory density. Because no density tests are required for the Type B CLS, no field density tests were performed in the control section. Appendix E includes more detailed aggregate and subgrade test data.
3.2.2 Loading and Rutting Data The control and experimental sections were loaded at different times because of construction scheduling. Tandem axle trucks were used to deliver HMA to both the control and experimental sections. Because of the spacing of temporary entrances, an average of 6 load passes was made for any given location during paving. Because of transition and intersection area width, paving was performed in three 12± ft wide passes. Combined with the location of the truck entrances, this resulted in a more random truck loading pattern. The rutting measurements were taken over a wider area at each location, and corresponded to a left-centerline-right offset pattern rather than the 2 measurements in each wheel path used in the test loop and IL 97. Within the control section, no rutting was observed. Station 1168+00 was the most heavily loaded, with trucks delivering HMA and trucks delivering aggregate to complete construction of the experimental section. Rut measurements at that location indicated no rutting. Table 8 summarizes rut measurements in the 8-inch thick experimental section.
22
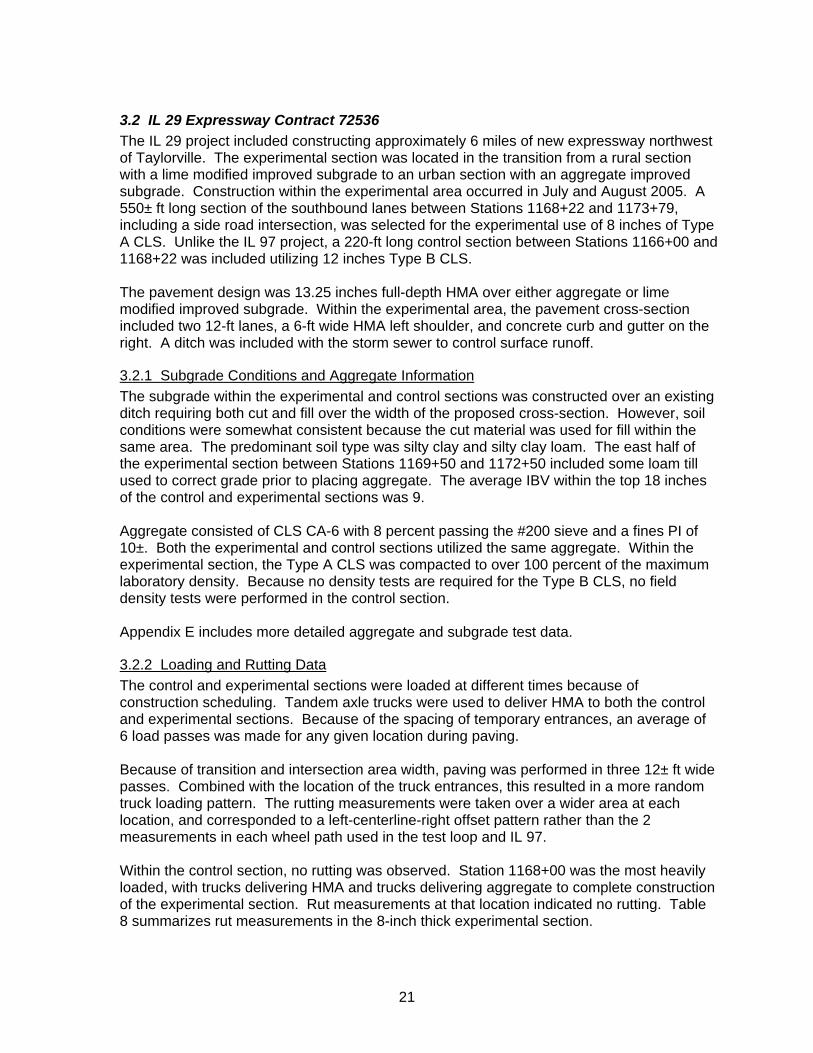
Table 8. IL 29 Rutting Data for 8-inch Type A CLS.
Station Subgrade Conditions Rut Depth, mm left/center/right
1169+00 Clay Loam IBV = 24 7/0/0 1169+50± Clay Loam IBV = 7 0/0/0 1170+00 SiCL with Loam Till
IBV = 8 7/0/7
1171+00 Silty Clay IBV = 4 0/7/0 1171+80± Silty Clay 7/7/7 1172+00 Clay Loam with Loam Till
IBV = 5 0/0/0
1173+00 Clay Loam IBV = 8 0/0 The data shown in Table 8 indicates the 8-inch Type A CLS performed as well as the 12-inch thick Type B CLS control section. The data was also similar to the typical performance described in Table 7 for IL 97. While no aggregate density information was available for the control section, the results still show a thinner aggregate layer performed the same as a thicker layer of the same aggregate.
3.3 IL 96 Contract 72240 The IL 96 project was a 5-mile long resurfacing project with a 900-ft long vertical realignment in Plainville. The experimental section was located within the vertical realignment between Stations 1524+00 and 1533+00. This project differed from the others because the experimental section uses 6 inches of Type B CLS as improved subgrade instead of the 8-inch Type A CLS identified as a best practice. As with the IL 97 project, there was no control section. The pavement design in the experimental section consisted of 13.5 inches full-depth HMA over the 6-inch experimental CLS improved subgrade.
3.3.1 Subgrade and Aggregate The subgrade was in a cut section consisting of high moisture content silty clay loams. Unstable areas were encountered over a significant length of the section. The unstable soils were located beneath the top 12 inches where disking and drying had been attempted. The unstable areas were full width between 1526+00 and 1528+25 and between 1532+00 and 1533+00. The unstable area was only on the left half between stations 1528+25 and 1532+00. The average IBV in the unstable areas was 2, with some areas having IBVs less than 1. The average IBV below the planned 6 inches Type B CLS in the remaining areas was 4. The proposed remedial action consisted of undercutting an additional 12 inches and replacing it with 12 inches of limestone primary crusher run aggregate. When combined with the planed 6 inches Type B CLS, it resulted in a total 18-inch aggregate thickness. This would represent a 25% reduction in remedial thickness, which approximately corresponds to the second “best practice” identified from the test loop results. Unfortunately, the contractor elected to use a gap-graded oversized aggregate instead of the well-graded primary crusher run. In order to prevent infiltration, the decision to include a woven geotextile was made shortly before aggregate was placed. The inclusion of geotextile limited the usefulness of this section to evaluate the performance of the reduced aggregate thickness in low IBV situations. The combination of aggregate and geotextile in this project corresponds with the recommendation in the Subgrade Stability Manual (IDOT, 1982/2005).
23
The aggregate consisted of a CLS CA-6. The aggregate had 7 percent passing the # 200 sieve and non-plastic fines. The aggregate was compacted to the satisfaction of the Engineer and no field density tests were performed. The aggregate was placed and compacted in two layers. The top layer was mixed with water prior to placement and compaction. As a result, the top layer may have had a density meeting the requirements for Type A materials. Appendix F includes more detailed aggregate and subgrade data.
3.3.2 Loading and Rutting Paving began on July 22, 2005. Unfortunately because of scheduling difficulties, rutting measurements and detailed loading observations were not obtained. Information regarding loading and performance was provided by IDOT construction personnel. HMA was delivered using tandem axle trucks and the roadway was paved one lane at a time similar to IL 97. Based on the length of the paving section, the theoretical maximum number of load passes was calculated to be 14. Construction personnel observed no rutting in undercut areas. No rutting was observed in areas having 6 inches of aggregate, except a truck entrance area between 1525+60 and 1526+00, which experienced up to 3-inch ruts. The information obtained indicated a 6-inch aggregate thickness was viable in limited loading situations. The performance of the remedial aggregate and geotextile combination supports the current recommendations shown in the Subgrade Stability Manual.
3.4 Field Verification Conclusions The experimental 8-inch Type A CLS improved subgrade performed satisfactorily on each project where it was used. When a 12-inch Type B CLS control section was available, there was no significant difference in performance. The field performance confirmed the selection of the 8-inch Type A CLS material as a “best practice” based on the test loop findings. When combined with limited loading, a 6-inch Type A CLS material could also be used in areas having an IBV of 4 or greater. In areas with unstable subgrade conditions, the aggregate thickness recommended by the Subgrade Stability Manual was reduced by at least 20 percent. However on the two affected projects, either the loading was insufficient to draw significant conclusions, or a geotextile was added negating the experimental evaluation. The information obtained does indicate the 20 percent reduction in thickness may be appropriate under limited loading.
4 Conclusions The current IDOT Subgrade Stability Manual may not accurately predict performance for all combinations of aggregate and construction methods. Aggregate properties such as angularity, fines content, and fines plasticity in addition to field compaction have a significant effect on aggregate performance.
24
The test loop and field verification indicated, where subgrade IBV was 4 or greater, an 8-inch aggregate layer performed satisfactorily under the following conditions:
1. The aggregate was dense graded CLS (or equivalent). 2. A sufficient quantity of low plasticity aggregate fines was present. 3. The aggregate was compacted to 95 percent of the maximum laboratory dry density.
The RAP and uncrushed gravel used in this study demonstrated unacceptable performance for improved subgrade applications at any thickness. Rut depth increased with increasing loading for all aggregate materials. However, the rate of rut depth increase depended on aggregate properties and construction methods. The anticipated amount of loading must be considered when evaluating appropriate aggregate type, thickness, and construction specification. Where subgrade IBV was 4 or greater, the use of geotextile did not affect aggregate performance for up to 270 load passes. This study did not examine the long-term performance of geotextile-aggregate systems. This study also did not include sufficient information to evaluate the performance of geosynthetic-aggregate systems where subgrade IBV was 2 or less. No significant conclusions could be made regarding aggregate thickness when subgrade IBV was 2 or less. The test loop did not include any locations with an IBV less than 2. At test locations with an IBV less than 3, the data indicated deformation within the aggregate layers themselves. Two Phase Two projects had subgrade with IBV less than 2, but loading was not sufficient to draw significant conclusions. At a subgrade IBV of 3 or greater, aggregate properties, rather than subgrade characteristics and aggregate thickness, were likely to control performance.
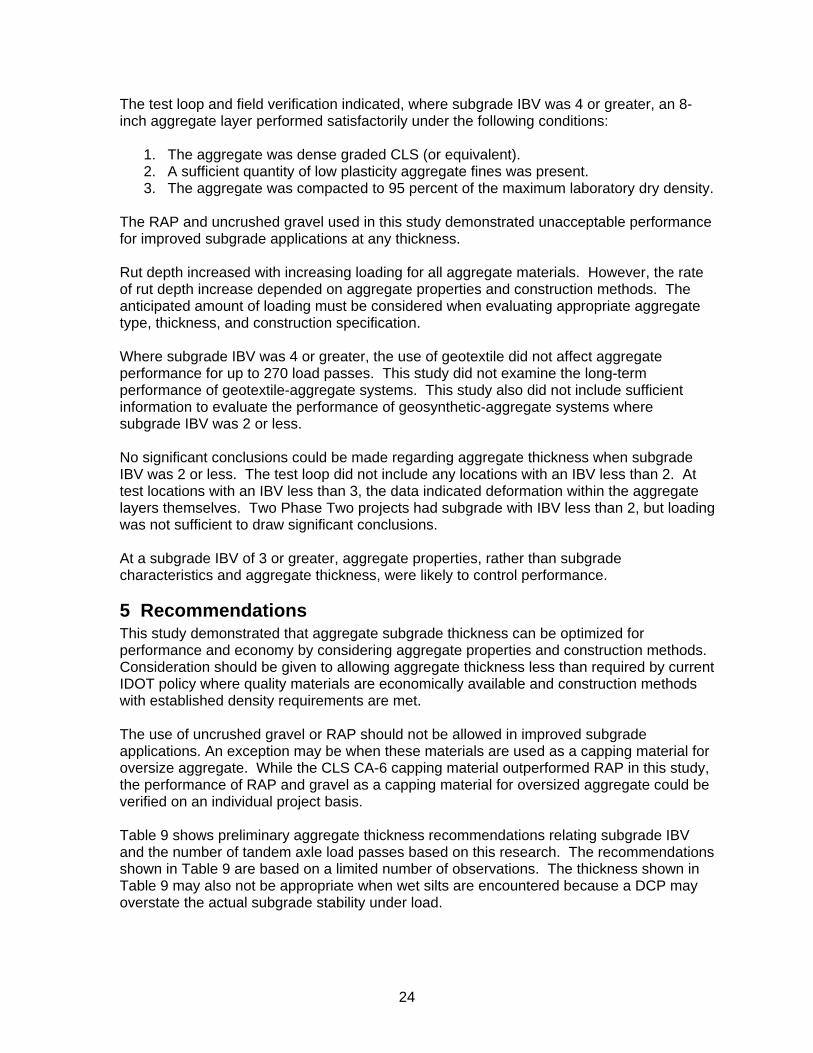
5 Recommendations This study demonstrated that aggregate subgrade thickness can be optimized for performance and economy by considering aggregate properties and construction methods. Consideration should be given to allowing aggregate thickness less than required by current IDOT policy where quality materials are economically available and construction methods with established density requirements are met. The use of uncrushed gravel or RAP should not be allowed in improved subgrade applications. An exception may be when these materials are used as a capping material for oversize aggregate. While the CLS CA-6 capping material outperformed RAP in this study, the performance of RAP and gravel as a capping material for oversized aggregate could be verified on an individual project basis. Table 9 shows preliminary aggregate thickness recommendations relating subgrade IBV and the number of tandem axle load passes based on this research. The recommendations shown in Table 9 are based on a limited number of observations. The thickness shown in Table 9 may also not be appropriate when wet silts are encountered because a DCP may overstate the actual subgrade stability under load.
25
Table 9. Improved Subgrade Thickness Preliminary Recommendations
Subgrade IBV Below Aggregate
CLS Type A Thickness, inches
Loading Range, tandem axle passes
5-6
6 0-30 8 30-60
10 60-90
3-4 6 0-15 8 0-30
10a 30-60a
CLS Oversize with CLS Type A Cap Thickness,
inches
2 12 0-30 1 20 0-15b
a Extrapolated from test loop data. b The load range shown is based on a field test with limited load passes. Greater than 15 load passes may be applied
with satisfactory results. This study examined a limited number of aggregates and did not include a parametric evaluation of how specific aggregate properties interacted together to influence performance. A more detailed study series is currently being conducted by the University of Illinois at Urbana-Champaign under the Illinois Center for Transportation. The study is aimed at developing correlations between specific aggregate properties, loading, and layer thickness. The study series will include controlled field correlation of laboratory test results. Table 9 will be considered in the University of Illinois study, but it should not be used on a non-experimental basis until the study is completed and a statewide policy can be issued regarding aggregate subgrade thickness determination.
6 References IDOT (2002). Bureau of Design and Environment Manual. IDOT Bureau of Design and
Environment. Springfield, Illinois. IDOT (1982). Subgrade Stability Manual. IDOT Bureau of Materials and Physical
Research. Springfield, Illinois. IDOT (2005). Subgrade Stability Manual. IDOT Bureau of Bridges and Structures.
Springfield, Illinois. Thompson, M.R., Kinney, T.C., Traylor, M.L., Bullard, J.R., and Figueroa, J.L (1977). “Final
Report - Subgrade Stability.” Dept. of Civil Engineering Engineering Experiment Station, University of Illinois at Urbana – Champaign. UILU-ENG-77-2009

A-1
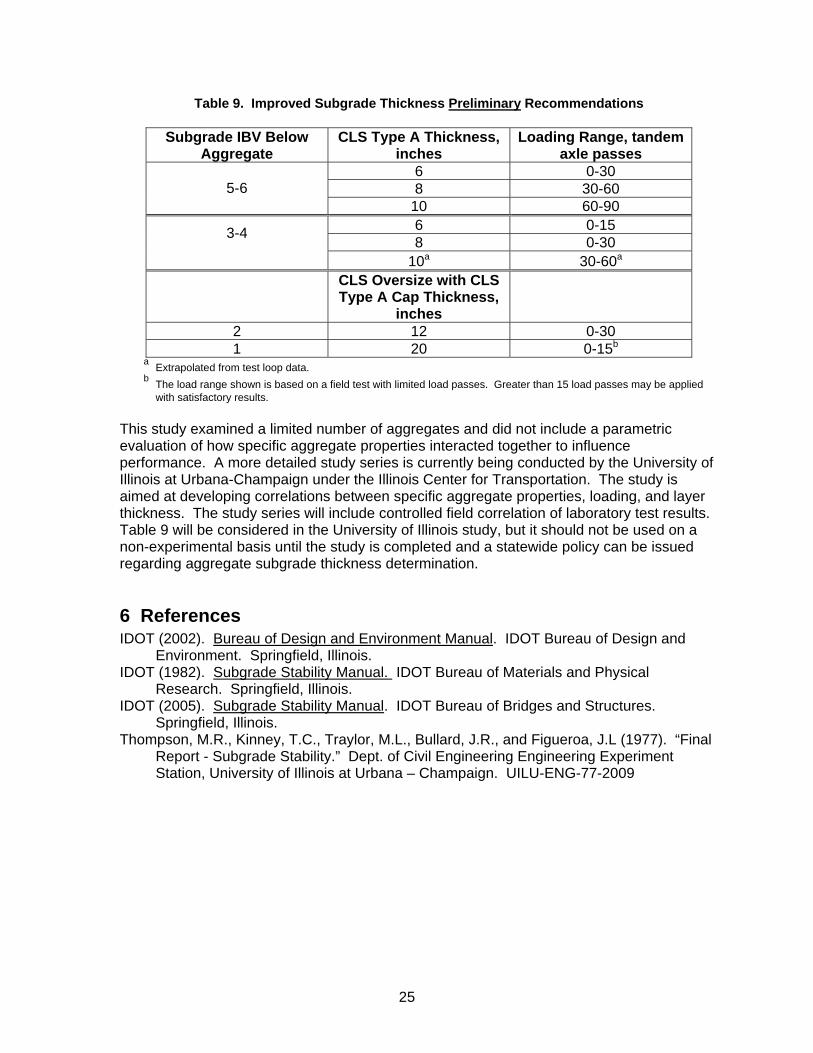
Appendix A: Project and Aggregate Source Locations
A-2
US 67 Test Loop
IL 97 Field Test IL 96 Field Test
IL 29 Field Test
Material Service - Athens
Central Stone - Florence
Pana Limestone
Pekin
B-1
Appendix B: Test Loop Subgrade and Aggregate Data
B-2
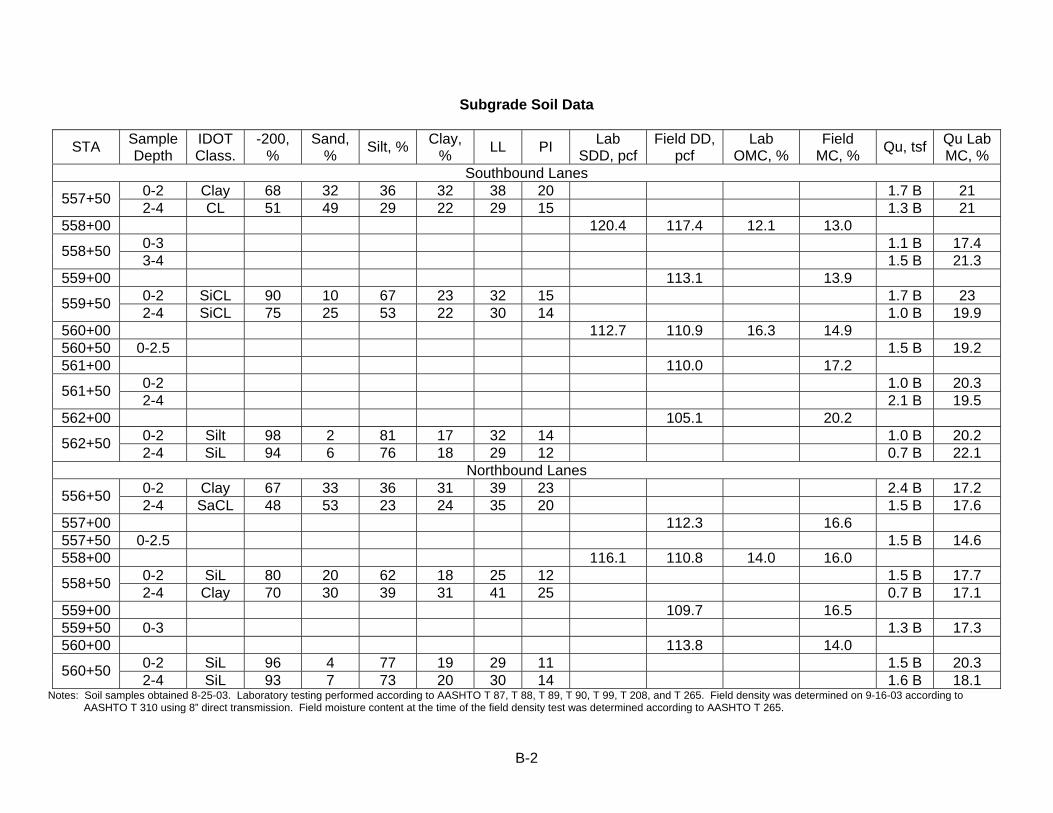
Subgrade Soil Data
STA Sample Depth
IDOT Class.
-200, %
Sand, % Silt, % Clay,
% LL PI Lab SDD, pcf
Field DD, pcf
Lab OMC, %
Field MC, % Qu, tsf Qu Lab
MC, % Southbound Lanes
557+50 0-2 Clay 68 32 36 32 38 20 1.7 B 21 2-4 CL 51 49 29 22 29 15 1.3 B 21
558+00 120.4 117.4 12.1 13.0
558+50 0-3 1.1 B 17.4 3-4 1.5 B 21.3
559+00 113.1 13.9
559+50 0-2 SiCL 90 10 67 23 32 15 1.7 B 23 2-4 SiCL 75 25 53 22 30 14 1.0 B 19.9
560+00 112.7 110.9 16.3 14.9 560+50 0-2.5 1.5 B 19.2 561+00 110.0 17.2
561+50 0-2 1.0 B 20.3 2-4 2.1 B 19.5
562+00 105.1 20.2
562+50 0-2 Silt 98 2 81 17 32 14 1.0 B 20.2 2-4 SiL 94 6 76 18 29 12 0.7 B 22.1
Northbound Lanes
556+50 0-2 Clay 67 33 36 31 39 23 2.4 B 17.2 2-4 SaCL 48 53 23 24 35 20 1.5 B 17.6
557+00 112.3 16.6 557+50 0-2.5 1.5 B 14.6 558+00 116.1 110.8 14.0 16.0
558+50 0-2 SiL 80 20 62 18 25 12 1.5 B 17.7 2-4 Clay 70 30 39 31 41 25 0.7 B 17.1
559+00 109.7 16.5 559+50 0-3 1.3 B 17.3 560+00 113.8 14.0
560+50 0-2 SiL 96 4 77 19 29 11 1.5 B 20.3 2-4 SiL 93 7 73 20 30 14 1.6 B 18.1
Notes: Soil samples obtained 8-25-03. Laboratory testing performed according to AASHTO T 87, T 88, T 89, T 90, T 99, T 208, and T 265. Field density was determined on 9-16-03 according to AASHTO T 310 using 8” direct transmission. Field moisture content at the time of the field density test was determined according to AASHTO T 265.
B-3
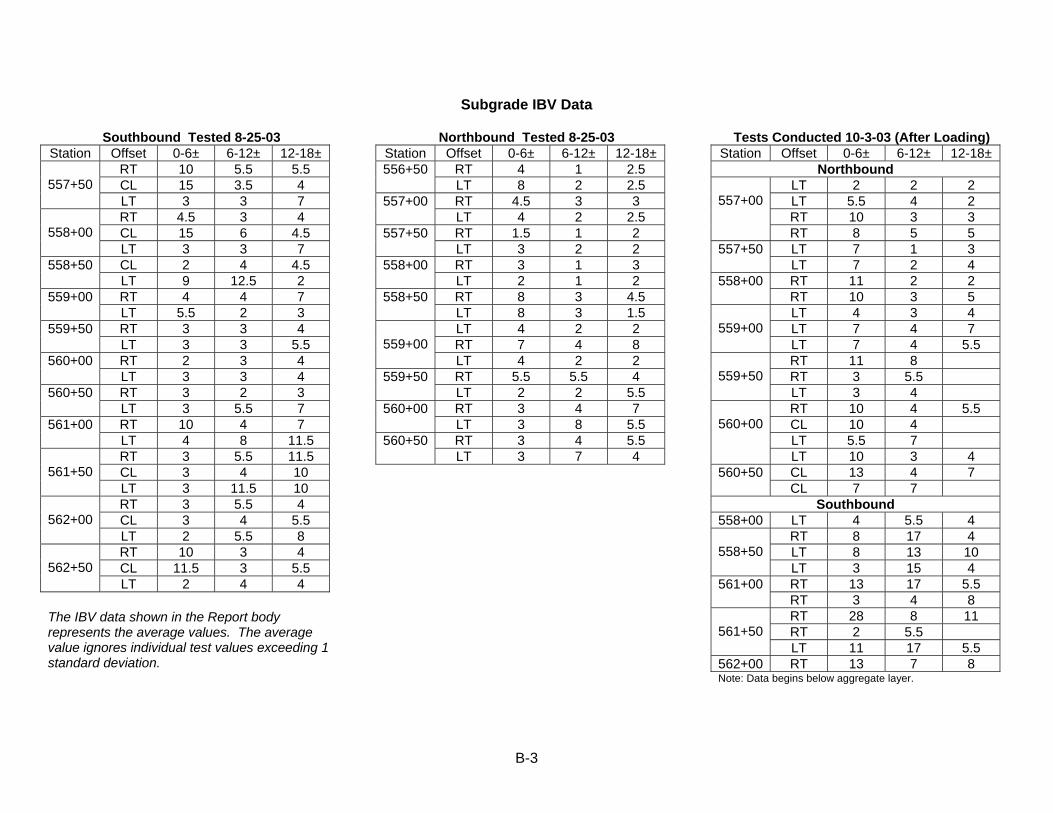
Subgrade IBV Data
Southbound Tested 8-25-03 Station Offset 0-6± 6-12± 12-18±
557+50
RT 10 5.5 5.5 CL 15 3.5 4 LT 3 3 7
558+00
RT 4.5 3 4 CL 15 6 4.5 LT 3 3 7
558+50 CL 2 4 4.5 LT 9 12.5 2
559+00 RT 4 4 7 LT 5.5 2 3
559+50 RT 3 3 4 LT 3 3 5.5
560+00 RT 2 3 4 LT 3 3 4
560+50 RT 3 2 3 LT 3 5.5 7
561+00 RT 10 4 7 LT 4 8 11.5
561+50
RT 3 5.5 11.5 CL 3 4 10 LT 3 11.5 10
562+00
RT 3 5.5 4 CL 3 4 5.5 LT 2 5.5 8
562+50
RT 10 3 4 CL 11.5 3 5.5 LT 2 4 4
The IBV data shown in the Report body represents the average values. The average value ignores individual test values exceeding 1 standard deviation.
Northbound Tested 8-25-03 Station Offset 0-6± 6-12± 12-18± 556+50 RT 4 1 2.5
LT 8 2 2.5 557+00 RT 4.5 3 3
LT 4 2 2.5 557+50 RT 1.5 1 2
LT 3 2 2 558+00 RT 3 1 3
LT 2 1 2 558+50 RT 8 3 4.5
LT 8 3 1.5
559+00LT 4 2 2 RT 7 4 8 LT 4 2 2
559+50 RT 5.5 5.5 4 LT 2 2 5.5
560+00 RT 3 4 7 LT 3 8 5.5
560+50 RT 3 4 5.5 LT 3 7 4
Tests Conducted 10-3-03 (After Loading) Station Offset 0-6± 6-12± 12-18±
Northbound
557+00LT 2 2 2 LT 5.5 4 2 RT 10 3 3 RT 8 5 5
557+50 LT 7 1 3 LT 7 2 4
558+00 RT 11 2 2 RT 10 3 5
559+00
LT 4 3 4 LT 7 4 7 LT 7 4 5.5
559+50
RT 11 8 RT 3 5.5 LT 3 4
560+00
RT 10 4 5.5 CL 10 4 LT 5.5 7 LT 10 3 4
560+50 CL 13 4 7 CL 7 7
Southbound 558+00 LT 4 5.5 4
558+50
RT 8 17 4 LT 8 13 10 LT 3 15 4
561+00 RT 13 17 5.5 RT 3 4 8
561+50
RT 28 8 11 RT 2 5.5 LT 11 17 5.5
562+00 RT 13 7 8 Note: Data begins below aggregate layer.

B-4
AGGREGATE DATA Subbase Granular Material, Type A Material Type: Crushed Limestone Material Source: Central Stone – Florence (Ledge Unknown) Sampled From: End Dumped Stockpile Station 560+50 Gradation:
Percent Passing 1.5” 1” ¾” 5/8” ½” 3/8” #4 #16 #40 #200 100 97.6 87.1 80.1 74.3 65.2 45.0 26.0 19.8 14.3
The gradation sample was obtained on the construction site. No mixing was performed prior to sampling. Samples were obtained by blending shovel-full amounts from around the pile. Fines Plasticity: Non-Plastic Density Information: Average SDD and OMC of all Central Stone – Florence CLS CA-6 is
134.3 pcf at 9.6%OMC.
124
126
128
130
132
134
136
5 6 7 8 9 10 11 12 13 14Moisture Content, %
Dry
Den
sity
, pcf
Moisture-Density Relationship Subbase Granular Material, Type A
SDD = 135.2 pcf @ 9.6% OMC
Field Density
9-26-07 During Construction
Station 560+00 Left: 126.0 pcf @ 6.8% Right: 137.7 @ 6.3%
Station 560+40
Left: 135.1 pcf @ 5.9% Right: 137.3 pcf @ 5.9%
10-1-03 Prior to Loading
Station 560+20
Left: 138.6 pcf @ 4.8% Right: 138.7 pcf @ 5.3%
Station 560+60
Left: 130.6 pcf @ 4.9% Right: 138.7 pcf @ 5.7%
Field density tested using 4 to 6 inch direct transmission nuclear methods according to AASHTO T 310. All moisture contents are based on oven dry samples from beneath the gage. Illinois Bearing Ratio (IBR) - Soaked
Molded Dry Density and Moisture Content
IBR @ 0.10” Penetration
IBR @ 0.20” Penetration
135.8 pcf @ 5.2% 328 312 135.6 pcf @ 5.1% 343 325 128.9 pcf @ 7.6% 21 33 129.5 pcf @ 7.8% 29 35
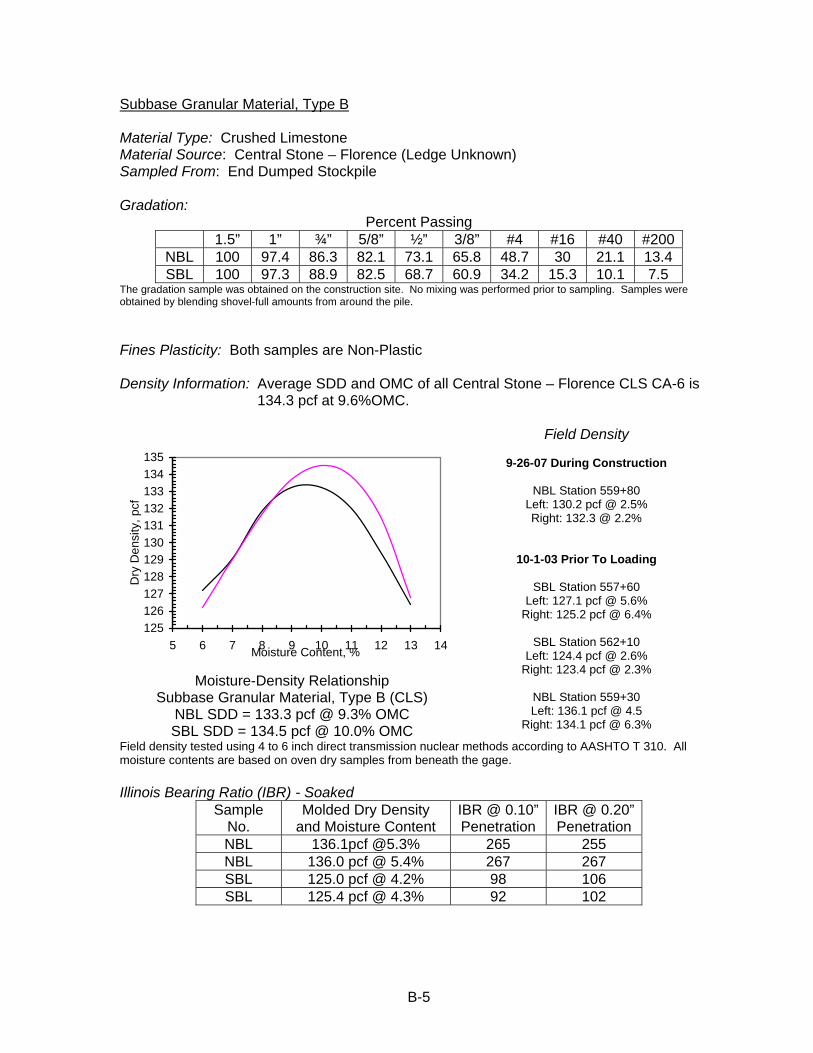
B-5
Subbase Granular Material, Type B Material Type: Crushed Limestone Material Source: Central Stone – Florence (Ledge Unknown) Sampled From: End Dumped Stockpile Gradation:
Percent Passing 1.5” 1” ¾” 5/8” ½” 3/8” #4 #16 #40 #200
NBL 100 97.4 86.3 82.1 73.1 65.8 48.7 30 21.1 13.4 SBL 100 97.3 88.9 82.5 68.7 60.9 34.2 15.3 10.1 7.5
The gradation sample was obtained on the construction site. No mixing was performed prior to sampling. Samples were obtained by blending shovel-full amounts from around the pile. Fines Plasticity: Both samples are Non-Plastic Density Information: Average SDD and OMC of all Central Stone – Florence CLS CA-6 is
134.3 pcf at 9.6%OMC.
125126127128129130131132133134135
5 6 7 8 9 10 11 12 13 14Moisture Content, %
Dry
Den
sity
, pcf
Moisture-Density Relationship Subbase Granular Material, Type B (CLS)
NBL SDD = 133.3 pcf @ 9.3% OMC SBL SDD = 134.5 pcf @ 10.0% OMC
Field Density
9-26-07 During Construction
NBL Station 559+80 Left: 130.2 pcf @ 2.5% Right: 132.3 @ 2.2%
10-1-03 Prior To Loading
SBL Station 557+60 Left: 127.1 pcf @ 5.6%
Right: 125.2 pcf @ 6.4%
SBL Station 562+10 Left: 124.4 pcf @ 2.6%
Right: 123.4 pcf @ 2.3%
NBL Station 559+30 Left: 136.1 pcf @ 4.5
Right: 134.1 pcf @ 6.3%
Field density tested using 4 to 6 inch direct transmission nuclear methods according to AASHTO T 310. All moisture contents are based on oven dry samples from beneath the gage. Illinois Bearing Ratio (IBR) - Soaked
Sample No.
Molded Dry Density and Moisture Content
IBR @ 0.10” Penetration
IBR @ 0.20” Penetration
NBL 136.1pcf @5.3% 265 255 NBL 136.0 pcf @ 5.4% 267 267 SBL 125.0 pcf @ 4.2% 98 106 SBL 125.4 pcf @ 4.3% 92 102
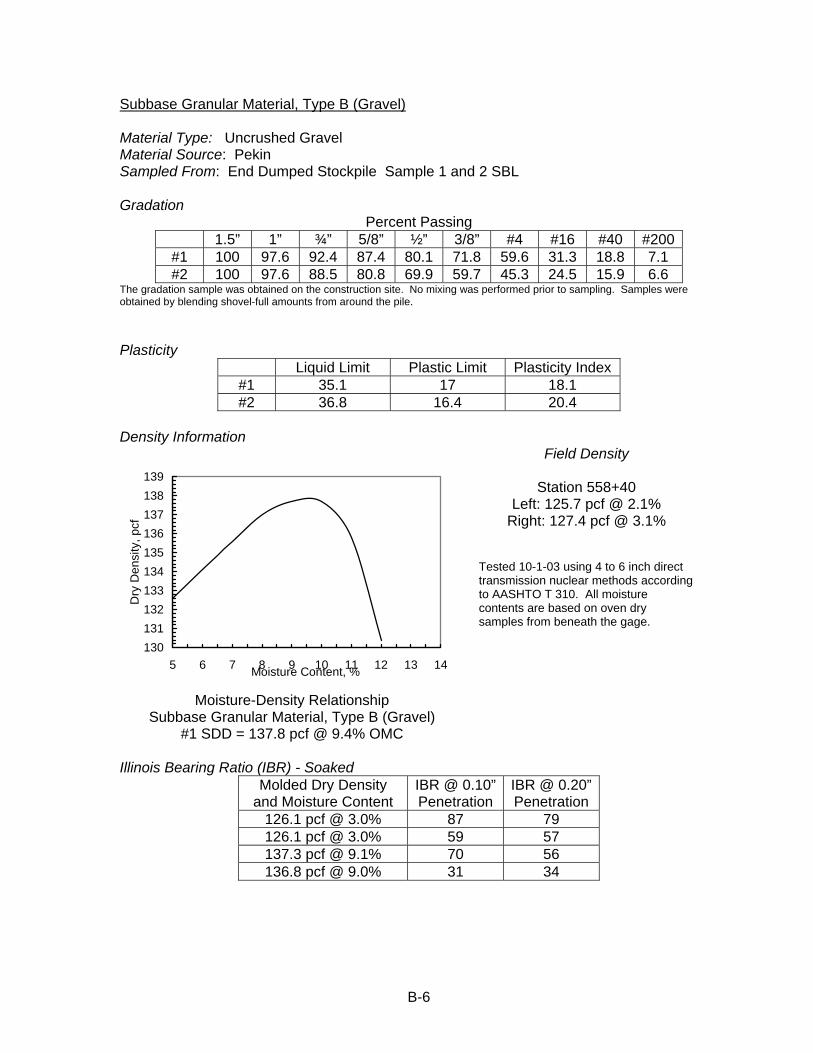
B-6
Subbase Granular Material, Type B (Gravel) Material Type: Uncrushed Gravel Material Source: Pekin Sampled From: End Dumped Stockpile Sample 1 and 2 SBL Gradation
Percent Passing 1.5” 1” ¾” 5/8” ½” 3/8” #4 #16 #40 #200
#1 100 97.6 92.4 87.4 80.1 71.8 59.6 31.3 18.8 7.1 #2 100 97.6 88.5 80.8 69.9 59.7 45.3 24.5 15.9 6.6
The gradation sample was obtained on the construction site. No mixing was performed prior to sampling. Samples were obtained by blending shovel-full amounts from around the pile. Plasticity
Liquid Limit Plastic Limit Plasticity Index #1 35.1 17 18.1 #2 36.8 16.4 20.4
Density Information
130131132133134135136137138139
5 6 7 8 9 10 11 12 13 14Moisture Content, %
Dry
Den
sity
, pcf
Moisture-Density Relationship Subbase Granular Material, Type B (Gravel)
#1 SDD = 137.8 pcf @ 9.4% OMC
Field Density
Station 558+40 Left: 125.7 pcf @ 2.1%
Right: 127.4 pcf @ 3.1%
Tested 10-1-03 using 4 to 6 inch direct transmission nuclear methods according to AASHTO T 310. All moisture contents are based on oven dry samples from beneath the gage.
Illinois Bearing Ratio (IBR) - Soaked
Molded Dry Density and Moisture Content
IBR @ 0.10” Penetration
IBR @ 0.20” Penetration
126.1 pcf @ 3.0% 87 79 126.1 pcf @ 3.0% 59 57 137.3 pcf @ 9.1% 70 56 136.8 pcf @ 9.0% 31 34
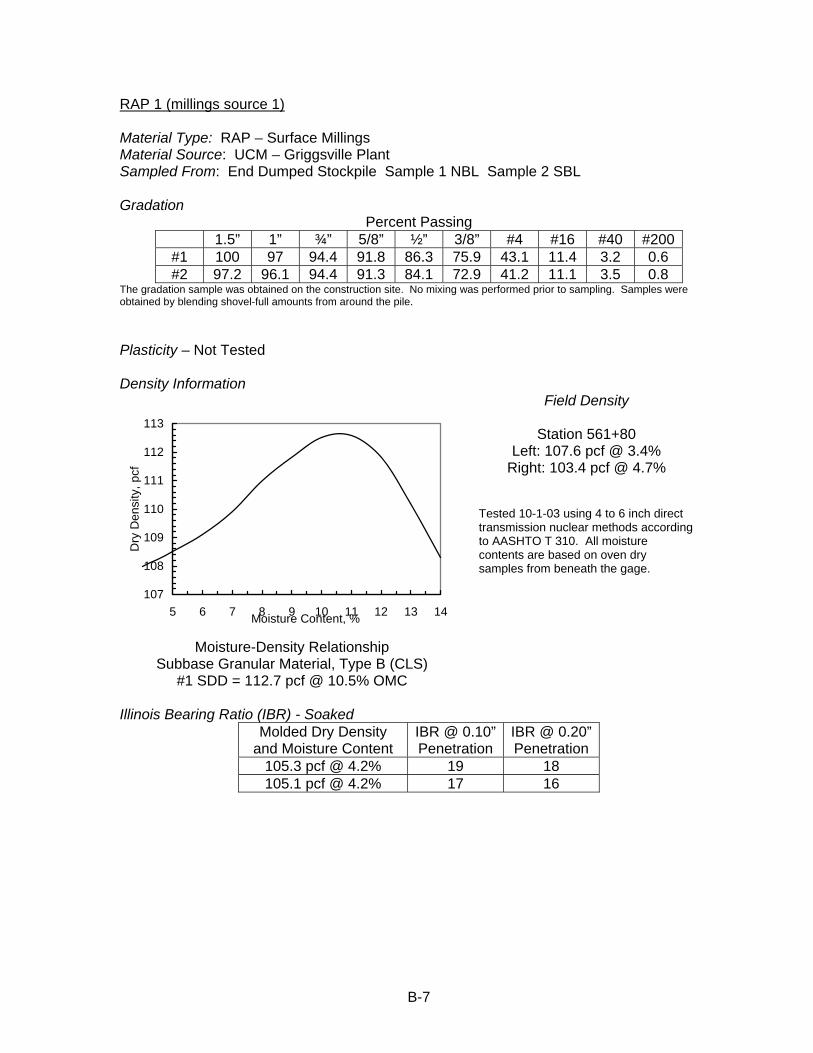
B-7
RAP 1 (millings source 1) Material Type: RAP – Surface Millings Material Source: UCM – Griggsville Plant Sampled From: End Dumped Stockpile Sample 1 NBL Sample 2 SBL Gradation
Percent Passing 1.5” 1” ¾” 5/8” ½” 3/8” #4 #16 #40 #200
#1 100 97 94.4 91.8 86.3 75.9 43.1 11.4 3.2 0.6 #2 97.2 96.1 94.4 91.3 84.1 72.9 41.2 11.1 3.5 0.8
The gradation sample was obtained on the construction site. No mixing was performed prior to sampling. Samples were obtained by blending shovel-full amounts from around the pile. Plasticity – Not Tested Density Information
107
108
109
110
111
112
113
5 6 7 8 9 10 11 12 13 14Moisture Content, %
Dry
Den
sity
, pcf
Moisture-Density Relationship Subbase Granular Material, Type B (CLS)
#1 SDD = 112.7 pcf @ 10.5% OMC
Field Density
Station 561+80 Left: 107.6 pcf @ 3.4%
Right: 103.4 pcf @ 4.7%
Tested 10-1-03 using 4 to 6 inch direct transmission nuclear methods according to AASHTO T 310. All moisture contents are based on oven dry samples from beneath the gage.
Illinois Bearing Ratio (IBR) - Soaked
Molded Dry Density and Moisture Content
IBR @ 0.10” Penetration
IBR @ 0.20” Penetration
105.3 pcf @ 4.2% 19 18 105.1 pcf @ 4.2% 17 16
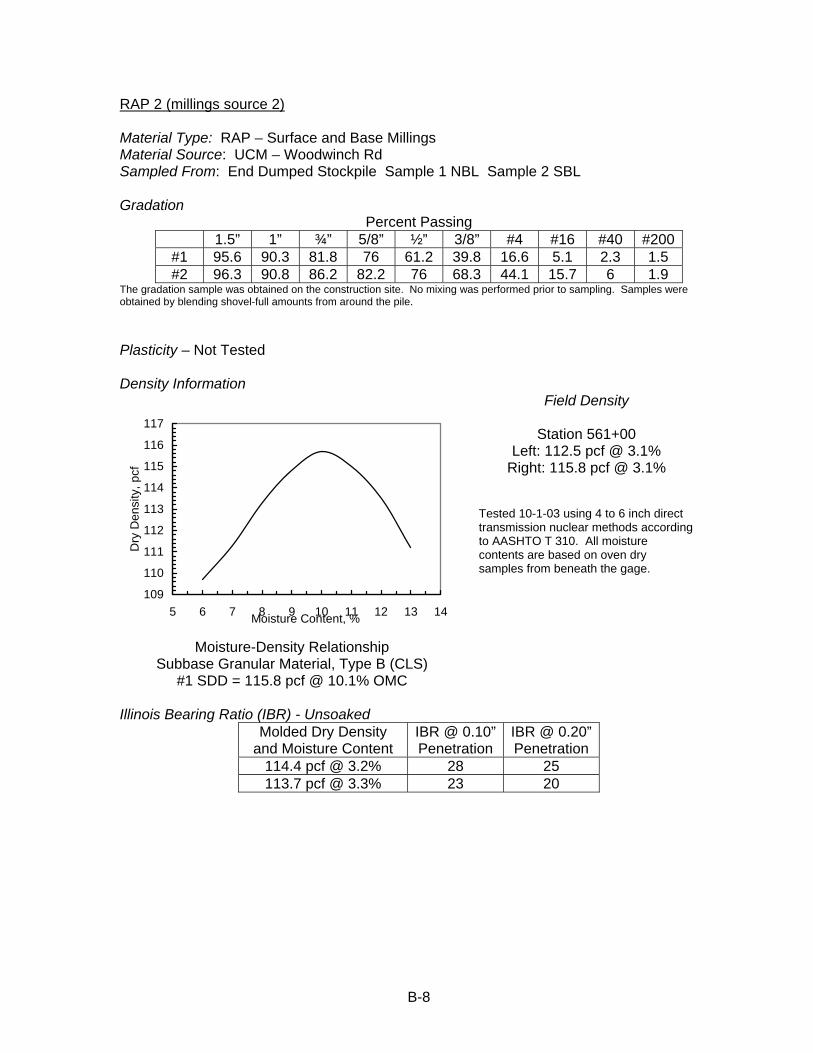
B-8
RAP 2 (millings source 2) Material Type: RAP – Surface and Base Millings Material Source: UCM – Woodwinch Rd Sampled From: End Dumped Stockpile Sample 1 NBL Sample 2 SBL Gradation
Percent Passing 1.5” 1” ¾” 5/8” ½” 3/8” #4 #16 #40 #200
#1 95.6 90.3 81.8 76 61.2 39.8 16.6 5.1 2.3 1.5 #2 96.3 90.8 86.2 82.2 76 68.3 44.1 15.7 6 1.9
The gradation sample was obtained on the construction site. No mixing was performed prior to sampling. Samples were obtained by blending shovel-full amounts from around the pile. Plasticity – Not Tested Density Information
109
110
111
112
113
114
115
116
117
5 6 7 8 9 10 11 12 13 14Moisture Content, %
Dry
Den
sity
, pcf
Moisture-Density Relationship Subbase Granular Material, Type B (CLS)
#1 SDD = 115.8 pcf @ 10.1% OMC
Field Density
Station 561+00 Left: 112.5 pcf @ 3.1%
Right: 115.8 pcf @ 3.1%
Tested 10-1-03 using 4 to 6 inch direct transmission nuclear methods according to AASHTO T 310. All moisture contents are based on oven dry samples from beneath the gage.
Illinois Bearing Ratio (IBR) - Unsoaked
Molded Dry Density and Moisture Content
IBR @ 0.10” Penetration
IBR @ 0.20” Penetration
114.4 pcf @ 3.2% 28 25 113.7 pcf @ 3.3% 23 20
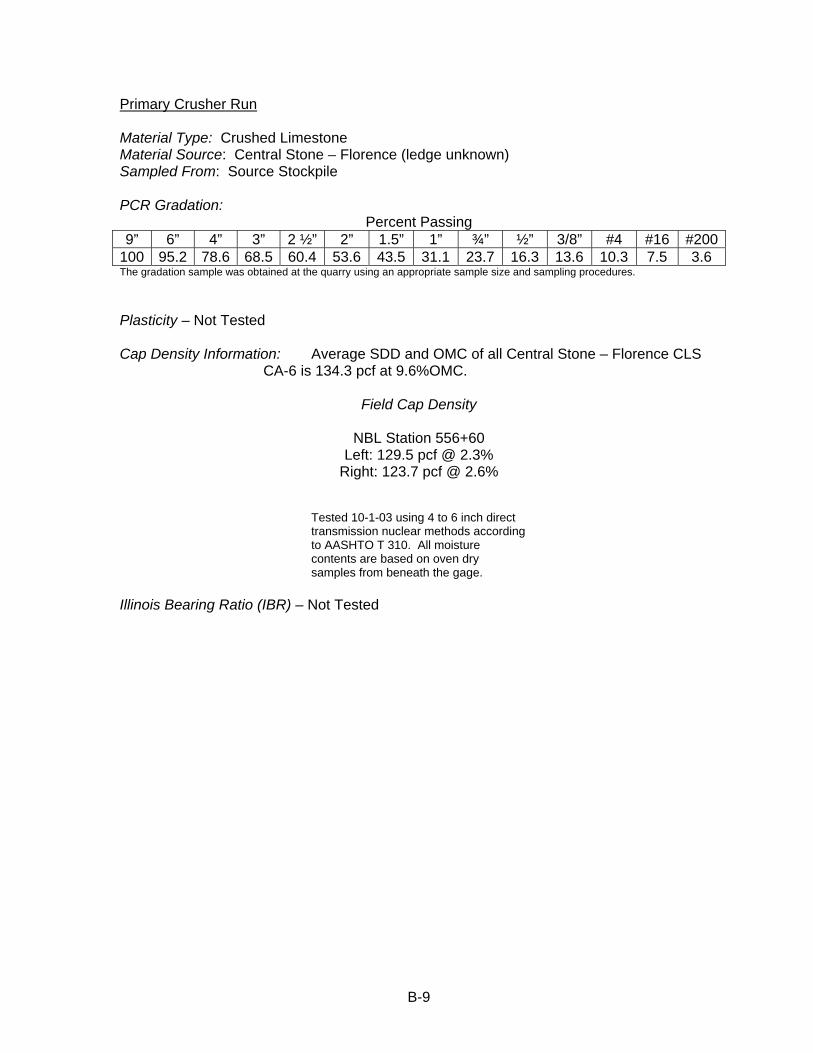
B-9
Primary Crusher Run Material Type: Crushed Limestone Material Source: Central Stone – Florence (ledge unknown) Sampled From: Source Stockpile PCR Gradation:
Percent Passing 9” 6” 4” 3” 2 ½” 2” 1.5” 1” ¾” ½” 3/8” #4 #16 #200
100 95.2 78.6 68.5 60.4 53.6 43.5 31.1 23.7 16.3 13.6 10.3 7.5 3.6 The gradation sample was obtained at the quarry using an appropriate sample size and sampling procedures. Plasticity – Not Tested Cap Density Information: Average SDD and OMC of all Central Stone – Florence CLS
CA-6 is 134.3 pcf at 9.6%OMC.
Field Cap Density
NBL Station 556+60 Left: 129.5 pcf @ 2.3%
Right: 123.7 pcf @ 2.6%
Tested 10-1-03 using 4 to 6 inch direct transmission nuclear methods according to AASHTO T 310. All moisture contents are based on oven dry samples from beneath the gage.
Illinois Bearing Ratio (IBR) – Not Tested

B-10
This page intentionally left blank.
C-1
Appendix C: Test Location Summary & Complete Test Loop Rutting Data
The Test ID format conveys specific location information. For example, Test ID S810L indicates the test is located in the South bound lanes at station 558+10 on the Left test lane.
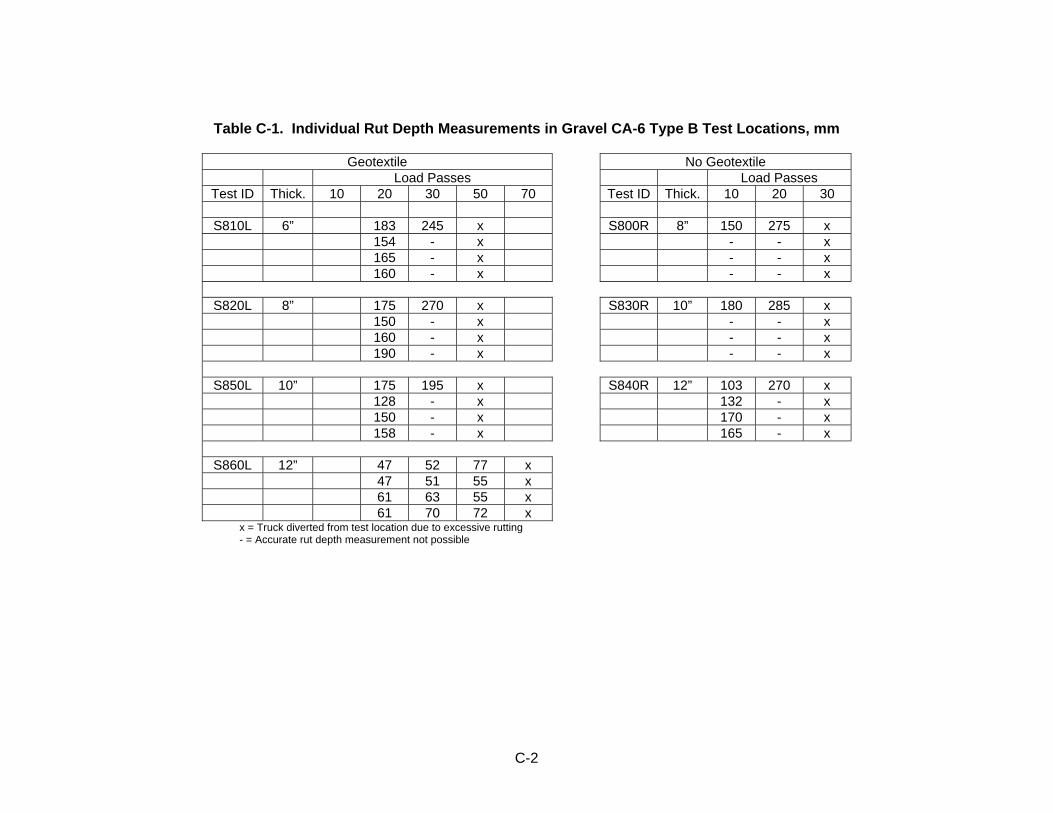
C-2
Table C-1. Individual Rut Depth Measurements in Gravel CA-6 Type B Test Locations, mm
Geotextile No Geotextile Load Passes Load Passes
Test ID Thick. 10 20 30 50 70 Test ID Thick. 10 20 30
S810L 6” 183 245 x S800R 8” 150 275 x 154 - x - - x 165 - x - - x 160 - x - - x
S820L 8” 175 270 x S830R 10” 180 285 x 150 - x - - x 160 - x - - x 190 - x - - x
S850L 10” 175 195 x S840R 12” 103 270 x 128 - x 132 - x 150 - x 170 - x 158 - x 165 - x
S860L 12” 47 52 77 x 47 51 55 x 61 63 55 x 61 70 72 x
x = Truck diverted from test location due to excessive rutting - = Accurate rut depth measurement not possible
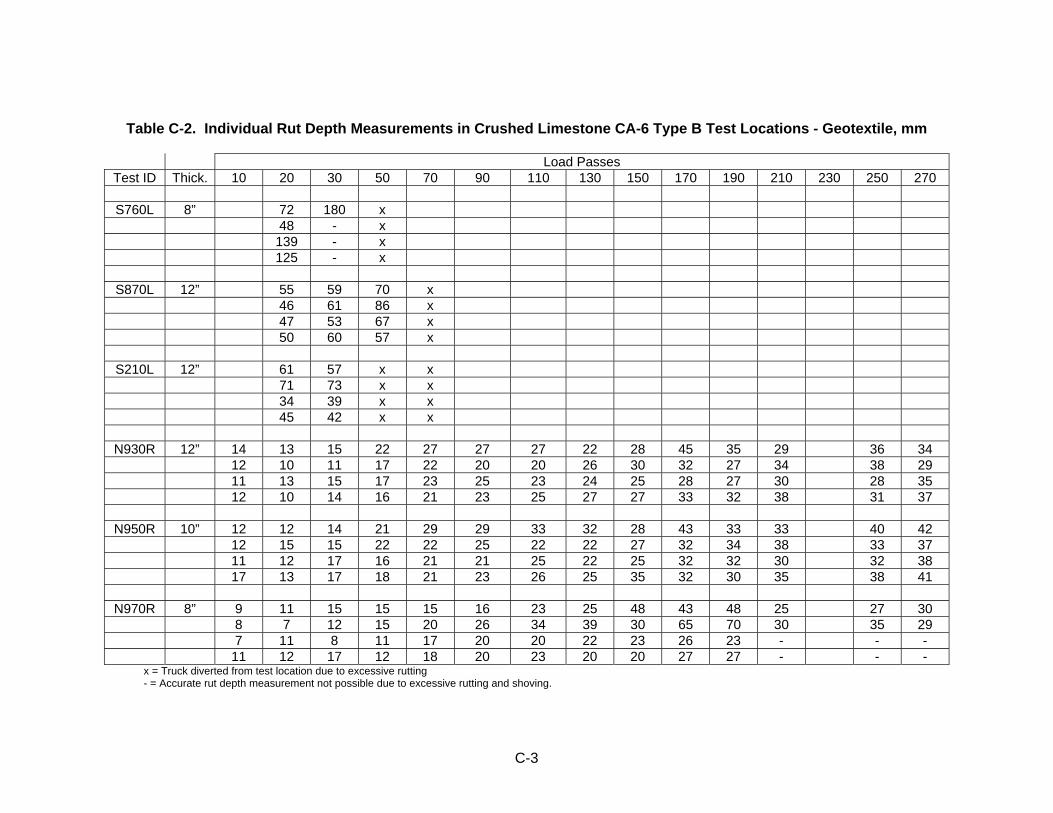
C-3
Table C-2. Individual Rut Depth Measurements in Crushed Limestone CA-6 Type B Test Locations - Geotextile, mm
Load Passes Test ID Thick. 10 20 30 50 70 90 110 130 150 170 190 210 230 250 270
S760L 8” 72 180 x
48 - x 139 - x 125 - x
S870L 12” 55 59 70 x 46 61 86 x 47 53 67 x 50 60 57 x
S210L 12” 61 57 x x 71 73 x x 34 39 x x 45 42 x x
N930R 12” 14 13 15 22 27 27 27 22 28 45 35 29 36 34 12 10 11 17 22 20 20 26 30 32 27 34 38 29 11 13 15 17 23 25 23 24 25 28 27 30 28 35 12 10 14 16 21 23 25 27 27 33 32 38 31 37
N950R 10” 12 12 14 21 29 29 33 32 28 43 33 33 40 42 12 15 15 22 22 25 22 22 27 32 34 38 33 37 11 12 17 16 21 21 25 22 25 32 32 30 32 38 17 13 17 18 21 23 26 25 35 32 30 35 38 41
N970R 8” 9 11 15 15 15 16 23 25 48 43 48 25 27 30 8 7 12 15 20 26 34 39 30 65 70 30 35 29 7 11 8 11 17 20 20 22 23 26 23 - - - 11 12 17 12 18 20 23 20 20 27 27 - - -
x = Truck diverted from test location due to excessive rutting - = Accurate rut depth measurement not possible due to excessive rutting and shoving.
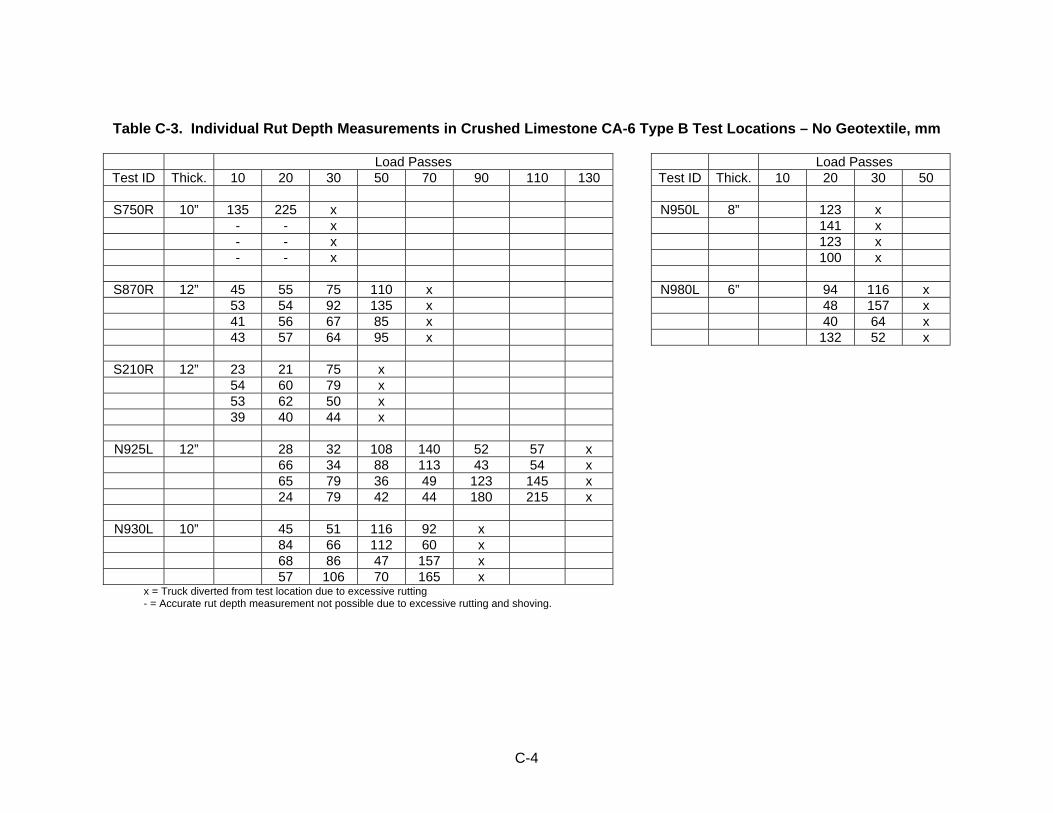
C-4
Table C-3. Individual Rut Depth Measurements in Crushed Limestone CA-6 Type B Test Locations – No Geotextile, mm
Load Passes Load Passes Test ID Thick. 10 20 30 50 70 90 110 130 Test ID Thick. 10 20 30 50
S750R 10” 135 225 x N950L 8” 123 x
- - x 141 x - - x 123 x - - x 100 x
S870R 12” 45 55 75 110 x N980L 6” 94 116 x 53 54 92 135 x 48 157 x 41 56 67 85 x 40 64 x 43 57 64 95 x 132 52 x
S210R 12” 23 21 75 x 54 60 79 x 53 62 50 x 39 40 44 x
N925L 12” 28 32 108 140 52 57 x 66 34 88 113 43 54 x 65 79 36 49 123 145 x 24 79 42 44 180 215 x
N930L 10” 45 51 116 92 x 84 66 112 60 x 68 86 47 157 x 57 106 70 165 x
x = Truck diverted from test location due to excessive rutting - = Accurate rut depth measurement not possible due to excessive rutting and shoving.
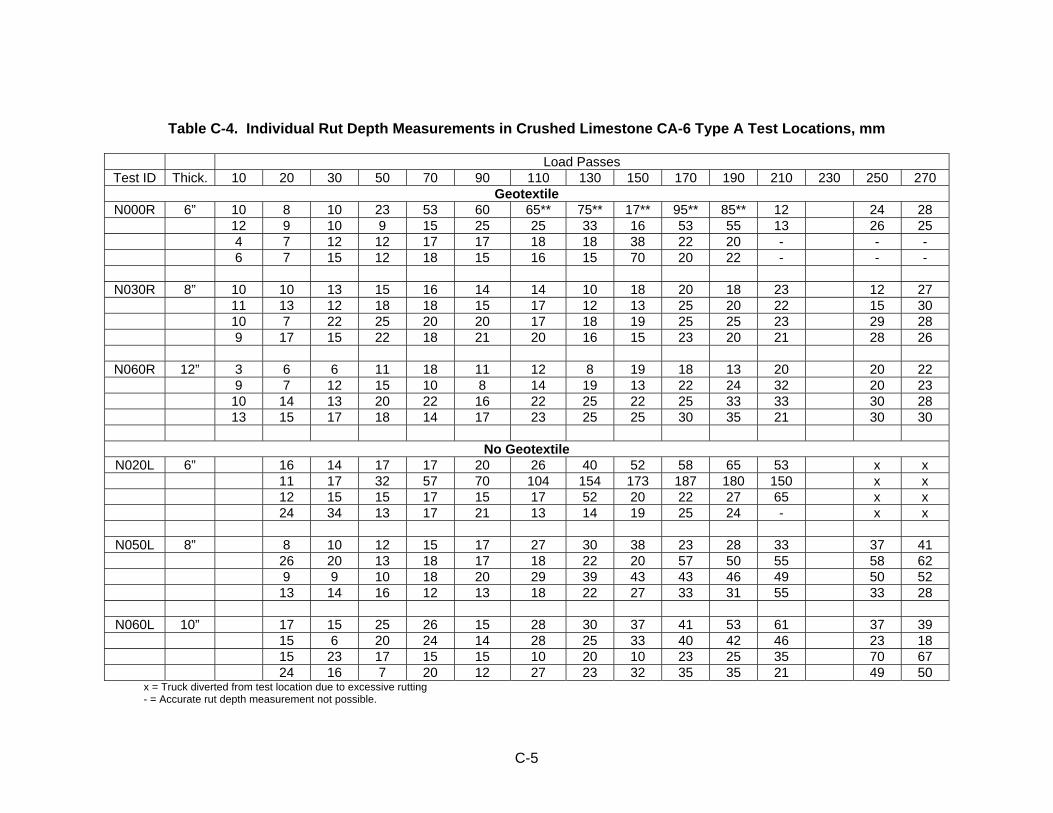
C-5
Table C-4. Individual Rut Depth Measurements in Crushed Limestone CA-6 Type A Test Locations, mm
Load Passes Test ID Thick. 10 20 30 50 70 90 110 130 150 170 190 210 230 250 270
Geotextile N000R 6” 10 8 10 23 53 60 65** 75** 17** 95** 85** 12 24 28
12 9 10 9 15 25 25 33 16 53 55 13 26 25 4 7 12 12 17 17 18 18 38 22 20 - - - 6 7 15 12 18 15 16 15 70 20 22 - - -
N030R 8” 10 10 13 15 16 14 14 10 18 20 18 23 12 27 11 13 12 18 18 15 17 12 13 25 20 22 15 30 10 7 22 25 20 20 17 18 19 25 25 23 29 28 9 17 15 22 18 21 20 16 15 23 20 21 28 26
N060R 12” 3 6 6 11 18 11 12 8 19 18 13 20 20 22 9 7 12 15 10 8 14 19 13 22 24 32 20 23 10 14 13 20 22 16 22 25 22 25 33 33 30 28 13 15 17 18 14 17 23 25 25 30 35 21 30 30
No Geotextile N020L 6” 16 14 17 17 20 26 40 52 58 65 53 x x
11 17 32 57 70 104 154 173 187 180 150 x x 12 15 15 17 15 17 52 20 22 27 65 x x 24 34 13 17 21 13 14 19 25 24 - x x
N050L 8” 8 10 12 15 17 27 30 38 23 28 33 37 41 26 20 13 18 17 18 22 20 57 50 55 58 62 9 9 10 18 20 29 39 43 43 46 49 50 52 13 14 16 12 13 18 22 27 33 31 55 33 28
N060L 10” 17 15 25 26 15 28 30 37 41 53 61 37 39 15 6 20 24 14 28 25 33 40 42 46 23 18 15 23 17 15 15 10 20 10 23 25 35 70 67 24 16 7 20 12 27 23 32 35 35 21 49 50
x = Truck diverted from test location due to excessive rutting - = Accurate rut depth measurement not possible.
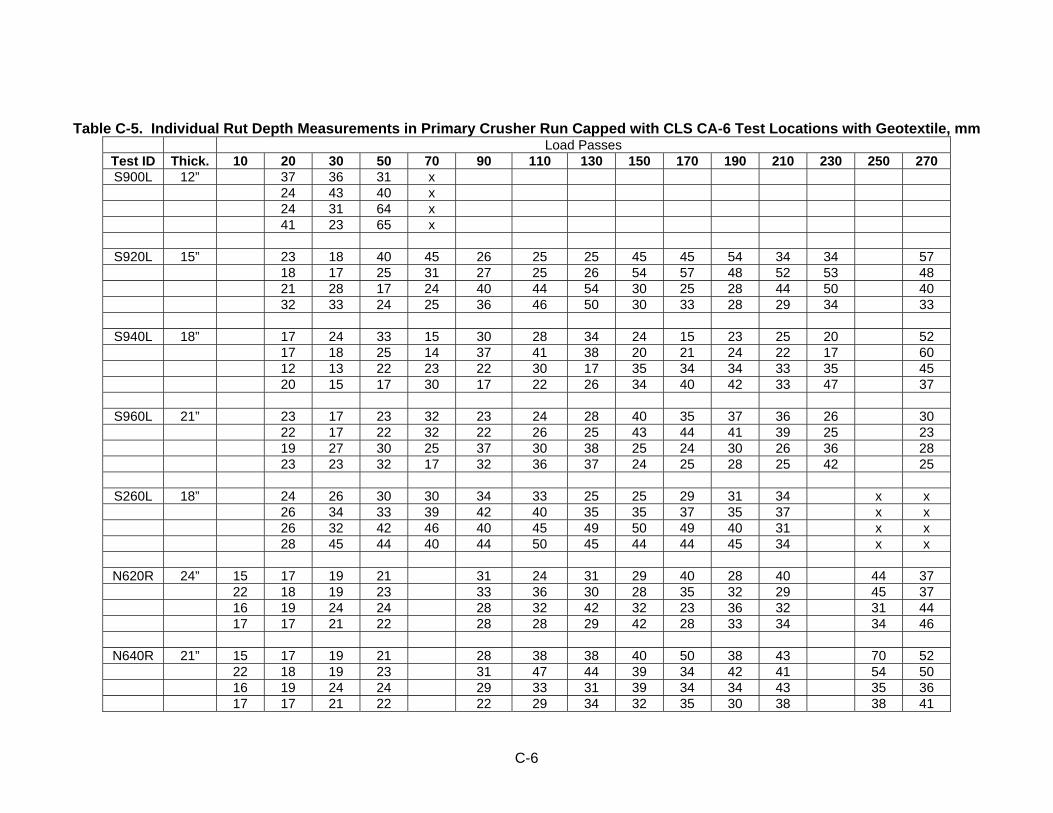
C-6
Table C-5. Individual Rut Depth Measurements in Primary Crusher Run Capped with CLS CA-6 Test Locations with Geotextile, mm Load Passes Test ID Thick. 10 20 30 50 70 90 110 130 150 170 190 210 230 250 270 S900L 12” 37 36 31 x
24 43 40 x 24 31 64 x 41 23 65 x
S920L 15” 23 18 40 45 26 25 25 45 45 54 34 34 57 18 17 25 31 27 25 26 54 57 48 52 53 48 21 28 17 24 40 44 54 30 25 28 44 50 40 32 33 24 25 36 46 50 30 33 28 29 34 33
S940L 18” 17 24 33 15 30 28 34 24 15 23 25 20 52 17 18 25 14 37 41 38 20 21 24 22 17 60 12 13 22 23 22 30 17 35 34 34 33 35 45 20 15 17 30 17 22 26 34 40 42 33 47 37
S960L 21” 23 17 23 32 23 24 28 40 35 37 36 26 30 22 17 22 32 22 26 25 43 44 41 39 25 23 19 27 30 25 37 30 38 25 24 30 26 36 28 23 23 32 17 32 36 37 24 25 28 25 42 25
S260L 18” 24 26 30 30 34 33 25 25 29 31 34 x x 26 34 33 39 42 40 35 35 37 35 37 x x 26 32 42 46 40 45 49 50 49 40 31 x x 28 45 44 40 44 50 45 44 44 45 34 x x
N620R 24” 15 17 19 21 31 24 31 29 40 28 40 44 37 22 18 19 23 33 36 30 28 35 32 29 45 37 16 19 24 24 28 32 42 32 23 36 32 31 44 17 17 21 22 28 28 29 42 28 33 34 34 46
N640R 21” 15 17 19 21 28 38 38 40 50 38 43 70 52 22 18 19 23 31 47 44 39 34 42 41 54 50 16 19 24 24 29 33 31 39 34 34 43 35 36 17 17 21 22 22 29 34 32 35 30 38 38 41
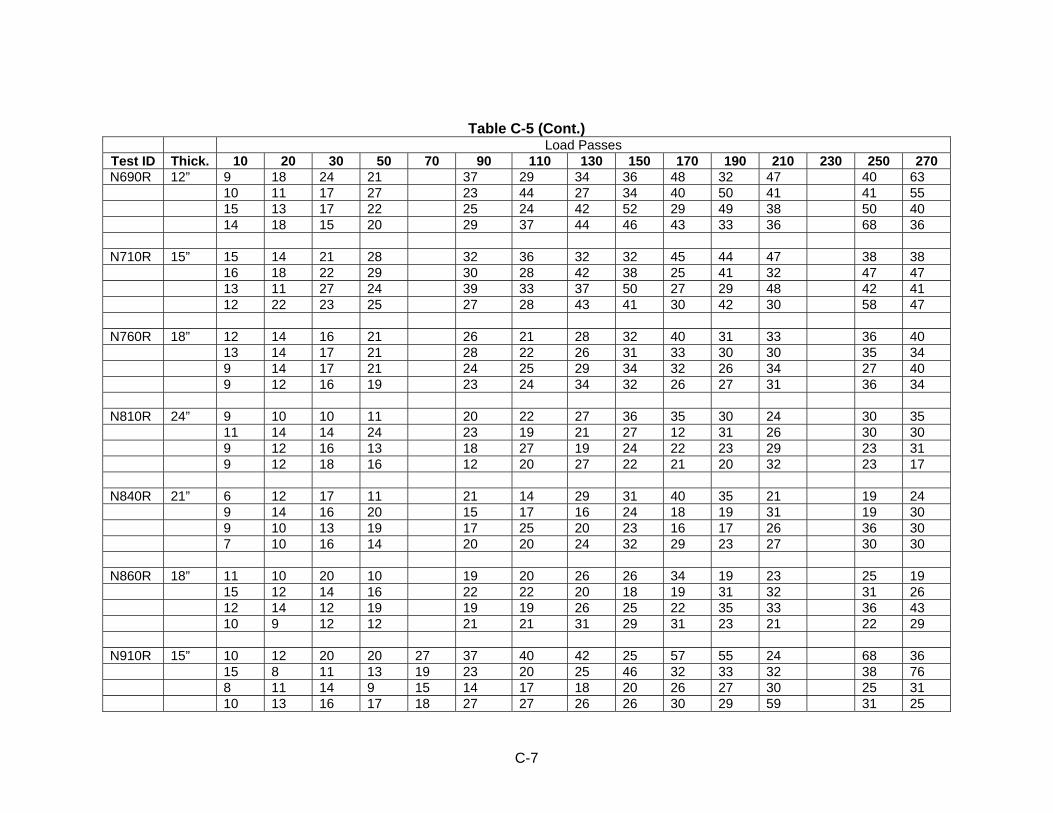
C-7
Table C-5 (Cont.) Load Passes Test ID Thick. 10 20 30 50 70 90 110 130 150 170 190 210 230 250 270 N690R 12” 9 18 24 21 37 29 34 36 48 32 47 40 63 10 11 17 27 23 44 27 34 40 50 41 41 55 15 13 17 22 25 24 42 52 29 49 38 50 40 14 18 15 20 29 37 44 46 43 33 36 68 36 N710R 15” 15 14 21 28 32 36 32 32 45 44 47 38 38 16 18 22 29 30 28 42 38 25 41 32 47 47 13 11 27 24 39 33 37 50 27 29 48 42 41 12 22 23 25 27 28 43 41 30 42 30 58 47 N760R 18” 12 14 16 21 26 21 28 32 40 31 33 36 40 13 14 17 21 28 22 26 31 33 30 30 35 34 9 14 17 21 24 25 29 34 32 26 34 27 40 9 12 16 19 23 24 34 32 26 27 31 36 34 N810R 24” 9 10 10 11 20 22 27 36 35 30 24 30 35 11 14 14 24 23 19 21 27 12 31 26 30 30 9 12 16 13 18 27 19 24 22 23 29 23 31 9 12 18 16 12 20 27 22 21 20 32 23 17 N840R 21” 6 12 17 11 21 14 29 31 40 35 21 19 24 9 14 16 20 15 17 16 24 18 19 31 19 30 9 10 13 19 17 25 20 23 16 17 26 36 30 7 10 16 14 20 20 24 32 29 23 27 30 30 N860R 18” 11 10 20 10 19 20 26 26 34 19 23 25 19 15 12 14 16 22 22 20 18 19 31 32 31 26 12 14 12 19 19 19 26 25 22 35 33 36 43 10 9 12 12 21 21 31 29 31 23 21 22 29 N910R 15” 10 12 20 20 27 37 40 42 25 57 55 24 68 36 15 8 11 13 19 23 20 25 46 32 33 32 38 76 8 11 14 9 15 14 17 18 20 26 27 30 25 31 10 13 16 17 18 27 27 26 26 30 29 59 31 25
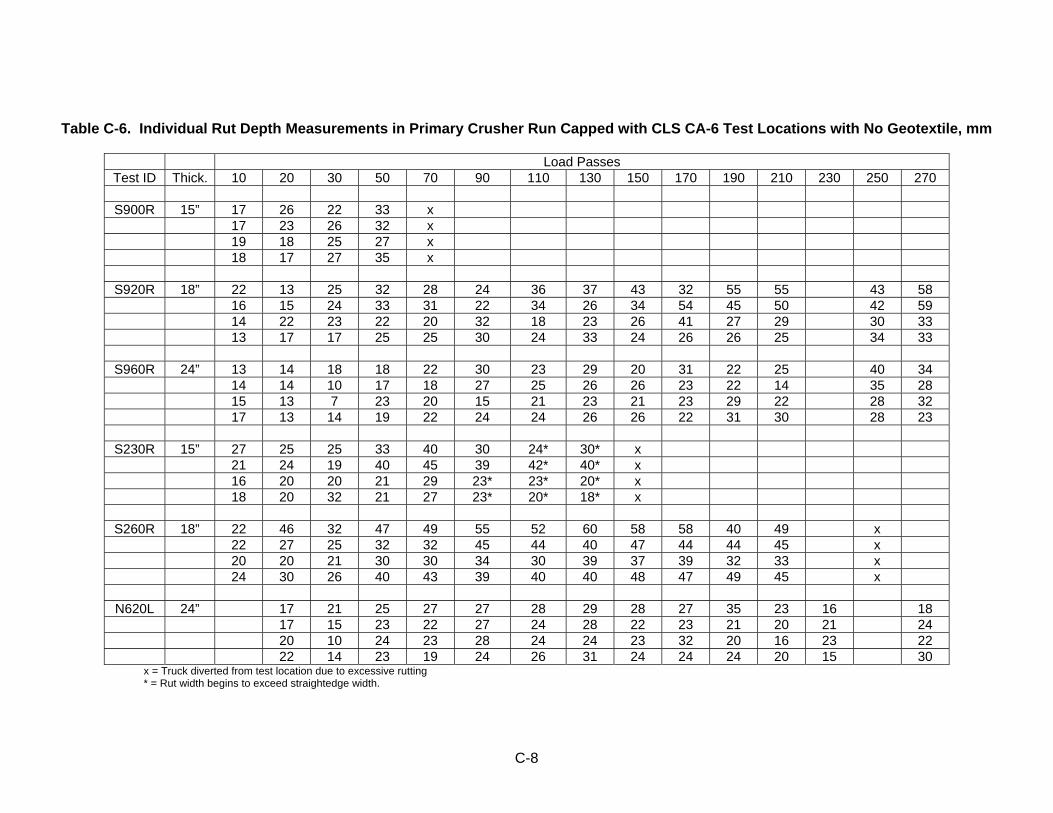
C-8
Table C-6. Individual Rut Depth Measurements in Primary Crusher Run Capped with CLS CA-6 Test Locations with No Geotextile, mm
Load Passes Test ID Thick. 10 20 30 50 70 90 110 130 150 170 190 210 230 250 270
S900R 15” 17 26 22 33 x
17 23 26 32 x 19 18 25 27 x 18 17 27 35 x
S920R 18” 22 13 25 32 28 24 36 37 43 32 55 55 43 58 16 15 24 33 31 22 34 26 34 54 45 50 42 59 14 22 23 22 20 32 18 23 26 41 27 29 30 33 13 17 17 25 25 30 24 33 24 26 26 25 34 33
S960R 24” 13 14 18 18 22 30 23 29 20 31 22 25 40 34 14 14 10 17 18 27 25 26 26 23 22 14 35 28 15 13 7 23 20 15 21 23 21 23 29 22 28 32 17 13 14 19 22 24 24 26 26 22 31 30 28 23
S230R 15” 27 25 25 33 40 30 24* 30* x 21 24 19 40 45 39 42* 40* x 16 20 20 21 29 23* 23* 20* x 18 20 32 21 27 23* 20* 18* x
S260R 18” 22 46 32 47 49 55 52 60 58 58 40 49 x 22 27 25 32 32 45 44 40 47 44 44 45 x 20 20 21 30 30 34 30 39 37 39 32 33 x 24 30 26 40 43 39 40 40 48 47 49 45 x
N620L 24” 17 21 25 27 27 28 29 28 27 35 23 16 18 17 15 23 22 27 24 28 22 23 21 20 21 24 20 10 24 23 28 24 24 23 32 20 16 23 22 22 14 23 19 24 26 31 24 24 24 20 15 30
x = Truck diverted from test location due to excessive rutting * = Rut width begins to exceed straightedge width.
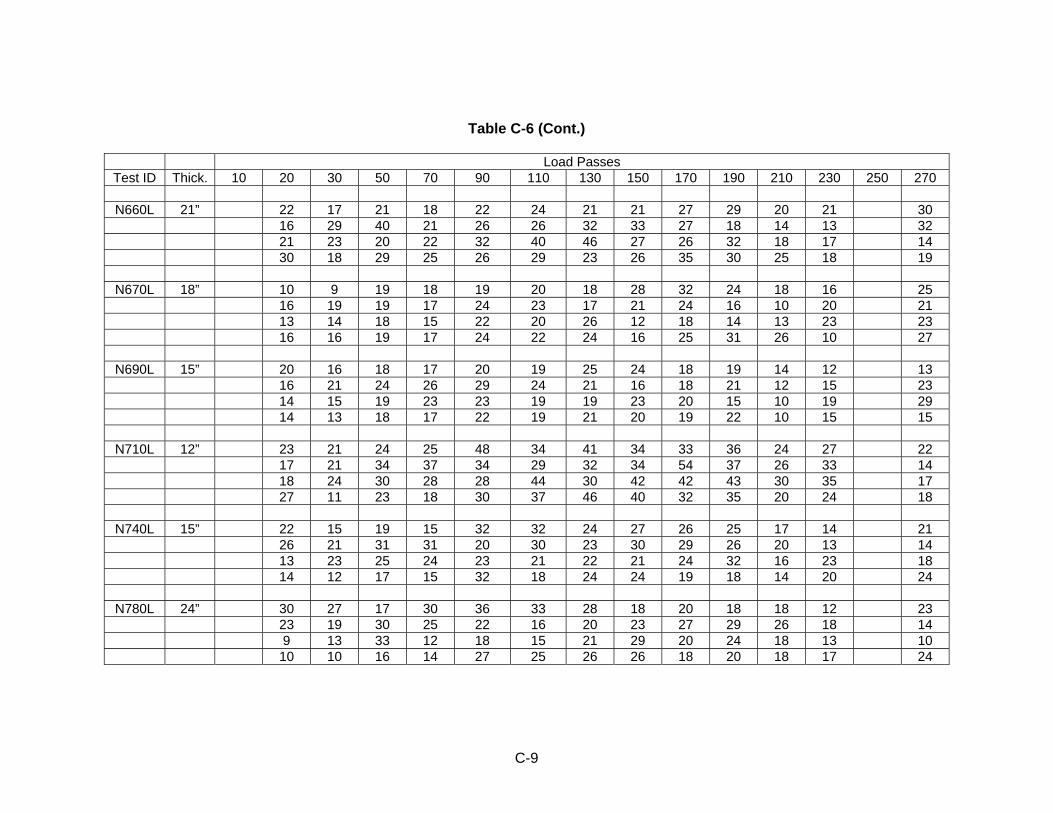
C-9
Table C-6 (Cont.)
Load Passes Test ID Thick. 10 20 30 50 70 90 110 130 150 170 190 210 230 250 270
N660L 21” 22 17 21 18 22 24 21 21 27 29 20 21 30
16 29 40 21 26 26 32 33 27 18 14 13 32 21 23 20 22 32 40 46 27 26 32 18 17 14 30 18 29 25 26 29 23 26 35 30 25 18 19
N670L 18” 10 9 19 18 19 20 18 28 32 24 18 16 25 16 19 19 17 24 23 17 21 24 16 10 20 21 13 14 18 15 22 20 26 12 18 14 13 23 23 16 16 19 17 24 22 24 16 25 31 26 10 27
N690L 15” 20 16 18 17 20 19 25 24 18 19 14 12 13 16 21 24 26 29 24 21 16 18 21 12 15 23 14 15 19 23 23 19 19 23 20 15 10 19 29 14 13 18 17 22 19 21 20 19 22 10 15 15
N710L 12” 23 21 24 25 48 34 41 34 33 36 24 27 22 17 21 34 37 34 29 32 34 54 37 26 33 14 18 24 30 28 28 44 30 42 42 43 30 35 17 27 11 23 18 30 37 46 40 32 35 20 24 18
N740L 15” 22 15 19 15 32 32 24 27 26 25 17 14 21 26 21 31 31 20 30 23 30 29 26 20 13 14 13 23 25 24 23 21 22 21 24 32 16 23 18 14 12 17 15 32 18 24 24 19 18 14 20 24
N780L 24” 30 27 17 30 36 33 28 18 20 18 18 12 23 23 19 30 25 22 16 20 23 27 29 26 18 14 9 13 33 12 18 15 21 29 20 24 18 13 10 10 10 16 14 27 25 26 26 18 20 18 17 24
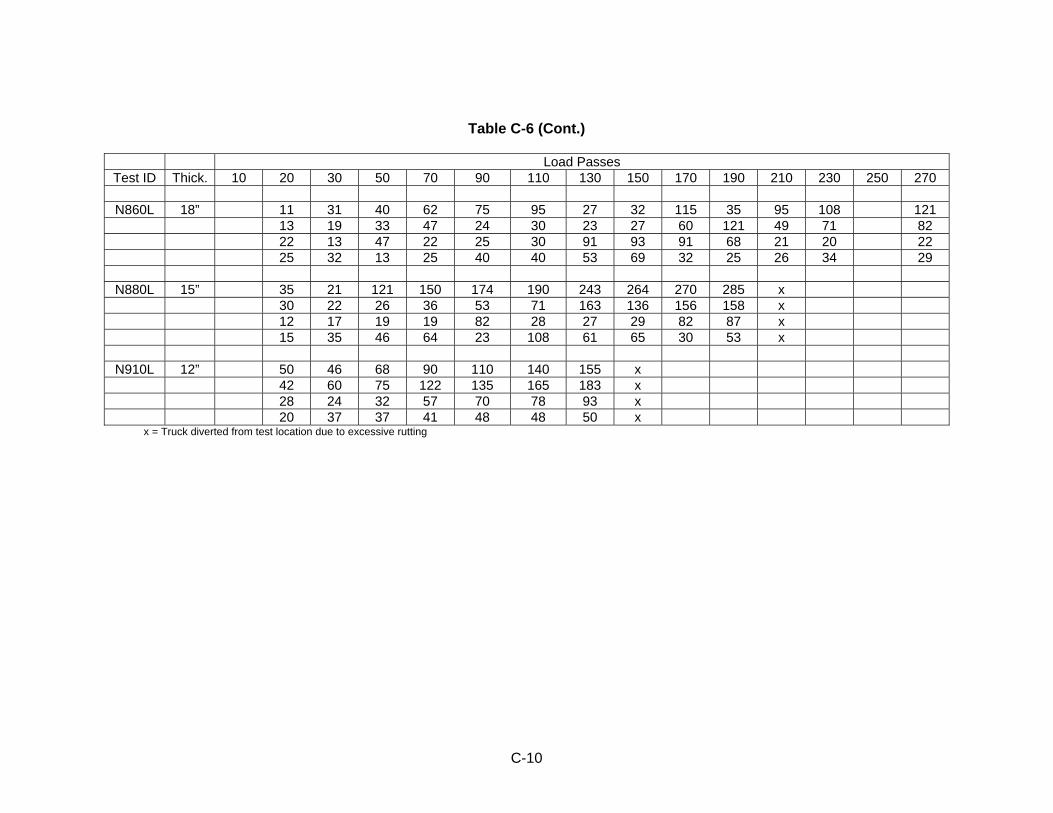
C-10
Table C-6 (Cont.)
Load Passes Test ID Thick. 10 20 30 50 70 90 110 130 150 170 190 210 230 250 270
N860L 18” 11 31 40 62 75 95 27 32 115 35 95 108 121
13 19 33 47 24 30 23 27 60 121 49 71 82 22 13 47 22 25 30 91 93 91 68 21 20 22 25 32 13 25 40 40 53 69 32 25 26 34 29
N880L 15” 35 21 121 150 174 190 243 264 270 285 x 30 22 26 36 53 71 163 136 156 158 x 12 17 19 19 82 28 27 29 82 87 x 15 35 46 64 23 108 61 65 30 53 x
N910L 12” 50 46 68 90 110 140 155 x 42 60 75 122 135 165 183 x 28 24 32 57 70 78 93 x 20 37 37 41 48 48 50 x
x = Truck diverted from test location due to excessive rutting
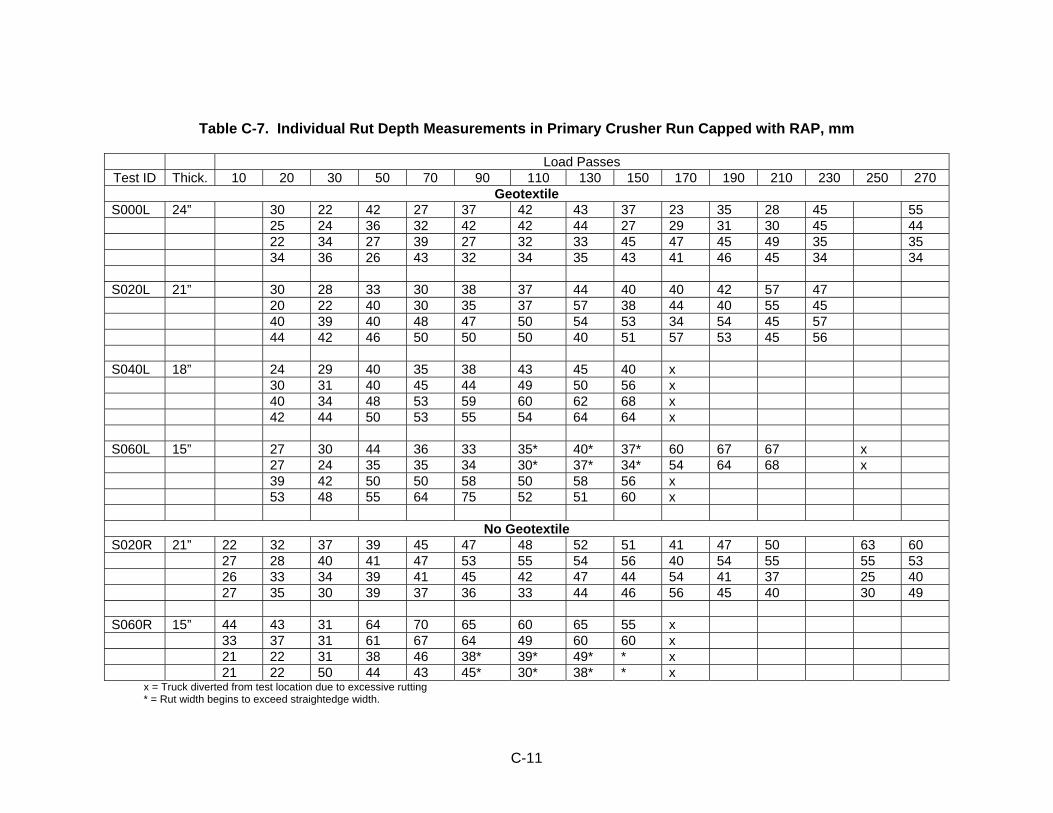
C-11
Table C-7. Individual Rut Depth Measurements in Primary Crusher Run Capped with RAP, mm
Load Passes Test ID Thick. 10 20 30 50 70 90 110 130 150 170 190 210 230 250 270
Geotextile S000L 24” 30 22 42 27 37 42 43 37 23 35 28 45 55 25 24 36 32 42 42 44 27 29 31 30 45 44 22 34 27 39 27 32 33 45 47 45 49 35 35 34 36 26 43 32 34 35 43 41 46 45 34 34 S020L 21” 30 28 33 30 38 37 44 40 40 42 57 47 20 22 40 30 35 37 57 38 44 40 55 45 40 39 40 48 47 50 54 53 34 54 45 57 44 42 46 50 50 50 40 51 57 53 45 56 S040L 18” 24 29 40 35 38 43 45 40 x 30 31 40 45 44 49 50 56 x 40 34 48 53 59 60 62 68 x 42 44 50 53 55 54 64 64 x S060L 15” 27 30 44 36 33 35* 40* 37* 60 67 67 x 27 24 35 35 34 30* 37* 34* 54 64 68 x 39 42 50 50 58 50 58 56 x 53 48 55 64 75 52 51 60 x
No Geotextile S020R 21” 22 32 37 39 45 47 48 52 51 41 47 50 63 60 27 28 40 41 47 53 55 54 56 40 54 55 55 53 26 33 34 39 41 45 42 47 44 54 41 37 25 40 27 35 30 39 37 36 33 44 46 56 45 40 30 49 S060R 15” 44 43 31 64 70 65 60 65 55 x 33 37 31 61 67 64 49 60 60 x 21 22 31 38 46 38* 39* 49* * x 21 22 50 44 43 45* 30* 38* * x
x = Truck diverted from test location due to excessive rutting * = Rut width begins to exceed straightedge width.
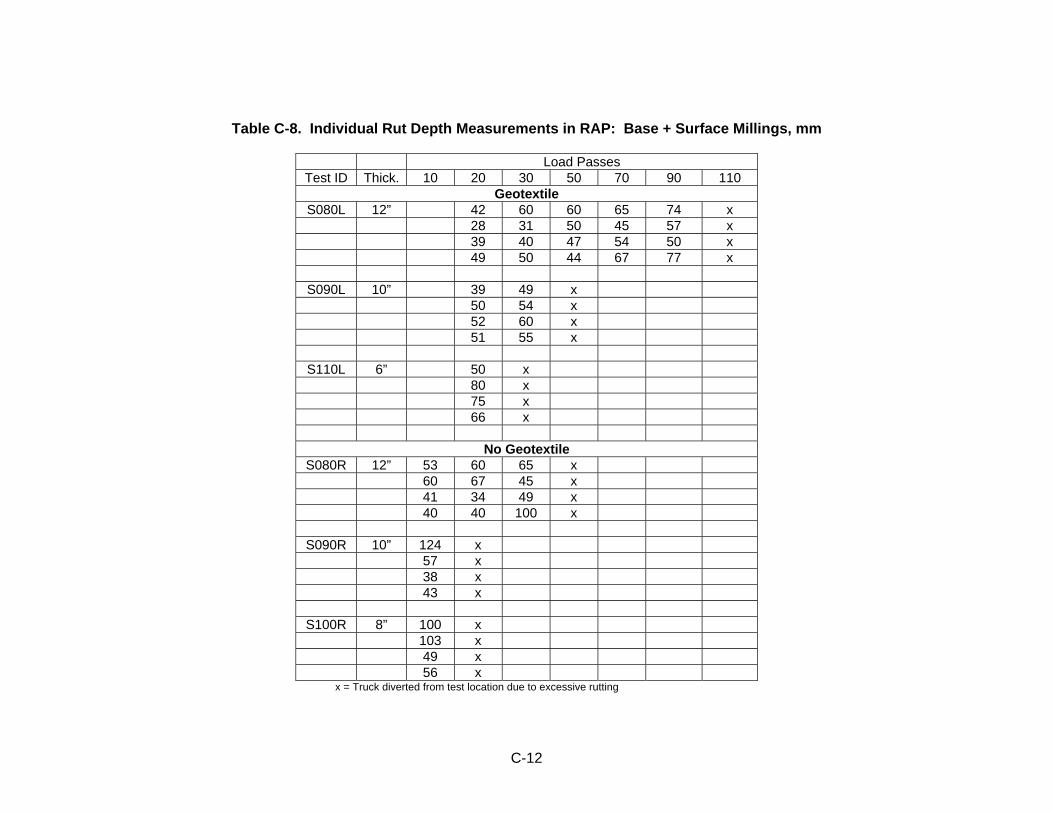
C-12
Table C-8. Individual Rut Depth Measurements in RAP: Base + Surface Millings, mm
Load Passes Test ID Thick. 10 20 30 50 70 90 110
Geotextile S080L 12” 42 60 60 65 74 x
28 31 50 45 57 x 39 40 47 54 50 x 49 50 44 67 77 x
S090L 10” 39 49 x 50 54 x 52 60 x 51 55 x
S110L 6” 50 x 80 x 75 x 66 x
No Geotextile S080R 12” 53 60 65 x
60 67 45 x 41 34 49 x 40 40 100 x
S090R 10” 124 x 57 x 38 x 43 x
S100R 8” 100 x 103 x 49 x 56 x
x = Truck diverted from test location due to excessive rutting
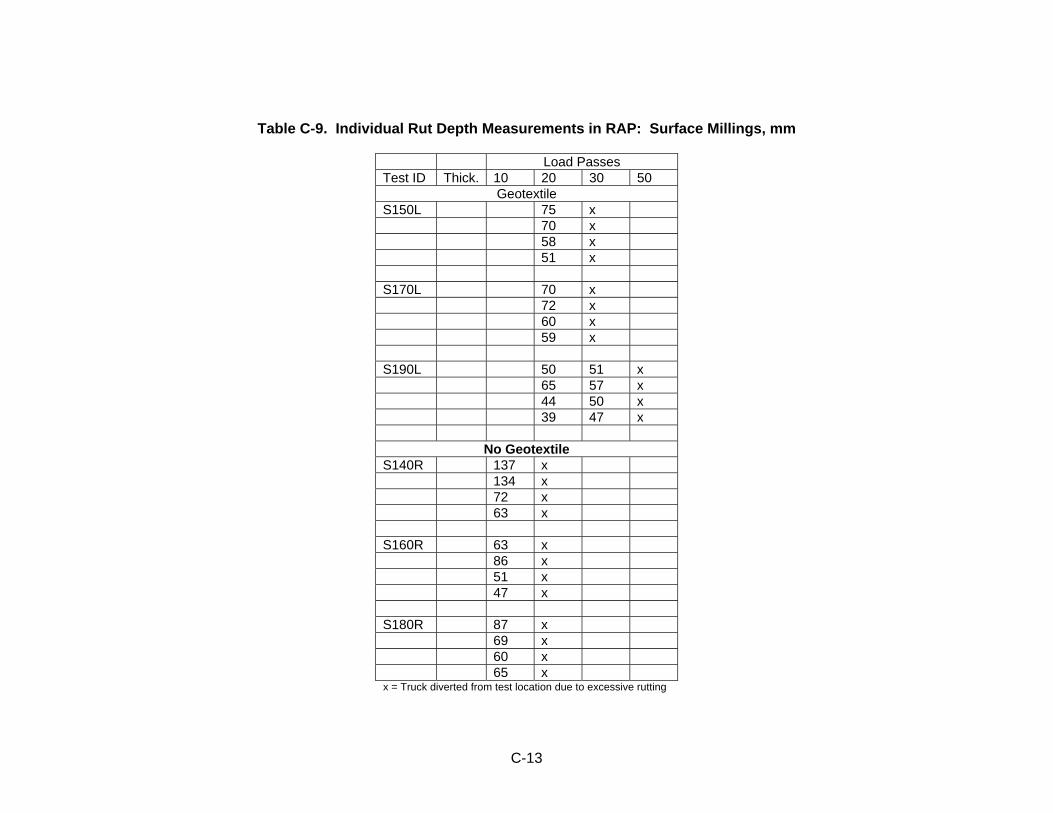
C-13
Table C-9. Individual Rut Depth Measurements in RAP: Surface Millings, mm
Load Passes Test ID Thick. 10 20 30 50
Geotextile S150L 75 x 70 x 58 x 51 x S170L 70 x 72 x 60 x 59 x S190L 50 51 x 65 57 x 44 50 x 39 47 x
No Geotextile S140R 137 x 134 x 72 x 63 x S160R 63 x 86 x 51 x 47 x S180R 87 x 69 x 60 x 65 x x = Truck diverted from test location due to excessive rutting

C-14
This page intentionally left blank.

D-1
Appendix D: IL 97 Complete Subgrade and Aggregate Property Data
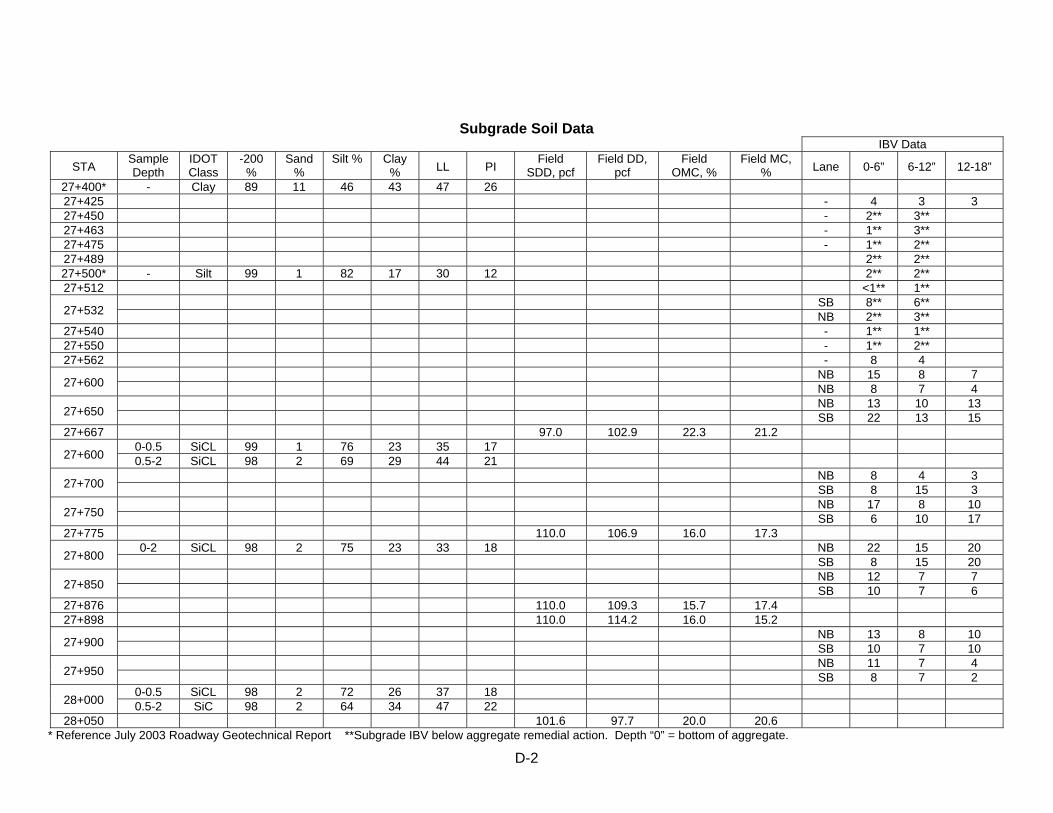
D-2
Subgrade Soil Data IBV Data
STA Sample Depth
IDOT Class
-200 %
Sand %
Silt % Clay % LL PI
Field SDD, pcf
Field DD, pcf
Field OMC, %
Field MC, % Lane 0-6” 6-12” 12-18”
27+400* - Clay 89 11 46 43 47 26 27+425 - 4 3 3 27+450 - 2** 3** 27+463 - 1** 3** 27+475 - 1** 2** 27+489 2** 2** 27+500* - Silt 99 1 82 17 30 12 2** 2** 27+512 <1** 1**
27+532 SB 8** 6** NB 2** 3**
27+540 - 1** 1** 27+550 - 1** 2** 27+562 - 8 4
27+600 NB 15 8 7 NB 8 7 4
27+650 NB 13 10 13 SB 22 13 15
27+667 97.0 102.9 22.3 21.2
27+600 0-0.5 SiCL 99 1 76 23 35 17 0.5-2 SiCL 98 2 69 29 44 21
27+700 NB 8 4 3 SB 8 15 3
27+750 NB 17 8 10 SB 6 10 17
27+775 110.0 106.9 16.0 17.3
27+800 0-2 SiCL 98 2 75 23 33 18 NB 22 15 20
SB 8 15 20
27+850 NB 12 7 7 SB 10 7 6
27+876 110.0 109.3 15.7 17.4 27+898 110.0 114.2 16.0 15.2
27+900 NB 13 8 10 SB 10 7 10
27+950 NB 11 7 4 SB 8 7 2
28+000 0-0.5 SiCL 98 2 72 26 37 18 0.5-2 SiC 98 2 64 34 47 22
28+050 101.6 97.7 20.0 20.6 * Reference July 2003 Roadway Geotechnical Report **Subgrade IBV below aggregate remedial action. Depth “0” = bottom of aggregate.
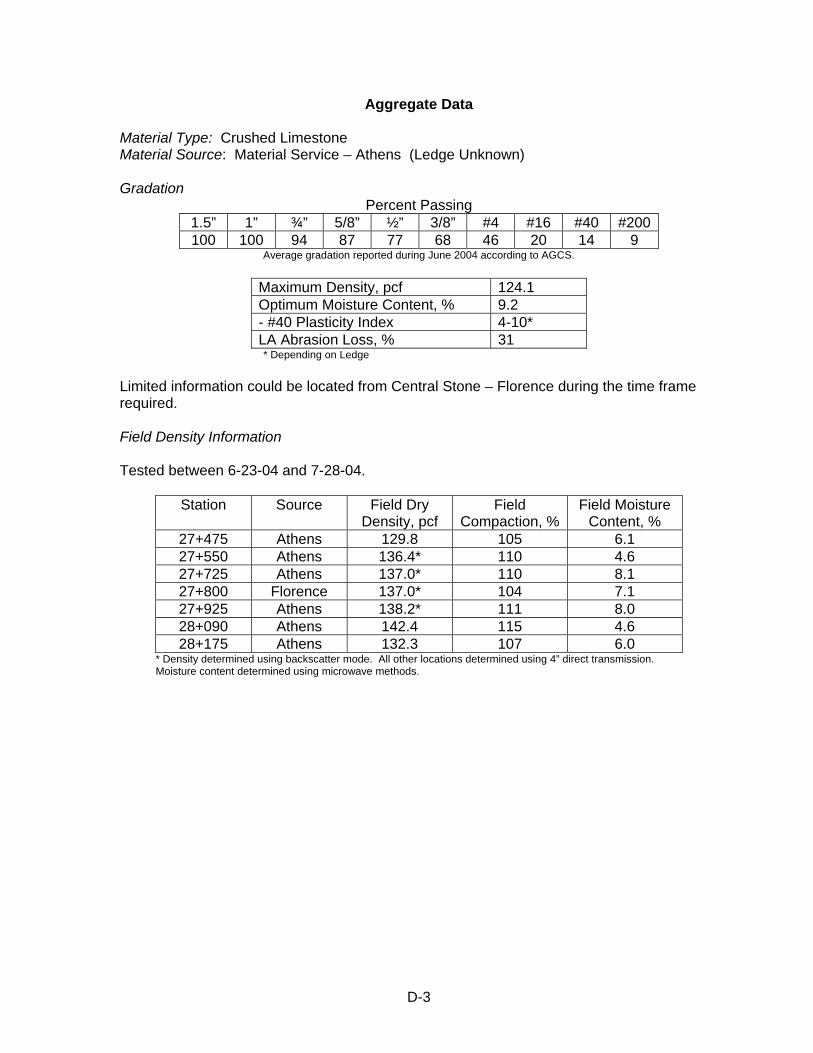
D-3
Aggregate Data Material Type: Crushed Limestone Material Source: Material Service – Athens (Ledge Unknown) Gradation
Percent Passing 1.5” 1” ¾” 5/8” ½” 3/8” #4 #16 #40 #200 100 100 94 87 77 68 46 20 14 9
Average gradation reported during June 2004 according to AGCS.
Maximum Density, pcf 124.1 Optimum Moisture Content, % 9.2 - #40 Plasticity Index 4-10* LA Abrasion Loss, % 31 * Depending on Ledge
Limited information could be located from Central Stone – Florence during the time frame required. Field Density Information Tested between 6-23-04 and 7-28-04.
Station Source Field Dry Density, pcf
Field Compaction, %
Field Moisture Content, %
27+475 Athens 129.8 105 6.1 27+550 Athens 136.4* 110 4.6 27+725 Athens 137.0* 110 8.1 27+800 Florence 137.0* 104 7.1 27+925 Athens 138.2* 111 8.0 28+090 Athens 142.4 115 4.6 28+175 Athens 132.3 107 6.0
* Density determined using backscatter mode. All other locations determined using 4” direct transmission. Moisture content determined using microwave methods.

D-4
This page intentionally left blank.

E-1
Appendix E: IL 29 Expressway Complete Subgrade and Aggregate Property Data
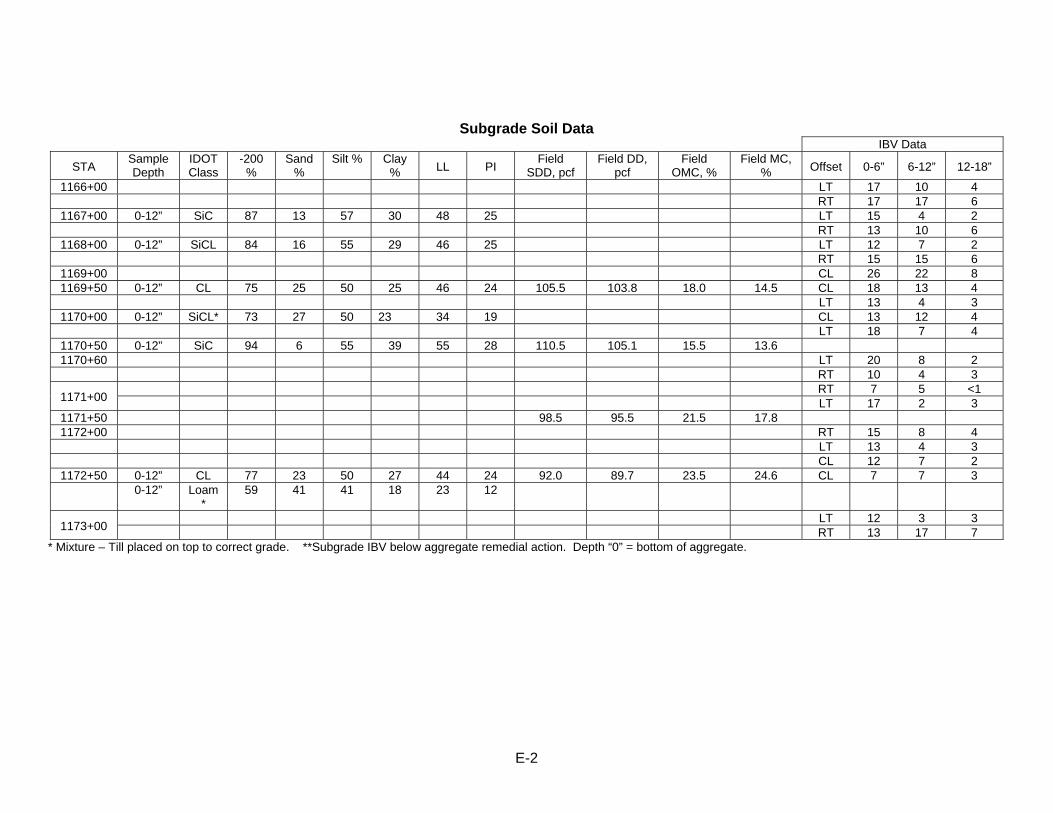
E-2
Subgrade Soil Data IBV Data
STA Sample Depth
IDOT Class
-200 %
Sand %
Silt % Clay % LL PI
Field SDD, pcf
Field DD, pcf
Field OMC, %
Field MC, % Offset 0-6” 6-12” 12-18”
1166+00 LT 17 10 4 RT 17 17 6
1167+00 0-12” SiC 87 13 57 30 48 25 LT 15 4 2 RT 13 10 6
1168+00 0-12” SiCL 84 16 55 29 46 25 LT 12 7 2 RT 15 15 6
1169+00 CL 26 22 8 1169+50 0-12” CL 75 25 50 25 46 24 105.5 103.8 18.0 14.5 CL 18 13 4
LT 13 4 3 1170+00 0-12” SiCL* 73 27 50 23 34 19 CL 13 12 4
LT 18 7 4 1170+50 0-12” SiC 94 6 55 39 55 28 110.5 105.1 15.5 13.6 1170+60 LT 20 8 2
RT 10 4 3
1171+00 RT 7 5 <1 LT 17 2 3
1171+50 98.5 95.5 21.5 17.8 1172+00 RT 15 8 4
LT 13 4 3 CL 12 7 2
1172+50 0-12” CL 77 23 50 27 44 24 92.0 89.7 23.5 24.6 CL 7 7 3 0-12” Loam
* 59 41 41 18 23 12
1173+00 LT 12 3 3 RT 13 17 7
* Mixture – Till placed on top to correct grade. **Subgrade IBV below aggregate remedial action. Depth “0” = bottom of aggregate.
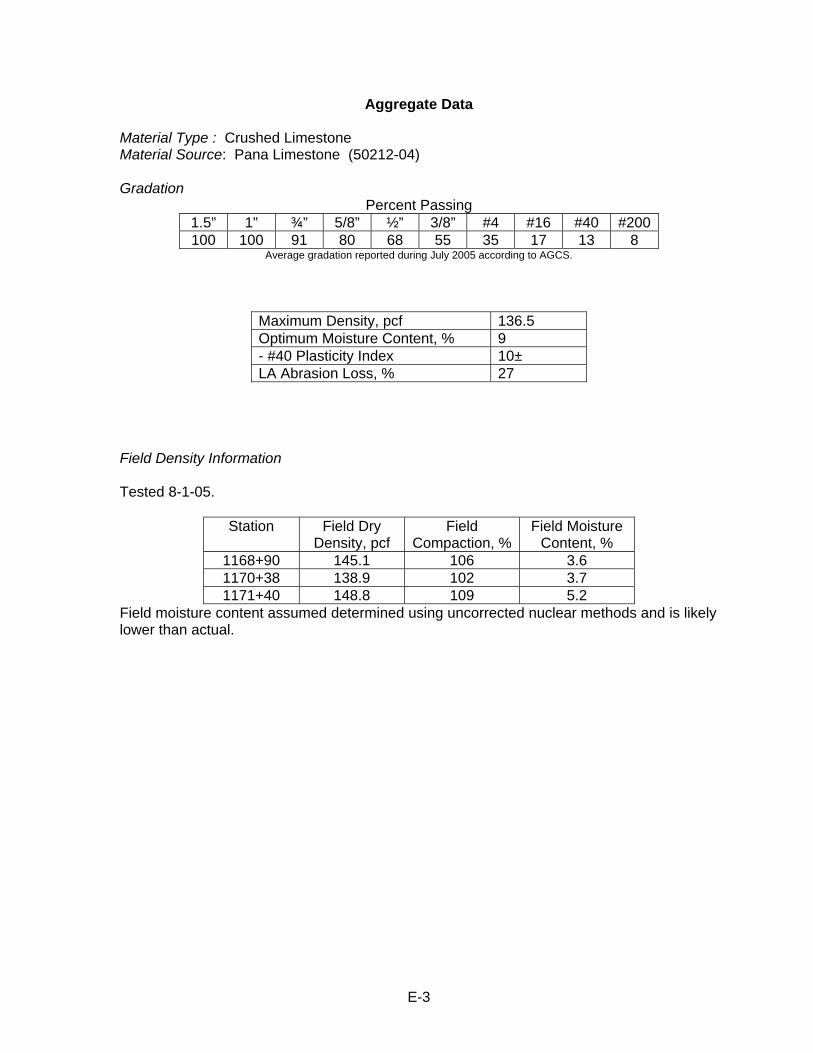
E-3
Aggregate Data Material Type : Crushed Limestone Material Source: Pana Limestone (50212-04) Gradation
Percent Passing 1.5” 1” ¾” 5/8” ½” 3/8” #4 #16 #40 #200 100 100 91 80 68 55 35 17 13 8
Average gradation reported during July 2005 according to AGCS.
Maximum Density, pcf 136.5 Optimum Moisture Content, % 9 - #40 Plasticity Index 10± LA Abrasion Loss, % 27
Field Density Information Tested 8-1-05.
Station Field Dry Density, pcf
Field Compaction, %
Field Moisture Content, %
1168+90 145.1 106 3.6 1170+38 138.9 102 3.7 1171+40 148.8 109 5.2
Field moisture content assumed determined using uncorrected nuclear methods and is likely lower than actual.

E-4
This page intentionally left blank.

F-1
Appendix F: IL 96 Complete Subgrade and Aggregate Property Data
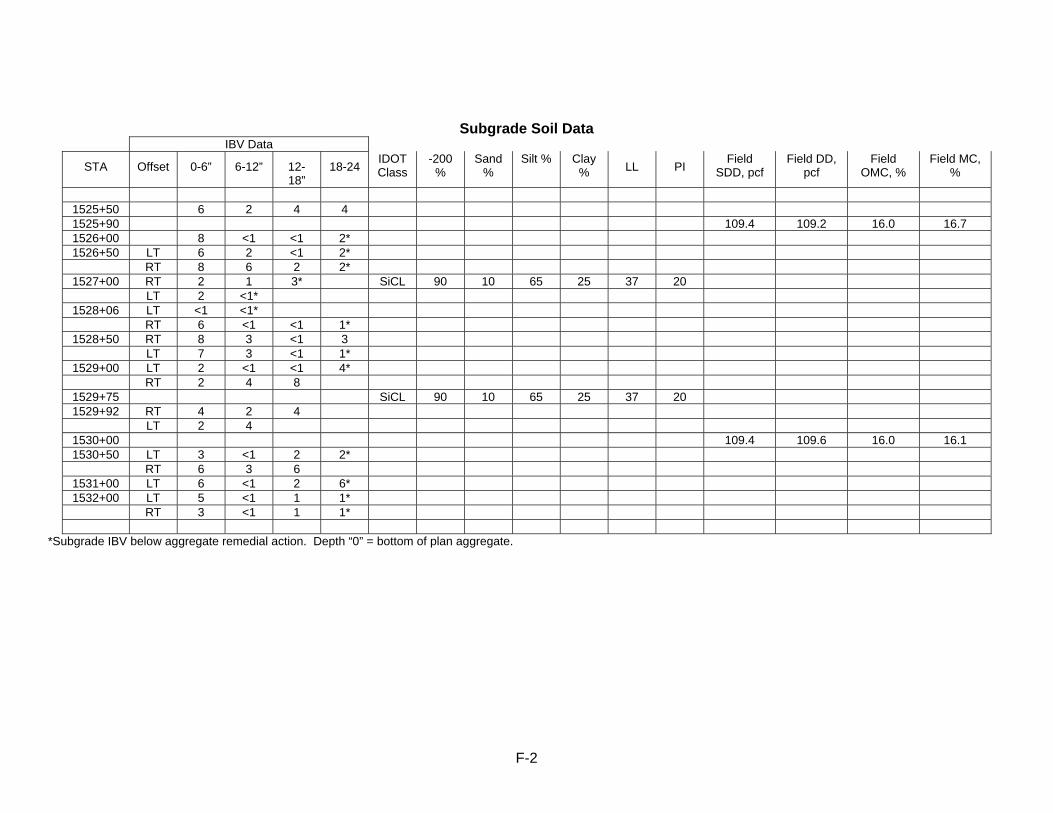
F-2
Subgrade Soil Data IBV Data
STA Offset 0-6” 6-12” 12-18”
18-24 IDOT Class
-200 %
Sand %
Silt % Clay % LL PI
Field SDD, pcf
Field DD, pcf
Field OMC, %
Field MC, %
1525+50 6 2 4 4 1525+90 109.4 109.2 16.0 16.7 1526+00 8 <1 <1 2* 1526+50 LT 6 2 <1 2*
RT 8 6 2 2* 1527+00 RT 2 1 3* SiCL 90 10 65 25 37 20
LT 2 <1* 1528+06 LT <1 <1*
RT 6 <1 <1 1* 1528+50 RT 8 3 <1 3
LT 7 3 <1 1* 1529+00 LT 2 <1 <1 4*
RT 2 4 8 1529+75 SiCL 90 10 65 25 37 20 1529+92 RT 4 2 4
LT 2 4 1530+00 109.4 109.6 16.0 16.1 1530+50 LT 3 <1 2 2*
RT 6 3 6 1531+00 LT 6 <1 2 6* 1532+00 LT 5 <1 1 1*
RT 3 <1 1 1*
*Subgrade IBV below aggregate remedial action. Depth “0” = bottom of plan aggregate.
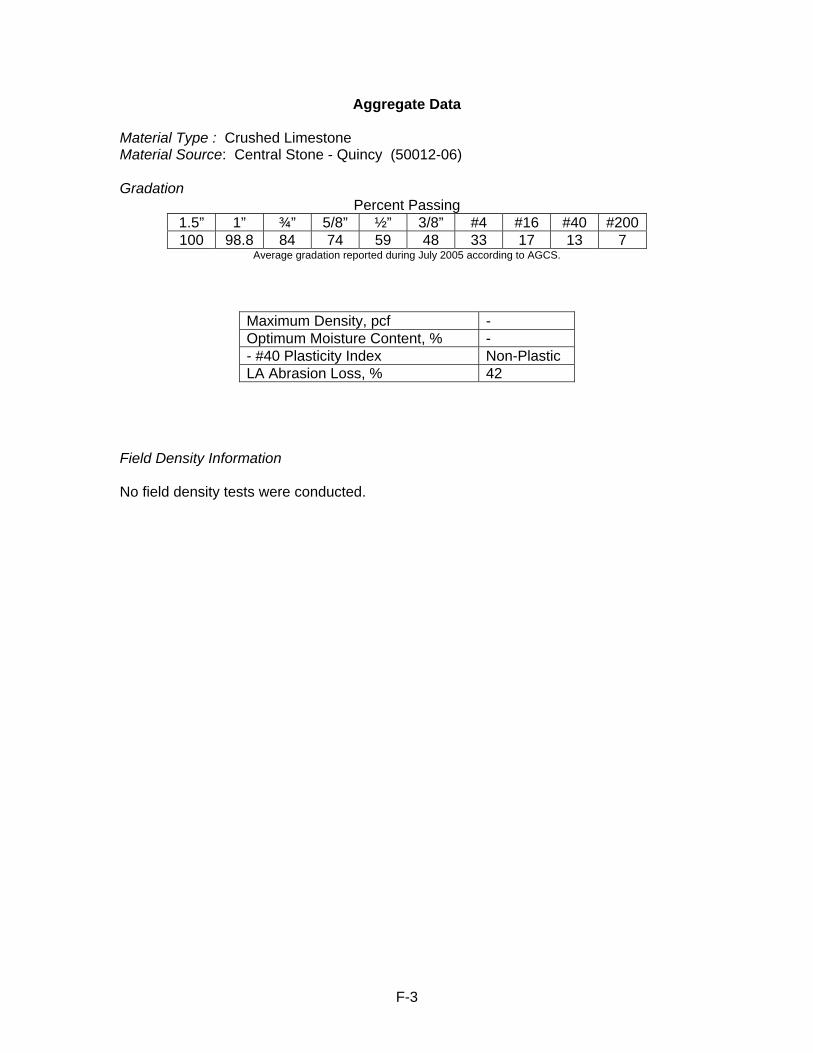
F-3
Aggregate Data Material Type : Crushed Limestone Material Source: Central Stone - Quincy (50012-06) Gradation
Percent Passing 1.5” 1” ¾” 5/8” ½” 3/8” #4 #16 #40 #200 100 98.8 84 74 59 48 33 17 13 7
Average gradation reported during July 2005 according to AGCS.
Maximum Density, pcf - Optimum Moisture Content, % - - #40 Plasticity Index Non-Plastic LA Abrasion Loss, % 42
Field Density Information No field density tests were conducted.