STUDY OF SUBGRADE STRENGTH RELATED TO MOISTURE …ethesis.nitrkl.ac.in/1317/1/project_report.pdf ·...
72
STUDY OF SUBGRADE STRENGTH RELATED TO MOISTURE A project submitted in partial fulfillment of the requirements for the degree of Bachelor of technology In Civil engineering By Biswajeet Sahoo (10501029) Devadatta Nayak (10501012) DEPARTMENT OF CIVIL ENGINEERING NATIONAL INSTITUTE OF TECHNOLOGY ROURKELA-769008 2009
Transcript of STUDY OF SUBGRADE STRENGTH RELATED TO MOISTURE …ethesis.nitrkl.ac.in/1317/1/project_report.pdf ·...
STUDY OF SUBGRADE STRENGTH RELATED TO
MOISTURE
A project submitted in partial fulfillment of the requirements for the degree of
Bachelor of technology
In
Civil engineering
By
Biswajeet Sahoo (10501029)
Devadatta Nayak (10501012)
DEPARTMENT OF CIVIL ENGINEERING
NATIONAL INSTITUTE OF TECHNOLOGY
ROURKELA-769008
2009
STUDY OF SUBGRADE STRENGTH RELATED TO
MOISTURE
A project submitted in partial fulfillment of the requirements for the degree of
Bachelor of technology
In
Civil engineering
By
Biswajeet Sahoo (10501029)
Devadatta Nayak (10501012)
Under the profound guidance of
Prof. M. Panda
Prof. J. K. Pani
DEPARTMENT OF CIVIL ENGINEERING
NATIONAL INSTITUTE OF TECHNOLOGY
ROURKELA-769008

CERTIFICATE
This is to certify that the thesis entitled, “STUDY OF SUBGRADE STRENGTH RELATED TO
MOISTURE CONTENT” submitted by Mr Biswajeet Sahoo and Mr Devadatta Nayak in partial
fulfillment for the requirements for the award of Bachelor of Technology Degree in Civil
Engineering at National Institute of Technology, Rourkela(Deemed university) is an authentic
workcarried out by them under my supervision and guidance.
To the best of my knowledge, the matter embodied in the thesis has not been
submitted to any other university/Institute for the award of any Degree or Diploma.
Date: Prof.M.Panda Prof.J.K.Pani
Dept. of Civil Engineering Dept. of Civil Engineering
National Institute of Technology National Institute of Technology
Rourkela-769008 Rourkela-769008
ACKNOWLEDGEMENT
We would like to express our deep gratitude to our project mentors,
Prof M.Panda and Prof.J.K.Pani for their valuable guidance. It is only
for their constant suggestions that we have been able to finish our
project work.
Biswajeet Sahoo
Devadatta Nayak
8TH SEM, Civil Engg
CONTENTS
1. Brief overview of the project
2. The Subgrade
3. Determining subgrade strength for designing new roads
1.1 Typical presumptive design CBR values
1.2 Nomograph based upon sieve analysis data
1.3 Quick estimation of CBR
1.4 The actual laboratory method
4. Experimental work
4.1 Calculation of OMC and MDD
4.2 Determination of CBR
4.3 Variation of CBR with days of soaking
4.4 Variation of CBR with moisture content(after each day of soaking)
5. Conclusion
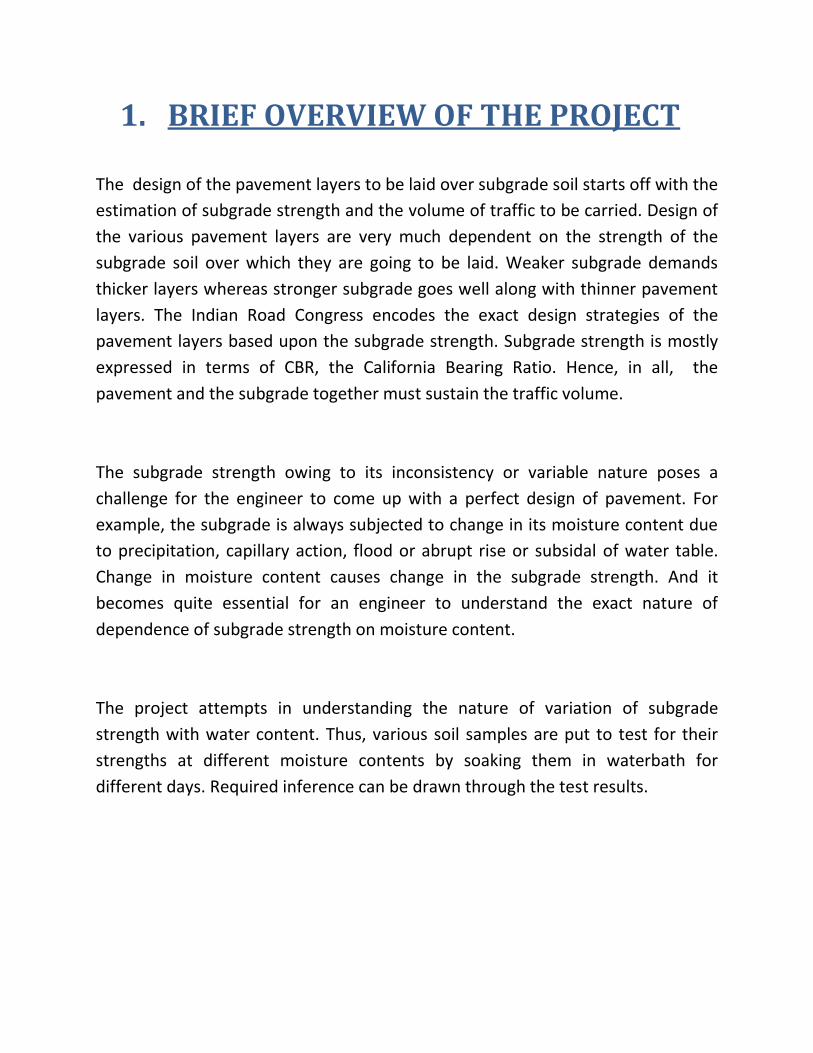
1. BRIEF OVERVIEW OF THE PROJECT
The design of the pavement layers to be laid over subgrade soil starts off with the
estimation of subgrade strength and the volume of traffic to be carried. Design of
the various pavement layers are very much dependent on the strength of the
subgrade soil over which they are going to be laid. Weaker subgrade demands
thicker layers whereas stronger subgrade goes well along with thinner pavement
layers. The Indian Road Congress encodes the exact design strategies of the
pavement layers based upon the subgrade strength. Subgrade strength is mostly
expressed in terms of CBR, the California Bearing Ratio. Hence, in all, the
pavement and the subgrade together must sustain the traffic volume.
The subgrade strength owing to its inconsistency or variable nature poses a
challenge for the engineer to come up with a perfect design of pavement. For
example, the subgrade is always subjected to change in its moisture content due
to precipitation, capillary action, flood or abrupt rise or subsidal of water table.
Change in moisture content causes change in the subgrade strength. And it
becomes quite essential for an engineer to understand the exact nature of
dependence of subgrade strength on moisture content.
The project attempts in understanding the nature of variation of subgrade
strength with water content. Thus, various soil samples are put to test for their
strengths at different moisture contents by soaking them in waterbath for
different days. Required inference can be drawn through the test results.
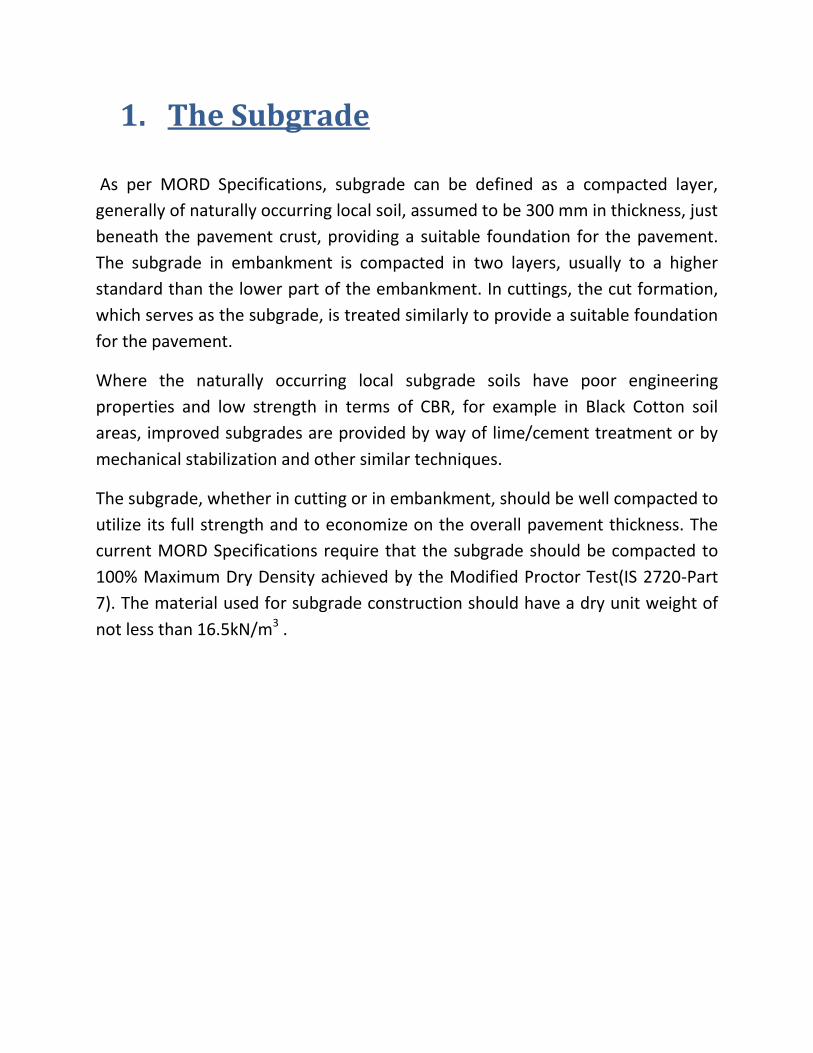
1. The Subgrade
As per MORD Specifications, subgrade can be defined as a compacted layer,
generally of naturally occurring local soil, assumed to be 300 mm in thickness, just
beneath the pavement crust, providing a suitable foundation for the pavement.
The subgrade in embankment is compacted in two layers, usually to a higher
standard than the lower part of the embankment. In cuttings, the cut formation,
which serves as the subgrade, is treated similarly to provide a suitable foundation
for the pavement.
Where the naturally occurring local subgrade soils have poor engineering
properties and low strength in terms of CBR, for example in Black Cotton soil
areas, improved subgrades are provided by way of lime/cement treatment or by
mechanical stabilization and other similar techniques.
The subgrade, whether in cutting or in embankment, should be well compacted to
utilize its full strength and to economize on the overall pavement thickness. The
current MORD Specifications require that the subgrade should be compacted to
100% Maximum Dry Density achieved by the Modified Proctor Test(IS 2720-Part
7). The material used for subgrade construction should have a dry unit weight of
not less than 16.5kN/m3 .
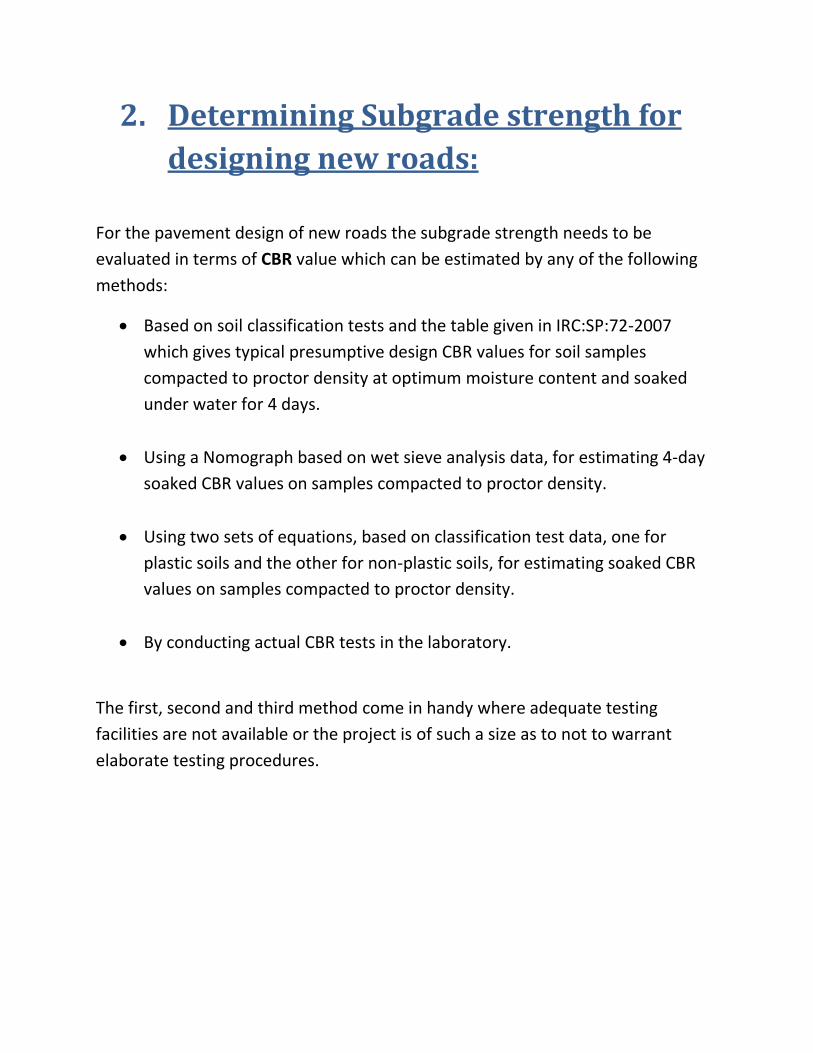
2. Determining Subgrade strength for
designing new roads:
For the pavement design of new roads the subgrade strength needs to be
evaluated in terms of CBR value which can be estimated by any of the following
methods:
Based on soil classification tests and the table given in IRC:SP:72-2007
which gives typical presumptive design CBR values for soil samples
compacted to proctor density at optimum moisture content and soaked
under water for 4 days.
Using a Nomograph based on wet sieve analysis data, for estimating 4-day
soaked CBR values on samples compacted to proctor density.
Using two sets of equations, based on classification test data, one for
plastic soils and the other for non-plastic soils, for estimating soaked CBR
values on samples compacted to proctor density.
By conducting actual CBR tests in the laboratory.
The first, second and third method come in handy where adequate testing
facilities are not available or the project is of such a size as to not to warrant
elaborate testing procedures.
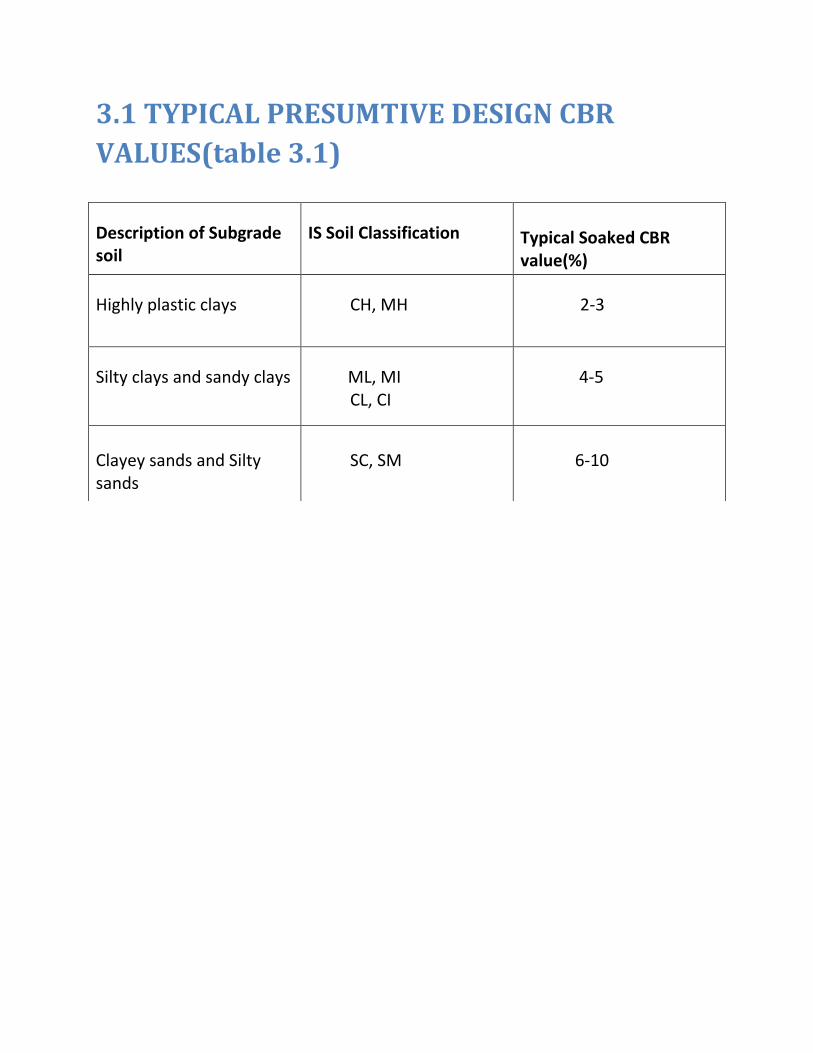
3.1 TYPICAL PRESUMTIVE DESIGN CBR
VALUES(table 3.1)
Description of Subgrade soil
IS Soil Classification Typical Soaked CBR value(%)
Highly plastic clays
CH, MH
2-3
Silty clays and sandy clays
ML, MI CL, CI
4-5
Clayey sands and Silty sands
SC, SM
6-10
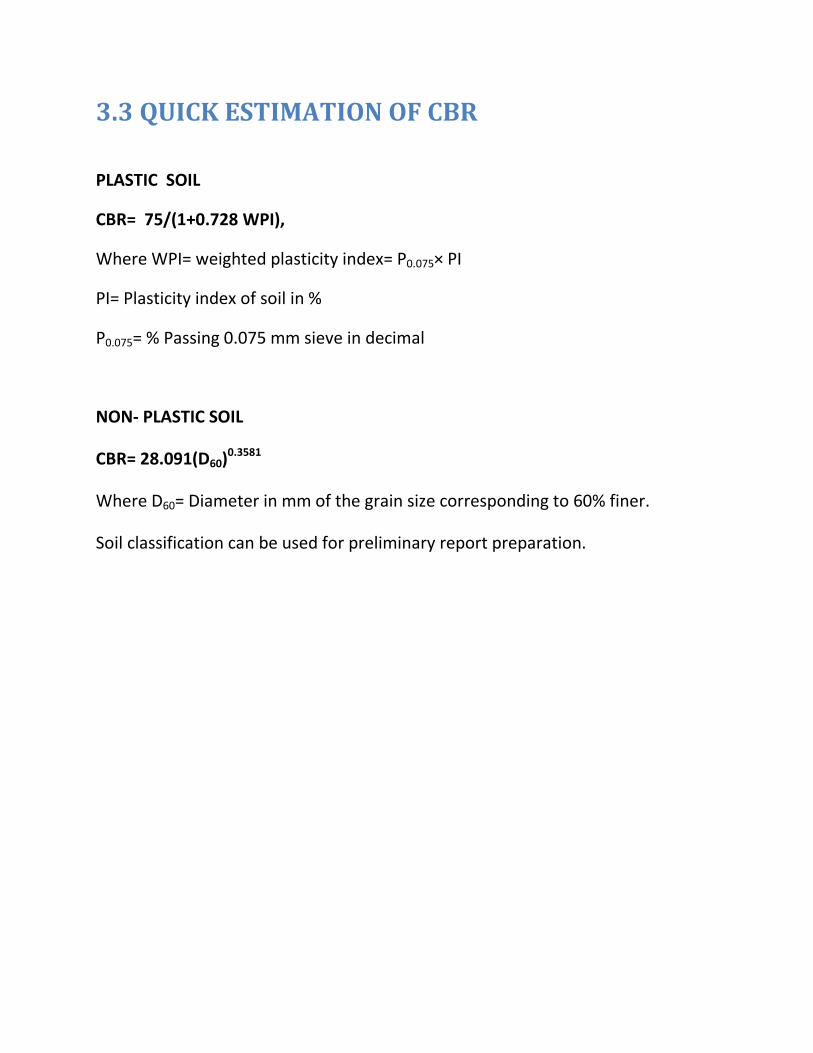
3.3 QUICK ESTIMATION OF CBR
PLASTIC SOIL
CBR= 75/(1+0.728 WPI),
Where WPI= weighted plasticity index= P0.075× PI
PI= Plasticity index of soil in %
P0.075= % Passing 0.075 mm sieve in decimal
NON- PLASTIC SOIL
CBR= 28.091(D60)0.3581
Where D60= Diameter in mm of the grain size corresponding to 60% finer.
Soil classification can be used for preliminary report preparation.
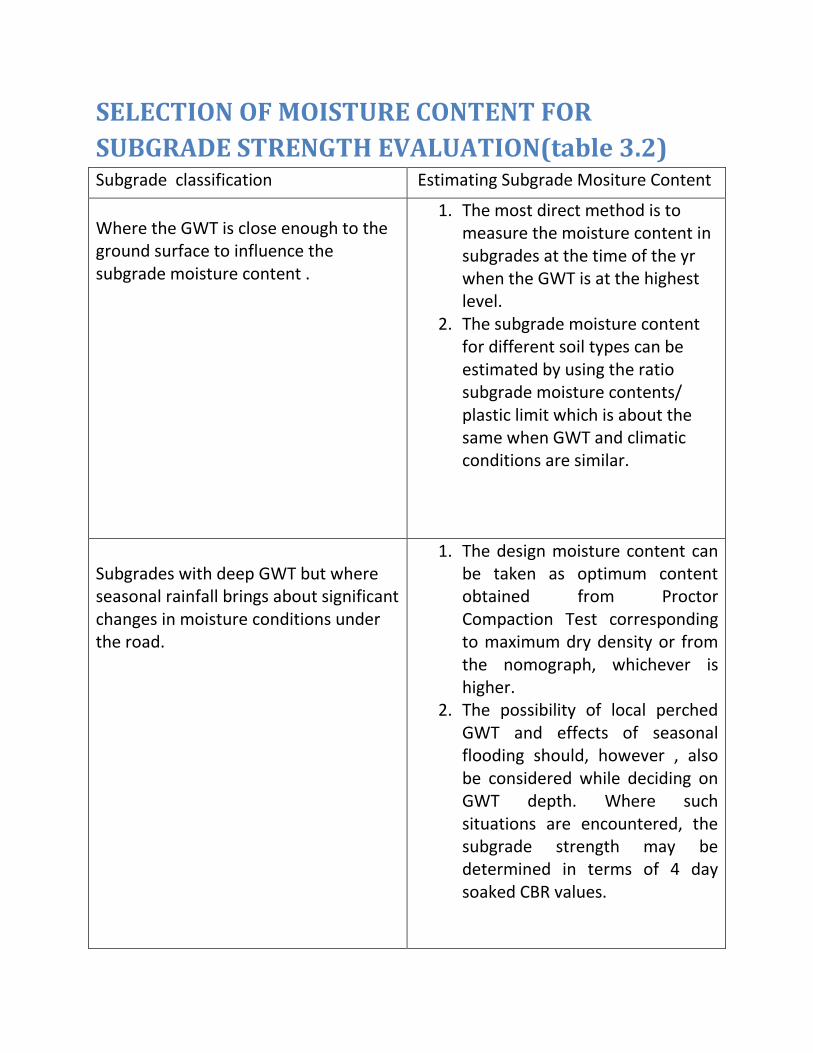
SELECTION OF MOISTURE CONTENT FOR
SUBGRADE STRENGTH EVALUATION(table 3.2) Subgrade classification Estimating Subgrade Mositure Content
Where the GWT is close enough to the ground surface to influence the subgrade moisture content .
1. The most direct method is to measure the moisture content in subgrades at the time of the yr when the GWT is at the highest level.
2. The subgrade moisture content for different soil types can be estimated by using the ratio subgrade moisture contents/ plastic limit which is about the same when GWT and climatic conditions are similar.
Subgrades with deep GWT but where seasonal rainfall brings about significant changes in moisture conditions under the road.
1. The design moisture content can be taken as optimum content obtained from Proctor Compaction Test corresponding to maximum dry density or from the nomograph, whichever is higher.
2. The possibility of local perched GWT and effects of seasonal flooding should, however , also be considered while deciding on GWT depth. Where such situations are encountered, the subgrade strength may be determined in terms of 4 day soaked CBR values.
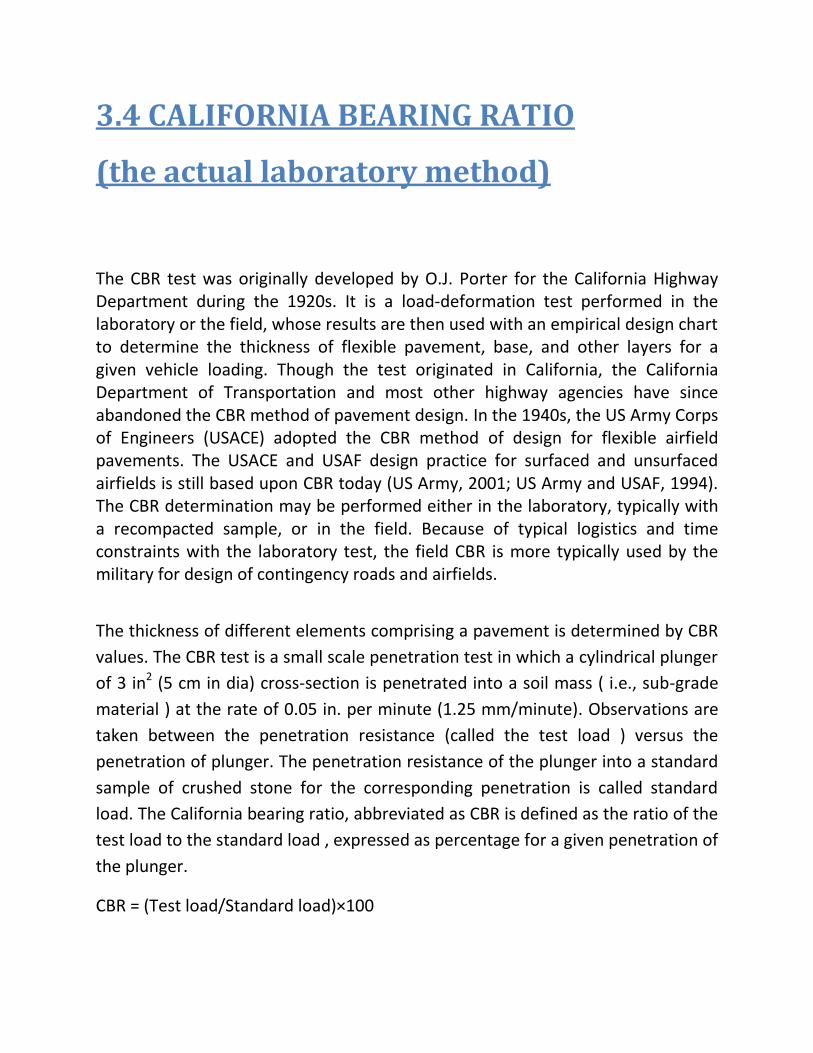
3.4 CALIFORNIA BEARING RATIO
(the actual laboratory method)
The CBR test was originally developed by O.J. Porter for the California Highway Department during the 1920s. It is a load-deformation test performed in the laboratory or the field, whose results are then used with an empirical design chart to determine the thickness of flexible pavement, base, and other layers for a given vehicle loading. Though the test originated in California, the California Department of Transportation and most other highway agencies have since abandoned the CBR method of pavement design. In the 1940s, the US Army Corps of Engineers (USACE) adopted the CBR method of design for flexible airfield pavements. The USACE and USAF design practice for surfaced and unsurfaced airfields is still based upon CBR today (US Army, 2001; US Army and USAF, 1994). The CBR determination may be performed either in the laboratory, typically with a recompacted sample, or in the field. Because of typical logistics and time constraints with the laboratory test, the field CBR is more typically used by the military for design of contingency roads and airfields.
The thickness of different elements comprising a pavement is determined by CBR
values. The CBR test is a small scale penetration test in which a cylindrical plunger
of 3 in2 (5 cm in dia) cross-section is penetrated into a soil mass ( i.e., sub-grade
material ) at the rate of 0.05 in. per minute (1.25 mm/minute). Observations are
taken between the penetration resistance (called the test load ) versus the
penetration of plunger. The penetration resistance of the plunger into a standard
sample of crushed stone for the corresponding penetration is called standard
load. The California bearing ratio, abbreviated as CBR is defined as the ratio of the
test load to the standard load , expressed as percentage for a given penetration of
the plunger.
CBR = (Test load/Standard load)×100
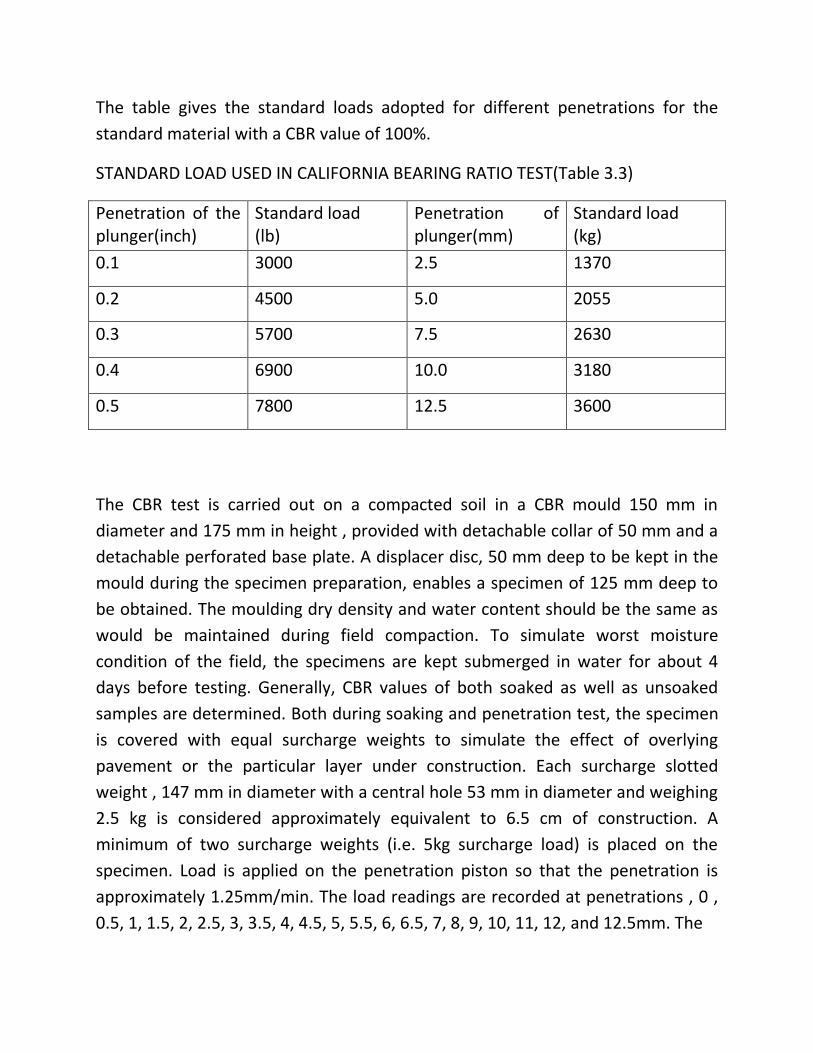
The table gives the standard loads adopted for different penetrations for the
standard material with a CBR value of 100%.
STANDARD LOAD USED IN CALIFORNIA BEARING RATIO TEST(Table 3.3)
Penetration of the plunger(inch)
Standard load (lb)
Penetration of plunger(mm)
Standard load (kg)
0.1 3000 2.5 1370
0.2 4500 5.0 2055
0.3 5700 7.5 2630
0.4 6900 10.0 3180
0.5 7800 12.5 3600
The CBR test is carried out on a compacted soil in a CBR mould 150 mm in
diameter and 175 mm in height , provided with detachable collar of 50 mm and a
detachable perforated base plate. A displacer disc, 50 mm deep to be kept in the
mould during the specimen preparation, enables a specimen of 125 mm deep to
be obtained. The moulding dry density and water content should be the same as
would be maintained during field compaction. To simulate worst moisture
condition of the field, the specimens are kept submerged in water for about 4
days before testing. Generally, CBR values of both soaked as well as unsoaked
samples are determined. Both during soaking and penetration test, the specimen
is covered with equal surcharge weights to simulate the effect of overlying
pavement or the particular layer under construction. Each surcharge slotted
weight , 147 mm in diameter with a central hole 53 mm in diameter and weighing
2.5 kg is considered approximately equivalent to 6.5 cm of construction. A
minimum of two surcharge weights (i.e. 5kg surcharge load) is placed on the
specimen. Load is applied on the penetration piston so that the penetration is
approximately 1.25mm/min. The load readings are recorded at penetrations , 0 ,
0.5, 1, 1.5, 2, 2.5, 3, 3.5, 4, 4.5, 5, 5.5, 6, 6.5, 7, 8, 9, 10, 11, 12, and 12.5mm. The
maximum load and penetration is recorded if it occurs for a penetration of less
than 12.5 mm.
The curve is mainly convex upwards although the initial portion of the
curve may be concave upwards due to surface irregularities. A correction is then
applied by drawing a tangent to the curve at the point of greatest slope. The
corrected origin will be the point where the tangent meets the abscissa.
The CBR values are usually calculated for penetrations of 2.5 mm and
5mm. Generally the CBR values at 2.5mm penetration will be greater than 5mm
penetration and in such a case the former is taken as the CBR value for design
purposes. If the CBR value corresponding to a penetration of 5mm exceeds that
for 2.5mm, the test is repeated. If identical results follow, the bearing ratio
corresponding to 5mm penetration is taken for design.
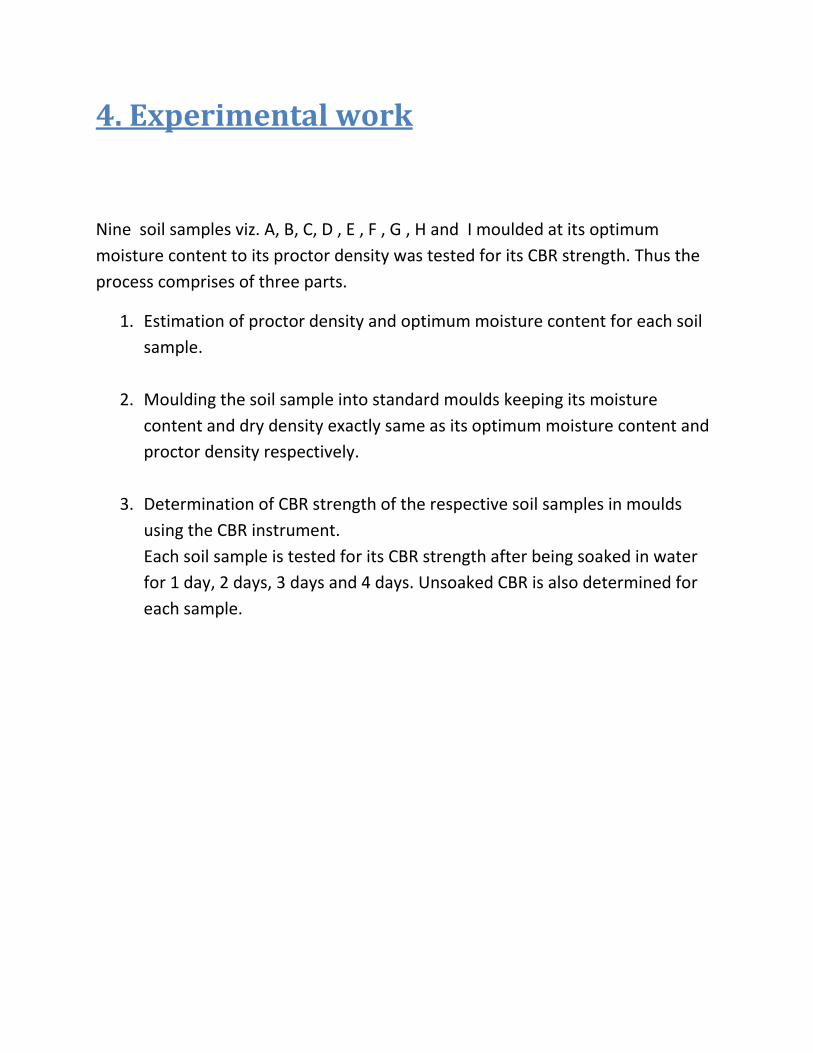
4. Experimental work
Nine soil samples viz. A, B, C, D , E , F , G , H and I moulded at its optimum
moisture content to its proctor density was tested for its CBR strength. Thus the
process comprises of three parts.
1. Estimation of proctor density and optimum moisture content for each soil
sample.
2. Moulding the soil sample into standard moulds keeping its moisture
content and dry density exactly same as its optimum moisture content and
proctor density respectively.
3. Determination of CBR strength of the respective soil samples in moulds
using the CBR instrument.
Each soil sample is tested for its CBR strength after being soaked in water
for 1 day, 2 days, 3 days and 4 days. Unsoaked CBR is also determined for
each sample.
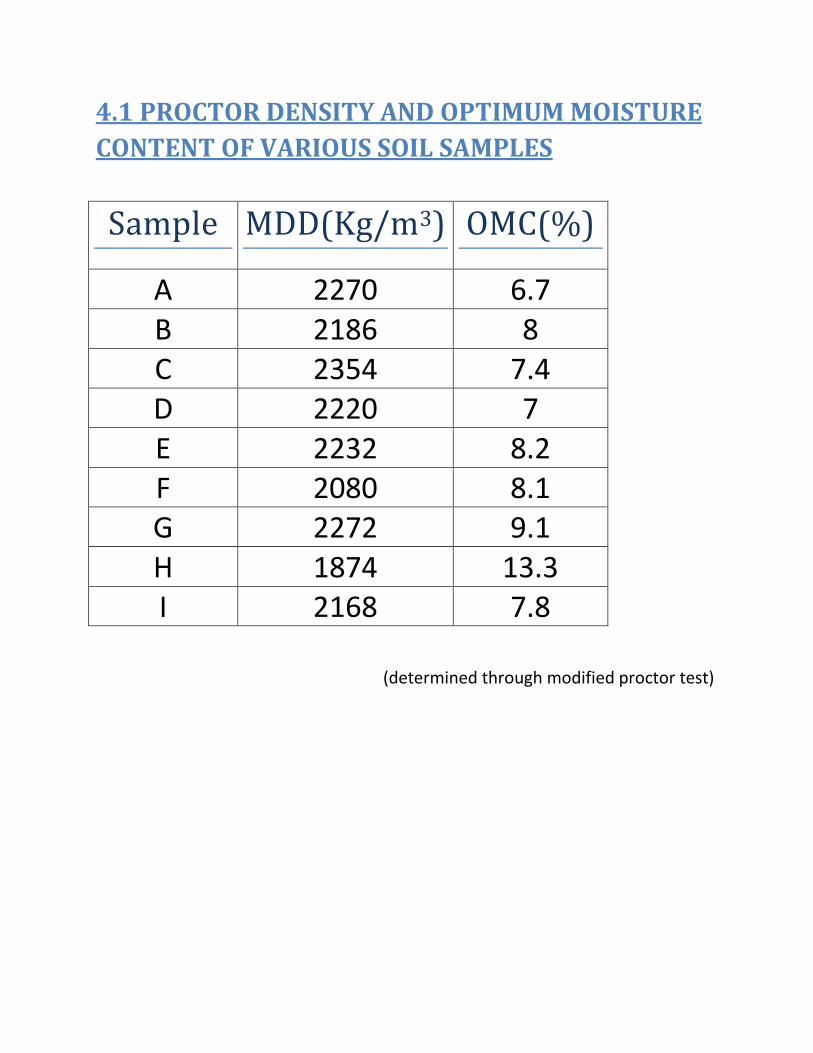
4.1 PROCTOR DENSITY AND OPTIMUM MOISTURE
CONTENT OF VARIOUS SOIL SAMPLES
Sample MDD(Kg/m3) OMC(%)
A 2270 6.7 B 2186 8 C 2354 7.4 D 2220 7 E 2232 8.2 F 2080 8.1 G 2272 9.1 H 1874 13.3 I 2168 7.8
(determined through modified proctor test)
4.2 DETERMINATION OF CBR
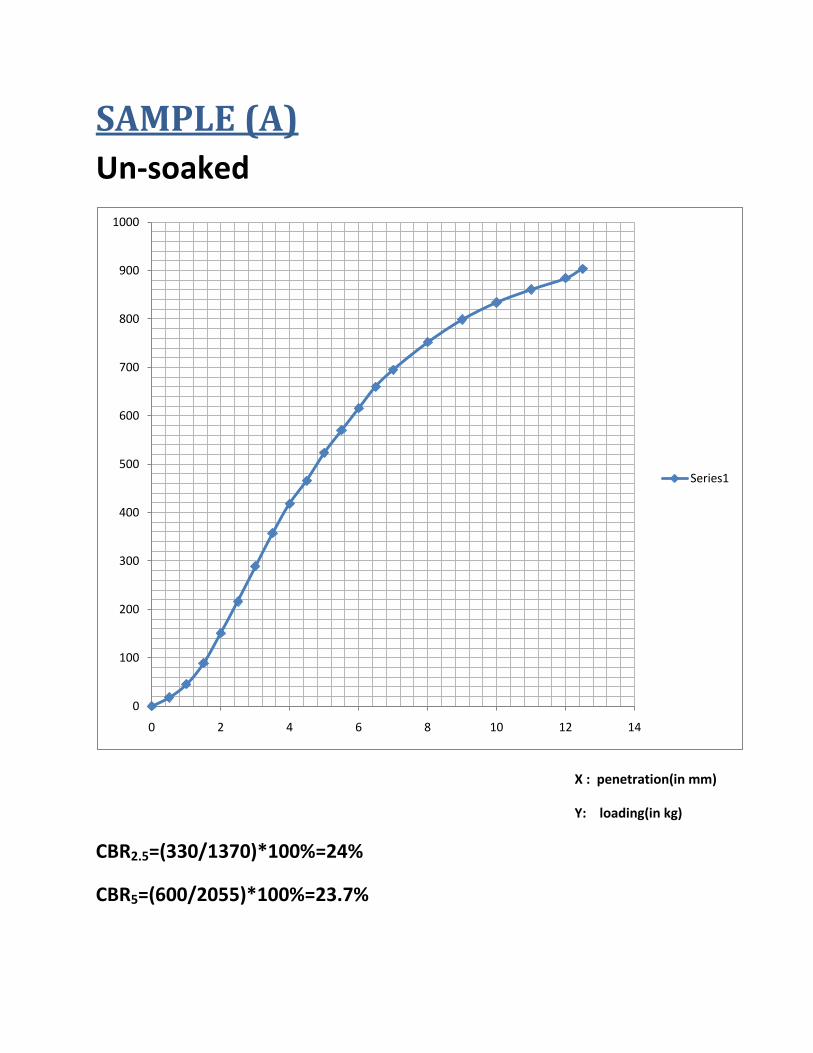
SAMPLE (A)
Un-soaked
X : penetration(in mm)
Y: loading(in kg)
CBR2.5=(330/1370)*100%=24%
CBR5=(600/2055)*100%=23.7%
0
100
200
300
400
500
600
700
800
900
1000
0 2 4 6 8 10 12 14
Series1
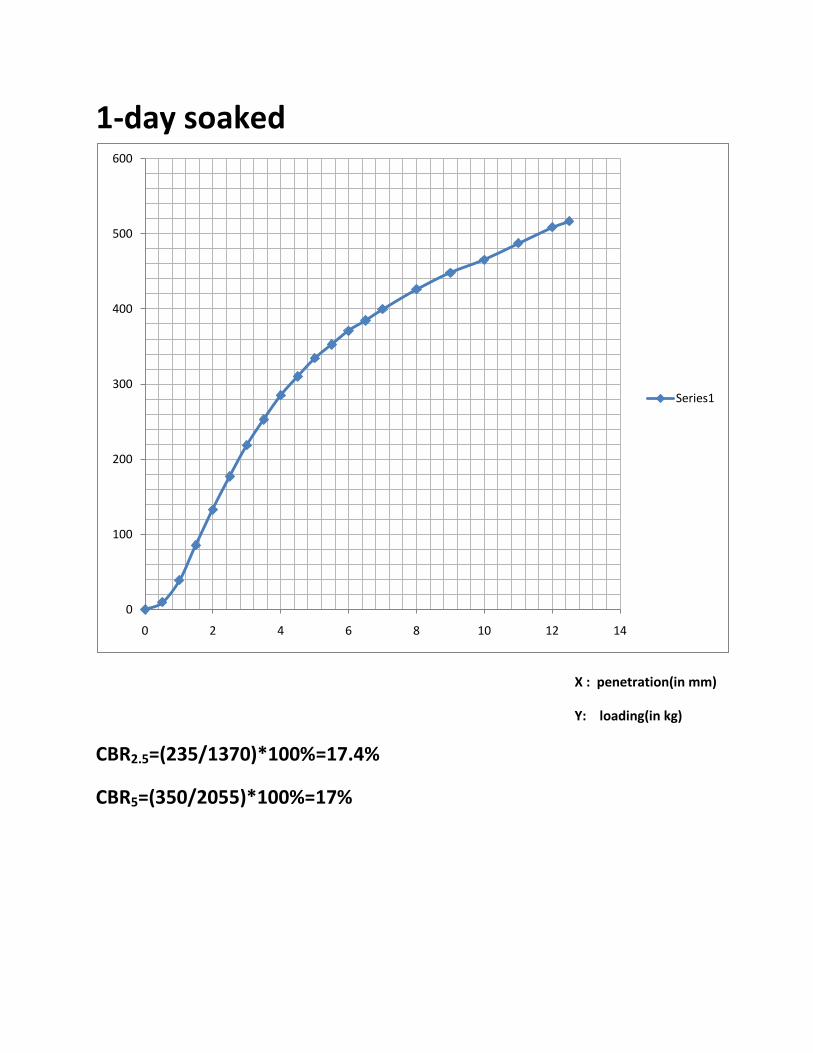
1-day soaked
X : penetration(in mm)
Y: loading(in kg)
CBR2.5=(235/1370)*100%=17.4%
CBR5=(350/2055)*100%=17%
0
100
200
300
400
500
600
0 2 4 6 8 10 12 14
Series1
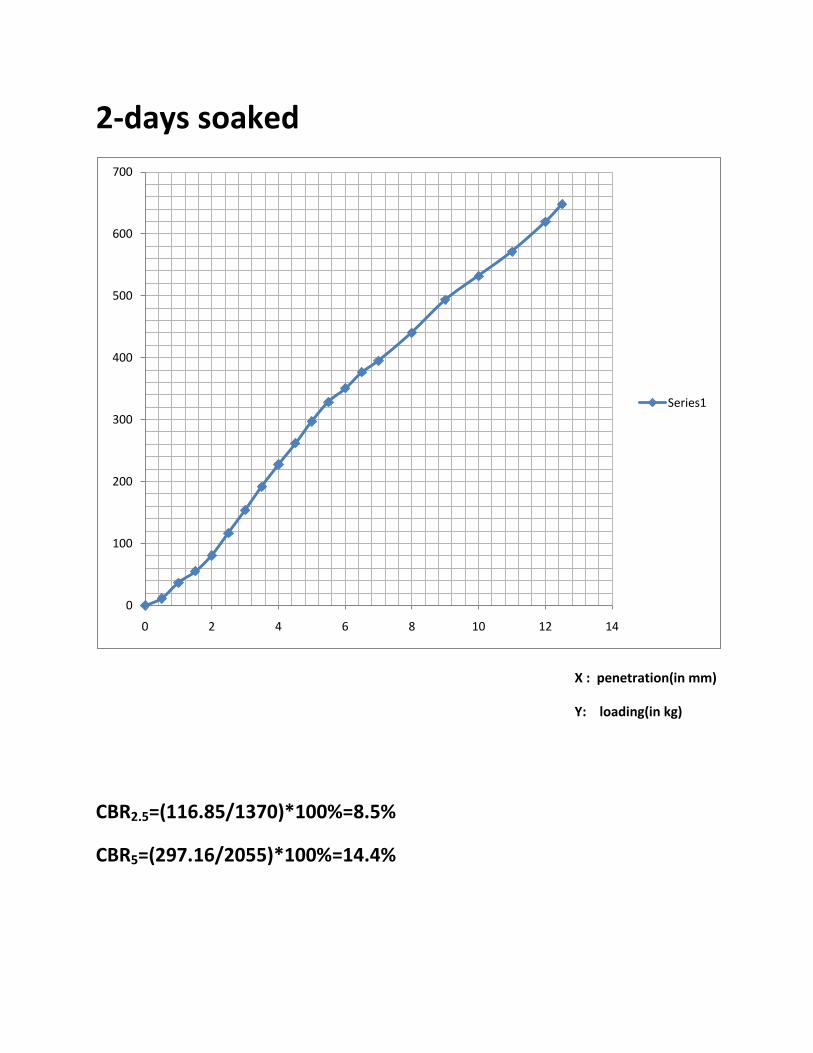
2-days soaked
X : penetration(in mm)
Y: loading(in kg)
CBR2.5=(116.85/1370)*100%=8.5%
CBR5=(297.16/2055)*100%=14.4%
0
100
200
300
400
500
600
700
0 2 4 6 8 10 12 14
Series1
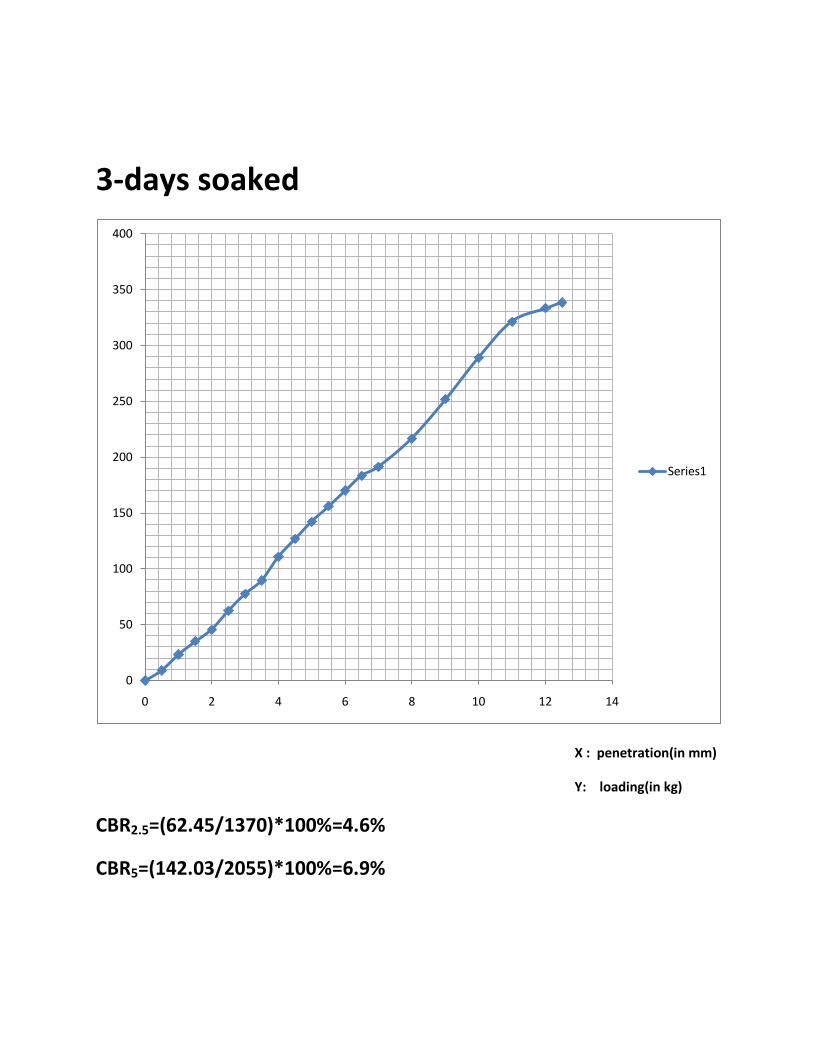
3-days soaked
X : penetration(in mm)
Y: loading(in kg)
CBR2.5=(62.45/1370)*100%=4.6%
CBR5=(142.03/2055)*100%=6.9%
0
50
100
150
200
250
300
350
400
0 2 4 6 8 10 12 14
Series1
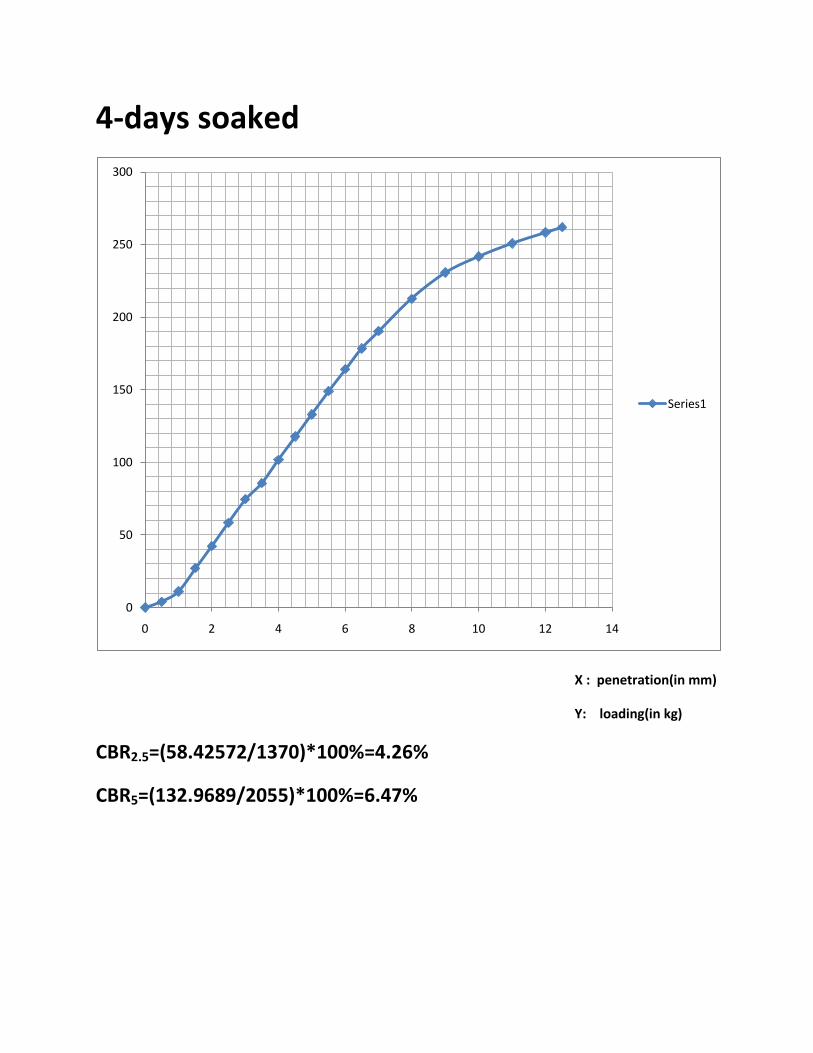
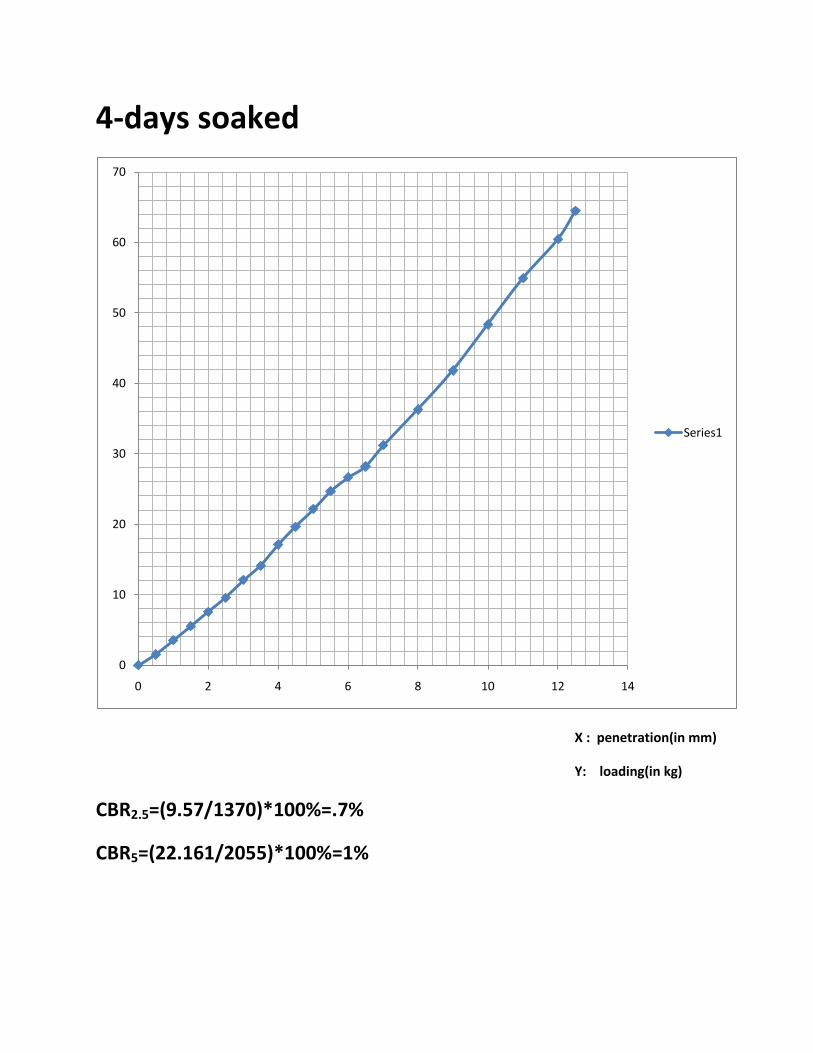
4-days soaked
X : penetration(in mm)
Y: loading(in kg)
CBR2.5=(58.42572/1370)*100%=4.26%
CBR5=(132.9689/2055)*100%=6.47%
0
50
100
150
200
250
300
0 2 4 6 8 10 12 14
Series1
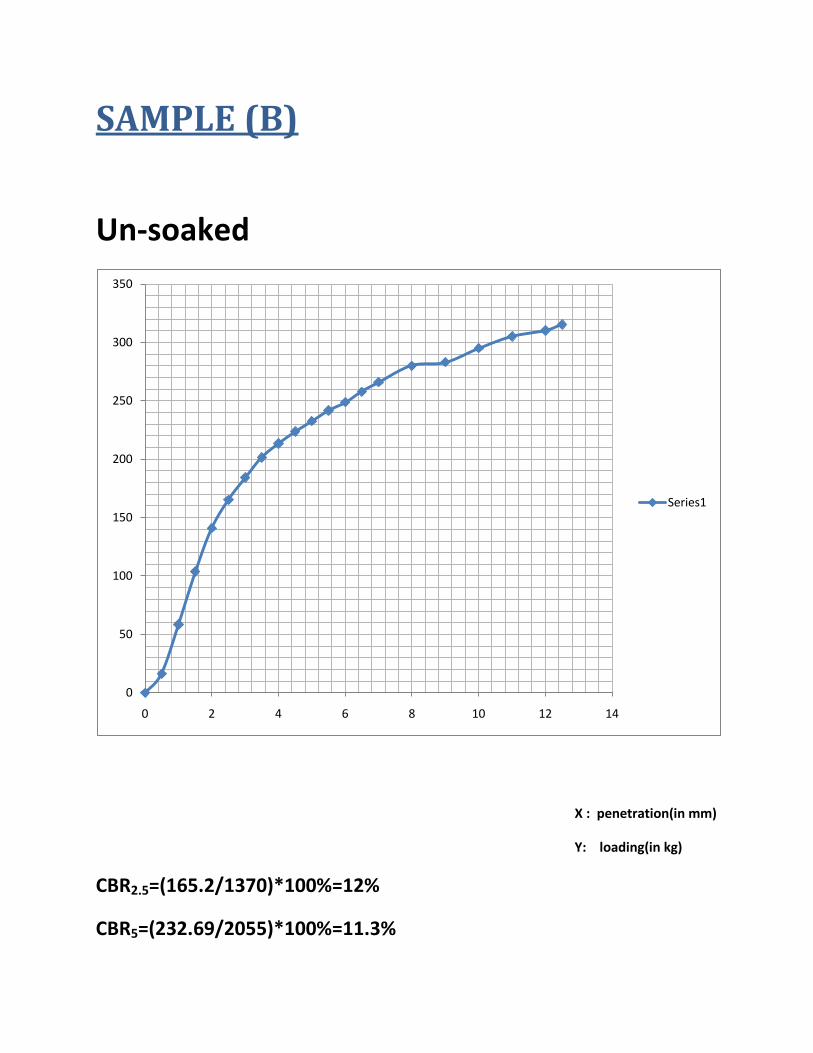
SAMPLE (B)
Un-soaked
X : penetration(in mm) Y: loading(in kg)
CBR2.5=(165.2/1370)*100%=12%
CBR5=(232.69/2055)*100%=11.3%
0
50
100
150
200
250
300
350
0 2 4 6 8 10 12 14
Series1
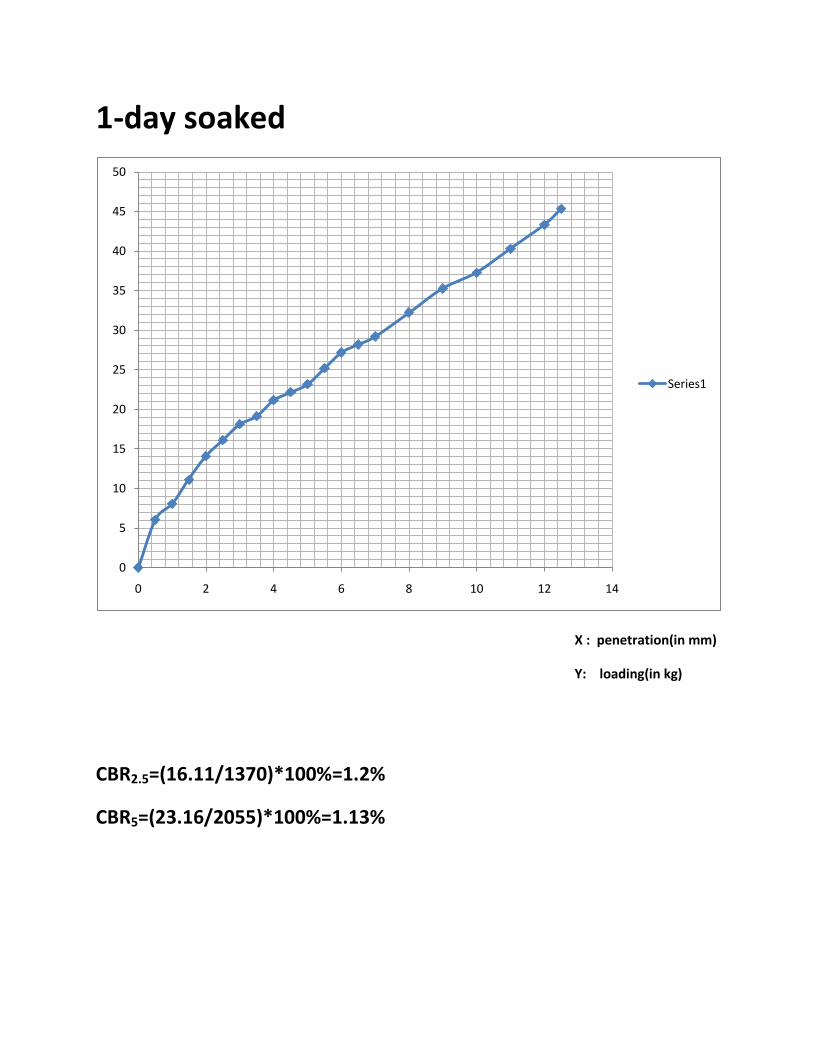
1-day soaked
X : penetration(in mm)
Y: loading(in kg)
CBR2.5=(16.11/1370)*100%=1.2%
CBR5=(23.16/2055)*100%=1.13%
0
5
10
15
20
25
30
35
40
45
50
0 2 4 6 8 10 12 14
Series1
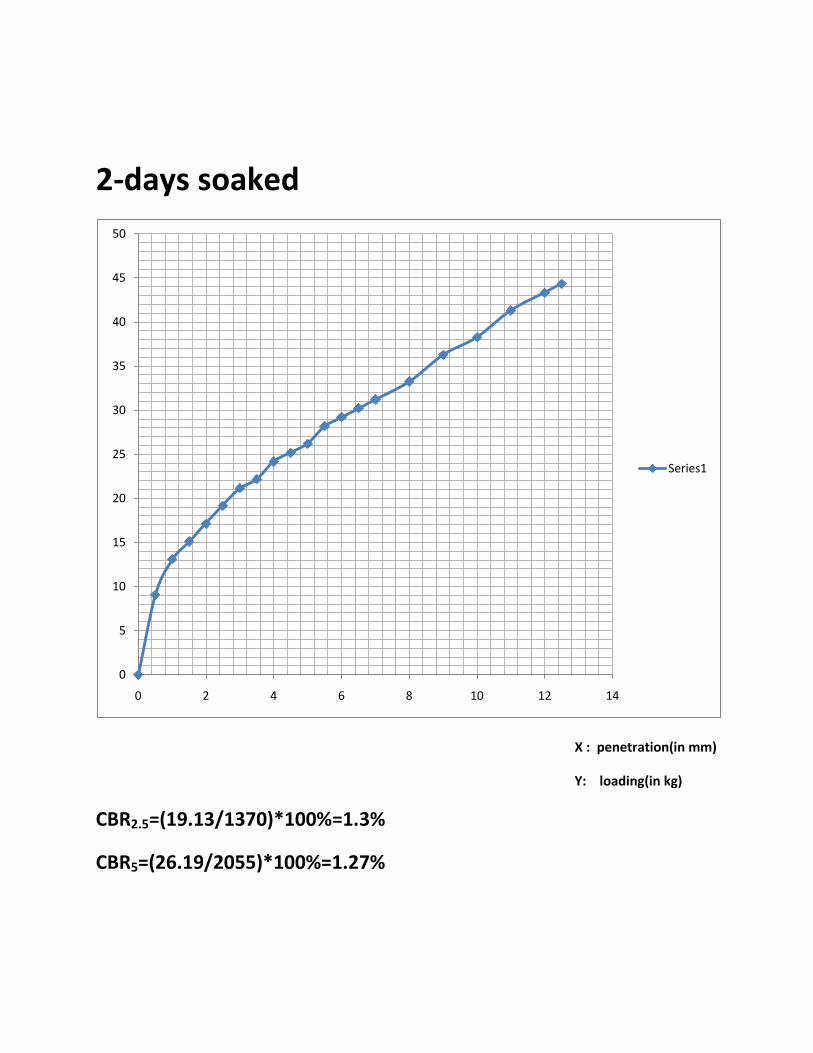
2-days soaked
X : penetration(in mm)
Y: loading(in kg)
CBR2.5=(19.13/1370)*100%=1.3%
CBR5=(26.19/2055)*100%=1.27%
0
5
10
15
20
25
30
35
40
45
50
0 2 4 6 8 10 12 14
Series1
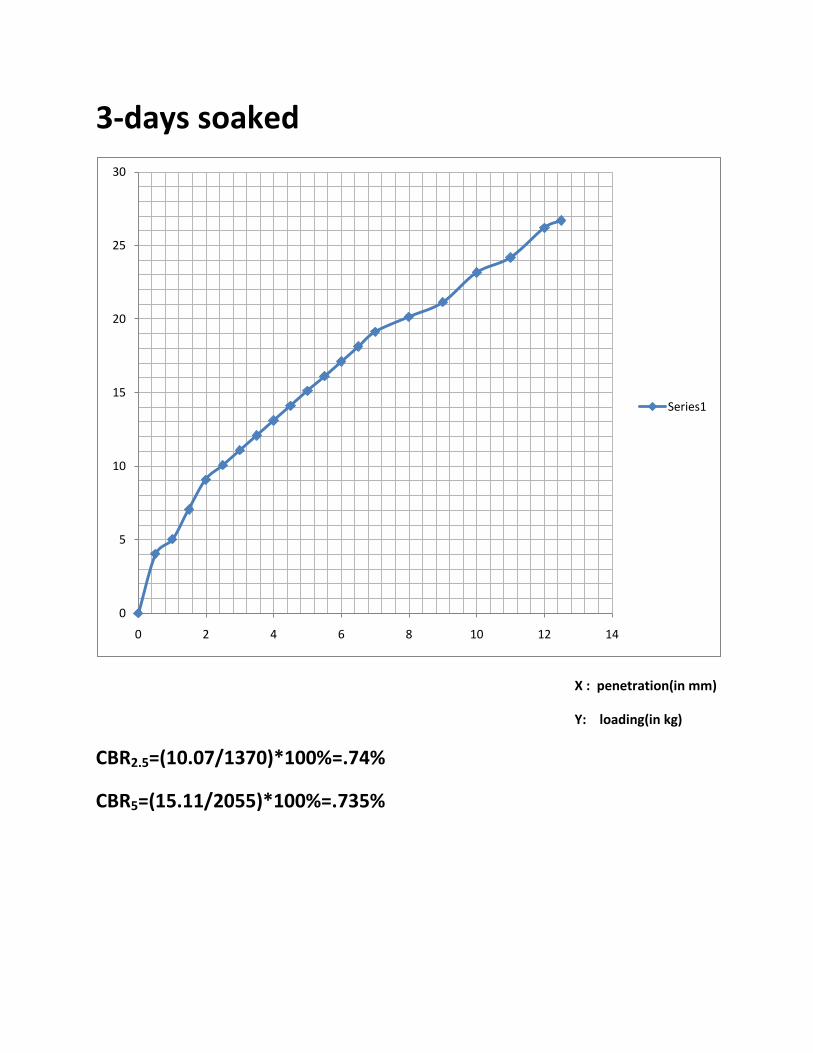
3-days soaked
X : penetration(in mm)
Y: loading(in kg)
CBR2.5=(10.07/1370)*100%=.74%
CBR5=(15.11/2055)*100%=.735%
0
5
10
15
20
25
30
0 2 4 6 8 10 12 14
Series1
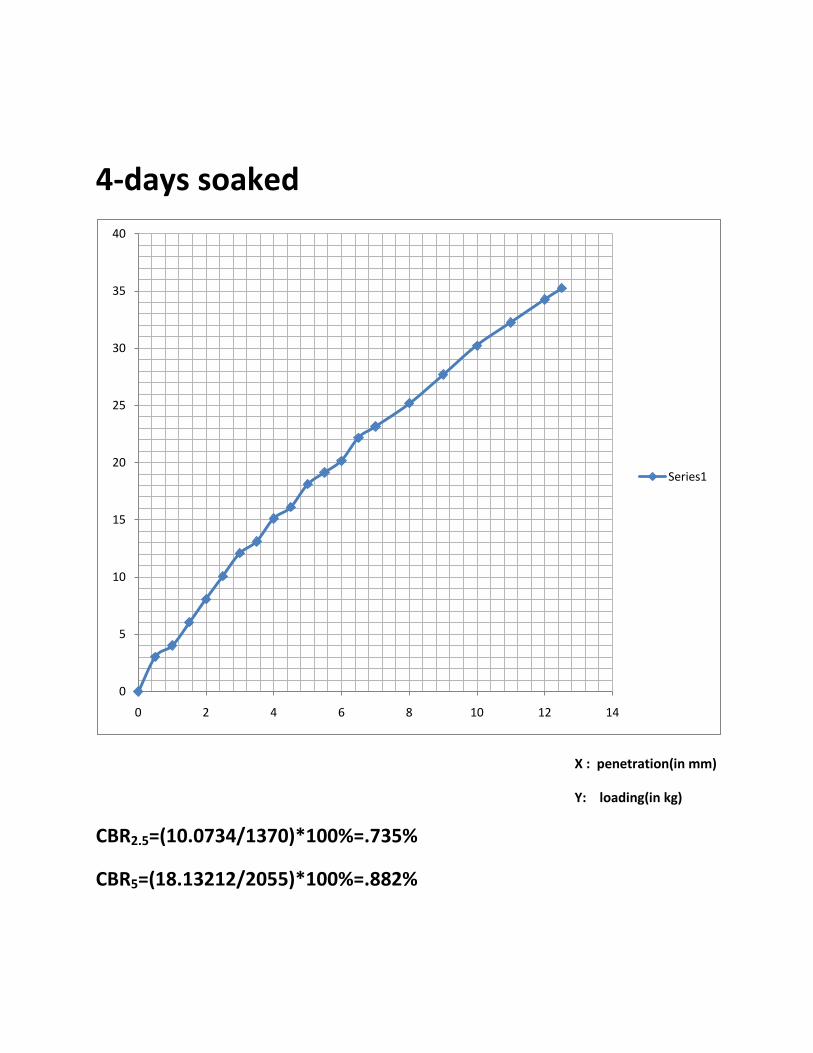
4-days soaked
X : penetration(in mm)
Y: loading(in kg)
CBR2.5=(10.0734/1370)*100%=.735%
CBR5=(18.13212/2055)*100%=.882%
0
5
10
15
20
25
30
35
40
0 2 4 6 8 10 12 14
Series1
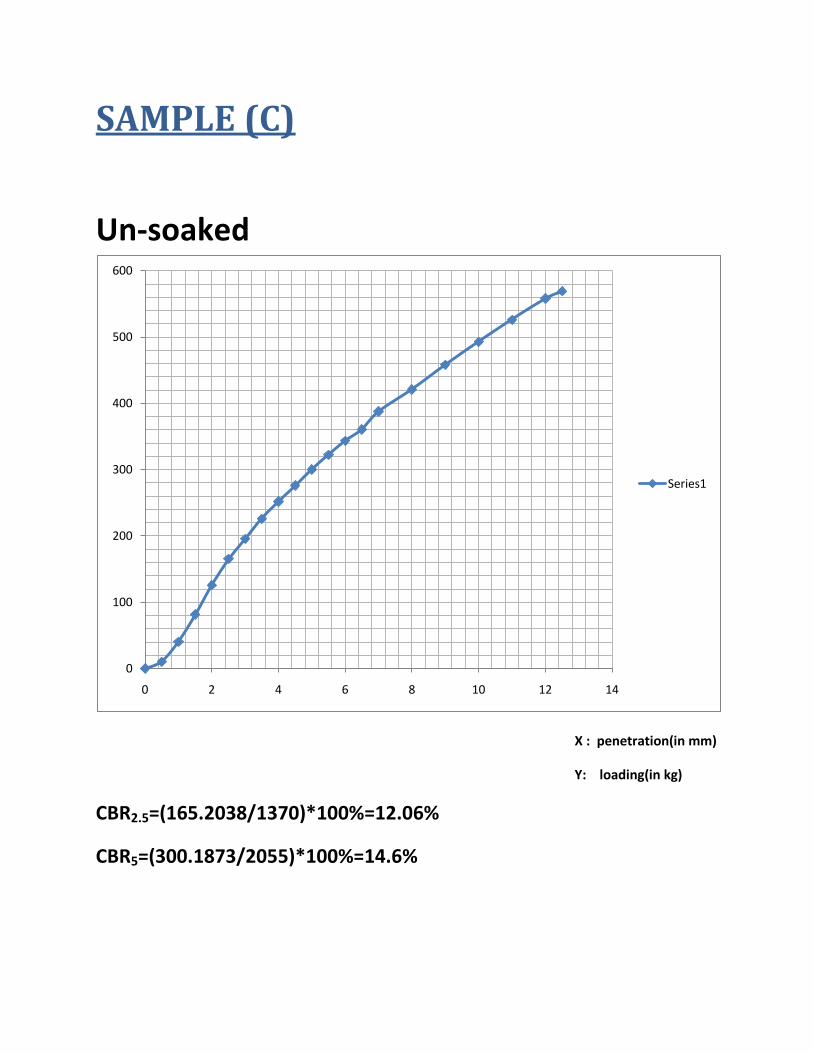
SAMPLE (C)
Un-soaked
X : penetration(in mm)
Y: loading(in kg)
CBR2.5=(165.2038/1370)*100%=12.06%
CBR5=(300.1873/2055)*100%=14.6%
0
100
200
300
400
500
600
0 2 4 6 8 10 12 14
Series1
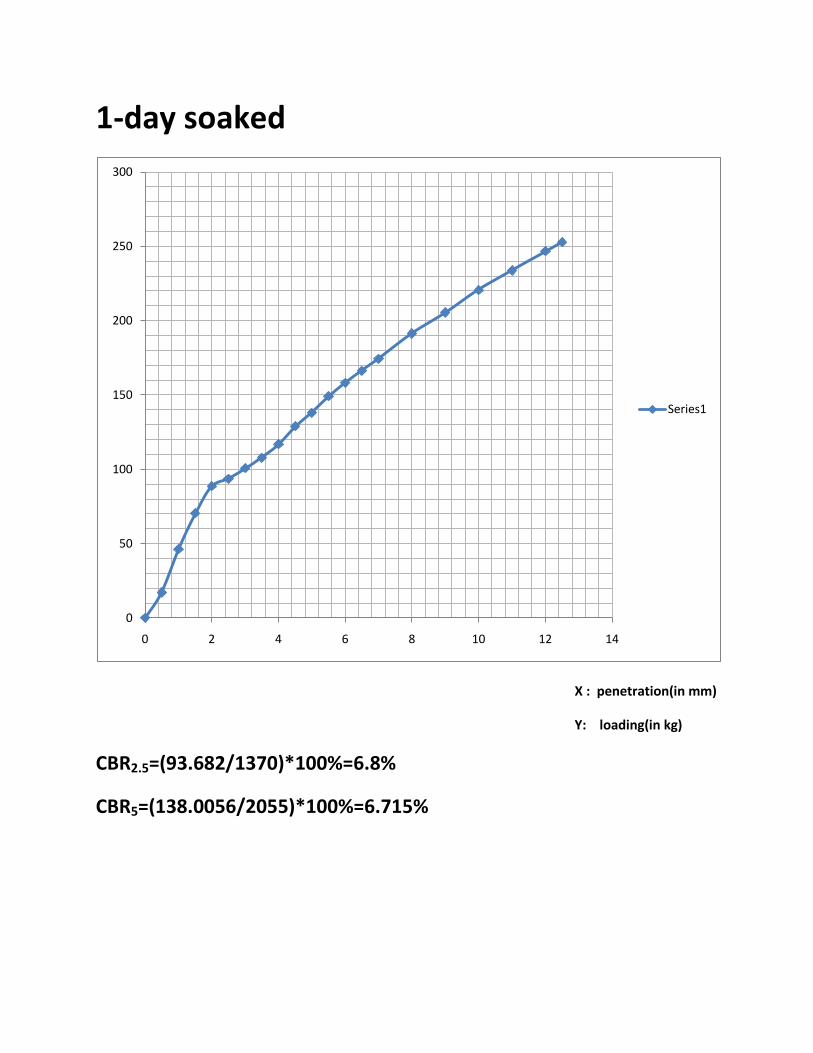
1-day soaked
X : penetration(in mm)
Y: loading(in kg)
CBR2.5=(93.682/1370)*100%=6.8%
CBR5=(138.0056/2055)*100%=6.715%
0
50
100
150
200
250
300
0 2 4 6 8 10 12 14
Series1
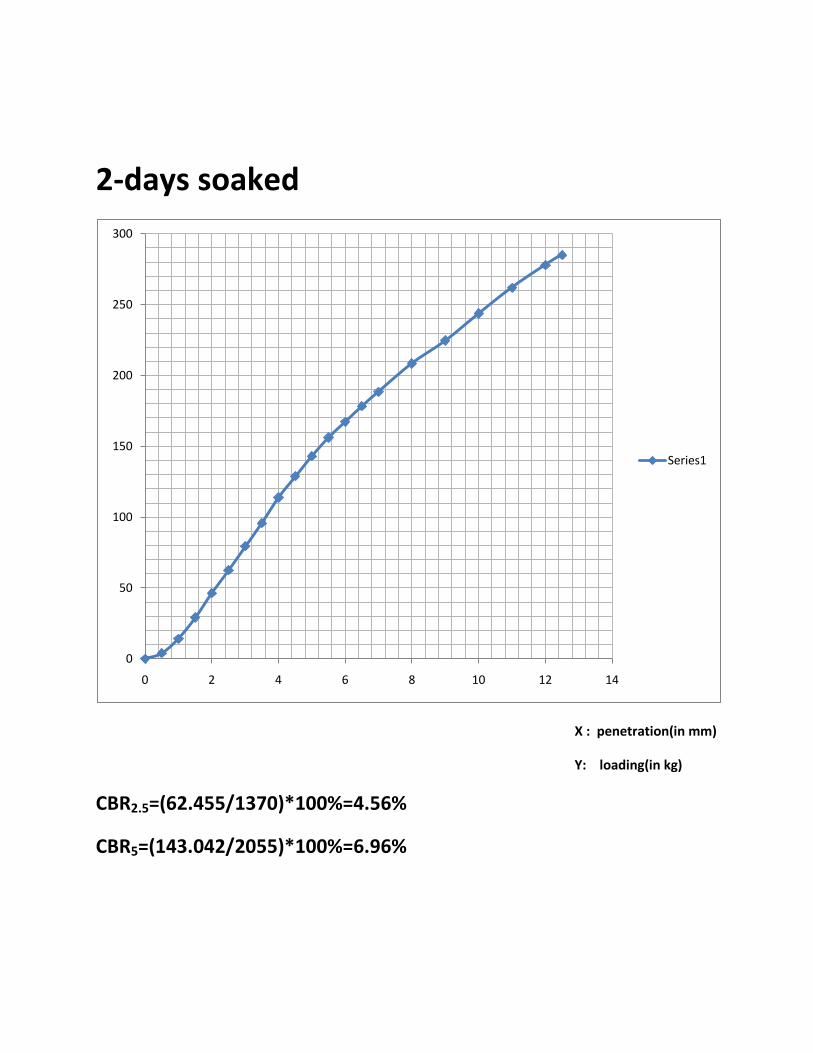
2-days soaked
X : penetration(in mm)
Y: loading(in kg)
CBR2.5=(62.455/1370)*100%=4.56%
CBR5=(143.042/2055)*100%=6.96%
0
50
100
150
200
250
300
0 2 4 6 8 10 12 14
Series1
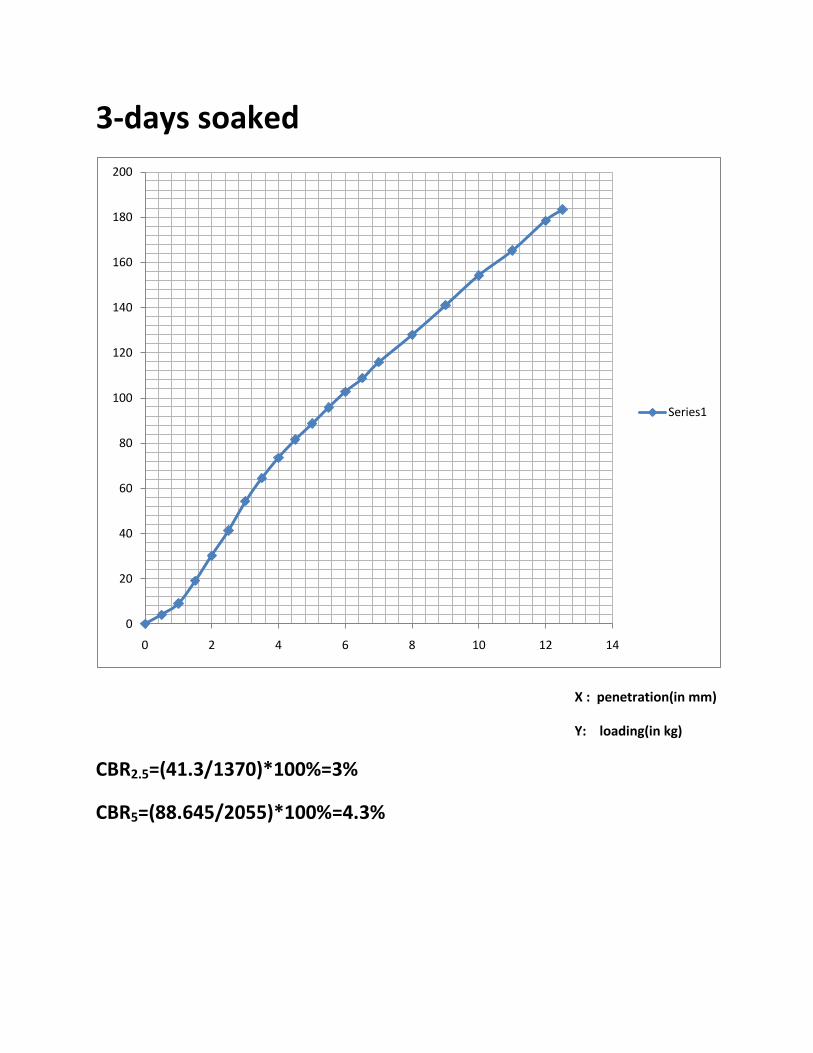
3-days soaked
X : penetration(in mm)
Y: loading(in kg)
CBR2.5=(41.3/1370)*100%=3%
CBR5=(88.645/2055)*100%=4.3%
0
20
40
60
80
100
120
140
160
180
200
0 2 4 6 8 10 12 14
Series1
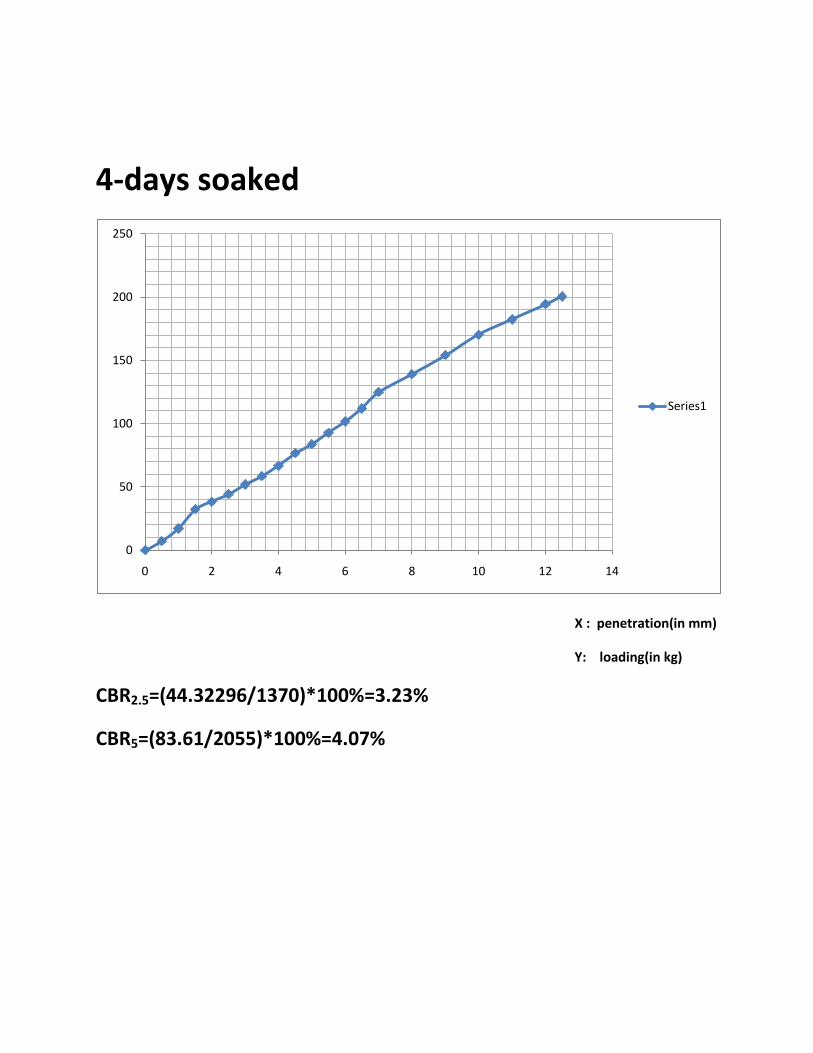
4-days soaked
X : penetration(in mm)
Y: loading(in kg)
CBR2.5=(44.32296/1370)*100%=3.23%
CBR5=(83.61/2055)*100%=4.07%
0
50
100
150
200
250
0 2 4 6 8 10 12 14
Series1
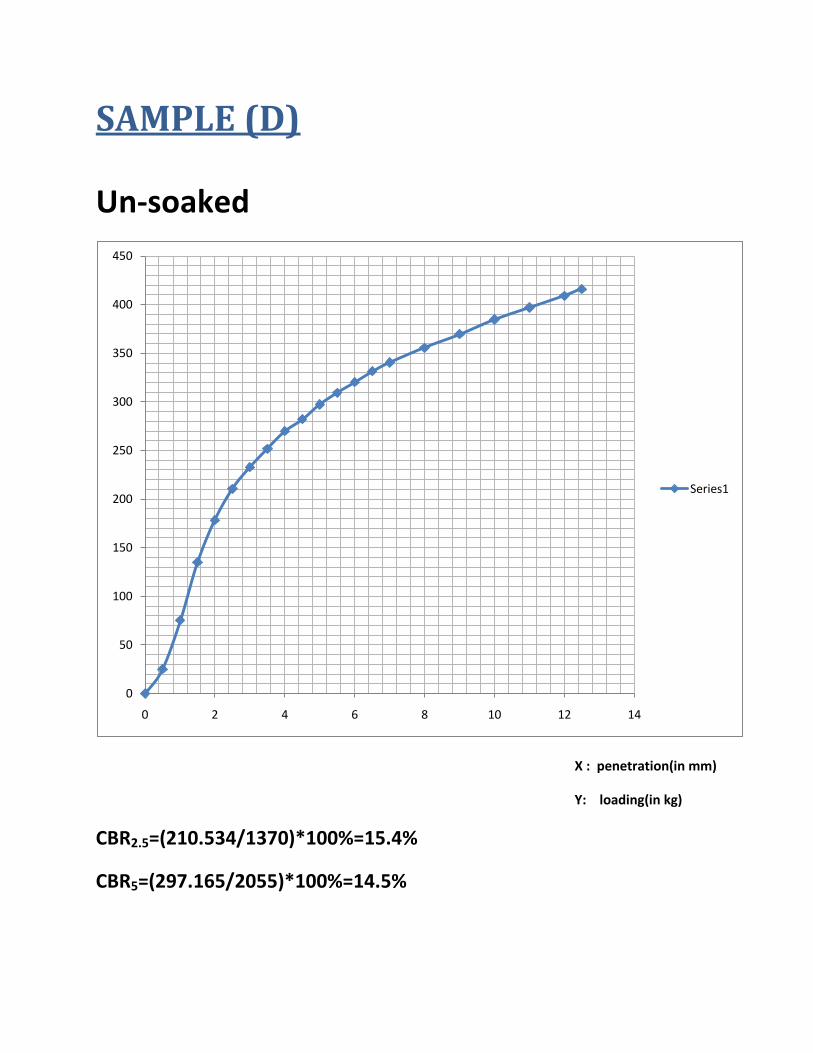
SAMPLE (D)
Un-soaked
X : penetration(in mm)
Y: loading(in kg)
CBR2.5=(210.534/1370)*100%=15.4%
CBR5=(297.165/2055)*100%=14.5%
0
50
100
150
200
250
300
350
400
450
0 2 4 6 8 10 12 14
Series1
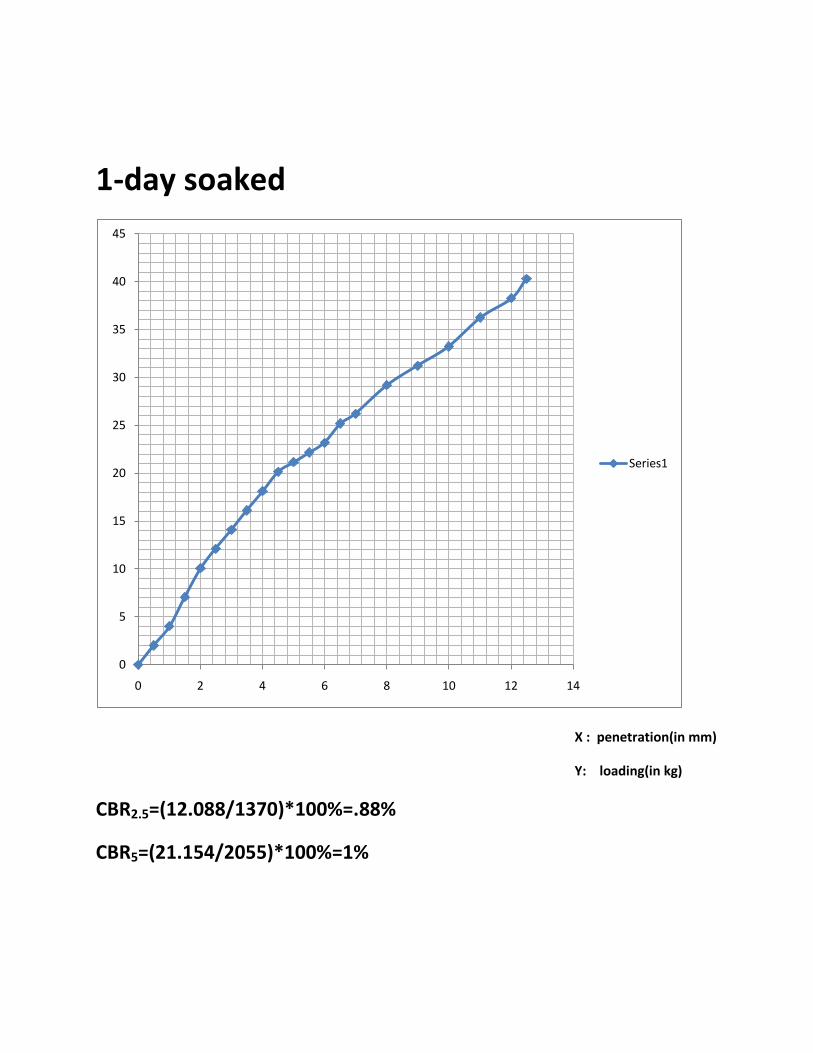
1-day soaked
X : penetration(in mm)
Y: loading(in kg)
CBR2.5=(12.088/1370)*100%=.88%
CBR5=(21.154/2055)*100%=1%
0
5
10
15
20
25
30
35
40
45
0 2 4 6 8 10 12 14
Series1
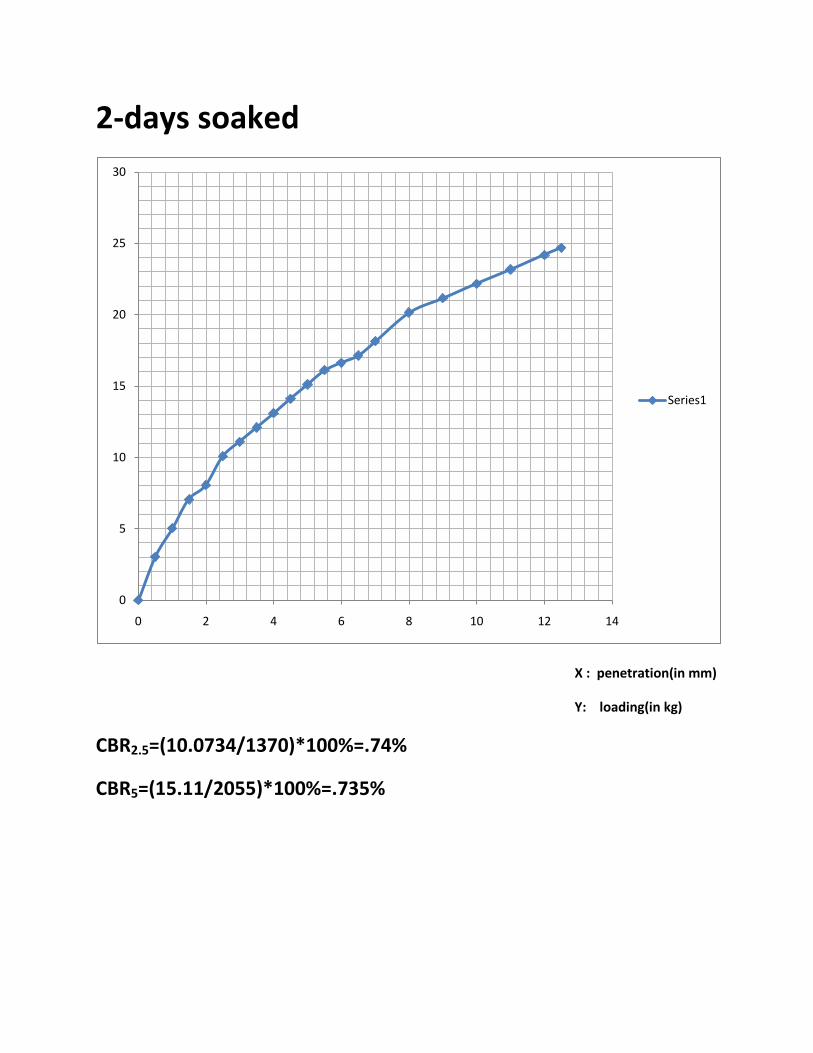
2-days soaked
X : penetration(in mm)
Y: loading(in kg)
CBR2.5=(10.0734/1370)*100%=.74%
CBR5=(15.11/2055)*100%=.735%
0
5
10
15
20
25
30
0 2 4 6 8 10 12 14
Series1
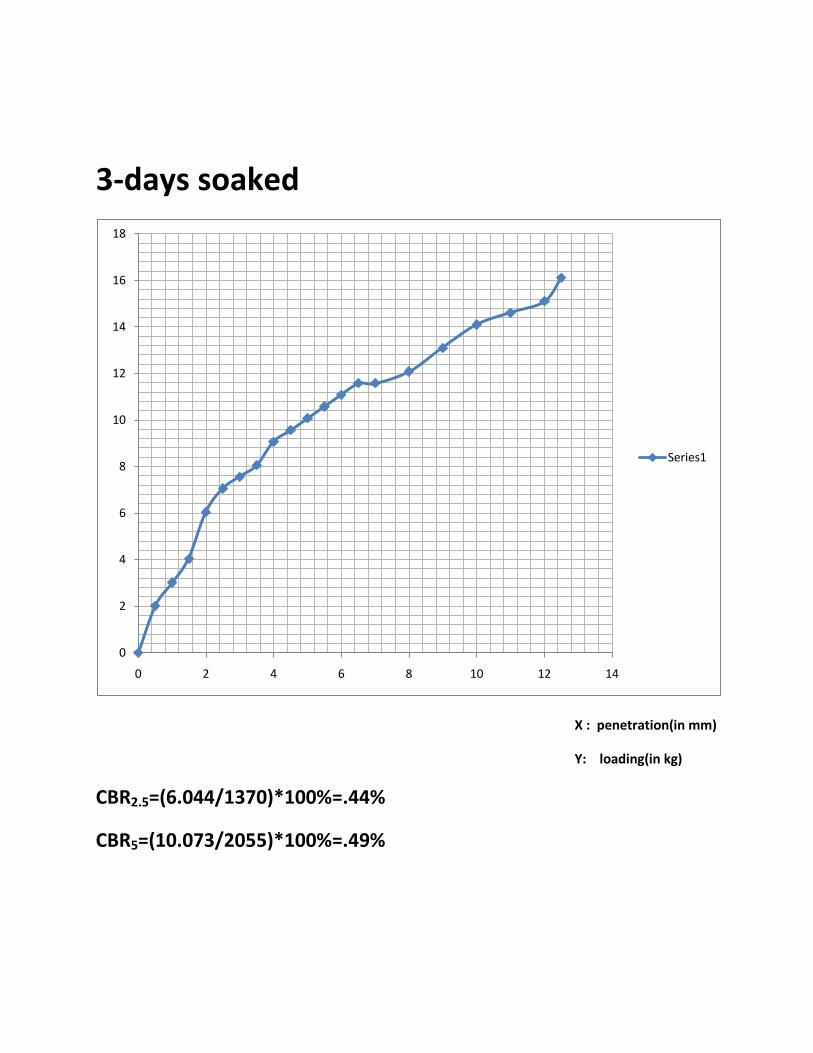
3-days soaked
X : penetration(in mm)
Y: loading(in kg)
CBR2.5=(6.044/1370)*100%=.44%
CBR5=(10.073/2055)*100%=.49%
0
2
4
6
8
10
12
14
16
18
0 2 4 6 8 10 12 14
Series1
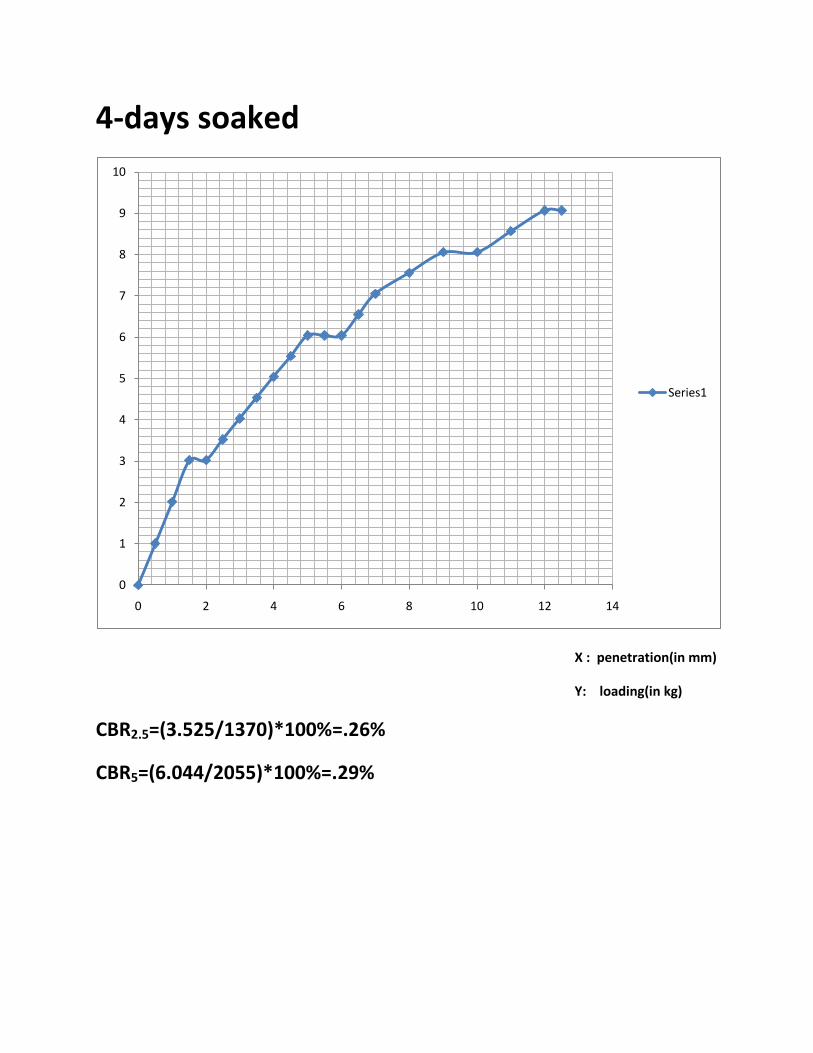
4-days soaked
X : penetration(in mm)
Y: loading(in kg)
CBR2.5=(3.525/1370)*100%=.26%
CBR5=(6.044/2055)*100%=.29%
0
1
2
3
4
5
6
7
8
9
10
0 2 4 6 8 10 12 14
Series1
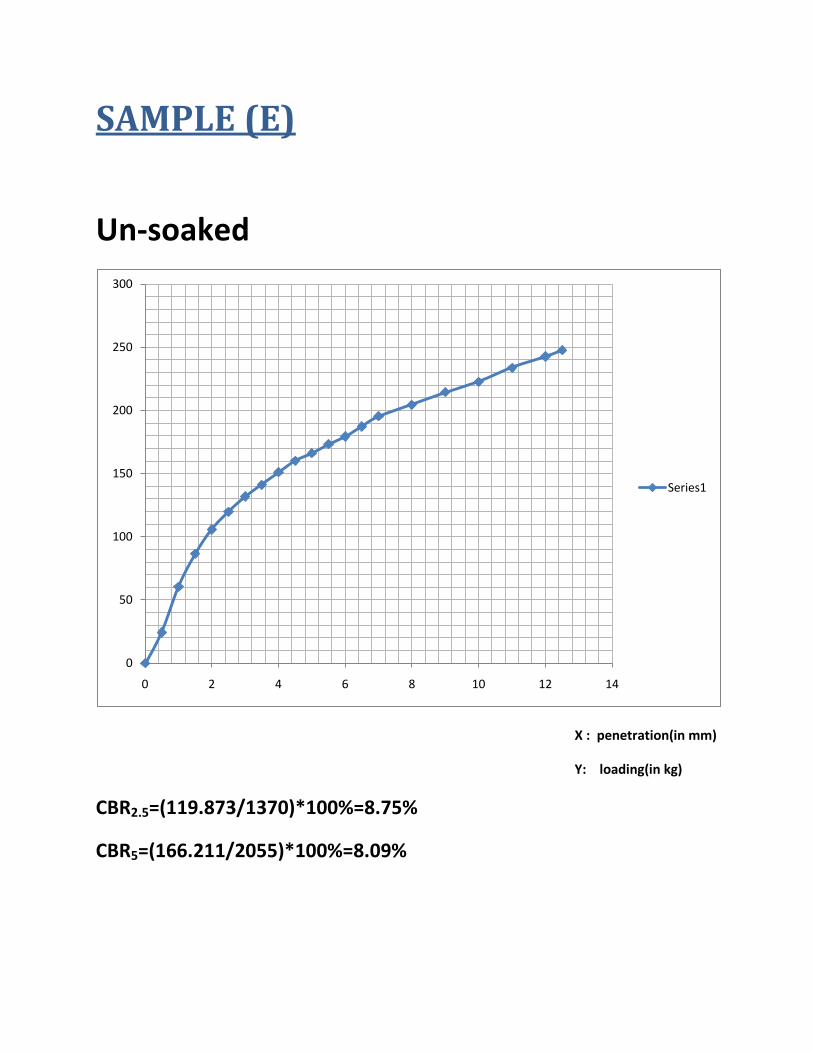
SAMPLE (E)
Un-soaked
X : penetration(in mm)
Y: loading(in kg)
CBR2.5=(119.873/1370)*100%=8.75%
CBR5=(166.211/2055)*100%=8.09%
0
50
100
150
200
250
300
0 2 4 6 8 10 12 14
Series1
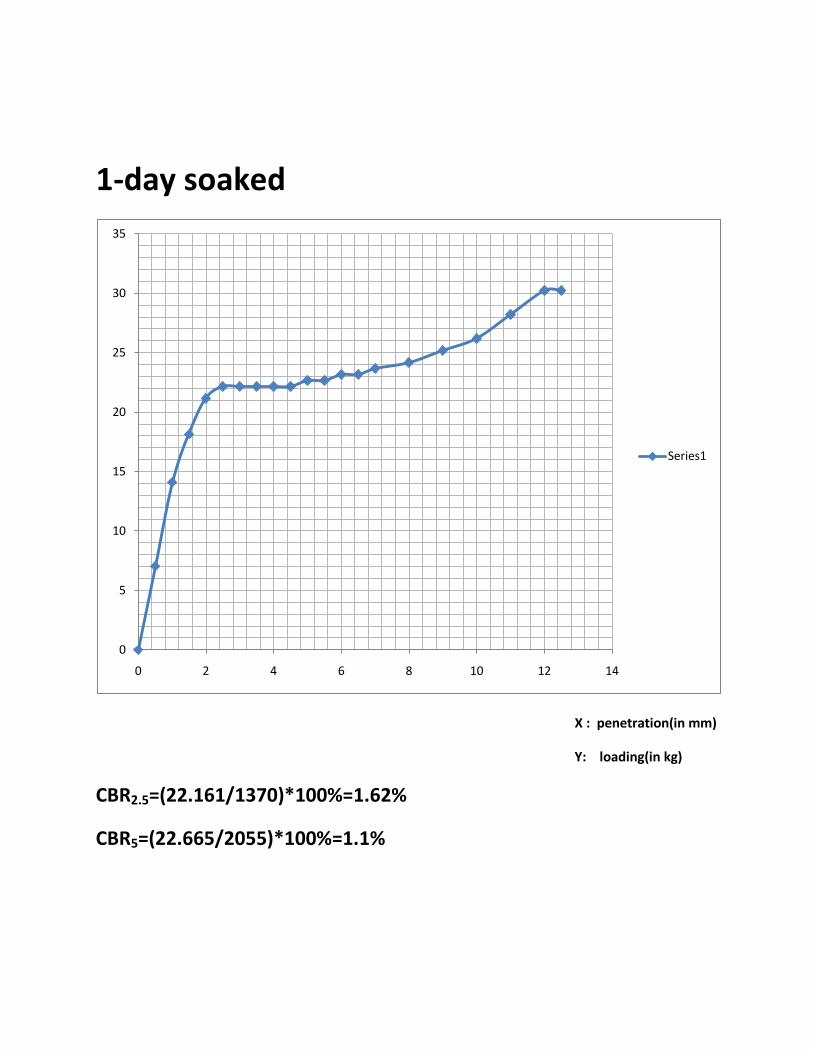
1-day soaked
X : penetration(in mm)
Y: loading(in kg)
CBR2.5=(22.161/1370)*100%=1.62%
CBR5=(22.665/2055)*100%=1.1%
0
5
10
15
20
25
30
35
0 2 4 6 8 10 12 14
Series1
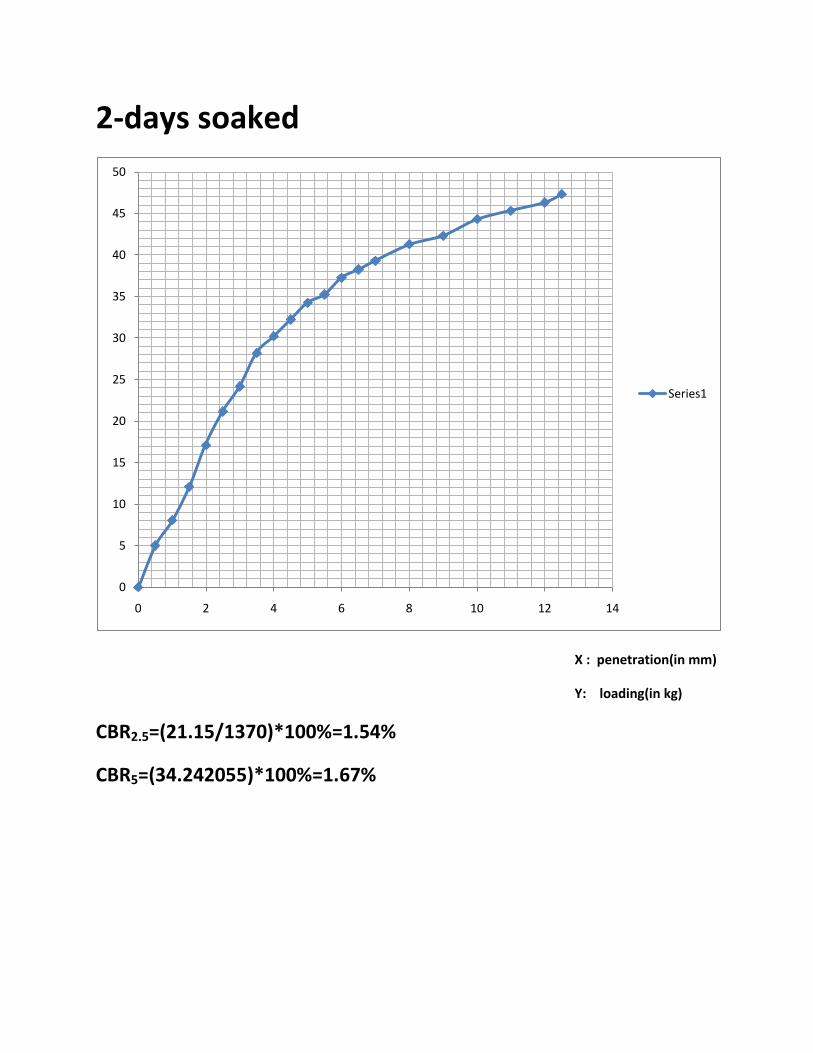
2-days soaked
X : penetration(in mm)
Y: loading(in kg)
CBR2.5=(21.15/1370)*100%=1.54%
CBR5=(34.242055)*100%=1.67%
0
5
10
15
20
25
30
35
40
45
50
0 2 4 6 8 10 12 14
Series1
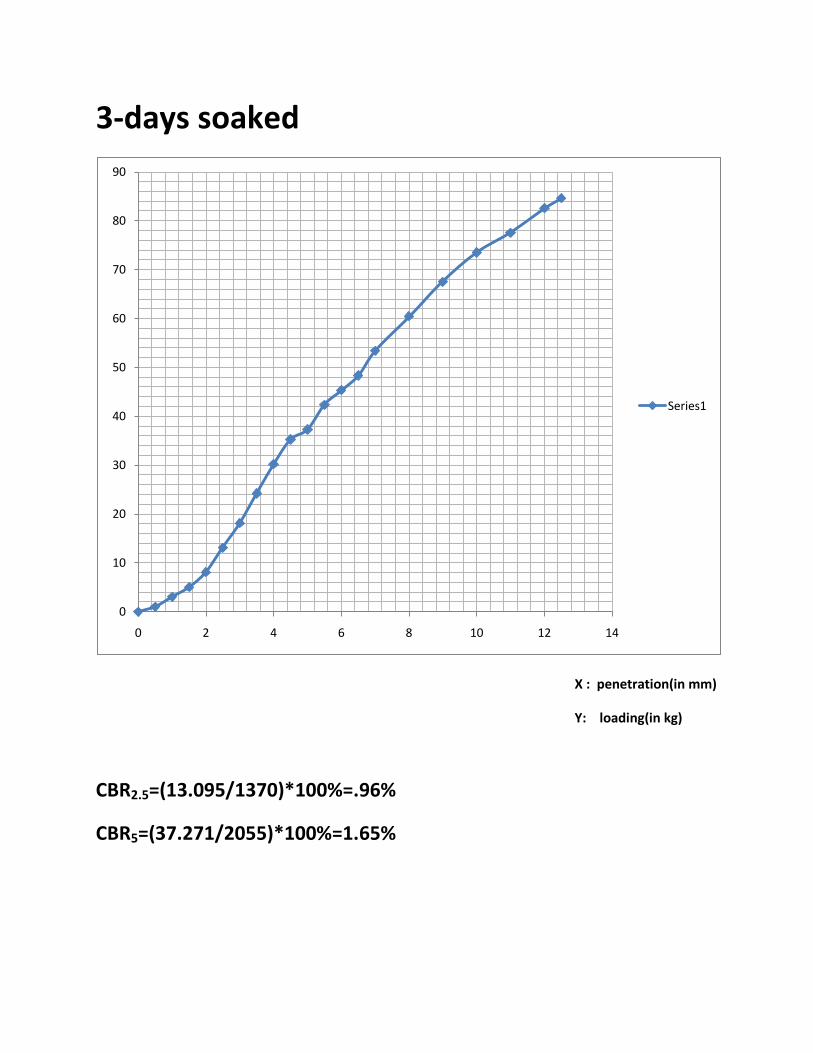
3-days soaked
X : penetration(in mm)
Y: loading(in kg)
CBR2.5=(13.095/1370)*100%=.96%
CBR5=(37.271/2055)*100%=1.65%
0
10
20
30
40
50
60
70
80
90
0 2 4 6 8 10 12 14
Series1
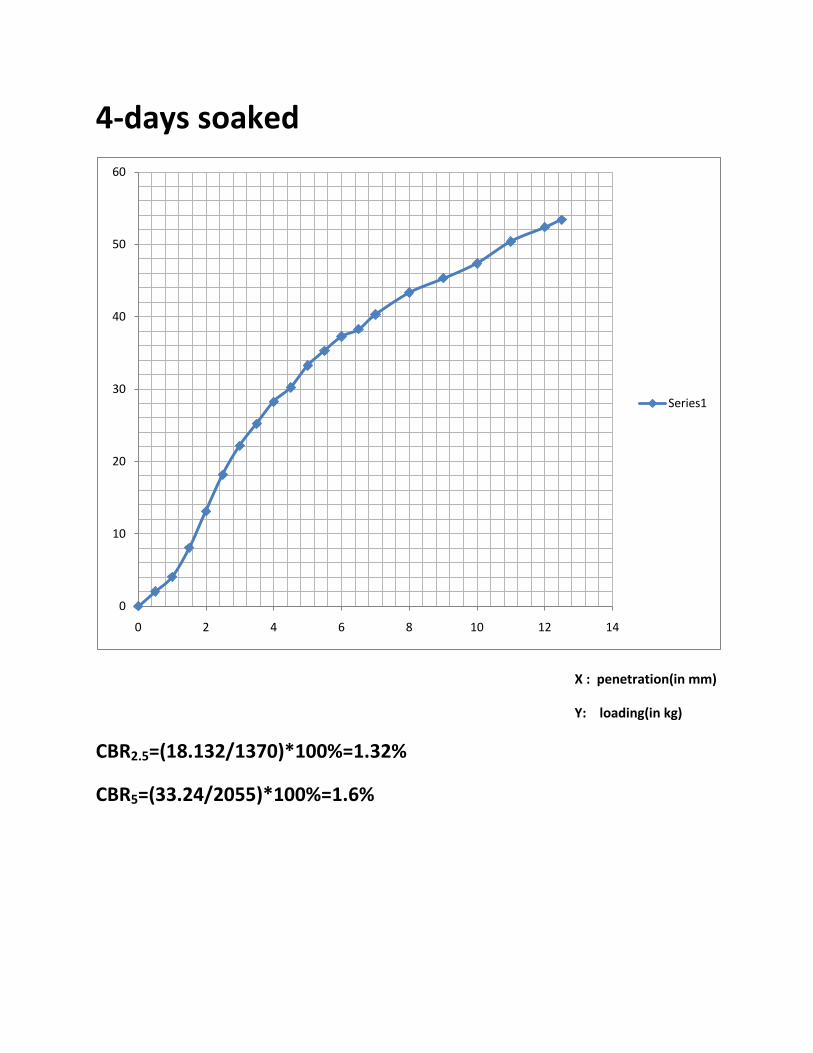
4-days soaked
X : penetration(in mm)
Y: loading(in kg)
CBR2.5=(18.132/1370)*100%=1.32%
CBR5=(33.24/2055)*100%=1.6%
0
10
20
30
40
50
60
0 2 4 6 8 10 12 14
Series1
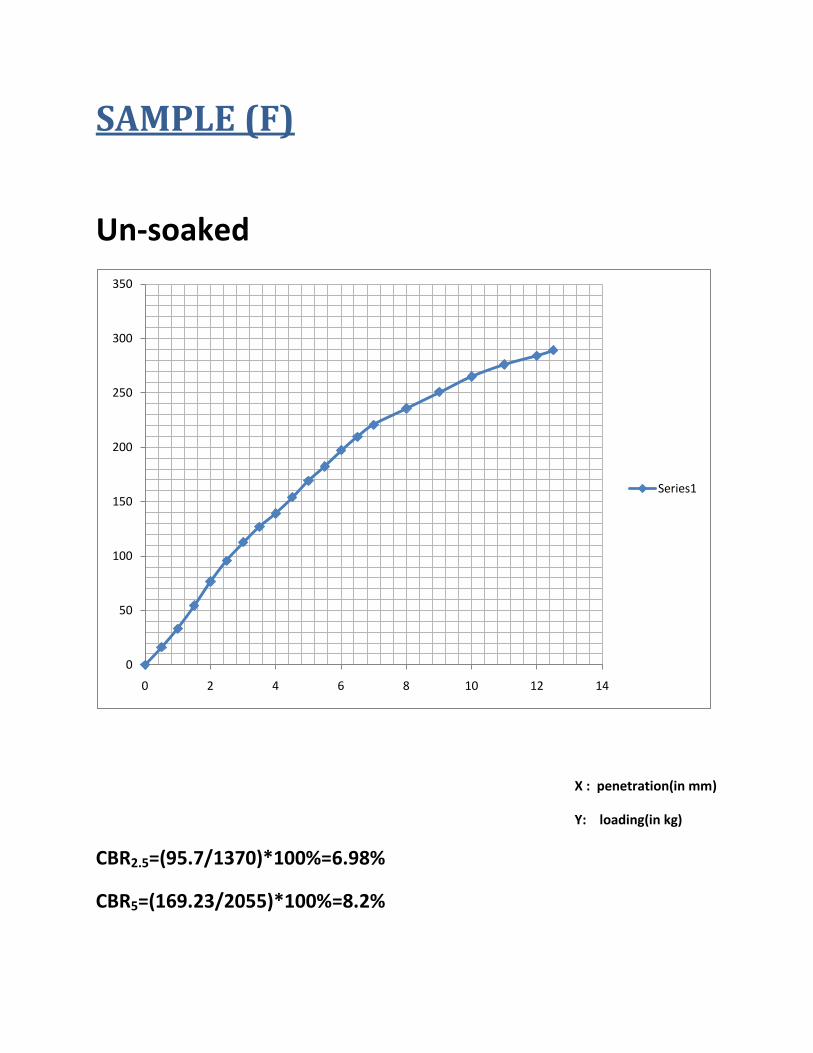
SAMPLE (F)
Un-soaked
X : penetration(in mm)
Y: loading(in kg)
CBR2.5=(95.7/1370)*100%=6.98%
CBR5=(169.23/2055)*100%=8.2%
0
50
100
150
200
250
300
350
0 2 4 6 8 10 12 14
Series1
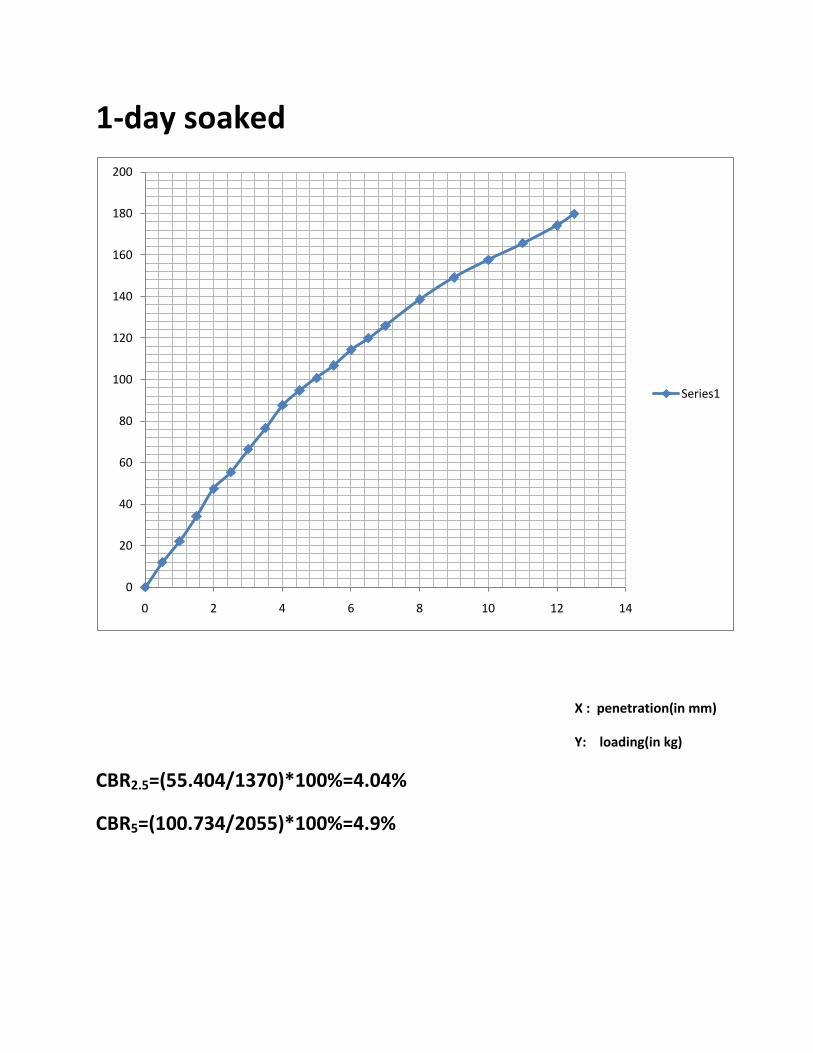
1-day soaked
X : penetration(in mm)
Y: loading(in kg)
CBR2.5=(55.404/1370)*100%=4.04%
CBR5=(100.734/2055)*100%=4.9%
0
20
40
60
80
100
120
140
160
180
200
0 2 4 6 8 10 12 14
Series1
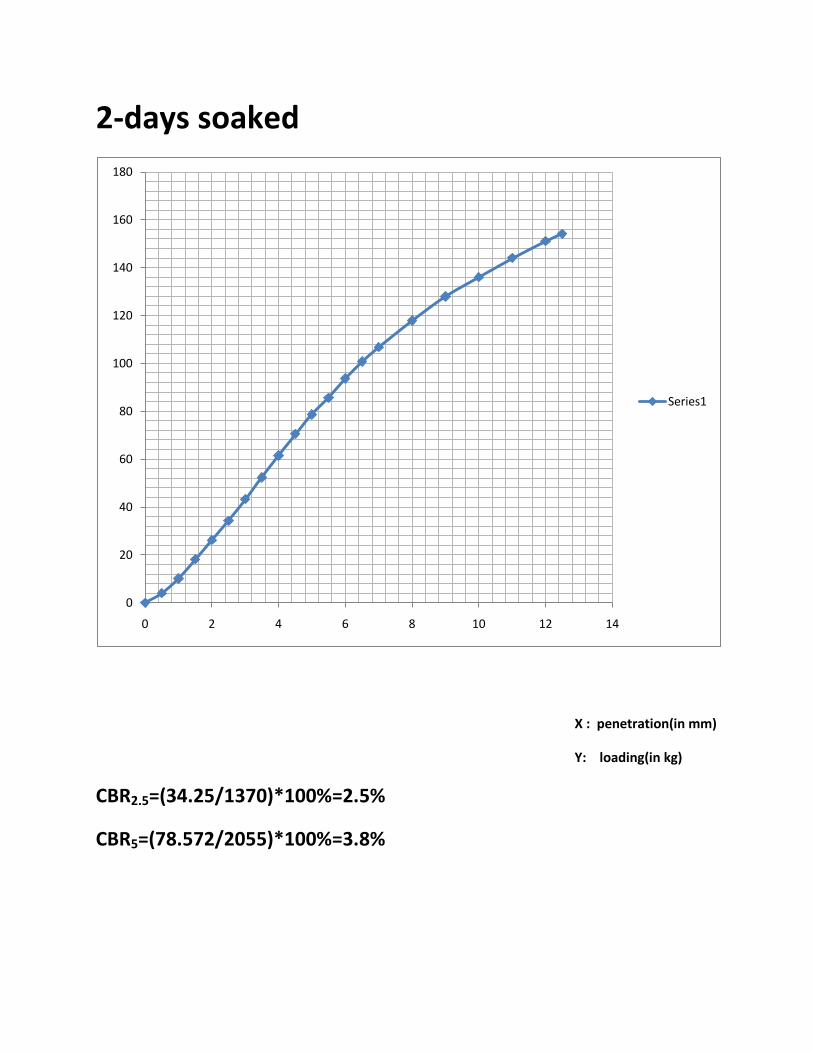
2-days soaked
X : penetration(in mm)
Y: loading(in kg)
CBR2.5=(34.25/1370)*100%=2.5%
CBR5=(78.572/2055)*100%=3.8%
0
20
40
60
80
100
120
140
160
180
0 2 4 6 8 10 12 14
Series1
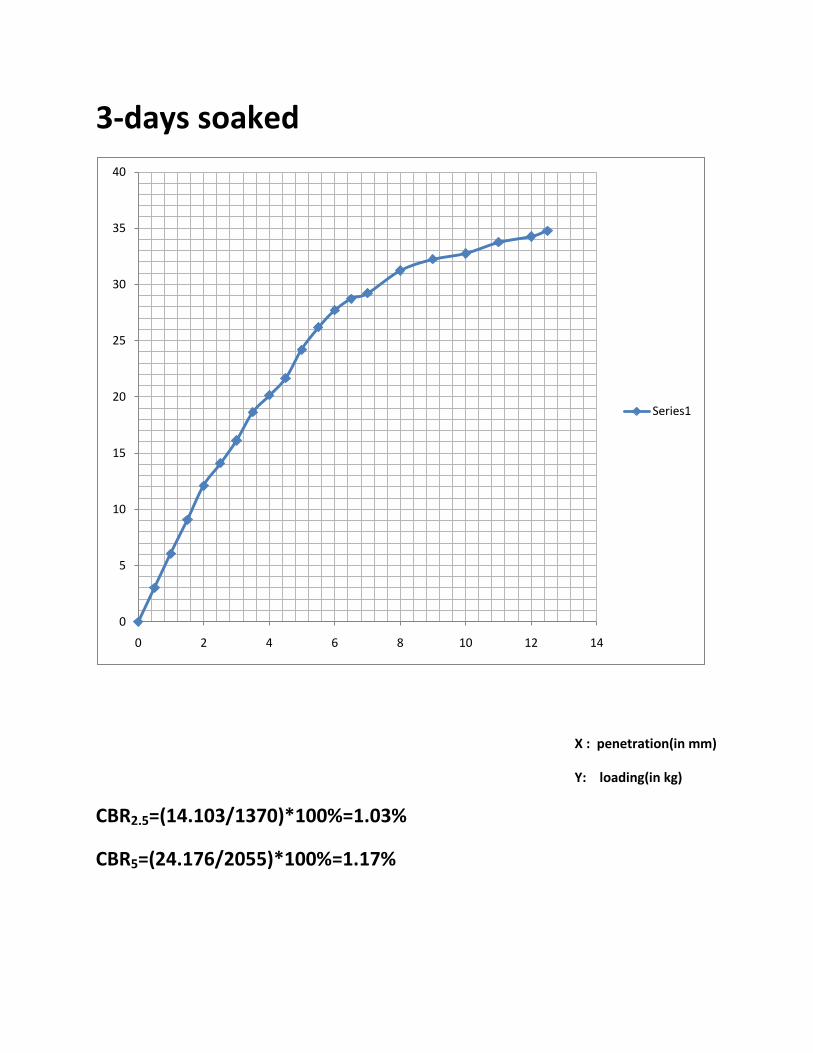
3-days soaked
X : penetration(in mm)
Y: loading(in kg)
CBR2.5=(14.103/1370)*100%=1.03%
CBR5=(24.176/2055)*100%=1.17%
0
5
10
15
20
25
30
35
40
0 2 4 6 8 10 12 14
Series1
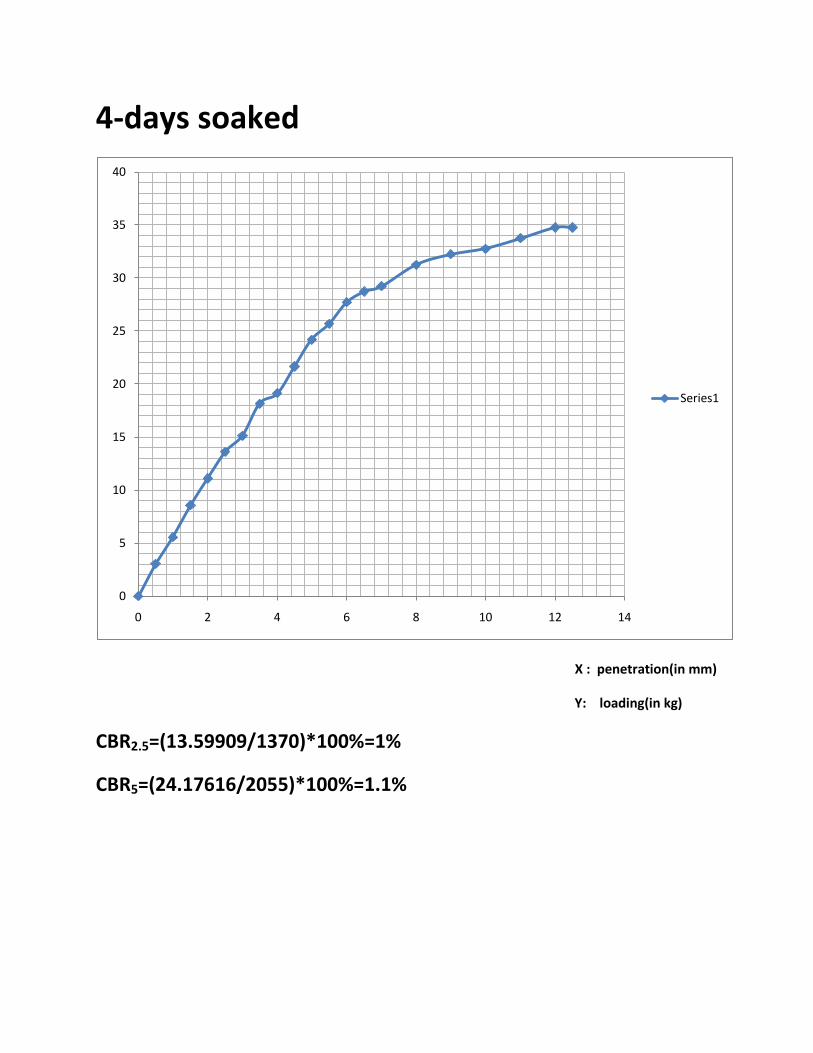
4-days soaked
X : penetration(in mm)
Y: loading(in kg)
CBR2.5=(13.59909/1370)*100%=1%
CBR5=(24.17616/2055)*100%=1.1%
0
5
10
15
20
25
30
35
40
0 2 4 6 8 10 12 14
Series1
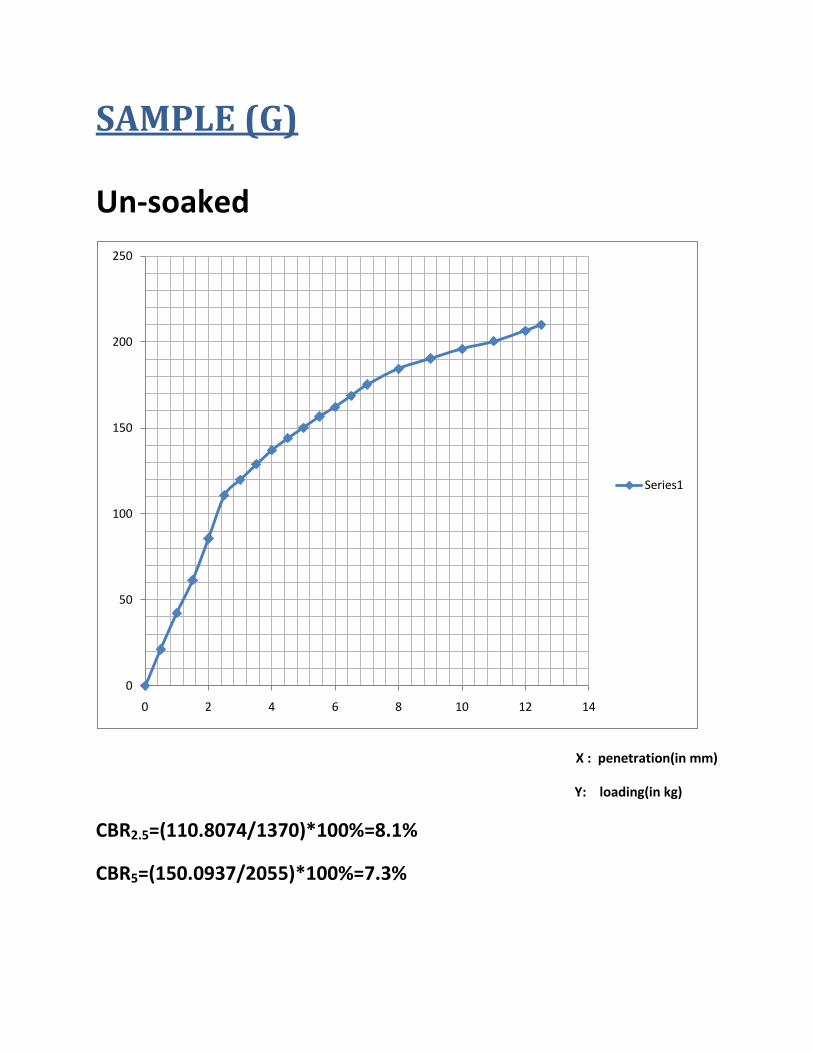
SAMPLE (G)
Un-soaked
X : penetration(in mm)
Y: loading(in kg)
CBR2.5=(110.8074/1370)*100%=8.1%
CBR5=(150.0937/2055)*100%=7.3%
0
50
100
150
200
250
0 2 4 6 8 10 12 14
Series1
1-day soaked
X : penetration(in mm)
Y: loading(in kg)
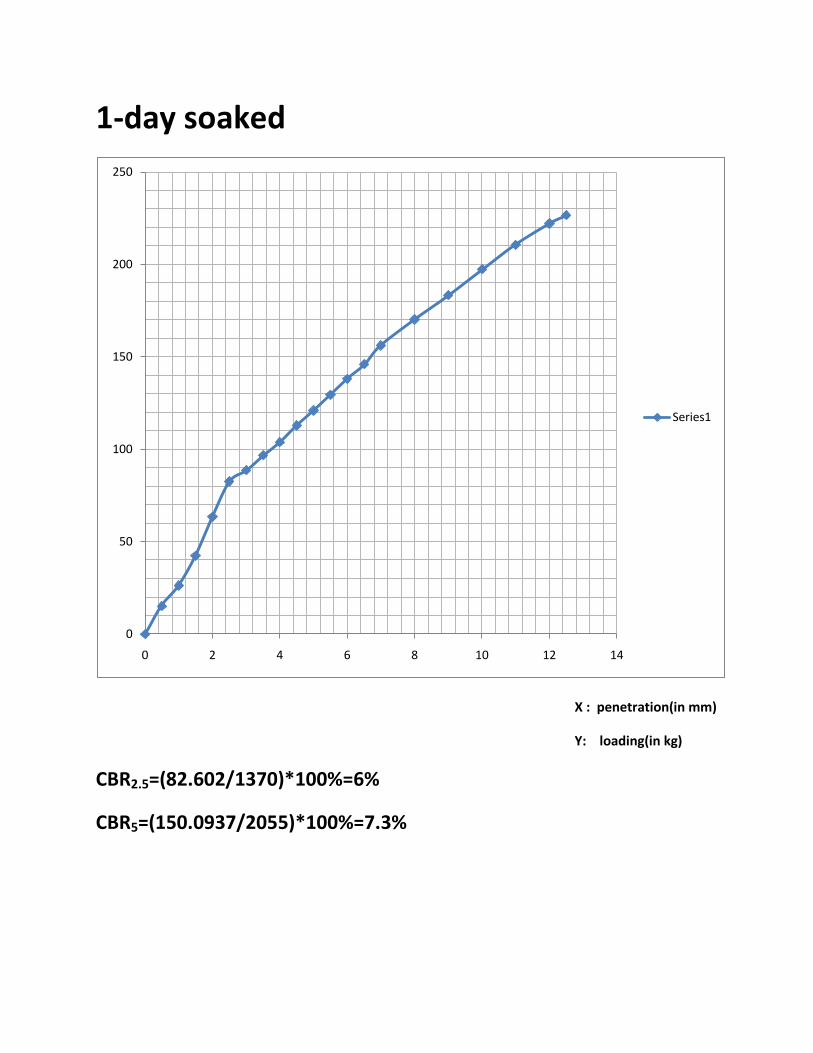
CBR2.5=(82.602/1370)*100%=6%
CBR5=(150.0937/2055)*100%=7.3%
0
50
100
150
200
250
0 2 4 6 8 10 12 14
Series1

2-days soaked
X : penetration(in mm)
Y: loading(in kg)
CBR2.5=(57.418/1370)*100%=4.2%
CBR5=(83.609/2055)*100%=4.07%
0
20
40
60
80
100
120
140
160
180
0 2 4 6 8 10 12 14
Series1
3-days soaked
X : penetration(in mm)
Y: loading(in kg)
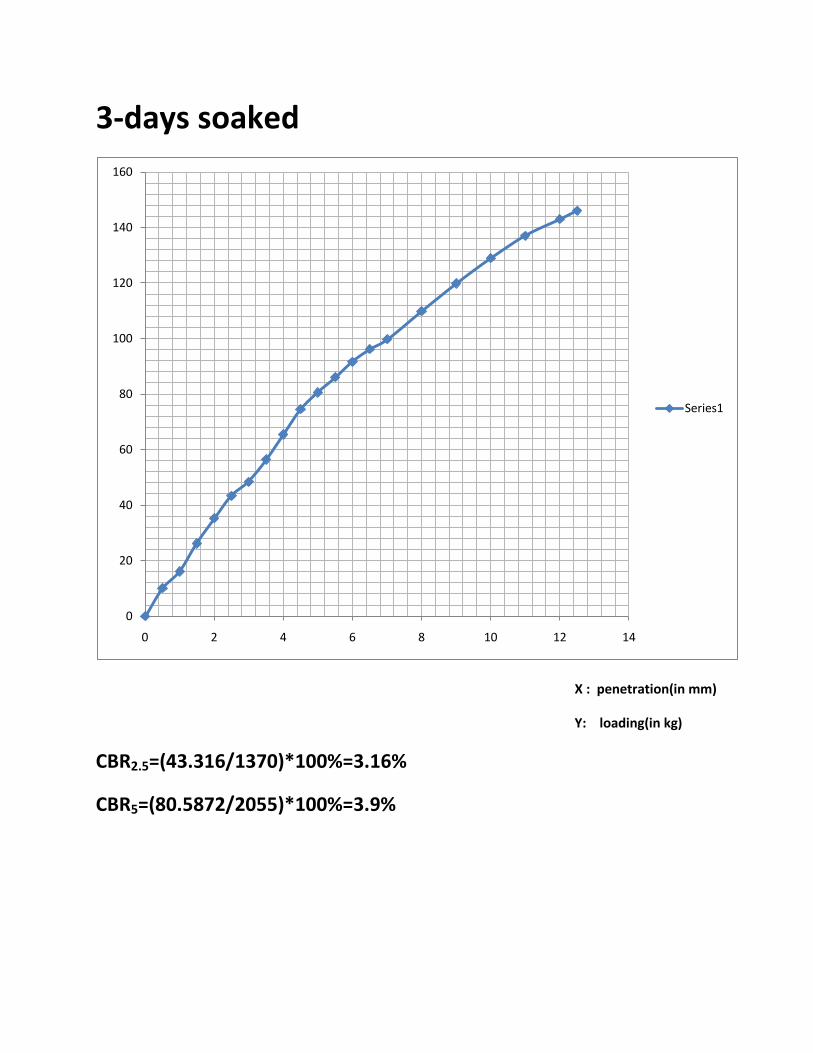
CBR2.5=(43.316/1370)*100%=3.16%
CBR5=(80.5872/2055)*100%=3.9%
0
20
40
60
80
100
120
140
160
0 2 4 6 8 10 12 14
Series1
4-days soaked
X : penetration(in mm)
Y: loading(in kg)
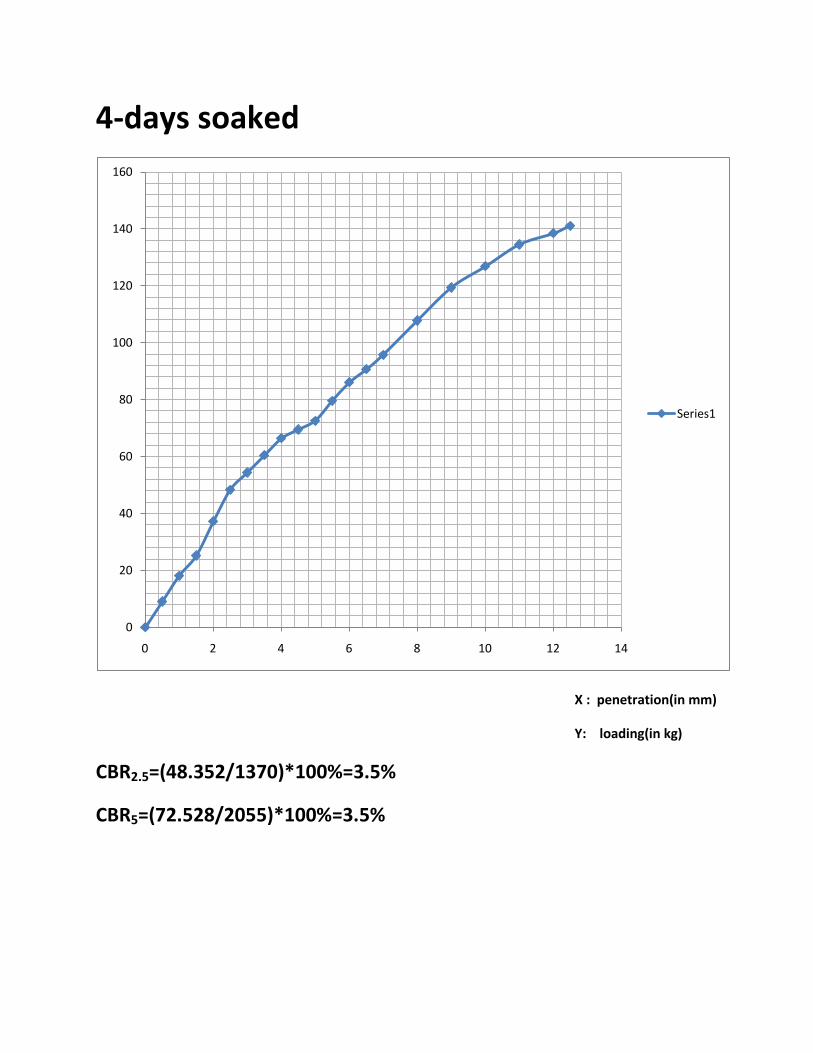
CBR2.5=(48.352/1370)*100%=3.5%
CBR5=(72.528/2055)*100%=3.5%
0
20
40
60
80
100
120
140
160
0 2 4 6 8 10 12 14
Series1
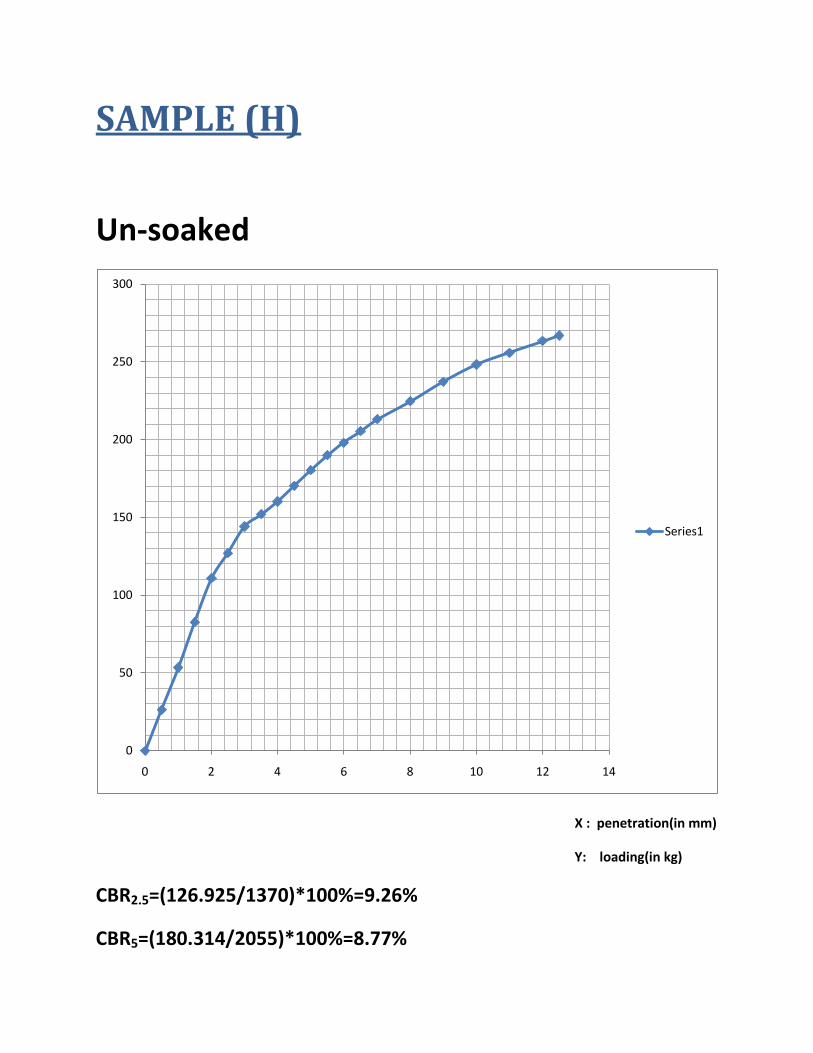
SAMPLE (H)
Un-soaked
X : penetration(in mm)
Y: loading(in kg)
CBR2.5=(126.925/1370)*100%=9.26%
CBR5=(180.314/2055)*100%=8.77%
0
50
100
150
200
250
300
0 2 4 6 8 10 12 14
Series1
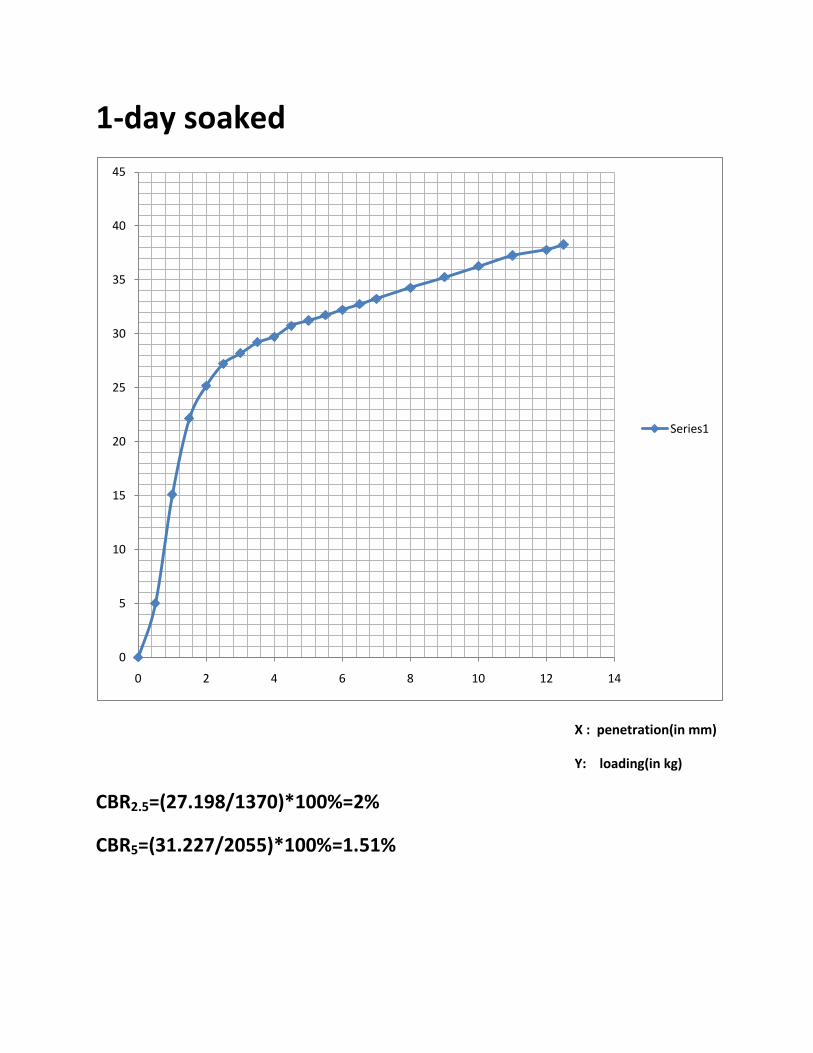
1-day soaked
X : penetration(in mm)
Y: loading(in kg)
CBR2.5=(27.198/1370)*100%=2%
CBR5=(31.227/2055)*100%=1.51%
0
5
10
15
20
25
30
35
40
45
0 2 4 6 8 10 12 14
Series1
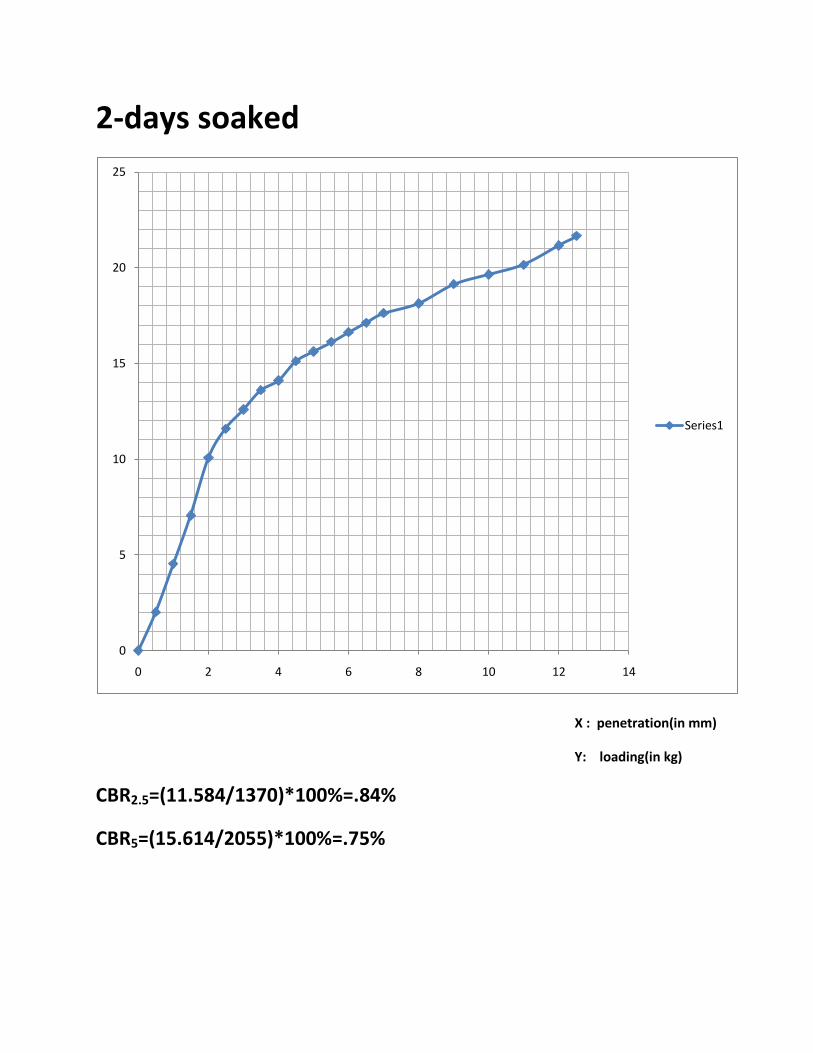
2-days soaked
X : penetration(in mm)
Y: loading(in kg)
CBR2.5=(11.584/1370)*100%=.84%
CBR5=(15.614/2055)*100%=.75%
0
5
10
15
20
25
0 2 4 6 8 10 12 14
Series1
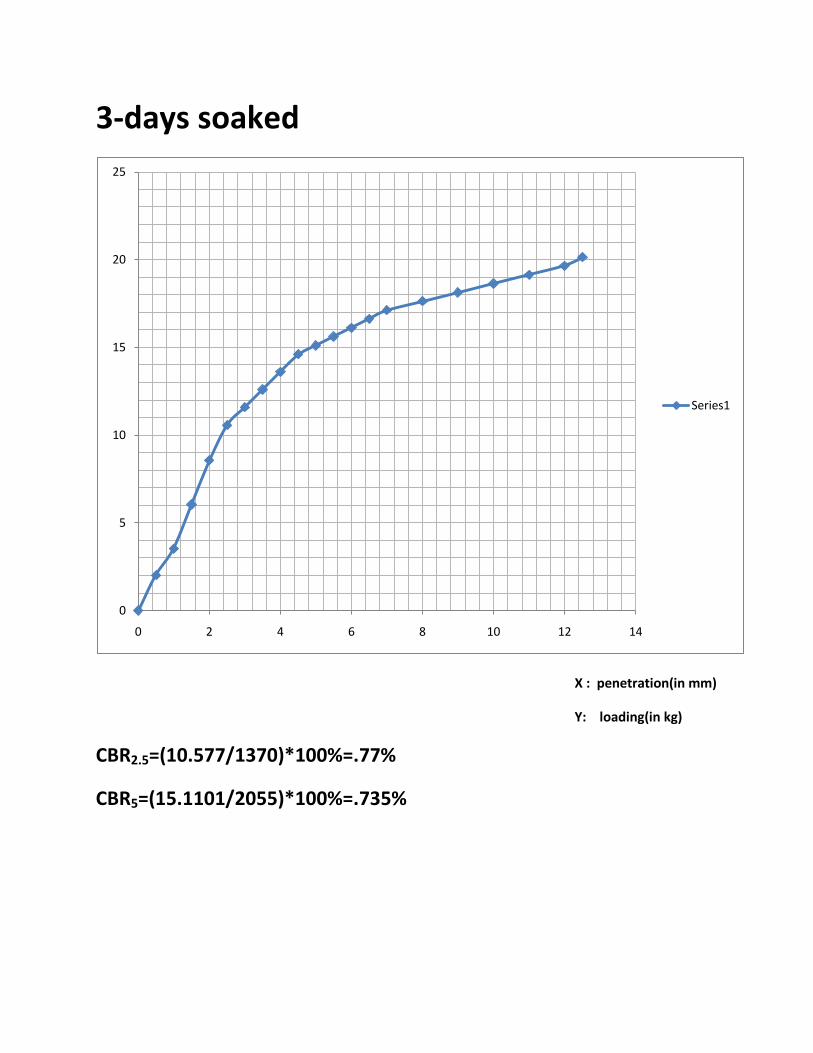
3-days soaked
X : penetration(in mm)
Y: loading(in kg)
CBR2.5=(10.577/1370)*100%=.77%
CBR5=(15.1101/2055)*100%=.735%
0
5
10
15
20
25
0 2 4 6 8 10 12 14
Series1
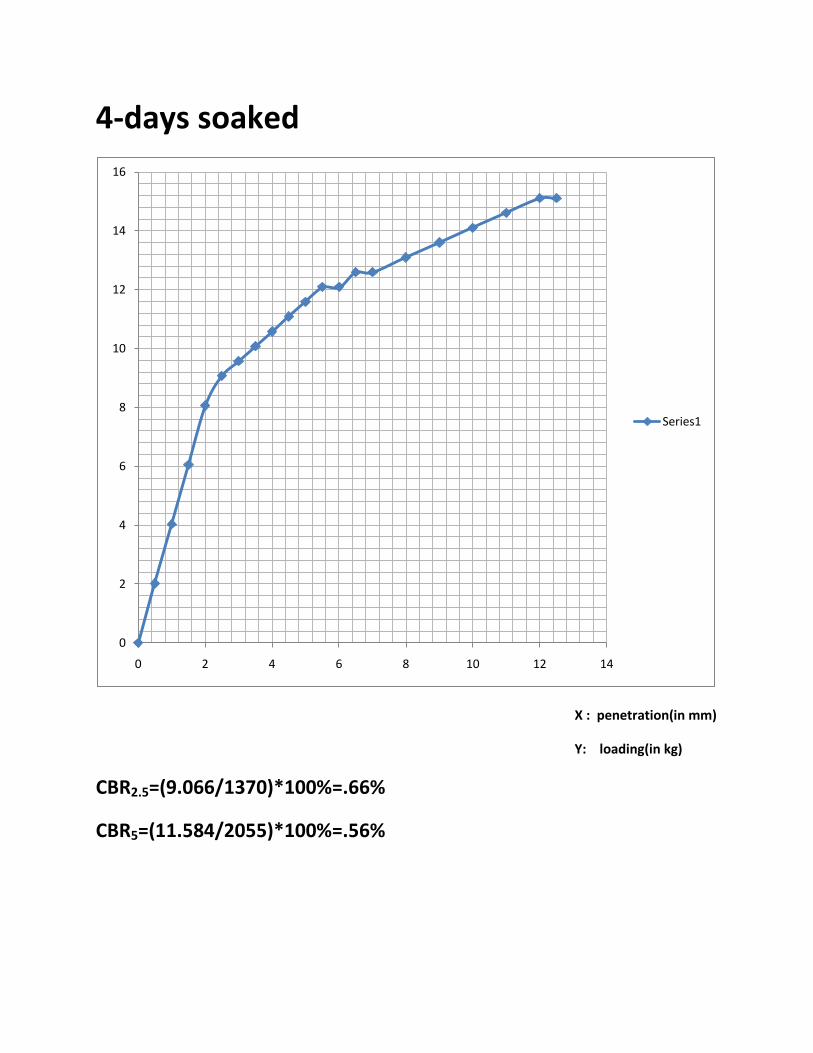
4-days soaked
X : penetration(in mm)
Y: loading(in kg)
CBR2.5=(9.066/1370)*100%=.66%
CBR5=(11.584/2055)*100%=.56%
0
2
4
6
8
10
12
14
16
0 2 4 6 8 10 12 14
Series1
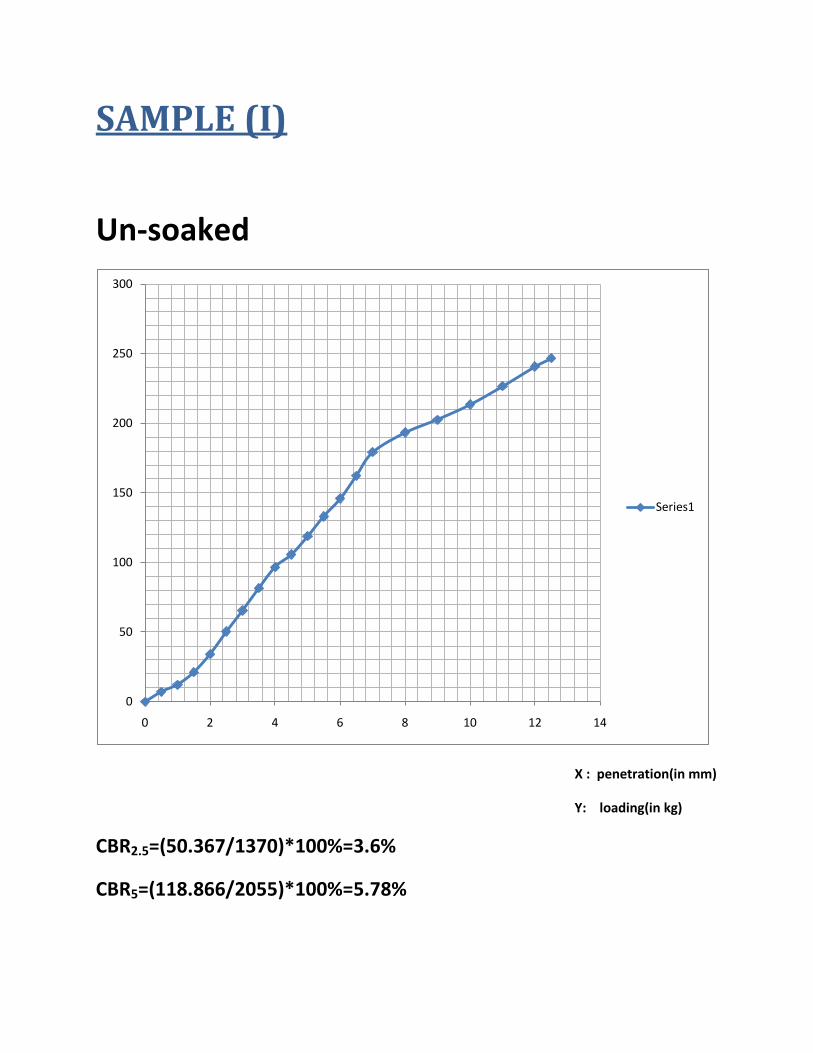
SAMPLE (I)
Un-soaked
X : penetration(in mm)
Y: loading(in kg)
CBR2.5=(50.367/1370)*100%=3.6%
CBR5=(118.866/2055)*100%=5.78%
0
50
100
150
200
250
300
0 2 4 6 8 10 12 14
Series1
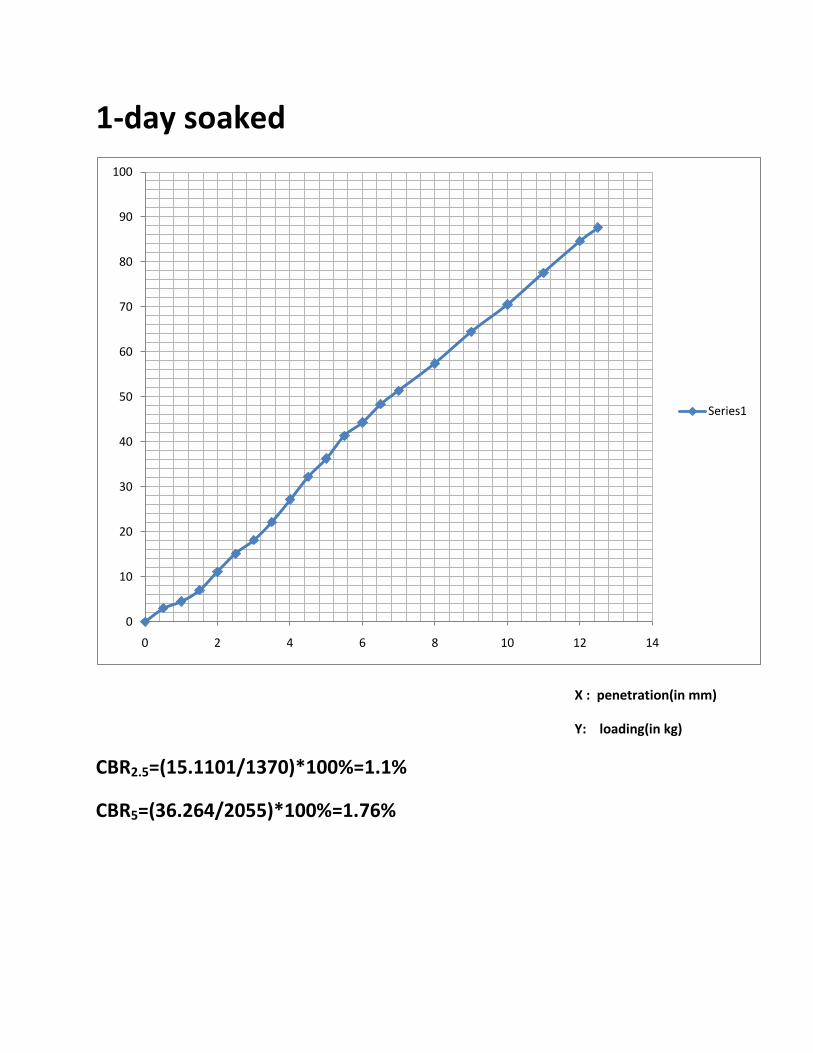
1-day soaked
X : penetration(in mm)
Y: loading(in kg)
CBR2.5=(15.1101/1370)*100%=1.1%
CBR5=(36.264/2055)*100%=1.76%
0
10
20
30
40
50
60
70
80
90
100
0 2 4 6 8 10 12 14
Series1
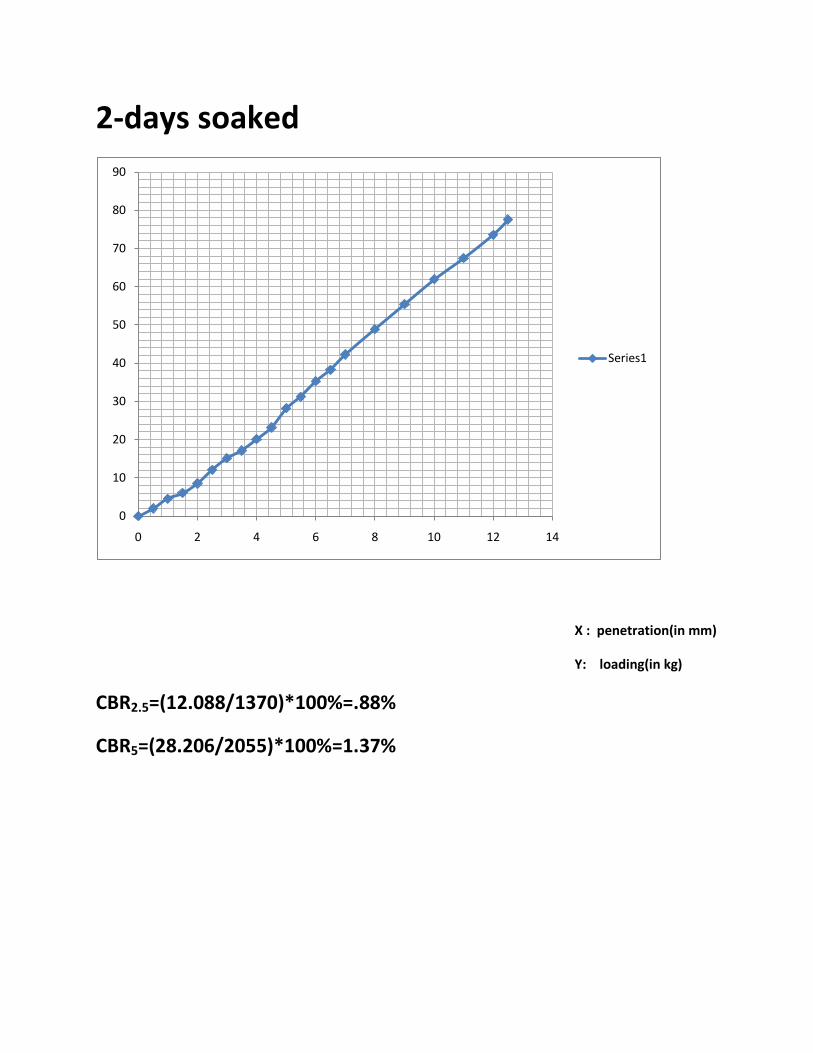
2-days soaked
X : penetration(in mm)
Y: loading(in kg)
CBR2.5=(12.088/1370)*100%=.88%
CBR5=(28.206/2055)*100%=1.37%
0
10
20
30
40
50
60
70
80
90
0 2 4 6 8 10 12 14
Series1
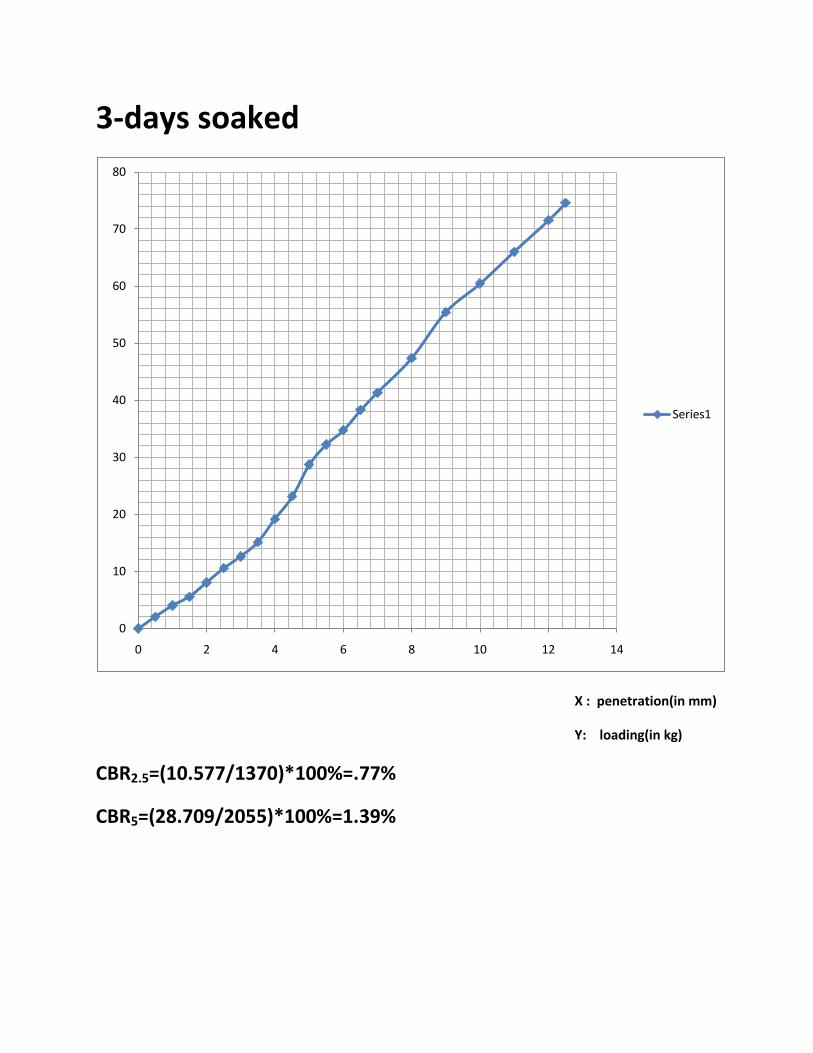
3-days soaked
X : penetration(in mm)
Y: loading(in kg)
CBR2.5=(10.577/1370)*100%=.77%
CBR5=(28.709/2055)*100%=1.39%
0
10
20
30
40
50
60
70
80
0 2 4 6 8 10 12 14
Series1
4-days soaked
X : penetration(in mm)
Y: loading(in kg)
CBR2.5=(9.57/1370)*100%=.7%
CBR5=(22.161/2055)*100%=1%
0
10
20
30
40
50
60
70
0 2 4 6 8 10 12 14
Series1
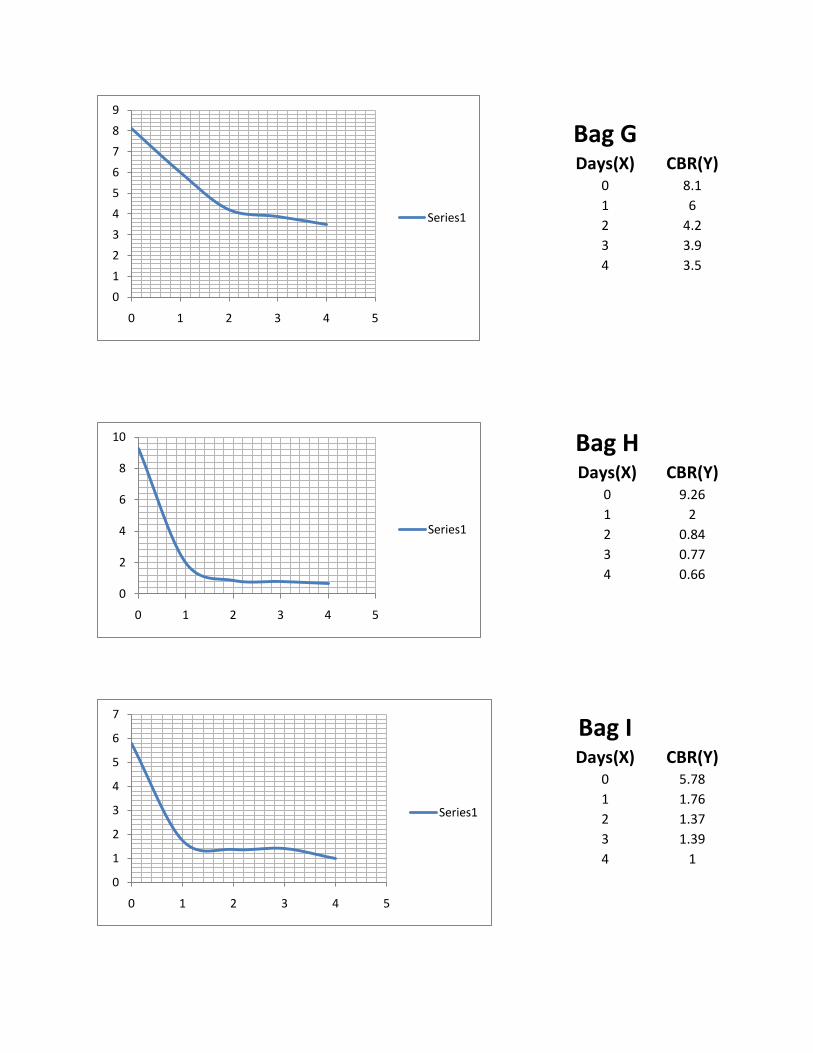
4.3 VARIATION OF CBR WITH DAYS OF
SOAKING.
0
5
10
15
20
25
30
0 2 4 6
Series1
0
2
4
6
8
10
12
14
16
0 2 4 6
Series1
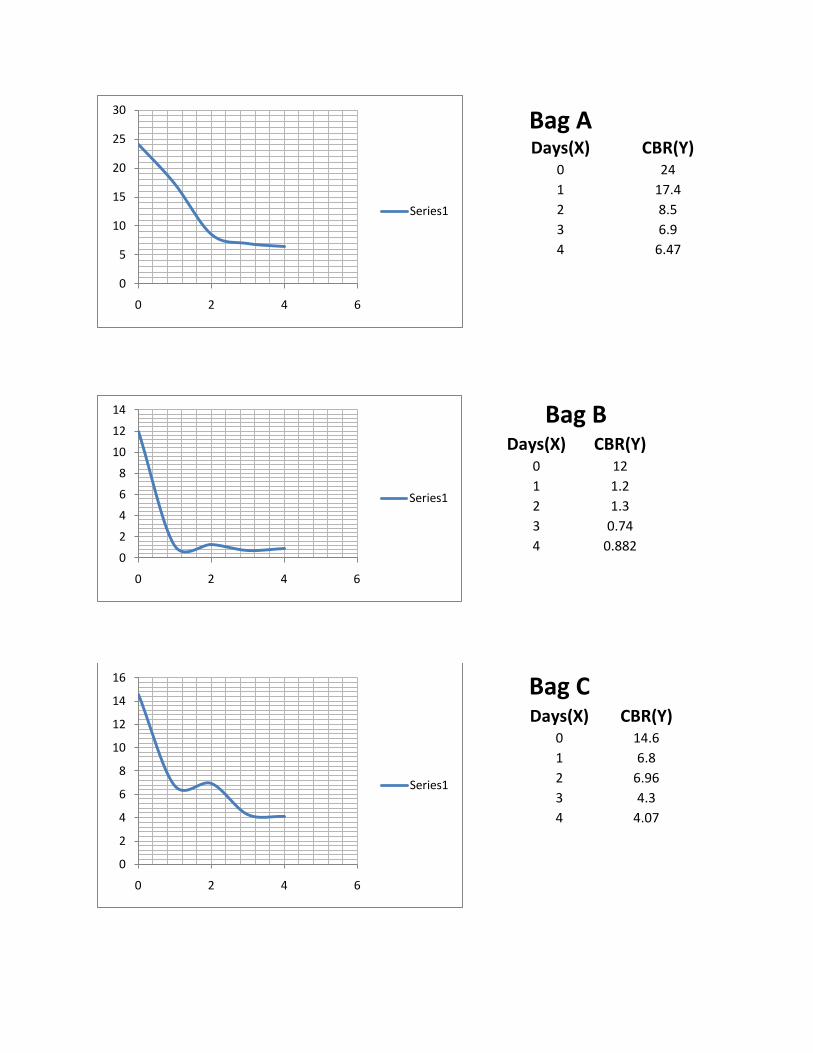
Bag A
Days(X) CBR(Y) 0 24
1 17.4
2 8.5
3 6.9
4 6.47
Bag B Days(X) CBR(Y)
0 12
1 1.2
2 1.3
3 0.74
4 0.882
Bag C Days(X) CBR(Y)
0 14.6
1 6.8
2 6.96
3 4.3
4 4.07
0
2
4
6
8
10
12
14
0 2 4 6
Series1
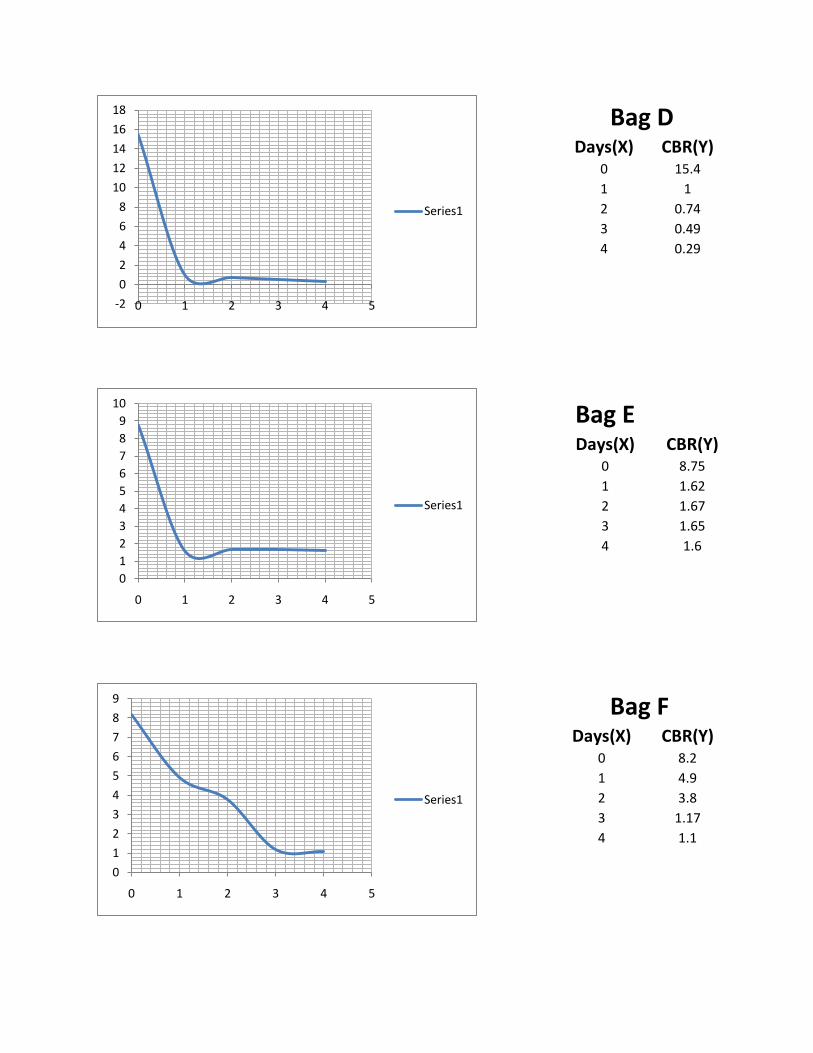
Bag D Days(X) CBR(Y)
0 15.4
1 1
2 0.74
3 0.49
4 0.29
Bag E Days(X) CBR(Y)
0 8.75
1 1.62
2 1.67
3 1.65
4 1.6
Bag F Days(X) CBR(Y)
0 8.2
1 4.9
2 3.8
3 1.17
4 1.1
-2
0
2
4
6
8
10
12
14
16
18
0 1 2 3 4 5
Series1
0
1
2
3
4
5
6
7
8
9
10
0 1 2 3 4 5
Series1
0
1
2
3
4
5
6
7
8
9
0 1 2 3 4 5
Series1
0
1
2
3
4
5
6
7
8
9
0 1 2 3 4 5
Series1
Bag G Days(X) CBR(Y)
0 8.1
1 6
2 4.2
3 3.9
4 3.5
Bag H Days(X) CBR(Y)
0 9.26
1 2
2 0.84
3 0.77
4 0.66
Bag I Days(X) CBR(Y)
0 5.78
1 1.76
2 1.37
3 1.39
4 1
0
2
4
6
8
10
0 1 2 3 4 5
Series1
0
1
2
3
4
5
6
7
0 1 2 3 4 5
Series1
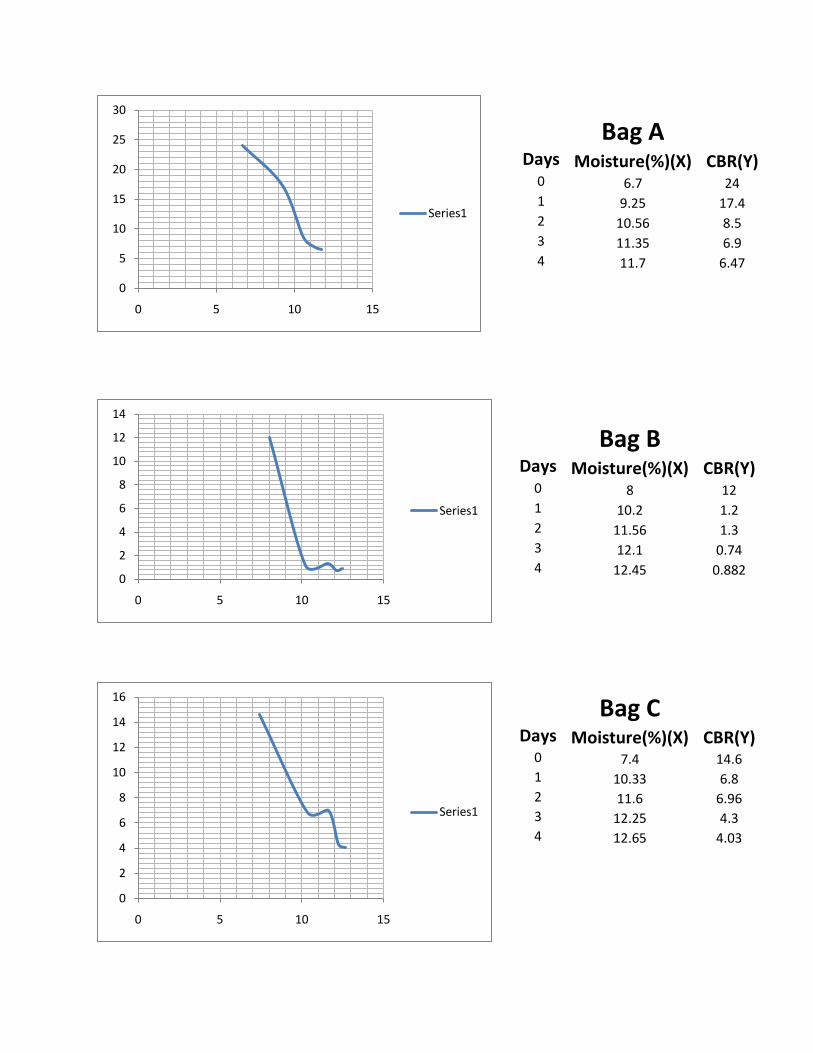
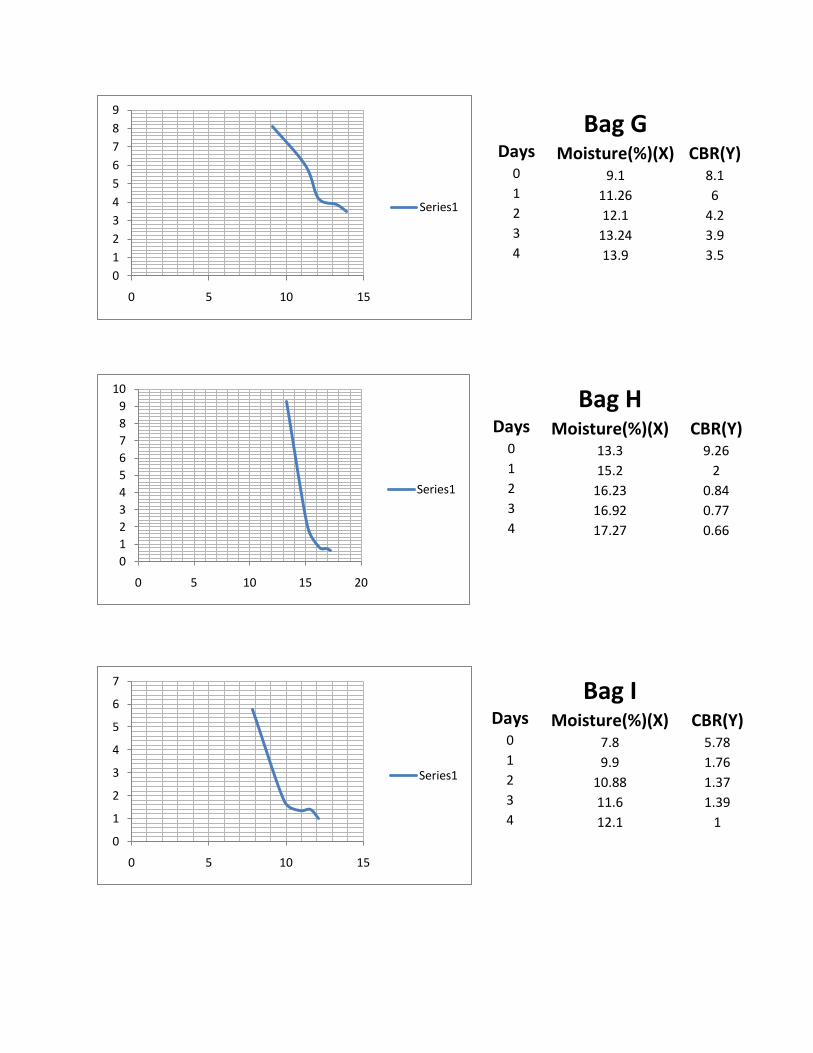
4.4 VARIATION OF CBR WITH
MOISTURE CONTENT(AFTER EACH
DAY OF SOAKING,UPTO 4 DAYS)
0
5
10
15
20
25
30
0 5 10 15
Series1
Bag A Days Moisture(%)(X) CBR(Y)
0 6.7 24 1 9.25 17.4 2 10.56 8.5 3 11.35 6.9 4 11.7 6.47
Bag B Days Moisture(%)(X) CBR(Y)
0 8 12 1 10.2 1.2 2 11.56 1.3 3 12.1 0.74 4 12.45 0.882
Bag C Days Moisture(%)(X) CBR(Y)
0 7.4 14.6 1 10.33 6.8 2 11.6 6.96 3 12.25 4.3 4 12.65 4.03
0
2
4
6
8
10
12
14
0 5 10 15
Series1
0
2
4
6
8
10
12
14
16
0 5 10 15
Series1
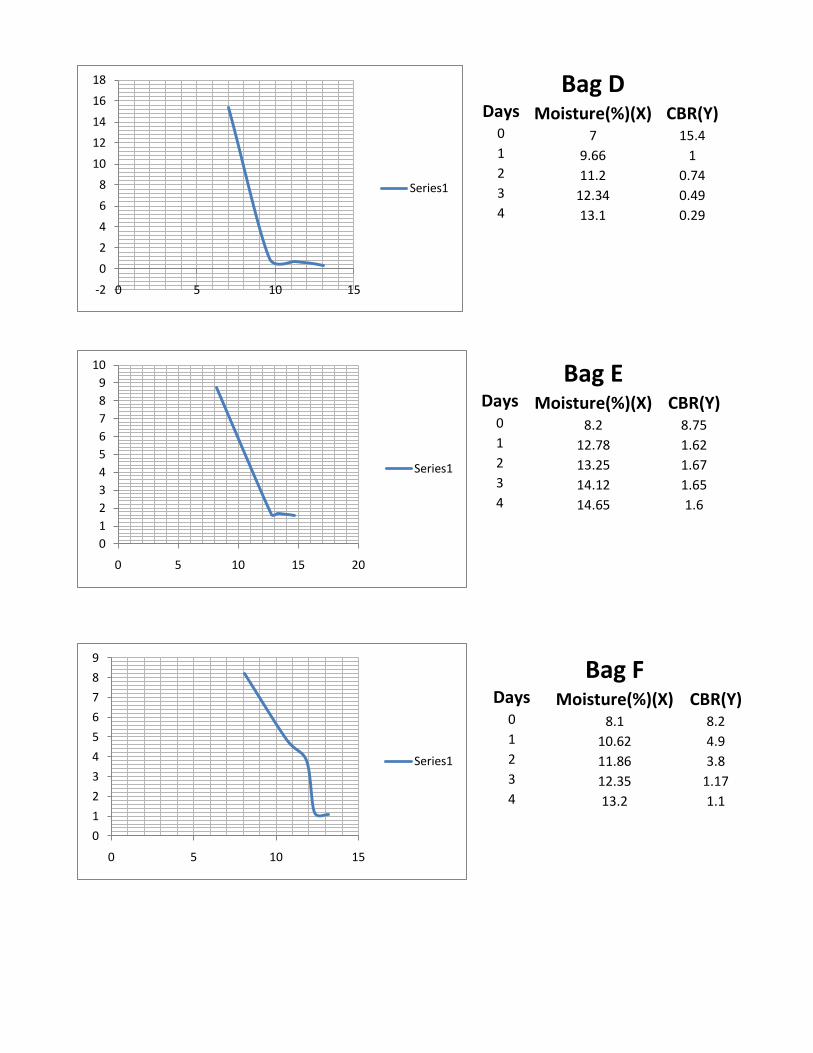
Bag D Days Moisture(%)(X) CBR(Y)
0 7 15.4 1 9.66 1 2 11.2 0.74 3 12.34 0.49 4 13.1 0.29
Bag E Days Moisture(%)(X) CBR(Y)
0 8.2 8.75 1 12.78 1.62 2 13.25 1.67 3 14.12 1.65 4 14.65 1.6
Bag F Days Moisture(%)(X) CBR(Y)
0 8.1 8.2 1 10.62 4.9 2 11.86 3.8 3 12.35 1.17 4 13.2 1.1
Bag G
-2
0
2
4
6
8
10
12
14
16
18
0 5 10 15
Series1
0
1
2
3
4
5
6
7
8
9
10
0 5 10 15 20
Series1
0
1
2
3
4
5
6
7
8
9
0 5 10 15
Series1
0
1
2
3
4
5
6
7
8
9
10
0 5 10 15 20
Series1
Bag G Days Moisture(%)(X) CBR(Y)
0 9.1 8.1 1 11.26 6 2 12.1 4.2 3 13.24 3.9 4 13.9 3.5
Bag H Days Moisture(%)(X) CBR(Y)
0 13.3 9.26 1 15.2 2 2 16.23 0.84 3 16.92 0.77 4 17.27 0.66
Bag I Days Moisture(%)(X) CBR(Y)
0 7.8 5.78 1 9.9 1.76 2 10.88 1.37 3 11.6 1.39 4 12.1 1
0
1
2
3
4
5
6
7
0 5 10 15
Series1
0
1
2
3
4
5
6
7
8
9
0 5 10 15
Series1
5. Conclusion On increasing the number of days of soaking, CBR decreases due to higher ingress
of water. Dramatic loss of strength is observed when unsoaked soil is soaked for
1day under water and then tested for its CBR strength. On further increasing the
number of days of soaking, gradual and not dramatic loss of strength is observed.
Hence, the graph (CBR Vs soaking days) commences with a steep fall and then
goes on with feeble falls.
Rate of ingress of water decreases with days of soaking because it closes in
towards saturation. Most amount of water is soaked on the 1st day and thus
accounts for the highest drop in CBR strength of the soil sample.

Reference:
IRC-SP 37-2007


![Geotechnical Engineering Report on Subgrade Strength … · ] Geotechnical Engineering Report on Subgrade Strength of Existing Highway (Balkh ~ Andkhoy) Fore word As a Design Team](https://static.fdocuments.in/doc/165x107/5b80f7ef7f8b9a35788e58b3/geotechnical-engineering-report-on-subgrade-strength-geotechnical-engineering.jpg)