Greenroads Manual v1.5
471
© 2011 MANUAL v1.5
Transcript of Greenroads Manual v1.5

© 2011
�
�
�
�
�
�
MANUAL
v1.5
�
�

© 2011
�

Greenroads™ Manual v1.5 Table of Contents
�
© 2011
TABLE OF CONTENTS Foreword�............................................................................................................................................................�1�
Acknowledgements�.............................................................................................................................................�3�
Introduction��Introduction�......................................................................................................................................................�7�Background�.....................................................................................................................................................�17�
Project�Requirements� �PR�1�Environmental�Review�Process�...............................................................................................................�29�PR�2�Lifecycle�Cost�Analysis�............................................................................................................................�39�PR�3�Lifecycle�Inventory�..................................................................................................................................�47�PR�4�Quality�Control�Plan�................................................................................................................................�65�PR�5�Noise�Mitigation�Plan�..............................................................................................................................�69�PR�6�Waste�Management�Plan�.......................................................................................................................�79�PR�7�Pollution�Prevention�Plan�.......................................................................................................................�91�PR�8�Low�Impact�Development�.......................................................................................................................�95�PR�9�Pavement�Management�System�...........................................................................................................�107�PR�10�Site�Maintenance�Plan�........................................................................................................................�117�PR�11�Educational�Outreach�.........................................................................................................................�123�
Environment�&�Water� �EW�1�Environmental�Management�System�..................................................................................................�129�EW�2�Runoff�Flow�Control�.............................................................................................................................�135�EW�3�Runoff�Quality......................................................................................................................................�153�EW�4�Stormwater�Cost�Analysis�....................................................................................................................�173�EW�5�Site�Vegetation�....................................................................................................................................�177�EW�6�Habitat�Restoration�.............................................................................................................................�183�EW�7�Ecological�Connectivity�........................................................................................................................�193�EW�8�Light�Pollution�......................................................................................................................................�201�
Access�&�Equity� �AE�1�Safety�Audit�..........................................................................................................................................�207�AE�2�Intelligent�Transportation�System�........................................................................................................�211�AE�3�Context�Sensitive�Solutions�..................................................................................................................�219�AE�4�Traffic�Emissions�Reduction�..................................................................................................................�231�AE�5�Pedestrian�Access�.................................................................................................................................�241�AE�6�Bicycle�Access�.......................................................................................................................................�245�AE�7�Transit�&�HOV�Access............................................................................................................................�251�AE�8�Scenic�Views..........................................................................................................................................�259�AE�9�Cultural�Outreach�.................................................................................................................................�267�
Construction�Activities�� �CA�1�Quality�Management�System�...............................................................................................................�279�CA�2�Environmental�Training�........................................................................................................................�285�CA�3�Site�Recycling�Plan�................................................................................................................................�291�CA�4�Fossil�Fuel�Reduction�............................................................................................................................�303�CA�5�Equipment�Emission�Reduction�............................................................................................................�309�CA�6�Paving�Emissions�Reduction�.................................................................................................................�315�CA�7�Water�Use�Tracking�..............................................................................................................................�321�CA�8�Contractor�Warranty�............................................................................................................................�327�

Greenroads™ Manual v1.5 Table of Contents
�
© 2011
Materials�&�Resources� �MR�1�Lifecycle�Assessment�...........................................................................................................................�339�MR�2�Pavement�Reuse�..................................................................................................................................�357�MR�3�Earthwork�Balance...............................................................................................................................�375�MR�4�Recycled�Materials�..............................................................................................................................�385�MR�5�Regional�Materials�...............................................................................................................................�403�MR�6�Energy�Efficiency�.................................................................................................................................�411�
Pavement�Technologies� �PT�1�Long�Life�Pavement�..............................................................................................................................�419�PT�2�Permeable�Pavement�............................................................................................................................�429�PT�3�Warm�Mix�Asphalt�................................................................................................................................�441�PT�4�Cool�Pavement�......................................................................................................................................�447�PT�5�Quiet�Pavement�....................................................................................................................................�455�PT�6�Pavement�Performance�Tracking�..........................................................................................................�465�
Custom�Credit� �CC�X�[Your�Title�Here]�...................................................................................................................................�471��

Greenroads™ Manual v1.5 Foreword
University of Washington © 2011
FOREWORD Welcome to the new and improved Greenroads Manual v1.5! In our fourth year of research and development, we have plenty of news to report! We are happy to announce that we have made great progress toward refining this continually developing system and you will see many changes in this version of the document as a result of input from case studies, pilot projects, and thoughtful comments we’ve gathered in the last year. Plus, we are pleased to announce that Greenroads has commercialized and is now a pending trademark of the University of Washington (UW)! We have also formed the Greenroads Foundation, a third‐party non‐profit corporation, with a mission of benefiting communities by promoting sustainability in transportation practice and education.
This Greenroads Manual contains ALL of the finer details of each Project Requirement (PR) and Voluntary Credit (VC) currently included in the Greenroads Rating System. You can use this document as a reference guide while you proceed through the design and construction phases of your Greenroads projects. For each PR and VC, this Manual provides the goal, what needs to be done to meet that goal, the documentation to prove those things were done, benefits, sustainability components addressed (Ecology, Economy, Equity, Extent, Expectations, Experience and Exposure), strategies, helpful examples and a supporting body of research and references to help you along the way. For those of you who may not have the time to read hundreds of pages of roadway research, you may note that there is also a shorter version of this manual, the Greenroads Abridged Manual v1.5, which is also available for download on the Greenroads website (http://www.greenroads.us). It has a green cover image.
IMPORTANT STUFF
• All 11 Project Requirements must be met and completed in order to be considered for certification. All of them. No exceptions. They are designed not to be difficult to do, especially if you start thinking about them early.
• Current point ranges for the four available certification levels are listed in the Introduction to the Manual. The minimum level of “Certified” means that all 11 PRs have been completed and that a minimum of 32 points have been earned by completing a variety of Voluntary Credits (VC).
• Please do not use the Greenroads logo or “Greenroads” without written permission of UW. • Please give credit where credit is due. If you are using Greenroads in an article or paper, please be sure to cite
appropriately. Here is a sample, in APA format:
Muench, S.T., Anderson, J.L., Hatfield, J.P., Koester, J.R., & Söderlund, M. et al. (2011). Greenroads Manual v1.5. (J.L. Anderson, C.D. Weiland, and S.T. Muench, Eds.). Seattle, WA: University of Washington.
HOW TO SUBMIT YOUR COMMENTS
• Visit the Greenroads website: http://www.greenroads.us. • Sign up to be a Reviewer by clicking the bottom grey and white button on the front page that says “Review the
Manual” or by following this link directly: http://www.greenroads.us/312/register‐to‐review.html • Fill in your contact information and you will receive a confirmation email with your login credentials. • Navigate the online version of the Manual, which is in the orange box on the right hand side of your screen
when you visit the website.
ADDITIONAL NOTES
• We fixed the pagination and have provided a table of contents in this edition. • We have published a version 1.0.1 to v1.5 “Errata” which is downloadable from our Manual webpage. Errata
have a blue cover image and show the date of publish in their titles.
We look forward to working with you on Greenroads!
Jeralee Anderson, Craig Weiland, and Steve Muench Editors
1

Greenroads™ Manual v1.5 Foreword
University of Washington © 2011
2

Greenroads
ACKNThis updatmany smaparticular, Söderlundfor an Envi
AUTHOR
The editorWashingto
UniversityStephen T.Jeralee L. ACraig WeilaJared KoesEric PetersMaleena SSteven LamCeleste HoNicholas JoDavid VichMalissa PhAaron KnigErika Rami
RESEARC
Greenroadour four re
Transporta(TransNow
s™ Manual v1.5
NOWLEDed version of trt individuals wGreenroads w. Much credit iironmental Rat
S & CONTR
s would also lion and CH2M H
of Washingto. Muench, PhDAnderson, P.E.,and ster son carsella mpert offman ones itthavong hok ght rez
CH SPONSO
ds would also nesearch sponso
ation Northwew)
DGEMEthe Greenroadswho are devotewould not haves due to Martiting System (20
IBUTORS
ke to thank theHILL, Inc. for th
on D., P.E. , LEED®AP
MJoKaYePaJiRaAAAKaJuM
RS
not have been ors.
est StatTech(SPT
NTS s™ Manual woed to making r become whatna. Her origina007) is availab
e following curheir work in res
Martina Söderluoshua Hatfieldari Watkins, P.enyu Lin aul Prigge n Woo Bae achel Liberty dnan Shabir ndrea Gaglianondrew Sahl atherine McIntuliette PeyrouxManisa Veeravig
possible at the
te Pavement hnology ConsoTC)
© 2011
ould not have boadway designt it is today wital master’s thele at the Unive
rrent and formsearch, credit d
CH2und
E.
o
tyre x grom
TimSamMarKristJoe ScotDanRobChuAmy
e University of
ortium WeLanDivi
been possible wn and constructhout the initiaesis work, Sustaersity of Washi
mer students andevelopment,
2M HILL, Inc.othy Bevan, P.
m Seskin rcy Schwartz tin Hull Guenther tt Barber, R.L.Aniel Pitzler bin Senner, Ph.ck Blair, C.W.By Elliott, P.E.
Washington w
stern Federal nds Highway ision (WFLHD)
without the coction practice mal concept fromainable Roadwngton libraries
nd employees arevisions and i
.E.
A.
D. B.
AnnekeDaniel Linda CSteve MRussellDonaldGuy CaLouise Loren BKathlee
without funding
)
OregoTransp
Acknowledg
oncerted effortmore sustainabm Martina way Design: a Ms.
at the Universiinitial contribu
e Davis, P.E.Peterson, P.E.Cyra‐KorsgaardMader, C.E. l Mudgett d Wagner, P.E.aley, P.E. Brown Bloomberg, P.Een Penney, P.E
g and support
n Departmentportation (ODO
gments
t of ble. In
Model
ity of tions.
d, R.L.A.
E. E.
from
t of OT)
3

Acknowledgements Greenroads™ Manual v1.5
©2011
SPECIAL THANKS
The editors would also like to thank the following people at the University of Washington, CH2M HILL, Inc. and other organizations for their work in reviewing, collaboration, case studies, coordination and other efforts.
University of Washington CH2M HILL, Inc. Joe Mahoney, PhD. Tim Larson, PhD. Russell Torgesen, P.E., LEED®AP Joyce Nuesca, M.D.
Sabine EismaRosslyn Luke Christopher Croft Ancelmo McCarthy
Tim Neuman, P.E.Kirsten Pennington Mark Bastasch, P.E., Mike Paddock, P.E., P.L.S. Bill Derry Canisius Chan, P.Eng.
Alex Chan, P.Eng.John Willis, P.E. Kevin Murphy, P.E. Thomas Cahill, P.E. Grahm Satterwhite
Others Amit Armstrong, Ph.D., P.E., Western Federal Lands Highway
Division (WFLHD) Lyn Cornell, ODOT Kim Willoughby, P.E., Washington Department of
Transportation (WSDOT) Jeff Uhlmeyer, P.E., WSDOT Jim Weston, P.E., WSDOT Freeman Anthony, City of Bellingham, WA Maureen Jensen, Minnesota Department of Transportation Angela Brady, P.E., PMP Seattle Department of
Transportation (SDOT) Mark Mazzola, SDOT Erin Moxon, British Columbia Ministry of Transportation
Daniel Medina, Ph.D., P.E., PBS&J Michael Booth, P.E., Perteet, Inc. Jesse Thomsen, Perteet, Inc. Travis Rauscher, Perteet, Inc. Debra T. Johnson, Eco‐Edge, LLC Mike Hutchinson, GeoEngineers, Inc. Kiva Lints, AECOM, USA, Inc. Kara Swanson, Parsons Brinckerhoff, Inc. Steve Carter, TriCar, Ltd. Tom Wheeler, Transportation Corridor Agencies
Volunteer Manual Reviewers Bob Gansauer, National Park Service Bob Holzheimer, National Park Service Darin Thacker, National Park Service Dennis Nagao, National Park Service Ginger Molitor, National Park Service Jan Burton, National Park Service Jesse Van Horne, National Park Service Jessica Hendryx, National Park Service Karen Vaage, National Park Service Lee Terzis, National Park Service Margaret McRoberts, National Park Service Robin Gregory, National Park Service Steven Culver, National Park Service Treff Alexander, National Park Service
Dean Potts, CaterpillarGary Aamold, Consultant Skip Stothert, Green Roads Recycling, Ltd. Jonathan Braadvedt, KOA Corporation Lionel Lemay, National Ready Mixed Concrete
Association Tarek Eweida, Parsons International Ryan Westrom, Patrick Engineering, Inc. Mike Hendrix, Perteet, Inc. Fares Abdo, Portland Cement Association Donna DeNinno, UNI‐GROUP, USA Judith Rochat, US DOT / RITA / Volpe Center
4

Greenroads Manual v1.5 © 2011
�
�
�
�
�
�
INTRODUCTION
5

Greenroads Manual v1.5 © 2011
� �
6

Greenroads™ Manual v1.5 Introduction
University of Washington © 2011
INTRODUCTION WHY GREENROADS™? Did�you�know�that�in�order�to�make�one�lane�of�road,�one�mile�long,�you�would�need�to�use�the�same�amount�of�energy�used�in�one�year�by�about�50�average�American�households?�In�2008,�the�United�States�had�almost�8.5�million�lane�miles�of�pavements�and�600,000�bridges.�So,�the�energy�we�have�already�used�to�make�our�transportation�network�is�over�25%�of�that�used�by�the�entire�U.S.�in�the�entire�year�in�2005.�With�the�national�call�to�energy�efficiency�standards�for�our�built�environment,�why�not�also�look�to�improve�how�we�get�from�place�to�place�every�day�by�rethinking�what�we�use,�how�we�use�it,�where�it�comes�from,�and�how�it�all�fits�together?�
Roads�and�bridges�are�a�critical�part�of�our�nation’s�economic�prosperity�and�local�community�well�being.�It�may�be�hard�to�believe�that�out�of�the�total�100�hours�Americans�spend�on�the�road�commuting�to�work�every�year,�almost�one�whole�work�week�(36�hours)�is�lost�just�waiting�for�road�construction�projects�to�be�finished.�You�might�even�be�surprised�to�learn�that�construction�delays�cost�regular�Americans�almost�$80�billion�in�lost�productivity,�benefits,�and�wages�annually.�These�delays�also�represent�2.9�billion�gallons�of�wasted�fuel�and�countless�carbon�dioxide�emissions,�as�well�as�other�harmful�environmental�exhausts�that�can�cause�acid�rain�and�smog.�In�busy�cities,�many�people�may�agree�that�their�local�congestion�problems�can�be�even�worse�(in�some�cases,�they�are)!�
People�obviously�suffer�frustrations,�but�our�natural�environment�probably�suffers�even�more.�We�all�depend�on�how�well�the�environment�functions�for�our�own�health,�livelihoods,�and�cultures.�Sadly,�even�the�convenient�street�to�and�from�your�local�grocery�store�could�be�to�blame�for�loss�and�destruction�of�sensitive�habitats�and�wetlands,�undrinkable�water,�collisions�with�innocent�animals,�and�lots�of�loud�noise�and�unpleasant�odors.�
The�good�news�is�that�there�is�now�a�way�to�address�and�solve�some�of�these�problems,�or�at�least�a�way�to�help�us�manage�them�better�and�to�make�the�right�decisions�when�we�are�thinking�about�building�new�roads�in�our�communities:�the�Greenroads™�Rating�System.�Greenroads�is�a�tool�(http://www.greenroads.us)�that�can�help�road�builders�work�to�make�better�transportation�projects�every�day,�one�project�at�a�time.�
�
�Figure�I.1:�Greenroads�Pilot�Project�at�Northshore�Drive�in�Bellingham,�Washington.�
Photo�by�Freeman�Anthony,�City�of�Bellingham�Public�Works�
7

Background Greenroads™ Manual v1.5
University of Washington © 2011
WHAT IS GREENROADS™? Greenroads�is�a�voluntary�third�party�rating�system�for�road�projects.�A�rating�system�can�be�useful�for�many�reasons.�Ultimately,�Greenroads�seeks�to�recognize�and�reward�roadway�projects�that�exceed�public�expectations�for�environmental,�economic�and�social�performance.�
Fundamentally,�Greenroads�helps�quantify�the�sustainable�attributes�of�a�roadway�project.�This�quantification�can�be�used�to:�
� Define�what�features�contribute�to�sustainability�on�the�project.�� Provide�accountability�for�sustainability�on�roadway�projects.��� Measure�and�track�specific�sustainability�goals�over�time.�� Manage�and�improve�roadway�sustainability.�� Encourage�new�and�innovative�practices.�� Promote�competitive�advantage�and�other�economic�or�market�incentives�for�sustainability.��� Communicate�sustainable�features�to�stakeholders�in�an�understandable�way,�especially�to�the�general�public.�
Greenroads�is�an�award�based,�flexible�rating�system�(sometimes�called�a�“performance�metric”)�that�can�be�used�to�rank,�score�and�compare�different�road�projects�for�their�overall�performance�toward�being�more�sustainable�than�an�average�road�project.�Earning�a�Greenroads�award,�called�“certification”�is�like�winning�the�Olympic�Games�for�roads:�projects�earn�points�for�special�activities.�Upon�successful�completion,�a�distinctive�sign�can�be�used�on�road�projects�that�go�above�and�beyond�current�standards�for�environmental�compliance,�roadway�design�and�construction�practice.�These�projects�demonstrate�a�level�of�excellence�in�sustainability�beyond�the�average�roadway�project�and�communicate�substantial�achievement�to�project�stakeholders.�
�Figure�I.2:�Yellowstone�East�Entrance�Pilot�Project,�Western�Federal�Lands�Highway�Division.�
Photo�by�Chris�Croft��
A NOTE ON COPYRIGHT AND TRADEMARK USE
Greenroads�is�a�publicly�available�system�that�can�be�used�by�anyone.�However,�the�Greenroads�logo�and�name�remain�the�property�of�the�University�of�Washington�and�may�only�be�used�with�express�permission�of�the�UW�or�a�licensed�agent.��Any�use�of�ideas�or�references�to�Greenroads�requires�proper�citation�of�Greenroads�as�the�origin�of�these�ideas�and�recognition�that�UW�owns�the�trademark.�
WHAT IS A GREENROAD?
A�Greenroad�is�defined�as�a�roadway�project�that�has�been�designed�and�constructed�to�a�level�of�sustainability�that�is�
substantially�higher�than�current�common�practice.�
8
Greenroads™ Manual v1.5 Introduction
University of Washington © 2011
HOW GREENROADS™ WORKS Greenroads�is�a�collection�of�sustainability�best�practices�that�apply�to�roadway�design�and�construction.�These�best�practices�are�divided�into�two�general�types:�required�and�voluntary.�Greenroads�activities�are�not�intended�to�supersede�local,�state,�or�federal�regulation�or�other�jurisdictional�ordinances.�
WHAT IS REQUIRED
At�minimum,�every�Greenroads�project�must�complete�11�specific�activities�in�order�to�qualify�for�any�award.�No�exceptions.�These�activities�are�straightforwardly�called�Project�Requirements�(PRs)�and�are�grouped�together�as�the�first�category�in�the�Manual.��
The�PRs�are�intended�to�capture�some�of�the�most�critical�ideas�of�sustainability�for�any�roadway�project�from�planning,�design,�construction�and�operations�and�maintenance,�such�as:�
� Environmental�and�economic�decision�making�� Public�engagement�� Design�for�long�term�environmental�performance�� Construction�planning�� Planning�for�lifetime�monitoring�and�maintenance�
Note�that�many,�but�not�all,�projects�will�meet�several�of�the�PR�outright�with�little�or�no�additional�effort.�This�is�because�underlying�many�of�these�credits�are�ideas�that�are�often�regulated�by�both�federal�and�state�laws.�However,�because�states�carry�a�significant�amount�of�autonomy�for�many�laws,�some�of�the�standards�in�the�PRs�may�be�somewhat�stricter�or�possibly�less�strict�than�the�project’s�actual�state�laws.�PRs�carry�no�point�value.��
WHAT IS OPTIONAL
Voluntary�best�practices�are�those�that�may�optionally�be�included�in�a�roadway�project.�These�are�called�“Voluntary�Credits”.�Each�Voluntary�Credit�is�assigned�a�point�value�(1�5�points)�depending�upon�its�impact�on�sustainability.�Currently,�there�are�37�Voluntary�Credits�totaling�108�points.�Greenroads�also�allows�a�project�or�organization�to�create�and�use�its�own�Voluntary�Credits�(called�“Custom�Credits”),�subject�to�approval�of�Greenroads,�for�a�total�of�10�more�points,�which�brings�the�total�available�points�to�118.�
Project�teams�apply�for�points�by�submitting�specific�documentation�in�support�of�the�Project�Requirement�or�Voluntary�Credit�they�are�pursuing.�These�documents,�which�can�range�from�project�specifications�to�field�documentation,�are�verified�by�an�independent�review�team.�Once�a�project�is�complete,�the�Greenroads�team�verifies�the�application�and�assigns�a�Greenroads�score�based�on�achieving�all�11�of�the�Project�Requirements�and�the�number�of�points�earned�from�the�Voluntary�Credits.�This�score�may�then�be�used�at�the�owner’s�discretion�and�may�also�be�translated�to�a�standard�achievement�level�or�“certification”�if�so�desired:�the�more�points�earned,�the�higher�the�recognition.�If�a�project�reaches�a�certification�level�it�will�be�able�to�display�the�Greenroads�logo�and�appropriate�certification�graphic�once�permission�from�the�Greenroads�team�is�given.�The�Greenroads�certification�levels�are�detailed�in�a�subsequent�section�of�this�document.�
Owner�agencies,�developers,�design�consultants�and�contractors�may�wish�to�pursue�official�certification�or�use�Greenroads�in�other�ways�that�are�either�voluntary�or�prescriptive.�For�instance,�developers�and�designers�may�wish�to�use�Greenroads�as�a�list�of�potential�ideas�for�improving�the�sustainability�of�a�roadway�project.�Or,�owners�may�wish�to�use�Greenroads�point�values�or�certification�levels�as�goals�or�benchmarks�for�new�roadway�projects�or�metrics�by�which�they�can�measure�and�manage�their�roadway�sustainability�efforts.��
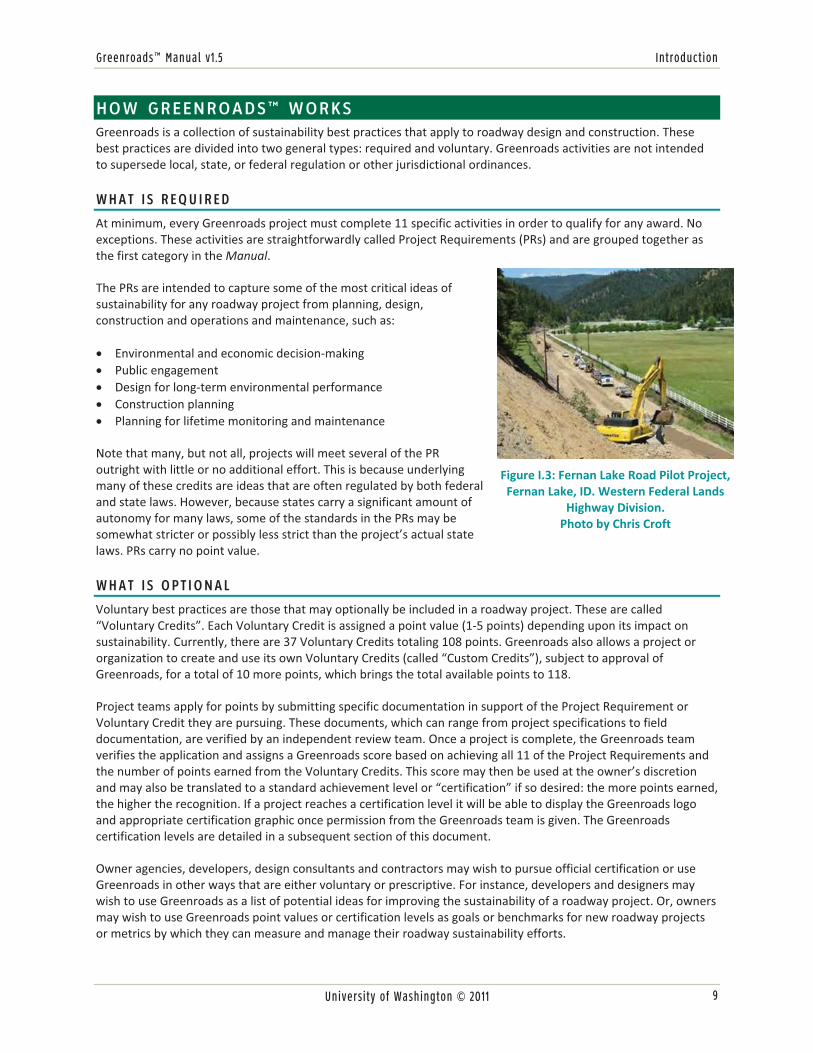
Figure�I.3:�Fernan�Lake�Road�Pilot�Project,�Fernan�Lake,�ID.�Western�Federal�Lands�
Highway�Division.�Photo�by�Chris�Croft�
9

Background Greenroads™ Manual v1.5
University of Washington © 2011
IS GREENROADS RIGHT FOR ME?
There�are�a�number�of�stakeholders�who�may�have�interest�in�a�roadway�sustainability�rating�system.�Each�stakeholder�is�likely�to�have�opinions�on�how�Greenroads�should�work;�however�it�should�be�noted�that�not�all�points�of�view�can�be�fully�accommodated.�Stakeholders�include:��
� Road�owners:�federal,�state,�county�and�city�agencies�as�well�as�the�general�public.�� Funding�agencies:��federal,�state,�county,�city�and�other�regional�authorities�� Design�consultants:�those�involved�with�corridor,�road�or�even�parking�lot�design�� Contractors:�heavy�construction,�road�and�paving�contractors�� Regulatory�agencies:�U.S.�Environmental�Protection�Agency�� Sustainability�organizations:�U.S.�Green�Building�Council�(USGBC),�Green�Highways�Partnership,�Sierra�Club,�etc.�� Research�organizations:�universities�and�other�research�organizations�that�participate�in�investigating�
transportation�related�sustainable�technologies.�
GENERAL PHILOSOPHY OF THE RATING SYSTEM
The�fundamental�tenets�that�guide�the�development�and�writing�of�Greenroads�are:�
� Straightforward�and�understandable.�Non�experts�should�be�able�to�understand�the�system.�Simplicity�is�valued�over�excessive�detail�because�it�is�more�understandable.�Project�Requirements�and�Voluntary�Credits�are�often�simplistic�interpretations�of�complex�ideas;�they�are�bound�to�contain�some�controversy�however�the�interpretation�should�hold�true�to�the�fundamental�idea.���
� Empirical�evidence�and�existing�evaluative�techniques.�Project�Requirements�and�Voluntary�Credits�are�based�on�a�preponderance�of�empirical�evidence�and,�to�the�extent�possible,�should�be�evaluated�using�existing�tools�and�techniques.��
� Points�commensurate�with�impact.�Items�that�have�high�economic,�environmental�or�social�impact�are�assigned�more�points�than�low�impact�items.��
� Flexible.�Greenroads�should�be�able�to�accommodate�a�broad�range�of�both�urban�and�rural�roadway�projects�from�preservation�overlays�to�major�new�corridor�development.�Project�Requirements�and�Voluntary�Credits�should�be�applicable�anywhere�in�the�U.S.�International�versions�may�need�further�development�in�the�future.��
� Continual�evolution.�Over�time,�better�ideas,�more�complete�knowledge�and�technology�advances�will�require�Greenroads�to�be�updated�and�changed.��
� Minimal�bureaucracy.�Pursuing�certification�requires�documentation�but�documents�should�either�come�from�existing�documents�(e.g.�plans�and�specifications)�or�be�simple�and�inexpensive�to�produce�from�existing�documents.��
� Beyond�minimum�requirements.�Greenroads�should�spur�innovation�and�encourage�design�and�construction�decisions�based�on�sustainability�considerations�that�go�beyond�regulatory�requirements.�While�regulatory�requirements�and�design�standards�contribute�to�sustainability,�a�rating�system�that�awards�credit�for�these�items�alone�essentially�becomes�a�marketing�tool�that�is�technically�redundant�and�administratively�burdensome.�
WHO DEVELOPED GREENROADS?
Greenroads�is�a�research�project�that�originated�at�the�University�of�Washington�and�has�developed�in�several�versions�since�the�initial�beginnings�of�research�work�in�2007.�Version�0.95�(2009)�was�developed�jointly�by�the�University�of�Washington�(UW)�and�CH2M�HILL,�with�further�work�on�v1.0,�v1.0.1�and�this�version�of�the�Rating�System�and�Manual�were�managed�through�the�University�of�Washington,�with�helpful�collaboration�from�CH2M�HILL�and�a�number�of�other�industry�groups�and�consultants�who�have�contributed�data�and�commentary�by�means�of�pilot�projects,�case�studies�and�public�comments.�
Current�research�at�the�University�of�Washington�is�headed�by�Steve�Muench,�an�Associate�Professor�in�the�Department�of�Civil�and�Environmental�Engineering.�Work�on�the�original�0.95�version�of�Greenroads�at�CH2M�HILL�
10

Greenroads™ Manual v1.5 Introduction
University of Washington © 2011
was�led�by�Tim�Bevan,�Mountain�West�Region�Technology�and�Quality�Manager,�Transportation�Business�Group.�Importantly,�although�UW�and�CH2M�HILL�are�developing�this�system,�the�brand�associated�with�any�rated�project�will�only�be�the�Greenroads�brand,�which�is�a�pending�trademark�of�the�University�of�Washington.�The�Greenroads�Foundation,�a�third�party�independent�non�profit�organization�incorporated�in�2010,�is�intended�to�be�the�sole�licensee�of�the�rating�system�and�will�manage�future�updates�to�maintain�and�continually�improve�Greenroads.�
GREENROADS WEBSITE
All�Greenroads�work,�including�this�Manual�and�all�of�its�credits,�is�documented�on�the�official�website:�
www.greenroads.us�
Please�visit�this�website�to�see�the�latest�news,�copies�of�presentations�given,�rated�projects�and�other�Greenroads�related�information.�You�can�also�contact�Greenroads�Foundation�staff�directly�via�the�Contact�Us�form,�register�your�projects�or�volunteer�to�review�the�Manual.�
�
Figure�I.4:�Homepage�of�the�Greenroads�Website:�http://www.greenroads.us��
FUTURE CHANGES
Greenroads�will�change�in�the�future�as�more�information�is�gathered�and�new�industry�standard�practices/rules�are�developed.�This�means�that�new�credits�could�be�added,�old�ones�removed,�point�values�changed,�certification�levels�adjusted�and�more.�No�matter�what�the�current�Greenroads�version�is,�we�are�already�working�on�the�next.�Therefore,�user�comments�are�welcomed�and�might�very�well�be�incorporated�into�the�next�version.�If�you�are�getting�pursuing�certification�under�one�version�of�the�rating�system�while�another�comes�out,�you�will�be�given�the�opportunity�to�upgrade�to�the�latest�version.�
11

Background Greenroads™ Manual v1.5
University of Washington © 2011
GREENROADS ESSENTIALS This�section�describes�the�essentials�of�the�Greenroads�Rating�System.�These�are�items�a�project�may�want�to�know�about�when�deciding�whether�or�not�to�pursue�Greenroads�certification.��
PROJECT REQUIREMENTS
Project�Requirements�are�the�minimum�steps�that�must�be�completed�in�order�to�be�considered�a�Greenroad.�They�can�be�thought�of�as�characteristics�common�to�all�Greenroads.�In�order�to�achieve�certification�they�must�all�be�met�and�an�additional�number�of�Voluntary�Credit�points�must�also�be�earned.�In�other�words,�regardless�of�how�many�Voluntary�Credit�points�are�achieved,�if�a�project�does�not�meet�all�of�the�Project�Requirements,�a�Greenroads�certification�level�will�NOT�be�awarded.�
Project�Requirements�are�listed�in�their�own�category�at�the�front�of�the�manual�to�distinguish�them�from�the�Voluntary�Credit�categories.�The�Project�Requirements�also�consist�of�items�or�procedures�that�are�often�related�to�practices�that�can�achieve�points�in�one�or�more�of�the�Voluntary�Credit�categories,�which�may�strategically�assist�projects�that�are�planning�to�pursue�certification.�
VOLUNTARY CREDITS
In�addition�to�the�Project�Requirements,�there�is�a�wide�selection�of�Voluntary�Credits�that�a�project�can�earn.�Each�Voluntary�Credit�is�associated�with�a�number�of�points�(from�1�to�5)�depending�upon�the�impact�the�credit�has�on�sustainability�(as�defined�later�in�this�document).�A�project�chooses�to�pursue�Voluntary�Credits�on�a�voluntary�basis;�none�are�required.�Once�those�pursued�Voluntary�Credits�are�verified�by�the�Greenroads�team,�the�number�of�points�achieved�is�tallied�up�and�a�certification�level�(see�next�section),�if�desired,�is�awarded.��
Voluntary�Credits�span�a�wide�spectrum�of�project�actions�from�cultural�outreach�and�multimodal�access�to�safety�to�pavement�materials.�Therefore,�it�is�likely�that�no�project�will�be�able�to�achieve�all�of�the�Voluntary�Credits.�However,�the�goal�of�Greenroads�is�to�have�enough�choice�in�Voluntary�Credits�that�any�roadway�project�could�find�enough�relevant�credits�to�achieve�at�least�a�minimum�certification�level.�This�means�that�Greenroads�should�work�for�all�roadway�projects�from�basic�preservation�overlays�to�large,�multi�billion�dollar�corridor�projects.��
ACHIEVEMENT/CERTIFICATION LEVELS
Greenroads�may�be�used�to�“certify”�a�project�based�on�total�points�achieved.�Depending�upon�the�appetite�of�the�project,�these�levels�can�be�called�“achievement”�or�“certification”�levels.�Obtaining�these�levels�is�an�official�acknowledgement�by�Greenroads�that�a�project�has�met�all�Project�Requirements�and�achieved�enough�of�the�118�possible�Voluntary�Credit�points�to�surpass�a�predetermined�certification�level.�There�are�four�certification�levels�as�shown�below:��
� Certified:�All�Project�Requirements�+�32�42�Voluntary�Credit�points�(30�40%�of�total)�� Silver:�All�Project�Requirements�+�43�53�Voluntary�Credit�points�(40�50%�of�total)�� Gold:�All�Project�Requirements�+�54�63�Voluntary�Credit�points�(50�60%�of�total)�� Evergreen:�All�Project�Requirements�+�64+�Voluntary�Credit�points�(>60%�of�total)�
These�levels�are�subject�to�revision�with�new�versions�of�Greenroads�and�may�change�in�the�future�as�the�system�is�updated.�A�certified�roadway�can�be�considered�a�Greenroad.��
�
12

Greenroads™ Manual v1.5 Introduction
University of Washington © 2011
SCOPE OF THE GREENROADS RATING SYSTEM This�section�describes�the�underlying�ideas,�scope�and�limits�of�Greenroads.�It�is�expected�that�the�basic�system�will�grow�and�change�as�sustainability�thought,�technologies�and�regulations�change.�However,�the�fundamental�concepts�addressed�here�are�expected�to�remain�relatively�constant.��
HOW DOES GREENROADS FIT WITH REGULATORY STANDARDS?
Greenroads�is�designed�to�promote�sustainability�best�practices�within�and�beyond�existing�federal,�state�and�local�regulations.�Specifically,�Greenroads�credits�are�designed�to�influence�decisions�regarding�sustainability�options�where�they�are�not�precluded�by�regulation�or�where�regulation�allows�a�choice�between�options�that�could�have�sustainability�impacts.�
An�important�corollary�to�this�is�that�Greenroads�is�not�an�absolute�measure�of�sustainability�because�it�does�not�include�sustainability�items�that�are�covered�by�current�U.S.�regulation�(e.g.,�Clean�Water�Act,�Clean�Air�Act,�National�Historical�Preservation�Act,�Americans�with�Disabilities�Act,�etc.).�However,�given�that�all�U.S.�agencies�are�governed�by�the�same�set�of�federal�regulations,�Greenroads�can�be�considered�a�sustainability�metric�built�on�U.S.�standard�practice.�
Greenroads�is�also�meant�to�encourage�organizations�to�include�sustainable�practices�in�their�company�wide�strategy�and�daily�work�practices.�Importantly,�Greenroads�is�not�meant�to�dictate�design�or�trade�off�decisions.�Rather�it�provides�a�tool�to�help�with�such�decisions.��
WHAT ARE THE SYSTEM BOUNDARIES?
Greenroads,�in�its�current�version,�is�a�project�based�rating�system.�This�means�that�it�is�applicable�to�the�design�and�construction�of�new�or�rehabilitated�roadways,�including�expansion�or�redesign.�There�are�shortcomings�to�a�project�based�system�which�are�highlighted�more�briefly�below.�Specifically�though,�Greenroads�best�applies�to�the�design�process�and�construction�activities�within�the�workzone�as�well�as�material�hauling�activities,�production�of�portland�cement�concrete�(PCC)�and�hot�mix�asphalt�(HMA).�
If�you�are�wondering�if�your�project�fits�with�a�system�like�Greenroads,�contact�us�directly�or�you�can�also�browse�the�Abridged�Manual�with�a�checklist�in�hand�to�help�you�make�that�determination�yourself.�Chances�are�that�you�will�be�able�to�incorporate�many�of�the�ideas�into�your�project.�Actually,�you�may�find�that�you�are�already�thinking�about�many�of�them,�but�may�have�had�trouble�seeing�how�they�would�fit�together,�or�help�achieve�your�sustainability�goals.�
We�also�think�transportation�planners�and�public�works�agencies�can�use�Greenroads�as�a�handy�tool�during�early�project�decision�making,�internal�accountability�programs�or�even�as�a�part�of�high�level�planning�or�long�term�maintenance�and�operations�decisions.�However,�the�majority�of�the�credits�in�the�Rating�System�do�not�address�planning�and�operations�in�depth.�We�recognize�the�concern�that�this�appears�to�create�a�piecemeal�approach�to�sustainability�but�also�that�an�enormous�environmental�impact�happens�immediately�upon�groundbreaking�during�roadway�construction.�Our�long�term�goal�is�to�be�able�to�develop�project�specific�credits�that�help�roadway�projects�support�and�interconnect�with�many�of�the�network�level�decisions�for�sustainability�at�any�owner�agency.�
How Do Greenroads Projects Relate To Transportation Planning?
Decisions�regarding�the�location,�type,�timing,�feasibility�or�other�planning�level�ideas�for�roadway�projects�are�excluded.�For�example,�Greenroads�does�not�answer�the�question�“should�we�build�a�road�or�not?”�While�planning�is�fundamental�to�roadway�and�community�sustainability,�these�decisions�are�often�too�complex�or�political�to�be�adequately�defined�by�a�point�based�system.�Project�level�planning�however,�in�terms�of�project�development�and/or�project�delivery,�is�included�and�many�of�the�Project�Requirements�and�Voluntary�Credits�can�be�used�during�design�and�development�to�help�shape�decisions�on�the�project.�
13
Background Greenroads™ Manual v1.5
University of Washington © 2011
How Does Greenroads Address Upstream Supply-Chain Processes?
Currently,�no�credits�in�the�rating�system�explicitly�address�direct�improvements�in�upstream�supply�chain�processes.�This�is�because�these�upstream�processes�present�a�quantification�problem�that�is�fundamentally�difficult�to�assign�specifically�enough�to�a�roadway�project.��However,�a�handful�of�Greenroads�credits�do�capture�ideas�that�involve�supply�chain�processes,�and�also�interconnect�with�each�other�to�make�a�small�contribution�toward�broader�supply�chain�goals.�
An�upstream�supply�chain�process�is�an�activity�that�contributes�only�partly�to�a�roadway�project,�such�as�petroleum�refining�or�cement�manufacturing.�The�reason�this�is�difficult�to�quantify�on�a�per�project�basis�is�because�these�processes�are�multifunctional�and�have�more�than�one�product�or�result.�Petroleum�is�used�for�a�number�of�things�beyond�the�gas�that�fuels�vehicles,�including�the�production�of�asphalt,�which�is�actually�a�byproduct�(waste)�of�the�refining�process.�Also,�cement�and�cement�products�are�used�in�many�applications�beyond�roadways,�such�as�in�buildings.�Should�a�project�be�held�responsible�for�all�of�the�asphalt�or�cement�in�the�batch,�or�just�a�portion�of�it?��
Addressing�the�allocation�of�sustainability�impacts�to�such�industries�or�others�that�contribute�to�roadway�design�and�construction�would�be�a�daunting�task�and�we�think�it�may�also�introduce�unnecessary�subjectivity�to�the�rating�system.�Many�upstream�choices�involve�tradeoffs�that�are�outside�the�control�of�a�rating�system�tool�like�Greenroads.�For�this�reason,�multifunctional�processes�are�a�subject�of�hot�debate�and�until�there�is�established�consensus�on�how�to�allocate�responsibility,�a�project�level�credit�for�such�activities�is�not�likely.�Ultimately,�it�is�not�the�primary�goal�or�utility�of�a�point�based�rating�system�for�roadway�projects�to�address�the�sustainability�of�supply�chain�management�and�this�may�be�best�left�to�experts�in�those�fields.�
We�do�try�to�improve�awareness�of�these�upstream�activities�and�their�impacts�and�tradeoffs�through�integration�of�lifecycle�inventories�(LCI)�and�assessments�(LCA)�through�providing�incentives�to�inform�project�decision�making.�However,�if�there�are�suggestions�on�how�to�resolve�some�of�these�issues�and�integrate�better�with�upstream�goals,�we�would�be�glad�to�entertain�them�for�future�credits.�
How Does Greenroads Address Structures?
Bridges,�tunnels,�walls�and�other�structures�are�not�explicitly�considered�in�Greenroads,�but�they�are�not�explicitly�excluded�either.�In�fact,�several�examples�in�the�Greenroads�Manual�feature�these�types�of�structures.�At�this�time�though,�no�structurally�specific�credits�have�been�identified�outside�the�pavement�structure�and�bridges,�but�could�easily�be�incorporated�into�future�versions�of�Greenroads�(i.e.�via�the�Custom�Credits).�We�think�many�of�the�existing�Project�Requirements�and�Voluntary�Credits�are�appropriate�to�bridge�and�tunnel�projects,�because�the�credits�are�designed�to�be�broadly�applicable.�
You�may�notice�that�in�this�edition�of�the�Manual�we�have�updated�some�of�the�pavement�specific�credits�to�include�alternatives�for�different�types�of�structures.�Many�of�these�updates�came�out�of�our�case�study�and�pilot�project�research�on�a�handful�of�bridge�projects.�
Non�pavement,�non�bridge�roadway�structures,�such�as�walls,�luminaires�and�barriers,�can�be�included�in�some�credits�conceptually�as�a�lump�of�materials,�but�there�are�no�credits�exclusively�for�these�road�related�items.�As�always,�comments�are�welcome�regarding�adjustments�that�would�need�to�be�made�to�be�more�reflective�of�sustainable�activities�for�bridges,�tunnels�and�other�structures.�
What about Operations & Maintenance Projects?
What�Is�Included.�Overlays,�rehabilitations,�2R,�3R,�4R,�you�name�it.�If�pavement�is�being�moved�in�a�meaningful�way,�it�is�included�(i.e.�to�and�from�site,�around�a�site,�etc.).�A�maintenance�project�intended�to�preserve�the�life�of�a�roadway�is�a�construction�project�for�the�purposes�of�Greenroads.�
14

Greenroads™ Manual v1.5 Introduction
University of Washington © 2011
What�Is�Not�Included.�Activities�that�are�performed�as�part�of�the�Site�Maintenance�Plan�(see�PR�10),�usually�by�Public�Works�Agencies�and�their�contractors.�
Maintenance�and�preservation�activities�are�a�key�part�in�the�long�term�sustainability�of�a�roadway,�so�there�are�a�number�of�Project�Requirements�and�Voluntary�Credits�that�reflect�these�activities�and�require�that�a�plan�is�in�place�for�these�to�be�performed�sometime�in�the�future.�However,�a�rating�system�like�Greenroads�cannot�be�used�to�monitor�these�activities�over�the�long�term�effectively.�This�means�that�once�the�Greenroads�score�is�calculated,�essentially�these�maintenance�and�preservation�plans�become�promises�to�perform.�
The�current�review�process�for�certification�does�not�allow�for�ensuring�that�these�promises�are�kept.�Ideally,�once�a�project�becomes�a�Greenroad,�the�maintenance�and�preservation�activities�will�also�continue�to�follow�this�framework�whether�certification�for�these�activities�is�pursued�or�not.�We�realize�this�is�a�weakness�of�the�rating�system�in�general�and�would�appreciate�feedback�on�how�to�incorporate�these�ideas�in�a�meaningful,�effective�way.�We�have�been�thinking�about�this�idea�but�have�not�been�able�to�determine�or�identify�a�standardized,�accepted�way�that�currently�meets�all�the�requirements�of�our�rating�system�philosophy.�If�you�have�ideas�on�how�we�can�do�this�at�a�roadway�project�level,�we�encourage�you�to�submit�for�a�Custom�Credit�on�your�project.�
Does Greenroads Fit Pathway and Trail Projects?
Paths�and�trails�may�be�able�to�use�Greenroads�too.�We�think�that�there�is�room�for�including�these�design�and�construction�projects�and�that�many�of�the�ideas�in�Greenroads�would�work�well.�Some�of�the�credits�may�require�modification�to�be�applicable�though,�and�earning�enough�points�to�become�Certified�might�be�difficult�depending�on�the�size�and�scale�of�the�project.�However,�if�there�is�a�pathway�or�trail�directly�associated�with�a�roadway�project,�it�is�definitely�included.�If�you�have�a�pathway�project�that�you�want�to�test�out�with�Greenroads,�you�can�always�contact�Greenroads�Foundation�to�inquire�about�pilot�project�opportunities.�
� �
15

GREENROADS RATING SYSTEM
LIST OF CREDITS (v1.5) No. Title Pts. Description
Project Requirements (PR) – Mandatory for all projects
PR‐1 Environmental Review Process Req Complete a comprehensive environmental review PR‐2 Lifecycle Cost Analysis (LCCA) Req Perform LCCA for pavement section PR‐3 Lifecycle Inventory (LCI) Req Perform LCI of pavement section PR‐4 Quality Control Plan Req Have a formal contractor quality control plan PR‐5 Noise Mitigation Plan Req Have a construction noise mitigation plan PR‐6 Waste Management Plan Req Have a plan to divert C&D waste from landfill PR‐7 Pollution Prevention Plan Req Have a TESC/SWPPP PR‐8 Low Impact Development (LID) Req Complete a LID feasibility study PR‐9 Pavement Management System Req Have a pavement management system PR‐10 Site Maintenance Plan Req Have a roadside maintenance plan PR‐11 Educational Outreach Req Publicize sustainability information for project
Environment & Water (EW) – Up to 21 Points
EW‐1 Environmental Management System 2 ISO 14001 certification for general contractor EW‐2 Runff Flow Control 1‐3 Reduce runoff quantity EW‐3 Runoff Quality 1‐3 Treat stormwater to a higher level of quality EW‐4 Stormwater Cost Analysis 1 Conduct an LCCA for stormwater elements EW‐5 Site Vegetation 1‐3 Use native low/no water vegetation EW‐6 Habitat Restoration 3 Restore habitat beyond what is required EW‐7 Ecological Connectivity 1‐3 Connect habitat across roadways EW‐8 Light Pollution 3 Discourage light pollution
Access & Equity (AE) – Up to 30 Points
AE‐1 Safety Audit 1‐2 Perform roadway safety audit AE‐2 Intelligent Transportation Systems (ITS) 2‐5 Implement ITS solutions AE‐3 Context Sensitive Solutions 5 Plan for context sensitive solutions AE‐4 Traffic Emissions Reduction 5 Reduce emissions with quantifiable methods AE‐5 Pedestrian Access 1‐2 Provide/improve pedestrian accessibility AE‐6 Bicycle Access 1‐2 Provide/improve bicycle accessibility AE‐7 Transit Access 1‐5 Provide/improve transit accessibility AE‐8 Scenic Views 1‐2 Provide views of scenery or vistas AE‐9 Cultural Outreach 1‐2 Promote art/culture/community values
Construction Activities (CA) – Up to 14 Points
CA‐1 Quality Management System 2 ISO 9001 certification for general contractor CA‐2 Environmental Training 1 Provide environmental training CA‐3 Site Recycling Plan 1 Have a plan to divert waste from landfill CA‐4 Fossil Fuel Reduction 1‐2 Use alternative fuels in construction equipment CA‐5 Equipment Emissions Reduction 1‐2 Meet EPA Tier 4 standards for non‐road equip. CA‐6 Paving Emissions Reduction 1 Use pavers that meet NIOSH requirements CA‐7 Water Tracking 2 Develop data on water use in construction CA‐8 Contractor Warranty 3 Warranty on the constructed pavement
Materials & Resources (MR) – Up to 23 Points
MR‐1 Life Cycle Assessment (LCA) 2 Conduct a detailed LCA of the entire project MR‐2 Pavement Reuse 1‐5 Reuse existing pavement sections MR‐3 Earthwork Balance 1 Use native soil rather than import fill MR‐4 Recycled Materials 1‐5 Use recycled materials for new pavement MR‐5 Regional Materials 1‐5 Use regional materials to reduce transportation MR‐6 Energy Efficiency 1‐5 Improve energy efficiency of operational systems
Pavement Technologies (PT) – Up to 20 Points
PT‐1 Long‐Life Pavement 5 Design pavements for long‐life PT‐2 Permeable Pavement 3 Use permeable pavement as a LID technique PT‐3 Warm Mix Asphalt (WMA) 3 Use WMA in place of HMA PT‐4 Cool Pavement 5 Contribute less to urban heat island effect (UHI) PT‐5 Quiet Pavement 2‐3 Use a quiet pavement to reduce noise PT‐6 Pavement Performance Tracking 1 Relate construction to performance data
Custom Credits (CC) – Available for all projects based on context and innovation, subject to approval
CC‐1 Custom Credit 1 1‐5 Design a new voluntary credit CC‐2 Custom Credit 2 1‐5 Design a new voluntary credit
Greenroads Total Points: 118

Greenroads™ Manual v1.5 Background
University of Washington © 2011
BACKGROUND WHAT WE MEAN BY “SUSTAINABILITY” While many of the definitions offered by other authors or political groups address the three central and well‐recognized themes of sustainability (ecology, economy and equity, a.k.a. the “triple bottom line”), none of these definitions are directly actionable at a project level and are of little utility when considering sustainability from the perspective of a transportation designer or contractor. This is for two particular reasons: 1) lack of project‐level context and specific tangible constraints, and 2) lack of incentive or drivers to progress sustainability in a meaningful way.
However, three key broader ideas are consistent in most of the definitions: physical constraints or laws of Nature (natural laws), satisfaction of basic human needs and desires (human values), and the idea that roadway projects are best perceived as systems of varying degrees of complexity, interdependence, scale and context. These three terms are clarified in detail below.
A useful, implementable definition of sustainability for roadway projects must feature these three terms because these ideas are simple to understand and explain to project stakeholders. Importantly, how well a particular project fits these project‐specific natural law and human value constraints is a characteristic or trait of that system that is measurable (in terms of quantity and/or quality). This means sustainability on one roadway project can be compared to other roadway projects, and ultimately, sustainability becomes manageable on both short‐ and long‐term time scales. Therefore, sustainability is a characteristic of a system that reflects its capacity to support natural laws and human values.1
This definition is essentially compatible with other definitions of sustainability or sustainable development, such as that provided by the Brundtland Commission2 and ideas featured in reports and international policy documents such as the Millennium Ecosystem Assessment3 and “Agenda 21”4. Note that processes (practices) are part of systems as well; that they are inclusive in the above definition of sustainability, but are not explicitly included in the definition for brevity and simplicity.
NATURAL LAWS
“Natural laws” encompass the essential idea of Ecology, which is the study of ecosystems. These concepts are illustrated by the simple, but oxymoronic idea that ecosystems are too complex to be fully controlled or understood by humans, and that our best control and understanding comes from basic sciences like physics, chemistry and biology. Effectively, mathematics and sciences are the tools by which we measure the limits and current status of our environment. These natural laws form the physical constraints within which all projects must fit, regardless of how much control we think we may have over our own environment as humans or how complete or certain the science is perceived to be.
1 Anderson, J. L. (2008). Sustainability in civil engineering. Thesis (M.S.C.E.)‐‐University of Washington, 2008. 2 United Nations General Assembly, 42nd Session. (1987, August 4). Report of the World Commission on Environment and Development (WCED): “Our Common Future.” (A/42/427). Annex to Official Record. Geneva, Switzerland, 1987. (Masthead). 3 Millennium Ecosystem Assessment (MEA), (2005). Ecosystems and Human Well‐being: Synthesis. Island Press, Washington, DC. 4 United Nations Conference on Environment and Development (UNCED), Rio de Janeiro, 3‐14 June 1992. (1993, January 1). Report on the United Nations Conference on Environment and Development: “Agenda 21.” (A/CONF.151/26/REV.1[VOL.I] and Corrigendum). Vol. I., Annex II to Resolutions Adopted by the Conference. New York, 1993. (Masthead).
WHAT IS SUSTAINABILITY?
Sustainability is a characteristic of a system that reflects its
capacity to support natural laws and human values.
17

Background Greenroads™ Manual v1.5
University of Washington © 2011
We�must�understand�that�our�conventional�understanding�of�natural�laws�is�at�best�incomplete�and�at�worst�could�be�totally�wrong.�Humans�live�and�operate�within�the�context�of�ecosystems,�not�vice�versa�(as�indicated�by�current�trends�in�civil�development).�The�paradigm�in�which�we�live,�operate�and�behave�must�therefore�shift�to�a�more�sustainable�one�under�our�best�possible�and�most�current�understanding�of�ecology,�such�as�that�proposed�by�The�Natural�Step�framework,�which�offers�a�system�based�approach�to�sustainability�guided�by�three�basic�principles5,6�as�follows:�
� Substances�should�not�be�extracted�from�the�Earth�at�a�rate�faster�than�they�can�be�regenerated�by�natural�processes.�
� Substances�(waste)�should�not�be�produced�at�rate�faster�than�they�can�be�decomposed�and�reintegrated�into�an�ecosystem.�
� Ecosystems�should�not�be�systematically�degraded�or�otherwise�disrupted�from�equilibrium�by�human�activities.�
Conventional�roadway�design�and�construction�practices�and�systems�do�not�support�these�three�above�principles�consistently;�however,�a�significant�amount�of�academic�and�industry�research�in�a�variety�of�fields�indicates�that�they�can.�
HUMAN VALUES
Similarly,�“human�values”�(basically�Robèrt’s�fourth�principle)�include�both�equity�and�economy.��Equity�can�be�broadly�understood�as�seeking�quality�of�life�for�all:�ultimately�this�means�satisfaction�of�basic�human�needs�within�a�specific�cultural�context.�Human�needs�have�been�well�studied�in�psychology�and�social�sciences.�The�most�prevalent�ideas�regarding�human�needs�can�be�defined�by�either�a�hierarchical�model,�such�as�that�proposed�by�Maslow7�or�a�taxonomic�model.�Maslow�identified�physiological�needs,�safety,�belonging,�esteem�and�self�actualization�as�tiers�of�needs.�Max�Neef�et�al.8�identified�nine�unique�needs�that�vary�according�to�the�process�by�which�they�are�satisfied�(being,�having,�doing,�and�interacting):�subsistence,�protection,�affection�understanding,�participation,�leisure,�creation,�identity,�and�freedom.�For�the�sustainability�purposes,�either�psychological�model�is�fitting�to�best�illustrate�the�idea�of�human�values.�The�basic�idea�is�that�all�humans�have�the�same�needs,�the�value�of�these�needs�can�change�with�time,�and�there�is�a�wide�variety�and�varying�degree�to�which�needs�are�satisfied�and�managed�in�different�communities�and�cultures.9�
There�are�a�number�of�tradeoffs�that�occur�when�meeting�more�than�one�need�simultaneously.�These�societal�constraints,�including�regulations�and�policy,�govern�the�idea�of�Economy,�which�means,�simply,�management�of�financial,�natural,�manufactured,�and�human�capital�resources.10,11�The�concept�of�economy�can�be�scaled�down�to�apply�to�project�level�financial�choices�or�scaled�up�to�more�broad�practices�of�resource�management�such�as�sustainable�forestry,�waste�management�or�carbon�cap�and�trade�arrangements.�Again,�however,�conventional�roadway�design�and�construction�practice�does�not�support�these�needs,�or�address�their�dynamics�and�management,�consistently�on�all�projects.�
�����������������������������������������������������������������5�Robèrt,�K.��H.�(2000).�Tools�and�concepts�for�sustainable�development,�how�do�they�relate�to�a�general�framework�for�sustainable�development,�and�to�each�other?�Journal�of�Cleaner�Production.�8(3),�243�254.�6�Robèrt,�K.��H.�(2002).�The�natural�step�story:�seeding�a�quiet�revolution.�Gabriola�Island,�BC:�New�Society�Publishers.�7�Maslow,�A.H.�(1943).�A�theory�of�human�motivations.�Psychological�Review.�50(4),�370�396.�8�Max�Neef.�M.A.;�Elizalde,�A.�and�Hopenhayn,�H.�(1991).�Human�scale�development:�conception,�application�and�further�reflections.�New�York:�The�Apex�Press.�9�Fisher,�K.J.�(2000).�A�wealth�of�notions:�reflective�engagement�in�the�emancipator�teaching�and�learning�of�economics.�Unpublished�doctoral�dissertation,�University�of�Western�Sydney,�Richmond.�10�Hawken,�P.;��Lovins,�A.B.�and�Lovins,�L.H.�(1999).�Natural�capitalism:�creating�the�next�industrial�revolution�(1st�ed.).�Boston,�MA:�Little�Brown�and�Co.�11�Goodland,�R.�(1993).�International�Association�of�Impact�Assessment�(IAIA)�Newsletter�5�(2).�
18

Greenroads™ Manual v1.5 Background
University of Washington © 2011
SYSTEMS AND SUSTAINABILITY
Clearly,�a�systems�based�approach�to�sustainability�renders�a�definition�that�includes�only�Ecology,�Equity,�and�Economy�incomplete.�In�addition�to�these�components,�sustainability�is�context�sensitive.�Specifically,�a�roadway�project�system’s�context�is�sensitive�to�whatever�human�needs�and�values�are�defined�by�the�management�team�and�stakeholders�and�its�environmental�setting.�These�are�the�constraints,�or�boundaries,�within�which�project�decisions�must�be�made.�Therefore,�two�more�critical�sustainability�components,�extent�and�expectations,�are�identified.12�These�two�components�act�as�the�system�boundaries,�providing�scope�and�context�to�sustainability.��
Extent�represents�the�idea�that�a�project�system�has�well�defined�constraints�and�limits�within�which�sustainability�can�be�measured.�Extent�refers�to�spatial�and�temporal�constraints�of�civil�projects�(such�as�centerline�length,�right�of�way�dimensions,�footprint,�and�service�life,�respectively)�often�explicitly�defined�by�natural�laws�(such�as�how�gravity�ultimately�defines�load�limits).�Some�other�practical�examples�of�extent�are�height�restrictions�and�construction�working�hours.��
Performance�criteria,�or�Expectations,�are�the�key�human�value�constraints�identified�for�the�project.�Expectations�provide�the�equity�and�economic�context�within�which�the�overall�performance�of�the�system�is�most�effectively�judged.�Expectations�vary�by�project�and�may�include�practical�performance�of�the�individual�design�elements,�overall�quality�of�the�construction�processes�of�a�project,�or�system�wide�outcomes�like�reduced�accidents�or�improved�worker�productivity.��
While�the�ideas�of�Extent�and�Expectations�may�be�implicit�(or�presumed�to�be�understood)�in�the�preceding�descriptions�of�natural�laws�and�human�values,�there�is�no�reason�for�them�not�to�be�explicitly�stated�in�working�definition�of�sustainability.�In�fact,�without�explicitly�stating�these�components,�it�is�more�likely�that�misunderstandings�of�these�critical�limits,�boundaries,�and�constraints�would�occur,�or�that�their�impacts�and�importance�would�be�ignored�or�downplayed.�
Furthermore,�it�is�not�enough�to�believe�that�the�idea�of�sustainability�will�self�propagate�and�implement�its�own�paradigm�shift�toward�more�sustainable�systems�and�practices.�Thus,�the�final�two�important�components�of�sustainability,�Experience�and�Exposure,�translate�the�philosophical�concept�of�sustainability�into�implementable�practices.�Experience�represents�both�what�has�been�learned�and�the�learning�process�itself,�which�is�ongoing.�So,�experience�includes�technical�expertise,�innovation,�and�knowledge�of�applicable�historical�information,�which�is�critical�in�decision�making�processes.�For�example,�most�successful�project�teams�are�comprised�of�interdisciplinary�experts�that�can�bring�specialized�experience�to�design�or�construction.��
Finally,�if�the�concept�of�sustainability�is�to�cause�a�paradigm�shift�in�individual,�community�and�societal�behavior�then�it�must�include�an�active�educational�component;�or�more�specifically,�a�teaching�or�outreach�component.�Exposure�represents�the�idea�that�implementing�sustainability�in�practice�requires�ongoing�educational�and�awareness�programs�for�the�general�public,�professionals,�agencies,�and�stakeholders.�Therefore,�experience�and�exposure�drive�the�progress�and�implementation�of�sustainability�within�a�project�system.�Without�these�two�driving�components,�civil�engineering�systems�would�remain�static,�and�sustainability�would�be�absent,�unmanageable�or�simply�unrecognized.�
�
�����������������������������������������������������������������12�Anderson,�J.�L.�(2008).�Sustainability�in�civil�engineering.�Thesis�(M.S.C.E.)��University�of�Washington,�2008.�
7 E’S OF SUSTAINABILITY
Ecology�Equity�
Economy�Extent�
Expectations�Experience�Exposure�
19

Background Greenroads™ Manual v1.5
University of Washington © 2011
GREENROADS BENEFITS There�are�particular�sustainability�related�benefits�associated�with�Project�Requirements�and�Voluntary�Credits.�These�roughly�correlate�with�the�ideas�of�“natural�laws”�and�“human�values”�that�were�outlined�in�the�preceding�sections.�Greenroads�identifies�these�benefits�for�each�Project�Requirements�and�Voluntary�Credit�making�it�easier�to�at�least�list,�if�not�exactly�quantify,�the�benefits�associated�with�Greenroads�certification.�These�benefits�are:�
Primarily�Eco�centric�Benefits
� Reduces�Raw�Materials�Use�� Reduces�Fossil�Fuel�Use�� Creates�Energy�� Reduces�Water�Use�� Reduces�Air�Emissions�� Reduces�Greenhouse�Gases�� Reduces�Water�Pollution�� Reduces�Solid�Waste�� Restores�Habitat�� Creates�Habitat�� Reduces�Manmade�Footprint�
Primarily Anthropocentric�Benefits�
� Improves�Access�� Improves�Mobility��� Increases�Service�Life�� Improves�Human�Health�&�Safety�� Improves�Local�Economies�� Reduces�First�Costs�� Reduces�Lifecycle�Costs�� Improves�Accountability�� Increases�Awareness�� Increases�Aesthetics�� Creates�New�Information�
We�have�listed�these,�along�with�each�of�the�sustainability�components�addressed,�on�the�front�page�of�each�PR�and�VC,�so�that�it�is�easy�to�identify�what�is�being�addressed�by�acting�on�that�PR�or�VC.�This�feature�of�the�Manual�may�be�particularly�helpful�for�agencies�or�project�teams�that�have�predefined�sustainability�goals,�values�or�internal�benchmarks�to�meet.��
Note�that�in�the�previous�version�of�the�Greenroads�Manual�we�had�made�16�benefits�explicit:�now�there�are�22.�Based�on�feedback�from�users�and�also�our�students�at�the�University�of�Washington,�we�broke�apart�these�16�benefits�somewhat�and�changed�the�wording�used�to�better�reflect�what�we�mean�by�“sustainability�benefit”�in�terms�that�are�more�commonly�understood�to�transportation�professionals.�We�also�have�tried�to�identify�them�as�being�primarily�eco�centric�or�anthropocentric�but�we�recognize�this�may�be�debatable�in�some,�if�not�all,�instances.�(See�Other�Notes�on�the�following�pages�for�more�commentary.)�
TRACING GREENROADS PRACTICES TO SUSTAINABILITY AND BENEFITS
Each�Greenroads�Project�Requirement�and�Voluntary�Credit�can�be�traced�back�to�at�least�one�relevant�sustainability�component�and�one�relevant�benefit;�most�can�be�traced�to�several.�We�call�this�“mapping”,�and�believe�it�is�important�because�it�provides�the�basis�by�which�a�Greenroads�Project�Requirement�or�Voluntary�Credit�can�be�considered�to�contribute�to�“sustainability”�and�provide�benefits�as�Greenroads�defines�them.�This�mapping�involves�subjective�judgment�as�to�which�components�and�which�benefits�map�to�which�items.�While�elimination�of�this�subjectivity�would�be�ideal,�more�complex�systems�for�mapping�would�likely�just�conceal�rather�than�eliminate�this�subjectivity.�
Mapping�of�an�item�back�to�sustainability�and�benefits�is�done,�where�practical,�using�empirical�evidence�with�proper�citations.�The�goal�is�to�create�a�metric�where�each�Project�Requirement�and�Voluntary�Credit�is,�to�the�extent�possible,�shown�through�existing�research�to�have�an�impact�on�sustainability.�
This�mapping�can�assist�in�selecting�Voluntary�Credits�to�pursue�based�on�user�values�or�desired�benefits.�Importantly,�the�nature�of�sustainability�requires�users�to�make�trade�offs�between�different�aspects�of�sustainability.�For�instance,�one�might�have�to�select�between�using�recycled�material�that�must�be�trucked�over�a�long�distance�or�using�locally�provided�virgin�material.�Both�concepts�(recycled�material,�local�material)�relate�to�sustainability�(e.g.,�ecology�and�economy)�however�only�one�can�be�chosen.��
20

Greenroads™ Manual v1.5 Background
University of Washington © 2011
Decisions�regarding�these�types�of�trade�offs�are�likely�to�be�at�least�partly,�if�not�wholly,�based�on�the�values�held�by�a�project,�which�is�a�conglomeration�of�values�held�by�its�stakeholders,�owners,�designers�and�constructors.�Since�these�values�are�not�likely�to�be�identical�between�projects,�over�time�or�between�stakeholders,�one�predetermined�set�of�values�included�in�a�performance�metric�is�probably�not�wise.�Rather,�Greenroads�allows�users�to�choose�from�a�long�list�of�Voluntary�Credits�based�on�their�values.�Mapping�to�sustainability�components�is�done�because�users�may�find�it�more�straightforward�to�choose�between�resources�rather�than�Greenroads�Voluntary�Credits.�For�instance,�it�may�be�difficult�to�choose�between�warm�mix�asphalt�and�porous�pavement�unless�a�technical�expert�is�consulted�to�fully�explain�each�item.�However,�it�may�be�easier�to�choose�between�the�benefits�they�offer.��
OTHER NOTES
1. Additionally,�it�is�useful�to�note�that�several�benefits�may�be�directly�quantifiable�while�others�are�more�likely�to�be�indirect�benefits.�Where�possible,�this�is�discussed�in�the�supporting�research�for�each�credit�in�the�Manual.�We�recognize�that�this�still�presents�an�incomplete�picture�of�the�benefits�of�sustainability,�but�our�intent�is�to�provide�assistance�in�understanding�a�relatively�new�and�sometimes�complex�idea.�
2. Also,�it�would�be�remiss�of�us�not�to�note�that�any�ecological�benefit�is�also�a�human�benefit�since�our�environment�is�fundamentally�what�supports�us�as�living�beings�and�impacts�our�quality�of�life.�Similarly,�sometimes�there�is�beneficial�interaction�between�these�benefits�where�humans�can�impact�the�quality�of�non�human�life�in�a�positive�way.�For�example,�pursuing�Credit�EW�7�Ecological�Connectivity�can�improve�mobility�and�access�for�both�humans�and�wildlife�simultaneously,�while�achieving�a�number�of�the�other�benefits�also�listed�above.�
3. Finally,�we�recognize�that�reduction�of�greenhouse�gases�is�a�key�goal�of�many�agencies.�This�level�of�specificity,�since�they�are�a�type�of�air�pollution,�correlates�directly�with�the�benefit�of�“reduced�air�emissions”�and�“reduced�fossil�fuel�use.”�We�felt�it�was�useful�to�provide�this�added�specificity�in�light�of�current�state�and�federal�policy�goals.�
�
21

Background Greenroads™ Manual v1.5
University of Washington © 2011
HOW GREENROADS IS WEIGHTED The�overall�goal�of�weighting�is�to�make�each�Voluntary�Credit’s�point�value�commensurate�with�its�impact�on�sustainability.�This�cannot�be�achieved�by�a�strictly�objective�or�empirical�approach�because:���
� Some�sustainability�components�are�difficult�to�directly�compare�because�there�is�no�generally�accepted�metric�of�comparison�(e.g.,�comparing�scenic�views�to�stormwater�treatment).��
� Traditionally�accepted�quantitative�methods,�e.g.,�lifecycle�assessment�(LCA),�lifecycle�cost�analysis�(LCCA),�benefit�cost�analysis,�do�not�adequately�address�all�sustainability�components.�
� Greenroads�is�designed�to�function�as�a�supplement�to�current�U.S.�regulations.�Therefore,�some�areas�that�might�otherwise�have�been�heavily�weighted�receive�less�emphasis�in�Greenroads�because�current�U.S.�regulation�already�requires�many�mandatory�actions�leaving�little�room�for�supplemental�voluntary�actions.�
� There�are�some�actions�for�which�the�direct�impact�on�sustainability�may�be�difficult�or�impossible�to�measure,�however�their�execution�may�provide�valuable�information�on�which�to�base�future�decisions.��
Weighting�follows�the�general�framework�described�here.�As�a�beginning�point,�we�established�a�minimum�value�of�one�point�and�a�maximum�value�of�five�points.�This�range�allows�weights�to�reflect�a�range�of�sustainability�impact�but�limits�the�impact�of�potential�missteps.�Individual�construction�activities�during�initial�construction�have�the�lowest�impact�(see�discussion�later)�on�sustainability�so�we�start�by�assigning�these�Voluntary�Credits�one�point�each.�From�here�Voluntary�Credit�point�values�are�modified�based�on�the�logic�presented�next.�Importantly,�weights�are�based�on�the�relationship�of�their�associated�prevailing�broad�concepts�while�the�actual�level�of�achievement�necessary�to�qualify�for�a�Voluntary�Credit�is�based�on�an�assessment�of�what�is�practically�achievable�given�current�technology�and�practice.�The�goal�is�to�make�the�level�of�achievement�beyond�current�practice�but�enticingly�attainable�using�current�technology.�Using�this�logic,�it�follows�that�as�the�industry’s�sustainability�savvy�grows�and�technology�advances�Voluntary�Credit�requirements�must�change.�The�following�sections�discuss�weighting�details�for�the�system.�The�figure�below�shows�the�weights�of�the�categories�(without�Custom�Credits).�
�Figure�I.5:�Graph�showing�the�distribution�of�Voluntary�Credit�points�(by�percentage�of�the�total)�
�in�each�of�the�5�categories.�
22

Greenroads™ Manual v1.5 Background
University of Washington © 2011
ECOLOGY WEIGHTING
While�it�is�difficult�to�place�a�value�on�ecosystem�services,�some�researchers�have�tried.�One�effort13��valued�them�at�US$16�54�trillion/yr�with�a�mean�of�US$33�trillion/yr�for�17�ecosystem�services�(in�1994�US�dollars).�This�compares�to�a�world�gross�national�product�(GNP)�of�US$18�trillion�(1994�US�dollars)�making�ecosystem�services�about�1.8�times�the�global�GNP�if�the�mean�value�is�assumed.�This�effort�acknowledges�that�the�estimate�is�on�the�low�side,�incomplete�and�flawed�but�reason�that�some�estimate�is�better�than�none.�Based�on�this,�we�estimate�the�value�of�ecosystems�as�about�three�times�the�value�of�human�economic�systems�(represented�by�the�baseline�value�of�one�point)�for�the�purposes�of�weighting�Voluntary�Credits.�This�uses�the�high�end�estimate�(US$54�trillion)�to�at�least�partially�account�for�their�admitted�underestimation.�From�this,�we�assign�EW�2,�EW�3,�EW�5,�EW�6,�EW�7,�EW�8�and�PT�2�three�points�each�because�they�are�primarily�concerned�with�ecosystem�services.��
EQUITY WEIGHTING
Equity,�as�it�is�reflected�in�Greenroads�can�primarily�be�addressed�by�portions�of�what�is�commonly�called�context�sensitive�design�(CSD)�or�context�sensitive�solutions�(CSS).�To�our�knowledge,�nobody�has�attempted�to�place�a�monetary�value�on�CSD/CSS�however,�there�is�substantial�evidence�suggesting�that�it�has�come�to�be�viewed�as�an�important�if�not�the�essential�component�in�U.S.�roadway�design�over�the�last�decade.�While�CSD/CSS�also�includes�ecological�elements,�its�strength�lies�in�its�approach�to�identifying�and�involving�stakeholders�and�reflecting�community�values�in�a�project�(the�equity�component�of�sustainability).�While�CSD/CSS�provides�evidence�of�equity’s�importance�it�does�not�provide�any�insight�regarding�its�level�of�importance�in�relation�to�other�sustainability�components.�In�fact,�it�argues�that�such�value�is�context�sensitive.�We�believe�that�the�U.S.�move�towards�CSD/CSS�and�its�emphasis�on�a�collaborative�community�based�approach�to�design�(versus�a�strictly�low�cost�standards�based�approach)�shows�that�equity�issues�ought�to�be�valued�more�than�the�minimum�of�one�point.�As�a�first�order�approximation,�we�assign�equity�Voluntary�Credits�two�points.�Based�on�this�we�assign�AE�1,�AE�5,�AE�6,�AE�8,�AE�9�two�points�each�because�they�are�primarily�concerned�with�equity�issues.�We�assign�AE�3�the�maximum�of�five�points�because�it�actually�gives�credit�for�a�CSD/CSS�approach,�while�the�other�AE�Voluntary�Credits�address�outcomes�of�a�CSD/CSS�approach.��
LIFECYCLE ASSESSMENT (LCA) BASED WEIGHTING
For�Voluntary�Credits�dealing�with�materials�production,�construction,�transportation�associated�with�the�construction�process�and�traffic�use,�weighting�is�based�on�lifecycle�assessment�(LCA)�results�to�the�greatest�possible�extent.�Since�Greenroads�is�meant�to�apply�to�any�roadway�project,�LCA�results�specific�to�a�particular�project�cannot�be�used�alone�because�they�are�project�specific�and�not�entirely�transferrable.�However,�examining�a�range�of�specific�LCAs�may�provide�insight�into�some�general�trends�that�could�be�used�to�weight�Voluntary�Credits.��We�identified�12�roadway�LCA�peer�reviewed�journal�papers�consisting�of�43�assessments�of�either�actual�or�hypothetical�roadways.14��Five�papers�addressed�PCC�pavements�(10�assessments),�while�all�12�address�HMA�pavements�(34�assessments).�Some�general�trends�observed�were:��
�����������������������������������������������������������������13�Costanza,�R.,�d’Arge,�R.,�de�Groot,�R.,�Farber,�S.,�Grasso,�M.,�Hannon,�B.,�Limburg,�K.,�Naeem,�S.,�O’Neill,�R.V.,�Paruelo,�J.,�Raskin,�R.G.,�Sutton,�P.,�van�den�Belt,�M.,�(1997).�The�value�of�the�world’s�ecosystem�services�and�natural�capital.�Nat.,�387,�253�260.�14�These�papers�are:�Stripple,�H.�Life�Cycle�Inventory�of�Asphalt�Pavements.�IVL�Swedish�Environmental�research�Institute�Ltd�report�for�
the�European�Asphalt�Pavement�Association�(EAPA)�and�Eurobitume,�2000.��Stripple,�H.�Life�Cycle�Assessment�of�Road:�A�Pilot�Study�for�Inventory�Analysis,�Second�Revised�Edition.�IVL�Swedish�
Environmental�Research�Institute�Ltd�report�for�the�Swedish�National�Road�Administration,�2001.��Mroueh,�U�M,�Eskola,�P.,�Laine�Ylijoki,�J.,�Life�cycle�impacts�of�the�use�of�industrial�by�products�in�road�and�earth�
construction.�Waste�Management�21,�2001,�pp.�271�277.��Treloar,�G.J.;�Love,�P.E.D.�and�Crawford,�R.H.�Hybrid�Life�Cycle�Inventory�for�Road�Construction�and�Use,�J.�of�Const.�
Engr.�and�Mgmt.�130(1),�2004,�pp.�43�49.��
23

Background Greenroads™ Manual v1.5
University of Washington © 2011
� Energy�use�and�emissions�for�construction�followed�the�same�basic�trends�in�most�studies.�Some�general�rules�of�thumb�we�found�were:�
� Materials�production�has�20�times�the�impact�of�construction.�� Transportation�(of�materials)�has�5�times�the�impact�of�construction.�� Maintenance�has�1/3�the�impact�of�initial�construction.�
� For�the�one�study�that�quantified�them,�roadway�operations�(e.g.,�lighting,�signals,�etc.)�over�40�years�had�about�the�same�energy�use�as�all�construction�activities�(initial�construction�plus�maintenance).���
� For�the�two�studies�that�related�them,�the�energy�expended�in�initial�construction�of�a�new�roadway�is�roughly�equivalent�to�the�energy�used�by�traffic�on�the�facility�over�1�2�years.��
Based�on�these�ideas,�the�following�weighting�is�used:�
� Operations�vs.�construction:�MR�6�is�assigned�5�points.�� Traffic�use�vs.�initial�construction:�AE�2,�AE�4,�and�AE�7�are�assigned�5�points�each.���� Transportation�associated�with�construction:�MR�5�is�assigned�5�points.�� Materials�production:�MR�2�and�MR�4�are�assigned�up�to�5�points�each.�MR�3�is�assigned�1�point�and�PT�3�
is�assigned�3�points.�
INCENTIVE-BASED WEIGHTING
Some�Voluntary�Credits�are�assigned�additional�points�to�provide�incentive�to�collect�data,�undertake�organization�wide�efforts�and�obtain�high�achievement�levels.�Generally,�higher�levels�of�achievement�will�correlate�to�incorporating�a�number�of�other�voluntary�activities�that�may�be�reflected�in�other�credits�too.�The�following�Voluntary�Credits�use�incentive�based�weighting:�EW�1,�EW�2,�EW�3,�EW�5,�AE�1,�AE�2,�AE�5,�AE�6,�AE�7,�CA�1,�CA�4,�CA�5,�CA�7,�MR�1,�MR�2,�MR�4,�MR�5�and�PT�5.�
DEVELOPED AREA WEIGHTING
The�Urban�Heat�Island�(UHI)�effect�is�“…a�measurable�increase�in�ambient�urban�air�temperatures�resulting�primarily�from�the�replacement�of�vegetation�with�buildings,�roads,�and�other�heat�absorbing�infrastructure.”15�UHI�can�impact�sustainability�by�increasing�energy�consumption,�and�related�emissions�and�affecting�human�health�
���������������������������������������������������������������������������������������������������������������������������������������������������������������������������������������������������������������13(cont.)�Zapata,�P.,�Gambatese,�J.A.,�Energy�Consumption�of�Asphalt�and�Reinforced�Concrete�Pavement�Materials�and�
Construction.�J.�of�Infrastructure�Systems�11(1),�2005,�pp.�9�20.��Rajendran,�S.,�Gambatese,�J.A.�Solid�Waste�Generation�in�Asphalt�and�Reinforced�Concrete�Roadway�Life�Cycles.�J.�
of�Infrastructure�Systems�13(2),�2005,�pp.�88�96.��Athena�Institute.�A�Life�Cycle�Perspective�on�Concrete�and�Asphalt�Roadways:�Embodied�Primary�Energy�and�Global�
Warming�Potential.�Report�to�the�Cement�Association�of�Canada,�2006.��Tramore�House�Regional�Design�Office.�Integration�of�the�Measurement�of�Energy�Usage�into�Road�Design.�Rept.�to�
the�Commission�of�the�European�D�G�for�Energy�and�Transport.�Project�Number�4.1031/Z/02�091/2002,�2006.��Weiland,�C.D.�Life�Cycle�Assessment�of�Portland�Cement�Concrete�Interstate�Highway�Rehabilitation�and�
Replacement.�Master’s�Thesis,�University�of�Washington,�Seattle,�WA,�2008.��Chui,�C�T.,�Hsu,�T�H.,�Yang,�W�F.�Life�cycle�assessment�on�using�recycled�materials�for�rehabilitating�asphalt�
pavements.�Resources,�Conservation�and�Recycling�52,�2008,�pp.�545��556.��Huang,�Y.,�Bird,�R.,�Bell,�M.�A�comparative�study�of�the�emissions�by�road�maintenance�works�and�the�disrupted�
traffic�using�life�cycle�assessment�and�micro�simulation.�Transportation�Research�Part�D�14,�2009,�pp.�197�204.��Huang,�Y.,�Bird,�R.,�Heidrich,�O.�Development�of�a�life�cycle�assessment�tool�for�construction�and�maintenance�of�
asphalt�pavements.�J.�of�Cleaner�Production�17,�2009,�pp.�283�296.��15�U.S.�Environmental�Protection�Agency�(EPA).�Heat�Island�Effect�website.�[http://www.epa.gov/hiri]�Accessed�9�June�2009.�
24

Greenroads™ Manual v1.5 Background
University of Washington © 2011
and�water�quality.�Based�on�research�from�the�Lawrence�Berkeley�National�Laboratory16�a�gross�approximation�is�that�road�pavements�constitute�about�one�quarter�the�total�surface�area�contributing�to�the�UHI.�From�this�PT�4�is�assigned�5�points.�This�weighting�is�also�consistent�with�other�concerns�that�are�relevant�in�urban�areas:�AE�4�and�MR�6.�
DURABILITY WEIGHTING
Long�life�pavement�generally�results�in�lower�lifecycle�costs,�less�material�and�fewer�traffic�interruptions�over�the�lifecycle�of�a�pavement.�While�more�work�needs�to�be�done�in�quantifying�these�reductions,�a�value�for�PT�1�can�be�attempted�by�drawing�the�link�between�less�material�and�fewer�traffic�interruptions�to�less�energy�and�lower�emissions.�PT�1�is�assigned�5�points.��
AESTHETIC WEIGHTING
One�study17�investigated�different�monetization�approaches�for�the�health�impacts�from�road�noise.�From�their�work�we�assign�noise�one�third�the�impact�of�traffic�related�emissions.�Since�tire�pavement�noise�is�the�predominant�source�or�road�noise�above�about�50�km/hr�(for�automobiles)�a�change�in�tire�pavement�noise�resulting�from�so�called�“quieter�pavement”�use�is�about�one�third�as�impactful�as�actions�resulting�in�traffic�related�emissions�reduction.�Noise�reduction�characteristics�of�quieter�pavements�tend�to�diminish�over�time.�PT�5�is�assigned�2�to�3�points.�This�correlates�with�EW�8,�which�is�also�assigned�3�points�and�addresses�glare�other�unwanted�light�emissions.�
� �
�����������������������������������������������������������������16�Rose,�L.S.,�H.�Akbari,�and�H.�Taha.�2003.�Characterizing�the�Fabric�of�the�Urban�Environment:�A�Case�Study�of�Greater�Houston,�Texas.�Paper�LBNL�51448.�Lawrence�Berkeley�National�Laboratory,�Berkeley,�CA.�17�Hofstetter,�P.,�Müller�Wenk,�R.,�2005.�Monetization�of�health�damages�from�road�noise�with�implications�for�monetizing�health�impacts�in�life�cycle�assessment.�J.�of�Clean.�Production�13,�1235�1245.�
25

Background Greenroads™ Manual v1.5
University of Washington © 2011
�
26

Greenroads Manual v1.5 © 2011
�
�
�
�
�
�
PROJECT REQUIREMENTS
27

Greenroads Manual v1.5 © 2011
� �
28

Greenroads™ Manual v1.5 Project Requirements
PR-1 Environmental Review Process
ENVIRONMENTAL REVIEW PROCESS GOAL Evaluate�impacts�of�roadway�projects�through�an�informed�decision�making�process.�
REQUIREMENTS Perform�and�document�a�comprehensive�environmental�review�of�the�roadway�project.�This�review�should�clearly�and�concisely�document:�
1. Project�name�and�location.�2. Names�and�contact�information�of�key�players�in�the�decision�making�process,�
including�(but�not�limited�to):�the�owner�agency,�agency�representatives�responsible�for�completing�the�environmental�review�process,�other�stakeholders,�and�relevant�professionals�involved.�
3. Intent�and�purpose�of�the�roadway�project.�4. Descriptions�of�potential�environmental,�economic�and�social�impacts�of�the�
intended�roadway�project.�5. Detailed�descriptions�of�the�extent�of�the�significance�of�these�impacts�with�respect�
to�the�decision�making�process�and�feasible�performance�expectations.�6. Description�of�the�public�involvement�opportunity�in�the�environmental�review�
process;�document�this�opportunity�and�the�results�of�input�in�the�final�decisions.�7. Any�jurisdictional�requirements�for�more�detailed�environmental�review�documents�
such�as�environmental�impact�statements�(EIS)�or�environmental�assessments�(EA)�to�determine�the�significance�of�environmental�impacts.�
8. Description�of�the�final�environmental�decisions�made.�
Details
An�environmental�review�process�is�a�method�of�decision�making�used�in�project�development.�The�basic�intent�of�the�process�is�to�promote�informed�decision�making�by�explaining�the�project�in�a�comprehensive,�concise�and�understandable�way.�This�explanation�involves�an�evaluation�of�environmental,�social�and�economic�impacts�in�order�to�meet�existing�regulations�and�public�stakeholder�needs.�These�impacts,�regulations,�and�needs�shape�basic�decision�criteria,�vary�significantly�in�complexity�between�projects,�and�dictate�the�effort�required�during�the�review�process�and�project�implementation.�The�National�Environmental�Policy�Act�(NEPA)�provides�formal�guidelines�for�federally�funded�roadway�projects,�and�many�states�have�environmental�review�processes�similar�to�NEPA.�
DOCUMENTATION � Copy�of�the�final�decision�document�that�demonstrates�an�environmental�review�
process�has�been�completed�for�the�project,�with�all�appropriate�agency�or�jurisdiction�representative�signatures.�Any�of�the�following�documents�will�suffice:�
� Executive�summary�of�the�EA�or�EIS,�the�Record�of�Decision�(ROD)�or�Finding�of�No�Significant�Impact�(FONSI),�or�jurisdiction�equivalent�of�these�documents.�
� Completed�copy�of�the�Washington�State�Department�of�Ecology�State�Environmental�Policy�Act�(SEPA)�Checklist�(or�local�equivalent).�Note:�Do�this�if�the�project�is�exempt�from�a�formal�environmental�review�or�is�classified�as�a�“categorical�exclusion”�(CE).�
PR-1
REQUIRED
RELATED CREDITS
� PR�2�Lifecycle�Cost�Analysis�
� PR�3�Lifecycle�Inventory�
� AE�3�Context�Sensitive�Solutions�
� MR�1�Lifecycle�Assessment�
SUSTAINABILITY COMPONENTS
� Ecology�� Expectations�� Exposure�
BENEFITS
� Reduces�Air�Emissions�
� Reduces�Water�Pollution�
� Reduces�Solid�Waste� Improves�Human�
Health�&�Safety�� Improves�
Accountability�� Increases�Awareness� Increases�Aesthetics�
29

Project Requirements Greenroads™ Manual v1.5
Environmental Review Process PR-1
APPROACHES & STRATEGIES
� Check�if�your�state�has�existing�procedures�that�streamline�the�environmental�review�process�specifically�for�roadway�projects.�The�Council�on�Environmental�Quality�(CEQ)�maintains�an�updated�list�of�states�that�are�compliant�here:�http://nepa.gov/nepa/regs/states/states.cfm�
� Identify�opportunities�to�involve�the�public�early�in�the�environmental�review�process.�Usually�this�step�is�most�effective�during�project�planning.�
� Recognize�that�the�environmental�review�process�can�often�be�iterative,�especially�during�planning�and�design�stages�when�alternatives�are�still�subject�to�change.�
� Conduct�a�detailed,�multi�disciplinary�literature�review�at�the�start�of�a�project.�This�review�can�help�identify�existing�extraordinary�circumstances,�such�as�special�wildlife�and�plant�concerns�and�socio�economic�issues.�
� Use�the�checklist�provided�by�the�Washington�state�Department�of�Ecology�State�Environmental�Policy�Act�(SEPA)�as�a�guideline�for�an�environmental�review�process�in�jurisdictions�not�subject�to�NEPA�or�similar�local�or�state�requirements.�This�checklist�is�easy�and�straightforward�and�may�be�completed�to�meet�the�intent�of�this�Project�Requirement.�Note�that�many�states�also�offer�checklists�that�cover�the�same�topics�as�the�Washington�SEPA�checklist,�and�will�also�meet�the�intent�of�this�Project�Requirement.�The�Washington�state�checklist�is�readily�available�and�downloadable�for�immediate�use�here:�http://www.ecy.wa.gov/biblio/ecy05045.html.�
� Make�the�environmental�review�documentation�as�concise�and�comprehensive�as�possible,�while�also�limiting�use�of�professional�jargon.�This�will�create�an�easy�to�read�and�understandable�environmental�review�document�for�decision�makers.�There�are�a�number�of�guidance�documents�available�from�the�CEQ�for�NEPA�documents,�and�individual�states�may�also�have�helpful�resources�available.�These�are�available�from�the�CEQ�here:�http://ceq.hss.doe.gov/nepa/regs/guidance.html��
� For�projects�typically�considered�categorically�exempt,�where�jurisdictional�precedent�has�been�established�for�similar�roadway�projects�in�previous�environmental�review�processes,�complete�the�Washington�state�SEPA�checklist�for�purposes�of�this�requirement.�This�process�will�also�demonstrate�1)�that�the�review�process�has�been�completed�and�all�impacts�have�been�addressed,�and�2)�why�your�project�has�been�determined�a�categorical�exclusion.�
� Follow�Federal�Highway�Administration�(FHWA)�and�Federal�Transit�Authority�(FTA)�guidelines�for�complex,�detailed�and�larger�projects�that�need�to�produce�EIS�reports.�These�guidelines�are�compiled�in�a�straightforward�guidance�document�located�here:�http://www.fhwa.dot.gov/hep/section6002/.�This�document�includes�steps�required�for�the�NEPA�process�and�also�exemplary�project�case�studies�that�meet�the�requirements�for�the�environmental�review�process.��
Example: SEPA Checklists
Projects�not�subject�to�NEPA�or�an�equivalent�local�or�state�policy�for�environmental�review�will�need�to�submit�a�completed�environmental�review�process�checklist�for�purposes�of�this�requirement.�There�are�many�available�from�various�state�agencies�or�Departments�of�Transportation�(DOT),�check�with�your�owner/agency.�Several�examples�of�completed�checklists�are�provided�in�Table�PR�1.1.�
Table�PR�1.1:�Sample�Completed�SEPA�Checklists�Project�Name� Owner Type Where�to�Find�Checklist�SR�509/SR�518�Interchange�Safety�Improvement�Project�
Washington�State�DOT�
Highway�improvement�
http://www.wsdot.wa.gov/NR/rdonlyres/624594AC�5B81�4D62�BA04�2D926347628C/�0/SR518SafetySEPAChecklist.pdf�
2009�AAC�Program�–�Fauntleroy�Way�SW�between�SW�Alaska�St�and�SW�Holly�St�
Seattle�DOT(SDOT)�
Resurfacing http://www.seattle.gov/transportation/docs/SEPAFAUNTLEROY.pdf�
Revised�Aurora�Avenue�North�Transit,�Pedestrian�and�Safety�Improvements�
SDOT,�WSDOT,�FHWA�
Multi�purpose�urban�arterial�improvements�
http://www.seattle.gov/Transportation/docs/aurora/RevAurora_SEPAchecklist_�SigOnFile.pdf�
Eagle�Creek�Road�Improvement�Project��
Chelan�County�
Rural�road�improvements�
http://www.co.chelan.wa.us/pw/data/sepa_checklist.pdf��
30

Greenroads™ Manual v1.5 Project Requirements
PR-1 Environmental Review Process
�Example: Federally Funded Projects and the National Environmental Policy Act (NEPA)
Federally�funded�roadway�projects�are�required�to�use�the�NEPA�(National�Environmental�Policy�Act)�environmental�review�process�(CEQ,�2007).�This�includes�all�roadway�projects�managed�by�the�Federal�Highway�Administration�(FHWA).�
NOTE:�NEPA�clearly�states�that�the�environmental�review�process�does�not�require�that�agencies�or�project�teams�make�final�project�decisions�based�on�any�of�the�environmental�impacts�that�are�studied�or�discovered.�Rather,�the�intent�of�the�NEPA�process�is�to�inform�decision�makers�of�the�potential�effects�of�their�actions�(Caldwell,�1999;�CEQ,�2007).�
The�FHWA,�American�Association�of�State�Highway�Transportation�Officials�(AASHTO)�and�the�American�Council�of�Engineering�Companies�(ACEC)�have�compiled�a�guidance�document�called�Improving�the�Quality�of�Environmental�Documents�that�highlights�several�case�studies�of�exemplary,�easy�to�read�and�comprehensive�NEPA�documents.�A�few�of�those�projects�are�listed�below:�
� Alaskan�Way�Viaduct�and�Seawall�Replacement�Project�(Washington�State�DOT)�� Mon/Fayette�Transportation�Project,�PA�Route�51�to�I�376�(Pennsylvania�Turnpike�Commission)�� Route�Post�13�(I�15)�Interchange�(Utah�DOT)�� Southern�Corridor�(I�15)�(Utah�DOT)�� US�93�Somers�to�Whitefish�(Montana�DOT)�� I�69�Evansville�to�Indianapolis�(Indiana�DOT)�� Mid�Currituck�Sound�Bridge�(North�Carolina�DOT)�
Detailed�information�on�each�project�(and�other�non�roadway�transportation�projects)�is�included�in�the�completed�report�for�the�National�Cooperative�Highway�Research�Program�(NCHRP)�25�25�Task�1�(2005).�This�NCHRP�report�also�contains�descriptions�of�why�these�reports�are�exemplary�of�a�successful�NEPA�process.�
According�to�regulations�updated�in�2001�from�the�FHWA,�many�transportation�projects�for�both�roadways�and�bridges,�specifically�rehabilitation�activities,�are�considered�to�be�categorically�exempt�(CEs)�because�they�have�been�deemed�to�meet�40�CFR�§�1508.4�based�on�past�precedent.�Accordingly,�these�certain�project�types:�
� Do�not�have�significant�environmental,�planned�growth�or�land�use�impacts�� Do�not�need�relocation�of�many�people�� Do�not�have�impact�on�natural,�cultural,�recreational,�or�historic�resources�� Do�not�have�air,�noise,�or�water�quality�impacts�� Do�not�have�significant�impacts�on�travel�patterns�� Do�not,�either�individually�or�cumulatively,�have�any�significant�environmental�impacts�
See�40�CFR�§1508.4�and�23�CFR�§771.117.��For�purposes�of�this�requirement,�projects�that�qualify�as�NEPA�CEs�must�complete�a�checklist�equivalent�to�those�shown�in�Table�PR�1.1.��
Example: States with Environmental Review Processes
Some�states,�regions�and�territories�of�the�United�States�require�an�environmental�review�process�that�is�similar�to�NEPA.�These�locations�are�listed�in�Table�PR�1.2.�Additionally,�some�local�and�regional�departments�of�transportation�(DOT),�or�projects�funded�by�those�agencies,�may�also�require�an�environmental�review�process�that�is�generally�based�on�the�NEPA.�Completing�such�an�owner/agency�process�meets�this�requirement,�provided�that�it�addresses�all�the�steps�noted.�Note�that�some�owners/agencies�may�have�stricter�criteria�than�NEPA.�Also,�guidance�documents�and�examples�at�the�federal�level�can�often�provide�a�helpful�resource�or�template�for�state�level�documentation.� �
31

Project Requirements Greenroads™ Manual v1.5
Environmental Review Process PR-1
Table�PR�1.2:�U.S.�Locations�with�Existing�Environmental�Review�Processes1�California� Montana�Connecticut� Nevada/California�–�Tahoe�District�of�Columbia� New�Jersey�Georgia� New�York�Guam� North�Carolina�Hawaii� Puerto�Rico�Indiana� South�Dakota�Maryland� Virginia�Massachusetts� Washington�Minnesota� Wisconsin�1http://nepa.gov/nepa/regs/states/states.cfm�
POTENTIAL ISSUES
1. Projects�that�are�typically�classified�as�“categorical�exclusions”�under�NEPA�(or�equivalent)�may�need�to�expend�extra�effort�to�achieve�the�intent�of�this�requirement.�
2. Inadequate�or�ineffective�public,�stakeholder,�and�agency�involvement�during�project�scoping,�leading�to�a�poorly�defined�or�incomplete�solution.�
3. Lead�agencies�are�responsible�for�the�scope�of�the�environmental�review,�but�consultants�or�developers�are�often�required�to�pay�for�and�perform�the�work�involved�(CEQ,�2007).�
4. Climate�change�is�not�often�adequately�addressed�by�the�environmental�review�process,�which�has�occasionally�resulted�in�litigation�(Clark,�1994;�Lemons,�1998).�
5. Inadequate�mitigation�of�indirect�and�cumulative�effects�because�of�jurisdictional�limitations�or�lack�of�scientific�data�(Clark,�1994;�Lemons,�1998).�
RESEARCH An�environmental�review�process�has�two�main�purposes:�providing�an�avenue�for�more�informed�decision�making�and�allowing�public�involvement�in�agency�projects�that�may�have�adverse�impacts�on�the�environment�(CEQ,�2007).��Generally�speaking,�it�is�the�first�step�toward�achieving�a�general�mark�of�roadway�sustainability;�this�step,�when�taken�at�the�outset�of�design�and�construction,�allows�comprehensive�consideration�of�elements�that�contribute�to�overall�sustainability�at�the�most�basic�level�of�project�decision�making.�
Completion�of�an�environmental�review�process�ensures�that�the�project�has�received�early�scrutiny�and�guidance�from�the�public,�stakeholders,�and�appropriate�agencies�and�jurisdictions�before�it�is�designed�and�built.�However,�importantly,�the�process�does�not�dictate�the�final�decisions�made.�In�other�words,�some�impacts�that�are�considered�adverse�may�actually�be�implemented�based�on�weighing�a�number�of�tradeoffs.�This�way,�stakeholder�values�and�local�regulations�provide�the�environmental,�social,�economic�and�other�political�parameters�within�which�a�project�must�fit.�
Why�is�the�environmental�review�process�a�requirement�in�Greenroads?�No�matter�how�small�the�roadway�project�is,�it�still�has�an�impact,�even�if�it�is�considered�at�some�regulatory�level�to�be�an�“insignificant”�one.�Greenroads�seeks�to�recognize�those�projects�that�have�been�subject�to�the�robust�public�and�regulatory�agency�review�process�imposed�by�the�National�Environmental�Policy�Act�(NEPA)�or�a�state�level�equivalent�procedure.�To�clarify,�in�particular,�many�roadway�projects�have�been�classified�as�Categorical�Exclusions.�Such�regular�exclusion�of�this�process�requirement�detaches�the�impacts�that�are�perceived�as�insignificant�on�a�project�basis�and�at�a�practical�level�actually�has�a�potentially�large�aggregate�environmental�impact.�Passing�off�insignificant�impacts�does�not�preclude�the�value�of�the�process�in�a�decision�making�situation,�especially�for�the�broad�range�of�impact�that�roadway�projects�have.��Also,�by�considering�using�a�metric�like�Greenroads�in�project�level�planning,�we�feel�that�the�environmental�review�process�may�be�augmented�by�consideration�of�some�of�the�ideas�at�the�project�conception.�
32

Greenroads™ Manual v1.5 Project Requirements
PR-1 Environmental Review Process
Why�is�environmental�review�important�for�roadways?�Roadway�construction�and�maintenance�activities�place�an�incredible�demand�on�national�environmental�and�financial�resources.�However,�current�roadway�design�and�construction�practice�does�not�always�systematically�or�holistically�address�environmental�impacts�or�environmental�quality.�For�many�projects,�often�it�is�difficult�to�conceptualize�the�environmental�impacts�or�influence�that�a�roadway�has�on�its�surroundings.�This�could�be�due�to�three�general�problems:�1)�decision�makers�are�unable�to�understand�the�complexity�of�ecosystems�and�how�manmade�roadways�fit�within�this�context;�2)�the�decision�requires�thoughtfulness�that�goes�beyond�conventional�wisdom�or�traditional�assumptions�3)�decision�makers�fail�to�understand�the�limits�of�control�that�humans�have�on�ecosystem�management�(Caldwell,�1999).�Also,�not�all�projects�are�covered�by�NEPA�or�an�equivalent�state�or�local�policy;�sometimes�existing�policies�require�no�more�than�a�cursory�evaluation�of�environmental,�social�and�economic�impacts.�In�these�cases,�many�critical�impacts�are�unintentionally�overlooked�or�ignored�and�these�impacts�may�have�long�term�consequences�for�the�environment�and�local�communities.�Approaches�that�do�not�address�direct,�indirect�and�cumulative�effects�of�roadway�design�and�construction�demonstrate,�at�best,�weak�stewardship�efforts,�and�are�inadequate�toward�achieving�sustainability�due�to�their�lack�of�comprehensiveness.�
For�example,�evaluation�of�project�air�emissions,�total�energy�use,�or�surrounding�ecosystems�is�rarely�extended�outside�of�regulatory�compliance,�such�as�meeting�requirements�for�a�cumulative�effects�assessment�in�National�Environmental�Policy�Act�(NEPA)�documents.�The�Bureau�of�Transportation�Statistics�(2007)�reports�that�approximately�$54�billion�was�spent�on�pavement�materials�alone�in�2006.��Production,�transport�and�placement�of�common�pavement�materials,�such�as�hot�mix�asphalt�(HMA)�and�portland�cement�concrete�(PCC),�represent�the�majority�of�life�cycle�greenhouse�gas�emissions�and�energy�usage�associated�with�roadways�(Zapata�and�Gambatese,�2005).�Additionally,�the�U.S.�Environmental�Protection�Agency�(EPA)�has�attributed�several�direct,�cumulative�and�long�term�environmental�impacts,�such�as�ecosystem�degradation,�fragmentation�and�habitat�loss,�due�to�the�linear�and�decentralized�nature�of�the�four�million�mile�network�of�roadways�in�the�U.S.�(1994)�Performing�an�environmental�review�on�a�roadway�project�provides�a�means�of�investigating�these�special�environmental�impacts�in�a�more�detailed�manner�in�order�to�make�better�environmental�decisions�for�roadway�development.�
What�are�the�steps�in�the�environmental�review�process?�Generally,�there�are�three�generic�steps�in�the�environmental�review�process.�For�projects�with�no�environmental�review�process�within�their�jurisdiction,�these�are�guidelines�provide�a�general�idea�of�the�process.�
1. Complete�the�initial�permitting�process�for�the�governing�jurisdiction.�Usually�this�involves�some�review�of�historical�documentation�for�the�area�where�the�project�will�be�located.�
2. Determine�if�an�environmental�review�is�needed.�Usually,�a�project�falls�into�a�certain�classification�which�has�specific�environmental�review�requirements.�
3. If�needed,�perform�an�environmental�review�and�submit�for�approval�by�the�governing�agency.�
These�three�steps�may�be�iterative�depending�on�the�complexity�of�the�project.�The�eight�steps�of�this�Project�Requirement�match�this�general�framework,�in�slightly�more�detail,�and�without�the�agency�permits.�
How�is�the�environmental�review�process�used�for�decision�making?�Roadway�design�and�construction�is�a�complex�process�that�requires�experienced�professionals�and�clearly�defined�expectations�and�values.�The�environmental�review�process�is�an�important�part�of�decision�making�in�roadway�projects�because�ultimately,�it�helps�tell�the�whole�project�story�in�an�effective�manner.�Determining�stakeholder�expectations�and�needs,�spatial�and�temporal�bounds�(Clark,�1994),�feasible�options�and�their�environmental�impacts,�and�which�choices�are�most�sensible�based�on�all�known�costs�and�benefits�are�critical�steps�in�approaching�the�project�in�a�meaningful�and�comprehensive�way.�Further,�without�defining�these�same�values,�efforts�toward�project�sustainability�would�be�ineffective.��
What�is�the�public�involvement�role?�Public�involvement�plays�a�key�role�in�a�comprehensive�environmental�review�process�because�the�public�is�one�of�the�largest�stakeholders�in�most�roadway�and�transportation�related�projects.�It�plays�a�complementary�role�
33
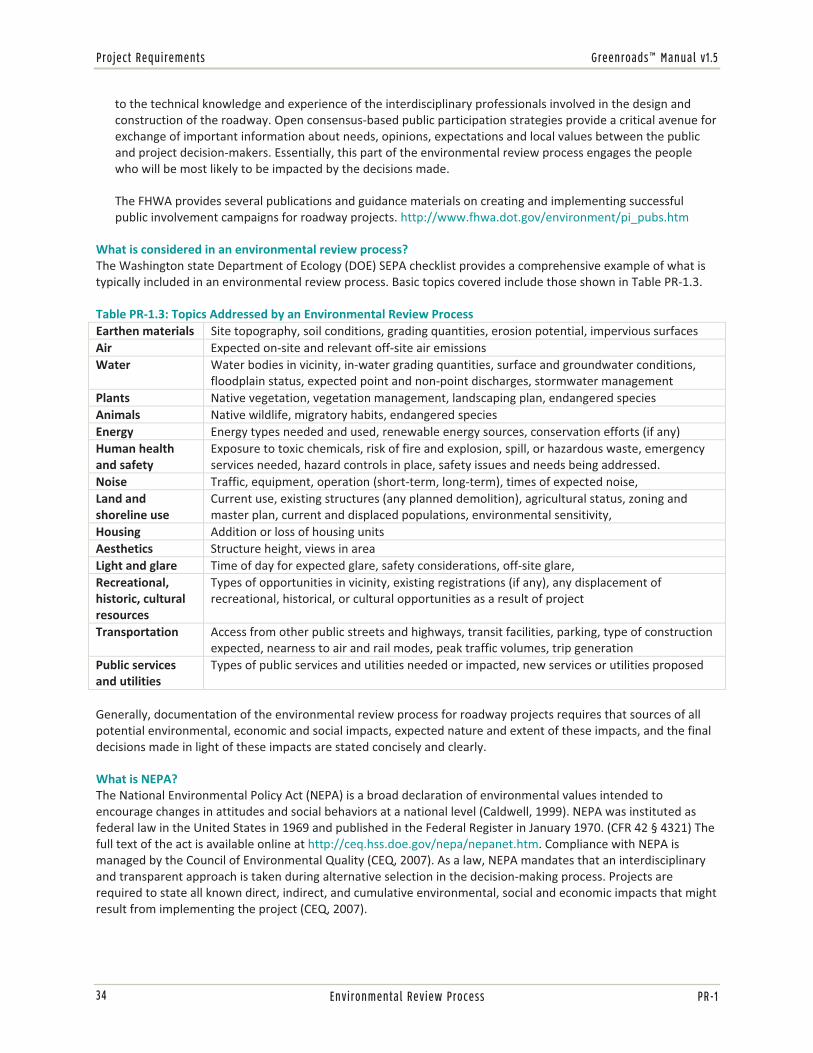
Project Requirements Greenroads™ Manual v1.5
Environmental Review Process PR-1
to�the�technical�knowledge�and�experience�of�the�interdisciplinary�professionals�involved�in�the�design�and�construction�of�the�roadway.�Open�consensus�based�public�participation�strategies�provide�a�critical�avenue�for�exchange�of�important�information�about�needs,�opinions,�expectations�and�local�values�between�the�public�and�project�decision�makers.�Essentially,�this�part�of�the�environmental�review�process�engages�the�people�who�will�be�most�likely�to�be�impacted�by�the�decisions�made.�
The�FHWA�provides�several�publications�and�guidance�materials�on�creating�and�implementing�successful�public�involvement�campaigns�for�roadway�projects.�http://www.fhwa.dot.gov/environment/pi_pubs.htm��
What�is�considered�in�an�environmental�review�process?�The�Washington�state�Department�of�Ecology�(DOE)�SEPA�checklist�provides�a�comprehensive�example�of�what�is�typically�included�in�an�environmental�review�process.�Basic�topics�covered�include�those�shown�in�Table�PR�1.3.�
Table�PR�1.3:�Topics�Addressed�by�an�Environmental�Review�Process�Earthen�materials� Site�topography,�soil�conditions,�grading�quantities,�erosion�potential,�impervious�surfacesAir� Expected�on�site�and�relevant off�site�air�emissionsWater� Water�bodies�in�vicinity,�in�water�grading�quantities,�surface�and�groundwater�conditions,�
floodplain�status,�expected�point�and�non�point�discharges,�stormwater�management�Plants� Native�vegetation,�vegetation�management,�landscaping�plan,�endangered�speciesAnimals� Native�wildlife,�migratory�habits,�endangered�speciesEnergy� Energy�types�needed�and�used,�renewable�energy�sources,�conservation�efforts�(if�any)Human�health�and�safety�
Exposure�to�toxic�chemicals,�risk�of�fire�and�explosion,�spill,�or hazardous�waste,�emergency�services�needed,�hazard�controls�in�place,�safety�issues�and�needs�being�addressed.�
Noise� Traffic,�equipment,�operation (short�term,�long�term),�times�of�expected�noise,��Land�and�shoreline�use�
Current�use,�existing�structures�(any�planned�demolition),�agricultural�status,�zoning�and�master�plan,�current�and�displaced�populations,�environmental�sensitivity,��
Housing� Addition�or�loss�of�housing�unitsAesthetics� Structure�height,�views�in�areaLight�and�glare� Time�of�day�for�expected�glare,�safety�considerations,�off�site�glare,��Recreational,�historic,�cultural�resources�
Types�of�opportunities�in�vicinity,�existing�registrations�(if�any),�any�displacement�of�recreational,�historical,�or�cultural�opportunities�as�a�result�of�project�
Transportation� Access�from�other�public�streets�and�highways,�transit�facilities,�parking,�type�of�construction�expected,�nearness�to�air�and�rail�modes,�peak�traffic�volumes,�trip�generation�
Public�services�and�utilities�
Types�of�public�services�and�utilities�needed�or�impacted,�new�services�or�utilities�proposed
�Generally,�documentation�of�the�environmental�review�process�for�roadway�projects�requires�that�sources�of�all�potential�environmental,�economic�and�social�impacts,�expected�nature�and�extent�of�these�impacts,�and�the�final�decisions�made�in�light�of�these�impacts�are�stated�concisely�and�clearly.�
What�is�NEPA?�The�National�Environmental�Policy�Act�(NEPA)�is�a�broad�declaration�of�environmental�values�intended�to�encourage�changes�in�attitudes�and�social�behaviors�at�a�national�level�(Caldwell,�1999).�NEPA�was�instituted�as�federal�law�in�the�United�States�in�1969�and�published�in�the�Federal�Register�in�January�1970.�(CFR�42�§�4321)�The�full�text�of�the�act�is�available�online�at�http://ceq.hss.doe.gov/nepa/nepanet.htm.�Compliance�with�NEPA�is�managed�by�the�Council�of�Environmental�Quality�(CEQ,�2007).�As�a�law,�NEPA�mandates�that�an�interdisciplinary�and�transparent�approach�is�taken�during�alternative�selection�in�the�decision�making�process.�Projects�are�required�to�state�all�known�direct,�indirect,�and�cumulative�environmental,�social�and�economic�impacts�that�might�result�from�implementing�the�project�(CEQ,�2007).�
34

Greenroads™ Manual v1.5 Project Requirements
PR-1 Environmental Review Process
NEPA�applies�to�all�federally�funded�projects,�which�commonly�includes�projects�such�as�roadways�managed�by�the�Federal�Highway�Administration�(FHWA),�environmental�remediation�efforts�through�the�EPA,�government�buildings�and�other�infrastructure�projects�receiving�federal�funding.�Because�many�roadway�projects�are�at�least�partly�funded�by�federal�money,�many�agencies�and�consultants�are�likely�to�be�experienced�with�the�level�of�detail�expected�during�the�NEPA�process.�Additionally,�many�states�may�have�regulations�that�map�directly�back�to�NEPA�or�have�more�stringent�environmental�review�expectations�due�to�local�or�statewide�policy�or�other�special�environmental�conditions.�
In�general,�there�are�five�classifications�of�projects�that�are�subject�to�environmental�review�under�NEPA.�These�are�shown�with�a�brief�description�of�the�documentation�needed�and�produced�to�meet�the�requirements�of�NEPA�process�in�Table�PR�1.4.�Significantly�more�detail�regarding�each�type�of�report�in�the�text�of�the�Act�itself�and�from�CEQ�at�http://ceq.hss.doe.gov/nepa/nepanet.htm.�
Table�PR�1.4:�Types�of�NEPA�Environmental�Reviews�NEPA�Classification� Documentation�Needs How�to�Meet�NeedsSignificant�Effects�Identified�
Environmental�Impact�Statement (EIS)Record�of�Decision�(ROD)�
Follow�NEPA�Process�guidelines�for�generating�an�EIS.�EPA�reviews�EIS.�
Effects�Uncertain� Environmental�Assessment�(EA)Finding�of�No�Significant�Impact�(FONSI)�or�follow�EIS�procedure�
Follow�NEPA�Process�guidelines�for�generating�an�EA.�Results�of�EA�may�dictate�a�more�detailed�EIS�is�required�for�the�roadway�project.�
Listed�Categorical�Exclusion�(CE)�
Letter�from�the�governing�jurisdiction�stating�the�existing�CE�for�project.�FHWA�lists�CEs�in�23�CFR�§771.117�
Provide�copy�of�existing�statement�of�Categorical�Exclusion�(CE)�
No�CE�listed�by�Agency� Environmental�Assessment�(EA)Finding�of�No�Significant�Impact�(FONSI)�or�EIS�and�ROD�
Follow�NEPA�Process�guidelines�for�generating�an�EA.�Results�of�EA�may�dictate�a�more�detailed�EIS�is�required�for�the�roadway�project.�
Extraordinary�circumstance�for�a�listed�CE�
Environmental�Assessment�(EA)Finding�of�No�Significant�Impact�(FONSI)�or�EIS�and�ROD�
Follow�NEPA�Process�guidelines�for�generating�an�EA.�Results�of�EA�may�dictate�a�more�detailed�EIS�is�required�for�the�roadway�project.�
Criticisms�of�NEPA�Some�of�the�common�criticisms�of�NEPA�are�outlined�by�NCHRP�Report�25�25(01)�(TransTech�et�al.,�2005).�Most�complaints�arise�from�loss�of�meaningfulness�in�the�environmental�review�process�due�to�two�coupled�issues,�the�vagueness�of�the�language�used�in�the�Act�and�the�bureaucratic�approval�process�required�of�the�NEPA�documentation.�
The�language�in�the�Act�is�very�broad�compared�to�other�U.S.�regulations,�and�often�the�requirements�for�NEPA�are�considered�unclear�by�comparison.�Interviewees�in�the�NCHRP�25�25�initial�survey�cited�the�need�for�clearer�language,�less�jargon,�consistent�styles�and�formats,�and�the�need�to�be�succinct�(TransTech�et�al.,�2005).�However,�the�meaning�of�the�process�is�not�likely�lost�in�the�process�itself,�but�rather�in�the�unnecessarily�verbose�documents�that�are�generated.�Many�sections�often�contain�duplicate�information.�This�problem�has�spurred�the�guidance�documents�available�from�FHWA,�AASHTO,�and�ACEC�(noted�in�the�preceding�Examples�section)�which�stress�brevity�and�clarity�in�final�NEPA�documents.�
Historically,�documentation�of�the�NEPA�process�has�also�been�considered�unwieldy�and�arduous�because�project�teams�often�try�to�present�as�much�information�in�as�broad�of�language�as�possible,�in�order�to�address�the�lack�of�specificity�in�the�Act�and�avoid�possible�litigation�for�errors�and�omissions�(Clark,�1994;�Lemons,�1998).�Interviewees�frequently�mentioned�that�demonstrating�legal�sufficiency�is�the�main�reason�documents�by�DOTs�are�so�long�(TransTech�et�al.,�2005).�Consequently,�these�lengthy�documents�require�lengthy�reviews.�The�review�process�is�complicated�further�if�a�project�does�not�begin�the�NEPA�environmental�review�in�early�stages�of�decision�making�or�if�documentation�is�not�properly�tracked.�
35

Project Requirements Greenroads™ Manual v1.5
Environmental Review Process PR-1
A�third�complaint�that�has�actually�resulted�in�recent�(and�complicated)�litigation�is�the�NEPA�requirement�for�cumulative�environmental�effect�assessment,�specifically�related�to�global�climate�change.�Smith�(2008)�notes�that�the�NEPA�has�traditionally�not�included�any�climate�change�analyses�in�the�environmental�impact�assessment�process.�Recently�though,�climate�change�has�appeared�as�a�comment�from�the�lead�agency�on�reviews�of�environmental�impact�statements�and�environmental�assessments.�However,�Lemons�(1998,�p.�89)�states�“Because�of�the�significant�amount�of�scientific�uncertainty�in�prediction�the�environmental�impacts�of�human�activities�[such�as�climate�change],�opponents�of�agency�decisions�have�often�been�successful�in�challenging�agency�decisions�if�they�can�demonstrate�that�the�agency�did�not�rigorously�consider�certain�impacts�or�if�they�can�demonstrate�that�an�agency�did�not�follow�prescribed�steps�in�dealing�with�scientific�uncertainty.�Alternatively,�if�an�agency�has�followed�these�prescribed�steps,�then�opponents�of�an�agency’s�decision�will�have�a�difficult�time�fulfilling�the�burden�of�proof�requirements�to�overturn�that�decision.”�For�example,�Smith�(2008,�p.�76)�identifies�the�landmark�case,�Center�for�Biological�Diversity�v.�National�Highway�Traffic�Safety�Administration,�as�the�“most�significant�NEPA�climate�change�court�decision�to�date”�related�to�NEPA�and�transportation.�In�this�decision,�the�National�Highway�Traffic�Safety�Administration�failed�to�identify�the�cumulative�effect�of�incremental�emissions�on�climate�change�in�the�EA�process.�However,�in�this�and�similar�cases,�even�the�best�scientific�knowledge�for�ecosystem�related�consequences�can�be�too�variable�and�uncertain�to�be�considered�significant�evidence�in�a�court�of�law.�Statistical�significance�in�science�and�engineering,�unfortunately,�does�not�translate�to�beyond�a�reasonable�doubt�in�law.�
Clark�(1994,�p.�322)�echoes�this�difficulty�and�states�that�the�“lack�of�consensus�concerning�the�application�of�cumulative�impact�analysis�methodology�is�primarily�associated�with�issues�of�temporal�and�spatial�bounds�and�the�difficulty�of�reaching�agreement�upon�the�geographical�boundaries�of�the�study�area�and�how�far�into�the�future�and�how�far�into�the�past�one�must�look�to�adequately�assess�the�cumulative�impacts.”�In�essence,�the�real�issue�is�that�most�project�teams�are�unable�to�define�regional�and�global�problems�in�a�context�relevant�to�project�level�decisions.�Most�of�the�cumulative�effect�assessments�for�transportation�projects�miss�the�point�(if�completed�at�all),�and�more�data�(easy�to�collect)�is�often�provided�without�completely�synthesizing�the�information�in�a�meaningful�way�(because�analysis�is�more�difficult)�(TransTech�et�al.,�2005).�Guidelines�for�the�level�of�detail�required�and�process�suggestions�for�cumulative�effects�studies�of�transportation�projects�are�provided�in�NCHRP�25�25(01).�
American�Recovery�and�Reinvestment�Act�of�2009�and�NEPA�The�NEPA�process�is�required�for�any�transportation�infrastructure�improvement�project�applying�for�or�granted�funds�under�the�American�Recovery�and�Reinvestment�Act�of�2009�(ARRA).�According�to�the�CEQ�(2009c),�NEPA�reviews�are�representative�of�the�sustainability�and�environmental�stewardship�goals�embedded�in�ARRA.�As�of�September�2009,�infrastructure�projects�through�the�United�States�DOT�amounted�to�9%�of�the�total�funded�projects�in�ARRA.�NEPA�was�not�applicable�for�only�two�of�these�projects�funded�for�USDOT�in�2009�(CEQ,�2009c).�
Resources�for�Project�Environmental�Reviews�� Blank�copies�of�the�Washington�state�Department�of�Ecology�SEPA�checklist�are�available�and�downloadable�for�
use�here:�http://www.ecy.wa.gov/biblio/ecy05045.html.��� Information�for�highway�proposals�and�SAFETEA�LU�requirements�is�available�from�the�FHWA�at�
http://www.fhwa.dot.gov/safetealu.��� A�“Citizen’s�Guide�to�Transportation�Decision�Making”�and�“The�Metropolitan�Transportation�Planning�Process:�
Key�Issues.�A�Briefing�Notebook�for�Transportation�Decisionmakers,�Officials,�and�Staff”�are�available�from�the�FHWA�at�http://www.fhwa.gov/planning/citizen/index.htm.��
� The�FHWA�provides�an�Environmental�Review�Toolkit�that�is�a�useful�resource�for�many�projects:�http://www.fhwa.dot.gov/planning/metro/index.htm�
� Detailed�questions�and�answers�for�environmental�review�processes�are�spelled�out�in�the�SAFETEA�LU�Final�Guidance,�available�here:�http://www.fhwa.dot.gov/hep/section6002/��
36
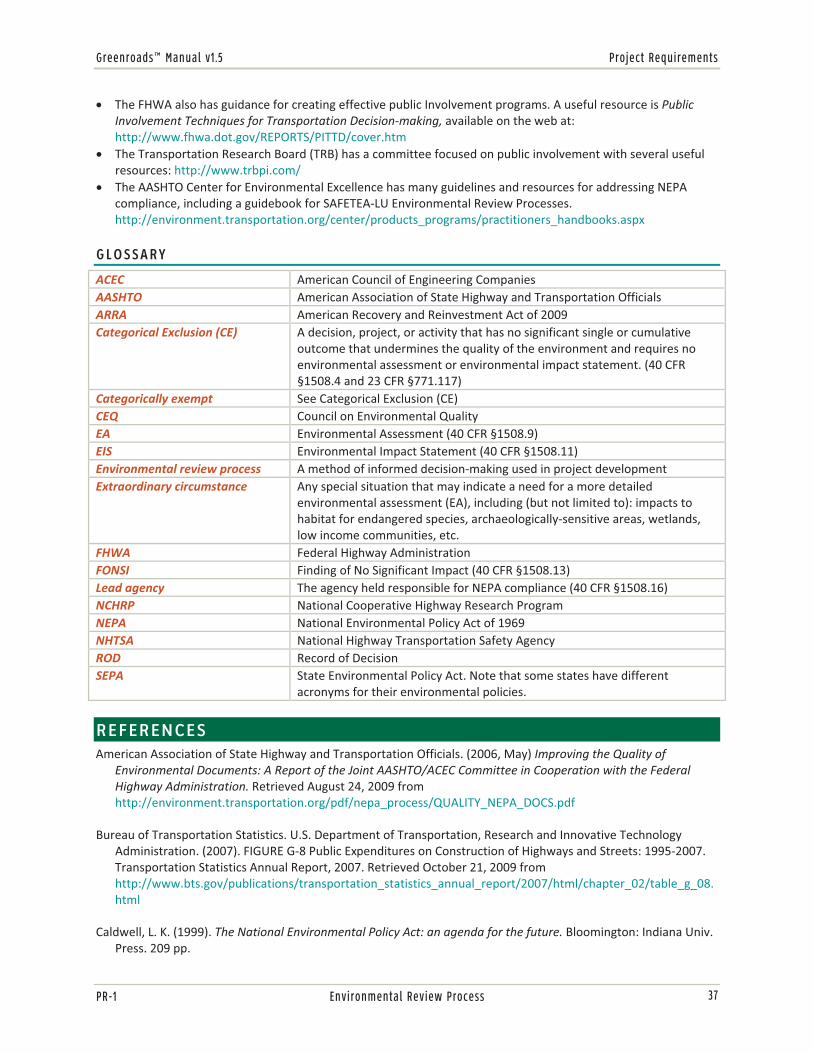
Greenroads™ Manual v1.5 Project Requirements
PR-1 Environmental Review Process
� The�FHWA�also�has�guidance�for�creating�effective�public�Involvement�programs.�A�useful�resource�is�Public�Involvement�Techniques�for�Transportation�Decision�making,�available�on�the�web�at:�http://www.fhwa.dot.gov/REPORTS/PITTD/cover.htm�
� The�Transportation�Research�Board�(TRB)�has�a�committee�focused�on�public�involvement�with�several�useful�resources:�http://www.trbpi.com/��
� The�AASHTO�Center�for�Environmental�Excellence�has�many�guidelines�and�resources�for�addressing�NEPA�compliance,�including�a�guidebook�for�SAFETEA�LU�Environmental�Review�Processes.�http://environment.transportation.org/center/products_programs/practitioners_handbooks.aspx��
GLOSSARY
ACEC� American�Council�of�Engineering�CompaniesAASHTO� American�Association�of�State�Highway�and�Transportation�OfficialsARRA� American�Recovery�and�Reinvestment�Act�of�2009Categorical�Exclusion�(CE)� A�decision,�project,�or�activity�that�has�no�significant�single�or�cumulative�
outcome�that�undermines�the�quality�of�the�environment�and�requires�no�environmental�assessment�or�environmental�impact�statement.�(40�CFR�§1508.4�and�23�CFR�§771.117)�
Categorically�exempt� See�Categorical�Exclusion�(CE)CEQ� Council�on�Environmental�QualityEA� Environmental�Assessment�(40�CFR�§1508.9)EIS� Environmental�Impact�Statement�(40�CFR�§1508.11)�Environmental�review�process� A�method�of�informed�decision�making�used�in�project�developmentExtraordinary�circumstance� Any�special�situation�that�may�indicate�a�need�for�a�more�detailed�
environmental�assessment�(EA),�including�(but�not�limited�to):�impacts�to�habitat�for�endangered�species,�archaeologically�sensitive�areas,�wetlands,�low�income�communities,�etc.�
FHWA� Federal�Highway�AdministrationFONSI� Finding�of�No�Significant�Impact�(40�CFR�§1508.13)Lead�agency� The�agency�held�responsible�for�NEPA�compliance (40�CFR�§1508.16)NCHRP� National�Cooperative�Highway�Research�ProgramNEPA� National�Environmental�Policy�Act�of�1969NHTSA� National�Highway�Transportation�Safety�AgencyROD� Record�of�DecisionSEPA� State�Environmental�Policy�Act.�Note�that�some�states�have�different�
acronyms�for�their�environmental�policies.��
REFERENCES American�Association�of�State�Highway�and�Transportation�Officials.�(2006,�May)�Improving�the�Quality�of�
Environmental�Documents:�A�Report�of�the�Joint�AASHTO/ACEC�Committee�in�Cooperation�with�the�Federal�Highway�Administration.�Retrieved�August�24,�2009�from�http://environment.transportation.org/pdf/nepa_process/QUALITY_NEPA_DOCS.pdf�
Bureau�of�Transportation�Statistics.�U.S.�Department�of�Transportation,�Research�and�Innovative�Technology�Administration.�(2007).�FIGURE�G�8�Public�Expenditures�on�Construction�of�Highways�and�Streets:�1995�2007.�Transportation�Statistics�Annual�Report,�2007.�Retrieved�October�21,�2009�from�http://www.bts.gov/publications/transportation_statistics_annual_report/2007/html/chapter_02/table_g_08.html�
Caldwell,�L.�K.�(1999).�The�National�Environmental�Policy�Act:�an�agenda�for�the�future.�Bloomington:�Indiana�Univ.��Press.�209�pp.�
37

Project Requirements Greenroads™ Manual v1.5
Environmental Review Process PR-1
Clark,�R.�(1994.)�Cumulative�effects�assessment:�a�tool�for�sustainable�development.�Impact�Assessment.�12(3):�319�331.�
Council�on�Environmental�Quality,�Office�of�the�President.�(2007,�December).�A�Citizen’s�Guide�to�the�NEPA:�Having�Your�Voice�Heard.�Retrieved�August�24,�2009�from�http://nepa.gov/nepa/Citizens_Guide_Dec07.pdf.�
Council�on�Environmental�Quality,�Office�of�the�President.�(2009a,�March�19).�State�Environmental�Planning�Information.�Retrieved�August�24,�2009.�Available�at�http://nepa.gov/nepa/regs/states/states.cfm��
Council�on�Environmental�Quality,�Office�of�the�President.�(2009b,�November�1)�NEPAnet�CEQ�Task�Force.�Available�at�http://ceq.hss.doe.gov/nepa/nepanet.htm�
Council�on�Environmental�Quality,�Office�of�the�President.�(2009c,�November�2)�The�Third�Report�on�the�National�Environmental�Policy�Act�and�Progress�for�American�Recovery�and�Reinvestment�Act�of�2009�Activities�and�Projects.�Available�at:�http://ceq.hss.doe.gov/nepa/reports_congress_Nov2009.htm��
Environmental�Protection�Agency.�Office�of�Federal�Activities.(1994,�April)�Evaluation�of�impacts�from�highway�development.�(EPA�Publication�No.�300�B�94�006.)�Washington,�DC:�Environmental�Protection�Agency.�
Federal�Highway�Administration�(FHWA).�(2008).�Environmental�Review�Toolkit.�FHWA,�US�Department�of�Transportation.�Accessed�July�25,�2008.�Available�at�http://www.environment.fhwa.dot.gov��
Federal�Highway�Administration�(FHWA).�(2005).�Safe,�Accountable,�Flexible,�Efficient�Transportation�Equity�Act:�A�Legacy�for�Users.�FHWA,�US�Department�of�Transportation.�Accessed�August�24,�2009.�Available�at�http://www.environment.fhwa.dot.gov.�
Lemons,�J.�(1998.)�Burden�of�Proof�Requirement�and�Environmental�Sustainability.�Chap.�6,�pp.�75�103,�in:�J.�Lemons,�L.�Westra,�and�R.�Goodland.�Ecological�Sustainability�and�Integrity:�Concepts�and�Approaches.�Boston:�Kluwer�Academic�Publishers.�315�pp.�
Smith,�M.D.�(2008).�NEPA�and�Climate�Change.�Environmental�Practice.�10(2),�75�77.�
TransTech�Management,�Inc.�&�Parsons,�Brinckerhoff�with�Akin,�Gump,�Strauss,�Hauer�&�Feld�LLP.�(2005,�January).�Synthesis�of�Data�Needs�for�EA�and�EIS�Documentation�–�A�Blueprint�for�NEPA�Document�Content�Requested�by:�American�Association�of�State�Highway�and�Transportation�Officials�(AASHTO)�Standing�Committee�on�the�Environment.�National�Cooperative�Highway�Research�Program�25�25/Task�01.�Available�at:�http://www.trb.org/NotesDocs/25�25%281%29_FR.pdf�
United�Nations�General�Assembly,�42nd�Session.�(1987,�August�4).�Report�of�the�World�Commission�on�Environment�and�Development�(WCED):�“Our�Common�Future.”�(A/42/427).�Annex�to�Official�Record.�Geneva,�Switzerland,�1987.�(Masthead).�Available�at�http://www.worldinbalance.net/agreements/1987�brundtland.php�
Zapata,�P.�&�Gambatese,�J.�A.�(2005).�Energy�Consumption�of�Asphalt�and�Reinforced�Concrete�Pavement�Materials�and�Construction.�Journal�of�Infrastructure�Systems.�11(1),�9�20.�
38

Greenroads™ Manual v1.5 Project Requirements
PR-2 Lifecycle Cost Analysis
LIFECYCLE COST ANALYSIS GOAL Determine�the�lifecycle�cost�for�the�roadway�project�to�aid�in�decision�making.��
REQUIREMENTS Perform�a�life�cycle�cost�analysis�(LCCA)�of�the�roadway�project.��LCCA�must�contain�at�least�agency�costs�(listed�below)�and�workzone�user�costs.�
LCCA�can�be�performed�with�manual�calculations�or�by�using�recommended�software�(noted�below�for�pavements�and�bridges).�Initial�values�for�calculations�should�be�consistent�with�existing�owner�agency�policies�and�software�should�report�probabilistic�rather�than�deterministic�results.�Where�no�owner�agency�policy�exists�for�LCCA,�do�one�or�more�of�the�following�to�determine�input�values�for�software:�
� Justify�the�use�of�any�default�inputs�� Use�historical�data�as�representative�values�where�available�� Use�engineering�estimates�� Use�values�recommended�for�select�software�where�noted�below�
For�projects�with�pavements:�Perform�a�LCCA�of�the�project’s�pavement�structure�(comparison�of�multiple�design�alternatives�is�encouraged�but�not�required)�in�accordance�with�the�method�described�in�the�FHWA’s�Interim�Technical�bulletin,�Life�Cycle�Cost�Analysis�in�Pavement�Design�(1998,�currently�being�revised).�This�may�be�completed�manually�or�by�using�the�FHWA’s�RealCost�software�available�for�free�at:�http://www.fhwa.dot.gov/infrastructure/asstmgmt/lccasoft.cfm�
Use�parameters�for�the�LCCA�that�are�consistent�with�existing�owner�agency�policies.�If�no�owner�agency�policy�exists,�use�recommended�values�shown�in�Table�PR�2.1�for�the�FHWA’s�RealCost�software.�
For�projects�with�bridges:�Perform�a�LCCA�of�the�project’s�bridges�(comparison�of�multiple�design�alternatives�is�encouraged�but�not�required)�according�to�the�guidance�in�the�National�Cooperative�Highway�Research�Program�(NCHRP)�Report�483�(Hawk,�2003)�and�the�software�(called�BLCCA)�developed�for�this�study.�The�report�provides�standard�input�values�for�a�wide�range�of�potential�bridge�projects�and�referenced�sources�for�other�input�data.�Other�lifecycle�cost�analysis�software�may�also�be�used�at�the�discretion�of�the�project�manager,�including�RealCost,�with�some�minor�adjustments�to�the�spreadsheet.�A�BLCCA�may�also�be�completed�by�hand.�Table�PR�2.1�may�provide�some�useful�inputs�for�user�costs�and�traffic�data.�
� Use�agency�and�user�cost�parameters�that�are�consistent�with�agency�policy,�if�one�exists�(though�according�to�the�body�of�research�such�policies�for�bridges�are�rare.)�
� Use�the�same�number�of�years�for�service�life�that�is�used�for�design�of�structural�members�subject�to�long�term�loading�effects.�
�
PR-2
REQUIRED
RELATED CREDITS
� PR�3�Lifecycle�Inventory�
� EW�4�Stormwater�Cost�Analysis�
� MR�1�Lifecycle�Assessment�
SUSTAINABILITY COMPONENTS
� Economy�� Extent�� Expectations�
BENEFITS
� Reduces�Lifecycle�Cost�
� Improves�Accountability�
�
39

Project Requirements Greenroads™ Manual v1.5
Lifecycle Cost Analysis PR-2
For�projects�with�additional�features:�Perform�a�LCCA�of�the�project’s�major�features�(comparison�of�multiple�design�alternatives�is�encouraged�but�not�required)�in�accordance�with�generally�accepted�engineering�economics�practices.�Major�features�may�include�tunnels,�retaining�walls�and�other�items.�
Details
Typical�LCCAs�and�BLCCAs�include�agency�and�user�costs,�defined�below.�Occasionally,�third�party�costs�(such�as�monetized�environmental�damages�or�hazards)�are�included,�but�are�not�required�for�this�Project�Requirement.�A�cost�benefit�analysis�(CBA)�that�includes�the�minimum�components�below�is�acceptable.�Assumptions�used�for�agency�and�user�costs�should�be�consistent�in�each�analysis�for�projects�with�multiple�major�features.�
Agency�Costs.��Costs�from�the�planning,�construction�and�operation�of�the�roadway�and�structures.�
� Preliminary�Engineering.��Planning�and�design�costs.�� Contract�Administration.��Bidding�and�contract�oversight.�� Initial�construction.�Costs�incurred�during�the�initial�construction.�� Construction�Supervision.��Construction�management,�inspections,�and��� Maintenance.��Pothole�patching,�crack�sealing,�restriping,�etc.��� Rehabilitation.�Costs�to�maintain�and�rehabilitate�or�retrofit�an�asset�throughout�its�service�life.�� Administrative�Costs.��Cost�of�pavement�management�and�other�administrative�costs.�� Salvage�value.�Expected�value�of�materials�and�equipment�at�end�of�service�life.�
User�Costs.�Those�who�use�the�facility�incur�costs�during�normal�operation�and�during�construction�periods�(e.g.,�time,�safety,�fuel�and�other�vehicle�operating�costs).�
� Normal�Operation.��Often�ignored�in�LCCA,�as�they�may�be�the�same�between�alternatives.�� Work�Zone.��Costs�incurred�by�the�user�from�work�zone�delays.�
The�Federal�government�mandated�LCCA�in�the�National�Highway�System�Designation�Act�of�1995�but�then�changed�it�to�a�voluntary�standard�in�TEA�21.�Section�1305(c)�states�that�LCCA�is�not�required�but�tasks�the�“…Secretary�shall�develop�recommendations�for�the�States�to�conduct�life�cycle�cost�analyses.”�Most�recently,�the�Safe,�Accountable,�Flexible,�Efficient�Transportation�Equity�Act:�A�Legacy�for�Users�(SAFETEA�LU)�set�a�funding�threshold�that�mandates�the�use�of�LCCA�or�other�value�engineering�tools�for�bridge�projects�US$20�million�or�more.�Another�mandate�threshold�is�set�at�US$25�million�for�any�federal�aid�project�(Federal�Highway�Administration,�n.d).�
Many�roadway�projects�have�both�pavements�and�structures�included�in�the�scope�of�work.�For�such�projects,�the�life�cycle�cost�analysis�prepared�for�this�credit�must�reflect�each�substantial�project�feature�for�its�entire�service�life.�It�may�also�be�desirable�to�perform�a�LCCA�on�the�entire�roadway�project�(e.g.,�include�all�earthwork,�traffic�hardware,�structures,�etc.)�but�currently�no�straightforward�means�of�doing�this�exists.�
Many�state�departments�of�transportations�(DOTs)�already�incorporate�LCCA�into�a�formal�pavement�type�selection�process�or�project�alternative�selection�process,�and�thus�already�have�a�formal�LCCA�process�in�place�for�pavements.�However,�a�formalized�alternative�selection�process�using�BLCCA�does�not�appear�to�be�in�widespread�use�for�bridge�or�other�structural�projects�(Özbay�et�al.�2004;�Thompson,�2004).�
DOCUMENTATION � A�copy�of�the�LCCA�and/or�BLCCA�calculations�(if�done�by�hand)�or�the�report�produced�by�the�analysis�
software,�including�a�summary�of�inputs�and�outputs.�� A�link�to�or�copy�of�agency�policy�on�LCCA�and/or�BLCCA�if�one�exists.�� A�short�1�paragraph�narrative�describing�which�alternative�was�selected�and�the�principal�reasons�for�selection.�
40

Greenroads™ Manual v1.5 Project Requirements
PR-2 Lifecycle Cost Analysis
Table�PR�2.1:�Recommended�LCCA�Input�Values�for�RealCost�if�No�Standard�Agency�Policy�Exists�Analysis�Options� Probability Distribution ValueAnalysis�period� NA ��40�yearsDiscount�Rate†� Triangular min�=�1.7%,�most�likely�=�2.7%,�max�=�3.7%Include�agency�cost�residual�value� NA YesInclude�user�costs�in�analysis� NA YesUser�cost�comparison�method� NA CalculatedTraffic�direction� NA Both�or�Inbound�or�Outbound�Include�user�cost�residual�value� NA Yes
Traffic�Data� �AADT� NA Best�estimateSingle�unit�trucks�as�%�of�AADT� NA Best�estimateCombo�unit�trucks�as�%�of�AADT� NA Best�estimateAnnual�growth�rate�of�traffic� Normal Best�estimateSpeed�limit�under�normal�conditions� NA Predominate�speed�limit�in�projectLanes�open�in�each�direction�under�normal�operation�
NA Best�estimate
Free�flow�capacity� NA Calculated�by�software�Queue�dissipation�capacity� Normal average�=�1818�vphpl,�st.�dev.�=�144�vphplMaximum�AADT�both�directions� NA Best�estimateMaximum�queue�length� NA Best�estimateRural/Urban� NA Best�estimate
Value�of�User�Time††� �Value�of�time�for�passenger�cars� Triangular min�=�$10,�most�likely�=�$11.50,�max�=�$13Value�of�time�for�single�unit�trucks� Triangular min�=�$17,�most�likely�=�$18.50,�max�=�$20Value�of�time�for�combination�trucks� Triangular min�=�$21,�most�likely�=�$22.50,�max�=�$24
Hourly�Traffic�Distribution�Use�default�values�if�no�region�or�project�specific�information�available.
Added�Vehicle�Time�and�Cost�Use�default�values�if�no�region�or�project�specific�information�available.
Alternatives� �Alternative�description� NA Fill�inActivity�description� NA Fill�inAgency�construction�cost� Normal average�=�best�estimate�of�cost�
st.�dev.�=�10%�of�the�average�Activity�service�life� Triangular Best�estimateMaintenance�frequency� Triangular Best�estimateWork�zone�length� NA Best�estimateWork�zone�capacity� NA Best�estimate,�if�no�data�consider�using�Figure�
3.4�in�Walls�and�Smith�(1998)�Work�zone�duration� NA Best�estimateWork�zone�speed�limit� NA Posted�valueNumber�of�lanes�open�in�each�direction�during�work�zone�
NA Best estimate
Work�zone�hours� NA Planned�hours†Discount�rate�should�be�determined�from�most�recent�OMB�Circular�A�94.��Appendix�C�contains�real�interest�rates�for�treasury�notes�and�bonds�of�various�lengths.��Treasury�note�maturity�that�most�closely�matches�the�project�analysis�period�should�be�used.�Use�minimum�and�maximum�values�of�±1%.�††Dollar�values�in�this�table�are�taken�directly�from�Walls�and�Smith�(1998)�and�are�given�in�August�1996�dollars.�These�values�MUST�be�inflated�to�dollar�values�in�the�year�that�construction�is�scheduled�to�start�using�the�U.S.�Bureau�of�Labor�Statistics�(BLS)�Consumer�Price�Index�(CPI)�U.S.�city�average�for�all�urban�consumers�(not�seasonally�adjusted).�The�value�for�this�index�in�1996�was�156.9.�The�BLS�CPI�Inflation�Calculator�(http://www.bls.gov/data/inflation_calculator.htm)�can�be�used�to�do�this�conversion�quickly.�
41

Project Requirements Greenroads™ Manual v1.5
Lifecycle Cost Analysis PR-2
APPROACHES & STRATEGIES
� Complete�the�LCCA�early�enough�in�the�project�so�that�its�results�can�be�considered�in�selecting�between�project�alternatives.�This�generally�means�it�should�happen�during�the�planning�stage�and�not�the�design�or�construction�stage.�
� Note�that�RealCost�and�BLCCA�software�are�not�required�for�this�credit;�however�any�other�method�used�must�conform�to�the�FHWA’s�Interim�Technical�bulletin�for�pavements,�Life�Cycle�Cost�Analysis�in�Pavement�Design�(Walls�&�Smith,�1998)�and�NCHRP�483�for�bridges.�
� Include�LCCA�considerations�in�the�technical�score�of�bidders�for�pavement�projects�in�order�for�it�to�be�considered�in�selecting�a�design�alternative�for�Design�Build�contract�delivery�methods.�This�is�because�the�actual�pavement�design�is�often�used�as�part�of�a�design�build�team’s�technical�score�in�determining�contract�award,�a�LCCA�of�alternative�designs�cannot�be�performed�by�the�agency�until�after�the�bid�competition�is�complete.�While�this�can�be�done,�LCCA�results�should�be�properly�weighted�so�that�they�influence�contract�award�in�a�manner�consistent�with�owner�wishes.�Unfortunately,�Gransberg�and�Molenaar�(2004)�showed�that�design�build�award�algorithms�often�do�not�weight�LCCA�concerns�heavily�enough�for�them�to�be�a�significant�factor�in�contract�award.�
� Incorporate�results�of�other�Related�Credits,�such�as�Project�Development:�Economy�and�Cost�Benefit�Analysis,�into�the�LCCA�for�consistency�across�the�whole�project.�
Example: Case Studies of LCCA
Rangaraju�et�al.�(2008)�report�on�LCCA�efforts�of�the�South�Carolina�DOT�and�list�several�case�studies�in�Appendix�E�(page�117)�that�deal�with�the�influence�of�discount�rate�and�analysis�period�on�LCCA�outcomes.�
The�entire�report,�Life�Cycle�Cost�Analysis�for�Pavement�(Rangaraju�et�al.�2008)�can�be�downloaded�at:�http://www.clemson.edu/t3s/scdot/pdf/projects/SPR656Final.pdf.�
Example: Washington State Department of Transportation (WSDOT) LCCA Protocol
WSDOT�follows�a�standard�LCCA�protocol�when�selecting�pavement�type�for�new�facilities.�This�protocol�is�based�on�the�FHWA’s�Life�Cycle�Cost�Analysis�in�Pavement�Design�(Walls�and�Smith,�1998)�and�uses�RealCost�software�for�calculations.�It�includes�specified�inputs�for�WSDOT�analysis�and�how�to�consider�results.�Of�note,�cost�difference�between�competing�alternatives�that�are�less�than�15�percent�are�considered�equal�based�on�the�uncertainty�of�input�values.�
The�WSDOT�Pavement�Type�Selection�Protocol�(2005)�is�available�for�download�here:�http://www.wsdot.wa.gov/biz/mats/Pavement/Technotes/PTSP_Jan2005.pdf.�
Example: Caltrans LCCA Procedures Manual
Caltrans�has�developed�a�manual�(Caltrans�2007)�that�describes�LCCA�procedures�for�use�in�Caltrans.�The�manual�is�based�on�RealCost�software�and�provides�standard�input�values�for�a�wide�range�of�potential�projects.�Caltrans�has�adopted�an�aggressive�policy�towards�using�LCCA�mandating�that�it�be�used�“…for�all�projects�with�include�pavement�work�on�the�State�Highway�System�regardless�of�funding�source…”�(Land�2007)�
The�manual�can�be�downloaded�at:�http://www.dot.ca.gov/hq/esc/Translab/ope/LCCA.html.�
POTENTIAL ISSUES
1. While�LCCA�is�a�fairly�standard�economic�analysis�tool,�the�potential�exists�to�input�incorrect�or�irrelevant�numbers�and�misuse�its�results.�Users�should�be�familiar�with�the�FHWA’s�Life�Cycle�Cost�Analysis�in�Pavement�Design�Interim�Technical�Bulletin�(Walls�and�Smith�1998,�currently�being�revised)�before�conducting�an�LCCA�with�RealCost�or�BLCCA.��
2. A�LCCA�assumes�that�the�benefits�associated�with�project�alternatives�are�equal.�Thus,�it�only�analyzes�costs.�Projects�with�different�benefits�between�alternatives�may�desire�a�more�comprehensive�cost�benefit�analysis.�
42

Greenroads™ Manual v1.5 Project Requirements
PR-2 Lifecycle Cost Analysis
3. The�meaningfulness�of�LCCA�outputs�relies�heavily�on�good�estimates�of�future�pavement�life,�rehabilitation�costs�and�the�interval�between�future�rehabilitation�efforts.�These�all�rely�on�good�engineering�judgment�and�past�history�rather�than�economic�theory�or�principals.���
4. LCCA�is�based�on�estimated�of�total�cost�and�can�be�easily�manipulated�by�changing�assumptions�and�input�values.��For�this�reason�the�results�should�not�be�weighted�too�heavily�in�the�choice�of�design�alternatives.��
5. This�credit�does�not�contain�a�requirement�to�use�or�implement�the�lowest�life�cycle�cost�project�alternative.�Therefore,�it�should�be�viewed�as�a�credit�that�creates�information�that�is�useful�in�decision�making�rather�than�a�decision�making�tool.�It�does�not�guarantee�a�lowest�life�cycle�cost�decision.��
6. This�credit�does�not�require�the�LCCA�to�be�done�during�the�planning�stage�where�it�would�be�most�likely�to�influence�project�decisions.�Therefore,�it�could�be�done�late�in�design,�or�even�during�construction,�meaning�it�would�be�undertaken�for�no�other�reason�than�to�meet�this�credit,�which�misses�the�point.�
7. Some�rehabilitation�efforts�and�even�other�efforts�that�take�a�systematic�approach�to�choosing�the�proper�project�features�(e.g.,�a�pavement�management�system),�there�may�not�be�a�choice�between�two�or�more�alternatives.�This�may�be�because�such�a�system�already�incorporates�a�form�of�LCCA,�or�it�may�be�because�no�other�alternative�is�reasonably�feasible.�
8. Other�prototype�software�programs�for�bridge�life�cycle�cost�analyses�have�been�developed�but�do�not�appear�to�be�in�widespread�use,�such�as�the�National�Institute�of�Standards�and�Technology’s�BridgeLCC�software�which�was�last�updated�in�2003�(available�at�http://www.bfrl.nist.gov/bridgelcc/welcome.html).�For�purposes�of�this�credit,�any�software�can�be�used�so�long�as�the�inputs�and�results�are�justifiable,�reasonable,�and�validated�by�the�professionals�working�on�the�project.�
RESEARCH Lifecycle�cost�analysis�(LCCA)�is�a�process�for�evaluating�the�total�cost�of�a�project,�facility�or�product�over�its�useful�lifetime.�For�roadway�projects,�this�means�accounting�for�initial�construction�costs,�maintenance�and�rehabilitation�costs,�roadway�user�costs�and�third�party�costs.�LCCA�can�contribute�to�the�sustainability�of�a�roadway�project�by�allowing�project�personnel�to�account�for�total�life�cycle�costs�when�making�key�project�decisions.�
An�important�distinction�must�be�made�between�LCCA�and�life�cycle�assessment�(LCA)�as�these�terms�use�confusingly�similar�acronyms.�Both�have�similar�utility�in�the�decision�making�process,�but�the�underlying�purpose,�scope�and�mathematical�model�for�each�are�different.�For�this�reason,�LCA�is�discussed�in�detail�in�other�credits�in�the�Greenroads�Manual�(see�PR�3�Lifecycle�Inventory�and�MR�1�Lifecycle�Assessment)�while�LCCA�is�discussed�here.�
Lifecycle�Cost�Analysis�Method�LCCA�is�simply�a�mathematical�accounting�tool�that�can�be�used�to�compare�the�value�of�money�at�different�times.�Underlying�the�LCCA�process�are�basic�principles�of�business�finance,�which�uses�compound�interest�formulas�(and�tables)�and�reasonable�assumptions�about�the�future�to�translate�different�economic�values�to�an�equal�reference�point�in�time.�LCCA�may�be�quite�familiar�to�many�transportation�professionals�in�the�form�of�cost�benefit�analysis�(CBA)�or�commonly�just�“engineering�economics.”�The�how�to�of�business�finance�and�engineering�economics�can�be�found�in�a�plethora�of�textbooks�and�will�not�be�discussed�in�depth�here.�
LCCA�is�a�useful�process�in�roadway�design�because�the�results�quantify�the�total�long�term�value�of�project�alternatives.�This�process�allows�for�straightforward�comparisons,�usually�in�terms�of�a�total�lifetime�cost�or�a�total�lifetime�benefits.�The�key�role�of�the�decision�maker�in�LCCA�is�determining�appropriate�assumptions�and�scope�for�the�comparison,�as�well�as�interpreting�and�acting�on�the�quantified�results.�
For�a�basic�example,�consider�a�roadway�project�with�two�design�alternatives;�one�is�a�thin�pavement�section�and�the�other�has�thicker�section.�The�initial�construction�cost�of�the�first�alternative�is�lower�than�the�second,�but�the�first�alternative�requires�additional,�more�frequent�expenditures�for�maintenance�throughout�its�lifetime.�The�project�manager�completes�an�LCCA�on�each�alternative.�The�results�show�that�while�first�alternative�is�less�expensive�for�initial�construction,�the�second�alternative�actually�has�a�much�lower�long�term�cost.�The�second�alternative�has�a�higher�upfront�cost�for�initial�construction,�but�saves�the�project�owner�more�money�over�time.�
43
Project Requirements Greenroads™ Manual v1.5
Lifecycle Cost Analysis PR-2
Because�this�comparison�is�not�limited�to�upfront�costs�alone,�a�project�manager�can�better�understand�how�their�design�and�construction�choices�contribute�to�the�overall�economic�impact�of�the�project.�
Lifecycle�Costing,�Roadways�and�Sustainability�There�is�substantial�writing�to�suggest�that�LCCA�contributes�to�sustainability.�Most�efforts�are�centered�on�buildings;�however,�the�FHWA�does�contribute�some�useful�information.�Considering�buildings,�the�Federal�Facilities�Council�recognized�the�relationship�between�life�cycle�costing�and�sustainable�development�by�stating:�
“Guidance�related�to�life�cycle�costing�and�value�engineering�was�recognized�as�being�supportive�of�sustainable�development,�in�particular�when�used�in�the�conceptual�planning�and�design�phases�of�acquisition,�where�decisions�are�made�that�substantially�affect�the�ultimate�performance�of�a�building�over�its�life�cycle�(Federal�Facilities�Council,�2001).”��
In�essence,�they�were�concerned�that�features�that�enhanced�sustainability�would�be�excluded�to�save�on�initial�costs�without�considering�life�cycle�costs�that�could�show�such�features�to�be�warranted.�The�FHWA�believes�LCCA�should�be�used�because�“…transportation�investment�decisions�should�consider�all�of�the�costs�incurred�during�the�period�over�which�alternatives�are�compared�(FHWA,�2002).”�This�means�considering�the�total�cost�to�the�owner,�users�and�externalities�rather�than�just�the�first,�or�construction,�cost.�
� Initial�construction.�Costs�incurred�during�the�initial�design�and�construction.�� Preservation.�Costs�to�maintain�and�rehabilitate�an�asset.�� Users.�Those�who�use�the�facility�incur�costs�during�normal�operation�and�during�construction�periods�(e.g.,�
time,�safety,�fuel�and�other�vehicle�operating�costs).�� Externalities.�Costs�that�indirectly�impact�the�users�or�the�environment�due�to,�for�example,�air�emissions�or�a�
natural�hazard.�
Prevalence�of�LCCA�and�BLCCA�According�to�the�comprehensive�state�of�the�practice�review�of�the�applications�of�lifecycle�costing�in�practice�by�Özbay�et�al.�(2004),�LCCA�has�been�in�use�to�some�extent�for�almost�40�years�for�pavement�selection.�The�authors�completed�a�three�year�study�that�surveyed�the�division�at�39�state�departments�of�transportation�(DOTs)�which�used�LCCA�the�most.�The�majority�of�respondents�in�the�survey�indicated�that�LCCA�is�applied�by:�
� Research�and�design�division�(68%)�� Materials�and�pavements�division�(37.5%)�� Bridge�offices�(12.5%)�
Additionally,�the�authors�found�that�all�agencies�surveyed�use�LCCA�on�some�form�of�pavement�projects.�In�fact,�60%�of�the�responding�agencies�have�adopted�formal�guidelines�for�pavement�LCCA.�However,�only�25%�of�those�surveyed�by�Ozbay�et�al.�(2004)�indicated�that�BLCCA�might�be�used�on�bridge�projects�at�their�state�agencies�while�100%�indicated�that�it�might�be�used�on�pavement�projects.�
State�of�the�Practice���Pavements�A�more�recent�study�for�the�South�Carolina�Department�of�Transportation�(Rangaraju�et�al.,�2008)�found�that�most�states�(i.e.�state�departments�of�transportation)�conduct�LCCA�but�to�varying�degrees.�Their�survey,�completed�in�2005,�had�responses�from�33�states�and�2�Canadian�Provinces�and�found:��
� 94%�(33�of�35)�of�the�agencies�use�LCCA�as�part�of�their�decision�making�process.�This�appears�to�be�an�increase�in�percentage�over�an�earlier�limited�2001�survey�that�found�8�of�16�responding�states�used�LCCA.��
� 69%�(24�of�35)�of�respondents�include�or�are�planning�to�include�user�costs�in�LCCA.�Typically�this�is�done�by�quantifying�user�delay�costs�during�construction�only.��
� Few�(only�2�out�of�32)�used�a�fully�probabilistic�approach�to�calculating�life�cycle�costs�while�others�did�conduct�sensitivity�analyses�to�determine�how�changes�in�assumed�parameters�affected�analysis�outcome.��
44
Greenroads™ Manual v1.5 Project Requirements
PR-2 Lifecycle Cost Analysis
State�of�the�Practice���Bridges�Ehlen�(1997)�provides�a�strong,�practical�argument�for�the�utility�of�systematic�application�of�BLCCA�and�Thompson�(2004)�also�provides�a�good�summary�of�the�state�of�BLCCA�in�bridge�practice.�He�notes�that�streamlined�tools�will�expand�application�opportunities�for�BLCCA,�especially�in�terms�of�network�level�bridge�management�systems,�but�much�more�refinement�may�be�necessary�for�uncertainties�and�assumptions�to�be�unified�from�project�to�project.�Much�of�the�lifecycle�literature�for�bridges�appears�to�be�relevant�to�optimization�of�the�project�and�network�level�bridge�management�systems.�These�references�are�discussed�in�more�detail�in�PR�9�Pavement�Management�System.�
However,�to�date,�the�most�comprehensive�work�on�BLCCA�was�completed�as�part�of�the�National�Cooperative�Highway�Research�Program�Report�483:�Bridge�Life�cycle�Cost�Analysis�(Hawk,�2003).�This�report�contains�details�on�specific�methodologies�that�may�be�relevant�to�bridge�designers,�as�well�as�limitations,�assumptions,�examples,�and�a�software�tool�called�BLCCA.�
Some�of�the�most�recent�work�that�is�relevant�to�sustainability�includes�early�BLCCA�work�by�Ehlen�(1999),�who�attempts�to�account�for�third�party�costs�(which�he�defines�as�costs�of�environmental�damages)�due�to�the�lifecycle�of�bridge�projects.�However,�values�of�zero�were�used�for�these�costs�in�his�model.�Lately,�BLCCA�literature�has�focused�more�on�reliability�studies�for�catastrophic�and�long�term�environmental�stressors�including�work�by�Lee,�Cho,�and�Cha�(2006),�Hosser�et�al.�(2008)�and�Padgett,�Dennemann,�and�Ghosh�(2010).�The�latter�authors�applied�LCCA�principles�using�a�risk�based�analysis�of�several�bridge�retrofit�options�subject�to�seismic�hazards.�The�study�may�be�particularly�relevant�to�practitioners�trying�to�model�their�bridge�to�determine�an�appropriate�retrofit�solution�and�maintenance�schedule.�
Impact�of�LCCA�Given�that�most�states�use�LCCA�in�some�form�already�this�credit�may�have�the�largest�effect�in�three�areas:�
1. Local�agencies�or�other�owners�who�do�not�typically�conduct�LCCAs.�RealCost�and�BLCCA�are�fairly�straightforward�free�software�tools�that�should�be�able�to�provide�answers�with�reasonable�effort.�
2. State�or�federal�projects�considered�too�small�for�LCCA.�Some�projects�(e.g.,�overlays�or�other�preservation�efforts)�are�generally�deemed�too�small�for�LCCA�and�have�historically�omitted�this�process�in�decision�making.�
3. Non�pavement�projects.�This�credit�may�encourage�the�wider�adoption�of�lifecycle�costing�on�non�pavement�projects�such�as�bridges�and�other�major�structures,�intelligent�transportation�systems,�or�other�types�of�assets�where�LCCA�applications�are�not�common�practice.�
GLOSSARY
REFERENCES California�Department�of�Transportation�(Caltrans).�(2007).�Life�Cycle�Cost�Analysis�Procedures�Manual.�State�of�
California�Department�of�Transportation,�Pavement�Standards�Team�&�Division�of�Design.�http://www.dot.ca.gov/hq/esc/Translab/ope/LCCA.html.�Accessed�11�November�2008.�
Agency�cost� A�cost�incurred�by�the�agency�of�a�roadway�such�as�maintenance,�repair,�rehabilitation,�improvement,�and�replacement�(Thompson,�2004)�
BLCCA� Bridge�Life�Cycle�Cost�AnalysisExternality� An�indirect�cost�incurred�by�any�party�due�to�the�project,�such�as�damage�to�
the�environment,�which�is�hard�to�quantify�using�traditional�accounting.�LCCA� Life�Cycle�Cost�AnalysisSalvage�value� The�estimated�monetary�value�of�an�asset�at�the�end�of�its�useful�life.Third�party�cost� See�Externality.User�cost� A�cost�incurred�by�the�users�of�a�roadway�such�as�collision�risk,�detours,�and�
time�delay�(Thompson,�2004)�
45

Project Requirements Greenroads™ Manual v1.5
Lifecycle Cost Analysis PR-2
Ehlen,�M.�A.�(1997).�Life�Cycle�Costs�of�New�Construction�Materials.�Journal�of�Infrastructure�Systems.�3(4),�129�133.�
Ehlen,�M.�A.�(1999).�“Life�cycle�costs�of�fiber�reinforced�polymer�bridge�decks.”�J.�Mater.�Civ.�Eng.�113,�224–230.�
Federal�Facilities�Council.�(2001).�Sustainable�Federal�Facilities:�A�Guide�to�Integrating�Value�Engineering,�Life�Cycle�Costing,�and�Sustainable�Development.�Federal�Facilities�Council�Technical�Report�No.�142,�National�Academy�Press,�Washington,�D.C.��
Federal�Highway�Administration�(FHWA).�(2002).�Life�Cycle�Cost�Analysis�Primer.�Office�of�Asset�Management,�FHWA,�U.S.�Department�of�Transportation,�Washington�D.C.��
Federal�Highway�Admnistration�(n.d).�“Fact�Sheets�on�Highway�Provisions,�”SAFETEA�LU�Fact�Sheets�–�Stewardship�and�Oversight.�Available�at�http://www.fhwa.dot.gov/safetealu/factsheets/stewardover.htm�Accessed�31�December�31,�2010.�
Gransberg,�D.D.�&�Molenaar,�K.R.�(2004).�Life�Cycle�Cost�Award�Algorithms�for�Design/Build�Highway�Pavement�Projects.�Journal�of�Infrastructure�Systems,�Vol.�10,�Issue�4,�pp.�167�175.��
Hawk,�H.�(2003).�Bridge�life�cycle�cost�analysis.�National�Cooperative�Highway�Research�Program�Report�483.�Washington,�D.C:�Transportation�Research�Board,�National�Research�Council.�
Hosser,�D.,�Klinzmann,�C.,�&�Schnetgoke,�R.�(2008).�A�framework�for�reliability�based�system�assessment�based�on�structural�health�monitoring.�Structure�and�Infrastructure�Engineering,�4,�4,�271�285.�
Land,�R.D.�(2007).�Use�of�Life�Cycle�Cost�Analysis�for�Pavements.�Memorandum�to�District�Directors�from�the�State�of�California�Department�of�Transportation�Chief�Engineer.�Available�at�http://www.dot.ca.gov/hq/esc/Translab/ope/Use�of�LCCA�for�Pavements.pdf.�Accessed�11�November�2008.��
Lee,�K.�M.,�Cho,�H.�N.,�&�Cha,�C.�J.�(2006).�Life�cycle�cost�effective�optimum�design�of�steel�bridges�considering�environmental�stressors.�Engineering�Structures,�28,�9,�1252�1265.�
Özbay,�K.�et�al.�(2004).�Life�cycle�cost�analysis:�State�of�the�practice�versus�state�of�the�art.�Transportation�Research�Record,�1864,�62�70.�
Padgett,�J.�E.,�Dennemann,�K.,�&�Ghosh,�J.�(2010).�Risk�based�seismic�life�cycle�costbenefit�(LCC�B)�analysis�for�bridge�retrofit�assessment.�Structural�Safety.�32(3),�165.�
Rangaraju,�P.R.;�Amirkhanian,�S.�&�Zeynep,�G.�(2008).�Life�Cycle�Cost�Analysis�for�Pavement.�Report�by�Clemson�University�for�the�South�Carolina�Department�of�Transportation,�Columbia,�SC.�Available�at�http://www.clemson.edu/t3s/scdot/pdf/projects/SPR656Final.pdf.�Accessed�17�October�2008.�
Thompson,�P.D.�(2004).�Bridge�life�cycle�costing�in�Integrated�Environment�of�Design,�Rating�and�Management.�Transportation�Research�Record.��
Walls,�J.�&�Smith,�M.R.�(1998).�Life�Cycle�Cost�Analysis�in�Pavement�Design.�Interim�Technical�Bulletin.�Report�No.�FHWA�SA�98�079.�FHWA,�U.S.�Department�of�Transportation,�Washington,�D.C.��
Washington�State�Department�of�Transportation�(WSDOT).�(2005).�Pavement�Type�Selection�Protocol.�Environmental�and�Engineering�Programs�Division,�Materials�Laboratory,�WSDOT,�Olympia,�WA.�http://www.wsdot.wa.gov/biz/mats/Pavement/Technotes/PTSP_Jan2005.pdf.�Accessed�11�November�2008.�
�
46

Greenroads™ Manual v1.5 Project Requirements
PR-3 Lifecycle Inventory
LIFECYCLE INVENTORY GOAL Incorporate energy and emissions information into the decision‐making process for pavement design alternatives.
REQUIREMENTS Complete a lifecycle inventory for the final pavement design alternative for the project using the software tool Roadprint, created by Dr. Yen‐Yu Lin at the University of Washington, or approved equal. Report only results for total energy use and global warming potential (GWP) (in carbon dioxide equivalent emissions, CO2e) for the final pavement design alternative. The following input values are required for Roadprint:
Total weight and types of virgin materials. This includes aggregates, binders, base materials, and structures. These amounts can be design estimates or constructed totals.
Total weight and types of recycled materials. Roadprint models emissions and energy for several types of materials.
Expected transportation distances for all materials. This means distances from source to production as well as from production to site. Transportation of waste to disposal is also included.
Expected construction vehicle types. These include, but are not limited to, pavers, mixers, hauling vehicles, excavators, rollers, and finishing equipment.
Estimated design life. Use the same input data as used in the PR‐2 Lifecycle Cost Analysis.
Scheduled years and expected type of maintenance. Use the same input data as used in the PR‐2 Lifecycle Cost Analysis. This information should also match the project specifications provided to meet the requirements for PR‐9 Pavement Maintenance Plan and PR‐10 Site Maintenance Plan.
Details
There are several built‐in limitations to the Roadprint tool, which are discussed in detail in the modified tool documentation. We recommend use of this tool because we are aware of these limitations, we have checked the data sources, we know that the software reports the two requested pieces of information reliably for both asphalt and concrete pavements (even with a variety of recycled materials), and we find it relatively easy to use. The tool is available on the Greenroads website (http://www.greenroads.us) for download.
There are a few other software tools that are available for developing lifecycle inventories, both free and proprietary. These tools are also acceptable if they are able to produce energy use and GWP outputs and use a transparent interface that clearly references data sources used to compute these values.
DOCUMENTATION A copy of the input/output page for Roadprint. If other software is used, provide a
list of data sources in addition to the input list and output values for total energy use and GWP.
PR-3
REQUIRED
RELATED CREDITS
PR‐2 Lifecycle Cost Analysis
PR‐9 Pavement Management System
PR‐10 Site Maintenance Plan
MR‐1 Lifecycle Assessment
SUSTAINABILITY COMPONENTS
Ecology Equity Extent Expectations Exposure
BENEFITS
Improves Accountability
Increases Awareness Creates New
Information
Greenroads™ Manual v1.5 Project Requirements
PR-4 Quality Control Plan
QUALITY CONTROL PLAN GOAL Have�a�process�in�place�to�monitor�and�improve�construction�quality.�
REQUIREMENTS The�prime�contractor�shall�establish,�implement,�and�maintain�a�formal�construction�Quality�Control�Plan�(QCP).��The�QCP�must�address�the�following�quality�control�elements:�
1. Key�quality�control�personnel,�their�responsibilities�and�their�qualifications�(résumés,�certifications,�etc.).�
2. Procedures�used�to�control�quality�during�construction�including�(as�a�minimum):�
a. Items�to�be�monitored�(including�pavement�mix�designs)�b. Testing�to�be�done�(including�testing�standards�and�frequency)�c. When�corrective�action�is�required�(action�limits)�d. Procedures�to�implement�corrective�action�e. Procedures�to�modify�QCP�if�ineffective�or�when�modifications�are�necessary�
Details
Some�state�and�local�owner�agencies�already�have�requirements�for�such�plans�written�in�to�their�standard�specifications.�Such�existing�requirements�should�be�able�to�meet�the�requirements�above,�however�some�only�address�construction�quality�for�hot�mix�asphalt�(HMA)�or�Portland�cement�concrete�(PCC)�paving�and�not�construction�of�the�overall�project.�Testing�frequency�and�test�procedures�should�not�be�based�on�minimum�owner�requirements�for�acceptance.�
Some�state�highway�agencies�use�contractor�testing�in�their�acceptance�process.�In�these�cases�the�independent�assurance�tests�must�be�performed�on�samples�that�are�taken�independently�of�quality�control�samples.�Quality�control�plans�are�required�in�these�cases,�as�defined�in�CFR�637,�Title�23.��
The�Quality�Control�Plan�should�cover�all�project�construction;�not�just�the�pavement.�Subcontractors�need�to�be�included�in�this�plan,�which�typically�means�identifying�a�responsible�party�and�obtaining�a�quality�control�procedure�from�the�subcontractor.�
A�large�document�that�repeats�language�from�the�contract�specifications�should�not�be�generated�for�this�Project�Requirement.�Rather,�the�document�should�clearly�identify�the�major�aspects�of�the�prime�contractor’s�plan�to�control�project�construction�quality�and�who�is�responsible�for�implementing�those�aspects.�A�reasonable�Quality�Control�Plan�for�a�typical�roadway�project�(i.e.,�less�than�$10�million�contract�price)�can�be�written�in�about�6�to�12�pages�(FLHD,�1998).�A�Quality�Control�Plan�should�be�approved�by�the�owner�before�construction�begins.���
DOCUMENTATION � Copy�of�the�contractor�Quality�Control�Plan.�
PR-4
REQUIRED
RELATED CREDITS
� CA�1�Quality�Management�System
� CA�8�Contractor�Warranty�
� PT�1�Long�Life�Pavement�
� PT�6�Pavement�Performance�Tracking�
SUSTAINABILITY COMPONENTS
� Economy�� Extent�� Expectations�
BENEFITS
� Increases�Service�Life� Improves�Human�
Health�&�Safety�� Reduces�Lifecycle�
Costs�� Improves�
Accountability��
65

Project Requirements Greenroads™ Manual v1.5
Quality Control Plan PR-4
APPROACHES & STRATEGIES
� Write�a�Quality�Control�Plan.�Often�this�can�be�accomplished�by�having�a�prime�contractor�with�an�established�quality�control�manual�and�then�writing�a�plan�that�refers�to�that�manual�for�procedures�and�identifies�key�personnel,�materials�and�processes�associated�with�the�particular�project�in�question.��
Example: Agencies with Quality Control Plans
Many�owners�already�require�QCPs�in�their�standard�specifications.�Following�are�examples�of�both�comprehensive�QCPs�that�cover�all�of�construction�and�some�that�just�refer�to�paving�operations.�
QCPs�Covering�All�of�Construction�These�plans�do�meet�the�requirements�for�PR�4.�
� Federal�Lands�Highway�Division.�This�document�discusses�a�QCP�that�covers�all�construction�aspects�and�provides�a�fictitious�example:�http://www.wfl.fhwa.dot.gov/resources/construction/field�notes/documents/d�02�15.pdf.�
� Florida�Department�of�Transportation�(FDOT).�FDOT’s�Construction�Project�Administration�Manual�(2007)�describes�FDOT�requirements�and�how�to�use�a�contractor’s�quality�control�manual�to�supplement�a�QCP�in�Section�3.3.�Section�6�8�of�the�FDOT�2007�Standard�Specifications�for�Road�and�Bridge�Construction�requires�a�contractor�quality�control�program:�http://www.dot.state.fl.us/construction/manuals/cpam/CPAMManual.shtm��
� Saskatchewan�Highways�and�Transportation:�The�Standard�Test�Procedure�Manual�(1994)�Standard�Test�400�(last�updated�in�1994)�describes�what�a�quality�control�plan�does�and�its�minimum�elements:�http://www.highways.gov.sk.ca/standard�test���
�QCPs�Covering�Paving�Operations�Only�These�plans�do�not�meet�the�requirements�for�PR�4.�
� Alabama�DOT�(ALDOT)�ALDOT�375�91:�http://www.dot.state.al.us/NR/rdonlyres/A1E8B299�F518�41BF�B0A9�2326C1177C91/0/ALDOT375ApprovedFHWAOctober202008_.pdf��
� Illinois�DOT�HMA�QCP�template:�http://www.dot.state.il.us/aero/PDF/HMA%20QC%20plan%20template.pdf��
� North�Carolina�DOT�Section�609�of�the�Standard�Specifications:�http://www.ncdot.org/doh/preconstruct/ps/specifications/english/s609.html���
� Unified�Facilities�Guide�Specifications,�Section�3.10:�http://www.wbdg.org/ccb/DOD/UFGS/UFGS%2032%2012%2016.pdf���
Many�other�organizations�also�have�guides�and�specifications�for�contractor�Quality�Control�Plans.�
POTENTIAL ISSUES
1. It�is�not�possible�to�determine�from�the�content�of�the�QCP�whether�quality�construction�will�result.�Therefore,�this�credit�does�not�guarantee�quality�construction�in�any�way.�
2. A�contractor�Quality�Control�Plan�that�only�addresses�paving�operations�is�not�sufficient�to�meet�the�intent�of�this�credit.�For�some�owners,�standard�specification�language�may�only�require�a�Quality�Control�Plan�for�the�paving�operation.�While�paving�needs�to�be�covered�in�the�Quality�Control�Plan,�all�other�major�components�of�construction�(e.g.,�structures,�earthwork,�drainage,�traffic�control�items,�etc.)�must�also�be�covered.��
3. The�Quality�Control�Plan�should�not�be�a�repeat�of�the�technical�specifications.�Rather,�the�plan�should�address�who�is�responsible�for�quality�control�for�a�particular�item�or�process,�when�key�inspections�are�made,�when�corrective�actions�are�to�be�taken�and�how�they�are�to�be�taken.�
4. A�formal�process�for�monitoring�and�improving�construction�quality�should�not�conflict�with�minimum�quality�standards�that�are�maintained�by�the�roadway�owner.�
66
Greenroads™ Manual v1.5 Project Requirements
PR-4 Quality Control Plan
RESEARCH Construction�quality�can�significantly�influence�final�project�quality�and�performance.�Poor�construction�can�lead�to�early�and�excessive�maintenance�and/or�early�replacement.�This�costs�more�money�and�uses�more�resources�leading�to�a�less�sustainable�project.�Unfortunately,�there�is�a�general�lack�of�empirical�evidence�to�document�these�items�as�they�are�often�taken�to�be�intuitively�obvious.�This�section,�therefore,�presents�a�discussion�of�several�pavement�items�since�for�these�items�there�is�substantial�evidence�that�construction�quality�impacts�performance�and�cost.��
Subgrade�and�Base�Compaction�Subgrade�or�base�material�that�is�not�adequately�compacted�may�settle�over�time,�which�in�turn�causes�the�overlying�pavement�to�settle�and�crack.�This�can�lead�to�roughness�and�early�pavement�failure.�Often�adequate�subgrade�density�is�described�in�terms�of�relative�density�(e.g.,�90�or�95�percent�of�maximum�density).���
Hot�Mix�Asphalt�(HMA)�Density�Compaction�is�the�greatest�determining�factor�in�dense�graded�hot�mix�asphalt�performance�(Scherocman�&�Martenson,�1984;�Scherocman,�1984;�Geller,�1984;�Brown,�1984;�Bell�et.�al.,�1984;�Hughes,�1984;�Hughes,�1989).�Inadequate�compaction�results�in�a�pavement�with�decreased�stiffness,�reduced�fatigue�life,�accelerated�aging/decreased�durability,�rutting,�raveling,�and�moisture�damage�(Hughes,�1984;�Hughes,�1989).���
HMA�Aggregate�Segregation�Based�on�several�articles�(Kennedy�et�al.,�1987;�Brown�&�Brownfield,�1988;�Williams�et�al.,�1996a�and�1996b;�Khedaywi�&�White,�1996;�American�Association�of�State�Highway�and�Transportation�Officials:�AASHTO,�1997)�the�commonly�accepted�qualitative�definition�of�aggregate�segregation�is�“the�non�uniform�distribution�of�coarse�and�fine�aggregate�components�within�the�asphalt�mixture.”�The�chief�detrimental�effects�of�segregation�on�HMA�performance�are:�reduced�fatigue�life,�rutting,�raveling,�and�moisture�damage.�These�effects�can�cause�a�severe�reduction�in�pavement�life.�More�information�on�segregation�causes�and�cures�can�be�found�in�Segregation�Causes�and�Cures�for�Hot�Mix�Asphalt�(QIP�110)�by�AASHTO�and�the�National�Asphalt�Pavement�Association�(NAPA).��
HMA�Temperature�Differentials�HMA�temperature�differentials�are�large�mat�temperature�differences�resulting�from�placement�of�a�significantly�cooler�portion�of�HMA�mass�into�the�mat.�This�cooler�mass�comes�from�the�surface�layer�(or�crust)�typically�developed�during�HMA�transport�from�the�mixing�plant�to�the�job�site.�These�cooler�areas�will�reach�cessation�temperature�more�quickly�than�the�surrounding�mat.�Roller�patterns�developed�based�on�general�mat�temperatures�may�not�be�adequate�to�compact�these�cooler�areas�before�they�cool�to�cessation�temperature�resulting�in�isolated�spots�of�inadequate�compaction.�Thus,�temperature�differentials�can�cause�isolated�areas�of�inadequate�compaction�resulting�in�decreased�strength,�reduced�fatigue�life,�accelerated�aging/decreased�durability,�rutting,�raveling,�and�moisture�damage�(Hughes,�1984;�Hughes,�1989).�
Portland�Cement�Concrete�(PCC)�Consolidation�Consolidation�is�the�process�of�making�the�freshly�placed�PCC�into�a�more�uniform�and�compact�mass�by�eliminating�undesirable�air�voids�and�causing�it�to�move�around�potential�obstructions�(such�as�reinforcing�steel).��This�is�usually�accomplished�using�vibrators.�Inadequate�consolidation�can�lead�to�undesirable�air�voids�that�can�weaken�PCC�or�be�unsightly.��
Pavement�Roughness�Pavement�roughness�is�an�expression�of�irregularities�in�the�pavement�surface�that�adversely�affect�the�ride�quality�of�a�vehicle�(and�thus�the�user).�Roughness�affects�not�only�ride�quality�but�also�vehicle�delay�costs,�fuel�consumption�and�maintenance�costs.�The�World�Bank�found�road�roughness�to�be�a�primary�factor�in�the�analyses�and�trade�offs�involving�road�quality�vs.�user�cost�(UMTRI,�1998).�Other�studies�(e.g.,�Papagiannakis�&�Delwar,�2001;�Barnes�&�Langworthy,�2003)�have�attempted�to�quantify�the�cost�of�vehicle�operation�in�relation�to�pavement�roughness.�
67

Project Requirements Greenroads™ Manual v1.5
Quality Control Plan PR-4
GLOSSARY
AASHTO� American�Association�of�State�Highway�and�Transportation�OfficialsAggregate�segregation� the�non�uniform�distribution�of�coarse�and�fine�aggregate�components�within�
the�asphalt�mixture�(Kennedy�et.�al.,�1987;�Brown�and�Brownfield,�1988;�Williams�et.�al.,�1996a�and�1996b;�Khedaywi�and�White,�1996;�American�Association�of�State�Highway�and�Transportation�Officials:�AASHTO,�1997)�
Consolidation� the�process�of�making�the�freshly�placed�portland�cement�concrete�into�a�more�uniform�and�compact�mass�by�eliminating�undesirable�air�voids�
HMA� Hot�mix�asphaltNAPA� National�Asphalt Paving�AssociationPavement�roughness� an�expression�of�irregularities�in�the�pavement�surface�that�adversely�affect�
the�ride�quality�of�a�vehicle�(and�thus�the�user)�PCC� Portland�cement�concrete�
REFERENCES Alabama�Department�of�Transportation�(ALDOT).�(2008).�ALDOT�375�91:�Contractor�Quality�Control�System�for�
Hot�Mix�Asphalt.�Revision�10/20/2008.�From�the�ALDOT�Bureau�of�Materials�and�Tests�Testing�Manual.�Accessed�11�November�2008.��Available�at�http://www.dot.state.al.us/NR/rdonlyres/A1E8B299�F518�41BF�B0A9�2326C1177C91/0/ALDOT375ApprovedFHWAOctober202008_.pdf.��
Federal�Lands�Highway�Division�(FLHD).�(1998).�Contractor�Quality�Control�Plans:�Contractor�Guidelines�and�Example�Quality�Control�Plan.�Federal�Highway�Administration�(FHWA),�Federal�Lands�Highway�Office,�Engineering�and�Operations�Division�(HFL�20),�Washington,�D.C.�Accessed�11�November�2008.��Available�at�http://www.cflhd.gov/resources/construction/documents/qc_plans.pdf.�
Florida�Department�of�Transportation�(FDOT).�(2007).�Construction�Project�Administration�Manual�(CPAM).�700�000�000.�Office�of�Construction,�FDOT.�Accessed�11�November�2008.��Available�at�http://www.dot.state.fl.us/construction/manuals/cpam/CPAMManual.shtm.�
Florida�Department�of�Transportation�(FDOT).�(2007).�Standard�Specifications�for�Road�and�Bridge�Construction�2007.�Accessed�11�November�2008.��Available�at�http://www2.dot.state.fl.us/SpecificationsEstimates/Implemented/CurrentBK/Default.aspx.�
Illinois�Department�of�Transportation�(IDOT).�(no�date).�Hot�Mix�Asphalt�(HMA)�Quality�Control�Plan�template.�IDOT�Division�of�Aeronautics.�Accessed�11�November�2008.��Available�at�http://www.dot.state.il.us/aero/PDF/HMA%20QC%20plan%20template.pdf.�
Saskatchewan�Highways�and�Transportation.�(1994).�Contractor�Quality�Control�Plan.�Standard�Test�Procedure�400�from�the�Standard�Test�Procedures�Manual,�Quality�Assurance�section.�Accessed�11�November�2008.��Available�at�http://www.highways.gov.sk.ca/standard�test.�
U.S.�Army�Corps�of�Engineers�(USACE).�(2008).�Unified�Facilities�Guide�Specifications.�UFGS�32�12�16.�Accessed�11�November�2008.��Available�at�http://www.wbdg.org/ccb/DOD/UFGS/UFGS%2032%2012%2016.pdf.�
68

Greenroads™ Manual v1.5 Project Requirements
PR-5 Noise Mitigation Plan
NOISE MITIGATION PLAN GOAL Reduce�or�eliminate�annoyance�or�disturbance�to�surrounding�neighborhoods�and�environments�from�road�construction�noise.�
REQUIREMENTS Establish,�implement,�and�maintain�a�formal�Noise�Mitigation�Plan�(NMP)�during�construction�for�the�prime�contractor.�The�NMP�must�address,�at�minimum,�the�following�elements:�
1. Responsible�party�for�noise�mitigation�activities,�contact�information,�their�responsibilities�and�their�qualifications.�Include�information�for�NMP�preparer,�if�applicable�or�completed�by�an�outside�party.�
2. Project�location�and�distance�to�closest�receptor�of�noise.�Include�a�description�of�the�surrounding�zoning�and�parcel�information�(i.e.,�commercial,�residential,�hospitals,�schools,�parks,�sensitive�habitat).�
3. A�list�of�proposed�construction�activities�(e.g.�demolition,�excavation,�paving,�bridge�foundations,�finishing).�
4. Dates�and�working�hours�of�proposed�construction�activities.�5. A�list�of�noise�generating�devices�used�during�each�construction�activity�listed�in�#3.��6. A�list�of�noise�mitigating�devices�used�during�each�construction�activity�listed�in�#3,�
including�personal�safety�equipment�requirements�for�all�site�employees.�7. Noise�permit�numbers,�agency�or�local�authority�policies�associated�with�
construction�work,�as�applicable.�8. Description�of�noise�monitoring�standards,�methods,�and�acceptable�levels.�9. Description�of�correction�procedures�for�non�compliant�noise�levels.�10. Signature�of�responsible�party.�
Details
The�NMP�should�cover�all�of�construction,�including�subcontractor�work�activities.�Some�state�and�local�owner�agencies�already�have�requirements�for�such�plans�written�in�their�standard�specifications.�However,�a�written�specification�requiring�the�prime�contractor�to�have�a�Noise�Mitigation�Plan�is�insufficient,�especially�because�many�local�authorities�and�owner�agencies�offer�certain�exemptions�to�their�policies,�such�as�daylight�work�schedules�or�projects�with�minimal�areas�of�land�disturbing�activities.�
A�large�document�need�not�be�generated�for�this�requirement.�For�projects�that�are�deemed�locally�exempt�(as�noted�above),�show�that�the�prime�contractor�has�completed�a�review�of�noise�as�part�of�project�planning.�The�New�York�Department�of�Environmental�Protection�(NYDEP�2008)�offers�a�4�page�checklist�style�NMP�that�addresses�all�of�the�elements�above,�except�for�items�9�and�10,�which�can�be�easily�addressed�in�1�page:�http://nyc.gov/html/dep/pdf/noise_mitigation.pdf.���
DOCUMENTATION � Copy�of�the�Noise�Mitigation�Plan.�� A�copy�of�any�applicable�noise�permits,�or�agency�or�local�authority�noise�policies�(a�
live�hyperlink�to�any�large�policy�documents�is�sufficient).�
PR-5
REQUIRED
RELATED CREDITS
� PR�1�Environmental�Review�Process�
� PT�5�Quiet�Pavement
SUSTAINABILITY COMPONENTS
� Equity�� Expectations�� Experience�� Exposure�
BENEFITS
� Improves�Human�Health�&�Safety�
� Improves�Accountability�
� Increases�Awareness� Increases�Aesthetics�
69

Project Requirements Greenroads™ Manual v1.5
Noise Mitigation Plan PR-5
APPROACHES & STRATEGIES
� Read�the�Federal�Highway�Administration�(FHWA)�Highway�Construction�Noise�Handbook�(Knauer�et�al.,�2006)�to�understand�the�aspects�of�construction�noise�that�could�be�relevant�to�your�project.�The�Highway�Construction�Noise�Handbook�is�available�as�a�web�document�at:�http://www.fhwa.dot.gov/environment/noise/handbook/index.htm.�The�Handbook�is�a�relatively�short�read—Chapters�5�8�may�be�especially�helpful�for�prime�contractors�or�project�leads�not�familiar�with�NMPs.�
� Complete�the�NMP�during�the�environmental�review�process,�when�the�environmental�documentation�is�being�generated.�Most�environmental�review�regulations�at�federal�and�state�levels,�including�the�National�Environmental�Policy�Act�(NEPA),�include�an�investigation�of�noise�related�project�impacts�to�surrounding�communities,�and�these�impacts�often�can�be�addressed�in�short�narrative�form�(Knauer�et�al.,�2006).�
� Use�the�checklist�style�NMP�available�from�the�NYDEP�as�a�template�to�create�and�assemble�custom�owner�agency�NMPs�for�use�on�future�projects.�The�NYDEP�checklist�is�available�here:�http://nyc.gov/html/dep/pdf/noise_mitigation.pdf�
� Estimate�noise�levels�from�your�construction�project�by�using�the�Roadway�Construction�Noise�Model�(RCNM)�software�available�from�the�FHWA�(Reheman�et�al.,�2006).�A�user’s�guide�for�the�software�program�is�also�available�as�part�of�the�Highway�Construction�Noise�Handbook�as�an�Appendix.�Most�projects�will�not�need�comprehensive�or�detailed�noise�modeling�and�simplified�manual�noise�analysis�will�be�adequate�(Knauer�et�al.,�2006).�However,�local�noise�ordinances�may�be�more�stringent�than�what�is�called�for�in�the�environmental�review�requirements�and�may�need�more�detailed�analysis.�(Knauer�et�al.,�2006)�The�RCNM�software�tool�is�available�for�free�download�here:�http://www.fhwa.dot.gov/environment/noise/cnstr_ns.htm.�
� Communicate�to�stakeholders�that�noise�mitigation�is�actively�being�investigated�on�your�project�and�that�a�plan�is�being�developed.�This�may�help�quell�the�potential�“political�noise”�that�often�stems�from�too�much�“construction�noise”�(Thalheimer,�2000),�especially�for�high�impact,�high�dollar,�or�sensitive�public�projects.�
� Hire�an�acoustical�engineering�firm�or�other�qualified�professional�to�complete�the�NMP.�� Deliver�noise�awareness�training�regarding�the�noise�mitigation�strategies�and�noise�safety�efforts�employed�on�
the�project�to�all�construction�project�employees,�including�subcontractor�employees.�This�training�will�help�ensure�that�the�NMP�is�implemented�effectively.�
� Review�individual�state�and�local�jurisdiction�noise�ordinances�and�any�permits�or�agency�coordination�efforts�during�the�project�development�process.�Sometimes�these�ordinances�contain�restrictions�associated�with�construction�noise�levels,�even�though�there�are�currently�no�federal�regulations�for�noise�levels.��
� Identify�noise�abatement�opportunities�during�project�design.�Such�things�as�locating�storage�areas,�stationary�equipment,�haul�roads�and�detours�away�from�sensitive�receivers,�planning�for�concurrent�construction,�maintaining�existing�noise�barriers�for�use�during�construction�and�scheduling�the�construction�of�new�noise�barriers�early�on�in�the�project,�can�reduce�noise�impacts.�
� Achieve�mitigation�of�noise�at�the�source�by�specifying�use�of�less�noisy�equipment,�requiring�muffler�systems�on�equipment,�employing�shields�and�modifying�vehicles�and�equipment�to�reduce�noise�levels.�
� Achieve�path�mitigation�by�building�noise�barriers,�using�tiered�or�layered�vegetative�barriers�(Anderson,�Mulligan�&Goodman,�1984),�or�using�existing�barriers�where�appropriate.�
� Achieve�receiver�mitigation�by�sealing�intakes�of�sensitive�receivers,�acoustic�window�treatments�(Thalheimer,�2000)�or,�where�feasible,�by�temporarily�relocating�residents.�
Example: Noise Mitigation Plan Sample Forms – City of New York, NY
The�New�York�City�Department�of�the�Environmental�Protection�(NYDEP,�2008)�enacted�new�noise�rules�in�2007�for�construction�activities�requiring�that�unique�noise�mitigation�plans�are�adopted,�posted,�applied,�and�monitored�on�construction�projects�when�specific�devices�are�used�or�certain�activities�are�performed�within�city�limits.�Their�municipal�code�rules�list�typical�equipment,�activities,�and�other�devices�that�produce�noise,�and�also�establish�minimum�noise�levels�allowed�for�construction�activities.�The�intent�of�the�noise�requirements�is�“to�inform�the�user�of�the�required�plan�elements�that�a�responsible�party�must�include�when�the�listed�devices�are�being�used�on�site,�and�the�mitigation�strategies�and�best�management�practices�that�are�being�employed”�(NYDEP,�2008).�Alternative�noise�mitigation�plans�(ANMPs)�may�also�be�filed�if�the�project�
70

Greenroads™ Manual v1.5 Project Requirements
PR-5 Noise Mitigation Plan
cannot�comply�with�the�sound�level�criteria�without�undue�hardship�and�can�reduce�or�exempt�certain�activities�from�non�compliance�penalties.�
� The�NYDEP�Sample�Noise�Mitigation�Plan�is�available�here:�http://nyc.gov/html/dep/pdf/noise_mitigation.pdf�� The�NYDEP�Sample�Alternative�Noise�Mitigation�Plan�is�available�here:�
http://nyc.gov/html/dep/pdf/noise_alternative_mitigation.pdf�
Additional�information�about�NYDEP’s�noise�code�and�noise�mitigation�planning�rules�for�construction�projects�are�available�at:�http://nyc.gov/html/dep/html/noise/index.shtml�
Example: Case Study — Central Artery/Tunnel (“The Big Dig”) in Boston, MA
This�case�study�summarizes�the�article�by�Thalheimer�(2000),�which�describes�the�noise�control�program�for�the�Central�Artery/Tunnel�(CA/T)�project�in�Boston,�Massachusetts.�The�CA/T�may�be�more�commonly�recognized�by�the�public�as�the�“Big�Dig,”�and�it�was�an�engineering�mega�project�with�“the�most�comprehensive�and�stringent�construction�noise�control�specification�of�any�public�works�project�in�the�country.”�The�sheer�size�and�duration�of�its�construction�impacts�on�the�Boston’s�residents�and�businesses�made�noise�mitigation�a�crucial�aspect�of�the�project.�Note�that�most�projects�will�not�need�to�provide�nearly�the�level�of�detail�as�that�required�for�noise�mitigation�on�the�Central�Artery/Tunnel�(CA/T),�however�the�approaches�and�strategies�used�for�this�project�helped�develop�many�of�the�guidance�documents�that�are�available�on�construction�noise,�such�as�the�FHWA�Highway�Construction�Noise�Handbook�(Knauer�et�al.,�2006).�
The�project�was�championed�by�the�former�Massachusetts�Turnpike�Authority�(MTA),�which�is�currently�managed�by�the�Massachusetts�Department�of�Transportation�(MassDOT)�Highway�Division.�Construction�began�in�1991�and�was�considered�complete�in�2006,�with�a�multibillion�dollar�price�tag.�More�information�about�the�Big�Dig�project�can�be�found�at�the�following�site:�http://www.massdot.state.ma.us/Highway/bigdig/bigdigmain.aspx.�
The�project’s�noise�control�program�had�two�main�goals:�1)�meet�the�commitments�for�mitigating�environmental�noise�as�stated�in�the�environmental�impact�report�and�2)�control�construction�noise�without�posing�hardship�to�local�communities,�project�budget�or�construction�schedule�to�the�maximum�extent�feasible.�Meeting�these�goals�posed�a�significant�challenge�because�construction�activity�occurred�at�all�times�of�day�in�many�areas�of�Boston,�and�sometimes�in�very�close�proximity�(with�10�feet)�of�residences�and�sensitive�locations.�Additionally,�the�project�was�critical�politically:�function�of�Boston’s�core�infrastructure�depended�on�the�outcome�and�the�level�of�stakeholder�involvement�was�extraordinarily�high.�
The�Noise�Mitigation�Program�for�the�CA/T�involved�establishing�lot�line�and�equipment�emission�noise�criteria�limits,�defining�operational�and/or�equipment�restrictions�and�also�required�the�submission�of�noise�control�and�monitoring�plans,�baseline�and�compliance�noise�data,�equipment�noise�certification�tests,�and�designs�for�proposed�noise�mitigation�measures.�“Mitigation�measures�were�implemented�only�when�justified�based�on�careful�consideration�of�all�relevant�technical,�cost�and�policy�issues.”��
The�NMP�prioritized�mitigation�measures�as�follows:�source�control,�path�control,�and�finally�receptor�control.�Source�control�was�most�effective�and�easiest�to�monitor,�but�where�this�was�not�possible,�path�control�measures�were�implemented�to�block�sound�directed�at�receptors.�Path�control�options�were�considered�cost�effective�only�if�they�could�prevent�noise�at�multiple�receptors.�Receptor�control�was�also�used�in�some�cases,�such�as�window�treatments�on�buildings,�and�the�success�of�this�program�was�due�largely�to�an�effective�public�involvement�process�as�well�as�partnerships�developed�during�project�design�and�planning.�
Noise�control�lessons�learned�from�the�CA/T�project�that�may�be�applicable�to�projects�developing�their�own�noise�mitigation�plans�include:�
71
Project Requirements Greenroads™ Manual v1.5
Noise Mitigation Plan PR-5
� Upholding�noise�policy�commitments�and�goals.�To�be�effective,�it�is�crucial�that�noise�policies�are�communicated�from�the�top�layers�of�the�project�team�and�applied�project�wide.�
� Engaging�the�public�for�active�feedback.�Informing�the�public�is�critical�to�the�overall�success�of�the�project�noise�mitigation�plan,�and�a�24�hour�hotline�for�communication�was�used�successfully�on�the�CA/T�project.�
� Establishing�an�ambient�level�and�monitoring�construction�noise.�Equitable�noise�policies�cannot�be�created�without�first�establishing�a�baseline�noise�level.�Noise�controls�are�not�as�effective�if�not�monitored�on�a�continuous�basis.�
� Engaging�professionals.�Noise�technicians�can�often�preempt�noise�problems�and�can�quickly�respond�to�complaints�given�proper�authority.�
� Addressing�the�biggest�complaints.�The�biggest�public�complaint�was�vehicle�backup�alarms�during�night�work,�which�was�addressed�by�mandating�installation�of�in�vehicle�controls�that�were�manually�adjustable�or�ambient�sensitive�and�prohibiting�alarm�use�in�especially�sensitive�areas�at�night�with�additional�supervision�from�safety�personnel.��
� Implementing�comprehensive�and�concise�specifications.�Contract�specification�language�for�contractors�that�is�clear�and�unambiguous�is�essential�for�management�of�contractors�and�for�implementation�of�a�noise�control�plan.�
� Using�multiple�controls.�Noise�mitigation�measures�must�be�flexible�and�include�many�alternatives�and�combinations�of�methods�to�meet�noise�policy�goals.�
� Targeting�receptor�controls.�Prevention�of�noise�at�the�receptor,�such�as�acoustical�treatments�for�windows,�can�be�cost�effective�solutions.�
� Using�sound�barriers�as�visual�barriers.�Public�perceptions�of�construction�noise�and�level�of�nuisance�or�annoyance�depend�on�sound�levels�of�the�activity�as�well�as�visibility�of�the�activity.�Thalheimer�(2000)�states�that�noise�barriers�were�effective�in�reducing�the�level�of�annoyance�perceived�on�the�CA/T�project.�However,�Aylor�and�Marks�(1976)�and�Anderson,�Mulligan�and�Goodman�(1984)�demonstrate�that�this�perception�is�extremely�variable�with�locale,�typical�ambient�noise�levels,�type�of�barrier,�how�much�of�the�activity�is�obscured�by�the�barrier,�familiarity�of�sound,�and�public�expectations.�
POTENTIAL ISSUES
1. It�is�not�feasible�to�eliminate�all�construction�noise,�but�it�is�often�feasible�to�control�most�or�all�of�it.�2. Multiple�work�sites�may�require�a�variety�or�combination�of�different�controls.�Some�special�areas�of�work�sites�
may�require�closer�analysis�or�modeling,�which�may�be�cost�and�time�intensive.�3. Noise�mitigation�plans�and�project�policies�apply�to�all�contractors�and�subcontractors�on�a�construction�site.�
Training�may�be�necessary�for�some�parties�who�are�otherwise�unfamiliar�with�noise�mitigation�or�policies.�4. The�subjectivity�involved�with�perceptions�of�sound�and�noise�presents�an�issue�for�managing�public�opinion�
and�expectations.��5. Most�jurisdictions�provide�an�exemption�from�noise�associated�with�daytime�construction�activities.�For�
Greenroads�all�projects�must�create�an�NMP,�even�if�exempt�from�noise�policies�and�local�ordinances.�
RESEARCH Noise�issues�on�most�roadway�projects�are�initially�addressed�during�the�project�environmental�review�(see�PR�1�Environmental�Review�Process).�This�Project�Requirement�(PR)�focuses�on�planning�for�and�management�of�noise�generated�by�the�roadway�project�throughout�its�construction�and�operation�phases.�
What�is�Noise?�Noise�is�defined�as�unwanted�sound�(Environmental�Protection�Agency,�1973).�Sound�is�part�of�the�science�of�acoustics,�which�is�a�complex�field�dealing�with�sound�generation,�propagation�and�reception.�This�credit�does�not�go�into�detail�on�sound�physics.�However,�some�terminology�is�useful�for�a�basic�understanding�of�noise.�
A�source�is�the�point�where�a�sound�is�generated.�Sources�can�be�mobile�or�stationary.�For�example,�traffic�noise�sources�are�mobile,�while�construction�noise�is�generally�a�mixture�of�stationary�and�mobile�sources.�The�receptor�(also,�receiver)�is�the�endpoint�where�sound�is�observed.�The�route�along�which�sound�passes�from�the�source�to�
72

Greenroads™ Manual v1.5 Project Requirements
PR-5 Noise Mitigation Plan
the�receptor�is�known�as�the�path.�The�length�of�the�path�is�important,�as�is�the�rate�of�change�in�length�of�the�path.�Generally,�perception�of�sound�changes�along�a�path�according�to�the�“inverse�square�law”:�as�the�distance�between�source�and�receiver�increases,�the�sound�decreases�in�proportion�to�the�inverse�square�of�the�path�length.�(New�York�Division�of�Environmental�Permits,�2001)�The�path�length�of�sound�from�mobile�sources�changes�with�time�(this�is�perceived�by�the�human�ear�as�what�is�commonly�known�as�the�Doppler�Effect).�
The�following�sound�terms�are�briefly�described�(Sandberg�&�Ejsmont,�2002):��
� Sound�pressure.�Sound�travels�through�the�surrounding�medium�(often�air)�as�pressure�waves.�Measuring�sound�involves�measuring�the�pressure�of�these�waves.�Thus�a�common�measure�of�sound�is�in�units�of�pressure.�The�perceived�loudness�of�sound�varies�with�pressure.�Higher�pressures�are�generally�associated�with�sounds�we�perceive�of�as�louder.��
� Sound�pressure�level�and�the�decibel�(dB).�Sound�pressure�varies�over�such�a�wide�range�that�it�is�commonly�measured�in�a�logarithmic�unit�called�the�decibel�(dB)�so�reported�numbers�are�easier�to�work�with.�Using�the�dB�scale,�a�difference�in�10�dB�roughly�corresponds�to�a�doubling�or�halving�of�our�hearing�perception�of�that�sound.�Also,�1�dB�is�about�the�smallest�difference�in�sound�pressure�that�humans�can�perceive.�Finally,�if�two�incoherent�sounds�of�equal�sound�pressure�level�(e.g.,�70�dB)�are�added�together,�the�resulting�overall�sound�is�3�dB�greater.�Thus,�70�dB�+�70�dB�=�73�dB.���
� Frequency�weighting.�Sound�can�occur�over�a�wide�range�of�frequencies.�The�human�ear�does�not�perceive�all�of�these�frequencies�equally.�Generally,�for�sound�at�a�given�pressure�level,�low�and�very�high�frequencies�are�interpreted�as�quieter�than�mid�range�frequencies.�Therefore,�for�sound�measurements�to�be�most�meaningful�to�human�hearing,�the�frequencies�of�sound�need�to�be�filtered�such�that�the�sound�pressure�levels�of�low�and�very�high�frequencies�count�less�than�the�sound�pressure�levels�of�mid�range�frequencies.��A�good�approximation�to�human�hearing�is�the�“A�filter,”�thus�sound�is�often�reported�as�an�“A�weighted�sound�pressure�level,”�dB(A)�or�dBA.���
It�is�important�to�emphasize�the�complexity�in�analyzing�sound�and�the�difference�of�sound�perception�in�humans�to�the�physical�measurements�of�sound�pressure.�The�response�to�any�sound�is�a�subjective�experience�and�can�depend�on�age,�health,�familiarity,�time�of�day�and�more�in�addition�to�the�characteristic�of�the�sound�itself.�This�complexity�makes�it�somewhat�difficult�to�express�and�compare�sound�levels�using�simplified�numbers�or�averages�such�as�the�A�weighted�decibel�scale�(dBA)�that�is�typically�used�to�describe�transportation�noise.�
Undesirable�Consequences�of�Noise�Noise�can�have�an�effect�on�human�health�and�also�on�the�general�desirability�of�a�location�based�on�its�exposure�to�noise.�Noise�impacts�human�health�and�well�being�by�increasing�stress,�causing�hearing�loss�(in�the�case�of�loud�noise),��disrupting�sleep,�causing�fatigue,�hinders�work�efficiency,�interrupting�activities,�and�interfering�with�speech�communication�(Passchier�Vermeer�&�Passchier,�2000;�EPA,�1978).�Noise�can�also�produce�unwanted�vibrations�that�may�cause�human�discomfort�(sonic�fatigue)�or�disturb�activities�(EPA,�1973).�In�addition�to�the�physiological�and�emotional�responses�of�noise,�transportation�noise�in�particular�can�also�impact�real�estate�values�hence�impacting�a�community’s�social,�economical�and�development�status.�
Noise�impacts�from�human�activities�do�not�only�affect�human�populations.�Kaseloo�and�Tyson�(2004)�synthesized�the�ecological�information�on�noise�impacts�to�wildlife�populations�living�near�roadways�and�determined�there�is�sufficient�evidence�that�noise�effects�populations,�breeding�habits,�and��biodiversity.�However,�there�is�very�little�conclusive�data�relative�to�road�noise�and�populations�of�fish,�amphibians,�reptiles,�and�invertebrates.�Burrowing�species�may�be�impacted�due�to�road�noise�and�noise�vibrations,�but�this�area�also�requires�further�study.�Bird�populations�appear�to�be�the�most�negatively�impacted,�with�impacts�proportional�to�the�levels�of�traffic�noise�and�volume.�In�many�locations�there�is�clear�evidence�of�decreased�bird�breeding�activity�and�population�declines�near�rights�of�way�(however,�this�may�be�related�to�displacement�of�prey�or�vegetation�change).�Large�and�small�mammals�may�also�be�repelled�by�roadway�noise.�
Wildlife�can�experience�similar�adverse�health�effects�and�stresses�because�the�structure�and�function�of�most�animal�ears�is�similar�to�the�human�ear�(EPA,�1978).�Not�only�do�sound�level�ranges�heard�by�animals�differ�from�
73

Project Requirements Greenroads™ Manual v1.5
Noise Mitigation Plan PR-5
what�is�heard�by�humans�(EPA,�1978),�but�their�sensitivity�to�and�corresponding�health�impacts�from�sound�also�vary.�Physiological�effects�of�noise�on�wildlife�include�stresses�to�endocrine,�digestive,�cardiovascular,�and�immune�systems�as�well�as�reproductive�function�(Kaseloo�&�Tyson,�2004).�Roadway�noise�can�also�impact�vocalization�and�communication�between�wildlife�species,�especially�where�roadway�noise�may�cause�background�noise�across�distances�(Kaseloo�&�Tyson,�2004).�
Construction�Noise�Construction�noise�is�temporary�but�may�adversely�affect�nearby�property�owners,�residents�and�wildlife.�The�FHWA�provides�guidance�in�its�Highway�Construction�Noise�Handbook�(Knauer�et�al.,�2006).�Many�of�the�recommendations�for�this�guidance�document�were�generated�by�the�Central�Artery/Tunnel�project�in�Boston�(featured�in�the�Examples�section�above),�and�were�documented�by�Thalheimer�(2000)�prior�to�being�published�by�the�FHWA.�
Road�construction�noise�is�typically�generated�by�three�source�types:�mobile�equipment,�stationary�equipment�and�blasting�activity.�Noise�levels�for�individual�equipment�typically�used�on�road�construction�projects�are�presented�in�Table�PR�5.1.�
Table�PR�5.1:�Maximum�Sound�Level�of�Construction�Equipment�Activity�Measured�at�50�feet.�(Adapted�from�Thalheimer,�2000;�Knauer�et�al.,�2006)�Equipment� dBA� Equipment� dBA� Equipment� dBA�
Auger�Drill�Rig� 85� Flat�Bed�Truck� 84� Rivet�buster/Chipping�gun� 85�
Backhoe� 80� Front�End�Loader� 80� Rock�Drill� 85�
Bar�Bender� 80� Generator� 82� Roller� 85�
Blasting� 94� Gradall� 85� Sand�Blasting�(Single�Nozzle)� 85�
Boring�Jack�Power�Unit� 80� Grader� 85� Scraper� 85�
Chain�Saw� 85� Grapple�(on�backhoe)� 85� Shears�(on�backhoe)� 85�
Clam�Shovel�(dropping)� 93� Horizontal�Boring�Hydraulic�Jack� 80� Slurry�Plant� 78�
Compactor�(ground)� 80� Hydra�Break�Ram� 90� Slurry�Trenching�Machine� 82�
Compressor�(air)� 80� Impact�Pile�Driver� 95� Soil�Mix�Drill�Rig� 80�
Concrete�Batch�Plant� 83� Jackhammer� 85� Tractor� 84�
Concrete�Mixer�Truck� 85� Man�Lift� 85� Vacuum�Excavator� 85�
Concrete�Saw� 90� Mounted�Impact�Hammer�(hoe�ram)� 90� Vacuum�Street�Sweeper� 80�
Crane� 85� Pavement�Scarifier� 85� Ventilation�Fan� 85�
Dozer� 85� Paver� 85� Vibrating�Hopper� 85�
Drill�Rig�Truck� 84� Pickup�Truck� 55� Vibratory�Concrete�Mixer� 80�
Drum�Mixer� 80� Pneumatic�Tools� 85� Vibratory�Pile�Driver� 95�
Dump�Truck� 84� Pumps� 77� Warning�Horn� 85�
Excavator� 85� Refrigerator�Unit� 82� Welder/Torch� 73��The�relative�A�weighted�noise�levels�of�common�sounds�measured�in�the�environment�and�industry�for�various�qualitative�sound�levels�are�provided�in�Figure�PR�5.1.�
74

Greenroads™ Manual v1.5 Project Requirements
PR-5 Noise Mitigation Plan
Noise�Source�(Given�Distance)� Sound�Level�(dbA) Qualitative Response Description�
Carrier�deck�jet�operation��
Jet�takeoff�(200�feet)�Dance�club�
Auto�horn�(3�feet)�Riveting�machine�
Jet�takeoff�(2000�feet)�Shout�(0.5�feet)�
New�York�subway�station�Heavy�truck�(50�feet)�
Pneumatic�drill�(50�feet)�
Freight�train�(50�feet)��Freeway�traffic�(50�feet)��
Air�conditioning�unit�(20�feet)�
Light�auto�traffic�(50�feet)��
Living�room�Bedroom�
Library�Soft�whisper�(5�feet)�
Recording�studio�
150
140
130
120
110
100
90
80
70
60
50
40
30
20
10
0�
Painfully�loud��Limit�of�amplified�speech�
Maximum�vocal�effort�
Very�annoying�Hearing�damage�(8�hr,�continuous�exposure)�
Annoying�
Telephone�use�difficult�Intrusive�
Quiet�
Very�quiet�
Just�audible�
Hearing�threshold�
Figure�PR�5.1:�Typical�Sound�Levels�Measured�in�the�Environment�and�Industry�(Adapted�from�Barksdale,�1991).�
Traffic�Noise�A�discussion�on�traffic�noise�sources�is�provided�in�Credit�PT�5�Quiet�Pavement.�
Regulation�of�Noise�In�1981,�the�Environmental�Protection�Agency�(EPA)�Office�of�Noise�Abatement�and�Control�(ONAC)�was�abolished�and�noise�management�authority�was�granted�to�individual�states�and�municipalities.�However,�the�1972�Noise�Act�and�the�1978�Quiet�Communities�Act�are�still�valid�but�unfunded�(EPA,�2009).�Prior�to�the�disintegration�of�ONAC,�EPA�did�establish�baseline�guidance�dBA�levels�for�both�indoor�and�outdoor�receivers�and�exposure�time�criteria�for�preventing�or�limiting�hearing�loss�(EPA,�2009).�These�laws�were�primarily�put�in�place�to�protect�noise�sensitive�receivers.�A�noise�sensitive�receiver�is�a�location�where�people�or�endangered�wildlife�reside�or�where�the�
75

Project Requirements Greenroads™ Manual v1.5
Noise Mitigation Plan PR-5
presence�of�unwanted�sound�could�adversely�affect�the�designated�use�of�the�land�or�habitat�(Knauer�et�al.,�2006).�Typically,�noise�sensitive�receivers�include�residences,�hospitals,�places�of�worship,�libraries,�schools,�and�may�include�nature�and�wildlife�preserves�and�parks.�For�example,�“Levels�of�45�decibels�are�associated�with�indoor�residential�areas,�hospitals�and�schools,�whereas�55�decibels�is�identified�for�certain�outdoor�areas�where�human�activity�takes�place.�The�level�of�70�decibels�is�identified�for�all�areas�in�order�to�prevent�hearing�loss.”�(EPA,�2009).�Roadway�projects�near�these�locations�may�be�restricted�by�more�stringent�noise�policies�during�both�construction�and�operation�(Knauer�et�al.,�2006).�
There�are�currently�no�federally�regulated�levels�of�construction�noise;�however�the�FHWA�has�set�some�standards�for�traffic�noise�levels.�“The�regulations�[23�CFR�§�772]�contain�noise�abatement�criteria�which�represent�the�upper�limit�of�acceptable�highway�traffic�noise�for�different�types�of�land�uses�and�human�activities.�The�regulations�do�not�require�that�the�abatement�criteria�be�met�in�every�instance.�Rather,�they�require�that�every�reasonable�and�feasible�effort�be�made�to�provide�noise�mitigation�when�the�criteria�are�approached�or�exceeded.”�(2006).�In�general,�federally�funded�highway�projects�are�required�to�follow�a�three�step�process�during�project�development�for�noise�abatement�involving�identification�and�mitigation�of�noise�impacts,�as�well�as�land�use�planning�coordination�with�local�officials.�Long�term�noise�control�and�mitigation�measures�for�traffic�noise�are�currently�assessed�via�the�environmental�review�process�and�associated�documentation�for�the�National�Environmental�Policy�Act�(NEPA)�of�1969�under�23�CFR�§�772.�However,�in�September�2009,�the�FHWA�published�a�Notice�of�Proposed�Rulemaking�(NPRM)�to�amend�the�current�federal�noise�policy�contained�in�23�CFR�§�772�which�could�mean�highway�agencies�will�need�to�review�their�existing�noise�policies,�revise�them,�and�obtain�approval�by�the�FHWA.�(USDOT�&�FHWA,�2009)�
Occupational�exposures�to�noise�for�construction�workers�are�closely�regulated�by�the�Occupational�Health�and�Safety�Administration�(OSHA).�For�more�information�on�OSHA�noise�and�hearing�safety�standards,�visit:�http://www.osha.gov/SLTC/noisehearingconservation/�
Considerations�for�Mitigating�Noise�Many�design�and�project�planning�methods�can�reduce�engine�or�blast�related�noise�from�construction�projects.�Also,�certain�techniques�and�roadway�surfacing�materials�can�be�used�to�reduce�tire�pavement�noise.�The�FHWA�Highway�Construction�Noise�Handbook�(Knauer�et�al.,�2006)�describes�the�following�elements�for�effective�control�of�highway�construction�and�operational�noise�which�are�applicable�to�all�roadway�projects.�
� Alternative�design�options.�Avoid�generation�of�noise�altogether.�Examples�are�designated�construction�traffic�routes,�specially�locating�storage�areas,�or�possibly�even�selection�of�an�entirely�different�roadway�alignment.�Another�design�option�would�be�considering�alternative�construction�approaches,�such�as�vibratory�pile�driving�instead�of�impact�pile�driving.�Alternative�designs�are�usually�very�effective�approaches,�but�they�are�not�always�cost�effective�or�practical.�
� Mitigation�at�the�source.�Reduce,�minimize�or�eliminate�initial�noise�generation.�An�example�would�be�installing�mufflers�or�baffles�on�construction�equipment�or�on�a�motor�vehicle�using�the�roadway.�Contract�specifications�and�special�provisions�are�an�excellent�means�of�source�mitigation,�such�as�requiring�contractors�to�use�quieter�equipment�or�setting�strict�noise�limits�for�specific�types�of�equipment.�Additionally,�construction�employee�training�is�considered�a�source�mitigation�technique.�Quiet�pavements,�where�tire�pavement�noise�is�reduced�at�the�source,�may�be�a�viable�strategy�for�mitigating�operational�traffic�noise�(see�Credit�PT�5�Quiet�Pavement).�Source�reduction�is�the�most�effective�and�often�also�most�cost�effective�type�of�mitigation�strategy,�because�it�is�easiest�to�observe�and�inspect�(Thalheimer,�2000).�
� Mitigation�along�the�path.�Reduce�or�minimize�noise�propagation.�Noise�barriers�and�shields�can�be�natural�such�as�grade�changes�or�permanent�such�as�sound�walls.�Path�mitigation�is�the�least�effective�mitigation�strategy,�and�has�a�number�of�disadvantages,�especially�if�manmade.�Path�mitigation�methods,�such�as�sound�barrier�structures,�are�only�effective�at�certain�distances�and�geometries�in�relation�to�the�roadway.�Commonly,�these�are�permanent�manmade�structures�that�tend�to�reduce�visual�quality,�are�high�cost,�energy�intensive,�materials�intensive,�and�may�potentially�fragment�or�obstruct�natural�habitats�depending�on�their�placement�in�the�right�of�way.��
76

Greenroads™ Manual v1.5 Project Requirements
PR-5 Noise Mitigation Plan
� Mitigation�at�the�receiver.�Reduce,�minimize�or�avoid�noise�reception.�Some�examples�are�noise�“masking”�where�unpleasant�sound�is�covered�up�or�interfered�by�a�more�pleasant�sound,�building�envelope�improvements,�and�temporary�relocation�of�residents.�Depending�on�the�scale�and�location�of�the�project,�as�well�as�the�level�of�public�and�stakeholder�involvement�and�project�acceptability,�receiver�mitigation�methods�vary�in�cost.�However,�these�methods�are�more�effective�at�reducing�noise�received�by�the�human�ear�than�path�mitigation,�especially�in�targeted�sensitive�receptors�(Thalheimer,�2000).�
Most�noise�mitigation�plans�created�for�roadway�projects�will�include�a�combination�of�many�of�these�strategies.�
GLOSSARY
ANMP� Alternative�Noise�Mitigation�PlanCA/T� Central�Artery/Tunnel�project.�Also�known�as�the�Big�Dig.�CFR� Code�of�Federal�RegulationsdB� DecibeldBA� A�weighted�decibelsEPA� Environmental�Protection�AgencyFHWA� Federal�Highway�AdministrationHMA� Hot�mix�asphaltMasking� using�acoustical�techniques�to�cover�up�or�interfere�with�unpleasant�soundMassDOT� Massachusetts�Department�of�TransportationMTA� Massachusetts�Turnpike�AuthorityNMP� Noise�Mitigation�PlanNoise� Unwanted�sound,�undesirable�soundNoise�sensitive�receiver� A�location�where�people or�endangered�wildlife reside�or�where�the�presence�
of�unwanted�sound�could�adversely�affect�the�designated�use�of�the�land�or�habitat�(Knauer�et�al.,�2006)�
NYDEP� New�York�City�Department�of�Environmental�Protection�Path� The�route�along�which�sound�passes�from�the�source�to�the�receptorPCC� Portland�cement�concreteReceptor�(receiver)� An�endpoint�where�sound�is�observedSource� A�point�where�a�sound�is�generatedUSDOT� United�States�Department�of�Transportation�
REFERENCES Anderson,�L.M.,�Mulligan,�B.E.,�&�Goodman,�L.S.�(1984).�Effects�of�vegetation�on�human�response�to�sound.�Journal�
of�Arboriculture.�10(2),�45�49.�
Aylor�DE,�&�Marks�LE.�(1976).�Perception�of�noise�transmitted�through�barriers.�The�Journal�of�the�Acoustical�Society�of�America.�59�(2),�397�400.�
Barksdale,�R.�D.�(1991).�The�Aggregate�Handbook.�Washington,�D.C.:�National�Stone�Association.�
City�of�New�York,�Department�of�Environment.�(2009)�DEP���Air,�Noise�&�Asbestos.�Accessed�December�22,�2009.�Available�at�http://nyc.gov/html/dep/html/air/index.shtml�
Commonwealth�of�Massachusetts,�Department�of�Transportation�(MassDOT),�Highway�Division.�(2009).�MassDOT�Highway�Division:�The�Central�Artery/Tunnel�Project���The�Big�Dig.�Accessed�December�23,�2009.�Available�at�http://www.massdot.state.ma.us/Highway/bigdig/bigdigmain.aspx�
77

Project Requirements Greenroads™ Manual v1.5
Noise Mitigation Plan PR-5
Environmental�Protection�Agency�(EPA).�(1973,�July)�Public�Health�and�Welfare�Criteria�for�Noise.�(550/9�73�002).�Office�of�Noise�Abatement�and�Control�(ONAC).�Washington,�D.C.:�EPA,�ONAC.�Accessed�January�1,�2010.�Available�at�http://www.nonoise.org/epa/Roll1/roll1doc3.pdf��
Environmental�Protection�Agency�(EPA).�(1978).�Noise:�A�Health�Problem.�EPA,�Office�of�Noise�Abatement�and�Control,�Washington,�DC.�Office�of�Noise�Abatement�and�Control�(ONAC).�Washington,�D.C.:�EPA,�ONAC.�Accessed�January�1,�2010.��Available�at�http://www.nonoise.org/epa/Roll15/roll15doc152.pdf�
Environmental�Protection�Agency�(EPA).�(2009,�August�12).�EPA�Identifies�Noise�Levels�Affecting�Health�and�Welfare�|�EPA�History�|�US�EPA.�[Press�Release:�April�2,�1974].�Accessed�January�1,�2010.�Available�at�http://www.epa.gov/history/topics/noise/01.htm��
Federal�Highway�Administration�(FHWA).�(2006,�April).�Highway�Traffic�Noise�in�the�United�States:�Problem�and�Response.�(FHWA�HEP�06�020).�Washington,�DC:�U.S.�Department�of�Transportation,�Federal�Highway�Administration.�Accessed�January�2,�2010.�Available�at�http://www.fhwa.dot.gov/environment/probresp.htm��
Federal�Highway�Administration�(FHWA).�(2008,�December�16).�FHWA�Roadway�Construction�Noise.�Accessed�December�22,�2009.�Available�at�http://www.fhwa.dot.gov/environment/noise/cnstr_ns.htm��
Federal�Highway�Administration�(FHWA).�(2009,�October�1).�Noise�Regulations,�Policy,�and�Guidance.�Accessed�January�2,�2010.�Available�at�http://www.fhwa.dot.gov/environment/noise/mem_nois.htm���
Kaseloo,�P.�A.�&�Tyson,�K.O.�(2004)�Synthesis�of�Noise�Effects�on�Wildlife�Populations.�(FHWA�HEP�06�016)�Washington,�DC:�U.S.�Department�of�Transportation,�Federal�Highway�Administration.�Accessed�November�25,�2008.�Available�at�http://www.fhwa.dot.gov/environment/noise/effects/index.htm��
Knauer,�H.�S.�et�al.�(2006).�FHWA�highway�construction�noise�handbook.�(FHWA�HEP�06�015)�Washington,�DC:�U.S.�Department�of�Transportation,�Federal�Highway�Administration.�Accessed�November�25,�2008.�Available�at�http://www.fhwa.dot.gov/environment/noise/handbook/index.htm��
Passchier�Vermeer,�W.�&�Passchier,�W.F.�(2000).�Noise�exposure�and�public�health.�Environmental�Health�Perspectives.�108,�123�31.�
Reherman,�C.�N.�et�al.�(2006).�FHWA�Roadway�Construction�Noise�Model,�Version�1.0�User’s�Guide.�(FHWA�HEP�05�054)�Washington,�DC:�U.S.�Department�of�Transportation,�Federal�Highway�Administration.�Accessed�November�25,�2008.�Available�at�http://www.fhwa.dot.gov/environment/noise/rcnm/rcnm.pdf��
Sandberg,�U.�and�Ejsmont,�J.A.�(2002).�Tyre/Road�Noise�Reference�Book.�Informex�Ejsmont�&�Sandberg�Handelsbolag,�Sweden.��
Thalheimer,�E.�(2000).�Construction�noise�control�program�and�mitigation�strategy�at�the�Central�Artery/Tunnel�Project.�Noise�Control�Engineering�Journal.�48�(5),�157�165.��
78

Greenroads
PR-6
WASTGOAL Create an a
REQUIEstablish, iManagemeincluded in
• Type of• Expecte• Costs a• Contac• Destina• Contac• Manag
person
Detai
The CWagency“Constmust bwithin (e.g. paleave tbecausdetails
Types o
• Pav• Mil• Me
alum• Plas• Exc• Sed• Lan• Haz• Wo• Gla
DOCUM• Copy o
s™ Manual v1.5
TE MAN
accounting and
REMENTSimplement, anent Plan (CWMn the project co
f construction ed (or actual) tand fees for lant information oation of waste t information oement strategal worker (hou
ls
WMP is typically for approval, ruction and dee hauled off‐sithe project Rigavements, embhe ROW for rese they are notunder Credits
of C&D for road
ving process waling waste, contals (e.g. wasteminum, and vastic (e.g. wasteavated soil cutdiment removed clearing debzardous materiood and paper ss
MENTATIOf the project C
NAGEME
d management
S d maintain a fo
MP) during roadontract docum
waste tonnage ndfills, recoverof responsible (e.g. recycling of responsible y for waste geusehold) waste
y completed band implemenemolition wastite for disposalght‐of‐Way (RObankments, shprocessing (re used in their pMR‐2 Paveme
dway construc
aste (e.g. asphncrete slough ae steel rebar, marious househoe plastic pipes) ttings and boued from tempobris or excess toials, including lproducts (e.g.
ON CWMP
Waste M
ENT PLA
t plan for road
ormal Construdway construcments and ident
ry facilities, anparty for haulfacility, landfiparty for disponerated from me
y the prime conted by all parte” (C&D wastel or reprocessinOW) is not inteoulders, base mcycling) activitpre‐constructioent Reuse and M
ction projects m
alt, concrete)and grindings, metal guardraiold metals)
lders orary constructopsoil liquids packaging mat
Management Pl
AN
d construction w
ction and Demtion. The CWMtify, at minimu
d hauling ing ll, contractor’sosal site mobile office a
ontractor, submties on the cone) constitutes ang, or, if dispoended for use amaterials, and ties are consideon form at theMR‐4 Recycled
may include (b
cobble ls, pipes, lumin
ion settling po
terials, cardbo
an
waste materia
molition Waste MP should be um, these item
s backyard)
activities and
mitted to the ostruction site. any material thsed (stockpiledas structural mfill). Materialsered C&D wast site. See mored Materials.
ut is not limite
naires, signs,
onds
ard and pallets
als.
ms:
owner hat d)
material s that te e
ed to):
s)
REL
PP
PM
MR
MB
MM
CP
SUSCOM
E E
BEN
R RF
R RC
ImA
CIn
Project Require
PR
REQUIRED
ATED CRED
PR‐7 Pollution Prevention PlanPR‐10 Site Maintenance PMR‐2 PavemenReuse MR‐3 EarthworBalance MR‐4 Recycled Materials CA‐3 Site RecycPlan
STAINABILITMPONENTS
Expectations Exposure
NEFITS
Reduces Solid WReduces ManmFootprint Reduces First CReduces LifecycCosts mproves AccountabilityCreates New nformation
ements
R-6
D
ITS
n
Plan nt
rk
cling
TY
Wastemade
Costs cle
79

Project Requirements Greenroads™ Manual v1.5
Waste Management Plan PR-6
APPROACHES & STRATEGIES
• Integrate the CWMP with a Site Recycling Plan to earn credit CA‐3 Site Recycling Plan. • Modify, as appropriate for roads, versions of waste management plan specifications developed for building
contractors by the Construction Materials Recycling Association (CMRA). The California Integrated Waste Management Board (CIWMB) provides Construction Specifications Institute (CSI) MasterFormat templates for Sections 01151 (New Construction) and 02060 (Demolition) for buildings construction debris. These tools were developed by the CMRA with funding from the Environmental Protection Agency and are available for free download and project‐specific use at: http://www.ciwmb.ca.gov/conDemo/specs/CMRA.htm.
• Keep accurate records and retain all waste handling invoices and receipts. The site listed above also includes spreadsheet templates that contractors may use for tracking waste during construction.
• Specify a project diversion rate goal that may help establish appropriate waste handling procedures. • The Construction Materials Recycling Association (CMRA) provides links to a variety of localities that offer
construction and demolition waste recycling services. The list can be accessed at http://www.cdrecycling.org/. • Include the Waste Management Plan in agency contract documents, bid packages, and/or specifications. • Set waste reduction goals and explicitly state them in the Waste Management Plan • Locate receptacles in easily accessible or highly frequented locations on the jobsite. Receptacles should not be
placed in areas where they may cause harm to workers or the local environment. See Pollution Prevention Plan for more information.
• Hire a contractor with an Environmental Management System (EMS) in place. See Credit EW‐1 Environmental Management System. These employers already have internal office procedures established to reduce office‐related pollution and may be familiar with local agency waste management efforts.
• Develop and deliver training to workers to educate them on waste recovery efforts being implemented onsite and compliance with the general CWMP. This step will be critical to all projects. See Credit CA‐2 Environmental Awareness Training for more approaches and strategies for education programs.
• Hire an experienced waste transport company to manage site waste and monitor waste streams for unacceptable materials.
• Identify local facilities that accept recyclables or salvaged materials. This is important in designating type of waste to separate, and in making arrangements for drop‐off or delivery of materials.
• The 2007 Contractor’s Guide by the King County Solid Waste Division and Seattle Public Utilities provides many helpful waste management and reduction strategies for the entire project. A sample waste management plan adapted from this guide is provided in the examples below.
Example: Sample CWMP Template with Materials Recovery
The following example content has been adapted from the 2007 Seattle/King County Contractor’s Guide, which is available here: http://your.kingcounty.gov/solidwaste/greenbuilding/documents/ConGuide.pdf. Project teams should consider customizing the CWMP information based on project goals and owner expectations.
80

Greenroads
PR-6
GeneraProjectSite WaPhone:Debris Waste Steps t1. 2. 3. 4. 5.
The fo
Materi
Materi Figure Utilties
Examp
In 2005agencysewer dexceedVancou
s™ Manual v1.5
al Contractor: t Name: aste Coordinat: Collection Age
Management
to inform cont
ollowing charts
ial
ial
PR‐6.1 Samples, 2007)
ple: Case St
5, the City of Vy strictly for madevelopment (ded 400,000 touver Landfill, ta
tor:
ency:
Goals:
ractors/subco
C identify mate
handlin
DQuant
Quant
e CWMP Temp
tudy - City
ancouver, Britanagement of i(see Figures PRnnes (MT: aboaking up massi
Waste M
WASTE MA
ntractors of W
C&D Materials rials expected ng these mater
ECONSTRUCTItity (units)
CONSTtity (units)
plate. (Adapted
of Vancouv
ish Columbia cinfrastructure R‐6.2 and PR‐6.out 441,000 tonve and preciou
Management Pl
ANAGEMEN
Waste Managem
Expected to bto be generaterials for disposa
ION & DEMOLHaul Method
TRUCTION PHAHaul Method
d from King Co
ver, British
created a new waste, such as.3). The estimans) annually. Tus volume in th
an
NT PLAN
ment Plan pol
be Generateded by this projal and/or recyc
LITION PHASEd & End Locatio
ASEd & End Locatio
ounty Solid Wa
Columbia R
engineering brs waste generaated amount oThis waste had his limited loca
icies.
ect and the placling.
ion Handli
ion Handli
aste Division &
Recycling In
ranch in their gated from roadof this infrastrubeen previousal resource.
Project Require
anned method
ing Procedure
ing Procedure
& Seattle Publi
nitiative
governmental dway, water ancture waste sly been dispos
ements
d for
ic
nd
sed in
81

Project Req
The infpavemsubbas
After thimplem
• 100• 100• Sto
extr
Figure waste.
• Tra
cos• Tot
$41
The inf(2006).Associaincludinhttp://
POTENTI
1. Specifyand dedata avmay mor wast
2. Potentdone oany maconsidesource,the pro
3. If distumeasurstockpi
quirements
frastructure waent grindings, se material for
his initiative, somented during
0% of annual h0% of annual cockpiles of soil, raction of new
PR‐6.2: Typica(Bremner & C
nsportation oft savings, emisal cost savings13,000 in 2005
formation in th. The City of Vaation of Canadang reprocessinwww.tac‐atc.c
AL ISSUES
ying and creatincision‐makers vailable to offeean that additte divisions) neial exists for trr where in theaterial that leavered “waste.” T, and before it oject. rbed or cut/filrement may beile and left in p
aste included aand 90,000 MT46 kilometers
ome remarkabthe constructio
ot mix asphalt oncrete curb, sasphalt, and c
w aggregate is o
al pile of roadwCity of Vancouv
f waste materiassions reductios for all measurU.S. dollars).
his case study cancouver recyca for their 200ng and storage ca/english/reso
ng documents who do not no
er examples onional people freed to be incluacked data to waste streamves the boundaTherefore, proleaves the site
l material is stoe more difficulplace). Volume
Waste M
approximately T of concrete e(almost 29 mi
ble results wereon of roadway
milling waste sidewalk and rooncrete are nooften avoided.
way constructiver, 2006)
als was reduceon, and pavemeres has an estim
comes from thecling initiative w5 Environmentactivities that ourcecentre/re
for waste manormally manag how to monitrom outside agded on the probe measured i it is measuredaries of the roaobably a good pe. This way, qu
ockpiled on‐sitt if not monito measurement
Management Pl
300,000 MT ofexcavations. Thles) of road.
e achieved throys and infrastru
is now recycleoadway slab mow available fo
on Figur
utility
ed by over 22,5ent wear. mated value of
e report produwas consideredtal Achievemeare also part oeadingroom/co
nagement pracge waste. Theretor and measurgency engineeroject team to inconsistently, d. In order to aadway project place to measuantities are mo
te and not inteored by trucklots, such as exp
an
f excavated sohe latter amou
ough waste mucture:
ed. material is nowor more projec
re PR‐6.3: Bouly work. (Brem
500 dump truc
f over CN$500
uced by Bremnd for nominatint Award. Morof this initiativeonference/con
ctices may be ue may be a stere road‐relatedring departmeimplement a Ceither becausddress this, th site, even if inure the waste gore likely to be
ended for use ooads (e.g. mateected cut volu
Gre
oil, 35,000 MT ount is estimated
anagement ac
w recycled. cts after reproc
lders excavatemner & City of V
k trips, resultin
0,000 annually
ner and the Cityion by the Tranre informatione, can be foundf2006/docs/s0
unfamiliar to roeep learning cud waste streamnts (such as enCWMP effectivee of how the mhis requiremenntended for reugenerated is ace captured and
on the roadwayerial is excavateumes, may be m
enroads™ Manu
of hot mix asphd to provide en
tivities that we
cessing and
ed during roadVancouver, 20
ng in substanti
(approximatel
y of Vancouvernsportation n about the prod at: 007/bremner.p
oadway designrve, as there isms. This requirenvironment, ecely. measurement it clearly notesuse later, is ctually at the d representativ
y project, ed in a large more appropria
ual v1.5
PR-6
halt nough
ere
way 006)
al fuel
y
r
oject,
ners s little ement cology
is that
ve of
ate
82
Greenroads™ Manual v1.5 Project Requirements
PR-6 Waste Management Plan
units of measure than mass. Some ingenuity may be required to determine an appropriate solution to account for on‐site solid waste.
4. Careless behavior or lack of stewardship may be an issue that can result in recyclables being disposed in waste‐only receptacles, or vice versa, especially if objectives of a WMP are not meaningful or communicated well to workers. This behavior can contaminate the recyclables stream and make an entire receptacle unsuitable for reprocessing or salvage, or accidentally send recyclables to a landfill.
5. Proper handling of recyclable materials is a key safety issue for new and unfamiliar recycling activities. Communication and training is critical to minimize risk and preserve safety.
6. Safety and security considerations should be taken into account relative to storage on‐site of recoverable materials of high value. Opportunities for theft may be increased, especially for some types of metals that are commonly used in infrastructure or electrical utilities like copper wire.
7. At this time, points are not available for achieving waste reduction based on percentage of total waste. This is due to lack of data regarding waste management for roadway construction activities.
RESEARCH “Solid material waste generation is one of the many environmental burdens associated with the roadway life cycle.” (Rajendran & Gambatese, 2007, p. 88). Waste management, especially as recycling, minimization or reuse, is one of the cornerstone principles of sustainable development and pollution prevention programs. Both municipal solid waste (MSW) and building industry construction and demolition (C&D) waste are well‐characterized. These types of waste are monitored and measured by the Environmental Protection Agency (EPA) and many state agencies. Remarkably little is known about quantities and types of solid waste generated by the transportation industry during road and bridge construction and rehabilitation activities (EPA, 2009a; Rajendran & Gambetese, 2007; Rajendran & Gambetese, 2005; Aquino, 2003; Northeast Waste Management Officials’ Association, 2009). A key component is also very unclear: where the waste actually ends up.
This may be partly due to the relative ease with which hot mix asphalt, concrete, soil and cobble waste is recovered and reprocessed. Facilities that manage C&D waste are relatively unregulated parts of the waste management industry, even though they may receive a very large volume of materials from road and bridge construction. Bloomquist et al. (1993; cited in Rajendran & Gambatese, 2007) state in their report to the U.S. Department of Transportation (USDOT) and the Federal Highway Administration (FHWA) that approximately 75% of highway pavement materials are recovered. Note that this data is nearly 20 years old (or more) and no significant progress on characterizing road construction waste has been made, except at very few local agencies (see Examples noted above) where the focus is on cost‐reduction and the savings associated with incorporating recycled materials into design standards.
What is Construction and Demolition (C&D) Waste? The definition of what is considered construction and demolition (C&D) waste varies by state and local jurisdiction. The EPA definition is just as broad: materials that consist of “debris generated during the construction, renovation, and demolition of buildings, roads, and bridges” (EPA, 2009e). Construction debris is considered to be a specific type of solid waste, which is clearly defined under the 1984 Hazardous and Solid Waste Amendments (HSWA) to the United States 1972 Resource Conservation and Recovery Act (RCRA) Title 40 CFR § 261.2 (EPA, 2009d; ICF, 1995b). It is also considered industrial waste to differentiate its origin in the commercial and institutional sectors from MSW, which is mostly residential in origin (EPA, 2009b). Most of the waste is perceived as inert, however, some can be considered hazardous, such as structural elements with lead‐based paint.
C&D waste is generated from “construction, renovation, repair, and demolition of structures such as residential and commercial buildings, roads, and bridges” and in general is comprised of a variety of materials (ICF, 1995b). The most common material in building C&D landfilled waste streams is waste wood, hot mix asphalt (from parking lots), drywall and masonry (ICF, 1995b); clearly the waste stream from roads and bridges has a different composition. For example, in Vancouver, British Columbia, earthen materials composed over half of the infrastructure demolition of the waste stream, followed by concrete and hot mix asphalt pavement materials in lesser quantities (Bremner, 2006). Franklin Associates (1998) justifies omitting roadway construction and
83

Project Requirements Greenroads™ Manual v1.5
Waste Management Plan PR-6
demolition debris from their report to the EPA on C&D waste because it was not easily characterized and no point‐source data was available for their study. Generally, data for percent composition of roadway waste stream materials is not available from any reliable source and it is clearly rarely tracked in a meaningful way. The waste stream for every roadway project will be unique in both volume and composition and end point, due to many factors such as: project size, location, material type, construction or demolition means, schedule, contractor site waste management practices (ICF, 1995b).
How Much C&D Waste Is There? In March 2009, the EPA released 2003 data on construction and demolition waste from the building industry, which generated an estimated 170 million tons (EPA, 2009a), up from 136 million tons stated in 1996 (Franklin Associates, 1998; EPA, 2008b) The EPA notes that “Significant additional quantities of C&D materials are generated from the construction of roads and bridges, from land clearing at construction sites, and at military installations” (EPA, 2008b). The most recent waste stream characterization study funded by the EPA and conducted by the Northeast Waste Management Officials’ Association (NEWMOA, 2009) characterized the 2006 C&D waste stream for several New England states. Interestingly, this study specifically excluded aggregated data relevant to the hot mix asphalt, brick and concrete (ABC) waste generated from road, bridge and land clearing projects because “the quantity of ABC material generated by road and bridge projects often dwarfs the quantity generated from other sources and can significantly bias the data on overall management of C&D wastes.” (p. 2). This is, in part, due to the variations between C&D facilities relative to waste handling practices and types and quantities of materials that they receive, and the tendency to classify road ABC waste as “aggregate” in the waste stream reports. In addition, the report justifies its exclusion of transportation waste because roadway project material is often recycled into new aggregate for road base or pavement sections and processing often occurs on‐site or at specialized facility (NEWMOA, 2009).
Gambetese and Rajendran (2005) note that little research is available on lifecycle impacts of roadway waste material, especially at end‐of‐life of the pavement sections, and have attempted to model this road waste. These same authors (2007) provide a good summary of road C&D waste estimates from various agencies and authors, and include what is known about waste quantities and percentages throughout the world for roadways. However, importantly, they note that “no exact estimates of C&D waste from the transportation industry are available” and that existing literature indicates road and bridge waste contributes significantly to the waste stream, more so than the building industry. William Turley, Executive Director of the Construction Materials Recycling Association (CMRA) estimated in 2003 that the annual C&D waste generated in the United States was roughly 320 million tons (Aquino, 2003). Following the publishing of the EPA 2009 report on 2003 building industry waste, Turley noted (Johnson, 2009) that the total waste stream is more realistically estimated at 325 to 350 million tons (for 2003) after infrastructure waste is accounted in the total. This would mean transportation‐related construction, demolition, and rehabilitation activities generate and dispose of C&D waste at approximately the same rate as the building industry.
Based on available lifecycle process data and their collected end‐of‐life waste statistics for road waste, Rajendran and Gambetese (2007) conducted a quantitative lifecycle inventory (LCI) model of typical hot mix asphalt and concrete pavement sections from extraction of materials to end‐of‐life to estimate the waste contributions from each pavement type. Their model showed that over 50% of the lifecycle waste was generated from end‐of‐life waste disposal practices for both pavement models. However, their models did not include any recycling or reprocessing activities because these processes are not well‐characterized. Waste generation rates at end‐of‐life, and during construction (scraps and refuse) are shown in Table PR‐6.1.
84

Greenroads™ Manual v1.5 Project Requirements
PR-6 Waste Management Plan
Table PR‐6.1: Roadway Material Waste Rates at End‐of‐Life and Construction (Adapted from Rajendran & Gambetese, 2007)
Pavement Material Type Waste Rate at End‐of‐Life(% of Material)
Waste Rate during Placement of New Road(% of Material)
Concrete Pavement 25 2.5 Concrete Pavement – Cement ‐ 2.45 Concrete Pavement – Aggregates ‐ 3.0
Steel Rebar 55 1.79 Asphalt Pavement 18 0.102 Asphalt Pavement – Asphalt ‐ 0.86
Crushed Stone Base 17.1 0.88 Crushed Gravel Base 18.5 0.88 Granular Subbase 23 0.80 Subgrade 12.8 ‐ The EPA (2009c) notes that Industrial processes contributed to a total of 7.6 billion tons of non‐hazardous solid waste generated in the U.S. in 2006. These processes include pavement material production such as asphalt and cement manufacturing. These wastes are outside the scope of Greenroads (at this time) because they occur earlier in the supply chain than materials produced (mixed) after ground‐breaking for the roadway project. However, agencies and contractors are encouraged to work with industries that demonstrate responsible waste management practices.
Where Does It Go? Most roadway, bridge and land clearing debris is managed by the same C&D landfills and reprocessing facilities as the building industry and represent a very large portion of the total C&D waste received by these facilities (Franklin Associates, 1998). Approximately 1,500 C&D landfills were operational in the United States in 2004 (EPA, 2009a). However, while building C&D waste composition and volume is monitored, the EPA admits that commercially generated C&D waste, such as from transportation and industry, is not because it is typically collected and disposed by the private sector. This makes managing these processes more difficult for municipalities, who have been slow to target this waste stream (EPA, 2009b). Also, the EPA reports that “Unknown amounts of C&D materials are also believed to go to combustion facilities or unpermitted landfills.” (2008c).
Many states also accept exported wastes from other states, which complicates tracking recovery activities (NEWMOA, 2009). States also differ in waste management practices: in some cases the majority of C&D waste is sent directly to landfill while other states will pre‐process the waste before it gets landfilled. “There is no common standard as to how C&D wastes are processed at facilities in different states or even within a single state.” (NEWMOA, 2009). The type of receiving facility varies and can be C&D only landfills, C&D recovery facilities (which still dispose unrecoverable materials into landfills eventually), municipal solid waste (MSW) landfills, or combined C&D and MSW facilities (EPA, 2008a; EPA, 2008c). The type of landfill where C&D waste might be received for your project depends on local opportunity, and no federal regulation specifically dictates where it must go. Facilities in the U.S. that accept C&D waste, sorted by EPA Regions, are provided by the Construction Industry Compliance Assistance Center (CICA): http://www.cicacenter.org/.
Costs of Roadway Waste Generally, road waste materials, like aggregate, asphalt and concrete, are heavy and, therefore, costly to transport. Reprocessed inert waste products are often cost‐competitive with virgin aggregate because many waste recovery facilities will crush and resell these wastes to avoid transport to landfill (NEWMOA, 2009), but this may not be the case where there is open landfill space, low tipping fees, or other low‐cost or virtually‐free disposal options available (William Turley qtd. in Aquino, 2003). Essentially, this likely makes waste management commonplace in the transportation industry, because it is a cost‐effective best practice.
85

Project Requirements Greenroads™ Manual v1.5
Waste Management Plan PR-6
In 1995, the EPA issued a report (ICF, 1995a) on environmental damages associated with C&D landfills, specifically to collect available data on groundwater or surface water pollution and ecosystem or habitat impacts, and to determine if these impacts can be attributed to specific types of C&D waste, landfill operations and environmental location. The study found that minimal data was available, many sites lacked basic environmental controls (like liners), and focused on only 11 C&D landfill sites. On‐site groundwater contamination was present at several of these sites that exceeded acceptable levels of inorganic contaminants for state secondary groundwater quality standards (i.e. taste). Additionally, several sites were found to have inorganic surface water contamination that exceeded either state levels or EPA Ambient Water Quality Criteria for freshwater aquatic life. Some of these impacts were attributed to characteristics of the landfill location such as shallow groundwater or permeable soils (ICF, 1995a). Notably, there are many other impacts associated with long‐term environmental degradation, using open space or habitat for landfills, and social and economic impacts that are not easily quantifiable. Current data on existing C&D landfill capacity in the United States is not available from any reliable source. Also, due to the high variability of size, location, capacities, and facility types lumped in industry census statistics for waste management does not adequately characterize the costs of landfilling large volumes of roadway waste.
How is C&D Waste Regulated? While MSW regulations are a core part of the RCRA and governed at a federal level by the EPA, most of the regulations regarding C&D waste are generally non‐specific and managed by states and local jurisdictions. However, the 1995 draft report created for the EPA Office of Solid Waste, indicates that all 50 states have some regulations for the C&D landfill facilities not located on private property, though many are not as strict as those for MSW facilities, which are covered under RCRA Title 40 CFR § 257 and 258. Additionally, “Executive Order 13423 requires all federal construction, renovation, and demolition projects to achieve a 50% recycling rate where markets or on‐site recycling opportunities exist.” (EPA, 2009a). The most detailed review for the EPA regarding the variability of landfill regulatory requirements is given in the 1995 draft report from ICF Incorporated.
In Departments of Transportation across the U.S., the story is similar: regulations are varied and often vague or non‐existent. In fact, most Departments of Transportation (DOTs) do not have any management control over the waste and typically, road‐related waste is handled by a different state agency (environmental or ecology, for example). The lack of consistency in characterizing and regulating this massive waste stream fundamentally demonstrates a large opportunity for both source reduction and waste minimization management protocols for roadway C&D waste.
Waste Management Planning Waste management planning may be an unfamiliar consideration for roadway design agencies, engineers or contractors because traditionally this is not one of their professional responsibilities. However, Kibert (2005) notes that proper planning and quality assurance plans are imperative to the successful construction and continued performance of building industry projects, and the same may be said for roadway projects. Poorly defined parameters for C&D waste, including what it is and what it is not, are necessary for an effective waste management plan. Another key part of waste management is measurement. Consistency in any measurement program should include clear identification of where the waste is to be measured (i.e. leaving the construction site) and by what unit of measure (volume or mass) (ICF, 1995b). Responsible treatment of waste materials, if the wasteful practices themselves cannot be eliminated, is a necessity for reducing the long‐term need for landfill space filled with inert, reusable materials.
Kibert (2005) also notes that with thoughtful planning and engineering, final contract documents can often anticipate sources of construction waste and generally generate less of it (as well as having fewer errors and change orders throughout the process). Specifications will also require a clear definition of what C&D waste means for the project. He states that source reduction (reduced need for materials) is most effective in minimizing waste, especially for new projects. Such success was demonstrated by the Examples from TxDOT and the City of Vancouver (Bremner, 2006), which were achieved largely through contract language (including specific instructions for recyclability, salvagability and special handling) and assignment of waste management responsibilities to various parties. Since the pavement engineer is responsible for the main material components project, i.e. the
86
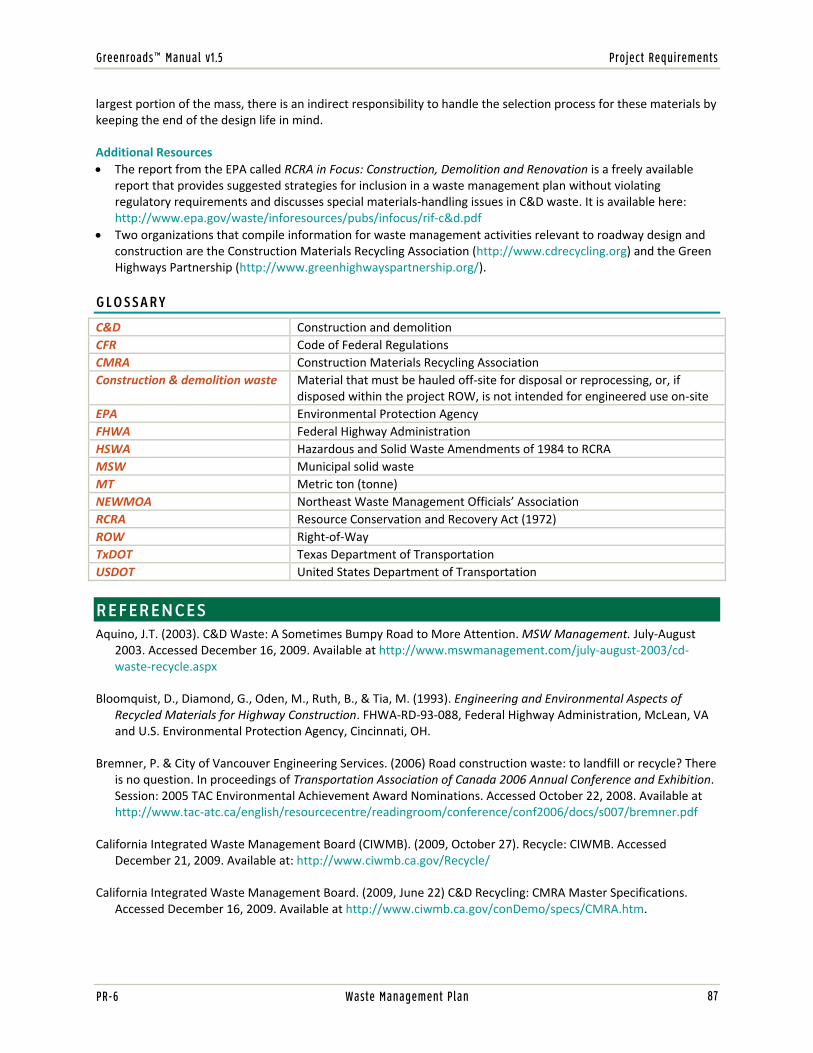
Greenroads™ Manual v1.5 Project Requirements
PR-6 Waste Management Plan
largest portion of the mass, there is an indirect responsibility to handle the selection process for these materials by keeping the end of the design life in mind.
Additional Resources • The report from the EPA called RCRA in Focus: Construction, Demolition and Renovation is a freely available
report that provides suggested strategies for inclusion in a waste management plan without violating regulatory requirements and discusses special materials‐handling issues in C&D waste. It is available here: http://www.epa.gov/waste/inforesources/pubs/infocus/rif‐c&d.pdf
• Two organizations that compile information for waste management activities relevant to roadway design and construction are the Construction Materials Recycling Association (http://www.cdrecycling.org) and the Green Highways Partnership (http://www.greenhighwayspartnership.org/).
GLOSSARY
C&D Construction and demolitionCFR Code of Federal RegulationsCMRA Construction Materials Recycling AssociationConstruction & demolition waste Material that must be hauled off‐site for disposal or reprocessing, or, if
disposed within the project ROW, is not intended for engineered use on‐site EPA Environmental Protection AgencyFHWA Federal Highway AdministrationHSWA Hazardous and Solid Waste Amendments of 1984 to RCRA MSW Municipal solid wasteMT Metric ton (tonne)NEWMOA Northeast Waste Management Officials’ Association RCRA Resource Conservation and Recovery Act (1972)ROW Right‐of‐WayTxDOT Texas Department of TransportationUSDOT United States Department of Transportation
REFERENCES Aquino, J.T. (2003). C&D Waste: A Sometimes Bumpy Road to More Attention. MSW Management. July‐August
2003. Accessed December 16, 2009. Available at http://www.mswmanagement.com/july‐august‐2003/cd‐waste‐recycle.aspx
Bloomquist, D., Diamond, G., Oden, M., Ruth, B., & Tia, M. (1993). Engineering and Environmental Aspects of Recycled Materials for Highway Construction. FHWA‐RD‐93‐088, Federal Highway Administration, McLean, VA and U.S. Environmental Protection Agency, Cincinnati, OH.
Bremner, P. & City of Vancouver Engineering Services. (2006) Road construction waste: to landfill or recycle? There is no question. In proceedings of Transportation Association of Canada 2006 Annual Conference and Exhibition. Session: 2005 TAC Environmental Achievement Award Nominations. Accessed October 22, 2008. Available at http://www.tac‐atc.ca/english/resourcecentre/readingroom/conference/conf2006/docs/s007/bremner.pdf
California Integrated Waste Management Board (CIWMB). (2009, October 27). Recycle: CIWMB. Accessed December 21, 2009. Available at: http://www.ciwmb.ca.gov/Recycle/
California Integrated Waste Management Board. (2009, June 22) C&D Recycling: CMRA Master Specifications. Accessed December 16, 2009. Available at http://www.ciwmb.ca.gov/conDemo/specs/CMRA.htm.
87

Project Requirements Greenroads™ Manual v1.5
Waste Management Plan PR-6
Construction Industry Research and Information Association. (2004, April 28). CIRIA: Construction Waste and Resources. Design and Construction Good Practice Pointers. Accessed December 21, 2009. Available at: http://www.ciria.org.uk/cwr/good_practice_pointers.htm
Construction Materials Recycling Association. (2009a). CMRA: Home. Accessed December 16, 2009. Available at http://www.cdrecycling.org/
Construction Materials Recycling Association. (2009b). 2009 C&D Recycling Excellence Honored By CMRA [Press Release]. April 6, 2009. Accessed December 16, 2009. Available at http://www.cdrecycling.org/news
Davio, R. United States Department of Transportation, Federal Highway Administration. (2000) Lessons Learned: TxDOT’s Efforts to Increase the Use of Recycled Materials. Public Roads. 64(1). Accessed December 16, 2009. Available at http://www.tfhrc.gov/pubrds/julaug00/recyctx.htm
Environmental Protection Agency (EPA). (2008, October 2) Landfills | C&D Materials | Wastes | US EPA. Accessed December 16, 2009. Available at http://www.epa.gov/waste/nonhaz/industrial/cd/cdlandfill.htm
Environmental Protection Agency (EPA). (2008a, September 11) Landfills | Municipal Solid Waste | Wastes | US EPA. Accessed December 16, 2009. Available at http://www.epa.gov/waste/nonhaz/municipal/landfill.htm
Environmental Protection Agency (EPA). (2008b, October 2) Basic Information | C&D Materials | Wastes | US EPA. Accessed December 16, 2009. Available at http://www.epa.gov/osw/nonhaz/industrial/cd/basic.htm
Environmental Protection Agency (EPA). (2009b, March 13) Industrial Wastes | Wastes | US EPA. Accessed December 16, 2009. Available at http://www.epa.gov/osw/nonhaz/industrial/index.htm
Environmental Protection Agency (EPA). (2009c, March 13) Non‐Hazardous Wastes | Wastes | US EPA. Accessed December 16, 2009. Available at http://www.epa.gov/waste/nonhaz/index.htm
Environmental Protection Agency (EPA). (2009d, July 1) Definition of Solid Waste | Wastes | US EPA. Accessed December 16, 2009. Available at http://www.epa.gov/osw/hazard/dsw/index.htm
Environmental Protection Agency (EPA). (2009e, November 16) C&D Materials | Wastes | US EPA. Accessed December 16, 2009. Available at http://www.epa.gov/osw/conserve/rrr/imr/cdm/index.htm
Environmental Protection Agency. (2004, September) RCRA in Focus: Construction, Demolition, and Renovation. (EPA530‐K‐04‐005). Accessed December 16, 2009. Available at: http://www.epa.gov/waste/inforesources/pubs/infocus/rif‐c&d.pdf
Environmental Protection Agency. (2008b, September 30). Climate Change and Municipal Solid Waste Fact Sheet | Pay‐As‐You‐Throw | US EPA. Accessed December 21, 2009. Available at http://www.epa.gov/waste/conserve/tools/payt/tools/factfin.htm
Environmental Protection Agency. (2008c, November 13). Municipal Solid Waste | Wastes | US EPA. Accessed December 21, 2009. Available at http://www.epa.gov/waste/nonhaz/municipal/index.htm
Environmental Protection Agency. (2008e, December 3). P2 Resource Exchange | Pollution Prevention | US EPA. Accessed December 21, 2009. Available at http://www.epa.gov/p2/pubs/p2rx.html.
Environmental Protection Agency. (2009a, March) Estimating 2003 Building‐Related Construction and Demolition Materials Amounts. (EPA530‐R‐09‐002). Accessed December 16, 2009. Available at: http://www.epa.gov/waste/conserve/rrr/imr/cdm/pubs/cd‐meas.pdf
88
Greenroads™ Manual v1.5 Project Requirements
PR-6 Waste Management Plan
Environmental Protection Agency. (2009a, September 14). Waste Home | General Information on the Link Between Solid Waste and Climate Change | Climate Change ‐ What You Can Do | US EPA. Accessed December 21, 2009. Available at http://www.epa.gov/climate/climatechange/wycd/waste/generalinfo.html
Environmental Protection Agency. (2009c, November) Municipal Solid Waste Generation, Recycling, and Disposal in the United States: Facts and Figures for 2008. (EPA‐530‐F‐009‐021) Available at http://www.epa.gov/epawaste/nonhaz/municipal/pubs/msw2008rpt.pdf
Environmental Protection Agency. Office of Resource Conservation and Recovery. (2009b, November). Municipal Solid Waste Generation, Recycling, and Disposal in the United States: Detailed Tables and Figures for 2008. Available at http://www.epa.gov/epawaste/nonhaz/municipal/pubs/msw2008data.pdf
Franklin Associates, Inc. (1998, June). Characterization of Building‐Related Construction and Demolition Debris in the United States. Report prepared for Environmental Protection Agency Municipal and Industrial Solid Waste Division, Office of Solid Waste. (EPA530‐R‐98‐010). Prairie Village, KS: TechLaw, Inc. Available at http://www.epa.gov/osw/hazard/generation/sqg/c&d‐rpt.pdf
Gambatese, J. A., & Rajendran, S. (2005). Sustainable Roadway Construction: Energy Consumption and Material Waste Generation of Roadways. In Proceedings of the ASCE Construction Research Congress 2005: Broadening perspectives, April 5‐7, 2005 (San Diego, Ca). Reston, Va: American Society of Civil Engineers.
Green Highways Partnership, Global Environment & Technology Fund. (2008). Green Highways Partnership. Accessed December 16, 2009. Available at http://www.greenhighwayspartnership.org/
ICF Incorporated. (1995a, May 18). Environmental Damages Cases from Construction and Demolition Waste Landfills [DRAFT]. Report prepared for Environmental Protection Agency. Available at http://www.epa.gov/osw/hazard/generation/sqg/damages/dam‐pdf/damage.pdf
ICF Incorporated. (1995b, May 18). Report on Construction and Demolition Waste Landfills [DRAFT]. Report prepared for Environmental Protection Agency. Available at http://www.epa.gov/waste/hazard/generation/sqg/const/cdrpt.pdf
Intergovernmental Panel on Climate Change (IPCC). (2007) Pachauri, R.K & Reisinger, A. eds. Climate Change 2007: Synthesis Report. “Contribution of Working Groups I, II and III to the Fourth Assessment. Report of the Intergovernmental Panel on Climate Change.” IPCC: Switzerland, 2007. 104 pp.
Johnson, J. (2009, March 30). EPA estimates C&D debris up 25%. Waste Recycling News. Accessed December 16, 2009. Available at http://wastenews.texterity.com/wastenews/20090330//Print_su#pg1
Kibert, C. (2005). Sustainable construction: green building design and delivery (1st ed.). Hoboken N.J.: John Wiley & Sons.
King County Solid Waste Division & Seattle Public Utilties. (2007). 2007 Contractors Guide ‐ King County Solid Waste Division. Available at: http://your.kingcounty.gov/solidwaste/greenbuilding/documents/ConGuide.pdf
King County Solid Waste Division. (2008, October 2). Design specifications and waste management plans for green building projects in King County, WA. Accessed December 20, 2009. Available at: http://your.kingcounty.gov/solidwaste/greenbuilding/construction‐recycling/specifications‐plans.asp
King County Solid Waste Division. (2009, October 20) Green Building ‐ King County Solid Waste Division. Accessed December 20, 2009. Available at: http://www.greentools.us
89
Project Requirements Greenroads™ Manual v1.5
Waste Management Plan PR-6
Kourmpanis, B., Papadopoulos, A., Moustakas, K., Stylianou, M., Haralambous, K., & Loizidou, M. (2008). Preliminary study for the management of construction and demolition waste. Waste Management & Research. 26 (3), 267‐275.
McDonough, W. & Braungart, M. (2002). Cradle to cradle: Remaking the way we make things. New York: North Point Press.
Northeast Waste Management Officials’ Association (NEWMOA). (2009, June 30). Construction & Demolition WasteManagement in the Northeast in 2006. Boston, Ma: NEWMOA. Available at http://www.newmoa.org/solidwaste/CDReport2006DataFinalJune302009.pdf
Poon, C. S., Yu, A. T. W. & Ng, L. H. (2001). On‐site sorting of construction and demolition waste in Hong Kong. Resources, Conservation, and Recycling. 32 (2), 157.
Rajendran, S. & Gambatese, J. A. (2007). Solid Waste Generation in Asphalt and Reinforced Concrete Roadway Life Cycles. Journal of Infrastructure Systems. 13 (2), 88.
Schultmann, F. & Sunke, N. (2007). Energy‐oriented deconstruction and recovery planning. Building Research &; Information. 35 (6), 602‐615.
Seydel, A., Wilson, O. D. & Skitmore, R. M. (2002). Financial Evaluation of Waste Management Methods. Journal of Construction Research. 3 (1), 167‐179.
Sustainable Sites Initiative. (2009) The Sustainable Sites Initiative: Guidelines and Performance Benchmarks 2009. Available at http://www.sustainablesites.org/report/
United States Green Building Council (USGBC). (2009) LEED 2009 for New Construction and Major Renovations Rating System. Available at http://www.usgbc.org/DisplayPage.aspx?CMSPageID=220
WasteCap Resource Solutions. WasteCap Resource Solutions ‐ Construction & Demolition. Accessed December 21, 2009. Available at http://www.wastecapwi.org/resources/construction‐demolition/
90

Greenroads™ Manual v1.5 Project Requirements
PR-7 Pollution Prevention Plan
POLLUTION PREVENTION PLAN GOAL Reduce�pollution�and�associated�effects�from�construction�activities.�
REQUIREMENTS Create�and�implement�a�comprehensive�Stormwater�Pollution�Prevention�Plan�(SWPPP)�or�Temporary�Erosion�and�Sedimentation�Control�(TESC)�plan�that�conforms�to�the�requirements�of�the�current�Environmental�Protection�Agency�(EPA)�Construction�General�Permit�OR�the�local�or�state�Construction�General�Permit�in�areas�that�manage�their�own�permitting�plan,�whichever�is�more�stringent.��The�SWPPP/TESC�must�address�water�quality�control�and�dust�control�activities�used�during�construction�of�the�roadway�project.��
Details
Note:�A�SWPPP�for�construction�activities�is�also�sometimes�called�a�Temporary�Erosion�and�Sedimentation�Control�(TESC)�Plan�or�Pollution�Prevention�Plan�(PPP)�depending�on�local�jurisdictions.�
This�requirement�applies�to�ALL�Greenroads�projects,�regardless�of�size.�
DOCUMENTATION � Copy�of�the�Stormwater�Pollution�Prevention�Plan�(SWPPP)�or�Temporary�Erosion�
and�Sedimentation�Control�Plan�(TESC)�signed�by�the�certified�Erosion�and�Sediment�Control�inspector�or�authorized�specialist�for�the�project�upon�completion�of�construction.�
PR-7
REQUIRED
RELATED CREDITS
� PR�4�Quality�Control�Plan�
� PR�6�Waste�Management�Plan�
� PR�8�Low�Impact�Development�
� EW�1�Environmental�Management�System
� EW�2�Runoff�Flow�Control�
� EW�3�Runoff�Quality�� CA�1�Quality�
Management�System� CA�2�Environmental�
Training�
SUSTAINABILITY COMPONENTS
� Ecology�� Expectations�
BENEFITS
� Reduces�Air�Emissions�
� Reduces�Water�Pollution�
� Reduces�Solid�Waste�
91

Project Requirements Greenroads™ Manual v1.5
Pollution Prevention Plan PR-7
APPROACHES & STRATEGIES
� Evaluate�federal,�state�and�local�requirements�for�most�stringent�pollution�prevention�standards�� Identify�any�high�risk�pollution�related�elements�of�the�project�early�in�design.�� Use�design�and�construction�staff�properly�trained�in�pollution�prevention.�� Consider�site�topography�carefully�during�planning�for�construction�staging�areas�and�storage�areas�for�
aggregates,�wastes�and�other�materials.�� Create�the�pollution�prevention�plan�during�project�development.�(USGBC,�2009)�� Use�more�than�one�strategy�to�prevent�pollution�on�your�project�such�as�(Sustainable�Sites�Initiative,�2009;�
USGBC,�2009):��
� Temporary�and�permanent�seeding�� Mulching�� Earth�dikes�� Sediment�traps�� Sediment�basins�� Filter�socks�� Compost�berms�and�blankets�� Secondary�containment�� Spill�control�equipment�� Hazardous�waste�manifests,�and��� Overfill�alarms.�� Silt�fencing�
� Seal�pavement�only�when�weather�is�not�rainy.�(Sustainable�Sites�Initiative,�2009).�� Do�not�conduct�mass�grading�operations�before�large�storms�are�forecast�(Sustainable�Sites�Initiative,�2009).�� Coordinate�staging�activities�with�a�contractor�during�design�where�possible.�� Use�care�when�sequencing�construction�activities,�especially�for�installation�of�low�impact�development�(LID)�
infiltration�systems�(Sustainable�Sites�Initiative,�2009).�� Have�an�environmental�monitor�on�site�to�make�sure�that�the�requirements�of�the�SWPPP�are�being�followed.�
Example: EPA SWPPP Templates and Guidance
The�EPA�provides�a�significant�amount�of�guidance�to�aid�in�developing�stormwater�pollution�prevention�plan�for�construction�activities.�A�number�of�tools�are�available,�such�as:�
� SWPPP�Template�for�states�authorized�to�implement�NPDES:�http://www.epa.gov/npdes/pubs/sw_swppp_template_authstates.doc��
� SWPPP�Template�for�jurisdictions�not�authorized�to�implement�NPDES�(Alaska,�Massachusetts,�Idaho,�New�Mexico,�New�Hampshire,�the�District�of�Columbia,�U.S.�Territories,�and�Indian�land):�http://www.epa.gov/npdes/pubs/sw_swppp_template_unauthstates.doc��
� Helpful�guidance�on�developing�SWPPPs�for�your�construction�site,�Developing�Your�Stormwater�Pollution�Prevention�Plan:�a�Guide�for�Construction�Sites:�http://www.epa.gov/npdes/pubs/sw_swppp_guide.pdf.��
More�tools,�sample�plans,�inspection�templates�and�other�helpful�information�are�available�at�http://cfpub.epa.gov/npdes/Stormwater/swppp.cfm.�(EPA,�2008)�
POTENTIAL ISSUES
1. The�EPA�only�requires�Construction�General�Permits�for�land�disturbing�activities�greater�than�one�acre�in�size.�However,�every�Greenroads�project�must�have�a�plan�for�controlling�construction�stormwater�runoff,�regardless�of�size,�because�size�does�not�dictate�good�practice�or�insignificance�of�pollution�generated�by�these�construction�activities.�The�precedence�for�this�requirement�has�been�established�by�other�sustainability�rating�
92

Greenroads™ Manual v1.5 Project Requirements
PR-7 Pollution Prevention Plan
systems,�such�as�the�2009�Sustainable�Sites�Initiative�(see�“Prerequisite�7.1�Control�and�retain�construction�pollutants”)�and�the�LEED™�2009�Green�Building�Rating�System�(see�“Prerequisite�1�Construction�Activity�Pollution�Prevention”�in�the�“Sustainable�Sites”�credit�category).��
2. For�small�projects�that�do�not�normally�need�to�complete�a�SWPPP,�a�SWPPP�will�need�to�be�generated.�This�could�require�additional�man�hours�for�the�project,�especially�if�the�SWPPP�development�process�is�unfamiliar.�
3. Some�jurisdictions�may�have�stormwater�requirements�in�place�that�are�similar�but�not�identical�to�the�NPDES�requirements.�In�such�cases,�additional�supporting�documentation�may�be�requested�to�demonstrate�that�the�project�SWPPP�in�place�is�equal�to�or�more�stringent�the�requirements�for�the�EPA�Construction�General�Permit.�However,�this�requirement�does�not�intend�to�generate�extra�paperwork,�so�where�possible,�links�to�current�agency�policies�may�be�provided�in�support�of�this�Project�Requirement.�
RESEARCH Providing�an�erosion�and�sediment�control�plan�during�the�construction�of�infrastructure�holds�both�contractors�and�owners�accountable�to�protect�the�surrounding�environment�from�negative�effects�of�excess�sediment�and�pollution�in�stormwater.�
Providing�erosion�and�sedimentation�control�during�construction�of�roadway�infrastructure�prevents:�
� Degradation�of�aquatic�habitats�of�fish�and�insects�(EPA,�1999)�as�well�as�other�wildlife�communities.�� Increased�sediment�loading�in�nearby�streams�and�outfalls�(EPA,�1999).�
The�increase�in�sediment�found�in�runoff�on�construction�sites�can�be�attributed�to�land�that�has�been�cleared�of�vegetation�leaving�exposed�soil.�Increased�sediment�loading�in�rivers�and�streams�is�the�most�common�problem�for�water�quality�(EPA,�2009b).�If�rain�events�occur,�this�can�cause�erosion,�and�if�erosion�is�not�contained�using�the�stormwater�best�management�practices�outlined�in�the�NPDES,�sediment�can�then�be�mixed�with�stormwater.�At�construction�sites,�these�have�often�been�found�to�contain�metals�and�organic�material,�which�can�cause�damage�to�wetland�habitats�(EPA,�1999).�Furthermore,�excessive�sedimentation�degrades�habitats�and�cause�significant�decreases�to�the�fish�and�insect�populations�of�a�watershed.�
The�United�States�EPA�recommends�keeping�current�water�habitats�to�the�same�quality�as�they�were�before�construction�takes�place.�The�intent�of�this�is�to�ensure�the�water�quality�preconstruction�is�the�same�as�the�water�quality�post�construction,�meaning�it�is�important�to�ensure�the�same�volumes�of�water�are�being�discharged�naturally�before�and�after�development�(EPA,�1999).�In�the�EPA’s�report�to�congress�in�1999�the�agency�shows�a�clear�message�that�the�intent�of�these�permits�is�to�prevent�any�and�all�negative�impacts�to�streams:�
”In�many�cases,�consideration�of�the�increased�flow�rate,�velocity�and�energy�of�storm�water�discharges�following�development�unavoidably�must�be�taken�into�consideration�in�order�to�reduce�the�discharge�of�pollutants,�to�meet�water�quality�standards�and�to�prevent�degradation�of�receiving�streams.”�(EPA,�1999)�
The�NPDES�construction�general�permit�is�the�governing�permit�set�forth�by�the�United�States�EPA�for�the�discharge�of�construction�stormwater.�This�permit�regulates�the�effluent�limits�for�both�sediment�and�pollution�and�is�available�at�http://www.epa.gov/npdes/pubs/cgp2008_finalpermit.pdf.�However,�local�or�state�regulations�may�include�more�stringent�requirements.�Most�states�are�authorized�by�the�EPA�to�manage�their�own�stormwater�pollution�control�activities�(all�but�five�and�the�District�of�Columbia:�Massachusetts,�New�Hampshire,�New�Mexico,�Alaska�and�Idaho).�The�EPA�also�governs�these�activities�in�territories�and�Indian�Country�(EPA,�2009a).��
The�United�States�EPA�outlines�the�provisions�necessary�to�comply�with�Phase�I�and�Phase�II�of�the�National�Pollutant�Discharge�Elimination�System�(NPDES)�program.�The�major�difference�between�the�two�phases�is�in�the�size�of�the�footprint.�The�Phase�II�permit�applies�to�all�sites�in�which�between�one�and�five�acres�of�land�disturbing�activity�occur�(Illinois�EPA).�While�Phase�I�encompasses�all�construction�sites�disturbing�five�acres�or�more�(Illinois�
93

Project Requirements Greenroads™ Manual v1.5
Pollution Prevention Plan PR-7
EPA).�Information�on�the�EPA’s�NPDES�program�is�available�at�http://cfpub2.epa.gov/npdes/index.cfm�(EPA,�2009b).�
GLOSSARY
Effluent� Outflowing�waterEPA� Environmental�Protection�AgencyErosion� A�physical�process�that�removes�solid�materials�from�their�source�and�
transports�them�to�another�location�NPDES� National�Pollution�Discharge�Elimination�SystemSedimentation� The�accumulation�of�soil�particles�in�water�bodiesStormwater� Water�from�rainfall�eventsSWPPP� Stormwater�Pollution�Prevention�PlanTESC� Temporary�Erosion�and�Sedimentation�Control�Plan��
REFERENCES Illinois�Environmental�Protection�Agency,�(2002).�What�is�Phase�II�of�the�NPDES�storm�water�management�
program?�Springfield,�IL.��Available�at�http://www.epa.state.il.us/small�business/phase�two/��
Sustainable�Sites�Initiative.�(2009)�The�Sustainable�Sites�Initiative:�Guidelines�and�Performance�Benchmarks�2009.�Available�at�http://www.sustainablesites.org/report/�
United�States�Environmental�Protection�Agency,�(2008,�November�4).�EPA�|�Stormwater�Pollution�Prevention�for�Construction�Activities.�Available�at�http://cfpub.epa.gov/npdes/Stormwater/swppp.cfm��
United�States�Environmental�Protection�Agency,�(2009a,�February�26).�EPA�|�Authorization�Status�for�EPA’s�Stormwater�Construction�Program.�Available�at�http://cfpub.epa.gov/npdes/stormwater/authorizationstatus.cfm��
United�States�Environmental�Protection�Agency,�(2009b,�November�4).�EPA�|�General�Construction�Permit.�Available�at�http://cfpub.epa.gov/npdes/stormwater/cgp.cfm��
United�States�Environmental�Protection�Agency,�(1999).�National�pollutant�discharge�elimination�system—regulations�for�revision�of�the�water�pollution�control�program�addressing�storm�water�discharges�(FRL���6470�8).�Washington,�DC:�Federal�Register.�Available�at�http://yosemite.epa.gov/OPEI/Sbrefa.nsf/0728e3a1cc2339df85256cf4005020db/9762f1aedc3fbe4585256cef007b0599/$FILE/pnl03f.pdf�
United�States�Green�Building�Council�(USGBC).�(2009)�LEED�2009�for�New�Construction�and�Major�Renovations�Rating�System.�Available�at�http://www.usgbc.org/DisplayPage.aspx?CMSPageID=220��
94
Greenroads™ Manual v1.5 Project Requirements
PR-8 Low Impact Development
LOW IMPACT DEVELOPMENT GOAL Use�low�impact�development�(LID)�stormwater�management�solutions�where�appropriate�to�better�mimic�pre�development�hydrological�conditions.�
REQUIREMENTS Determine�the�feasibility�of�LID�best�management�practices�(BMPs)�for�stormwater�management�in�the�right�of�way�(ROW).�Complete�a�basic�LID�hydrologic�evaluation�according�to�the�steps�outlined�in�Chapter�3,�“LID�Hydrologic�Analysis,”�of�the�1999�Low�Impact�Development�Design�Strategies:�An�Integrated�Approach�(“LID�Manual”)�by�the�Prince�George’s�County,�Maryland,�Department�of�Environmental�Resources,�Programs�and�Planning�Division�(PGC).�If�an�alternative�approach�is�used�to�investigate�LID,�show�that�it�meets�the�general�steps�provided�in�the�referenced�guideline.�The�PGC�guideline�is�available�here:�http://www.lowimpactdevelopment.org/pubs/LID_Hydrology_National_Manual.pdf.�
Details
Low�impact�development�(LID)�is�a�term�that�describes�a�broad�collection�of�engineered�controls,�stormwater�management�facilities,�and�other�land�development�BMPs�that�attempt�to�mimic�pre�development�hydrologic�conditions�by�emphasizing�infiltration,�evapotranspiration,�or�stormwater�reuse�for�long�term�flow�control�and�runoff�treatment.�Hydrologic�analysis�is�a�systematic�way�to�evaluate�existing�stormwater�controls�and�new�stormwater�management�or�improvement�opportunities.�The�LID�Manual�states:�
The�purpose�of�the�hydrologic�evaluation�is�to�determine�the�level�of�control�required�to�achieve�the�stormwater�management�goals�for�LID�sites.�The�required�level�of�control�may�be�achieved�through�application�of�the�various�hydrologic�tools�during�the�site�planning�process,�the�use�of�IMPs,�and�supplemental�controls.�The�hydrologic�evaluation�is�performed�using�hydrologic�modeling�and�analysis�techniques.�The�output�of�the�hydrologic�analysis�provides�the�basis�for�comparison�with�the�four�evaluation�measures�(i.e.,�runoff�volume,�peak�runoff,�frequency,�and�water�quality�control).�(PGC,�1999)�
Note:�This�Project�Requirement�does�not�mandate�the�use�of�LID�techniques�on�the�roadway�project.�Instead,�it�is�intended�to�inform�the�decision�making�process.�Therefore,�any�pre�existing�procedure�that�meets�the�stated�objectives�will�suffice.�
Projects�that�are�not�changing�the�total�existing�surface�area�of�the�roadway�facility�(i.e.�most�rehabilitation�or�resurfacing�projects)�must�also�complete�this�requirement.�This�is�discussed�in�further�detail�in�later�sections�of�this�Project�Requirement.�Also,�for�projects�with�only�minor�stormwater�improvements,�the�hydrologic�analysis�or�LID�evaluation�may�be�scaled�accordingly�(i.e.�simplified).�
DOCUMENTATION � Copy�of�the�completed�LID�hydrologic�evaluation.�Scopes�of�standard�drainage�or�
geotechnical�reports�may�already�meet�these�evaluation�requirements�or�need�only�minor�changes�to�include�LID.�A�separate�document�is�NOT�required�in�this�case.�
PR-8
REQUIRED
RELATED CREDITS
� PR�7�Pollution�Prevention�Plan�
� EW�2�Runoff�Flow�Control�
� EW�3�Runoff�Quality�� EW�4�Stormwater�
Cost�Analysis�� EW�5�Site�Vegetation� EW�6�Habitat�
Restoration�
SUSTAINABILITY COMPONENTS
� Ecology�� Expectations�� Experience�� Exposure�
BENEFITS
� Reduces�Water�Pollution�
� Reduces�Solid�Waste� Reduces�Manmade�
Footprint�� Increases�Awareness�
95

Project Requirements Greenroads™ Manual v1.5
Low Impact Development PR-8
APPROACHES & STRATEGIES
Meeting�this�Project�Requirement�� Evaluate�the�opportunities�on�site�for�using�LID�techniques.�Chances�are�that�there�are�many�opportunities�
available�for�every�project.�This�in�general�means�that�four�steps�are�completed�as�part�of�the�evaluation:�
a. Topographical�assessment�(i.e.�forests,�floodplains,�etc.)�b. Soils�assessment�c. Hydrology�assessment�d. Existing�vegetation�and�water�features�(i.e.�wetlands,�riparian�areas,�etc.)�
� Follow�the�stated�guideline,�or�follow�any�other�guideline�that�uses�a�systematic�site�assessment�to�evaluate�geological�and�hydrological�conditions�and�meets�the�goal�of�this�Project�Requirement.�For�example,�the�Prince�George’s�County�recommendations�have�been�specified�in�more�technical�detail�for�the�Puget�Sound�region�of�Washington�in�the�Puget�Sound�Partnership’s�Low�Impact�Development�Technical�Guidance�Manual�for�Puget�Sound�(Hinman,�2005).�This�Project�Requirement�relies�on�the�former�because�LID�was�pioneered�in�practice�by�Prince�George’s�County�and�their�LID�Manual�is�the�default�guide�for�many�organizations�(EPA,�2000).�
� Evaluate�the�site�for�potential�stormwater�improvements�even�if�the�project�involves�basic�surface�maintenance�activities�or�is�otherwise�considered�to�be�categorically�excluded�from�stormwater�considerations.�It�may�be�that�a�particular�project�cannot�feasibly�implement�any�stormwater�improvements,�either�by�cost,�existing�regulations,�etc.�The�intent�here�is�that�(1)�stormwater�improvements�are�considered�systematically�as�an�opportunity�for�all�roadway�projects�and�(2)�that�any�decisions�made�not�to�implement�stormwater�management�are�documented.�All�projects�have�some�impact,�even�if�they�are�determined�to�be�insignificant�or�categorically�excluded�from�environmental�review,�or�local�policies�are�considered�“not�applicable”�to�certain�project�types.�It�may�be�cost�effective�for�owner�agencies�to�improve�existing�infrastructure�in�conjunction�with�the�roadway�project,�even�if�stormwater�management�is�not�in�the�initial�scope.�
� Use�design�and�construction�staff�properly�trained�in�stormwater�LID�design.�� Identify�opportunities�for�stormwater�related�BMPs�elements�early�in�project�development.�
Some�Potential�LID�Opportunities�� Minimize�impact�to�existing�undisturbed�soil�and�vegetation�through�avoidance,�reduced�project�footprints�
elements�(e.g.�lane�widths,�shoulder�widths,�slopes).�� Use�permeable�hard�surfaces�(e.g.�porous�asphalt,�porous�pavers,�porous�concrete)�instead�of�conventional�
impervious�surfaces.�� Use�amended�or�engineered�soils�instead�of�conventional�compacted�soils.�� Incorporate�dispersed,�evapotranspiration�(ET)�and�infiltration�based�practices�(e.g.�dispersion,�bioretention)�
instead�of�enclosed�drainage�systems.�� The�Federal�Highway�Administration�(FHWA),�Environmental�Protection�Agency�(EPA),�the�American�
Association�of�State�Highway�and�Transportation�Officials�(AASHTO)�Center�for�Environmental�Excellence,�and�the�National�Cooperative�Highway�Research�Program�(NCHRP)�as�well�as�many�state�agencies�outline�a�variety�of�provisions�incorporating�LID�measures�into�roadways.�A�variety�of�resources�are�listed�at�the�end�of�this�credit�for�reference.�
Example: Case Study — High Point Subdivision, Seattle, WA
The�High�Point�subdivision�in�the�West�Seattle�neighborhood�of�Seattle,�Washington�is�one�of�the�first�comprehensive�installations�of�a�Natural�Drainage�Systems�scheme�for�stormwater�management�in�a�large�scale�urban�environment.�(In�Seattle,�streetside�LID�is�referred�to�as�“Natural�Drainage�Systems”�to�distinguish�these�facilities�from�in�lot�installations.)�High�Point�was�a�joint�effort�of�Seattle�Public�Utilities�and�the�Seattle�Housing�Authority�(SPU,�2009)�and�was�a�large�scale�low�income�development�community�that�redeveloped�land�from�a�former�military�base.�
96

Greenroads™ Manual v1.5 Project Requirements
PR-8 Low Impact Development
High�Point�incorporates�a�suite�of�LID�techniques�including�bioswales,�infiltration�basins�and�permeable�pavements�(sidewalks�and�heavily�traveled�residential�streets).�See�Figure�PR�8.1.�These�LID�techniques�helped�the�City�of�Seattle�achieve�some�of�its�stormwater�management�goals.�Some�highlights�of�the�project�include:�
� 10�percent�of�the�watershed�for�Longfellow�Creek�(a�priority�watershed�for�Coho�salmon)�is�accommodated�by�controls�in�High�Point.�
� Predevelopment�conditions�were�mimicked�through�bioswales�and�landscaped�ponds�that�became�amenities�to�the�community.�
� While�standard�detention�basins�were�still�required�for�emergency�and�fire�purposes�for�the�subdivision,�the�size�of�the�detention�facility�was�scaled�down�to�25%�of�what�would�have�been�needed�by�conventionally�designed�controls.�
� High�Point�stormwater�functions�similar�to�the�predeveloped�conditions�of�a�forest�meadow.�
�Figure�PR�8.1:�Three�LID�techniques�are�featured�in�this�photo�taken�at�High�Point�Subdivision�in�Seattle,�WA.�The�grassy�area�(far�left)�is�actually�turf�placed�over�a�large�infiltration�basin.�A�bioswale�(center)�is�featured,�and�still�in�early�growth.�Also,�the�sidewalk�(left)�and�the�street�(right)�are�paved�with�permeable�concrete.�
(Photo�by�J.�Anderson)��
More�information�about�High�Point�LID�techniques�are�available�at:�http://www.seattle.gov/util/About_SPU/Drainage_&_Sewer_System/GreenStormwaterInfrastructure/NaturalDrainageProjects/HighPointNaturalDrainageSystem/index.htm��
Example: Case Study — SEA Street, Seattle, Washington
Another�example�from�Seattle,�“SEA�Street,”�was�actually�one�of�the�first�pilot�projects�for�low�impact�development�infrastructure�in�Seattle.�(Here,�SEA�stands�for�Street�Edge�Alternatives)�(SPU,�2009).�The�SEA�street�program�focused�on�improving�natural�drainage�of�existing�residential�street�areas�through�three�main�LID�techniques:�
� Narrower�streets�(which�also�provide�a�traffic�calming�effect).�See�Figure�PR�8.2.�(Note�that�narrow�streets�are�typically�considered�to�be�an�approach�in�“conservation�design”)�(EPA,�2000).��
97

Project Requirements Greenroads™ Manual v1.5
Low Impact Development PR-8
� Added�vegetation�(for�increased�infiltration�and�public�amenities).�� Vegetated�filter�strips.�Compare�the�conventional�asphalt�lined�channel�(Figure�PR�8.3)�with�the�new�
vegetated�filters�strips�installed�along�the�sidewalks�(Figure�PR�8.4).�
�Figure�PR�8.2:�This�street�was�designed�to�be�narrower�in�order�to�produce�a�traffic�calming�effect�for�this�
residential�area.�(Photo�by�J.�Anderson)��
�Figure�PR�8.3:�A�conventional�asphalt�lined�channel�
near�SEA�Street.�(Photo�by�J.�Anderson)��
�Figure�PR�8.4:�A�bioswale�on�SEA�Street�between�the�
sidewalk�and�street.�(Photo�by�J.�Anderson)��
98
Greenroads™ Manual v1.5 Project Requirements
PR-8 Low Impact Development
�More�information�about�SEA�Street�is�available�from�Seattle�Public�Utilities�at:�http://www.seattle.gov/util/About_SPU/Drainage_&_Sewer_System/GreenStormwaterInfrastructure/NaturalDrainageProjects/StreetEdgeAlternatives/index.htm��
Example: City of Kirkland, Washington Surface Water Low Impact Development
The�City�of�Kirkland�requires�the�use�of�surface�water�low�impact�development�(LID)�techniques�as�feasible�on�new�development.�The�City�has�adopted�the�King�County�Surface�Water�Design�Manual�(KCSWDM),�which�requires�that�development�projects�perform�a�surface�water�LID�feasibility�study�and�install�stormwater�LID�to�the�maximum�extent�feasible�and�to�install�at�least�one�element�for�surface�water�runoff�in�all�situations�(City�of�Kirkland,�2010).��The�KCSWDM�can�be�found�here:�http://www.kingcounty.gov/environment/waterandland/stormwater/documents/surface�water�design�manual.aspx.�
POTENTIAL ISSUES
1. Most�sites�will�be�able�to�incorporate�some�LID�techniques;�however,�soil�conditions�in�every�project�will�be�different.�In�general,�there�will�be�a�tradeoff�between�function�and�cost�for�implementing�LID.�
2. Some�sites�have�existing�soil�or�water�pollution�issues�where�infiltration�through�soils�and�into�groundwater�tables�or�other�aquifers�may�not�be�allowed�or�is�not�advisable.�
3. Some�regulations�or�urban�planning�policies�may�be�in�place�in�some�areas�that�dictate�a�number�of�urban�improvements,�such�as�widening�sidewalks�or�adding�width�to�lanes.�These�add�impervious�surface,�and�do�not�allow�much�room�for�LID�in�the�right�of�way.�Often�these�regulatory�implications�will�be�difficult�to�overcome�(EPA,�2000).��In�general,�a�review�of�existing�policy�should�be�part�of�the�LID�evaluation.�
4. The�LID�Manual�referenced�in�this�credit�refers�to�the�“Hydrologic�Analysis”�by�Prince�George’s�County,�Maryland.�As�it�turns�out,�this�particular�process�is�outlined�in�two�different�documents�by�PGC.�Either�is�acceptable�for�this�Project�Requirement�because�they�are�equivalent.�The�Low�Impact�Development�Hydrologic�Analysis�is�an�abridged�version�of�the�one�specified�here�and�it�is�available�from�the�AASHTO�via�the�EPA�at:�http://www.epa.gov/owow/nps/lid/lid_hydr.pdf.��
5. This�Project�Requirement�applies�to�all�projects,�even�those�that�typically�do�not�consider�stormwater�as�one�of�their�main�project�objectives.�There�is�documented�evidence�that�shows�consideration�of�stormwater�in�project�planning�for�urban�roads�can�often�result�in�strategic�benefits�for�urban�environments�where�stormwater�management�is�increasingly�a�problem�(City�of�Seattle,�2009).��Additionally,�where�roadways�are�located�in�watersheds�with�total�maximum�daily�load�(TMDL)�requirements,�LID�techniques�are�becoming�one�way�that�a�roadway�stormwater�management�system�can�help�reduce�the�non�point�source�water�pollution�impact�on�the�receiving�waters�from�stormwater�generated�on�the�impervious�surface�(EPA,�2008).��In�essence,�this�Project�Requirement�is�not�requiring�that�LID�is�implemented;�instead,�it�is�requiring�that�it�is�considered.�Some�projects�will�specifically�avoid�stormwater�issues�just�to�save�cost,�but�this�practice�does�not�ultimately�agree�with�the�goals�and�intents�of�Greenroads.�
RESEARCH Low�impact�development�(LID)�is�a�well�documented�approach�to�stormwater�management.�The�best�way�to�describe�LID�is�as�a�collection�of�decentralized,�small�scale,�engineered�stormwater�controls�that�collect�and�treat�stormwater�at�the�source�as�it�is�generated�(EPA,�2000;�Huber�et�al.,�2006;�Hinman,�2005;�City�of�Seattle,�2009).��A�number�of�hydrological�objectives�are�achieved�by�this�approach,�because�it�relies�heavily�on�the�natural�ecosystem�processes�infiltration�(IF)�and�evapotranspiration�(ET).�Surface�flows�are�reduced�and�also�attenuated,�some�level�of�water�quality�treatment�is�often�provided,�and�groundwater�tables�can�be�recharged,�which�help�maintain�stream�flows:�all�of�these�things�help�an�“unnatural”�(i.e.�manmade)�system�such�as�a�building�or�a�roadway�more�effectively�mimic�the�natural�ecosystem’s�preexisting�hydrology�(relative�to�its�undeveloped�condition).�LID�strategies�thus�combine�to�become�an�effective�and�efficient�stormwater�management�scheme�that�results�in�an�overall�smaller�ecosystem�footprint.�
99

Project Requirements Greenroads™ Manual v1.5
Low Impact Development PR-8
Generally,�this�is�contrary�to�the�philosophy�behind�most�conventional�structural�stormwater�systems,�which�collect�and�convey�stormwater�to�meet�only�an�efficiency�objective,�i.e.�remove�it�from�the�site�and�treat�it�elsewhere�(an�end�of�pipe�approach)�often�using�a�lot�of�material�along�the�way�to�construct�the�needed�infrastructure�to�perform�these�tasks�(EPA,�2000).��
Sometimes,�LID�is�also�called�“green�infrastructure”�or�GI�(EPA,�2009),�or�also�“Natural�Drainage�Systems”�(SPU,�2009)�and�also�usually�includes�some�elements�of�another�development�approach�known�as�“Conservation�Design”�or�CD�(EPA,�2000).�
How�Do�LID�Techniques�Work?�Put�simply,�LID�works�by�minimizing�the�amount�of�impervious�area�on�a�site,�sometimes�called�the�“effective�impervious�area”�(EIA)�though�this�nomenclature�varies�(EPA,�2000).��An�impervious�surface�is�“a�hard�surface�area�that�either�prevents�or�retards�the�entry�of�water�into�the�soil�mantle�or�causes�water�to�run�off�the�surface�in�greater�quantities�or�at�an�increased�rate”�(Tilley�&�Slonecker,�2006).��Developed�areas�have�high�levels�of�impervious�surfaces�compared�to�their�otherwise�undeveloped�conditions�(i.e.�“predevelopment”).�According�to�a�recent�study�for�Federal�Highway�Administration�by�the�United�States�Geological�Service�(Tilley�&�Slonecker,�2006),�roads�and�sidewalks�accounted�for�an�average�of�about�31.5�percent�of�the�total�impervious�surface�in�six�studied�urban�and�suburban�watersheds.�
Because�increased�impervious�surfaces�lead�to�higher�volumes�of�surface�runoff�(at�higher�velocities�and�faster�times�to�peak�flows),�streams�and�watersheds�can�be�damaged�with�erosion�producing�flows.�Erosive�flows�are�characterized�by�higher�sediment�loads�that�degrade�aquatic�habitats.�Conventional�stormwater�control�techniques�tend�to�decouple�the�rainfall�event�from�one�of�its�main�hydrological�functions:�groundwater�recharge�(EPA,�2000).��Figure�PR�8.5�shows�this�phenomenon�graphically.��
�Figure�PR�8.5:�Comparison�of�predevelopment�hydrology�and�developed�hydrology.�(From�Schuler,�1987)�
�Stormwater�management,�then,�in�any�environment�(rural�and�urban),�plays�an�enormous�role�in�sustainability�or�maintaining�existing�hydrology.�LID�techniques�can�help�restore�the�predevelopment�hydrological�balance�in�areas�that�have�been�ultra�urbanized�(City�of�Seattle,�2009;�EPA,�2009)�and�can�also�help�maintain�a�close�match�for�existing�hydrological�function�in�areas�that�have�not�been�developed.�
In�general,�LID�techniques�have�the�following�common�features�(Hinman,�2005):�
� Infiltration�and�evapotranspiration�are�the�primary�modes�of�runoff�controls�
(Schueler, 1992)(Schueler, 1992)
100

Greenroads™ Manual v1.5 Project Requirements
PR-8 Low Impact Development
� Impermeable�surfaces�are�avoided�or�significantly�decreased�� Natural�soils�are�used,�often�with�organic�compositions�(organics)�instead�of�engineered�or�off�site�fill�� Native�vegetation�is�used�(for�some�select�techniques)�� Usually�they�are�used�in�combination.�� Usually�not�all�of�them�are�appropriate�for�every�site.�
Depending�on�flow�control�objectives,�there�are�a�variety�of�LID�design�techniques�to�increase�retention,�increase�time�of�concentration�and�reduce�total�volume�(primarily�through�IF�and�ET).�Consequently,�before�LID�is�used�on�any�site,�that�site�must�be�assessed�for�such�things�as�soil�properties,�existing�hydrological�In�order�to�determine�if�LID�is�appropriate�(PGC,�1999).�
What�are�the�benefits�of�LID?�There�is�a�laundry�list�of�benefits�associated�with�LID,�including�human�health�and�aesthetic�benefits�that�go�hand�in�hand�with�a�number�of�environmental�benefits.�
� Flow�control�for�volume�and�time�of�concentration�(reduced�erosive�flows,�and�reduced�load�on�municipal�stormwater�facilities�too)�(EPA,�2009)�
� Groundwater�recharge�through�infiltration�(ibid.)�� Improved�water�quality�(ibid.)�� Reduced�sewer�overflow�(ibid.)�� Increased�carbon�sequestration�through�increased�vegetation�(ibid.)�� Urban�Heat�Island�mitigation�and�reduced�energy�demands�in�cities�and�developed�areas�(ibid.)�� Improved�air�quality�primarily�through�increased�use�of�vegetation,�also�includes�a�cooling�effect�(ibid.)�� Creation�of�habitat�and�recreational�space�(ibid.)�� Improved�human�health�through�connection�to�place�and�the�natural�environment�(ibid.)�� Increased�property�values�due�to�added�aesthetics�and�performance�(ibid.)�� Reduced�cost�and�size�for�supplemental�conventional�stormwater�infrastructure�(EPA,�2000)�� Easily�incorporated�into�a�number�of�urbanized�features,�such�as�parking�spaces�and�streetsides�(EPA,�2000)�
LID�Limitations�While�LID�is�a�best�management�practice,�it�is�the�means�to�an�end�for�every�stormwater�management�issue.�Like�any�practice�or�technology,�there�are�certain�limitations�to�LID�techniques�that�must�be�understood�prior�to�implementing�them�on�a�roadway�project.�
1. Some�especially�sensitive�watersheds�may�have�objectives�(i.e.�quality�and�flow�control)�that�cannot�be�achieved�via�LID�alone.�Some�larger�structural�measures�may�be�necessary�for�some�projects�(EPA,�2000).�
2. The�overall�performance�of�LID�elements�on�a�project�is�very�site�specific�(EPA,�2000).��This�means�that�a�comprehensive�site�evaluation�is�an�extremely�important�step�in�an�effective�stormwater�management�scheme.�
3. Long�term�maintenance�of�LID�elements�can�be�an�issue,�usually�because�of�contractor�unfamiliarity.�Also�frequency�of�maintenance�activities�usually�is�higher�than�for�conventional�controls,�which�can�cause�long�term�funding�issues�(EPA,�2000).�
4. Lack�of�maintenance�can�often�be�very�detrimental�to�LID�performance�and�function�(Hinman,�2005).�5. Construction�of�LID�elements�requires�special�care�for�some�facilities.�For�example,�overcompaction�of�
infiltration�basin�soils�or�amended�soils�can�lead�to�poor�performance�for�flow�control�(Hinman,�2005).�6. Some�sites�may�be�ideal�candidates�for�LID�BMPs,�but�regulatory�standards�disallow�them�and�require�that�
impervious�surfaces�are�installed�instead.�These�could�be�subdivision�codes,�zoning�rules,�parking�and�street�widths�and�sidewalk�requirements,�and�other�development�standards�that�can�essentially�trump�good�stormwater�design�opportunities�(EPA,�2000;�Hinman,�2005).�
7. LID�techniques�are�not�the�best�for�handling�large�storm�events.�Usually,�they�behave�much�the�same�as�natural�hydrological�features�in�these�situations.�Sometimes,�LID�measures�will�need�to�be�supplemented�by�conventional�conveyance�as�a�contingency�(Hinman,�2005).�
101

Project Requirements Greenroads™ Manual v1.5
Low Impact Development PR-8
8. Huber�et�al.�(2006)�note�that�the�road�right�of�way�can�restrict�the�ability�of�the�engineer�to�incorporate�LID�practices�due,�simply,�to�lack�of�space.�
Why�is�a�LID�evaluation�a�requirement�for�Greenroads?�The�environmental�impacts�of�stormwater�generated�from�roadway�facilities�are�not�to�be�ignored.�The�decentralized�nature�of�LID�techniques�fits�well�with�the�environment�of�many�roads,�even�in�urban�environments.�However,�many�roadway�facilities�do�not�take�advantage�of�the�hydrological�benefits�of�IF�and�ET�in�standard�design�practice.�It�is�the�intent�of�this�Project�Requirement�to�provide�an�opportunity�to�evaluate�these�design�approaches,�which�represent�a�higher�level�of�practice�for�managing�stormwater.��
What�Happens�If�Infiltration�Is�Not�Appropriate�For�My�Project?�For�this�Project�Requirement�(PGC,�1999),�the�main�steps�required�in�this�study�are:�
a. Identify�the�project�watershed�and�microwatershed�areas�b. Define�design�storms�or�long�term�performance�requirements�c. Define�modeling�techniques�to�be�employed�d. Compile�information�for�predevelopment�conditions�e. Evaluate�predevelopment�conditions�and�develop�baseline�measures�f. Evaluate�site�planning�benefits�and�compare�with�baseline�g. Evaluate�BMPs�h. Evaluate�supplemental�needs�
If�infiltration�and�ET�are�not�appropriate�for�the�project,�or�cannot�be�used�in�an�effective�comprehensive�manner,�then�clearly�conventional�structural�stormwater�controls�will�likely�require�consideration�for�stormwater�management.�This�requirement�does�not�dictate�that�LID�must�be�used.�However,�other�credits�in�Greenroads�may�become�more�difficult�to�earn,�such�as�EW�2�Runoff�Flow�Control,�EW�3�Runoff�Quality�and�EW�4�Stormwater�Cost�Analysis.�
How�Much�Does�LID�Cost?�In�general,�costs�can�vary�for�LID�stormwater�controls.�See�the�discussion�included�in�Credit�EW�4�Stormwater�Cost�Analysis.�Many�projects�have�been�shown�to�be�cheaper�conventional�conveyance�and�treatment�systems.�However,�there�is�little�reliable�cost�information�regarding�performance�of�such�LID�systems�in�a�highway�environment.�While�the�idea�of�using�LID�is�well�documented�for�highway�environments�(see�Huber�et�al.,�2006),�the�long�term�performance�of�LID�on�highways,�if�practiced,�is�not.�However,�many�local�agencies�in�urban�areas�have�found�that�road�maintenance�and�rehabilitation�projects�offer�a�unique�opportunity�to�improve�stormwater�infrastructure�in�these�cities�(e.g.�Seattle,�Washington;�Prince�George’s�County�Maryland).�
Some�Examples�of�LID�Techniques�There�are�a�number�of�LID�Techniques�that�are�becoming�more�commonplace.�Many�of�them,�however,�are�more�appropriate�for�buildings�or�on�parcels�instead�of�in�roadways�(i.e.�green�roofs�and�rainwater�cisterns).�There�are�still�several�technologies�that�can�easily�be�implemented�in�most�right�of�ways�for�roads.�Also,�the�selection�of�BMP�ultimately�must�align�with�project�objectives,�i.e.�flow�control,�water�quality�treatment,�aesthetics,�thermal�effects,�or�air�quality�(Hinman,�2005).��A�short�list�is�provided�below�with�a�brief�description�(this�list�is�not�exhaustive).�
� Bioretention�swales�or�ponds.�These�facilities�can�also�be�known�as�“rain�gardens”�(small�scale)�or�“constructed�wetlands”�(very�large�scale);�sometimes�“bioinfiltration”�or�“bioswale”�is�also�used.�Generally,�the�purpose�of�bioretention�facilities�is�to�incorporate�a�number�of�runoff�controls�into�one�engineered�facility�by�providing�a�mix�of�vegetation,�amended�soils,�and�different�drainage�configurations�to�achieve�flow�control�and�quality�performance�(City�of�Seattle,�2009).�
� Vegetated�or�grassed�wet�and�dry�swales.�Wet�and�dry�swales�are�basically�linearized�bioretention�facilities,�commonly�“bioswales”�as�noted�above�or�“filter�strips”�(EPA,�1995b).�The�“wet”�or�“dry”�notation�indicates�the�type�of�plant�life�that�is�incorporated�(City�of�Seattle,�2009).��They�are�not�quite�the�same�as�a�roadside�ditch,�as�
102

Greenroads™ Manual v1.5 Project Requirements
PR-8 Low Impact Development
they�are�usually�composed�of�amended�soils�and�a�select�variety�of�plants�to�achieve�a�specific�level�of�infiltration.�They�can�also�be�designed�to�have�weirs�for�added�retention�on�some�steeper�grades�and�slopes.�See�EW�2�for�a�photo.�
� Permeable�pavements.�There�are�a�number�of�different�kinds�of�permeable�pavements.�These�are�discussed�in�detail�in�Credit�PT�2�Permeable�Pavement.�
� Infiltration�basins.�These�can�be�found�in�a�number�of�forms,�including�trenches,�fields,�or�depressions.�In�general�the�rule�of�thumb�is�that�the�larger�the�area,�the�more�infiltration�can�take�place.�Infiltration�based�LID�BMPs�often�suffer�from�constructability�issues�such�as�overcompaction�(City�of�Seattle,�2009).�
� Trees.�Trees�function�as�a�stormwater�control�by�increasing�infiltration�demand.�They�also�provide�transpiration�and�participate�actively�in�the�hydrologic�cycle.�They�may�also�be�an�aesthetic�amenity,�especially�in�urban�environments.�Generally,�preservation�of�treed�areas�is�a�good�practice�(City�of�Seattle,�2009).�
� Dispersion.�Some�examples�are�splash�blocks�or�gravel�trenches.�Generally,�these�are�a�means�of�distributing�the�energy�in�runoff�flow�into�a�vegetated�infiltration�area�(City�of�Seattle,�2009).��Depending�on�their�design�and�level�of�attenuation,�check�dams�and�terracing�efforts�also�fit�here�(EPA,�1995b).�
Brief�Review�of�Existing�Regulatory�Requirements�While�there�are�no�specific�mandates�for�using�LID�in�roads,�highways�and�bridges,�there�are�a�number�of�federal�regulations�and�policies�in�place�to�address�the�non�point�source�pollution�generated�by�these�entities�(mostly�water�quality�related).�These�are,�in�brief,�the�Coastal�Zone�Management�Act�of�1972,�the�Safe,�Accountable,�Flexible,�Efficient�Transportation�Equity�Act:�A�Legacy�for�Users�(SAFETEA�LU,�currently�expired�and�not�replaced�legislatively�as�of�this�writing),�and�several�sections�of�the�Clean�Water�Act.�Additionally,�both�the�Federal�Highway�Administration�(FHWA)�and�the�American�Association�of�State�Highway�and�Transportation�Officials�(AASHTO)�have�policies�in�place�for�managing�stormwater�runoff�and�provide�guidance�documents�(EPA,�1995b;�Strecker,�Mayo,�Quigley�&�Howell,�2001;�AASHTO,�2009).��The�AASHTO�guidance�document�provides�a�brief�review�of�states�with�existing�BMP�manuals�for�stormwater�runoff�and�recommends�the�LID�hydrological�evaluation�from�Prince�George’s�County�that�is�specified�in�this�Project�Requirement�(AASHTO,�2009).�
Additional�Resources�There�is�a�wide�body�of�literature�on�LID�for�stormwater�management.�A�few�select�documents�are�highlighted�here.�More�specific�techniques�for�stormwater�management�are�addressed�in�Credits�EW�2�Runoff�Flow�Control�and�EW�3�Runoff�Quality.�
� FHWA�(Shoemaker,�Lahlou,�Doll�&�Cazenas,�2002)�provides�guidance�on�ultra�urban�BMP�selection�and�monitoring�available�at:�http://www.fhwa.dot.gov/environment/ultraurb/3fs10.htm��
� AASHTO�Center�for�Environmental�Excellence’s�Environmental�Issue�Construction�and�Maintenance�Practices�Compendium,�Chapter�3,�Section�7�provides�some�design�guidance�on�LID�available�at:�http://environment.transportation.org/environmental_issues/construct_maint_prac/compendium/manual/3_7.aspx���
� Huber�et�al.�(2006)�compiled�a�comprehensive�review�of�highway�runoff�control�programs�as�part�of�the�National�Cooperative�Highway�Research�Program�(NCHRP)�Report�565:�Evaluation�of�Best�Practices�for�Highway�Runoff�Control.�This�report�is�available�in�PDF�format,�with�supplemental�appendices,�at:�http://onlinepubs.trb.org/Onlinepubs/nchrp/nchrp_rpt_565.pdf�
� The�City�of�Seattle�recently�published�a�BAS�(Best�Available�Science)�Review�as�part�of�the�updates�to�their�stormwater�code.�This�is�available�in�Word�Format�at�http://www.seattle.gov/dpd/static/BAS%20Review_FINAL_30JUN09_LatestReleased_DPDP017711.doc��
� The�Low�Impact�Development�Technical�Guidance�Manual�(Hinman,�2005)�for�Puget�Sound�is�available�and�offers�a�somewhat�more�structured�approach�to�hydrologic�analysis�than�the�Prince�George’s�County�LID�Manual,�and�includes�many�different�site�considerations,�primarily�useful�in�urban�areas�and�for�lot�development:�www.psp.wa.gov/downloads/LID/LID_manual2005.pdf��
103

Project Requirements Greenroads™ Manual v1.5
Low Impact Development PR-8
GLOSSARY
BMP� Best�management�practiceCD� Conservation�designEIA� Effective�impervious�areaEvapotranspiration�� the�combined�effects�of�evaporation�and�transpiration�in�reducing�the�
volume�of�water�in�a�vegetated�area�during�a�specific�period�of�time�(Huber�et�al.�2006)�
GI� Green�infrastructureImpervious�surface� a�hard�surface�area�that�either�prevents�or�retards�the�entry�of�water�into�the�
soil�mantle�or�causes�water�to�run�off�the�surface�in�greater�quantities�or�at�an�increased�rate�(Tilley�and�Slonecker,�2006)�
Infiltration� the�downward�movement�of�water�into�the�soil�after�surficial�entry�and�percolation�through�pore�spaces�(Huber�et�al.�2006)�
Low�impact�development� a�broad�collection�of�engineered�controls,�stormwater�management�facilities,�and�other�land�development�BMPs�that�attempt�to�mimic�pre�development�hydrologic�conditions�by�emphasizing�infiltration,�evapotranspiration,�or�stormwater�reuse�for�long�term�flow�control�and�runoff�treatment�
NDS� Natural�drainage�systemsSEA� Street�Edge�Alternatives�
REFERENCES AASHTO�Center�for�Environmental�Excellence.�(2009).�Center�for�Environmental�Excellence�by�AASHTO���
Environmental�Issue�Construction�and�Maintenance�Practices�Compendium.�Accessed�January�13,�2010.�Available�at�http://environment.transportation.org/environmental_issues/construct_maint_prac/compendium/manual/�
City�of�Kirkland,�Washington.�(2010).�Surface�Water�Low�Impact�Development.��Available�at�http://www.ci.kirkland.wa.us/depart/Public_Works/Storm___Surface_Water/Surface_Water_Low_Impact_Development.htm�
City�of�Seattle,�Seattle�Public�Utilities,�Department�of�Planning�and�Development.�(2009,�June�30).�Environmentally�Critical�Areas:�Best�Available�Science�Review.�Accessed�November�14,�2009.�Available�at�http://www.seattle.gov/dpd/static/BAS%20Review_FINAL_30JUN09_LatestReleased_DPDP017711.doc��
Environmental�Protection��Agency.�(1995,�November).�Erosion,�Sediment�and�Runoff�Control�for�Roads�and�Highways.�(EPA�841�F�95�008d).�Office�of�Water.�Washington,�DC:�Environmental�Protection�Agency.�Available�at�http://www.epa.gov/owow/nps/education/runoff.html��
Environmental�Protection��Agency.�(1995,�November).�Pollution�Control�Programs�for�Roads,�Highways�and�Bridges.�(EPA�841�F�95�008c).�Office�of�Water.�Washington,�DC:�Environmental�Protection�Agency.�Available�at�http://www.epa.gov/owow/nps/education/control.html��
Environmental�Protection��Agency.�(2000,�October).�Low�Impact�Development�(LID):�A�Literature�Review.�(EPA�841�B�00�005).�Office�of�Water.�Washington,�DC:�Environmental�Protection�Agency.��
Environmental�Protection��Agency.�(2008,�March�7).�NPS�Categories�|�Roads,�Highways�and�Bridges�|�Polluted�Runoff�(Nonpoint�Source�Pollution)�|�US�EPA.�Accessed�January�13,�2010.�Available�at�http://www.epa.gov/owow/nps/roadshwys.html��
104

Greenroads™ Manual v1.5 Project Requirements
PR-8 Low Impact Development
Environmental�Protection��Agency.�(2009,�April�1).�Managing�Wet�Weather�with�Green�Infrastructure�|�NPDES�|�US�EPA.�Accessed�January�13,�2010.�Available�at�http://cfpub.epa.gov/npdes/home.cfm?program_id=298��
Hinman,�C.�(2005).�Low�impact�development:�Technical�guidance�manual�for�Puget�Sound.�Olympia,�WA:�Puget�Sound�Action�Team.�Available�at�http://www.psparchives.com/publications/our_work/stormwater/lid/LID_manual2005.pdf��
Huber�et�al.�(2006).�NCHRP�Synthesis�565:�Evaluation�of�best�management�practices�for�highway�runoff�control.�National�Cooperative�Highway�Research�Program�(NCHRP).�Washington,�D.C.:�Transportation�Research�Board.�Available�at�http://onlinepubs.trb.org/Onlinepubs/nchrp/nchrp_rpt_565.pdf�
King�County.�(2010).�2009�King�County�Storm�Water�Design�Manual�(SWDM).�Available�at�http://www.kingcounty.gov/environment/waterandland/stormwater/documents/surface�water�design�manual.aspx�
Prince�George’s�County,�Maryland,�Department�of�Environmental�Resources.�(1999,�July).�Low�Impact�Development�Hydrologic�Analysis.�Available�at�http://www.epa.gov/owow/nps/lid/lid_hydr.pdf��
Prince�George’s�County,�Maryland,�Department�of�Environmental�Resources.�(1999,�June).�Low�Impact�Development�Design�Strategies:�An�Integrated�Approach.�Available�at�http://www.epa.gov/owow/nps/lidnatl.pdf�
Schueler,�T.R.�1987.�Controlling�Urban�Runoff:�A�Practical�Manual�for�Planning�and�Designing�Urban�Best�Management�Practices.�Metropolitan�Washington�Council�of�Governments,�Washington�D.C.�
Seattle�Public�Utilities.�(2009).�Seattle�Public�Utilities�–�Natural�Drainage�Projects.�Accessed�January�13,�2010.�Available�at�http://www.seattle.gov/util/About_SPU/Drainage_&_Sewer_System/GreenStormwaterInfrastructure/�
Shoemaker,�L.,�Lahlou,�M.,�Doll,�A.�&�Cazenas,�P.�US�Department�of�Transportation.�Federal�Highway�Administration.�(2002).�Stormwater�Best�Management�Practices�in�an�Ultra�Urban�Setting:�Selection�and�Monitoring.�Accessed�November�30,�2009.�Available�at�http://www.fhwa.dot.gov/environment/ultraurb/3fs10.htm�
Strecker,�E.,�Mayo,�L.,�Quigley,�M.�&�Howell,�J.�(2001,�June).�Guidance�Manual�for�Monitoring�Water�Quality.�(FHWA�EP�01�022).�United�States�Department�of�Transportation,�Federal�Highway�Administration.�Office�of�Natural�Environment.�Washington,�DC:�United�States�Department�of�Transportation.�
Tilley,�J.�S.�&�Slonecker,�E.�T.�(2006).�Quantifying�the�components�of�impervious�surfaces.�Reston,�Va:�U.S.�Geological�Survey.�
� �
105

Project Requirements Greenroads™ Manual v1.5
Low Impact Development PR-8
�
106

Greenroads™ Manual v1.5 Project Requirements
PR-9 Pavement Management System
PAVEMENT MANAGEMENT SYSTEM GOAL Make�roadway�capital�assets�last�longer�and�perform�better�by�preserving�and�maintaining�them.�
REQUIREMENTS Have�asset�management�systems�in�effect�that�include�the�pavement�and�critical�structural�features�on�a�project,�such�as�bridges.�Asset�management�system(s)�must�serve�the�roadway�project�and�include,�at�minimum,�these�activities:�
1. Measure�conditions�of�pavement�structure�and�bridge�structures�at�least�once�every�two�years.�
2. Possess�documented�decision�criteria�for�timing�preservation�actions.�3. Record�when�preservation�efforts�occur.��4. Store�information�from�#1�3�in�a�retrievable�format.�5. Display�information�from�#1�3�to�the�roadway�user.�
Generally,�this�means�the�owner�agency�of�the�roadway�should�have�pavement�management�systems�(PMS)�and�bridge�management�systems�(BMS)�in�place�for�the�extent�of�their�roadway�network.�Projects�with�both�pavements�and�major�structures�must�demonstrate�that�both�types�of�asset�management�systems�are�in�place�and�operational�for�all�such�features.�
Details
An�“asset�management�system”�is�a�formal�systematic�process�of�maintaining,�upgrading�and�operating�a�particular�structure�or�network�of�structures.�Asset�management�systems�typically�involve�the�use�of�one�or�more�decision�support�tools�(often�computer�based)�to�organize�the�five�activities�detailed�above.�For�purposes�of�this�credit,�we�refer�primarily�to�pavement�management�systems�(PMS)�and�bridge�management�systems�(BMS).�“Preservation”�refers�to�a�set�of�maintenance�and�rehabilitation�practices�used�to�improve�roadway�condition�and�extend�roadway�life�and�also�applies�to�both�pavements�and�bridges.�
Theoretically,�any�“asset”�on�a�roadway�project�can�be�managed�using�the�principles�outlined�here.�While�there�are�also�separate�asset�management�systems�and�tools�for�site�infrastructure,�traffic�controls,�standalone�retaining�walls�and�vegetation,�for�purposes�of�this�Project�Requirement�such�management�systems�are�not�required.�Projects�that�have�such�systems�in�place�should�determine�if�the�systems�meet�the�five�criteria�above�and�apply�for�a�Greenroads�Custom�Credit.�
DOCUMENTATION � A�signed�letter�from�an�owner’s�representative�stating�the�following:�
1. A�PMS�and�BMS�(where�appropriate)�is�either�in�place�or�will�be�put�in�place�for�the�project�pavement�and/or�bridges.�
2. The�agency�will�manage�the�project�pavement(s)�and/or�bridge(s).�3. The�proposed�means�of�accomplishing�the�five�activities�(e.g.�the�names�of�the�
consultant�or�software�system�in�use).�
PR-9
REQUIRED
RELATED CREDITS
� PR�2�Lifecycle�Cost�Analysis�
� PR�10�Site�Maintenance�Plan�
� MR�2�Pavement�Reuse�
� PT�1�Long�Life�Pavement�
� PT�6�Pavement�Performance�Tracking�
SUSTAINABILITY COMPONENTS
� Extent�� Expectations�� Experience�
BENEFITS
� Increases�Service�Life� Improves�Human�
Health�&�Safety�� Reduces�Lifecycle�
Costs�� Improves�
Accountability�� Increases�Aesthetics�
107
Project Requirements Greenroads™ Manual v1.5
Pavement Management System PR-9
APPROACHES & STRATEGIES
� Ensure�that�the�project�roadway�is�part�of�a�new�or�existing�management�system.�It�is�likely�that�there�is�already�a�system�in�use�by�the�roadway�owner,�which�means�that�provisions�for�the�project�pavement�to�be�included�need�to�be�made.�
� For�pavements,�adopt�a�pavement�management�system�that�incorporates�the�project�pavement.�This�is�generally�not�practical�unless�the�pavement�management�system�incorporates�other�pavements�also�managed�by�the�owner.�
Example: Pavement Management Systems
All�50�states�have�some�form�of�pavement�management�program�in�place�(Finn,�1998).�Many�local�pavement�owner�agencies�also�have�pavement�management�systems�that�vary�in�complexity.�While�there�is�no�requirement�that�they�be�computer�based,�most�current�systems�are.�A�few�examples�follow.�
� Dynatest�Pavement�Management�System.�An�example�of�a�commercially�available�product�(there�are�many),�this�system�is�integrated�with�the�condition�assessment�equipment�that�Dynatest�also�manufactures.�
� StreetSaver.�A�new�online�program�developed�by�the�Bay�Area�Metropolitan�Transportation�Commission�(MTC)�for�use�by�local�governments.�It�is�used�by�a�number�of�owner�agencies,�many�of�which�are�in�California�and�Oregon.�The�interface�is�web�based�and�has�been�integrated�with�ArcGIS�by�Farallon�Geographics,�Inc.�An�example�is�Chula�Vista,�CA:�http://www.chulavistaca.gov/city_Services/Development_Services/engineering/pavementmgmtsystem.asp�
� MicroPAVER.�A�desktop�pavement�management�system�from�the�U.S.�Army�Corps�of�Engineers.�It�is�available�for�free�and�is�widely�used�by�the�U.S.�military�and�other�agency�owners.�Information�at:�http://owww.cecer.army.mil/paver/Paver.htm.�
Example: Case Study – Washington State Pavement Management System (WSPMS)
The�Washington�State�Department�of�Transportation�(WSDOT)�pavement�management�system�(WSPMS)�is�an�example�of�an�internally�built�system�and�is�one�of�the�oldest�systems�in�the�U.S.�WSDOT�began�collecting�data�in�1963�(Muench�et�al.,�2004)�and�developed�a�management�system�in�1982�(FHWA,�2008).�More�details�are�given�in�the�case�study�example�below.�A�description�of�the�system�can�be�found�at:�
http://www.wsdot.wa.gov/Research/Reports/300/315.2.htm.��
A�recent�Federal�Highway�Administration�(FHWA)�case�study�(2008)�highlighted�the�Washington�State�Pavement�Management�System�(WSPMS)�and�its�contribution�to�overall�condition�and�life�cycle�costs�of�pavements�managed�by�the�Washington�State�Department�of�Transportation�(WSDOT).�While�the�case�study�does�not�separate�the�level�of�funding�from�the�use�of�WSPMS,�it�makes�a�case�that�WSPMS�has�contributed�to�a�marked�shift�towards�pavements�in�good�condition�since�1971�(Figure�PR�9.1).�
108

Greenroads™ Manual v1.5 Project Requirements
PR-9 Pavement Management System
WSDOT�uses�WSPMS�to�not�only�track�pavement�condition�but�also�to�choose�when�and�by�what�means�the�pavement�should�be�preserved�and/or�rehabilitated.�WSPMS�has�simple�built�in�models�that�predict�future�pavement�condition�based�on�current�and�past�condition.�This�way,�WSDOT�is�able�to�predict�with�reasonable�accuracy�when�preservation/rehabilitation�need�to�occur.�In�1993�WSDOT�received�legislative�mandate�that�their�project�selection�criteria�should�be�based�on�lowest�life�cycle�cost,�which�further�reinforced�their�pavement�management�approach.�Overall,�Figure�PT�9.2�shows�the�condition�of�WSDOT�pavements�from�1969�2005�and�gives�clear�evidence�that�pavement�condition�has�improved�markedly�over�this�36�year�stretch.�
�Figure�PR�9.1:��Trends�in�poor�and�good�pavement�condition�of�Washington�State�highways,�1971–2005,�following�adoption�of�a�pavement�condition�survey�in�1969�and�a�pavement�
management�system�in�1982�(FHWA,�2008).�
�Figure�PR�9.2:�Trends�in�Washington�State�pavement�structural�condition,�1969–2006�(FHWA,�2008).��
Data�source:�Washington�State�Department�of�Transportation�Materials�Laboratory.�
109

Project Requirements Greenroads™ Manual v1.5
Pavement Management System PR-9
Example: Michigan DOT Bridge Management System
Michigan�DOT�(MDOT)�has�developed�a�Bridge�Management�System�(BMS),�one�of�six�components�of�their�Transportation�Management�System.�The�BMS�is�the�decision�support�tool�responsible�for�managing�the�inspection,�analysis�and�maintenance�of�the�numerous�components�that�make�up�a�bridge.�MDOT�utilizes�software�American�Association�of�State�Highway�and�Transportation�Officials�(AASHTO)�has�developed�called�“Pontis”�to�aid�their�BMS.�A�description�of�the�system�can�be�found�at:�http://michigan.gov/documents/bridge_16549_7.pdf�
Example: Virtis and Opis – Bridge Management System Tools
AASHTO’s�BRIDGEWare,�a�software�design�system,�developed�comprehensive�bridge�rating�and�design�tools�called�Virtis�and�Opis.�“The�Opis�bridge�design�package�and�the�Virtis�bridge�load–rating�package�share�a�detailed�database�of�structure�descriptions�that�is�integrated�with�the�database�of�the�Pontis�bridge�management�data”�(Thompson,�2004).�More�information�is�available�at:�http://aashto.bakerprojects.com/virtis/VirtisOpisBrochure0303.pdf�
POTENTIAL ISSUES
This�Project�Requirement�asks�for�asset�management�systems�but�does�not�verify�execution�of�that�management�system.�Therefore,�the�possibility�exists�that�a�management�system�could�be�presented�and�then�not�executed.�
RESEARCH Pavement�Management�Systems�The�American�Association�of�State�Highway�and�Transportation�Officials�(AASHTO)�defines�pavement�management�as�“…the�effective�and�efficient�directing�of�the�various�activities�involved�in�providing�and�sustaining�pavements�in�a�condition�acceptable�to�the�traveling�public�at�the�least�life�cycle�cost”�(AASHTO,�1985).�Pavement�management�consists�of�3�major�components�(Pavement�Management,�2007):��
1. Pavement�life�cycle.�This�includes�how�pavements�are�built,�how�their�condition�changes�over�time,�and�how�this�process�can�be�affected�by�different�forms�of�maintenance,�rehabilitation�and�reconstruction.��
2. Costs�associated�with�the�pavement�life�cycle.�This�includes�the�costs�of�initial�construction,�maintenance�and�rehabilitation,�assessing�end�of�life�pavement�salvage�value,�and�determining�user�costs�incurred�throughout�the�life�cycle.��
3. Pavement�management�systems.�This�includes�all�the�different�systems�used�to�determine�the�most�appropriate�time�to�rehabilitate�pavement,�what�the�most�cost�effective�method�is,�and�how�many�dollars�it�will�take�to�maintain�a�roadway�system�at�a�desirable�condition�level�(WSDOT,�1994).�
The�fundamental�idea�is�that�pavement�management�will�lead�to�lower�overall�life�cycle�costs�for�a�pavement�or�network�of�pavements�and�thus�be�a�more�sustainable�approach.�This�idea�has�been�theoretically�shown�many�times�(e.g.,�Scrivner�et�al.,�1968;�Hudson�et�al.,�1979;�MAPC,�1986;�Kay�et�al.,�1993;�Pierce�et�al.,�2001)�but�has�not�been�shown�by�direct�comparison�of�a�managed�system�and�one�that�is�not.�A�corollary,�that�some�believe�is�true�but�has�yet�to�be�shown�by�empirical�evidence,�is�that�pavement�management�will�also�lead�to�lower�use�of�natural�resources,�less�energy�input�and�fewer�emissions�associated�with�a�pavement�network.�
A�basic�asset�management�system�should�include�the�following�5�components�(Peterson,�1987):�
1. Roadway�condition�surveys.�A�survey�of�the�roadway�structure�to�assess�current�condition�and�strength��2. Database�containing�all�related�roadway�structure�information.�Information�about�other�aspects�of�each�
roadway�section�including�things�like�location,�pavement�thickness,�ownership,�date�last�constructed,�etc.��3. Analysis�scheme.�Algorithms�used�to�interpret�roadway�condition�and�other�data�in�a�meaningful�way�and�
produce�information�such�as�cost�and�deterioration�models�that�assist�in�programming�roadway�preservation/rehabilitation/maintenance�efforts.�Recent�software�can�combine�the�database,�analysis�scheme�
110
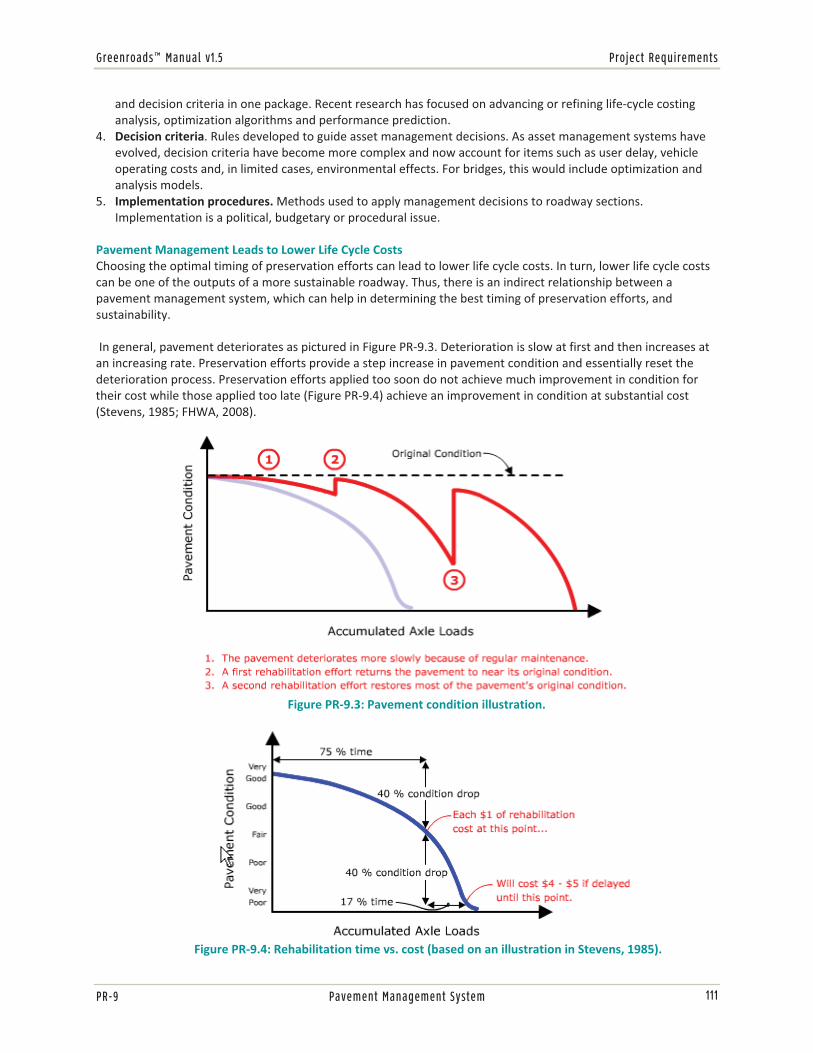
Greenroads™ Manual v1.5 Project Requirements
PR-9 Pavement Management System
and�decision�criteria�in�one�package.�Recent�research�has�focused�on�advancing�or�refining�life�cycle�costing�analysis,�optimization�algorithms�and�performance�prediction.��
4. Decision�criteria.�Rules�developed�to�guide�asset�management�decisions.�As�asset�management�systems�have�evolved,�decision�criteria�have�become�more�complex�and�now�account�for�items�such�as�user�delay,�vehicle�operating�costs�and,�in�limited�cases,�environmental�effects.�For�bridges,�this�would�include�optimization�and�analysis�models.�
5. Implementation�procedures.�Methods�used�to�apply�management�decisions�to�roadway�sections.�Implementation�is�a�political,�budgetary�or�procedural�issue.�
Pavement�Management�Leads�to�Lower�Life�Cycle�Costs�Choosing�the�optimal�timing�of�preservation�efforts�can�lead�to�lower�life�cycle�costs.�In�turn,�lower�life�cycle�costs�can�be�one�of�the�outputs�of�a�more�sustainable�roadway.�Thus,�there�is�an�indirect�relationship�between�a�pavement�management�system,�which�can�help�in�determining�the�best�timing�of�preservation�efforts,�and�sustainability.�
�In�general,�pavement�deteriorates�as�pictured�in�Figure�PR�9.3.�Deterioration�is�slow�at�first�and�then�increases�at�an�increasing�rate.�Preservation�efforts�provide�a�step�increase�in�pavement�condition�and�essentially�reset�the�deterioration�process.�Preservation�efforts�applied�too�soon�do�not�achieve�much�improvement�in�condition�for�their�cost�while�those�applied�too�late�(Figure�PR�9.4)�achieve�an�improvement�in�condition�at�substantial�cost�(Stevens,�1985;�FHWA,�2008).�
�Figure�PR�9.3:�Pavement�condition�illustration.�
�Figure�PR�9.4:�Rehabilitation�time�vs.�cost�(based�on�an�illustration�in�Stevens,�1985).�
111

Project Requirements Greenroads™ Manual v1.5
Pavement Management System PR-9
Bridge�Management�Systems�The�Federal�Highway�Administration�recognizes�the�importance�of�maintenance�and�preservation�of�bridge�sturctures�too.�For�roadways,�bridges�are�considered�critical�points�or�“nodes”�along�an�otherwise�continuous�network�of�pavements.�However,�similar�to�pavement�management�systems,�agencies�usually�develop�a�BMS�that�is�tailored�to�their�organizational,�financial,�managerial,�political,�and�technical�modes�of�operation.�
Currently,�all�state�DOTs�have�a�bridge�management�system�(Özbay�et�al.,�2004).�Each�BMS�may�vary�due�to�(Markow�&�Hyman,�2009):�
1. Different�philosophies�of�bridge�management;��2. Different�approaches�to�planning,�programming,�and�budgeting;�3. the�characteristics�of�each�agency’s�transportation�system�and�its�infrastructures;�and�4. The�policy,�financial,�technical,�and�institutional�environment�in�which�each�agency�operates.�
A�study�by�the�Transportation�Research�Board�(TRB)�in�1994,�found�that�only�6�of�33�states�responding�to�a�survey�said�they�were�satisfied�with�the�cost�data�they�had�available�to�provide�to�their�bridge�management�systems�(Thompson,�2004).�This�may�suggest�that�agencies�consider�the�accuracy�and�availability�of�cost�and�management�data�and�other�information�required�to�develop�a�comprehensive�asset�management�system�to�be�inadequate.��
In�1994,�a�20�page�questionnaire�was�distributed�to�52�departments�of�transportation�(DOT)�in�the�50�states,�the�District�of�Columbia,�and�Puerto�Rico�(Thompson�&�Markow,�1996).�A�total�of�33�state�DOTs�provided�usable�responses.��
� 76%�(25�of�33)�of�the�agencies�use�Pontis�as�part�of�their�bridge�management�system;��� 12%�(4�of�33)�are�developing�their�own�system;�and��� 10%�(3�of�33)�are�undecided.�
The�percentage�of�those�using�Pontis�is�decreasing�as�new�technologies�emerge�and�become�more�accurate�and�reliable.�More�recent�studies�show�that�an�increasing�number�of�agencies�are�resorting�to�developing�their�own�system�in�conjunction�with�current�design�software.�
In�2009,�Markow�and�Hyman�prepared�a�detailed�synthesis�report�on�BMS�for�the�National�Cooperative�Highway�Research�Program�(NCHRP),�Report�397.�Currently,�this�is�the�most�up�to�date�and�comprehensive�information�on�the�state�of�the�practice�of�bridge�management�systems�and�the�need,�utility,�level�of�implementation�and�cost�implications�at�various�state�agencies.�It�also�includes�a�survey�of�DOTs�for�prevalence�of�use�of�BMS,�but�there�were�similar�results�to�the�1994�study�mentioned�above�and�fewer�respondents�to�the�survey.�
Bridge�Management�Software�During�the�early�1990s,�FHWA�and�Cambridge�Systematics�and�Optima,�Inc.�developed�a�bridge�management�system�called�Pontis.�Cambridge�Systematics�and�Optima,�Inc.�(2010)�describe�Pontis�as�a�decision�support�software�tool�that�includes�a�structural�inventory�for�use�in�preservation�and�maintenance�activities.�Pontis�provides�a�way�for�bridge�managers�to�document�inspections�by�structural�element�and�develop�cost�effective�plans�for�maintenance�activities�in�an�existing�bridge�network.�Newer�software�suites�like�AASHTO’s�BridgeWARE�line�of�products�incorporate�additional�tools�like�Virtis�and�Opis�which�can�assist�in�load�rating�and�design�that�utilize�the�Pontis�database�(Transportation�Research�Board,�Committee�on�Bridge�Management�Systems,�2003;�Thompson,�2004).�
Bridge�Management�Systems�and�Lifecycle�Cost�Analysis�Bridge�management�systems�and�lifecycle�cost�analysis�(see�PR�2�Lifecycle�Cost�Analysis)�are�complementary�tools�for�long�term�decision�making�in�bridge�maintenance,�preservation�and�operation.�Much�of�the�current�literature�overlaps�at�optimization�models�for�integrating�lifecycle�costing�into�network�level�BMS�as�well�as�at�the�project�level�(Morcous,�2007;�Frangopol�&�Liu,�2007;�Estes�&�Frangopol,�2001;�Frangopol,�2004;�Hegazy,�Elbeltagi,�&�El�Behairy,�2004;�Okasha�&�Frangopol,�2009)�as�well�as�for�preservation�and�maintenance�decisions�
112

Greenroads™ Manual v1.5 Project Requirements
PR-9 Pavement Management System
(List,�2007;�Strauss�et�al.�2007;�Naus�&�Johnston,�2001).�More�recent�research�has�been�in�the�area�of�reliability�and�risk�analysis�for�lifetime�weathering�and�other�hazards,�(Lee,�Cho,�&�Cha,�2006;��Hosser�et�al.�2008;�Padgett,�Dennemann,�&�Ghosh,�2010).�For�a�comprehensive�review�of�bridge�life�cycle�cost�analysis�(BLCCA)�and�its�potential�applications�at�project�and�network�level�BMS,�the�reader�is�referred�to�NCHRP�Report�483�(Hawk,�2003),�which�provides�the�most�comprehensive�information�on�integrative�lifecycle�thinking�for�bridges.�
Other�Types�of�Asset�Management�Systems�Ancillary�structures.�Currently,�the�Federal�Highway�Administration�is�investigating�development�of�decision�support�tools�for�data�management�and�preservation�efforts�for�ancillary�structures�such�as�luminares,�sign�trusses,�and�other�non�bridge�and�non�pavement�features.�The�current�program�effort�is�led�by�the�Office�of�Bridge�Technology,�which�provides�a�free�helpful�guidance�manual�for�these�features�called�Guidelines�for�the�Installation,�Inspection,�Maintenance�and�Repair�of�Structural�Supports�for�Highway�Signs,�Luminaires,�and�Traffic�Signals�(FHWA,�2005).�
Tunnels�and�retaining�wall�structures.�Tunnel�and�wall�structures�are�a�very�small�percentage�of�structural�roadway�features.�Much�of�the�research�on�tunnel�maintenance�and�preservation�is�managed�under�the�purview�of�the�Federal�Highway�Administration’s�Office�of�Bridge�Technology�and�integrates�with�highway�and�rail�transit�in�their�web�based�guidance�document�from�the�2005�Highway�&�Rail�Transit�Tunnel�Maintenance�&�Rehabilitation�Manual�(FHWA,�2007).�
Vegetation.�Additionally,�there�is�a�wealth�of�information�available�on�vegetation�management�practices�such�as�street�trees,�native�vegetation,�pesticide�and�herbicide�use,�and�maintenance�of�other�landscaping�features,�especially�with�regard�to�management�of�above�and�below�ground�utilities.�However,�a�consensus�does�not�appear�to�exist�on�computerized�tools�for�systematic�implementation�of�such�vegetation�management�strategies�and�practices.�AASHTO’s�Center�on�Environmental�Excellence�provides�some�guidance�on�management�of�these�types�of�living�assets�on�roadsides�at�this�link�under�“Integrated�Roadside�Vegetation�Management:”�http://environment.transportation.org/environmental_issues/invasive_species�(AASHTO,�2011).�
GLOSSARY
REFERENCES American�Association�of�State�Highway�and�Transportation�Officials�(AASHTO).�(1985).�Guidelines�on�Pavement�
Management,�AASHTO�Joint�Task�Force�on�Pavements,�AASHTO,�Washington,�D.C.,�1985.�
American�Association�of�State�Highway�and�Transportation�Officials�(AASHTO).�(2011).�Center�for�Environmental�Excellence�by�AASHTO:�Invasive�Species/Vegetation�Management.�Available�at:�http://environment.transportation.org/environmental_issues/invasive_species/�Accessed�January�31,�2011.�
Cambridge�Systematics,�Inc.�(2010).�Pontis�Bridge�Management�System�Version�4.4.��Available�at�http://www.camsys.com/pro_inframan_pontis.htm.�Accessed�May�26,�2010.�
Estes,�A.�C.,�and�Frangopol,�D.�M.�2001.�“Minimum�expected�costoriented�optimal�maintenance�planning�for�deteriorating�structures:�Application�to�concrete�bridge�decks.”�Reliab.�Eng.�Syst.�Saf.,�73,�281–291.�
Federal�Highway�Administration.�(2008).�Pavement�Management�Systems:�The�Washington�State�Experience.�Transportation�Asset�Management�Case�Studies.�FHWA,�U.S.�DOT.�Available�at�http://www.fhwa.dot.gov/asset/if08010/index.cfm.�
Asset�management�system a�formal�systematic�process�of�maintaining,�upgrading�and�operating�a�particular�asset�or�network�of�assets,�such�as�pavements�and�bridges�
Preservation� a�set�of�maintenance�and�rehabilitation�practices�used�to�improve�condition�and�extend�life�of�a�structure(s)�
113
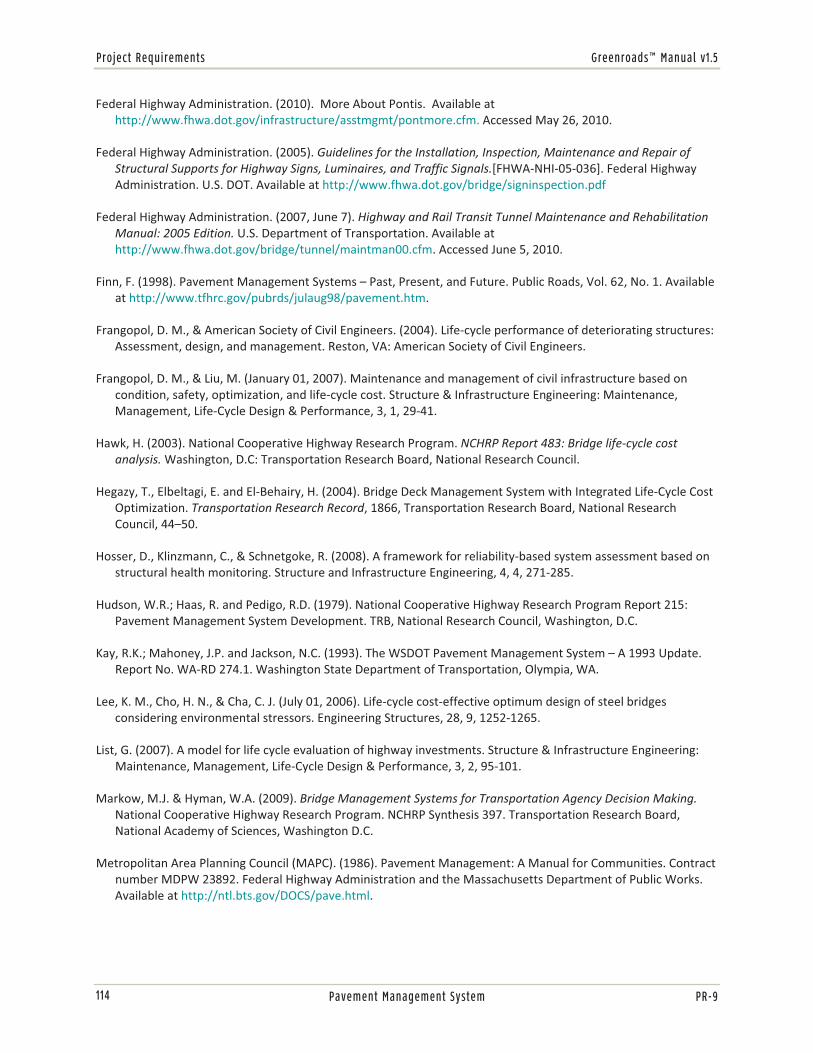
Project Requirements Greenroads™ Manual v1.5
Pavement Management System PR-9
Federal�Highway�Administration.�(2010).��More�About�Pontis.��Available�at�http://www.fhwa.dot.gov/infrastructure/asstmgmt/pontmore.cfm.�Accessed�May�26,�2010.�
Federal�Highway�Administration.�(2005).�Guidelines�for�the�Installation,�Inspection,�Maintenance�and�Repair�of�Structural�Supports�for�Highway�Signs,�Luminaires,�and�Traffic�Signals.[FHWA�NHI�05�036].�Federal�Highway�Administration.�U.S.�DOT.�Available�at�http://www.fhwa.dot.gov/bridge/signinspection.pdf��
Federal�Highway�Administration.�(2007,�June�7).�Highway�and�Rail�Transit�Tunnel�Maintenance�and�Rehabilitation�Manual:�2005�Edition.�U.S.�Department�of�Transportation.�Available�at�http://www.fhwa.dot.gov/bridge/tunnel/maintman00.cfm.�Accessed�June�5,�2010.�
Finn,�F.�(1998).�Pavement�Management�Systems�–�Past,�Present,�and�Future.�Public�Roads,�Vol.�62,�No.�1.�Available�at�http://www.tfhrc.gov/pubrds/julaug98/pavement.htm.��
Frangopol,�D.�M.,�&�American�Society�of�Civil�Engineers.�(2004).�Life�cycle�performance�of�deteriorating�structures:�Assessment,�design,�and�management.�Reston,�VA:�American�Society�of�Civil�Engineers.�
Frangopol,�D.�M.,�&�Liu,�M.�(January�01,�2007).�Maintenance�and�management�of�civil�infrastructure�based�on�condition,�safety,�optimization,�and�life�cycle�cost.�Structure�&�Infrastructure�Engineering:�Maintenance,�Management,�Life�Cycle�Design�&�Performance,�3,�1,�29�41.�
Hawk,�H.�(2003).�National�Cooperative�Highway�Research�Program.�NCHRP�Report�483:�Bridge�life�cycle�cost�analysis.�Washington,�D.C:�Transportation�Research�Board,�National�Research�Council.�
Hegazy,�T.,�Elbeltagi,�E.�and�El�Behairy,�H.�(2004).�Bridge�Deck�Management�System�with�Integrated�Life�Cycle�Cost�Optimization.�Transportation�Research�Record,�1866,�Transportation�Research�Board,�National�Research�Council,�44–50.�
Hosser,�D.,�Klinzmann,�C.,�&�Schnetgoke,�R.�(2008).�A�framework�for�reliability�based�system�assessment�based�on�structural�health�monitoring.�Structure�and�Infrastructure�Engineering,�4,�4,�271�285.�
Hudson,�W.R.;�Haas,�R.�and�Pedigo,�R.D.�(1979).�National�Cooperative�Highway�Research�Program�Report�215:�Pavement�Management�System�Development.�TRB,�National�Research�Council,�Washington,�D.C.�
Kay,�R.K.;�Mahoney,�J.P.�and�Jackson,�N.C.�(1993).�The�WSDOT�Pavement�Management�System�–�A�1993�Update.�Report�No.�WA�RD�274.1.�Washington�State�Department�of�Transportation,�Olympia,�WA.�
Lee,�K.�M.,�Cho,�H.�N.,�&�Cha,�C.�J.�(July�01,�2006).�Life�cycle�cost�effective�optimum�design�of�steel�bridges�considering�environmental�stressors.�Engineering�Structures,�28,�9,�1252�1265.�
List,�G.�(2007).�A�model�for�life�cycle�evaluation�of�highway�investments.�Structure�&�Infrastructure�Engineering:�Maintenance,�Management,�Life�Cycle�Design�&�Performance,�3,�2,�95�101.�
Markow,�M.J.�&�Hyman,�W.A.�(2009).�Bridge�Management�Systems�for�Transportation�Agency�Decision�Making.�National�Cooperative�Highway�Research�Program.�NCHRP�Synthesis�397.�Transportation�Research�Board,�National�Academy�of�Sciences,�Washington�D.C.�
Metropolitan�Area�Planning�Council�(MAPC).�(1986).�Pavement�Management:�A�Manual�for�Communities.�Contract�number�MDPW�23892.�Federal�Highway�Administration�and�the�Massachusetts�Department�of�Public�Works.�Available�at�http://ntl.bts.gov/DOCS/pave.html.�
114

Greenroads™ Manual v1.5 Project Requirements
PR-9 Pavement Management System
Morcous,�G.�(2007)�Pareto�Analysis�for�Multicriteria�Optimization�of�Bridge�Preservation�Decisions�Transportation�Research�Record:�Journal�of�the�Transportation�Research�Board,�1991,�Transportation�Research�Board�of�the�National�Academies,�Washington,�D.C.,�62–68�
Naus,�D.J.�and�Johnston,�M.W.�(2001,�October).�International�RILEM�Workshop�on�Life�Prediction�and�Aging�Management�of�Concrete�Structures.�Proceedings�of�the�International�RILEM�Workshop�Technical�Committees,�Cannes,�France,�16�17,�October�2000.�Materials�and�Structures,�RILEM,�34,�458�466.�
Okasha,�N.�M.,�&�Frangopol,�D.�M.�(January�01,�2009).�Lifetime�oriented�multi�objective�optimization�of�structural�maintenance�considering�system�reliability,�redundancy�and�life�cycle�cost�using�GA.�Structural�Safety,�31,�6,�460.�
Ozbay,�K.�(2004).�Life�cycle�cost�analysis:�State�of�the�practice�versus�state�of�the�art.�Transportation�Research�Record,�1864,�62�70.�
Padgett,�J.�E.,�Dennemann,�K.,�&�Ghosh,�J.�(2010).�Risk�based�seismic�life�cycle�costbenefit�(LCC�B)�analysis�for�bridge�retrofit�assessment.�Structural�Safety,�32,�3,�165.�
Pavement�Management.�(2007,�August�16).�Pavement�Interactive.�Available�at�http://pavementinteractive.org/index.php?title=Pavement_Management&oldid=11444.�
Peterson,�D.E.�(1987).�National�Cooperative�Highway�Research�Program�Synthesis�of�Highway�Practice�135:�Pavement�Management�Practices.�NCHRP,�TRB,�National�Research�Council.�Washington,�D.C.�
Pierce,�L.M.,�Mahoney,�J.P.,�&�Sivaneswaran,�N.�(2001).�An�Assessment�of�the�Benefits�of�the�Washington�State�Pavement�Management�System.�Paper�presented�at�the�Fifth�International�Conference�on�Managing�Pavements,�Seattle,�Washington,�August�11–14,�2001.�
Scrivner,�F.H.;�McFarland,�W.F.�and�Carey,�G.R.�(1968).�A�Systems�Approach�to�the�Flexible�Pavement�Design�Problem.�Research�Report�132�11.�Texas�Transportation�Institute,�Texas�A&M�University.�
Stevens,�L.B.�(1985).�Road�Surface�Management�for�Local�Governments���Resource�Notebook.�Publication�No.�DOT�I�85�37.�Federal�Highway�Administration.�Washington,�D.C.�
Strauss,�A.,�Bergmeister,�K.,�Hoffmann,�S.,�Pukl,�R.,�&�Novak,�D.�(January�01,�2008).�Advanced�Life�Cycle�Analysis�of�Existing�Concrete�Bridges.�Journal�of�Materials�in�Civil�Engineering,�20,�1,�9.�
Thompson,�P.D.�&�Markow,�M.J.�(1996).�Collecting�and�Managing�Cost�Data�for�Bridge�Management�Systems.�National�Cooperative�Highway�Research�Program,�National�Research�Council�(U.S.).�Transportation�Research�Board,�American�Association�of�State�Highway�and�Transportation�Officials.��
Thompson,�P.D.�(2004).�Bridge�Life�Cycle�Costing�in�Integrated�Environment�of�Design,�Rating,�and�Management.�Transportation�Research�Record:�Journal�of�the�Transportation�Research�Board,�No.�1866,�51–58.�
Transportation�Research�Board,�Committee�on�Bridge�Management�Systems.�(2003).�Integration�of�AASHTO’S�BridgeWARE�Products.�Transportation�Research�Circular�Number�E�C049.�9th�International�Bridge�Management�Conference,�Orlando�Airport�Marriott�Orlando,�Florida�April�28–30,�2003.�Available�at�http://onlinepubs.trb.org/onlinepubs/circulars/ec049.pdf.�
� �
115

Project Requirements Greenroads™ Manual v1.5
Pavement Management System PR-9
�
116

Greenroads™ Manual v1.5 Project Requirements
PR-10 Site Maintenance Plan
SITE MAINTENANCE PLAN GOAL Maintain�environmental�quality�and�aesthetics�of�the�roadway�project�during�use.�
REQUIREMENTS Have�and�implement�a�comprehensive�ongoing�site�maintenance�plan�that�addresses�(at�a�minimum)�responsible�parties/organizations,�standards,�schedule,�methods�to�be�used�and�funding�source(s)�for�the�following�items�(listed�by�major�topics):�
� Roadway�maintenance�� Pavement�patching,�repair�and�crack�sealing�� Shoulder/sidewalk�maintenance�and�repair�
� Stormwater�system�cleaning�and�repair�� Roadside�vegetation�
� Landscaping�� Control�of�noxious�weeds�and�nuisance�plants�
� Snow�and�ice�control��� Traffic�control�infrastructure�
� Pavement�marking�maintenance�and�repair�� Sign�maintenance�and�repair�� Safety�device�maintenance�and�repair��� Traffic�signal�maintenance�and�repair�� Roadway�lighting�maintenance�and�repair�� Intelligent�transportation�system�maintenance�and�repair�
� Cleaning�� Pavement�sweeping�and�cleaning�� Litter�control�� Trash�collection��
If�any�items�are�not�applicable�they�should�be�listed�as�such�and�accompanied�with�a�short�reason�for�the�“not�applicable”�listing.�The�site�maintenance�plan�should�cover�the�expected�lifetime�of�the�roadway�facility.�
Details
It�is�likely�that�some�or�all�of�the�required�activities�are�addressed�by�different�documents�or�by�different�organizations.�A�separate�stand�alone�site�maintenance�plan�is�not�required;�references�to�relevant�existing�documents�are�sufficient.��
DOCUMENTATION � A�copy�of�the�stand�alone�site�maintenance�plan�or�copies�of�existing�
documentation�or�plans�that�address�the�items�noted�above.�
OR�
� A�list�of�each�item�that�addresses�responsible�parties/organizations,�schedule,�methods�and�funding�source(s).�
PR-10
REQUIRED
RELATED CREDITS
� PR�9�Pavement�Management�System
� EW�2�Runoff�Quality�� EW�3�Runoff�Flow�
Control�� EW�4�Stormwater�
Cost�Analysis�� EW�5�Site�Vegetation
SUSTAINABILITY COMPONENTS
� Ecology�� Extent�� Expectations�� Experience�
BENEFITS
� Improves�Human�Health�&�Safety�
� Reduces�Lifecycle�Cost��
� Improves�Accountability�
� Increases�Aesthetics��
117

Project Requirements Greenroads™ Manual v1.5
Site Maintenance Plan PR-10
APPROACHES & STRATEGIES
� Use�standard�agency�maintenance�guidelines�and�specifications.��� Seek�a�long�term�maintenance�contract�or�partnership.�Long�term�maintenance�agreements�can�be�an�effective�
maintenance�solution�and�improve�cost�efficiency�over�the�lifetime�of�the�facility.�� Initiate�discussions�and�document�the�public�involvement�process�of�outlining�design�elements�in�relation�to�
maintenance�requirements�during�project�planning.�Discuss�how�maintenance�partnerships�are�formed�and�explore�the�benefits�of�successful�maintenance�guidelines.�(This�may�include�initiation�of�a�public�involvement/volunteer�program.)�
� Establish�a�public�involvement�program�and�marketing�strategy.�For�example,�community�supported�and�volunteer�programs�like�Adopt�a�Highway�can�be�an�effective�approach�to�litter�and�graffiti�control�and�increase�community�ownership�of�the�infrastructure.�
Example: Documentation
This�is�an�example�of�documentation�that�meets�the�intent�of�this�requirement.�The�example�is�for�a�fictional�2�lane�road�being�expanded�in�to�a�multimodal�facility�(e.g.,�bicycles,�pedestrians,�new�two�way�left�turn�lane)�in�the�greater�Seattle,�WA�area�for�the�Washington�State�Department�of�Transportation�(WSDOT).�This�site�maintenance�requirement�is�met�by�existing�programs�within�WSDOT.�Therefore,�documentation�need�only�cite�these�programs�and�their�relevant�manuals�and�procedures.�Note�that�Figures�PR�10.1�and�PR�10.2�show�more�than�the�required�information�of�“funding�source(s)”�because�they�break�down�all�funding�sources�for�the�entire�Washington�State�Transportation�budget�(not�just�the�funding�source�for�site�maintenance)�and�the�entire�distribution�of�state�collected�transportation�revenues�and�funds�(not�required).��
Documentation�For�this�particular�project,�WSDOT�is�the�owner�agency�and�is�responsible�for�site�maintenance�(as�defined�by�this�requirement).�This�is�true�in�many�jurisdictions�but�not�all.�In�some�jurisdictions,�the�owner�agency�contracts�out�to�private�companies�for�portions�of�site�maintenance.�The�overarching�document�that�describes�WSDOT�site�maintenance�responsible�parties,�schedule�and�methods�is�the�WSDOT�Maintenance�Manual�(M�51�01)�(http://www.wsdot.wa.gov/Publications/Manuals/M51�01.htm).�The�WSDOT�Maintenance�Performance�Measures�website�(http://www.wsdot.wa.gov/Maintenance/Accountability/default.htm)�describes�the�standards�and�targets�for�current�and�past�years.�Additional�guidance�on�roadside�vegetation�is�given�in�the�Northwest�Region,�Area�5:�Integrated�Roadside�Vegetation�Management�Plan�(http://www.wsdot.wa.gov/Maintenance/Roadside/mgmt_plans.htm).�Additional�guidance�on�snow�and�ice�control�is�given�in�the�Statewide�Snow�and�Ice�Plan:�2009�2010�(http://www.wsdot.wa.gov/winter/SnowIcePlan.htm).�In�WSDOT’s�2009�2011�transportation�budget,�“Highway�Maintenance”�is�funded�at�$355.4�million�(about�6.1%�of�the�total�WSDOT�budget).�Figures�PR�10.1�and�PR�10.2�describe�the�collection�and�distribution�of�funds.��
118

Greenroads™ Manual v1.5 Project Requirements
PR-10 Site Maintenance Plan
�
Figure�PR�10.1:�Transportation�Revenues�and�Funds�Collected�by�the�State�(WSDOT,�2009).���
�
Figure�PR�10.2:�Distribution�of�State�Collected�Transportation�Revenues�and�Funds�(WSDOT,�2009).���
119
Project Requirements Greenroads™ Manual v1.5
Site Maintenance Plan PR-10
More�about�the�WSDOT�Maintenance�Accountability�Program�(MAP)�The�Washington�State�Department�of�Transportation�(WSDOT)�has�developed�a�Maintenance�Accountability�Program�(MAP)�designed�to�track,�measure,�and�communicate�the�results�of�maintenance�activities�on�state�roadways�(http://www.wsdot.wa.gov/Maintenance/Accountability).�The�program�was�developed�in�1996�out�of�necessity�as�a�response�to�impending�budget�cuts�by�the�Washington�State�legislature�for�road�maintenance.��
The�MAP�exists�to�comprehensively�measure�the�performance�of�road�maintenance�within�the�state�by�providing�tools�that�link�strategic�planning,�the�budget�and�delivery�of�service,�and�analyzing�the�results�quantitatively.�To�do�this�the�MAP�is�divided�into�33�distinct�categories�that�aim�to�comprehensively�cover�the�scope�of�road�maintenance.�Analysis�is�derived�from�data�collected�by�randomly�sampling�roadways�twice�a�year�via�comprehensive�sampling�procedures,�and�from�records�of�accomplished�work.�The�data�is�then�compared�with�the�established�standards�to�arrive�at�a�level�of�service�(LOS)�designation�for�each�category.�These�LOS�designations�are�then�compared�with�WSDOT�goals�and�targets�to�responsibly�track�progress�and�maintain�accountability�in�all�facets�of�maintenance�operations.��
The�success�of�the�MAP�has�been�to�the�benefit�of�WSDOT�and�their�maintenance�division�as�the�maintenance�budget�is�now�performance�based.�Thorough�analysis�of�program�successes�and�failures�allows�WSDOT�to�analyze�budget�proposals�and�accurately�project�the�consequences�of�budget�decisions�on�road�maintenance�performance,�from�which�they�can�lobby�the�legislature�to�secure�adequate�funding.�Thus,�by�being�careful,�logical,�and�doing�their�research,�WSDOT�is�able�to�secure�the�money�necessary�to�keep�their�roadway�investments�in�good�working�condition,�obviously�to�the�benefit�of�all�residents�of�the�state.�Furthermore,�if�the�final�budget�falls�short�of�funding�everything�that�WSDOT�desires,�they�can�effectively�scale�back�their�goals�and�targets�to�produce�ones�that�maximize�the�productivity�of�the�road�infrastructure�and�accurately�evaluate�the�performance�of�maintenance�based�on�the�funding�provided.�
The�MAP�is�considered�to�be�a�successful�program.�It�has�been�heavily�borrowed�for�use�in�other�states,�and�its�measurement�techniques�were�so�successful�that�part�of�the�program�was�used�as�the�pilot�for�performance�based�budgeting�in�Washington�State.��
POTENTIAL ISSUES
1. Some�responsibilities,�standards,�schedules,�methods�and�funding�sources�may�not�be�known�or�are�not�documented.�Such�documentation�may�need�to�be�created�above�the�individual�project�level.�
2. Funding�for�site�maintenance�may�not�be�secured�long�term.�While�this�is�certainly�recommended,�listing�the�current�funding�source�is�adequate�for�this�requirement.�
3. This�requirement�only�specifies�that�a�site�maintenance�plan�exist.�It�does�not�ensure�that�site�maintenance�is�actually�done.�
4. This�requirement�only�specifies�broad�categories�of�site�maintenance.�It�does�not�specify�effectiveness,�costs�or�utility�of�individual�efforts.�
RESEARCH Maintenance�can�increase�the�useful�life�of�most�infrastructure�components,�promotes�public�safety,�and�benefits�both�public�and�ecosystem�health.�The�following�is�a�series�of�brief�discussions�on�the�value�and�nature�of�infrastructure�maintenance�broken�down�by�general�category.��
Street�Cleaning�&�Litter�Removal�Street�cleaning�and�litter�removal�retain�the�value�of�the�roadway�by�sustaining�the�environmental�and�aesthetic�benefits�over�its�lifespan.�During�its�operating�cycle�the�roadway�will,�due�to�use�and�nature,�necessarily�accumulate�various�debris�that,�left�alone,�will�negatively�impact�the�roadway’s�relationship�with�its�environment.�Both�dirt�and�dangerous�pollutants�(e.g.�phosphorus,�nitrogen,�lead)�will�collect�on�the�roadway�over�time�and�pose�a�legitimate�threat�to�vegetation�and�water�quality�in�the�area�(Hyman,�1999).�Street�sweeping�has�traditionally�been�viewed�as�effective�against�dirt�and�dust�control�only,�but�advancements�in�sweeper�technology�
120

Greenroads™ Manual v1.5 Project Requirements
PR-10 Site Maintenance Plan
have�shown�it�to�be�very�effective�in�removing�small�pollutants�as�well�(James,�1997).�Removal�of�dirt�and�dust�from�the�roadway�also�improves�safety�by�maximizing�the�surface�area�of�tires�the�meet�the�road�surface�and�enhances�the�aesthetics�of�the�site�for�its�users�(Hyman,�1999).�Similarly,�litter�on�the�site�can�be�an�eyesore�and�a�gateway�to�pollution�of�earth�and�water.�Volunteer�litter�removal�programs,�such�as�Adopt�a�highway,�have�been�shown�to�be�the�most�effective�method�of�combating�litter�accumulation�(Hyman,�1999).�
Vegetation�Maintenance�Native�vegetation�growth�near�the�roadway�is�necessary�for�the�roadway�to�maintain�a�good�relationship�with�its�environment,�but�unchecked�vegetation�growth�can�negatively�affect�the�performance�and�safety�of�the�roadway.�Maintaining�vegetation�limits�improve�safety�and�traffic�flow�by�maximizing�sight�distance�for�drivers,�providing�more�accessible�shoulders�for�emergencies,�and�preventing�damage�to�and�interference�with�roadside�structures�and�signs�(WSDOT,�2009;�MassTran,�2003).�Furthermore,�keeping�vegetation�growth�clear�of�the�edge�of�the�roadway�helps�prevent�the�pooling�of�water,�prolonging�the�life�of�the�pavement�(WSDOT,�2009).�The�key�is�to�maintain�vegetation,�since�root�systems�can�provide�necessary�support�and�stabilization�of�embankments�supporting�the�road�(MassTran,�2003).�For�an�example�discussion�of�the�methods�of�vegetation�maintenance�including�important�sustainability�aspects,�see�the�Integrated�Roadside�Vegetation�Management�Program�of�MassHighway�(2003).�
Pavement�Repair�Despite�our�best�efforts,�use�of�the�roadway�over�its�lifetime�will�cause�it�to�begin�to�break�down,�resulting�in�small�pavement�failures�that�can�negatively�impact�the�performance�of�a�roadway.�Maintenance�on�the�roadway�has�two�main�effects:�it�immediately�improves�the�condition�of�the�pavement�and�slows�the�rate�of�future�deterioration�(Deighton,�1997).�These�effects�maintain�life�of�the�road�for�a�longer�period�of�time,�maximizing�the�capital�investment.�
Aside�from�economic�concerns,�unmaintained�paved�surfaces�can�also�become�very�dangerous�safety�risks�to�drivers,�passengers,�and�pedestrians�by�damaging�vehicles�and�requiring�additional�driver�attention.�While�best�management�practices�for�pavement�maintenance�are�widespread,�comprehensive�supporting�research�is�not.�However,�the�process�of�retaining�the�value�and�function�of�the�roadway�over�time�represents�a�significant�portion�of�that�roadway’s�sustainability�benefit,�so�well�designed�maintenance�procedures�must�be�considered�(Wei,�2004).�For�a�comprehensive�discussion�of�pavement�maintenance�benefits,�definitions,�costs,�methods,�and�references�see�Pavement�Interactive�at�http://www.pavementinteractive.org.��
Storm�Drain�Maintenance�and�Cleaning�Drainage�structures,�essential�for�an�environmentally�sensitive�and�functioning�roadway,�require�periodic�maintenance�to�maintain�efficiency.�Without�maintenance,�significant�declines�in�performance�and�flow�rates�have�been�well�documented�(Hyman,�1999).�Best�management�practices�are�also�well�documented,�and�include�routine�maintenance�(especially�right�before�a�rainy�season)�and�data�collection�to�track�when�and�where�storm�drains�tend�to�fail�in�an�effort�to�clean�and/or�fix�them�before�failure�occurs.�Hyman�(1999)�has�a�good�baseline�sampling�of�some�effective�best�management�practices.�
Cost�Analysis�While�the�benefits�of�site�maintenance�on�a�roadway�have�been�relatively�well�documented,�cost�analyses�of�these�procedures�are�much�less�so.�Since�road�maintenance�costs�vary�considerably�by�roadway�type,�road�use�patterns,�regional�weather�factors,�and�chosen�best�management�practices�by�local�agencies,�there�is�no�easy�definition�for�the�maintenance�cost�of�any�specific�roadway.�However,�there�are�some�commonly�cited�costs�of�site�maintenance�that�can�provide�an�understanding�of�the�resources�required�to�maintain�the�asset.�
The�Washington�State�Department�of�Transportation�(WSDOT)�has�$355.4�million�allocated�in�the�2009�2011�budget�for�highway�maintenance�of�roughly�7,000�centerline�miles�of�roadway.�Furthermore,�their�Maintenance�Accountability�Program�divides�that�money�into�33�distinct�activities�within�site�maintenance�to�measure�resource�distribution�more�accurately.�Sub�budgets�include�$137�million�for�roadway�maintenance,�including�pavement�patching�&�repair,�shoulder�repair,�and�cleaning�&�sweeping;�$27�million�for�drainage�maintenance�and�slope�
121
Project Requirements Greenroads™ Manual v1.5
Site Maintenance Plan PR-10
repair;�and�$35�million�for�roadside�and�vegetation�management,�including�litter�pickup�and�control�of�intrusive�and�interfering�vegetation�(WSDOT,�2008).��
REFERENCES Deighton.�(1997).�Pavement�Condition,�vol.�3.�Videotape�from�the�dTV�(Deighton�Television)�Library�video�series�on�
pavement�management�system�topics.�Deighton�Associated,�Ltd.�Bowmanville,�Ontario.�
Hyman,�W.�A.�&�Vary,�D.�(1999).�NCHRP�Synthesis�272:�Best�Management�Practices�for�Environmental�Issues�Related�to�Highway�and�Street�Maintenance.�Transportation�Research�Board,�Washington,�D.C.�
James,�W.�(Ed.).�(1997).�Advances�in�Modeling�the�Management�of�Stormwater�Impacts,�Volume�5.�CRC�Press.�
Massachusetts�Highway�Department�(MassTran).�(2003).�Vegetation�Management�Plan�2003�2007.�Accessed�15�December�2009.�Available�at�http://www.mhd.state.ma.us/downloads/vmp/appendixE.pdf.��
Washington�State�Department�of�Transportation�(WSDOT).�(2008).�Maintenance�Manual.�M�51�01.�WSDOT,�Olympia,�WA.��
Washington�State�Department�of�Transportation�(WSDOT).�(2008).�WSDOT�Maintenance�Performance�Measures.�Accessed�30�December�2009.�Available�at�http://www.wsdot.wa.gov/Maintenance/Accountability/default.htm.�
Washington�State�Department�of�Transportation�(WSDOT).�(2009).�Northwest�Region,�Area�5:�Integrated�Roadside�Vegetation�Management�Plan.�Accessed�30�December�2009.�Available�at�http://www.wsdot.wa.gov/Maintenance/Roadside/mgmt_plans.htm.�
Washington�State�Department�of�Transportation�(WSDOT).�(2009).�Washington’s�09�11�Transportation�Budget.�Accessed�30�December�2009.�Available�at�http://www.wsdot.wa.gov/Finance/budget/BudgetPieCharts.htm.��
Washington�State�Department�of�Transportation�(WSDOT).�(2009).�WSDOT�Maintenance�Operations.�Accessed�30�December�2009.�Available�at�http://www.wsdot.wa.gov/maintenance.��
Wei,�C.�and�Tighe,�S.�(2004).�Development�of�Preventative�Maintenance�Decision�Trees�based�on�Cost�Effectiveness�Analysis:�An�Ontario�Case�Study.�Transportation�Research�Board,�Washington,�D.C.��
122

Greenroads™ Manual v1.5 Project Requirements
PR-11 Educational Outreach
EDUCATIONAL OUTREACH GOAL Increase�public,�agency�and�stakeholder�awareness�of�roadway�sustainability�activities.�
REQUIREMENTS Incorporate�a�comprehensive�public�educational�outreach�program�into�the�operational�phase�of�the�roadway�facility�project.�
A�minimum�of�three�out�of�the�following�eight�educational�elements,�to�be�installed�within�the�roadway�project�limits�or�within�the�purview�of�the�lead�agency,�must�be�completed�to�meet�the�intent�of�this�project�requirement:�
1. Install�and�maintain�a�permanent�project�oriented�signage�program�along�the�roadway�right�of�way.�During�construction�registered�projects�may�use�temporary�signs�to�display�factual�information�about�the�Greenroads™�certification�level�being�pursued,�as�noted�in�the�Greenroads�trademark�policy�(available�on�the�website).�
2. Install�and�maintain�at�least�one�offroad,�permanent�point�of�interest�kiosk�that�displays�the�Greenroads�certification�level�pursued,�project�information,�and�the�certification�level�actually�achieved.�
3. Provide�a�publicly�available�and�maintained�informational�project�website�with�capacity�for�submitting�feedback�and�comments.�
4. Develop�an�agency�and/or�stakeholder�guide,�specification,�or�policy�that�incorporates�or�otherwise�clearly�references�and�reflects�the�ideals�and�intents�of�Greenroads.�
5. Institute�an�internal�agency�continuing�professional�education�and�training�program�related�to�Greenroads.�
6. Perform�at�least�two�presentations�about�the�project�for�primary�and�secondary�schools.�
7. Perform�one�professional�technical�presentation.�8. Document�the�project�experience�using�Greenroads�(i.e.�conduct�a�detailed�case�
study�for�the�roadway�project).�
Details
Note�that�the�official�Greenroads�logo�may�only�be�used�on�project�signs,�public�installations�or�project�documents�by�permission�of�Greenroads.�
DOCUMENTATION The�following�correspond�to�the�numbered�sequence�in�the�preceding�section.�
1. Provide�photos�of�temporary�and�permanent�signs�installed�in�the�right�of�way.�2. Provide�a�text�or�printed�copy�of�the�information�offered�at�the�kiosk�(i.e.�brochure�
or�static�installation)�AND�a�photo�of�the�kiosk�structure�and�location�as�installed.�3. Provide�the�website�address.�(Note:�hyperlinks�must�be�live.)�4. Provide�a�copy�of�the�agency�guide,�manual�or�specification.�5. Provide�a�copy�of�the�learning�objectives�and�schedule�for�the�training�program.�6. Provide�a�copy�of�each�presentation�and�the�time�and�date�of�the�presentation.�7. Provide�a�copy�of�the�abstract�along�with�the�technical�paper�and/or�presentation.�8. Provide�a�copy�of�the�completed�case�study.� �
PR-11
REQUIRED
RELATED CREDITS
� PR�1�Environmental�Review�Process�
� CA�2�Environmental�Training�
� AE�8�Scenic�Views�� AE�9�Cultural�
Outreach�
SUSTAINABILITY COMPONENTS
� Equity�� Expectations�� Exposure�
BENEFITS
� Increases�Awareness�
123

Project Requirements Greenroads™ Manual v1.5
Educational Outreach PR-11
APPROACHES & STRATEGIES
� Use�the�environmental�review�process�(see�PR�1)�as�a�starting�point�for�establishing�public�awareness�needs.�� Involve�business�development�personnel,�marketing�professionals,�and�public�relations�officers�early�in�the�
project�planning�process.�� Expand�construction�team�health�and�safety�training�meetings�to�incorporate�Greenroads�goals�for�the�project�
(see�CA�2).�� Identify�people�within�the�project�team,�agency�or�company�who�may�be�interested�in�leading�external�and�
internal�educational�efforts�relative�to�incorporating�Greenroads�and�sustainability�in�the�organization.�� Consider�collaboration�with�professional�website�developers.�� Contact�the�Greenroads�Team�if�interested�in�participating�in�a�case�study.�Resources,�such�as�report�templates�
and�scorecards,�are�available�by�request.�� Follow�the�guidelines�for�active�outreach�(and�related�public�interaction�topics)�outlined�in�the�“Public�
Involvement�Techniques�for�Transportation�Decision�making”�(FHWA�PD�96�031).�This�document�contains�a�number�of�potential�activities�that�could�be�used�alone�or�in�combination�to�meet�the�intent�of�this�Project�Requirement,�as�well�as�several�additional�useful�references�and�resources.�
Example: Kickinghorse Canyon Project — British Columbia Ministry of Transportation
The�Kickinghorse�Canyon�Project�on�the�Trans�Canada�Highway�(Highway�1)�by�the�British�Columbia�Ministry�of�Transportation�offers�an�excellent�example�of�a�comprehensive�public�educational�outreach�program.�
This�project�has�a�detailed�website�(http://www.th.gov.bc.ca/kickinghorse/index.htm),�a�printable�fact�sheet�(available�http://www.th.gov.bc.ca/kickinghorse/updates/KHCP_Fact_Sheet.pdf),�and�has�completed�a�case�study�(available�by�written�request).�Additionally,�the�completed�project�includes�improvements�to�a�rest�area�which�will�incorporate�project�and�historical�information�for�the�site.�
POTENTIAL ISSUES
1. Graffiti�on�installed�signs�or�public�information�kiosks.�2. Potentially�inflammatory�or�offensive�comments�or�spam�on�project�websites.�
RESEARCH At�the�heart�of�the�Greenroads�program�is�encouragement�of�broad�sustainability�education�for�people�who�use,�design,�and�build�transportation�infrastructure.�Public�outreach�programs�are�encouraged�at�most�transportation�agencies�and�often�required�on�many�projects�as�part�of�the�initial�planning�process�(such�as�during�environmental�review).�However,�most�of�these�open�communication�oriented�initiatives�are�relevant�only�during�the�decision�making�process�and�are�not�deliberately�educational�over�the�long�term�life�of�the�project.�Greenroads�seeks�to�support�roadway�projects�that�offer�built�in�educational�resources�for�the�benefit�of�public�interest�and�professional�learning�and�development.�
Need�&�Opportunity�The�Brundtland�Report�notes�“…the�changes�in�attitudes,�in�social�values,�and�in�aspirations….will�depend�on�vast�campaigns�of�education,�debate�and�public�participation”�(WCED,�1987,�p.�16).�Sustainability�has�certainly�become�a�popular�literature�topic,�but�the�volume�of�research�on�education�is�too�vast�to�summarize�here.�Many�authors�on�sustainability�as�well�as�other�environmental�organizations�suggest�or�explicitly�stress�the�importance�of�sustainability�education�(Edwards,�2005;�Benyus,�2002;�WCED,�1987;�USGBC,�2009;�Wilson,�2002;�Daly,�2005;�Robèrt,�1997,�2002;�Kibert,�2005),�but�few�offer�actionable�solutions�or�implementation.�In�most�cases,�current�educational�efforts�occur�internally�within�companies�or�agencies,�or�are�directed�toward�children�and�young�adults�in�elementary�schools�through�college.�Specific�academic�research�on�either�the�success�or�failure�of�implementing�roadway�based�public�outreach�programs�for�sustainability�education�is�difficult�to�find�(or,�more�likely,�it�simply�does�not�exist�yet).�
124

Greenroads™ Manual v1.5 Project Requirements
PR-11 Educational Outreach
Roadways�present�a�unique�opportunity�to�interact�with�their�main�stakeholder,�the�public,�throughout�the�life�of�the�project.�Over�100�hours�per�person�per�year�are�spent�commuting�to�work�in�the�United�States�(Buckner�&�Gonzales,�2005).�This�exceeds�the�amount�of�personal�vacation�time�for�most�traditional�salaried�positions,�is�twice�as�long�as�spring�breaks�for�most�schools,�and�is�two�to�five�times�the�amount�of�time�that�most�states�require�for�Continuing�Education�Units�(CEU)�for�licensed�professionals�like�engineers,�doctors,�and�lawyers.�Clearly,�time�spent�on�a�roadway�provides�ample�opportunity�for�Exposure�to�different�sustainability�topics,�as�well�as�time�for�reflection,�repetition�and�reinforcement�on�a�nearly�daily�basis�for�most�commuters.�However,�when�the�project�ownership�changes�into�the�public�hands,�often�any�learning�opportunities�pertaining�to�the�project�(such�as�how�a�new�pavement�technology�was�implemented,�how�energy�use�was�reduced�in�the�lighting,�or�what�types�of�stormwater�treatments�were�used)�are�lost.�
In�addition�to�institutional�learning,�professional�and�technical�organizations�also�play�a�vital�role�in�furthering�knowledge�of�sustainability�throughout�their�membership.�Organizations�like�the�Transportation�Research�Board�(TRB),�whose�mission�statement�is�oriented�toward�promoting�information�exchange�and�interdisciplinary�research�(TRB,�2009),�and�other�government�bodies�promote�continuing�education�of�the�transportation�professional�community.�Conference�presentations,�technical�papers,�and�presentations�to�local�schools�are�all�considered�to�be�worthwhile�efforts�made�to�forward�sustainability�education�through�outreach.�
Finally,�rating�systems�like�Greenroads�offer�unique�opportunities�for�agencies�and�organizations�to�track�and�measure�internal�processes.�Using�a�sustainability�rating�system�is�a�simple�way�to�measure�progress�and�improvements�over�the�long�term�and�stimulate�innovation�within�an�agency.�Case�studies�can�provide�valuable�snapshots�of�overall�performance�on�the�project�and�be�used�to�develop�agency�specific�benchmarks�for�sustainability�for�future�projects.�
Precedence�in�Buildings�The�LEED®�Green�Building�Rating�System�awards�one�point�in�all�of�its�rating�system�programs�for�instituting�a�project�oriented�Educational�Outreach�program�that�meets�the�intent�of�the�credit�category�called�Innovation�in�Design,�which�rewards�superior�performance�and�creative�implementation�of�ideas�or�technologies�(USGBC,�2008).�This�credit�awarded�for�the�built�environment�establishes�precedence�for�the�need,�validity�and�acceptance�of�such�educational�programs�and�public�awareness�programs.�Transportation�and�infrastructure�have�a�similar�need�for�such�precedence.�
Further,�though�using�a�building�as�a�model�for�cost�of�roadways�is�not�ideal,�the�availability�of�an�educational�opportunity�such�as�a�roadside�point�of�interest�or�signs�lining�the�street�may�be�perceived�as�a�large�value�added�benefit�for�the�public�at�a�very�minimal�added�cost�to�the�design�budget.�A�cost�analysis�of�such�educational�programs,�signage�and/or�displays�incorporated�in�LEED�rated�buildings�(using�a�generic�building�model)�showed�only�minor�added�costs�for�implementation�to�the�project�bottom�line�(Steven�Winter�Associates,�2004).�Additionally,�this�study�showed�that�most�of�these�costs�are�“soft�costs”�that�are�typically�administrative�in�nature.�
The�primary�mode�of�establishing�and�communicating�public�values�in�transportation�and�infrastructure�is�consensus�based�political�mandate�or�other�regulatory�rulings.�Also,�a�federal�mandate�was�recently�instituted�for�high�performance�and�green�buildings�as�Executive�Order�(EO)�13423:�Strengthening�Federal�Environmental,�Energy,�and�Transportation�Management�(2007).�EO�Section�3(c)�makes�federal�agency�leads�accountable�for�establishment�of�internal�agency�programs�for�environmental�training,�including�management,�compliance�and�audit,�and�leadership�recognition.�This�could�be�considered�a�premonition�for�mandated�sustainability�training�and�education�in�roadway�system�projects�and�for�internal�programs�in�transportation�agencies�and�organizations.�
Ongoing�sustainability�education�programs�can�teach�people�to�understand�the�consequences�of�their�actions,�such�as�the�impact�of�personal�resource�use,�and�to�relate�their�values�and�behaviors�to�current�political�and�environmental�conditions�(Palmer,�1998).�Roads�are�highly�accessible�to�the�public;�thus,�roads�can�offer�a�creative�means�of�exposure�to�sustainability�concepts�which�can�help�users�make�more�informed�decisions�regarding�sustainability�in�their�daily�lives,�communities�and�cultures.�Greenroads�adds�education�as�another�step�toward�establishing�a�connection�between�people�and�the�places�that�they�live,�travel,�work�and�recreate.��
125

Project Requirements Greenroads™ Manual v1.5
Educational Outreach PR-11
GLOSSARY
REFERENCES Buckner,�S.�&�Gonzales,�J.�United�States�Census�Bureau�Public�Information�Office.�(2005,�March�30).�Americans�
spend�more�than�100�hours�commuting�to�work�each�year,�Census�Bureau�reports.�U.S.�Census�News�[Press�Release].�Retrieved�September�29,�2010�from�http://www.census.gov/newsroom/releases/archives/american_community_survey_acs/cb05�ac02.html��
Daly,�H.�E.�(2005).�Economics�in�a�full�world.�Scientific�American.�293�(3),�100�7.��
Edwards,�A.�R.�(2005).�The�sustainability�revolution:�Portrait�of�a�paradigm�shift.�Gabriola,�BC:�New�Society.�
Exec.�Order�No.�13,423�72�Fed.�Reg.�(2007).�(to�be�codified�at�3�C.F.R.�§�102)�
Howard/Stein�Hudson�Associates,�Inc.�and�Parsons�Brinckerhoff�Quade�and�Douglas.�(1996,�September).�Public�involvement�for�transportation�decision�making.�(FHWA�PD�96�031)�Washington,�DC:�U.S.�Dept.�of�Transportation,�Federal�Highway�Administration.�Posted�December�1996.�Retrieved�October�12,�2009�from�http://www.fhwa.dot.gov/REPORTS/PITTD/contents.htm.�
Kibert,�C.�(2005).�Sustainable�construction:�green�building�design�and�delivery�(1st�ed.).�Hoboken�N.J.:�John�Wiley�&�Sons.�
Palmer,�J.�(1998).�Environmental�education�in�the�21st�century:�theory,�practice,�progress�and�promise.�London,�UK;�New�York,�NY:�Routledge.��
Robèrt,�K.��H.�(2002).�The�natural�step�story:�seeding�a�quiet�revolution.�Gabriola�Island,�BC:�New�Society�Publishers.��
Steven�Winter�Associates,�Inc.�(2004,�October).�GSA�LEED�Cost�Study:�Final�Report.�U.S.�General�Services�Administration�Doc.�No.�GS�11P�99�MAD�0565/P�00�02�CY�0065.�Washington,�DC:�U.S.�Government�Printing�Office.�Retrieved�October�12,�2009�from�http://www.wbdg.org/ccb/GSAMAN/gsaleed.pdf�
Transportation�Research�Board.�(2009).�Education�and�Training�Research�at�TRB.�Education�and�Training.�Retrieved�October15,�2009�from�http://www.trb.org/EducationTraining/Public/EducationandTraining1.aspx��
U.S.�Green�Building�Council.�(2008b,�March�21).�USGBC:�LEED�Reference�Documents.�LEED�ID�Credit�Catalog.�Retrieved�December�11,�2008,�from�http://www.usgbc.org/ShowFile.aspx?DocumentID=3569�
United�Nations�General�Assembly,�42nd�Session.�(1987,�August�4).�Report�of�the�World�Commission�on�Environment�and�Development�(WCED):�“Our�Common�Future.”�(A/42/427).�Annex�to�Official�Record.�Geneva,�Switzerland,�1987.�(Masthead).�Retrieved�November�2,�2008,�from�http://www.worldinbalance.net/agreements/1987�brundtland.php�
Wilson,�E.�O.�(2002).�The�future�of�life�(1st�ed.).�New�York:�Alfred�A.�Knopf.��
EO� United�States�Executive�OrderKiosk� A�small�structure�that�can�be�used�to�access�information,�such�as�a�newsstand�
or�computer�terminal�LEED� Leadership�in�Energy�&�Environmental�Design,�a�rating�system�for�green�
buildings�by�the�United�States�Green�Building�Council�TRB� Transportation�Research�BoardUSGBC� United�States�Green�Building�Council
126

Greenroads Manual v1.5 © 2011
�
�
�
�
�
�
ENVIRONMENT & WATER
� �
127

Greenroads Manual v1.5 © 2011
� �
128

Greenroads™ Manual v1.5 Environment & Water
EW-1 Environmental Management System
ENVIRONMENTAL MANAGEMENT SYSTEM GOAL Improve�environmental�stewardship�by�using�a�contractor�that�has�a�formal�environmental�management�process.��
CREDIT REQUIREMENTS The�prime�contractor,�design�builder�or�construction�management�firm�shall�have�a�documented�environmental�management�system�(EMS)�for�the�entire�company�or�at�least�the�portion(s)�of�the�company�participating�in�the�project.�The�EMS�must�be�in�place�for�the�duration�of�project�construction.�As�a�minimum,�the�EMS�and�its�documentation�shall�meet�the�requirements�of�International�Standards�Organization�(ISO)�14001:2004.���
Details
The�prime�contractor,�design�builder�or�construction�management�firm�is�considered�to�have�a�documented�EMS�if�it�has:�
� ISO�14001:2004�certification.�� An�EMS�that�meets�ISO�14001:2004�requirements�but�is�not�formally�certified.�
DOCUMENTATION Submit�one�(1)�of�the�following�items:�
1. Documentation�of�the�ISO�14001:2004�certification�for�the�prime�contractor,�design�builder�or�construction�management�firm.�
2. A�copy�of�the�prime�contractor,�design�builder�or�construction�management�firm’s�EMS�documentation�to�include:�
� Environmental�policy�� Environmental�objectives�and�targets�� Identified�regulatory�requirements�and�compliance�with�requirements�� Defined�roles�and�responsibilities�� Employee�training�plan�� Listing�of�documented�processes�� Preventive�actions�� Corrective�actions�� Emergency�procedures�
EW-1
2 POINTS
RELATED CREDITS
� PR�1�Environmental�Review�Process�
� PR�10�Site�Maintenance�Plan�
� CA�1�Quality�Management�System
� CA�2�Environmental�Training�
SUSTAINABILITY COMPONENTS
� Ecology�� Extent�� Expectations�� Experience�� Exposure�
BENEFITS
� Reduces�Water�Use�� Reduces�Fossil�Fuel�
Use�� Reduces�Raw�
Materials�� Reduces�Air�
Emissions�� Reduces�Greenhouse�
Gases�� Reduces�Water�
Pollution�� Reduces�Solid�Waste�� Improves�Human�
Health�&�Safety�� Improves�
Accountability�� Increases�Awareness�
�
129

Environment & Water Greenroads™ Manual v1.5
Environmental Management System EW-1
APPROACHES & STRATEGIES
� Have�a�prime�contractor�with�ISO�14001:2004.��� Have�a�prime�contractor�with�a�documented�EMS�that�meets�the�requirements�of�ISO�14001:2004.��
Example: Environmental Management System (EMS) Manuals
While�it�is�not�possible�to�present�an�entire�EMS,�there�are�many�examples�of�key�EMS�documents�available�on�the�Web�including�the�following�EMS�manuals:�
� U.S.�Environmental�Protection�Agency,�Philadelphia�Office:�http://www.epa.gov/region03/ems/philly_manual.htm��
� Robins�Air�Force�Base:�http://205.153.241.230/ems/basics/emsrobins.pdf�� The�City�of�San�Diego�(contains�PowerPoint�presentations�on�key�ISO�14001�facets):�
http://www.sandiego.gov/environmental�services/ems/emp_manual.shtml��� Mass�Highway:�http://www.mhd.state.ma.us/downloads/projdev/emsmanual.pdf�� North�Carolina�Department�of�Environment�and�Natural�Resources�(they�have�a�generic�guide�EMS�manual�
for�use�by�those�wishing�to�create�one):�http://www.p2pays.org/ref/08/07378/0737829.pdf�� The�American�Association�of�State�Highway�and�Transportation�Officials�(AASHTO)�maintains�an�EMS�
implementation�guide�website�at:�http://environment.transportation.org/documents/ems_implementation_guide.asp.��
POTENTIAL ISSUES
1. Smaller�firms�may�not�be�able�to�afford�the�ISO�certification�process.�2. Documentation�of�an�EMS�is�not�the�same�has�having�an�effective�EMS;�however�collection�of�documentation�
(in�lieu�of�an�actual�audit)�is�an�efficient�way�of�gathering�evidence�of�an�effective�EMS.�
RESEARCH According�to�ISO�(2009)�an�EMS�is�a�management�tool�that�“…provides�a�framework�for�a�holistic,�strategic�approach�to�the�organization's�environmental�policy,�plans�and�actions.”�One�of�the�more�comprehensive�descriptions�of�such�a�system�comes�from�ISO�in�their�14000�family�of�standards.��
ISO�14000�The�ISO�14000�family�of�documents�addresses�various�aspects�of�environmental�management.�ISO�14001�and�ISO�14004�specifically�address�EMS�requirements�and�guidelines�respectively.�Essentially,�it�is�a�formal�description�of�an�EMS�and�all�that�is�involved�in�its�creation,�implementation�and�use.�The�ISO�is�a�standard�publishing�body�similar�to�ASTM�International�or�the�American�Association�of�State�Highway�and�Transportation�Officials�(AASHTO).�
Certification:�ISO�14001�The�requirements�for�certification�are�contained�in�ISO�14001.�Therefore,�organizations�are�certified�in�accordance�with�ISO�14001;�the�number�is�appended�with�the�year�of�the�standard�that�applied�when�the�organization�was�certified.�The�most�current�version�is�ISO�14001:2004.���
ISO�does�not�certify�organizations�itself.�Most�countries�have�formed�formal�groups�or�“certification�bodies,”�which�audit�organizations�applying�for�ISO�14001�certification.�Through�mutual�agreements�these�bodies�ensure�that�certification�audit�standards�are�relatively�the�same�worldwide.�Certification,�once�granted,�must�be�renewed�at�standard�intervals,�often�three�years.��
ISO�does�not�require�certification�and�many�organizations�just�choose�to�follow�ISO�14000�requirements�but�forego�certification.�However,�it�is�common�practice�in�many�parts�of�the�world�(e.g.,�Western�Europe,�China,�India,�etc.)�to�require�ISO�certification�as�a�prerequisite�for�doing�business.�Therefore,�countries�that�require�this�usually�see�the�highest�certification�rates.�
130

Greenroads™ Manual v1.5 Environment & Water
EW-1 Environmental Management System
Arguments�for�Certification�Arguments�for�certification�typically�cite�the�general�idea�that�proper�and�active�management�of�a�company’s�impact�on�the�environment�can�result�in�better�regulatory�compliance,�better�business�opportunities,�less�impact�on�the�environment�and�improved�safety.�Typically�these�items�are�measured�by�counting�regulatory�violations,�market�share,�sales�growth,�reduced�injuries�and�other�metrics.��
Arguments�against�Certification�Opponents�of�certification�argue�that�the�actual�act�of�certification�and�existence�of�documentation�do�not,�in�and�of�themselves,�guarantee�improved�environmental�impacts.�Further,�they�point�out�that�ISO�14001�certification�can�be�an�expensive�and�burdensome�process�that�does�not�necessarily�produce�results.��
Certification�Cost�According�to�Christini�et�al.�(2004),�it�cost�one�major�U.S.�construction�firm�about�$1�million�to�achieve�certification.�Most�research�(e.g.,�Zeng�et�al.�2003;�Ofori�et�al.;�2000)�tends�to�investigate�reasons�for�ISO�14000�adoption�and�not�the�actual�cost.�
Worldwide�ISO�14001�Certification�Data�from�2006�show�worldwide�ISO�14001�certifications�at�129,199�in�140�different�countries�and�growing�(Figure�EW�1.1).�In�December�2006�the�U.S.�had�5,585�certifications,�which�ranked�seventh�worldwide�(Figure�EW�1.2).�ISO�14001�certification�is�far�more�common�in�Europe�and�Eastern�Asia�with�44%�and�41%�of�worldwide�certifications�respectively.�North�America�(consisting�of�only�the�U.S.,�Canada�and�Mexico)�comprised�almost�6%�of�the�worldwide�total.��
�Figure�EW�1.1:�ISO�14001�certification�worldwide�growth�2005�2006�(data�from�ISO�2006).�
�
111,162�
129,199�
100,000�
105,000�
110,000�
115,000�
120,000�
125,000�
130,000�
135,000�
2005 2006
Num
ber�o
f�ISO
�140
01�Certifications�W
orldwide
Year
131

Environment & Water Greenroads™ Manual v1.5
Environmental Management System EW-1
�Figure�EW�1.2:�Top�10�countries�in�terms�of�number�of�ISO�14001�certifications�in�2006�(data�from�ISO�2006).�
�
ISO�14001�Certification�in�the�U.S.�Construction�Industry�ISO�14000�enjoys�growing�worldwide�popularity,�however�relatively�few�U.S.�construction�firms�are�certified�(Christini�et�al.�2004).�Reasons�for�the�low�popularity�in�the�U.S.�are�somewhat�non�specific�but�perhaps�can�be�attributed�to�a�lack�of�any�government�requirement,�no�insistence�by�clients,�implementation�costs,�and�a�subcontracting�system�that�makes�it�difficult�to�use�an�EMS�on�a�particular�job�(Tse�2001).��
Evidence�to�support�the�positive�outcomes�of�ISO�14001�certification�generally�comes�from�surveys�or�case�studies�of�contractors�that�are�largely�already�ISO�certified�(e.g.,�Christini�et�al.�2004;�Valdez�and�Chini�2002;�Ofori�et�al.�2000)�or�segregate�the�certified�firms�and�then�ask�them�what�the�benefits�were�they�were�seeking�in�certification�(Zeng�et�al.�2003).�It�is�not�surprising�that�results�indicate�a�general�benefit�to�ISO�14001�certification.�Even�so,�there�is�evidence�to�suggest�that�ISO�14000�can�reduce�landfilled�waste�and�produce�financial�savings�(Christini�et�al.�2004).���
GLOSSARY
REFERENCES Christini,�G.,�Fetsko,�M.,�and�Hendrickson,�C.�(2004).�Environmental�Management�Systems�and�ISO�14001�
Certification�for�Construction�Firms.�Journal�of�Construction�Engineering�and�Management,�130(3),�330�336.�
International�Organization�for�Standardization�(ISO).�(2004).�ISO�14001:2004�Environmental�management�systems���Requirements�with�guidance�for�use.�ISO,�Geneva,�Switzerland.��
International�Organization�for�Standardization�(ISO).�(2009).�ISO�14000�essentials.�ISO�website.�http://www.iso.org/iso/iso_14000_essentials.�Accessed�11�January�2010.�
22,593�
18,842�
11,125�
9,825�
6,070�
5,893�
5,585�
5,415�
4,411�
3,047�
� 5,000� 10,000� 15,000� 20,000� 25,000�
Japan
China
Spain
Italy
UK
South�Korea
USA
Germany
Sweden
France
Number�of�ISO�14001�Certifications� in�December�2006
ISO� International�Standards�OrganizationEMS� environmental management�system
132
Greenroads™ Manual v1.5 Environment & Water
EW-1 Environmental Management System
Ofori,�G.,�Briffett,�C.,�Gang,�G.,�and�Ranasinghe,�M.�(2000).�Impact�of�ISO�14000�on�construction�enterprises�in�Singapore.�Construction�Management�and�Economics,�18,�935–947.�
Tse,�R.Y.C.�(2001).�The�implementation�of�EMS�in�construction�firms:�case�study�in�Hong�Kong.�J.�Environ.�Assessment�Policy�Management,�3(2),�177�194.�
Valdez,�H.�E.�and�Chini,�A.R.�(2002).�ISO�14000�Standards�and�the�US�Construction�Industry.�Commentary.�Environmental�Practice,�4,�10–219.�
Zeng,�S.X.,�Tam,�C.M.,�Deng,�Z.M.�and�Tam,�V.W.Y.�(2003).�ISO�14000�and�the�Construction�Industry:�Survey�in�China.�Journal�of�Management�in�Engineering,�19(3),�107�115.�
� �
133

Environment & Water Greenroads™ Manual v1.5
Environmental Management System EW-1
�
134

Greenroads™ Manual v1.5 Environment & Water
EW-2 Runoff Flow Control
RUNOFF FLOW CONTROL GOAL Mimic�predevelopment�hydrological�conditions�in�the�right�of�way�(ROW)�and�minimize�offsite�stormwater�controls.�
CREDIT REQUIREMENTS 1. Develop�a�stormwater�management�plan�for�the�site�using�stormwater�best�
management�practices�(BMPs)�for�flow�control.�Explicitly�state�the�goals�of�this�plan�and�how�performance�will�be�measured.�
2. Use�low�impact�development�(LID)�BMPs�to�the�maximum�extent�feasible�as�determined�in�Project�Requirement�PR�8�by�a�licensed�professional.��
3. Compute�the�90th�percentile�average�annual�rainfall�event�values�for�the�following�predevelopment�and�post�construction�conditions:�� VpreROW�=�inside�ROW�predevelopment�volume�of�runoff�� Vpre�out�=�outside�ROW�predevelopment�volume�of�run�on�� Vtotal�pre�=�VpreROW�+�Vpre�out�=�total�predevelopment�volume��� Qpre�=�predevelopment�flow�rate�measured�at�water�body�receiving�effluent�
from�the�site,�based�on�Vtotal�pre�� VpostROW�=�inside�ROW�post�construction�volume�of�runoff�� Vpost�out�=�outside�ROW�post�construction�volume�of�run�on�� Vtotal�post�=�VpostROW�+�Vpost�out�=�total�post�construction�volume��� Qpost�=�post�construction�flow�rate�measured�at�the�same�location�as�Qpre,�based�
on�Vtotal�post�4. Provide�BMPs�for�stormwater�flow�control.�List�the�types,�manufacturers,�total�
volumes�and�flow�rates�controlled�by�BMPs�within�the�ROW�or�outside�of�the�ROW.�5. Demonstrate�that�the�planned�BMPs�meet�the�following�flow�control�criteria:�
� BMPs�conform�to�all�applicable�minimum�flow�control�standards�for�all�effluent�leaving�the�ROW�set�by�the�governing�jurisdiction�for�volume,�flow�control�and�time�of�concentration.�State�the�minimum�requirements,�including�critical�erosive�flow�criteria,�and�provide�referenced�document�or�policy.�
� RV�=�Ratio�of�Volume�Achieved�=�Vtotal�post/Vtotal�pre���1.20�� RF�=�Ratio�of�Flow�Rate�Achieved�=�Qpost/Qpre���1.20�� Points�are�awarded�per�Table�EW�2.1�based�on�type�of�alignment,�location�of�
BMPs�and�level�of�control�achieved.�Use�RV�and�RF,�whichever�is�higher,�to�determine�if�points�have�been�earned.�
Table�EW�2.1:�Points�for�Flow�Control�Achievement�Type�of�
Alignment�Location�of�
BMPs�Vtotal�post�Includes�
Run�on?�Higher�of�RV or�RF
1.20 – 1.10 1.10 – 1.00 �1.00New�� Within�ROW� No� 0 0 2
Yes� 0 0 3Out�of�ROW� No� 0 0 1
Yes� 0 0 2Existing� Within�ROW� No� 0 1 2
Yes� 1 2 3Out�of�ROW� No� 0 0 1
Yes� 0 1 2�
EW-2
1-3 POINTS
RELATED CREDITS
� PR�8�Low�Impact�Development�
� PR�10�Site�Maintenance�Plan�
� EW�3�Runoff�Quality�� EW�4�Stormwater�
Cost�Analysis�
SUSTAINABILITY COMPONENTS
� Ecology�� Extent�
BENEFITS
� Reduces�Water�Pollution�
� Reduces�Solid�Waste� Reduces�Manmade�
Footprint�
135

Environment & Water Greenroads™ Manual v1.5
Runoff Flow Control EW-2
Details
Stormwater�flows�are�measured�by�flow�rate,�time�of�concentration,�and�volume.�“Predevelopment�conditions”�are�the�estimated�values�of�these�three�variables�that�existed�in�the�ROW�at�a�prior�time�relative�to�regional�historic,�natural�or�undeveloped�conditions�as�defined�by�the�governing�local�watershed�authority.�If�no�local�authority�or�no�existing�definition,�use�the�definition�for�green�,�gray��and�brownfields�provided�in�the�2009�Sustainable�Sites�Initiative�(SSI)�Credit�3.5�“Manage�stormwater�on�site.”�While�continuous�stormwater�simulation�models�are�most�appropriate�for�this�credit,�the�modified�curve�numbers�provided�in�SSI�Credit�3.5�may�be�used�to�simplify�calculations.�“Post�construction”�means�the�expected�performance�of�the�designed�BMPs�in�the�stormwater�management�plan.�
DOCUMENTATION A�copy�of�the�executive�summary�of�the�project�drainage�design�report�that�includes,�at�minimum,�the�following:��
� Short�narrative�that�addresses�each�of�the�credit�requirements.�
As�needed,�supporting�calculations�for�runoff�areas,�runoff�volume�(output�from�any�rainfall�modeling�software�used�is�adequate),�and�treatment�levels�may�be�requested.�
APPROACHES & STRATEGIES
� The�Sustainable�Sites�Initiative�(2009)�modified�curve�number�(CN)�approach�is�acceptable�and�may�be�used�to�achieve�this�credit.�New�alignments�and�rehabilitation�(or�widening)�of�rural�roads�will�fall�under�“greenfield"�CNs�while�almost�all�other�projects�will�use�“grayfield”�CNs.�(See�additional�notes�in�the�“Potential�Issues”�section.)�The�guidelines�for�Sustainable�Sites�are�available�here:�http://www.sustainablesites.org/report/��
� Preserve�native�vegetation.�� Protect�soils�with�good�infiltration�capacity.�� Minimize�compaction�of�soils�to�preserve�natural�infiltration�capacity.��� Distribute�stormwater�controls�throughout�the�project�area�instead�of�using�a�few�relatively�large�centralized�
facilities.�� Assess�the�feasibility�of�infiltration�and�evapotranspiration�to�reduce�the�need�for�detention�ponds�outside�the�
right�of�way.�� Reduce�land�area�impacts�by�avoiding�the�use�of�traditional�detention�ponds.�
Example: Northshore Drive, Bellingham, WA - Case Study
The�Northshore�Drive�project�is�located�in�the�Silver�Beach�area�of�the�City�of�Bellingham,�Washington�on�the�north�shore�of�Lake�Whatcom.��The�project�includes�all�of�Northshore�Drive�from�the�Dakin�Street�intersection�to�the�Britton�Road�intersection.��The�design�was�loosely�based�on�a�recent�project�by�the�City�of�Olympia�called�RW�Johnson�Boulevard�that�used�porous�bike�lanes�and�sidewalks�along�a�traditional�roadway.��Northshore�Drive�received�an�asphalt�overlay�after�surface�grinding�the�existing�roadway�and�making�minor�alignment�modifications.��Lane�widths�were�reduced�to�11�feet�to�accommodate�new�bike�lanes�and�sidewalks.��A�new�stormwater�drainage�system�was�also�installed.�
1. Calculate�Pervious�and�Impervious�Area
Alabama�Ave�to�Silver�Beach�Store�Total�segment�length�=�2450�ft�Total�width�of�cross�section�=�37.5�ft�
Existing:�� 29�ft�impervious�hot�mix�asphalt�(HMA)� Area�1=�29�ft�x�2,450�ft�=�71,050�sf�� 8.5�ft�of�pervious�grass/gravel�� Area�2�=�8.5�ft�x�2,450�ft�=�20,825�sf��
136

Greenroads™ Manual v1.5 Environment & Water
EW-2 Runoff Flow Control
Proposed:�� 22.5�ft�impervious�HMA,�intersections,�aprons,�curb Area�3�=�22.5�ft�x�2,450�ft�=�55,125�sf� 15�ft�pervious�HMA� Area�4�=�15�ft�x�2,450�ft�=�36,750�sf��
Total�new�and�replaced�impervious�surface�for�segment�=�Area�3�=�55,125�sf�Decrease�in�impervious�surface�for�segment�=�Area�1�–�Area�3�=�15,925�sf�
Silver�Beach�Store�to�Britton�Road�Total�segment�length�=�1,550�ft�Total�width�of�cross�section�=�29�ft�(excludes�existing�gutter�pan)�
Existing:�� 27�ft�impervious�HMA� Area�5�=�29�ft�x�1,550�ft�=�41,850�sf�� 2�ft�of�pervious�grass/gravel�� Area�6�=�2�ft�x�1,550�ft�=�3,100�sf��Proposed:�� 29�ft�impervious�HMA� Area�7�=�29�ft�x�1,550�ft�=�44,950�sf�� �
Total�new�and�replaced�impervious�surface�for�segment�=�Area�7�=�44,950�sf�Increase�in�impervious�surface�for�segment�=�Area�7�–�Area�5�=�Area�6�=�3,100�sf�
Project�Totals�Total�Existing�Impervious�Surface�=�Area�1�+�Area�5�=�112,900�sf�Total�New�and�Replaced�Impervious�Surface�=�Area�3�+�Area�7�=�100,075�sf�� Net�Change�in�Impervious�Surface�=�112,900�sf�–�100,075�sf�=12,825�sf�(Decrease)�
Total�Existing�Pervious�Surface�=�23,925�sf�Total�New�Pervious�Surface�=�36,750�sf�� Net�Change�in�Pervious�Surface�=�36,750�sf�–�23,925�sf�=�12,825�sf�(Increase)�
2. Minimum�Requirements�from�2008�WSDOT�Highway�Runoff�Manual�(HRM)�
Figures�3.1,�3.2,�and�3.3�of�the�HRM�are�used�to�determine�the�minimum�requirements�applicable�for�a�project.*�Section�3�2.2�of�the�HRM�lists�possible�exceptions�for�this�project.**�No�special�exceptions�apply�but�the�project�discharges�directly�into�an�exempt�water�body�(Lake�Whatcom)�which�does�not�have�flow�control�requirements.�However,�WSDOT�requires�that�regardless�of�an�exemption,�on�site�BMPs�need�to�be�used�to�infiltrate�as�much�runoff�as�reasonably�possible.�
3. Determine�Flow�Control�Values�
Time�of�concentration,�flowrates�and�runoff�volumes�were�not�required�to�be�computed�for�exempt�projects�for�flow�control,�nor�were�they�computed�for�quality�treatment�purposes�because�a�net�decrease�in�impervious�surface�occurred.�
4. Apply�Stormwater�Best�Management�Practices�
This�project�used�permeable�pavements�with�underdrains�for�bikelanes�and�sidewalks.�Infiltration�rates�are�shown�in�Table�EW�2.2�from�the�project�geotechnical�report.�
Table�EW�2.2:�Estimated�long�term�design�infiltration�rates�(Northshore�Geotechnical�report)�
Sample�Depth�USDA�Textural�Classification�
Infiltration�Rate�(in/hr)***�
T.P.1@�2.0’���3.0’� Loam� 0.13T.P.4@�1.5’���2.5’� Sandy�Loam� 0.25
5. Determine�Flow�Control�Achieved�
Since�total�impervious�surface�on�the�project�was�reduced�from�existing�surface�areas�and�BMPs,�greater�than�
137

Environment & Water Greenroads™ Manual v1.5
Runoff Flow Control EW-2
100%�of�predevelopment�flow�control�rates�and�volumes�were�achieved.�The�project�earns�3�points.
Notes:�*These�figures�make�up�a�decision�tree�used�to�guide�the�engineer�in�the�applicable�minimum�requirements�when�designing�a�stormwater�management�facility�based�on�known�surface�areas,�relative�perviousness,�and�pollution�generating�capacity.�**�Generally,�if�the�amount�of�impervious�surfaces�is�greater�than�a�specified�minimum�value,�certain�requirements�must�be�applied�to�that�impervious�surface.��These�values�are�called�“minimum�requirements.”�***�Includes�the�recommended�correction�factors�presented�in�the�SWMM.
�
�Figure�1:�Northshore�Drive�in�Bellingham,�Washington.�Cyclists�using�permeable�pavement�bikelanes�adjacent�to�
permeable�sidewalk.�Photo�by�C.Weiland��
138

Greenroads™ Manual v1.5 Environment & Water
EW-2 Runoff Flow Control
Example: Bioswale with Flow Control Weirs
Figure�EW�2.2�shows�a�set�of�streetside�flow�control�weirs�in�a�bioswale�BMP.�This�swale�provides�flow�control�benefits�of�increased�infiltration,�increased�retention,�and�flow�attenuation.�
�Figure�EW�2.2:�A�bioswale�with�flow�control�weirs.�(Photo�by�J.�Anderson)�
Example: Continuous Modeling Scenarios
The�effect�of�low�impact�development�(LID)�stormwater�controls�toward�restoring�the�original�hydrology�can�be�illustrated�analyzing�the�erosive�potential�of�flows�under�various�scenarios.�Stream�erosion�is�caused�by�excessive�shear�stress�applied�by�the�flow�on�the�stream�banks�and�bed.�For�this�example,�a�suite�of�LID�methods�were�modeled�as�part�of�an�alternatives�study�for�roadway�realignment�and�associated�stormwater�management�options�for�the�Interstate�70�expansion�project.�
Figure�EW�2.3�on�the�following�page�shows�the�average�distribution�of�shear�stress�in�a�stream�near�Columbia,�Missouri.�Ideally,�the�distribution�after�development�should�remain�close�to�the�pre�development�curve.�The�graphic�shows�several�key�things:�
� Detention�basins�designed�to�control�extreme�events�(e.g.,�those�with�return�periods�of�2�to�100�years)�do�little�to�restore�the�shear�stress�distribution�when�compared�with�the�post�developed�scenario.�
� Basins�designed�to�control�water�quality�and�protect�channels�(i.e.,�designed�for�the�1�year�storm)�do�lower�the�shear�stress�but�notably�change�the�distribution�over�time.�
� In�this�specific�case,�LID�controls,�although�still�not�exactly�replicating�the�pre�development�condition,�afford�the�closest�match.�
Figure�EW�2.3�was�created�with�CH2M�HILL’s�LIFE™�continuous�modeling�software�for�LID�runoff�controls.�
139

Environment & Water Greenroads™ Manual v1.5
Runoff Flow Control EW-2 140

Greenroads™ Manual v1.5 Environment & Water
EW-2 Runoff Flow Control
POTENTIAL ISSUES
1. There�are�numerous�methods�to�calculate�runoff�volume.�Many�are�applicable�to�storms�of�large�magnitude�and�underestimate�the�runoff�generated�by�small�storms,�which�occur�more�frequently�and�represent�most�of�the�annual�runoff�volume.�Average�annual�runoff�volumes�have�been�specified�for�use�in�all�of�the�stormwater�related�credits�in�Greenroads�to�provide�consistency�between�credits.�
2. The�LID�evaluation�process�that�is�required�to�meet�Project�Requirement�PR�8�does�not�require�an�average�annual�runoff�model.�In�fact,�it�recommends�the�use�of�design�storms�to�model�peak�flow.�This�practice�is�now�outdated�and�the�preferred�approach�to�runoff�quantity�management�is�through�flow�control�methods.�(City�of�Seattle,�2009)�
3. Continuous�modeling�can�be�time�intensive�and�costly�and�this�can�vary�greatly�between�projects�and�by�size�of�project.�The�2009�Sustainable�Sites�Initiative�(SSI)�provides�an�alternative�model�that�can�be�used�to�meet�the�intent�of�this�credit.�It�is�based�on�the�old�TR�55�software�model�from�the�National�Resource�Conservation�Service�(NRCS)�in�combination�with�a�continuous�modeling�program�based�on�the�Stormwater�Management�Model�(SWMM)�software�by�the�EPA.�The�2009�SSI�credit�provides�charts�and�target�curve�numbers�for�achieving�certain�points�in�that�rating�system.�(In�general,�probably�a�good�rule�of�thumb�is�that�points�for�the�SSI�credit�are�worth�5,�7,�and�10�points�which�probably�correspond�to�1,�2,�and�3�points�in�Greenroads,�respectively.�However,�Greenroads�also�requires�supporting�calculations�to�show�that�flow�control�performance�guidelines�have�been�met�according�to�this�credit�and�to�date�no�projects�have�attempted�this�credit�or�the�SSI�approach.)�
4. Any�models�that�are�used�inherently�have�some�limitations�and�assumptions.�Some�are�better�than�others�depending�on�project�location.�This�credit�defaults�to�the�integrity�of�the�designer�to�choose�the�appropriate�modeling�software.�
RESEARCH Altering�the�imperviousness�of�the�land�to�make�way�for�roads�can�have�major�impacts�on�the�physical�and�chemical�integrity�of�a�watershed�(Southerland,�1994;�Forman�and�Alexander,�1998;�Environmental�Protection�Agency:�EPA,�2007).�This�Greenroads�credit�primarily�addresses�changes�to�physical�integrity�of�watersheds�based�on�physical�quantities�of�runoff�generated�by�a�roadway;�however,�many�of�the�topics�are�inherently�tied�to�water�quality�issues�because�all�best�management�practices�that�address�flow�control�also�address�water�quality�(Quigley�et�al.,�2009).�Credit�EW�3�Runoff�Quality�addresses�chemical�runoff�characteristics�(water�quality)�while�an�often�ignored�component�of�watershed�health,�biological�integrity,�is�addressed�by�Credit�EW�6�Habitat�Restoration.�
Physical�Impacts�from�Stormwater�Runoff�The�general�relationship�between�volume�of�water�and�velocity�of�flows�on�streambeds�seems�intuitive�—more�water�and�faster�flows�means�more�erosion�and�thus�higher�sediment�loads�—�however,�the�relationship�between�volume,�pollutant�(sediment)�transport,�and�aquatic�biological�integrity�is�actually�quite�complex.�Much�of�this�complexity�stems�from�the�scale�of�the�problem.�To�illustrate�this�issue,�in�2007,�there�were�actually�more�miles�of�roadway�in�the�United�States�(almost�4.1�million)�than�there�were�documented�river�and�coastal�and�lake�shoreline�miles�(about�3.6�million)�(Federal�Highway�Administration:�FHWA,�2008;�EPA,�2010).�The�EPA�notes�(2007):��
“The�effect�that�a�road�network�has�on�stream�networks�largely�depends�on�the�extent�to�which�the�networks�are�interconnected.�Road�networks�can�be�hydrologically�connected�to�stream�networks�where�road�surface�runoff�is�delivered�directly�to�stream�channels�(at�stream�crossings�or�via�ditches�or�gullies�that�direct�flow�off�the�road�into�a�stream)�and�where�road�cuts�transform�subsurface�flow�into�surface�flow�(in�road�ditches�or�on�road�surfaces�that�deliver�sediment�and�water�to�streams�much�more�quickly�than�without�a�road�present).�The�combined�effects�of�these�drainage�network�connections�are�increased�sedimentation�and�peak�flows�that�are�higher�and�arrive�more�quickly�after�storms.�This�can�lead�to�increased�instream�erosion�and�stream�channel�changes,�especially�in�small�watersheds.”�
141

Environment & Water Greenroads™ Manual v1.5
Runoff Flow Control EW-2
Figure�EW�2.3�below�shows�how�interconnected�both�of�these�systems�actually�are�in�the�United�States.�Note�that�the�scale�of�this�image�only�allows�a�level�of�detail�that�shows�major�Interstates�and�major�watershed�streams;�local�or�arterial�roads�and�smaller�watersheds�are�not�shown:�these�smaller�watersheds�are�most�sensitive�to�nearby�roadway�project�impacts.�
�Figure�EW�2.3:�United�States�streams�(blue)�and�the�Interstate�highway�system�(light�red).�(Enviromapper,�n.d.)�
�Figure�EW�2.3�suggests�that�a�significant�amount�of�hydromodification�is�attributable�to�roadways.�Hydromodification�is�a�term�used�by�the�EPA�to�mean�“alteration�of�the�hydrologic�characteristics�of�coastal�and�non�coastal�waters,�which�in�turn�could�cause�degradation�of�water�resources.”�(EPA,�2007)��Hydromodification�encompasses�river�engineering�activities�for�improving�river�channels�(i.e.�dredging)�and�also�building�dams.�It�also�includes�forestry�practices,�recreation�and�industrial�use,�construction�sites�and�other�point�source�activities,�and�a�plethora�of�urban�runoff�issues�including�stream�restoration�practices�(EPA,�2010).�Roads�are�innately�tied�to�each�of�these�activities.��
The�primary�concerns�with�hydromodification�are:�
� Pollutant�generation�and�transport�� Habitat�degradation�and�loss�of�habitat�� Species�loss�� Streambank�slope�stability�� Erosion�of�channels�or�changes�in�flow�path�of�streams�� Flooding�
A�majority�of�the�literature�regarding�stormwater�management�and�roads�and�bridges�addresses�the�issues�of�water�pollution�(water�quality)�and�controlling�pollutant�transport.�Importantly,�sediment�is�considered�to�be�one�of�the�primary�pollutants�for�water�bodies�that�threaten�aquatic�habitats�and�species�(EPA,�2008).�Together,�these�issues�can�broadly�be�termed�“watershed�health."�(Pollutants�and�impacts�associated�with�pollution�are�discussed�further�in�Credit�EW�3.�It�is�important�to�note�that�an�effective�flow�control�measure�also�has�the�co�benefit�of�reducing�pollutant�loads�due�to�the�hierarchical�nature�of�physical�processes.�Additionally,�note�that�some�best�management�practices�applied�for�flow�control�offer�more�effective�mitigation�of�pollutants�than�others.)�Watershed�health�is�directly�related�to�nearby�effective�impervious�surface.�(EPA,�2008;�Tilley�and�Slonecker,�2007;�City�of�Seattle,�2009;�EPA,�2010)�It�follows�that�watershed�health�is�directly�related�to�management�of�stormwater�runoff�quantities�generated�by�those�impervious�surfaces.�
142

Greenroads™ Manual v1.5 Environment & Water
EW-2 Runoff Flow Control
Bank�stability,�erosion�and�flooding,�however,�are�primarily�flow�control�concerns�associated�with�physical�impacts�of�runoff,�not�quality.�These�are�often�considered�“drainage�issues”�and�have�historically�been�the�primary�application�of�stormwater�management�governed�by�EPA�permits�up�until�1987,�when�runoff�quality�came�to�be�addressed�as�well.�(Pitt�and�Maestre,�2005)�These�physical�attributes�of�runoff�can�impact�sensitive�watershed�habitats�and�aquatic�life�in�both�urban�and�rural�environments�(Southerland,�1994;�City�of�Seattle,�2009).�For�example,�“When�a�stream�changes�its�physical�configuration�and�substrate�due�to�increased�flows,�habitats�are�altered….The�biological�communities�in�wetlands�are�also�severely�impacted�and�altered�by�the�hydrological�changes.�Relatively�small�changes�in�the�natural�water�elevation�fluctuations�can�cause�dramatic�shifts�in�vegetative�and�animal�species�composition”�(City�of�Seattle,�2009).�Furthermore,�in�2007,�approximately�73%�of�the�roads�in�the�United�States�were�designated�as�“rural”�by�the�FHWA�(2008);�43%�of�rural�roads�are�unpaved.�The�EPA�(2007)�states:�
“Roads�built�in�rural�areas,�such�as�forest�and�recreational�roads,�alter�the�natural�landscape�and�can�destroy�riparian�habitat.�If�not�properly�installed�and�maintained,�these�types�of�roads�erode�and�supply�increased�sediment�and�pollutants�to�adjacent�streams.�Additionally,�roads�may�increase�imperviousness,�which�leads�to�flashier�runoff�events.�Stream�crossings�associated�with�rural�roads�can�block�fish�passage,�trap�debris�during�storms,�and�lead�to�increased�streambank�erosion�in�nearby�areas.”�
In�urban�environments,�the�problem�is�sometimes�worse.�More�water�and�faster�flows�in�this�case�mean�that�an�aging�infrastructure�system�in�an�already�degraded�watershed�can�easily�become�overloaded�with�increasing�development�in�surrounding�areas.�Much�of�the�stormwater�infrastructure�in�cities�is�built�in�tandem�with�roads�in�the�public�right�of�way.�This�means�that�(1)�many�stormwater�infrastructure�projects�also�become�roadway�projects,�and�more�importantly�for�Greenroads,�(2)�flow�control�clearly�presents�both�a�challenge�and�a�stormwater�management�opportunity�to�roadway�projects.�
Hydromodification�and�Roads:�The�Smoking�Gun�The�EPA’s�definition�of�hydromodification�is�quite�broad—while�it�is�impossible�to�isolate�hydromodification�impacts�with�roadways�alone�for�a�number�of�reasons,�it�is�also�difficult�to�argue�that�they�do�not�cause�hydromodification.�Which�is�correct�seems�to�be�a�matter�of�philosophical�debate�(FHWA,�1990;�EPA,�2008).�Water�courses�are�dynamic�by�nature�and�respond�to�stressors,�changing�paths�and�eroding�“naturally.”�(Wilcock,�Pitlick�and�Cui,�2009)�The�behavior�of�rivers�and�streams�is�ultimately�governed�by�principles�of�geomorphology�and�hydraulics,�not�by�humans.�It�appears�that�the�core�issue�is�one�of�values�and�how�one�defines�something�as�“natural.”�For�example,�it�is�true�that�more�water�and�faster�flows�are�generated�from�higher�levels�of�impervious�surfaces�(Maestre�and�Pitt,�2005),�which�can�prevent�or�impede�“natural”�groundwater�recharge�and�have�a�number�of�thus�“unnatural”�effects�on�streamflows�in�localized�areas�of�watersheds�(EPA,�2007;�EPA,�2008).�It�is�also�true�however,�that�even�stream�restoration�activities�are�accounted�for�in�the�list�of�hydromodification�impacts�associated�with�degradation�of�watersheds�(EPA,�2008).�So,�stream�preservation�via�manmade�controls�intended�to�repair�a�stream�to�what�is�considered�“natural”�may�actually�have�unintended�consequences�of�further�degradation.�There�is�little�evidence�to�show�that�the�stream�would�not�have�acted�that�way�on�its�own,�but�the�converse�is�also�true.�
The�stressors�of�concern,�then,�are�really�human�activities�themselves.�In�particular,�the�stress�is�caused�by�urbanization�or�development�(two�more�very�broad�terms).�The�interaction�between�human�activities�and�the�hydrologic�cycle�is�also�complex.�It�is�important�to�note�that�many�important�relationships�are�not�well�enough�understood�to�be�able�to�quantify�the�total�accountability�for�roads�and�bridges�for�hydromodification�beyond�indirect�association.�Many�uncertainties�and�variability�arise,�for�example,�due�to�lack�of�understanding�of:�
� The�amount�of�streambank�erodability�(Morrissey,�Rizzo,�Ross,�and�Young,�2009)�that�occurs�due�to�upstream�changes�
� The�level�of�change�between�surface�and�base�flows�associated�with�different�hydraulic�controls�(i.e.�storm�Sewers,�catch�basins�and�ponds)�(Tilley�and�Slonecker,�2007)�
143

Environment & Water Greenroads™ Manual v1.5
Runoff Flow Control EW-2
� Amounts�of�sediment�and�sediment�transport�capacity�of�different�types�of�river�and�stream�flows�(Wilcock,�Pitlick�and�Cui,�2009)�
� Inconsistencies�and�variability�in�monitoring�and�assessment�of�watersheds�(Strecker,�Mayo,�Quigley,�and�Howell,�2001)�
� The�biological�integrity�of�receiving�watersheds�(City�of�Seattle,�2009)�
Urbanization,�Hydromodification�and�Roads�Development,�including�roads,�changes�the�hydrologic�profile�of�a�site�or�area�usually�by�increasing�the�total�impervious�surface�area.�This�correlation�was�confirmed�in�a�recent�study�by�Maestre�and�Pitt�(2005)�and�a�graph�is�shown�in�Figure�EW�2.4�that�illustrates�the�clear�relationship�between�volumetric�runoff�coefficients�and�percent�imperviousness�of�a�surface.�
The�United�States�is�5%�developed�with�ranges�of�impervious�between�20�80%�in�some�areas.�(EPA,�2008)�Though�previously�estimated�at�much�higher�percentages,�roads�and�sidewalks�make�up�about�33%�of�the�total�impervious�surface�in�average�urban�and�suburban�areas�(Tilley�and�Slonecker,�2007).�In�rural�environments,�up�to�100%�of�the�total�impervious�surface�area�can�be�attributed�to�roads�and�highways�depending�on�the�scale�of�the�watershed�being�studied.�
Therefore,�hydromodification�(bank�stability,�erosion,�flooding,�and�related�water�quality�issues)�can�be�directly�attributed�to�increases�in�runoff�discharges�from�impervious�surfaces�due�to�urbanization.�Gregory�and�Chin�(2002)�composed�a�brief�list�that�provides�a�good�summary�of�how�quantities�of�stormwater�discharge�are�related�to�urbanization�and�a�variety�of�hydromodification�hazards.�Awareness�of�these�effects�can�assist�in�development�of�appropriate�stormwater�management�plans.�These�are�shown�in�Figure�EW�2.5.�
�Figure�EW�2.4:�Discharge�quantities�are�directly�proportional�to�impervious�surfaces.�(Maestre�&�Pitt,�2005)�
�
144

Greenroads™ Manual v1.5 Environment & Water
EW-2 Runoff Flow Control
�Figure�EW�2.5:�Urban�channel�hazards�related�to�urbanizations.�(Gregory�&�Chin,�2002)�
Design�Alternatives�for�Roadway�Flow�Control�Hydrologic�conditions�at�each�roadway�site�are�highly�variable,�even�within�the�same�site.�Granato,�Zenone,�and�Cazenas�(2003)�note�“Stormwater�flows�respond�differently�to�different�types�of�storms�and�may�respond�differently�to�the�same�type�of�storm�in�different�seasons�of�the�year.”�Just�like�the�interconnectedness�of�roadways�and�watersheds,�stormwater�flow�control�design�can�be�complex�and�easily�lends�itself�to�oversimplification.�This�is�perhaps�exemplified�with�the�fluctuations�for�flow�control�standards�in�the�past�thirty�years�(City�of�Seattle,�2009).�A�variety�of�approaches�have�been�used,�including�peak�flow�designs�that�limited�flow�rates�to�control�erosive�flows,�setting�certain�percentages�of�those�rates�to�those�supposed�to�be�more�representative�of�predevelopment�peaks,�and�finally�flow�duration�standards.�This�shift�in�practice�represented�a�shift�from�event�based�methods�at�a�microscale�level�to�continuous�simulation�modeling�at�a�watershed�scale.�
Typically,�allowable�regulatory�levels�for�certain�flows�and�certain�types�of�roadway�projects�are�set�and�“flow�control”�really�means�a�predetermined�suite�or�range�of�allowable�flow�volumes,�rates�and�times�to�concentration�that�are�considered�to�pose�an�acceptable�risk�of�erosion�receiving�waters.�(City�of�Seattle,�2009)�These�threshold�levels�are�primarily�determined�“based�on�the�amount�of�new�and�replaced�impervious�surfaces,…which�can�also�be�dependent�on�the�type�of�project,�size�of�project,�and�the�drainage�basin�in�which�the�project�is�located.”�(City�of�Seattle,�2009)��There�is�a�mounting�body�of�evidence�however�to�suggest�that�single�event�design�approaches�are�insufficient�to�maintain�streambank�and�channel�integrity�and�structure.�(City�of�Seattle,�2009;�Bledsoe,�2002;�Huber�et�al.�2006).�Bledsoe�(2002)�notes:�
145

Environment & Water Greenroads™ Manual v1.5
Runoff Flow Control EW-2
To�fully�address�the�potential�for�channel�response,�it�is�necessary�to�expand�standard�design�approaches�to�address�the�temporal�distribution�of�erosive�forces�relative�to�both�bed�materials�and�bank�conditions.�Single�event�techniques�for�maintaining�the�cumulative�bedload�transport�volume,�unless�modified�to�account�for�differential�transport�by�size�fractions�across�a�broader�range�of�flow�events,�may�alter�predevelopment�fluvial�processes�and�affect�channel�morphology�and�the�quality�of�instream�habitat.�Given�the�sensitivity�of�fine�grained�streams�to�inflowing�bed�material�load,�reproducing�the�predevelopment�hydrograph�will�not�necessarily�ensure�stability�if�there�is�a�sufficient�long�term�reduction�in�sediment�delivery.�Thus,�stormwater�management�strategies�should�be�carefully�weighed�in�terms�of�their�long�term�geomorphic�implications�in�addition�to�flood�control�and�pollutant�removal�functions.�
Event�based�methods�often�result�in�overly�conservative�drainage�designs�(Huber�et�al.�2006)�and�in�general�do�not�meet�stream�channel�protection�objectives�(Booth,�1991;�Booth�and�Jackson,�2007).�Huber�et�al.�(2006)�notes�that�though�most�of�the�hyetographs�(graphs�of�rainfall�distributions�over�time)�from�event�based�designs�can�be�applied�to�monitored�rainfall�data,�they�are�generally�not;�and�they�are�also�sensitive�to�initial�conditions�and�assumptions�as�well�as�storage�capacity�and�infiltration�capabilities�of�the�site.�These�imperfect�traits�and�limitations�then�get�adopted�into�water�quality�designs,�which�are�consequently�also�overly�conservative,�or�worse,�ineffective.�Despite�the�disadvantages�to�each�of�these�approaches�and�the�research�to�justify�that�synthetic�storm�event�based�methods�are�inefficient�to�model�actual�rainfall�events�(City�of�Seattle,�2009;�Huber�et�al;�2006),�“these�methods�are�embedded�in�several�versions�of�commercial�software�and�are�routinely�accepted�by�the�hydrologic�engineering�profession�in�spite�of�the�issues�just�mentioned.”�(Huber�et�al.�2006).�FHWA�and�the�American�Association�of�State�Highway�and�Transportation�Officials�(AASHTO)�and�most�state�departments�of�transportation�still�recommend�use�of�the�traditional�design�storms�for�hydrologic�and�hydraulic�design�of�roadways,�presumably�due�to�the�single�event,�catastrophic�nature�of�flood�events.�(FHWA,�2009;�AASHTO,�2005)�Some�regulatory�agencies�now�require�2,�10�and�100�years�instead�of�one�or�other�(FHWA,�2009;�WSDOT,�2008).�
Currently,�low�impact�development�(LID)�methods�have�become�the�preferred�standard�of�practice�for�the�built�environment�and�for�site�development�(City�of�Seattle,�2009).�The�most�appropriate�way�to�emulate�the�performance�of�LID�methods�is�through�continuous�modeling�(City�of�Seattle,�2009;�Huber�et�al.,�2006).�Continuous�hydrological�modeling�has�its�own�disadvantages,�primarily�in�time�intensiveness�(and�thus�cost)�and�unavailability�of�data�(Huber�et�al.,�2006;�City�of�Seattle,�2009).�In�general,�these�LID�methods�are�being�pushed�mostly�in�urban�areas�to�help�manage�the�increasing�imperviousness�and�the�associated�water�quality�issues�in�cities�as�populations�in�these�communities�grow�to�relieve�stress�on�existing�infrastructure�and�attempt�to�achieve�“natural”�conditions�as�a�baseline�for�performance.�However,�due�to�the�high�concern�of�flooding�impacts�on�roadways,�it�may�be�most�appropriate�to�use�a�combined�approach,�which�may�require�a�combination�of�both�LID�and�conventional�methods�in�order�to�meet�flood�control�demands�and�also�maintain�water�quality�standards.�(Washington�Department�of�Transportation:�WSDOT,�2008)��
Low�impact�Development�for�Flow�Control�A�brief�introduction�to�LID�techniques�was�provided�in�Project�Requirement�PR�8.�The�relevant�concepts�for�LID�methods�in�flow�control�(all�offer�quality�benefits�unless�otherwise�noted)�are�briefly�described�below.�(City�of�Seattle,�2009)�Most�LID�techniques�incorporate�more�than�one.�
� Infiltration.�Runoff�is�percolated�into�receiving�soils.�The�infiltration�capacity�is�closely�related�to�the�hydraulic�conductivity�and�capacity�of�the�soils.�Evaporation�is�often�also�present�as�well�as�transpiration�as�these�facilities�are�often�vegetated.��
� Evaporation.�Runoff�is�vaporized�and�absorbed�into�the�air.�� Transpiration.�Runoff�is�absorbed�by�plants�and�then�released�as�vapor.�� Dispersion.�Runoff�area�is�increased�to�delay�the�flow.�� Interception.�Rainfall�is�trapped�by�the�leaves�of�plants.�� Storage�and�release�(retention�and�detention).�Runoff�is�collected�temporarily�and�released�via�a�controlled�
outflow.�(True�retention�facilities�rely�on�infiltration�and�evaporation�and�no�outflow.)�
146

Greenroads™ Manual v1.5 Environment & Water
EW-2 Runoff Flow Control
� Storage�and�reuse.�Runoff�is�collected�and�stored�for�stored�for�other�uses�(commonly�“harvesting�rainwater”).�Often�storage�facilities�are�vaults�beneath�roadways�and�their�flow�control�utility�is�based�on�their�total�volume�and�opening�sizes.��
The�Prince�George’s�County�LID�Manual�(1999)�presents�a�more�detailed�description�of�the�LID�methods:�the�reader�is�referred�to�the�Manual�for�more�detailed�information.�A�summary�of�the�flow�control�attributes�of�some�common�LID�techniques�is�shown�in�Figure�EW�2.6.�(For�most�roadway�facilities,�storage�will�be�underground.)�
�Figure�EW�2.6�The�suite�of�flow�control�attributes�for�LID�methods.�(Prince�George’s�County,�1999)�
�
Flow�Control�by�Avoidance�The�EPA�(2007)�suggests�that�the�geometric�design�of�a�road�can�do�much�to�aid�in�flow�control,�however�the�primary�objective�of�their�“non�eroding�roadway”�design�concept�is�to�stabilize�and�orient�the�roadbed�to�minimize�production�of�sediment�due�to�erosion�of�slopes,�base�materials�and�surface�courses�and�avoid�uncontrolled�drainage�of�pollutants�into�sensitive�areas.�Further�design�considerations�include�not�sloping�the�roadway�toward�wetland�areas�(unless�the�wetlands�are�part�of�the�treatment�scheme)�or�planning�alignments�to�fall�as�far�as�possible�away�from�existing�water�courses.�Nevertheless,�the�shape�and�surface�course�material�design�is�clearly�tied�to�the�amount�of�runoff�generated�by�the�roadway.�The�design�approach�is�especially�critical�for�unpaved�roads�where�erosion�and�sedimentation�of�the�road�itself�is�an�important�issue.��(EPA,�2007)�
Flow�Control�by�Soil�Amendment�“Soil�amendment”�is�a�process�that�describes�adding�organic�content�such�as�compost�or�mulch�to�native�and�fill�soils.�The�organic�content�aids�in�flow�control�by�providing�additional�storage�through�absorption,�higher�infiltration�and�evapotranspiration�from�increased�surface�area�of�finer�soil�particles,�improved�groundwater�recharge�and�also�improved�affinity�for�vegetation.�It�also�offers�several�pollutant�reducing�benefits�and�can�offer�urban�benefits�such�as�reduced�irrigation�and�fertilizer�needs.�(City�of�Seattle,�2009)�Time�of�concentration�is�increased�and�peak�flows�are�attenuated�and�reduced�through�this�method.�Many�of�the�compost�amended�soil�approaches�are�outlined�in�site�development�guidance�documents�for�buildings;�however,�Swiss�engineers�Piguet,�Parriaux�and�Bensimon�(2008)�offer�a�road�specific�design�approach�called�“infiltration�slopes”�that�allows�implementation�of�soil�amendment�that�maintain�the�overall�impermeability�of�the�roadway�for�fast�runoff�removal�without�promoting�water�intrusion�in�roadway�subbase�materials.�Their�models�of�infiltration�slopes�are�shown�in�Figure�EW�2.7�with�various�slope�and�material�configurations�using�
147
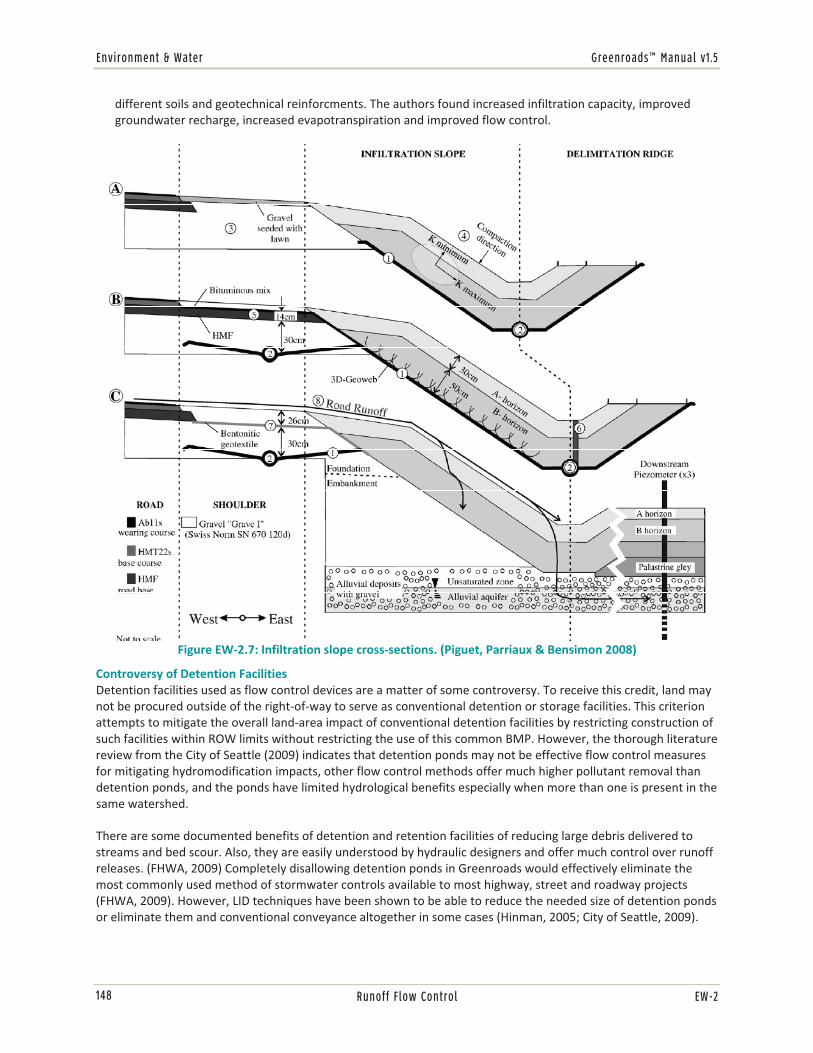
Environment & Water Greenroads™ Manual v1.5
Runoff Flow Control EW-2
different�soils�and�geotechnical�reinforcments.�The�authors�found�increased�infiltration�capacity,�improved�groundwater�recharge,�increased�evapotranspiration�and�improved�flow�control.��
�Figure�EW�2.7:�Infiltration�slope�cross�sections.�(Piguet,�Parriaux�&�Bensimon�2008)�
Controversy�of�Detention�Facilities�Detention�facilities�used�as�flow�control�devices�are�a�matter�of�some�controversy.�To�receive�this�credit,�land�may�not�be�procured�outside�of�the�right�of�way�to�serve�as�conventional�detention�or�storage�facilities.�This�criterion�attempts�to�mitigate�the�overall�land�area�impact�of�conventional�detention�facilities�by�restricting�construction�of�such�facilities�within�ROW�limits�without�restricting�the�use�of�this�common�BMP.�However,�the�thorough�literature�review�from�the�City�of�Seattle�(2009)�indicates�that�detention�ponds�may�not�be�effective�flow�control�measures�for�mitigating�hydromodification�impacts,�other�flow�control�methods�offer�much�higher�pollutant�removal�than�detention�ponds,�and�the�ponds�have�limited�hydrological�benefits�especially�when�more�than�one�is�present�in�the�same�watershed.�
There�are�some�documented�benefits�of�detention�and�retention�facilities�of�reducing�large�debris�delivered�to�streams�and�bed�scour.�Also,�they�are�easily�understood�by�hydraulic�designers�and�offer�much�control�over�runoff�releases.�(FHWA,�2009)�Completely�disallowing�detention�ponds�in�Greenroads�would�effectively�eliminate�the�most�commonly�used�method�of�stormwater�controls�available�to�most�highway,�street�and�roadway�projects�(FHWA,�2009).�However,�LID�techniques�have�been�shown�to�be�able�to�reduce�the�needed�size�of�detention�ponds�or�eliminate�them�and�conventional�conveyance�altogether�in�some�cases�(Hinman,�2005;�City�of�Seattle,�2009).�
148

Greenroads™ Manual v1.5 Environment & Water
EW-2 Runoff Flow Control
The�preferred�alternative�to�conventional�detention�ponds�in�Greenroads�are�multi�functional�BMPs�such�as�bioretention�or�stormwater�storage�and�reuse.�
When�LID�Is�Not�Appropriate�In�general,�LID�flow�control�BMPs�may�not�be�appropriate�and�should�be�avoided�in�areas�(WSDOT,�2008)�
� With�high�or�seasonally�high�water�tables�� Below�the�100�year�flood�plain�� With�distressed�groundwater�� In�intertidal�areas�� In�sensitive�watersheds�or�forests�(these�have�a�higher�net�benefit�than�LID.)�
However,�a�site�specific�design�built�on�watershed�parameters�and�topography�will�be�most�effective�for�controlling�runoff�flows�and�some�of�flow�control�techniques�may�be�viable�even�in�these�conditions.�
Additional�Resources�� For�further�discussion�on�the�merits�of�detention�facilities,�see�the�Environmentally�Critical�Areas:�Best�
Available�Science�report�by�the�City�of�Seattle�(2009),�available�at:�http://www.seattle.gov/dpd/static/BAS%20Review_FINAL_30JUN09_LatestReleased_DPDP017711.doc�
� Current�performance�data�on�flow�control�for�LID�BMPs�is�available�at�the�International�BMP�Database:�http://www.bmpdatabase.org.�They�also�track�cost�data�as�it�is�volunteered�along�with�submissions.�
For�more�information�and�additional�resources�on�specific�LID�techniques,�see�the�discussion�in�Project�Requirement�PR�8�Low�Impact�Development.�
GLOSSARY
AASHTO� American�Association�of�State�Highway�and�Transportation�OfficialsBiodiversity� Total�number�of�species�present�Biological�integrity� The�ability�to�support�and�maintain�a�balanced,�integrated�adaptive�
assemblage�of�organisms�having�species�composition,�diversity,�and�functional�organization�comparable�to�that�of�natural�habitat�of�the�region�(Karr�and�Dudley,�1981).�
BMP� Best�management�practiceBMPDB� International�BMP�Database�(http://www.bmpdatabase.org)��Channel� A�streambedDetention� The�process�of�holding�and�delaying�runoff�with�a�controlled�releaseEIA� Effective�impervious�areaEPA� Environmental�Protection�AgencyErosion� Surface�wearing�due�to�physical�processes�such�as�water,�wind�and�heatEvaporation� The�process�of�water�becoming�water�vaporEvapotranspiration�� the�combined�effects�of�evaporation�and�transpiration�in�reducing�the�
volume�of�water�in�a�vegetated�area�during�a�specific�period�of�time�(Huber�et�al.�2006)�
FHWA� Federal�Highway�AdministrationFlow�control� Management�of�runoff�volume�physical�characteristics�including�peak�flows�
and�time�of�concentration�Hydromodification� alteration�of�the�hydrologic�characteristics�of�coastal�and�non�coastal�waters,�
which�in�turn�could�cause�degradation�of�water�resources�(EPA,�2007)���
149

Environment & Water Greenroads™ Manual v1.5
Runoff Flow Control EW-2
Impervious�surface� a�hard�surface�area�that�either�prevents�or�retards�the�entry�of�water�into�the�soil�mantle�or�causes�water�to�run�off�the�surface�in�greater�quantities�or�at�an�increased�rate�(Tilley�and�Slonecker,�2006)�
Infiltration� the�downward�movement�of�water�into�the�soil�after�surficial�entry�and�percolation�through�pore�spaces�(Huber�et�al.�2006)�
Interception� The�process�of�leaves�of�plants�preventing�rainfall�from�hitting�a�surfaceLow�impact�development� a�broad�collection�of�engineered�controls,�stormwater�management�facilities,�
and�other�land�development�BMPs�that�attempt�to�mimic�pre�development�hydrologic�conditions�by�emphasizing�infiltration,�evapotranspiration,�or�stormwater�reuse�for�long�term�flow�control�and�runoff�treatment�
Reach� The�length�of�a�river�or�stream�between�river�bends�Retention� The�process�of�holding�runoff,�ideally�no�release�occurs�and�all�runoff�is�
infiltrated�or�evaporated�TIA� Total�impervious�areaTranspiration� The�process�of�water�uptake�in�plantsUrbanization� The�process�of�and�activities�associated�with�human�development��
REFERENCES American�Association�of�State�Highway�and�Transportation�Officials.�(1999).�Highway�drainage�guidelines.�
Washington,�D.C.:�American�Association�of�State�Highway�and�Transportation�Officials.�
Bledsoe,�B.�P.�(2002).�Stream�Erosion�Potential�and�Stormwater�Management�Strategies.�Journal�of�Water�Resources�Planning�and�Management.�128�(6),�451.��
Booth,�D.�B.�(1991).�Urbanization�and�the�natural�drainage�system:�Impacts,�solutions,�and�prognoses.�The�Northwest�Environmental�Journal.�7�(1).��
Booth,�D.B.�and�Jackson,�C.R.�(1997).�Urbanization�of�aquatic�systems:�degradation�thresholds,�stormwater�detention,�and�the�limits�of�mitigation.�Journal�American�Water�Resources�Association.�35(5),�1077�1090.�
City�of�Seattle,�Seattle�Public�Utilities,�Department�of�Planning�and�Development.�(2009,�June�30).�Environmentally�Critical�Areas:�Best�Available�Science�Review.�Accessed�November�14,�2009.�Available�at�http://www.seattle.gov/dpd/static/BAS%20Review_FINAL_30JUN09_LatestReleased_DPDP017711.doc��
Environmental�Protection�Agency.�(2007).�National�management�measures�to�control�nonpoint�source�pollution�from�hydromodification.�[EPA�841�B�07�002]�Washington,�DC:�Nonpoint�Source�Control�Branch,�Office�of�Wetlands,�Oceans,�and�Watersheds,�U.S.�Environmental�Protection�Agency,�Office�of�Water.�Available�at�http://www.epa.gov/owow/nps/hydromod/pdf/Hydromod_all_web.pdf��
Environmental�Protection�Agency.�(2008,�May).�EPA’s�Report�on�the�Environment.�[EPA/600/R�07/045F]�Washington,�DC:�Environmental�Protection�Agency.��
Environmental�Protection�Agency.�(2010,�January�15).�National�Summary�of�State�Information�|�WATERS�|�US�EPA.�Accessed�January�15,�2010.�Available�at�http://iaspub.epa.gov/waters10/attains_nation_cy.control��
Environmental�Protection�Agency.�(n.d.)�Enviromapper�for�Water.�Accessed�January�13,�2010.�Available�at�http://map24.epa.gov/emr/��
Federal�Highway�Administration.��(1990).�Highways�in�the�River�Environment.�[FHWA�HI�90�016].�Washington,�DC:�Federal�Highway�Administration,�Hydraulics�Engineering.�Available�at�http://www.fhwa.dot.gov/engineering/hydraulics/pubs/hire1990.pdf��
150

Greenroads™ Manual v1.5 Environment & Water
EW-2 Runoff Flow Control
Federal�Highway�Administration.�(2008,�December�15).�Table�HM�12�–�Highway�Statistics�2007����Highway�Statistic�Series�–�Policy�Information���FHWA.�Office�of�Highway�Policy�Information.�Accessed�January�13,�2010.�Available�at�http://www.fhwa.dot.gov/policyinformation/statistics/2008/hm12.cfm���
Federal�Highway�Administration.��(2009).�Urban�Drainage�Design�Manual.�3rd�ed.�[NHI�10�009].�Washington,�DC:�Federal�Highway�Administration,�Hydraulics�Engineering.�Available�at�http://www.fhwa.dot.gov/engineering/hydraulics/pubs/10009/index.cfm���
Forman,�R.�T.�T.,�&�Alexander,�L.�E.�(1998).�Roads�and�their�major�ecological�effects.�Annual�Review�of�Ecology�and�Systematics.�29,�207.�
Granato,�G.�E.,�Zenone,�C.�&�Cazenas,�P.�A.�(2003).�The�National�highway�runoff�data�and�methodology�synthesis.�[FHWA�EP�03�054]�U.S.�Geological�Survey�for�the�Federal�Highway�Administration.�Washington,�D.C.:�U.S.�Dept.�of�Transportation,�Federal�Highway�Administration,�Office�of�Natural�and�Human�Environment.�
Gregory,�K.�J.,�&�Chin,�A.�(2002).�Urban�Stream�Channel�Hazards.�Area.�34�(3).�
Hinman,�C.�(2005).�Low�impact�development:�Technical�guidance�manual�for�Puget�Sound.�Olympia,�WA:�Puget�Sound�Action�Team.�Available�at�http://www.psparchives.com/publications/our_work/stormwater/lid/LID_manual2005.pdf��
Huber�et�al.�(2006).�NCHRP�Synthesis�565:�Evaluation�of�best�management�practices�for�highway�runoff�control.�National�Cooperative�Highway�Research�Program�(NCHRP).�Washington,�D.C.:�Transportation�Research�Board.�Available�at�http://onlinepubs.trb.org/Onlinepubs/nchrp/nchrp_rpt_565.pdf�
Karr,�J.R.�and�Dudley,�D.R.�(1981).�Ecological�perspective�on�water�quality�goals.�Environmental�Management,�5:55�68.�
Maestre,�A,�&�Pitt,�R.�(2005).�The�National�Stormwater�Quality�Database,�Version�1.1:�A�Compilation�and�Analysis�of�NPDES�Stormwater�Monitoring�Information.�Prepared�by�University�of�Alabama�and�Center�for�Watershed�Protection.�Washington,�DC:�Environmental�Protection�Agency,�Office�of�Water.��
Morrissey,�L.,�Rizzo,�D.,�Ross,�D.�&�Young,�E.�(2009,�September�30)�Quantifying�Sediment�Loading�due�to�Streambank�Erosion.�U.S.�Geological�Survey�State�Water�Resources�Research�Institute�Program.�Accessed�January�13,�2010.�Available�at�http://water.usgs.gov/wrri/09grants/2009VT44B.html�
Piguet�P,�Parriaux�A,�&�Bensimon�M.�(2008).�The�diffuse�infiltration�of�road�runoff:�an�environmental�improvement.�The�Science�of�the�Total�Environment.�397�(1�3),�1�3.�
Prince�George’s�County,�Maryland,�Department�of�Environmental�Resources.�(1999,�June).�Low�Impact�Development�Design�Strategies:�An�Integrated�Approach.�Available�at�http://www.epa.gov/owow/nps/lidnatl.pdf�
Quigley,�M.�et�al.�(2009,�October).�Urban�Stormwater�BMP�Performance�Monitoring.�Report�to�the�Environmental�Protection�Agency�and�the�Federal�Highway�Administration�by�Geosyntec�Consultants�and�Wright�Water�Engineers.�Available�at�the�International�Stormwater�BMP�Database�(BMPDB):�http://www.bmpdatabase.org.��
Southerland,�M.�(1994).�Evaluation�of�ecological�impacts�from�highway�development.�[EPA�300�B�94�006]�Dynamac�Corporation�for�the�Environmental�Protection�Agency.�Washington,�DC:�United�States�Environmental�Protection�Agency,�Office�of�Federal�Activities.�
151

Environment & Water Greenroads™ Manual v1.5
Runoff Flow Control EW-2
Strecker,�E.,�Mayo,�L.,�Quigley,�M.�and�Howell,�J.�(2001,�June).�Guidance�Manual�for�Monitoring�Water�Quality.�(FHWA�EP�01�022).�United�States�Department�of�Transportation,�Federal�Highway�Administration.�Office�of�Natural�Environment.�Washington,�DC:�United�States�Department�of�Transportation.�
Sustainable�Sites�Initiative.�(2009).�Guidelines�and�Performance�Benchmarks.�American�Society�of�Landscape�Architects,�Lady�Bird�Johnson�Wildflower�Center�at�the�University�of�Texas�at�Austin,�United�States�Botanic�Garden.��
Tilley,�J.�S.,�&�Slonecker,�E.�T.�(2006).�Quantifying�the�components�of�impervious�surfaces.�Reston,�Va:�U.S.�Geological�Survey.�
Washington�State�Department�of�Transportation�(WSDOT).�(2008).�Highway�Runoff�Manual.�[M�31�16.01]�Washington�Department�of�Transportation�Environmental�and�Engineering�Programs,�Design�Office.�Olympia,�WA:�Washington�State�Department�of�Transportation.�Available�at�http://www.wsdot.wa.gov/Environment/WaterQuality/Runoff/HighwayRunoffManual.htm��
Wilcock,�P.�R.,�Pitlick,�J.,�&�Cui,�Y.�(2009).�Sediment�transport�primer�Estimating�bed�material�transport�in�gravel�bed�rivers.�Fort�Collins,�CO:�U.S.�Dept.�of�Agriculture,�Forest�Service,�Rocky�Mountain�Research�Station.�
�
152
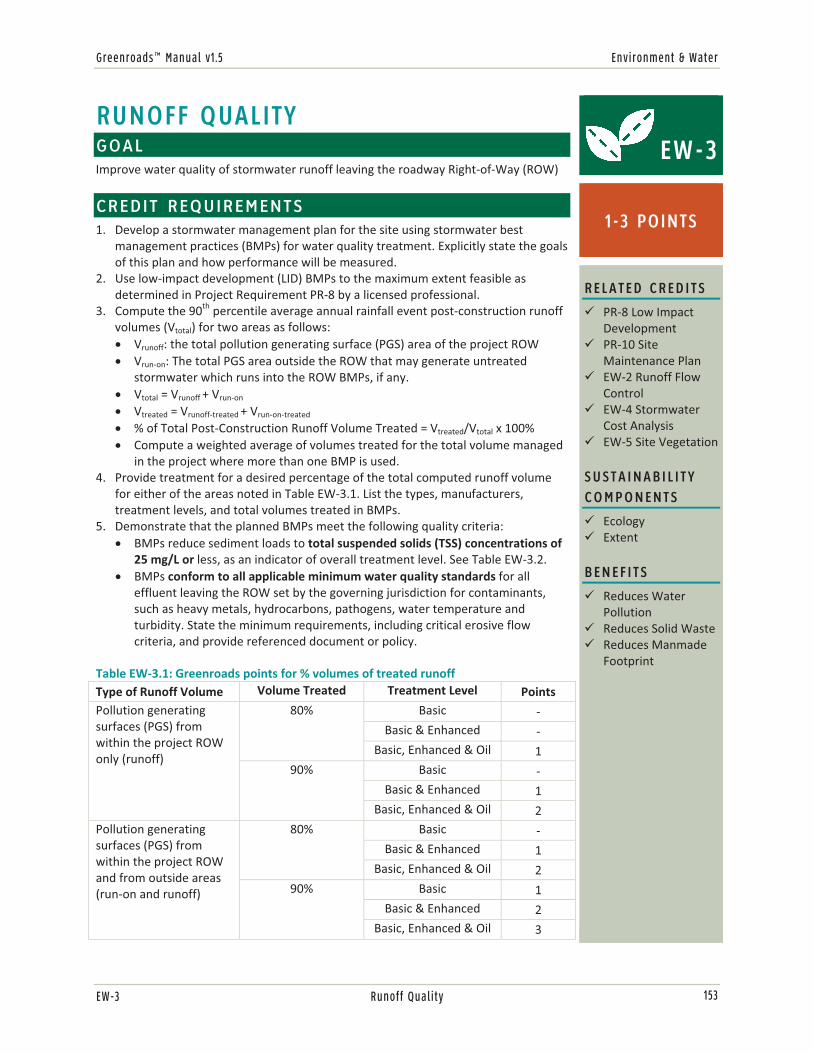
Greenroads™ Manual v1.5 Environment & Water
EW-3 Runoff Quality
RUNOFF QUALITY GOAL Improve�water�quality�of�stormwater�runoff�leaving�the�roadway�Right�of�Way�(ROW)�
CREDIT REQUIREMENTS 1. Develop�a�stormwater�management�plan�for�the�site�using�stormwater�best�
management�practices�(BMPs)�for�water�quality�treatment.�Explicitly�state�the�goals�of�this�plan�and�how�performance�will�be�measured.�
2. Use�low�impact�development�(LID)�BMPs�to�the�maximum�extent�feasible�as�determined�in�Project�Requirement�PR�8�by�a�licensed�professional.��
3. Compute�the�90th�percentile�average�annual�rainfall�event�post�construction�runoff�volumes�(Vtotal)�for�two�areas�as�follows:�� Vrunoff:�the�total�pollution�generating�surface�(PGS)�area�of�the�project�ROW�� Vrun�on:�The�total�PGS�area�outside�the�ROW�that�may�generate�untreated�
stormwater�which�runs�into�the�ROW�BMPs,�if�any.�� Vtotal�=�Vrunoff�+�Vrun�on�� Vtreated�=�Vrunoff�treated�+�Vrun�on�treated�� %�of�Total�Post�Construction�Runoff�Volume�Treated�=�Vtreated/Vtotal�x�100%�� Compute�a�weighted�average�of�volumes�treated�for�the�total�volume�managed�
in�the�project�where�more�than�one�BMP�is�used.�4. Provide�treatment�for�a�desired�percentage�of�the�total�computed�runoff�volume�
for�either�of�the�areas�noted�in�Table�EW�3.1.�List�the�types,�manufacturers,�treatment�levels,�and�total�volumes�treated�in�BMPs.�
5. Demonstrate�that�the�planned�BMPs�meet�the�following�quality�criteria:�� BMPs�reduce�sediment�loads�to�total�suspended�solids�(TSS)�concentrations�of�
25�mg/L�or�less,�as�an�indicator�of�overall�treatment�level.�See�Table�EW�3.2.�� BMPs�conform�to�all�applicable�minimum�water�quality�standards�for�all�
effluent�leaving�the�ROW�set�by�the�governing�jurisdiction�for�contaminants,�such�as�heavy�metals,�hydrocarbons,�pathogens,�water�temperature�and�turbidity.�State�the�minimum�requirements,�including�critical�erosive�flow�criteria,�and�provide�referenced�document�or�policy.�
Table�EW�3.1:�Greenroads�points�for�%�volumes�of�treated�runoff�Type�of�Runoff�Volume� Volume�Treated Treatment�Level Points�Pollution�generating�surfaces�(PGS)�from�within�the�project�ROW�only�(runoff)�
80%� Basic ��Basic�&�Enhanced ��
Basic,�Enhanced�&�Oil 1�90%� Basic ��
Basic�&�Enhanced 1�Basic,�Enhanced�&�Oil 2�
Pollution�generating�surfaces�(PGS)�from�within�the�project�ROW�and�from�outside�areas�(run�on�and�runoff)�
80%� Basic ��Basic�&�Enhanced 1�
Basic,�Enhanced�&�Oil 2�90%� Basic 1�
Basic�&�Enhanced 2�Basic,�Enhanced�&�Oil 3�
EW-3
1-3 POINTS
RELATED CREDITS
� PR�8�Low�Impact�Development�
� PR�10�Site�Maintenance�Plan�
� EW�2�Runoff�Flow�Control�
� EW�4�Stormwater�Cost�Analysis�
� EW�5�Site�Vegetation
SUSTAINABILITY COMPONENTS
� Ecology�� Extent�
BENEFITS
� Reduces�Water�Pollution�
� Reduces�Solid�Waste�� Reduces�Manmade�
Footprint�
153

Environment & Water Greenroads™ Manual v1.5
Runoff Quality EW-3
Details
This�credit�is�an�adaptation�of�the�2009�Sustainable�Sites�Initiative�Credit�3.6:�“Protect�and�enhance�water�quality”�and�the�LEED™�Green�Building�Rating�System�Sustainable�Sites�Credit�SS�6.2�“Stormwater�Design:�Quality�Control.”�It�also�draws�heavily�on�concepts�from�the�Washington�State�Department�of�Transportation�Highway�Runoff�Manual.�Continuous�modeling�approaches�are�recommended�(see�Credit�EW�2).�
If�more�than�one�BMP�is�used�in�the�project,�calculate�a�weighted�average�of�the�%�total�volume�treated�by�each�BMP�and�its�quality�achieved.�Note�that�BMPs�should�be�sized�appropriately�if�considering�any�runoff�volumes�generated�from�outside�the�project�ROW.�“Basic,”�“Enhanced”�and�“Oil”�treatment�criteria�are�defined�by�local�governing�agencies�or�by�the�Washington�State�Department�of�Transportation�(WSDOT)�Highway�Runoff�Manual,�in�absence�of�a�local�definition.�
DOCUMENTATION A�copy�of�the�executive�summary�of�the�project�drainage�design�report�that�includes,�at�minimum,�the�following:��� Short�narrative�that�addresses�each�of�the�credit�requirements.�
As�needed,�supporting�calculations�for�runoff�areas,�runoff�volume�(output�from�any�rainfall�modeling�software�used�is�adequate),�and�treatment�levels�may�be�requested.��Table�EW�3.2:�Median�of�average�influent�and�effluent�concentrations.�(Reproduced�from�table�in�Geosyntec�&�Wright�Water,�2008)�
Constituents�Sample�
Location�
Detention�Pond�
(n=25)1�
Wet�Pond�(n=46)1�
WetlandBasin�
(n=19)1�
Biofilter�(n=57)1�
Media�Filter�
(n=38)1�
Hydrodynamic�Device�(n=32)1�
Porous�Pavement�
(n=6)1�
Suspended�Solids�(mg/L)�
Influent�72.65���
(41.70�103.59)�
34.13(19.16�49.10)�
37.76(18.10�53.39)�
52.15(41.41�62.88)�
43.27(27.25�59.58)�
39.61�(21.95�76.27)�
���
Effluent�31.04���
(16.07�46.01)�
13.37(7.29�19.45)�
17.77(9.26�26.29)�
23.92(15.07�32.78)�
15.86(9.74�21.98)�
37.67�(21.28�54.02)�
16.96(5.90�48.72)�
Total�Calcium�(�g/L)�
Influent�0.71�����(0.45�
1.28)�0.49�
(0.20�0.79)�0.36�
(0.11�0.60)�0.54�
(0.40�0.67)�
0.25(0.12�0.49)�
0.74�(0.37�1.11)�
���
Effluent�0.47�����(0.25�
0.87)�0.27�
(0.12�0.61)�0.24�
(0.11�0.55)�0.30�
(0.26�0.35)�0.19�
(0.1�0.37)�0.57�
(0.25�1.33)����
Dissolved�Calcium�(�g/L)�
Influent�0.24�����(0.15�
0.33)�0.19�
(0.10�0.28)����
0.25�(0.21�0.28)�
0.16(0.11�0.21)�
0.33�(0.11�0.55)�
���
Effluent�0.25�����(0.17�
0.36)�0.11�
(0.08�0.15)����
0.21�(0.19�0.23)�
0.13(0.10�0.18)�
0.31�(0.13�0.71)�
���
Total�Copper�(�g/L)�
Influent�20.14����
(8.41�31.79)�
8.91(5.29�12.52)�
5.65(2.67�38.61)�
31.93(25.25�38.61)�
14.57(10.87�18.27)�
15.42�(9.20�21.63)�
���
Effluent�12.10����
(5.41�18.80)�6.36�
(4.70�8.01)�4.23�
(0.62�7.83)�
10.66(7.68�13.68)�
10.25(8.21�12.29)�
14.17�(8.33�20.01)�
2.78�(0.88�8.78)�
Dissolved�Copper�(�g/L)�
Influent�6.66�����(0.73�
12.59)�7.33�
(5.40�9.26)����
14.15(10.14�18.16)�
7.75(4.55�10.96)�
13.59�(9.82�17.36)�
���
Effluent�7.37�
(3.28�11.45)�4.37�
(3.73�5.73)����
8.40(5.65�11.45)�
9.00(7.28�10.72)�
13.92�(4.40�23.44)�
���
Total�Chromium�
(�g/L)�Influent�
7.36�(5.49�9.88)�
6.00(3.58�10.08)�
���5.63�
(4.49�7.05)�
2.18(1.66�2.86)�
4.07�(2.39�6.91)�
���
154
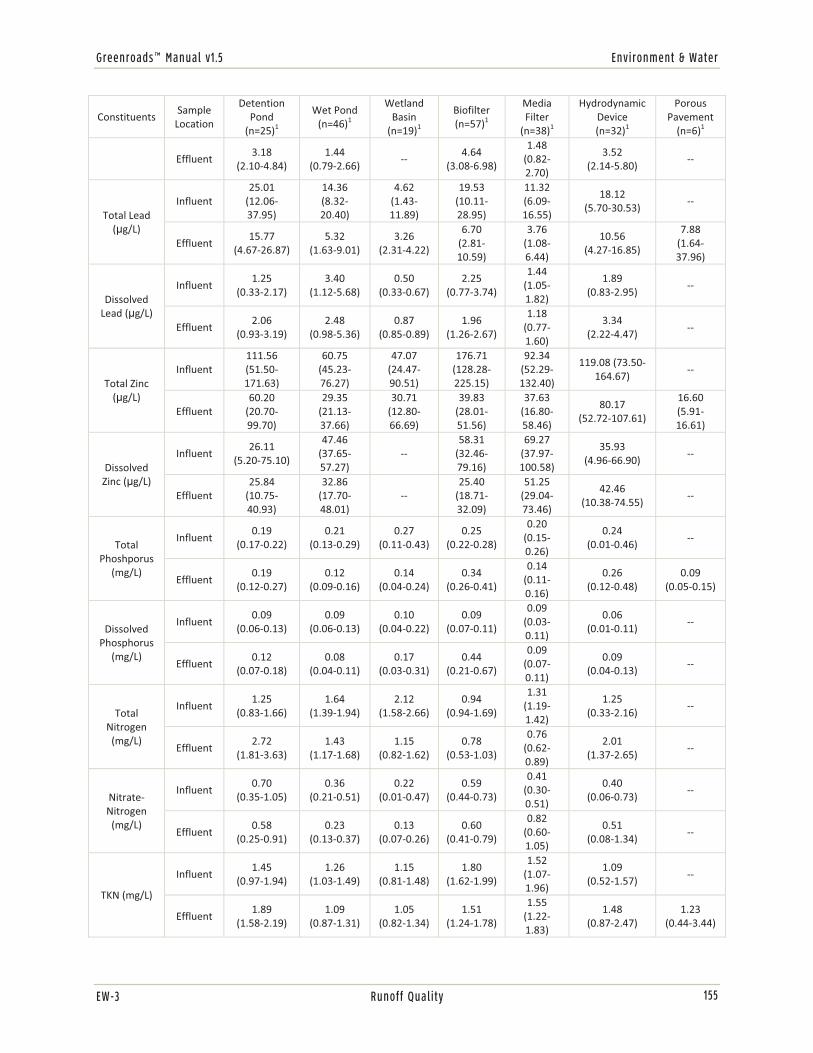
Greenroads™ Manual v1.5 Environment & Water
EW-3 Runoff Quality
Constituents�Sample�
Location�
Detention�Pond�
(n=25)1�
Wet�Pond�(n=46)1�
WetlandBasin�
(n=19)1�
Biofilter�(n=57)1�
Media�Filter�
(n=38)1�
Hydrodynamic�Device�(n=32)1�
Porous�Pavement�
(n=6)1�
Effluent�3.18�
(2.10�4.84)�1.44�
(0.79�2.66)����
4.64�(3.08�6.98)�
1.48(0.82�2.70)�
3.52�(2.14�5.80)�
���
Total�Lead�(�g/L)�
Influent�25.01�
(12.06�37.95)�
14.36(8.32�20.40)�
4.62(1.43�11.89)�
19.53(10.11�28.95)�
11.32(6.09�16.55)�
18.12�(5.70�30.53)�
���
Effluent�15.77�
(4.67�26.87)�5.32�
(1.63�9.01)�3.26�
(2.31�4.22)�
6.70(2.81�10.59)�
3.76(1.08�6.44)�
10.56�(4.27�16.85)�
7.88(1.64�37.96)�
Dissolved�Lead�(�g/L)�
Influent�1.25�
(0.33�2.17)�3.40�
(1.12�5.68)�0.50�
(0.33�0.67)�2.25�
(0.77�3.74)�
1.44(1.05�1.82)�
1.89�(0.83�2.95)�
���
Effluent�2.06�
(0.93�3.19)�2.48�
(0.98�5.36)�0.87�
(0.85�0.89)�1.96�
(1.26�2.67)�
1.18(0.77�1.60)�
3.34�(2.22�4.47)�
���
Total�Zinc�(�g/L)�
Influent�111.56�(51.50�171.63)�
60.75(45.23�76.27)�
47.07(24.47�90.51)�
176.71�(128.28�225.15)�
92.34(52.29�132.40)�
119.08�(73.50�164.67)�
���
Effluent�60.20�
(20.70�99.70)�
29.35(21.13�37.66)�
30.71(12.80�66.69)�
39.83(28.01�51.56)�
37.63(16.80�58.46)�
80.17�(52.72�107.61)�
16.60(5.91�16.61)�
Dissolved�Zinc�(�g/L)�
Influent�26.11�
(5.20�75.10)�
47.46(37.65�57.27)�
���58.31
(32.46�79.16)�
69.27(37.97�100.58)�
35.93�(4.96�66.90)�
���
Effluent�25.84�
(10.75�40.93)�
32.86(17.70�48.01)�
���25.40
(18.71�32.09)�
51.25(29.04�73.46)�
42.46�(10.38�74.55)�
���
Total�Phoshporus�
(mg/L)�
Influent�0.19�
(0.17�0.22)�0.21�
(0.13�0.29)�0.27�
(0.11�0.43)�0.25�
(0.22�0.28)�
0.20(0.15�0.26)�
0.24�(0.01�0.46)�
���
Effluent�0.19�
(0.12�0.27)�0.12�
(0.09�0.16)�0.14�
(0.04�0.24)�0.34�
(0.26�0.41)�
0.14(0.11�0.16)�
0.26�(0.12�0.48)�
0.09�(0.05�0.15)�
Dissolved�Phosphorus�
(mg/L)�
Influent�0.09�
(0.06�0.13)�0.09�
(0.06�0.13)�0.10�
(0.04�0.22)�0.09�
(0.07�0.11)�
0.09(0.03�0.11)�
0.06�(0.01�0.11)�
���
Effluent�0.12�
(0.07�0.18)�0.08�
(0.04�0.11)�0.17�
(0.03�0.31)�0.44�
(0.21�0.67)�
0.09(0.07�0.11)�
0.09�(0.04�0.13)�
���
Total�Nitrogen�(mg/L)�
Influent�1.25�
(0.83�1.66)�1.64�
(1.39�1.94)�2.12�
(1.58�2.66)�0.94�
(0.94�1.69)�
1.31(1.19�1.42)�
1.25�(0.33�2.16)�
���
Effluent�2.72�
(1.81�3.63)�1.43�
(1.17�1.68)�1.15�
(0.82�1.62)�0.78�
(0.53�1.03)�
0.76(0.62�0.89)�
2.01�(1.37�2.65)�
���
Nitrate�Nitrogen�(mg/L)�
Influent�0.70�
(0.35�1.05)�0.36�
(0.21�0.51)�0.22�
(0.01�0.47)�0.59�
(0.44�0.73)�
0.41(0.30�0.51)�
0.40�(0.06�0.73)�
���
Effluent�0.58�
(0.25�0.91)�0.23�
(0.13�0.37)�0.13�
(0.07�0.26)�0.60�
(0.41�0.79)�
0.82(0.60�1.05)�
0.51�(0.08�1.34)�
���
TKN�(mg/L)�
Influent�1.45�
(0.97�1.94)�1.26�
(1.03�1.49)�1.15�
(0.81�1.48)�1.80�
(1.62�1.99)�
1.52(1.07�1.96)�
1.09�(0.52�1.57)�
���
Effluent�1.89�
(1.58�2.19)�1.09�
(0.87�1.31)�1.05�
(0.82�1.34)�1.51�
(1.24�1.78)�
1.55(1.22�1.83)�
1.48�(0.87�2.47)�
1.23�(0.44�3.44)�
�
155
Environment & Water Greenroads™ Manual v1.5
Runoff Quality EW-3
APPROACHES & STRATEGIES
� Reduce�or�disconnect�impervious�cover,�such�as�between�lanes�with�a�vegetated�median�or�sidewalks�with�a�buffer�strip.�(Sustainable�Sites�Initiative:�SSI,�2009)�
� Provide�depression�storage�in�the�landscape�(SSI,�2009)�� Convey�stormwater�in�swales�to�promote�infiltration�(SSI,�2009)�� Use�biofiltration�to�provide�vegetated�and�soil�filtering�(SSI,�2009)�� Evapotranspire�(e.g.,�use�engineered�soils�and�vegetation�in�biofiltration�areas/landscaping�to�maximize�
evapotranspiration�potential)�(SSI,�2009)�� Infiltrate�stormwater�(infiltration�basins�and�trenches,�permeable�pavement,�etc.)�(SSI,�2009)�� Develop�and�implement�a�spill�response�plan�(SSI,�2009)�� Minimize�the�use�of�salt�for�deicing�and�consider�organic�deicers�or�sand�instead�(SSI,�2009)�� Use�a�“treatment�train”�of�many�BMPs�in�series.�(SSI,�2009)�� Use�a�stormwater�treatment�system�or�BMPs�that�have�been�demonstrated�to�achieve�the�25�milligrams/liter�
TSS�discharge.�Some�of�these�are�(SSI,�2009):�
� Water�quality�wet�ponds�� Constructed�stormwater�wetlands�� Bioretention�� Biofiltration�(e.g.,�raingardens)�� Vegetated�buffer�strips�� Sand�filters�� Bioswales�(usually�most�effective�as�the�first�in�line�of�a�treatment�train)�� Other�BMPs�like�vaults�and�pretreatment�or�mechanical�separators�may�not�be�able�to�earn�this�credit�alone�
but�could�be�used�in�a�treatment�train�effectively.�
� Perform�regular�inspections�and�monitoring�activities�to�ensure�long�term�performance.�This�includes�visual�inspection�of�controls.�(EPA,�1995)�
� Clean�out�accumulated�sediment�regularly.�(EPA,�1995)�� Replace�old�fabrics,�filters�and�other�materials�as�they�deteriorate�to�maintain�BMP�effectiveness.�(EPA,�1995)�� Remove�temporary�BMPs�used�in�construction�and�replace�them�with�permanent�controls.�(EPA,�1995)�� Seed�with�grass�and�compost�amended�mulch�or�soil�to�develop�vegetation�and�provide�stabilized�slopes.�(EPA,�
1995)�� Use�wildflower�cover�to�provide�erosion�control�and�aesthetic�benefits.�(EPA,�1995)�� Use�established�grass�sod�blankets�on�prepared�soils.�(EPA,�1995)�� Design�the�roadway�facility�for�treatment�using�grassed�swales,�check�dams,�filter�strips,�terracing,�infiltration�
trenches�and/or�basins.�(EPA,�1995)�� Consider�constructed�wetlands�for�increased�quality�and�new�provision�of�habitat.�(EPA,�1995)�� Set�performance�goals�for�basic�treatment�(i.e.�80%�removal�of�TSS),�enhanced�treatment�(i.e.�metals�removal)�
and�oil�or�phosphorous�control.�(Washington�State�Department�of�Transportation:�WSDOT,�2008)��� Consider�infiltration�slopes�(Piguet,�Parriaux�&�Bensimon�2008)�and�“Ecology�ditches”�(City�of�Seattle,�2009)�
(these�are�similar�approaches�using�compost�amended�soils�for�promoting�infiltration�and�pollutant�removal).�� Consider�geometric�design�for�erosion�control�and�flow�moderation�(EPA,�2007)�
Example: City of Kirkland 120th Street Extension
The�City�of�Kirkland�proposes�to�extend�NE�120th�Street�one�city�block�between�124th�Avenue�NE�to�Slater�Avenue�NE.�Improvements�include�the�approximate�0.16�mile�extension�of�NE�120th�Street,�complete�with�5�foot�sidewalks,�5�foot�bicycle�lanes�in�each�direction,�4.5�foot�planter�strips,�and�continuous�two�way�left�turn�lanes�at�each�intersection.�
156
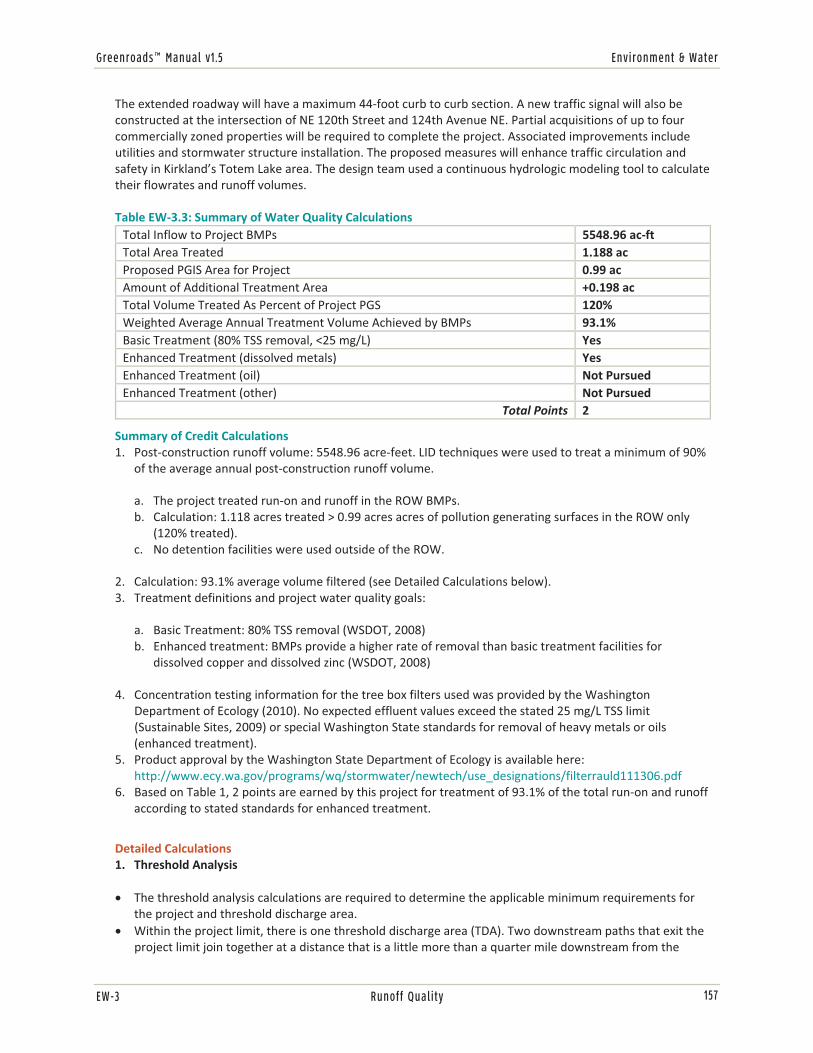
Greenroads™ Manual v1.5 Environment & Water
EW-3 Runoff Quality
The�extended�roadway�will�have�a�maximum�44�foot�curb�to�curb�section.�A�new�traffic�signal�will�also�be�constructed�at�the�intersection�of�NE�120th�Street�and�124th�Avenue�NE.�Partial�acquisitions�of�up�to�four�commercially�zoned�properties�will�be�required�to�complete�the�project.�Associated�improvements�include�utilities�and�stormwater�structure�installation.�The�proposed�measures�will�enhance�traffic�circulation�and�safety�in�Kirkland’s�Totem�Lake�area.�The�design�team�used�a�continuous�hydrologic�modeling�tool�to�calculate�their�flowrates�and�runoff�volumes.�
Table�EW�3.3:�Summary�of�Water�Quality�CalculationsTotal�Inflow�to�Project�BMPs� 5548.96�ac�ftTotal�Area�Treated� 1.188�ac�Proposed�PGIS�Area�for�Project�� 0.99�ac�Amount�of�Additional�Treatment�Area +0.198�ac�Total�Volume�Treated�As�Percent�of�Project�PGS 120%�Weighted�Average�Annual�Treatment�Volume�Achieved�by�BMPs 93.1%�Basic�Treatment�(80%�TSS�removal,�<25�mg/L) Yes�Enhanced�Treatment�(dissolved�metals) Yes�Enhanced�Treatment�(oil)� Not�Pursued�Enhanced�Treatment�(other)� Not�Pursued�
Total�Points 2�
Summary�of�Credit�Calculations�1. Post�construction�runoff�volume:�5548.96�acre�feet.�LID�techniques�were�used�to�treat�a�minimum�of�90%�
of�the�average�annual�post�construction�runoff�volume.�
a. The�project�treated�run�on�and�runoff�in�the�ROW�BMPs.�b. Calculation:�1.118�acres�treated�>�0.99�acres�acres�of�pollution�generating�surfaces�in�the�ROW�only�
(120%�treated).�c. No�detention�facilities�were�used�outside�of�the�ROW.�
2. Calculation:�93.1%�average�volume�filtered�(see�Detailed�Calculations�below).�3. Treatment�definitions�and�project�water�quality�goals:�
a. Basic�Treatment:�80%�TSS�removal�(WSDOT,�2008)�b. Enhanced�treatment:�BMPs�provide�a�higher�rate�of�removal�than�basic�treatment�facilities�for�
dissolved�copper�and�dissolved�zinc�(WSDOT,�2008)�
4. Concentration�testing�information�for�the�tree�box�filters�used�was�provided�by�the�Washington�Department�of�Ecology�(2010).�No�expected�effluent�values�exceed�the�stated�25�mg/L�TSS�limit�(Sustainable�Sites,�2009)�or�special�Washington�State�standards�for�removal�of�heavy�metals�or�oils�(enhanced�treatment).�
5. Product�approval�by�the�Washington�State�Department�of�Ecology�is�available�here:�http://www.ecy.wa.gov/programs/wq/stormwater/newtech/use_designations/filterrauld111306.pdf�
6. Based�on�Table�1,�2�points�are�earned�by�this�project�for�treatment�of�93.1%�of�the�total�run�on�and�runoff�according�to�stated�standards�for�enhanced�treatment.�
Detailed�Calculations�1. Threshold�Analysis�
� The�threshold�analysis�calculations�are�required�to�determine�the�applicable�minimum�requirements�for�the�project�and�threshold�discharge�area.�
� Within�the�project�limit,�there�is�one�threshold�discharge�area�(TDA).�Two�downstream�paths�that�exit�the�project�limit�join�together�at�a�distance�that�is�a�little�more�than�a�quarter�mile�downstream�from�the�
157

Environment & Water Greenroads™ Manual v1.5
Runoff Quality EW-3
project�site,�at�a�wetland.�This�flow�discharges�into�a�culvert�to�Totem�Lake. These�two�systems�are�hydraulically�connected�because�the�water�level�at�the�quarter�mile�point�is�that�the�level�of�Totem�Lake.�
2. Assumptions�
� All�roadway�areas�are�considered�pollutant�generating�impervious�surface�(PGIS),�sidewalks�as�non�pollution�generating�impervious�surface�(NPGIS),�and�planter�strip�and�other�landscape�as�non�pollution�generating�pervious�surface�(NPGPS).�
� Rubblized�pavement�left�in�place�and�paved�over�is�not�considered�replaced�pavement.�
3. Definitions�(from�Table�3�1�of�the�2008�WSDOT�Highway�Runoff�Manual)�
Basic�Treatment�� Applies�to�all�project�threshold�discharge�areas�(TDAs)�where�runoff�treatment�threshold�is�met�
(project�adds�5000�sf�or�more�of�PGIS)�
Performance�Goal:�80%�removal�of�total�suspended�solids�(TSS)�
Enhanced�Treatment�(dissolved�metals)�� Applies�to�all�project�threshold�discharge�areas�(TDAs)�where�runoff�treatment�threshold�is�met�
(project�adds�5000�sf�or�more�of�PGIS)�� Does�not�discharge�to�Basic�Treatment�receiving�water�body��� Applies�to�roadways�within�Urban�Growth�Areas�(UGAs)�with�Average�Daily�Trip�(ADT)���7,500�(For�this�
project�area,�ADT�is�8700)�
Performance�Goal:�Provide�a�higher�rate�of�removal�of�dissolved�metals�than�Basic�Treatment�facilities�for�influent�concentrations�ranging�from�0.003�to�0.02�mg/L�for�dissolved�copper�and�0.02�0.3�mg/L�for�dissolved�zinc.�
4. Pervious�and�Impervious�Area�Calculations�
� Tabulated�calculations�are�shown�in�Tables�EW�3.4�and�EW�3.5.�
Table�EW�3.4:�Impervious�area�summary�Category� Area�(sf) Area�(Acres)Existing�Impervious� 35,240 0.81New�Impervious� 22,140 0.51Replaced�Impervious� 9,735 0.22Removed�Impervious� 1,647 0.04Proposed�Impervious� 55,733 1.28Effective�Impervious� 31,875 0.73
�Table�EW�3.5:�PGIS�summary�Category� Area�(sf) Area�(Acres)Existing�PGIS� 34,201 0.79New�PGIS� 16,404 0.38Replaced�PGIS� 4,321 0.10Removed�PGIS� 7,646 0.18Proposed�PGIS� 42,959 0.99Effective�PGIS� 16,404 0.38
��
158

Greenroads™ Manual v1.5 Environment & Water
EW-3 Runoff Quality
5. Minimum�Requirements�from�2008�WSDOT�Highway�Runoff�Manual�(HRM)
Figures�3.1,�3.2,�and�3.3�of�the�HRM�are�used�to�determine�the�minimum�requirements�applicable�for�a�project.*�Section�3�2.2�of�the�HRM�lists�possible�exceptions�for�this�project.**�No�special�exceptions�apply,�so�minimum�requirements�1�9�of�the�HRM�states�that�new�pollution�generating�impervious�surface�must�provide�water�quality�treatment�meeting�the�stated�performance�goals�for�basic�and�enhanced�treatment.�
6. Calculate�the�Predeveloped�and�Developed�Runoff�Areas***�
A�continuous�modeling�software�tool�was�used�to�calculate�the�total�area�in�the�right�of�way�(ROW)�and�the�tributary�areas�providing�run�on�into�project�stormwater�treatment�facilities.�See�Table�EW�3.6.�
Table�EW�3.6:�Total�predeveloped�and�developed�runoff�area�Subbasin�Number� Total�Area�(Acres)
Predeveloped DevelopedSubbasin�1� 0.770 23.850Subbasin�2� 0.770 0.770
�7. Calculate�Predevelopment�Flowrate�
Predevelopment�flowrate�was�computed�using�a�2�year�recurrence�interval�for�onsite�(0.016�cfs)�and�offsite�flows�(2.640�cfs).�
8. Calculate�Post�Construction�Runoff�Volume�
The�total�inflow�volume�to�project�stormwater�treatment�facilities�from�Subbasin�1�was�computed�to�be�5549�acre�feet.�There�was�no�change�in�runoff�area�from�Subbasin�2.�
9. Identify�Types�of�Stormwater�Best�Management�Practices�(BMPs)�To�Be�Used�
Five�subsurface�biorention�systems�(tree�box�filters)****�were�selected�by�the�project�team�for�treating�stormwater�runoff�and�run�on.�See�Figure�EW�3.1.�
10. Select�Locations�BMPs�and�Compute�Treatment�Levels�for�Stormwater�Volumes�
The�weighted�average�annual�treatment�for�water�quality�on�the�project�was�93.1%�for�runoff�and�run�on.�See�Table�EW�3.7�for�computations.�
Table�EW�3.7:�Runoff�area�treated�by�the�tree�box�filters�Area�Extents� Area�(ac) Infiltration*�(%)�
Station�160+50�to�102+73�(north�half)� 0.244 91.4�Station�160+50�to�102+73�(south�half) 0.284 91.1�Station�108�+50�to�160+50�(south)� 0.183 94.9�Station�102+73�to�Station�100+00�(south) 0.236 95.4�Station�102+73�to�Station�100+00�(north) 0.241 93.5�
Weighted�Average 93.1�Notes:�*These�figures�make�up�a�decision�tree�used�to�guide�the�engineer�in�the�applicable�minimum�requirements�when�designing�a�stormwater�management�facility�based�on�known�surface�areas,�relative�perviousness,�and�pollution�generating�capacity.�**�Generally,�if�the�amount�of�impervious�surfaces�is�greater�than�a�specified�minimum�value,�certain�requirements�must�be�applied�to�that�impervious�surface.��These�values�are�called�“minimum�requirements.”�***�This�calculation�and�the�following�calculations�were�completed�using�the�Western�Washington�Hydrology�Model�(WWHM),�a�continuous�modeling�software�tool.�****These�treatment�systems�have�underdrains�in�place�that�bypass�excess�runoff�into�a�detention�vault�during�higher�intensity�events.�
159

Environment & Water Greenroads™ Manual v1.5
Runoff Quality EW-3
�
�Figure�EW�3.1:�Tree�box�filter�schematic�
(http://www.ladstudios.com/LADsites/Sustainability/Strategies/images/treebox�Model.jpg)� Example: Streetside Bioswale
Installed�as�part�of�the�Street�Edge�Alternatives�(SEA�Street)�Project�by�the�City�of�Seattle,�the�bioswale�pictured�below�in�Figure�EW�3.2�is�an�example�of�a�structural�stormwater�control�for�water�quality�treatment.�The�bioswales�on�SEA�Street�successfully�mitigate�98%�of�the�rainy�season�stormwater�and�100%�of�the�dry�season�water.�This�detention�based�approach�achieves�quality�treatment�primarily�through�control�of�flow�volumes�and�infiltration.�Additionally,�there�are�six�detention�facilities�which�allow�for�a�treatment�train�for�any�stormwater�that�enters�the�conventional�infrastructure.�Quality�treatment�is�provided�by�plant�uptake�and�compost�amended�soils�that�help�treat�street�runoff�and�remove�heavy�metals.�A�virtual�tour�of�SEA�Street�is�available�at�http://www2.cityofseattle.net/util/tours/seastreet/slide1.htm.�More�information�about�Seattle’s�Natural�Drainage�System�program�(including�other�projects)�is�also�available�at:�http://www.seattle.gov/util/About_SPU/Drainage_&_Sewer_System/GreenStormwaterInfrastructure/NaturalDrainageProjects/index.htm��
160
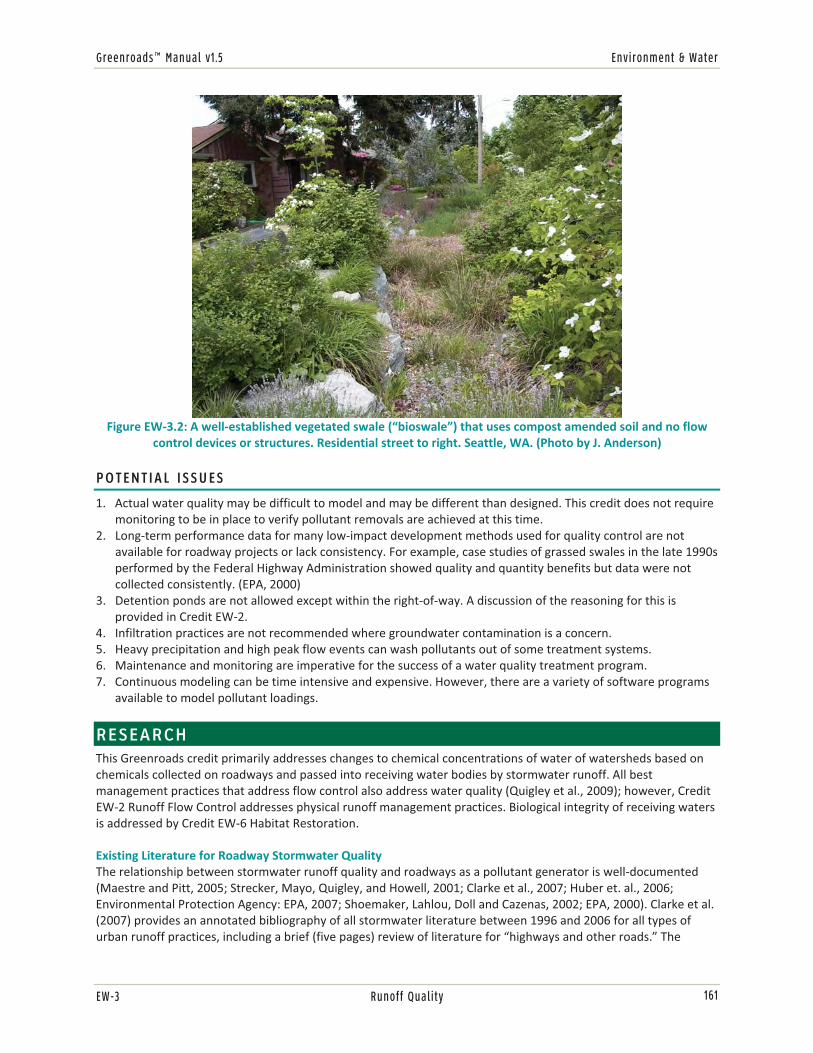
Greenroads™ Manual v1.5 Environment & Water
EW-3 Runoff Quality
�Figure�EW�3.2:�A�well�established�vegetated�swale�(“bioswale”)�that�uses�compost�amended�soil�and�no�flow�
control�devices�or�structures.�Residential�street�to�right.�Seattle,�WA.�(Photo�by�J.�Anderson)��
POTENTIAL ISSUES
1. Actual�water�quality�may�be�difficult�to�model�and�may�be�different�than�designed.�This�credit�does�not�require�monitoring�to�be�in�place�to�verify�pollutant�removals�are�achieved�at�this�time.�
2. Long�term�performance�data�for�many�low�impact�development�methods�used�for�quality�control�are�not�available�for�roadway�projects�or�lack�consistency.�For�example,�case�studies�of�grassed�swales�in�the�late�1990s�performed�by�the�Federal�Highway�Administration�showed�quality�and�quantity�benefits�but�data�were�not�collected�consistently.�(EPA,�2000)�
3. Detention�ponds�are�not�allowed�except�within�the�right�of�way.�A�discussion�of�the�reasoning�for�this�is�provided�in�Credit�EW�2.�
4. Infiltration�practices�are�not�recommended�where�groundwater�contamination�is�a�concern.�5. Heavy�precipitation�and�high�peak�flow�events�can�wash�pollutants�out�of�some�treatment�systems.�6. Maintenance�and�monitoring�are�imperative�for�the�success�of�a�water�quality�treatment�program.�7. Continuous�modeling�can�be�time�intensive�and�expensive.�However,�there�are�a�variety�of�software�programs�
available�to�model�pollutant�loadings.�
RESEARCH This�Greenroads�credit�primarily�addresses�changes�to�chemical�concentrations�of�water�of�watersheds�based�on�chemicals�collected�on�roadways�and�passed�into�receiving�water�bodies�by�stormwater�runoff.�All�best�management�practices�that�address�flow�control�also�address�water�quality�(Quigley�et�al.,�2009);�however,�Credit�EW�2�Runoff�Flow�Control�addresses�physical�runoff�management�practices.�Biological�integrity�of�receiving�waters�is�addressed�by�Credit�EW�6�Habitat�Restoration.�
Existing�Literature�for�Roadway�Stormwater�Quality�The�relationship�between�stormwater�runoff�quality�and�roadways�as�a�pollutant�generator�is�well�documented�(Maestre�and�Pitt,�2005;�Strecker,�Mayo,�Quigley,�and�Howell,�2001;�Clarke�et�al.,�2007;�Huber�et.�al.,�2006;�Environmental�Protection�Agency:�EPA,�2007;�Shoemaker,�Lahlou,�Doll�and�Cazenas,�2002;�EPA,�2000).�Clarke�et�al.�(2007)�provides�an�annotated�bibliography�of�all�stormwater�literature�between�1996�and�2006�for�all�types�of�urban�runoff�practices,�including�a�brief�(five�pages)�review�of�literature�for�“highways�and�other�roads.”�The�
161

Environment & Water Greenroads™ Manual v1.5
Runoff Quality EW-3
National�Cooperative�Highway�Research�Program�(NCHRP)�Report�565�(Huber�et�al.�2006)�provides�another�excellent�reference�specifically�relevant�for�roadways�using�low�impact�development�approaches�for�stormwater�quality�management�(and�flow�control)�in�a�highway�environment.�The�reader�is�referred�to�these�documents�for�more�detailed�information.�A�brief�introduction�of�roadway�water�quality�issues�is�presented�below,�including�an�overview�of�stormwater�treatment�objectives,�terminology,�impacts�and�types�of�pollutants�and�some�recommended�LID�controls�for�runoff�treatment.�
What�is�Non�Point�Source�Pollution?�The�EPA�identifies�roadways,�in�their�operational�phases,�as�non�point�source�pollution�generators,�which�means�that�the�source�of�the�pollutants�is�diffuse�(EPA,�2010a).�Non�point�source�runoff�comes�from�rain�or�snowmelt�that�washes�over�surfaces,�collecting�and�transporting�particles,�which�vary�in�human�and�environmental�toxicity,�into�receiving�bodies�of�water.�Pollutants�are�collected�on�impervious�surfaces�through�a�variety�of�processes�such�as�tire�wear,�erosion�of�pavement�surfaces�and�embankments,�atmospheric�deposition�and�routine�maintenance�of�roadways.�The�regulatory�framework�that�governs�non�point�source�pollution�in�the�U.S.�includes�(Shoemaker,�Lahlou,�Doll,�and�Cazenas,�2002):�
� National�Environmental�Policy�Act�(NEPA)�� Clean�Water�Act:�National�Pollutant�Discharge�Elimination�System�(NPDES)�� Clean�Water�Act:�Nonpoint�Source�Pollution�Control�Program�� Coastal�Zone�Act�Reauthorization�Amendments�(CZARA)�� Other�state�and�local�regulatory�requirements.�
Water�Quality�Treatment�Objectives�The�primary�concerns�with�non�point�source�runoff�are�generation�and�transport�of�pollutants,�habitat�degradation,�habitat�loss,�loss�of�biodiversity,�and�preservation�of�beneficial�use�(such�as�drinking�water�supplies)�(EPA,�2010a;�Southerland,�1994)�Federal�guidance�is�intended�to�meet�the�following�objectives�(EPA,�2005)�
� Protect�sensitive�ecosystems,�including�wetlands�and�estuaries,�by�minimizing�road��and�bridge�related�impacts�and�water�crossings,�and�by�establishing�protective�measures�including�setbacks�during�construction�
� Reduce�the�runoff�of�pollutants�through�the�use�and�proper�maintenance�of�structural�controls�� Reduce�the�generation�of�pollutants�from�maintenance�operations�by�minimizing�the�use�of�pesticides,�
herbicides,�fertilizers,�and�deicing�salts�and�chemicals�� Reduce�the�generation�and�runoff�of�pollutants�during�highway�and�bridge�repair�operations�by�decreasing�
the�use�of�hazardous�materials�and�incorporating�practices�to�prevent�spillage�into�sensitive�areas.�
Many�states�have�water�quality�objectives�that�align�with�federal�regulatory�compliance�with�the�Clean�Water�Act�and�intend�to�protect�state�water�resources.�Some�examples�from�the�Washington�State�Department�(WSDOT)�Highway�Runoff�Manual�(2008)�are:�
� Prevent�pollution�of�state�waters�and�protect�water�quality,�including�compliance�with�state�water�quality�standards.�
� Satisfy�state�requirements�for�all�known�available�and�reasonable�methods�of�prevention,�control,�and�treatment�of�wastes�prior�to�discharge�to�waters�of�the�state.�
� Satisfy�the�federal�technology�based�treatment�requirements�under�40�CFR�Part�125.3.�
Water�Quality�Treatment�Terminology�Non�point�source�pollution�can�be�managed�through�a�variety�of�“structural”�and�“non�structural”�controls.�These�are�typically�referred�to�as�“best�management�practices”�(BMPs)�or�“integrated�management�practices”�(IMPs),�and�sometimes�simply�as�“stormwater�controls”�or�“stormwater�control�measures”�(SCM)�(Quigley�et�al.�2009).�For�the�purposes�of�Greenroads,�the�term�BMP�is�used,�as�are�the�definitions�of�structural�and�non�structural�controls�provided�by�the�International�Stormwater�Best�Management�Practices�Database�(ibid.)�A�stormwater�quality�BMP�
162

Greenroads™ Manual v1.5 Environment & Water
EW-3 Runoff Quality
is�a�“device,�practice�or�method�for�removing,�reducing,�retarding�or�preventing�targeted�stormwater�runoff�constituents,�pollutants�and�contaminants�from�reaching�receiving�waters”�(ibid.)�There�are�five�types�of�structural�controls�that�are�defined�based�on�their�inflow�and�outflow�characteristics.�They�are�(ibid.):�
� Type�I.�BMPs�with�well�defined�inlets�and�outlets�(e.g.,�detention�basins,�vegetated�swales,�catch�basin�inserts).�These�are�the�“easy”�BMPs�to�monitor�where�inflow�and�outflow�can�typically�be�paired�to�assess�performance.�In�the�case�of�systems�such�as�wet�ponds�with�substantial�residence�times�or�storage�volumes,�data�may�be�straightforward�to�collect,�but�challenging�to�evaluate�for�individual�storms.�In�such�cases,�a�seasonal�mass�balance�approach�is�often�more�appropriate�than�a�storm�based,�paired�influent�effluent�approach�because�it�is�likely�that�the�effluent�sample�for�small�storms�is�displaced�water�originating�from�prior�events.��
� �Type�II.�BMPs�with�well�defined�inlets,�but�not�outlets�(e.g.,�infiltration�basins,�infiltration�trenches,�bioretention�cells).�Monitoring�strategies�for�these�BMPs�are�more�complex�and�may�involve�sampling�of�underdrains,�vadose�(unsaturated)�zone�monitoring,�groundwater�monitoring,�measuring�infiltration�rates�and�surface�overflow.�At�a�minimum,�the�influent�and�surface�overflow�must�be�quantified,�since�the�difference�between�the�two�should�represent�the�volume�infiltrated.�If�an�underdrain�is�used�to�direct�partially�treated�water�back�to�the�surface�drainage,�then�it�should�also�be�monitored.�Evaluation�of�data�from�these�types�of�studies�should�focus�on�mass�balance�approaches.��
� �Type�III.�BMPs�with�well�defined�outlets,�but�not�inlets�(e.g.,�grass�swales�where�inflow�is�overland�flow�along�the�length�of�the�swale,�buffer�strips,�green�roofs).��
� �Type�IV.�BMPs�without�any�well�defined�inlets�or�outlets�and/or�institutional�BMPs�(e.g.,�buffer�strips,�basin�wide�catch�basin�retrofits,�education�programs,�source�control�programs,�disconnected�impervious�area�practices).�
� Type�V.�Low�Impact�Development�(LID)/Distributed�Controls/Overall�Site�Designs�where�some�defined�monitoring�locations�are�available�that�may�include�monitoring�of�individual�practices�within�a�development,�in�combination�with�an�overall�site�monitoring�mechanism.�
Effective�communication�is�necessary�to�meet�stormwater�management�quality�objectives,�so�it�is�useful�to�compare�other�definitions�of�some�terms�that�are�available�in�some�related�guidance�documents�and�within�Greenroads.�The�term�BMP�is�used�more�broadly�in�Greenroads�in�reference�to�many�of�the�activities�involved�in�meeting�the�Project�Requirements�and�Voluntary�Credits,�and�does�not�necessarily�always�refer�to�a�water�quality�objective.�BMPs�can�be�temporary�(such�as�erosion�control�during�construction)�or�permanent,�such�as�those�BMPs�addressed�in�this�credit.�This�credit�addresses�structural�controls�for�quality�treatment.�Non�structural�controls�for�operations�and�maintenance�and�temporary�BMPs�for�construction�are�covered�in�the�Project�Requirements�and�Construction�Activities�categories.�
Table�EW�3.8�compares�the�definitions�used�in�some�current�stormwater�management�guidance�and�other�sustainability�rating�systems�that�are�sometimes�applied�to�roadways�and�infrastructure.�It�is�particularly�important�to�note�the�discrepancies�between�the�2009�LEED™�Rating�System�(LEED),�two�separate�documents�from�the�same�agency�(the�FHWA),�and�the�guidance�referenced�by�Greenroads�in�the�BMPDB�(also�used�in�Huber�et�al.�2006).�Notably,�LEED�appears�to�use�the�term�“non�structural”�to�mean�“biological”�or�“vegetated,”�which�matches�the�most�recent�guidance�from�the�FHWA.�However,�the�FHWA�appears�to�use�the�term�“structural”�control�to�describe�BMPs�that�provide�what�is�normally�called�“enhanced�treatment”�filters�or�“oil�control”�facilities��which�are�usually�small�or�moderately�sized�mechanical�filters�or�separators�that�parse�surface�oils�and�grease�from�settled�sediments�(City�of�Seattle,�2009).�Furthermore,�the�FHWA�confusingly�uses�the�term�“ultra�urban”�to�refer�to�what�is�equivalent�in�most�site�development�guidance�documents�to�mean�LID�techniques.�(See�Project�Requirement�PR�8�Low�Impact�Development).�This�is�probably�an�attempt�to�distinguish�standard�highway�drainage�practices�such�as,�for�example,�“grassed�swales”�(which�generally�means�long,�vegetated,�generally�non�engineered�outside�of�flow�control�sizing,�non�maintenance�intensive�roadside�ditches)�from�“bioswales”�(which�generally�means�small,�decentralized,�engineered�and�deliberately�vegetated�for�water�quality�treatment�and�flow�control,�not�necessarily�maintenance�intensive�roadside�ditches).�Greenroads�uses�the�term�LID�for�consistency�across�credits�and�requirements.�
163

Environment & Water Greenroads™ Manual v1.5
Runoff Quality EW-3
Table�EW�3.8:�Varying�Definitions�of�Stormwater�Treatment�Controls�in�Select�Guidance�Documents�Source� Structural�Control Non�Structural�Control�2009�LEED™��Rating�System�(USGBC,�2009)�
“Structural�measures,�such�as�rainwater�cisterns,�manhole�treatment�devices�and�ponds�can�be�used�to�remove�pollutants�from�runoff�from�impervious�areas�and�sometimes�reuse�the�water�for�irrigation�or�building�flush�fixtures….Structural�measures�are�preferred�on�urban�or�constrained�sites�and�make�it�possible�to�effectively�clean�the�runoff�with�minimal�space�allocation�and�land�use.�For�existing�sites�with�greater�than�50%�imperviousness,�structural�techniques�may�include�restoration�and�repair�of�deteriorated�storm�sewers,�or�separation�of�combined�sewers.”�
“Non�structural�strategies,�such�as�vegetated�swales,�disconnection�of�impervious�areas,�and�pervious�pavement,�can�be�used�to�infiltrate�and�limit�runoff.�In�these�cases�you�are�‘capturing�and�treating’�runoff�by�allowing�it�to�naturally�filter�into�the�soil�and�vegetation.�Pollutants�are�broken�down�by�microorganisms�in�the�soil�and�the�plants….Non�structural�methods�are�often�preferred�because�they�may�be�less�costly�to�construct�and�maintain�and�they�help�recharge�groundwater�supplies.”�
2009�Sustainable�Sites�Initiative�
Not�explicitly�defined Not explicitly defined�
2009�National�Highway�Institute/Federal�Highway�Administration�Urban�Drainage�Manual��
“…these�engineered�devices�are�typically�structural�and�are�made�on�a�production�line�in�a�factory.”�
Vegetative�practices�such�as�grassed�swales,�filter�strips�and�wetlands�“are�non�structural�BMPs�and�are�significantly�less�costly�than�structural�controls”�
2002�Federal�Highway�Administration�Stormwater�Best�Management�Practices�in�an�Ultra�Urban�Setting�(Shoemaker,�Lahlou,�Doll�and�Cazenas)�
Infiltration�technologies,�including�bioretention,�ponds�and�pond/wetland�combinations,�enhanced�treatment�systems,�filtering�systems,�vegetated�swales�and�filter�strips,�water�quality�inlets,�porous�pavements�
Streetsweeping,�source�controls
2009�Stormwater�BMP�Monitoring�Manual�(Quigley�et�al.�2009),�Greenroads�
“Structural�BMPs�include�a�variety�of�practices�that�rely�on�a�wide�range�of�hydrologic,�physical,�biological,�and�chemical�processes�to�improve�water�quality�and�manage�runoff.��
“Non�structural�BMPs�such�as�education�and�source�control�ordinances�typically�depend�on�a�combination�of�behavioral�change�and�enforcement.”�
Impacts�of�Pollutants�in�Roadway�Runoff�Few�stormwater�quality�management�approaches�consider�the�aggregate�and�systemic�impacts�to�the�full�reach�of�a�water�course,�let�alone�the�watershed�(Wilcock,�Pitlick�and�Cui,�2009).�As�discussed�in�Credit�EW�2�Runoff�Flow�Control,�impervious�surfaces�are�directly�related�to�runoff�volumes.�These�volumes�of�runoff�carry�pollutants�into�receiving�water�bodies,�such�as�rivers�and�streams,�bays,�wetlands�and�ocean�environments.�Tilley�and�Slonecker�(2006)�determined�that�imperviousness�as�low�as�one�percent�can�cause�an�aquatic�ecosystem�area�to�be�labeled�as�“stressed”�and�up�to�25%�imperviousness�can�cause�“irreversible�environmental�degradation.”�They�also�show�that�roads�and�sidewalks�comprise�up�to�33%�of�the�impervious�area�in�average�suburban�and�urban�environments,�while�in�rural�environments,�nearly�all�of�the�impervious�area�is�due�to�roadways�(Maestre�and�Pitt�,�2005).�The�pollutants�generated�from�roadways�in�areas�of�existing�watershed�impairment�are�monitored�and�managed�by�water�quality�programs�through�the�EPA�or�authorized�state�or�local�agencies.�
Total�Maximum�Daily�Loads�and�Roads�The�EPA�gathers�statistics�on�water�quality�for�a�variety�of�water�bodies�as�part�of�the�ongoing�water�quality�program�called�Assessment�Total�Maximum�Daily�Load�(TMDL)�Tracking�and�Implementation�System�(ATTAINS),�which�is�regulated�through�sections�305(b)�and�303(d)�of�the�Clean�Water�Act�(EPA,�2009b).��Reporting�is�required�from�states�with�non�attainment�water�bodies�(those�exceeding�their�TMDLs)�every�two�years�until�
164

Greenroads™ Manual v1.5 Environment & Water
EW-3 Runoff Quality
attainment�is�reached�for�each�assessed�pollutant�(EPA,�2009a).�Roadways�are�part�of�TMDL�computations�as�they�are�considered�to�be�non�point�contributors�of�pollution�(they�are�counted�as�part�of�the�total�load�allocation�for�effluent)�–�the�contribution�is�based�on�total�contributing�area�or�length�in�a�watershed.�Table�EW�3.9�was�constructed�from�the�current�TMDL�statistics�listed�in�the�ATTAINS�database.�For�example,�of�the�26%�of�the�assessed�mileage�of�U.S.�rivers�and�streams�receiving�roadway�runoff,�over�50%�are�considered�impaired�and�threatened.�Impaired�water�bodies�are�those�that�have�not�met�the�quality�criteria�for�one�or�more�of�its�assessed�beneficial�uses,�whereas�threatened�water�bodies�meet�all�assessed�beneficial�uses�but�demonstrate�an�apparent�decline�in�water�quality�(EPA,�2008).�
According�to�ATTAINS,�some�states�have�reported�roadways�as�a�direct�probable�cause�of�impairment�(not�including�threatened�waters)�for�receiving�streams�and�rivers.�Roads�and�road�construction�activities�are�probably�directly�responsible�for�about�3.4%�of�the�assessed�impaired�waters.�However,�the�impact�of�roadways�is�much�greater�than�this�figure�indicates.�As�discussed�in�the�previous�credit�(EW�2�Runoff�Flow�Control),�runoff�generated�on�impervious�surfaces�such�as�roadways�and�bridges�can�cause�degradation�of�habitat,�loss�of�wetland�habitat,�clearing�of�vegetation�and�many�other�activities�associated�with�hydromodification.�Many�of�these�impacts�result�from�or�are�otherwise�indirectly�related�to�roadway�construction�and�use.�While�not�all�rivers�and�stream�miles�in�the�U.S.�were�assessed,�these�indirect�habitat�and�ecosystem�changes�associated�with�roadway�potentially�represent�an�additional�20%�of�the�total�impairments�in�assessed�rivers�and�streams.�The�diffuse�impacts�due�to�roadway�development�could�be�up�to�56%�for�bays�and�estuaries.�These�TMDL�statistics�likely�include�several�different�non�point�sources;�however,�many�data�were�also�not�reported�(denoted�as�“NA”�in�Table�EW�3.9).�For�example,�ATTAINS�includes�additional�information�on�coastal�and�near�coastal�waters�and�shorelines,�but�there�is�extremely�limited�data�for�roadways�and�the�indirect�activities�noted;�these�were�omitted�from�the�table.�
When�Pollution�is�Worst�Maestre�and�Pitt�(2005)�showed�that�streets�in�urban�areas�generate�approximately�20�50%�of�the�initial�runoff�up�to�half�an�inch,�which�is�often�called�the�“first�flush”�event.�Prince�George’s�County�(PGC:�1999)�explains�the�concept�of�the�“first�flush,”�which�is�“the�first�half�inch�of�runoff�from�an�impervious�surface�[that�is]�expected�to�carry�with�most�of�the�pollutant�load�associated�with�stormwater.�In�terms�of�a�typical�storm�hydrograph,�the�“first�flush”�represents�a�small�portion�of�a�storm’s�total�discharge,�but�a�larger�percentage�of�the�total�loading�for�a�particular�contaminant.”�This�hypothesis�was�investigated�by�statistical�analysis�of�the�National�Stormwater�Quality�Database�by�Maestre�and�Pitt�(2005),�who�showed�that�while�peak�pollutant�concentrations�occur�often�with�peak�flows,�on�small�areas�of�pavement�with�small�or�localized�drainage�facilities�it�is�likely�that�there�will�be�a�first�flush�where�concentrations�peak�early�due�to�the�washing�away�of�most�pollutants�with�initial�rainfall.�However,�at�larger�scales�and�higher�rainfall,�and�with�more�complex�drainage�systems,�the�pollutant�load�is�less�likely�to�be�detected�in�terms�of�statistically�significant�concentration�differences.�This�suggests�that�LID�methods,�which�are�small,�decentralized�and�efficient�at�treating�the�first�half�inch�of�runoff,�may�be�appropriate�for�roads�and�may�also�help�agencies�meet�requirements�for�TMDL�attainment�levels�(Huber�et�al.,�2006,�PGC,�1999).�
� �
165
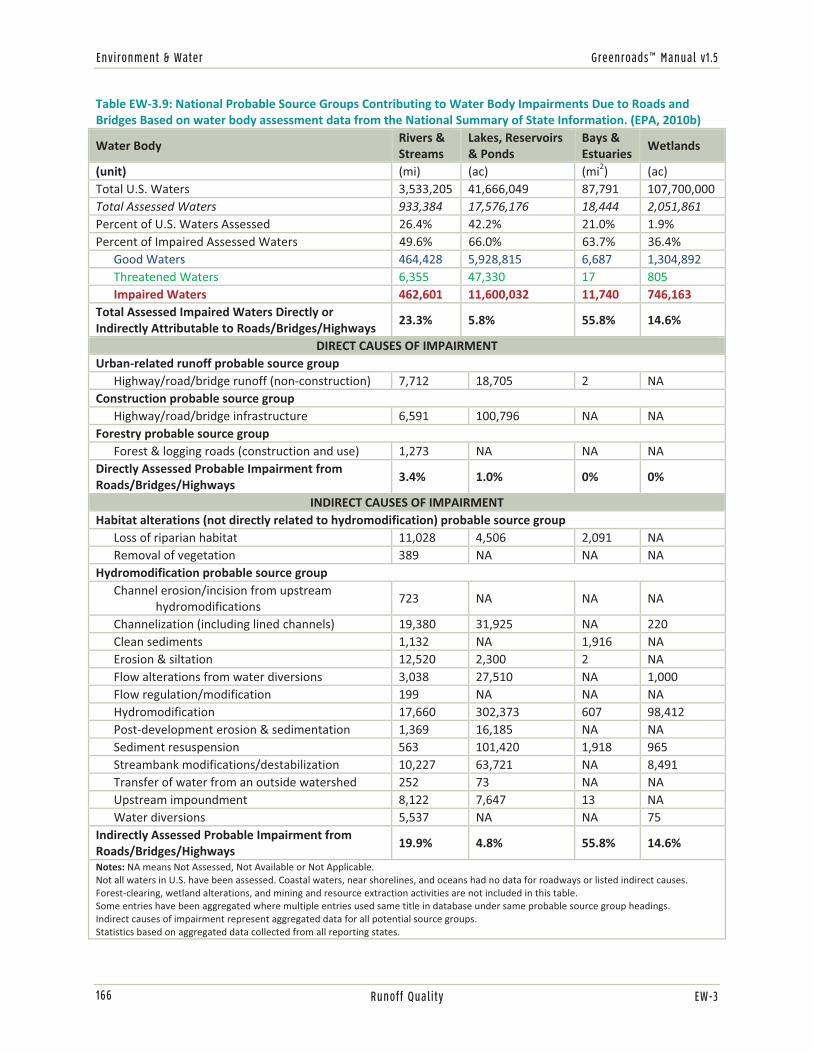
Environment & Water Greenroads™ Manual v1.5
Runoff Quality EW-3
Table�EW�3.9:�National�Probable�Source�Groups�Contributing�to�Water�Body�Impairments�Due�to�Roads�and�Bridges�Based�on�water�body�assessment�data�from�the�National�Summary�of�State�Information.�(EPA,�2010b)��
Water�Body�Rivers�&�Streams�
Lakes,�Reservoirs�&�Ponds�
Bays�&�Estuaries�
Wetlands�
(unit)� (mi) (ac) (mi2)� (ac)Total�U.S.�Waters�� 3,533,205 41,666,049 87,791� 107,700,000Total�Assessed�Waters�� 933,384 17,576,176 18,444� 2,051,861Percent�of�U.S.�Waters�Assessed�� 26.4% 42.2% 21.0%� 1.9%Percent�of�Impaired�Assessed�Waters� 49.6% 66.0% 63.7%� 36.4%� Good�Waters�� 464,428 5,928,815 6,687� 1,304,892� Threatened�Waters�� 6,355 47,330 17� 805� Impaired�Waters�� 462,601 11,600,032 11,740� 746,163Total�Assessed�Impaired�Waters�Directly�or�Indirectly�Attributable�to�Roads/Bridges/Highways�
23.3%� 5.8%� 55.8%� 14.6%�
DIRECT CAUSES�OF�IMPAIRMENTUrban�related�runoff�probable�source�group� Highway/road/bridge�runoff�(non�construction) 7,712 18,705 2� NAConstruction�probable�source�group�� Highway/road/bridge�infrastructure� 6,591 100,796 NA� NAForestry�probable�source�group�� Forest�&�logging�roads�(construction�and�use) 1,273 NA NA� NADirectly�Assessed�Probable�Impairment�from�Roads/Bridges/Highways�
3.4%� 1.0%� 0%� 0%�
INDIRECT CAUSES�OF�IMPAIRMENTHabitat�alterations�(not�directly�related�to�hydromodification)�probable�source�group� Loss�of�riparian�habitat� 11,028 4,506 2,091� NA� Removal�of�vegetation� 389 NA NA� NAHydromodification�probable�source�group� Channel�erosion/incision�from�upstream�� � ����hydromodifications��
723� NA� NA� NA�
� Channelization�(including�lined�channels) 19,380 31,925 NA� 220� Clean�sediments�� 1,132 NA 1,916� NA� Erosion�&�siltation�� 12,520 2,300 2� NA� Flow�alterations�from�water�diversions�� 3,038 27,510 NA� 1,000� Flow�regulation/modification�� 199 NA NA� NA� Hydromodification�� 17,660 302,373 607� 98,412� Post�development�erosion�&�sedimentation� 1,369 16,185 NA� NA� Sediment�resuspension�� 563 101,420 1,918� 965� Streambank�modifications/destabilization� 10,227 63,721 NA� 8,491� Transfer�of�water�from�an�outside�watershed 252 73 NA� NA� Upstream�impoundment�� 8,122 7,647 13� NA� Water�diversions�� 5,537 NA NA� 75Indirectly�Assessed�Probable�Impairment�from�Roads/Bridges/Highways�
19.9%� 4.8%� 55.8%� 14.6%�
Notes:�NA�means�Not�Assessed,�Not�Available�or�Not�Applicable.Not�all�waters�in�U.S.�have�been�assessed.�Coastal�waters,�near�shorelines,�and�oceans�had�no�data�for�roadways�or�listed�indirect�causes.�Forest�clearing,�wetland�alterations,�and�mining�and�resource�extraction�activities�are�not�included�in�this�table.�Some�entries�have�been�aggregated�where�multiple�entries�used�same�title�in�database�under�same�probable�source�group�headings.�Indirect�causes�of�impairment�represent�aggregated�data�for�all�potential�source�groups.�Statistics�based�on�aggregated�data�collected�from�all�reporting�states.
166

Greenroads™ Manual v1.5 Environment & Water
EW-3 Runoff Quality
Common�Pollutants�and�Sources�The�most�common�types�of�pollutants�found�in�roadway�runoff�are�sediment�(total�suspended�solids:�TSS�and�total�dissolved�solids:�TDS),�heavy�metals,�hydrocarbons�(oils�and�grease),�and�pathogens.�Concentrations�of�these�pollutants�vary�widely�depending�on�traffic�loads,�environmental�setting�and�land�use.�For�example,�Huber�et�al.�(2006)�showed�that�TSS�is�generally�greater�for�higher�average�daily�traffic�(ADT)�loads.�TSS�concentrations�averaged�about�172�mg/L�and�had�a�widespread�range�from�as�low�as�2�mg/L�(Interstate�205�in�Vancouver,�Washington:�17�x�103�ADT)�to�as�high�as�8735�mg/L�(Interstate�10�in�Baton�Rouge,�Louisiana:�78�x�103�ADT).�
Some�common�roadway�pollutants�are�shown�in�Table�EW�3.10�and�their�potential�concentrations�in�Table�EW�3.11�below.�
Table�EW�3.10:�Common�constituents�and�sources�of�road�runoff�(Shoemaker,�Lahlou,�Doll,�and�Cazenas,�2002)�Constituent�� Source�Particulates�� Pavement�wear,�vehicles,�atmospheric�deposition,�maintenance�activities�Nitrogen,�Phosphorus�� Atmospheric�deposition�and�fertilizer�applicationLead�� Leaded�gasoline�from�auto�exhausts�and�tire�wearZinc�� Tire�wear,�motor�oil,�and�greaseIron�� Auto�body�rust,�steel�highway�structures�such�as�bridges�and�guardrails,�and�moving�
engine�parts�Copper�� Metal�plating,�bearing�and�brushing�wear,�moving�engine�parts,�brake�lining�wear,�
fungicides�and�insecticides�Cadmium�� Tire�wear�and�insecticide�applicationChromium�� Metal�plating,�moving�engine�parts,�and�brake�lining�wearNickel�� Diesel�fuel�and�gasoline,�lubricating�oil,�metal�plating,�bushing�wear,�brake�lining�
wear,�and�asphalt�paving�Manganese�� Moving�engine�partsCyanide�� Anti�caking�compounds�used�to�keep�deicing�salts�granularSodium,�Calcium,�Chloride�� Deicing�salts�Sulphates�� Roadway�beds,�fuel,�and�deicing�saltsPetroleum�� Spill,�leaks,�antifreeze�and�hydraulic�fluids,�and�asphalt�surface�leachate��Table�EW�3.11:�Common�constituents�and�sources�of�road�runoff�(Shoemaker,�Lahlou,�Doll,�and�Cazenas,�2002;�EPA,�2005;�adapted�in�these�sources�from�Barrett�et�al.�1995)�Parameter�� Concentration�(mg/L,�unless�noted)�Total�Suspended�Solids�(TSS)�� 45�798Volatile�Suspended�Solids�(VSS)�� 4.3�79Total�Organic�Carbon�(TOC)�� 24�77Chemical�Oxygen�Demand�(COD)�� 14.7�272Biochemical�Oxygen�Demand�(BOD)�� 12.7�37Nitrate+Nitrite�(NO3+NO2)� 0.15�1.636Total�Kjeldahl�Nitrogen�(TKN)�� 0.335�55.0Total�Phosphorus�as�P�� 0.113�0.998Copper�(Cu)�� 0.022�7.033Lead�(Pb)�� 0.073�1.78Zinc�(Zn)�� 0.056�0.929Fecal�coliform�� 50�590 (organisms/100�ml)�
Other�Quality�Concerns:�Temperature�and�Turbidity�Temperature�and�turbidity�are�two�other�common�measures�of�water�quality.�Temperature,�which�is�technically�a�physical�characteristic�of�water,�is�usually�included�in�quality�measurements�as�an�indicator�of�biological�impacts,�especially�in�sensitive�aquatic�habitats�such�as�riparian�areas�(Hinman,�2005).�Turbidity,�or�
167

Environment & Water Greenroads™ Manual v1.5
Runoff Quality EW-3
relative�clarity�of�the�water,�is�another�physical�measure�that�is�used�as�an�indicator�of�suspended�sediment�loads�(EPA,�2006).�Different�jurisdictions�and�monitoring�criteria�will�dictate�whether�these�water�quality�parameters�are�measured�for�a�water�body.�
Low�Impact�Development�for�Runoff�Quality�Control�A�brief�introduction�to�LID�techniques�was�provided�in�Project�Requirement�PR�8.�The�relevant�mechanisms�at�work�that�provide�quality�treatment�with�LID�methods�briefly�described�below�(Shoemaker,�Lahlou,�Doll�and�Cazenas,�2002;�City�of�Seattle,�2009).�Most�LID�techniques�incorporate�more�than�one�of�these�methods.�Additionally,�all�flow�control�methods�provide�some�degree�of�mitigating�treatment�or�prevention�for�pollutant�transport�into�receiving�waters�(Huber�et�al.�2006;�Shoemaker,�Lahlou,�Doll�and�Cazenas,�2002).�
� Detention/Sedimentation.�Runoff�is�collected�temporarily�and�released�via�a�controlled�outflow.�The�slow�release�allows�for�particles�to�settle�out�based�on�density.�
� Flotation.�Pollutants�are�pulled�out�of�runoff�by�physical�processes�that�separate�them�based�on�density�(e.g.�oil/water�separators).�
� Biological�removal�mechanisms.�This�includes�vegetative�and�bacterial�processes�such�as�nutrient�uptake�or�metabolization�of�organic�or�inorganic�compounds.�
� Filtration/Sorption.�Pollutants�are�trapped�and�strained�through�different�materials,�such�as�fine�sand.�� Chemical�treatment.�Chemicals�are�added�to�runoff�to�remove�pollutants.�� Proprietary�treatment�methods.�Mechanical�or�otherwise�fabricated�pollutant�removal�equipment.�
Huber�et�al.�(2006)�presents�a�more�detailed�description�of�the�LID�processes.�Table�EW�3.2�presents�the�pollutant�removal�performance�for�several�different�types�of�LID�BMPs�that�have�been�statistically�analyzed�and�shown�in�terms�of�influent�and�effluent�concentrations�(Geosyntec�Consultants�and�Wright�Water�Engineers,�2008).�In�general,�a�mix�of�all�of�these�methods�will�be�most�effective�on�a�site.�“Treatment�trains”�or�LID�BMPs�arranged�in�series�can�also�be�used�to�treat�particularly�polluted�effluent�in�many�cases�(Quigley�et�al.�2009;�SSI,�2009).�Concentration,�rather�than�percent�removal,�is�the�preferred�reporting�method�for�runoff�quality�performance�for�a�number�of�reasons.�A�concise�discussion�of�this�reasoning�is�given�at�the�BMPDB�by�Wright�Water�Engineers�and�Geosyntec�Consultants�(2007):�http://www.bmpdatabase.org/Docs/FAQPercentRemoval.pdf.��
Additionally,�two�of�the�methods�described�in�Credit�EW�2�Runoff�Flow�Control,�compost�amended�soils�(such�as�infiltration�slopes)�and�design�by�avoidance�(such�as�non�eroding�roadways�or�planning�alignments�away�from�sensitive�watersheds)�also�present�significant�water�quality�benefits.�
Additional�Resources�� For�a�good,�brief�summary�of�recent�water�quality�literature�for�roadways�through�2006,�see�Clarke�et.�al�
(2007).�The�discussion�of�roads�and�highways�begins�on�page�39�and�is�available�for�free�at:�http://citeseerx.ist.psu.edu/viewdoc/download?doi=10.1.1.87.9494&rep=rep1&type=pdf��
� EPA’s�2005�National�Management�Measures�to�Control�Nonpoint�Source�Pollution�from�Urban�Areas�covers�highways�and�bridges�in�Management�Measure�7�(Chapter�7)�and�is�available�for��download�here:�http://www.epa.gov/nps/urbanmm/�
� Huber�et.�al�(2006)�compiled�a�comprehensive�review�of�highway�runoff�control�programs�as�part�of�the�National�Cooperative�Highway�Research�Program�(NCHRP)�Report�565:�Evaluation�of�Best�Practices�for�Highway�Runoff�Control.�This�report�is�available�in�PDF�format,�with�supplemental�appendices,�at:�http://onlinepubs.trb.org/Onlinepubs/nchrp/nchrp_rpt_565.pdf�
� A�variety�of�guidance�from�the�FHWA�on�water�quality�and�stormwater�management�publications�are�available�at:�http://www.fhwa.dot.gov/environment/h2o_abs.htm��
� FHWA�(Shoemaker,�Lahlou,�Doll�and�Cazenas,�2002)�provides�guidance�on�ultra�urban�BMP�selection�and�monitoring�available�at:�http://www.fhwa.dot.gov/environment/ultraurb/3fs10.htm��
� AASHTO�Center�for�Environmental�Excellence�provides�an�overview�of�water�quality�issues�and�wetlands�available�at:�http://environment.transportation.org/environmental_issues/water_wetlands/�
168

Greenroads™ Manual v1.5 Environment & Water
EW-3 Runoff Quality
� Current�performance�data�on�quality�control�for�LID�BMPs�is�available�at�the�International�BMP�Database:�http://www.bmpdatabase.org.�They�also�track�cost�data�as�it�is�volunteered�along�with�submissions.
GLOSSARY
AASHTO� American�Association�of�State�Highway�and�Transportation�OfficialsADT� Average�daily�trafficBiodiversity� Total�number�of�species�present�Biological�integrity� The�ability�to�support�and�maintain�a�balanced,�integrated�adaptive�
assemblage�of�organisms�having�species�composition,�diversity,�and�functional�organization�comparable�to�that�of�natural�habitat�of�the�region�(Karr�and�Dudley,�1981).�
BMP� Best�management�practiceBMPDB� International�BMP�Database�(http://www.bmpdatabase.org)��Detention� The�process�of�holding�and�delaying�runoff�with�a�controlled�releaseEPA� Environmental�Protection�AgencyErosion� Surface�wearing�due�to�physical�processes�such�as�water,�wind�and�heatFHWA� Federal�Highway�AdministrationFlow�control� Management�of�runoff�volume�physical�characteristics�including�peak�flows�
and�time�of�concentration�Hydromodification� alteration�of�the�hydrologic�characteristics�of�coastal�and�non�coastal�waters,�
which�in�turn�could�cause�degradation�of�water�resources�(EPA,�2007)�IMP� Integrated�management�practiceImpaired�water�body� Bodies�of�water�that�have�not�met�the�water�quality�criteria�for�one�or�more�
of�its�assessed�beneficial�uses�based�on�TMDL�(EPA,�2008)�Impervious�surface� a�hard�surface�area�that�either�prevents�or�retards�the�entry�of�water�into�the�
soil�mantle�or�causes�water�to�run�off�the�surface�in�greater�quantities�or�at�an�increased�rate�(Tilley�and�Slonecker,�2006)�
Infiltration� the�downward�movement�of�water�into�the�soil�after�surficial�entry�and�percolation�through�pore�spaces�(Huber�et�al.�2006)�
LA� Load�allocation�(used�to�compute�TMDL),�non�point�sources�LEED� Leadership�in�Energy�and�Environmental�Design™�Low�impact�development� a�broad�collection�of�engineered�controls,�stormwater�management�facilities,�
and�other�land�development�BMPs�that�attempt�to�mimic�pre�development�hydrologic�conditions�by�emphasizing�infiltration,�evapotranspiration,�or�stormwater�reuse�for�long�term�flow�control�and�runoff�treatment�
Non�point�source� A�diffuse�generator�of�pollution�or�contaminantsNon�structural�control� BMPs�that�depend�on�behavioral�change�and�enforcement�(Quigley�et�al.,�
2009)�Reach� The�length�of�a�river�or�stream�between�river�bends�Retention� The�process�of�holding�runoff,�ideally�no�release�occurs�and�all�runoff�is�
infiltrated�or�evaporated�SSI� Sustainable�Sites�InitiativeStructural�control� BMPs�that�use�a�wide�range�of�hydrologic,�physical,�biological,�and�chemical�
processes�to�improve�water�quality�and�manage�runoff.�TDS� Total�dissolved�solidsThreatened�water�body� Bodies�of�water�that�have�met�all�relevant�water�quality�criteria�for�its�
assessed�beneficial�uses�based�on�TMDL�but�demonstrate�an�apparent�decline�in�water�quality�(EPA,�2008)�
TMDL� Total�maximum�daily�load
169

Environment & Water Greenroads™ Manual v1.5
Runoff Quality EW-3
TSS� Total�suspended�solidsTurbidity� Relative�clarity�of�waterWLA� Waste�load�allocation�(used�to�compute�TMDL),�point�sources��
REFERENCES AASHTO�Center�for�Environmental�Excellence�(2009).�Center�for�Environmental�Excellence�by�AASHTO:�Water�
Quality/Wetlands.�Accessed�January�18,�2010.�Available�at:�http://environment.transportation.org/environmental_issues/water_wetlands/�
City�of�Seattle,�Seattle�Public�Utilities,�Department�of�Planning�and�Development.�(2009,�June�30).�Environmentally�Critical�Areas:�Best�Available�Science�Review.�Accessed�November�14,�2009.�Available�at�http://www.seattle.gov/dpd/static/BAS%20Review_FINAL_30JUN09_LatestReleased_DPDP017711.doc��
Clark�et.�al.�(2007).�Annotated�Bibliography�of�Urban�Wet�Weather�Flow�Literature�from�1996�through�2006�Middleton,�PA:�Pennsylvania�State�University�–�Harrisburg.�Available�at:�http://citeseerx.ist.psu.edu/viewdoc/download?doi=10.1.1.87.9494&rep=rep1&type=pdf�
Environmental�Protection��Agency.�(1995,�November).�Erosion,�Sediment�and�Runoff�Control�for�Roads�and�Highways.�(EPA�841�F�95�008d).�Office�of�Water.�Washington,�DC:�Environmental�Protection�Agency.�Available�at�http://www.epa.gov/owow/nps/education/runoff.html��
Environmental�Protection��Agency.�(2000,�October).�Low�Impact�Development�(LID):�A�Literature�Review.�(EPA�841�B�00�005).�Office�of�Water.�Washington,�DC:�Environmental�Protection�Agency.��
Environmental�Protection�Agency.�(2005,�November).�National�management�measures�to�control�nonpoint�source�pollution�from�urban�areas.�[EPA�841�B�05�004].�Washington,�DC:�Environmental�Protection�Agency,�Office�of�Water.�Available�at�http://www.epa.gov/owow/nps/urbanmm/index.html��
Environmental�Protection�Agency.�(2006,�November�30).�EPA�>�OWOW�>�Monitoring�and�Assessing�Water�Quality�>�Volunteer�Stream�Monitoring:�A�Methods�Manual�>�Chapter�5�>�5.5�Turbidity.�Accessed�January�18,�2010.�Available�at�http://www.epa.gov/volunteer/stream/vms55.html��
Environmental�Protection�Agency.�(2007).�National�management�measures�to�control�nonpoint�source�pollution�from�hydromodification.�[EPA�841�B�07�002]�Washington,�DC:�Nonpoint�Source�Control�Branch,�Office�of�Wetlands,�Oceans,�and�Watersheds,�U.S.�Environmental�Protection�Agency,�Office�of�Water.�Available�at�http://www.epa.gov/owow/nps/hydromod/pdf/Hydromod_all_web.pdf��
Environmental�Protection�Agency.�(2008,�October�16).�Overview�|�Impaired�Waters�and�TMDL�|�US�EPA.�Accessed�January�18,�2010.�Available�at�http://www.epa.gov/owow/tmdl/intro.html��
Environmental�Protection�Agency.�(2009a,�April�29).�Water�Quality�Assessment�and�TMDL�Information�(ATTAINS).�Accessed�January�18,�2010.�Available�at�http://www.epa.gov/waters/ir/��
Environmental�Protection�Agency.�(2009b,�September�24).�Clean�Waters�Act��Section�319�|��Polluted�Runoff�(Nonpoint�Source�Pollution)�|�EPA.�Accessed�January�18,�2010.�Available�at�http://www.epa.gov/owow/nps/cwact.html��
Environmental�Protection�Agency.�(2010a,�January�13).�What�is�NPS�Pollution?�–�Questions�and�Answers|�Polluted�Runoff�(Nonpoint�Source�Pollution)�|�US�EPA.�Accessed�January�18,�2010.�Available�at�http://www.epa.gov/owow/nps/qa.html��
170

Greenroads™ Manual v1.5 Environment & Water
EW-3 Runoff Quality
Environmental�Protection�Agency.�(2010b,�January�15).�National�Summary�of�State�Information�|�WATERS�|�US�EPA.�Accessed�January�15,�2010.�Available�at�http://iaspub.epa.gov/waters10/attains_nation_cy.control��
Federal�Highway�Administration.��(2009).�Urban�Drainage�Design�Manual.�3rd�ed.�[NHI�10�009].�Washington,�DC:�Federal�Highway�Administration,�Hydraulics�Engineering.�Available�at�http://www.fhwa.dot.gov/engineering/hydraulics/pubs/10009/index.cfm���
Hinman,�C.�(2005).�Low�impact�development:�Technical�guidance�manual�for�Puget�Sound.�Olympia,�WA:�Puget�Sound�Action�Team.�Available�at�http://www.psparchives.com/publications/our_work/stormwater/lid/LID_manual2005.pdf��
Huber�et�al.�(2006).�NCHRP�Synthesis�565:�Evaluation�of�best�management�practices�for�highway�runoff�control.�National�Cooperative�Highway�Research�Program�(NCHRP).�Washington,�D.C.:�Transportation�Research�Board.�Available�at�http://onlinepubs.trb.org/Onlinepubs/nchrp/nchrp_rpt_565.pdf�
Geosyntec�Consultants�and�Wright�Water�Engineers,�Inc.�(2008)�Overview�of�Performance�by�BMP�Category�and�Common�Pollutant�Type:�International�Stormwater�Best�Management�Practices�(BMP)�Database�[1999�2008].�Available�at�http://www.bmpdatabase.org/Docs/Performance%20Summary%20Cut%20Sheet%20June%202008.pdf��
International�BMP�Database.�(BMPDB)�BMPDB�–�Home.�Available�at�http://www.bmpdatabase.org��
Maestre,�A,�&�Pitt,�R.�(2005).�The�National�Stormwater�Quality�Database,�Version�1.1:�A�Compilation�and�Analysis�of�NPDES�Stormwater�Monitoring�Information.�Prepared�by�University�of�Alabama�and�Center�for�Watershed�Protection.�Washington,�DC:�Environmental�Protection�Agency,�Office�of�Water.��
Piguet�P,�Parriaux�A,�&�Bensimon�M.�(2008).�The�diffuse�infiltration�of�road�runoff:�an�environmental�improvement.�The�Science�of�the�Total�Environment.�397�(1�3),�1�3.�
Prince�George’s�County,�Maryland,�Department�of�Environmental�Resources.�(1999,�June).�Low�Impact�Development�Design�Strategies:�An�Integrated�Approach.�Available�at�http://www.epa.gov/owow/nps/lidnatl.pdf�
Quigley,�M.�et�al.�(2009,�October).�Urban�Stormwater�BMP�Performance�Monitoring.�Report�to�the�Environmental�Protection�Agency�and�the�Federal�Highway�Administration�by�Geosyntec�Consultants�and�Wright�Water�Engineers.�Available�at�the�International�Stormwater�BMP�Database�(BMPDB):�http://www.bmpdatabase.org.��
Seattle�Public�Utilities.�(2009)�Seattle�Public�Utilities�–�Natural�Drainage�Projects.�Accessed�January�13,�2010.�Available�at:�http://www.seattle.gov/util/About_SPU/Drainage_&_Sewer_System/GreenStormwaterInfrastructure/�
Shoemaker,�L.,�Lahlou,�M.,�Doll,�A.�and�Cazenas,�P.�US�Department�of�Transportation.�Federal�Highway�Administration.�(2002).�Stormwater�Best�Management�Practices�in�an�Ultra�Urban�Setting:�Selection�and�Monitoring.�Accessed�November�30,�2009.�Available�at�http://www.fhwa.dot.gov/environment/ultraurb/3fs10.htm�
Southerland,�M.�(1994).�Evaluation�of�ecological�impacts�from�highway�development.�[EPA�300�B�94�006]�Dynamac�Corporation�for�the�Environmental�Protection�Agency.�Washington,�DC:�United�States�Environmental�Protection�Agency,�Office�of�Federal�Activities.�
Strecker,�E.,�Mayo,�L.,�Quigley,�M.�and�Howell,�J.�(2001,�June).�Guidance�Manual�for�Monitoring�Water�Quality.�(FHWA�EP�01�022).�United�States�Department�of�Transportation,�Federal�Highway�Administration.�Office�of�Natural�Environment.�Washington,�DC:�United�States�Department�of�Transportation.�
171

Environment & Water Greenroads™ Manual v1.5
Runoff Quality EW-3
Sustainable�Sites�Initiative.�(2009).�Guidelines�and�Performance�Benchmarks.�American�Society�of�Landscape�Architects,�Lady�Bird�Johnson�Wildflower�Center�at�the�University�of�Texas�at�Austin,�United�States�Botanic�Garden.��
Tilley,�J.�S.,�&�Slonecker,�E.�T.�(2006).�Quantifying�the�components�of�impervious�surfaces.�Reston,�Va:�U.S.�Geological�Survey.�
United�States�Green�Building�Council�(USGBC).�(2009)�LEED�2009�for�New�Construction�and�Major�Renovations�Rating�System.�Available�at�http://www.usgbc.org/DisplayPage.aspx?CMSPageID=2202009��
Washington�State�Department�of�Transportation�(WSDOT).�(2008).�Highway�Runoff�Manual.�[M�31�16.01]�Washington�Department�of�Transportation�Environmental�and�Engineering�Programs,�Design�Office.�Olympia,�WA:�Washington�State�Department�of�Transportation.�Available�at�http://www.wsdot.wa.gov/Environment/WaterQuality/Runoff/HighwayRunoffManual.htm��
Wilcock,�P.�R.,�Pitlick,�J.,�&�Cui,�Y.�(2009).�Sediment�transport�primer�Estimating�bed�material�transport�in�gravel�bed�rivers.�Fort�Collins,�CO:�U.S.�Dept.�of�Agriculture,�Forest�Service,�Rocky�Mountain�Research�Station.�
Wright�Water�Engineers�and�Geosyntec�Consultants�(2007).�Frequently�Asked�Questions�Fact�Sheet�for�the�International�Stormwater�BMP�Database:�Why�does�the�International�Stormwater�BMP�Database�Project�omit�percent�removal�as�a�measure�of�BMP�performance?�Accessed�January�15,�2010.�Available�at�http://www.bmpdatabase.org��
�
172

Greenroads™ Manual v1.5 Environment & Water
EW-4 Stormwater Cost Analysis
STORMWATER COST ANALYSIS GOAL Determine�lifecycle�costs�and�savings�associated�with�low�impact�development�techniques�and�best�management�practices�for�stormwater�utilities.�
CREDIT REQUIREMENTS Conduct�a�lifecycle�cost�analysis�(LCCA)�for�stormwater�utilities�according�to�the�National�Cooperative�Highway�Research�Program�(NCHRP)�Report�565:�Evaluation�of�Best�Management�Practices�for�Highway�Runoff�Control�Guidelines�Manual.�
NCHRP�Report�565�can�be�accessed�at�the�following�link:�http://144.171.11.107/Main/Blurbs/Evaluation_of_Best_Management_Practices_for_Highwa_158397.aspx��
The�Guidelines�Manual�is�available�to�download�as�a�CD�image�file�(*.iso).�This�file�can�be�burned�to�a�CD�and�then�viewed�as�a�PDF.�
Details
Note:�This�credit�is�applicable�only�for�projects�where�PR�8�has�identified�that�low�impact�development�technologies�are�appropriate�for�implementation�for�stormwater�management.�
DOCUMENTATION Provide�a�copy�of�the�LCCA�spreadsheet�showing�the�final�results�of�the�cost�analysis�and�highlighting�the�final�alternative�chosen.�The�results�must�show,�at�minimum,�that�the�following�criteria�have�been�addressed:�
� Expected�service�life�� Construction�costs�� Maintenance�costs�� Interest�rate�� Salvage�value�� Estimated�annual�cost�of�the�stormwater�management�system�
� �
EW-4
1 POINT
RELATED CREDITS
� PR�2�Lifecycle�Cost�Analysis�
� PR�7�Pollution�Prevention�Plan�
� PR�8�Low�Impact�Development�
� PR�10�Site�Maintenance�Plan�
� EW�2�Runoff�Flow�Control�
� EW�3�Runoff�Quality�
SUSTAINABILITY COMPONENTS
� Ecology�� Economy�� Extent�� Expectations�� Exposure�
BENEFITS
� Improves�Accountability�
� Reduces�Lifecycle�Costs�
� Creates�New�Information�
173

Environment & Water Greenroads™ Manual v1.5
Stormwater Cost Analysis EW-4
APPROACHES & STRATEGIES
� Use�a�financial�approach�(strictly�monetary�costs�and�benefits)�for�the�LCCA.�� Evaluate�design�alternatives�based�on�the�goals�of�the�stormwater�management�plan.�� Set�up�a�spreadsheet�to�compute�costs�based�on�budget�inputs.�� Use�estimated�costs�for�LID�BMPs�available�from�the�BMP�Database�(BMPDB)�available�at:�
http://www.bmpdatabase.org.��� Consider�avoided�costs�of�stormwater�treatment�at�off�site�locations,�or�avoided�permitting�costs.�� Include�several�different�methods�and�alternatives�in�the�evaluation�of�the�stormwater�system�when�
performing�the�LCCA.��Investigate�both�structural�and�non�structural�controls,�including�conventional�controls�such�as�detention�or�infiltration�(Huber�et.�al.,�2006).�
Example: LCCA Calculation
The�following�example�uses�the�NCHRP�Report�outline�to�perform�an�LCCA�for�a�potential�stormwater�system.�The�system�being�analyzed�consists�of�150�linear�feet�of�12�inch�portland�cement�concrete�pipe�connected�to�two�48”�manholes.�
Table�EW�4.1�shows�the�initial�construction�costs�associated�with�the�potential�stormwater�system.�
Table�EW�4.1:�Initial�construction�costs.�Cost�of�150�LF�of�12"�Concrete�Pipe� $1,200.00Cost�of�2�48"�Manholes� $4,800.00Right�of�Way�Cost� $100.00Total�Initial�Construction�Cost� $6,100.00
�Table�EW�4.2�shows�some�of�the�other�costs�associated�with�the�stormwater�system,�including�salvage�value,��interest�rate,�and�design�life.�
Table�EW�4.2:�Incidental�Costs�Annual�Maintenance�Cost� $300.00Salvage�Value� $750.00Interest�Rate� 4.00%Design�Life�(Years)� 30
�To�begin�the�lifecycle�cost�analysis,�all�of�the�future�and�annual�costs�associated�with�the�system�must�be�converted�into�a�present�worth�value.�
First,�the�annual�maintenance�cost�is�converted�into�a�present�worth�using�Equation�EW�4.1:�
Equation�EW�4.1:�
� � ���� � � � ���� � � � � ��� � � ��� � �� ��� � � ��� � ���������
Secondly,�the�salvage�value�is�converted�into�a�present�worth�using�Equation�EW�4.2:�
Equation�EW�4.2:�
� � ��� � � �
�� �� � � ��� � ��������
The�total�initial�cost�is�then�found�by�adding�the�total�construction�costs�to�the�two�calculated�present�worth�values.�This�makes�the�total�cost�associated�with�this�stormwater�system�$11,518.85.�
174

Greenroads™ Manual v1.5 Environment & Water
EW-4 Stormwater Cost Analysis
Next,�by�annualizing�this�value�using�Equation�EW�4.3,�it�can�be�shown�that�the�annual�cost�for�the�new�stormwater�system�will�be�$666.14�per�year�for�a�30�year�lifetime.�
Equation�EW�4.3:�
� � � ��� � ��� � � � � � ���������
� ��� � � ����� � � ��� � � � ��������
POTENTIAL ISSUES
1. Complexity�of�the�cost�analysis�will�be�proportional�to�the�extent�and�labor�involved�in�installing�the�stormwater�utilities�system.�
2. LCCA�does�not�necessarily�reflect�the�actual�cost�or�functionality�of�the�finished�stormwater�system.�
RESEARCH Many�agencies’�project�evaluation�process�considers�only�the�initial�capital�costs�of�projects�without�considering�long�term�operations�and�maintenance.�Focusing�only�on�capital�costs�makes�it�less�likely�that�projects�will�adopt�stormwater�controls�that�may�have�higher�initial�costs,�but�are�less�expensive�to�operate�and�maintain�in�the�long�term.�There�are�also�non�monetary�risks�and�costs�associated�with�stormwater�systems�that�are�relevant�to�decision�making�such�as�permanent�land�use�changes�associated�with�detention�ponds,�a�common�feature�of�conventional�stormwater�infrastructure.�
Overall�capital�and�maintenance�costs�are�not�the�only�costs�that�should�be�involved�in�the�lifecycle�cost�assessment.�The�cost�of�actually�treating�the�stormwater�should�be�included�as�well.�Preliminary�estimates�in�NCHRP�Report�565�show�that�the�cost�of�treating�stormwater�can�vary�from�$0.10�to�$3.00�per�gallon�based�on�the�treatment�methodology�(Huber�et.al,�2006).��
Drastic�changes�to�stormwater�systems�can�affect�both�water�quality�and�flow�rates.�Evaluating�both�in�a�lifecycle�cost�analysis�as�well�as�a�water�quality�analysis�can�be�an�effective�method�of�design�evaluation.�The�design�team�should�ensure�that�the�overall�goals�of�the�stormwater�system�are�not�generated�specifically�on�cost,�but�functionality�as�well�(Huber�et.�al.,�2006).�Other�possible�factors�to�consider�in�design�evaluation�include�existing�infrastructure,�property�ownership,�health�and�safety,�and�volume�reduction�(Huber�et.�al,�2006).�
Case�studies�of�17�low�impact�development�installations�for�stormwater�flow�control�and�quality�management�were�completed�by�the�Environmental�Protection�Agency�in�2007.�Results�of�the�study�showed�that�applying�LID�techniques�usually�reduced�project�costs�and�had�the�added�benefit�of�improved�environmental�performance�(for�both�flow�control�and�quality�of�discharge).�In�some�cases,�LID�was�more�expensive�than�conventional�best�management�practices,�due�in�part�to�contractor�unfamiliarity.�In�most�cases,�significant�capital�costs�were�reduced�by�avoiding�grading,�stormwater�infrastructure,�additional�paving�and�vegetation.�Savings�ranged�from�15�80�percent�with�the�few�exceptions�mentioned�(EPA,�2007).�
GLOSSARY
LCCA� Lifecycle cost�analysis�
REFERENCES Environmental�Protection�Agency�(2007).�Reducing�Stormwater�Costs�through�Low�Impact�Development�(LID)�
Strategies�and�Practices.�[Publication�Number�EPA�841�F�07�006,�December�2007�
Huber�W.C.,�Strecker,�E.W.,�Heaney,�J.P.,�&�Weinstein,�N.�(2006).�Evaluation�of�Best�Management�Practices�and�Low�Impact�Development�for�Highway�Runoff�Control�User’s�Guide�for�BMP/LID�Selection�Guidelines�Manual.�National�Cooperative�Research�Program.�
175

Environment & Water Greenroads™ Manual v1.5
Stormwater Cost Analysis EW-4
�
176

Greenroads™ Manual v1.5 Environment & Water
EW-5 Site Vegetation
SITE VEGETATION GOAL Promote�sustainable�site�vegetation�that�does�not�require�irrigation.�
CREDIT REQUIREMENTS Site�vegetation�shall�be�subject�to�the�following�requirements�in�order�to�receive�the�points�listed:�
� 1�point:�Use�non�invasive�plant�species�only��� 1�point:�Do�not�use�water�(no�irrigation)�after�the�plant�establishment�period��� 1�point:�Use�native�plant�species�only��
Details
“Site�vegetation”�is�defined�as�all�vegetation�associated�with�a�particular�roadway�project�and�shall�include�all�vegetation�within�the�roadway’s�right�of�way.�This�can�include�roadside�vegetation,�decorative�planting�(e.g.,�planter�boxes�or�potted�plants�in�urban�areas)�and�vegetation�contained�in�stormwater�facilities�(e.g.,�bioswales�and�rain�gardens).��
The�following�items�must�be�performed�to�ensure�that�a�plant�species�is�considered�“non�invasive”:���
1. Consult�existing�local�(e.g.�city,�county,�state,�park�service)�vegetation�policy�and�procedure�that�is�applicable�to�the�roadway�project�and�is�specifically�formulated�to�prevent�the�use�of�invasive�plant�species�and�noxious�weeds.��
2. Use�local�and/or�regional�lists�to�identify�invasive�plant�species.��3. Comply�with�local�and/or�national�noxious�weed�laws.�
“No�water�use”�means�that�the�site�vegetation�will�not�require�any�irrigation�after�the�plant�establishment�period.�The�“plant�establishment�period”�shall�be�stated�in�the�project�specifications.�Typical�plant�establishment�periods�are�1�3�years.�This�requirement�means�that�vegetation�requiring�irrigation�such�as�seasonal�planter�boxes�cannot�receive�the�associated�point�even�if�it�is�fully�comprised�of�non�invasive�or�native�species.��
“Native�plant�species”�are�plants�native�to�the�EPA�Level�III�ecoregion�that�contains�the�roadway�project�site�or�known�to�naturally�occur�within�200�miles�of�the�roadway�construction�site�(The�Sustainable�Sites�Initiative,�2009a).�
DOCUMENTATION � A�vegetation�or�landscape�plan�showing�type�and�location�of�all�plant�species.�This�
can�often�be�found�in�the�standard�project�plans.��� The�specification�sections�relating�to�site�vegetation�including�planting�bed�
requirements.�These�are�typically�found�in�the�technical�specifications.�� A�copy�of�or�reference�to�(e.g.,�web�address)�the�policy�or�procedure�used�to�select�
plant�species.��
EW-5
1-3 POINTS
RELATED CREDITS
� PR�10�Site�Maintenance�Plan�
� EW�3�Runoff�Quality�� EW�6�Habitat�
Restoration�
SUSTAINABILITY COMPONENTS
� Ecology�� Economy�� Equity�� Extent�
BENEFITS
� Reduces�Water�Use�� Reduces�Water�
Pollution�� Reduces�Greenhouse�
Gases�� Reduces�Solid�Waste� Increases�Aesthetics�
177

Environment & Water Greenroads™ Manual v1.5
Site Vegetation EW-5
APPROACHES & STRATEGIES
Use�a�Pre�Defined�List�of�Approved�Plants�In�many�cases�the�local�road�owner�(e.g.,�City,�County,�State�or�other�authority)�already�has�a�pre�defined�list�of�acceptable�plant�species�for�site�vegetation.�Usually,�these�lists�have�been�carefully�developed�to�exclude�invasive�plants�and�noxious�weeds;�however�they�should�still�be�checked�against�local/regional�lists�and�laws.�Often�times,�these�pre�defined�lists�also�identify�native�plants�and�drought�tolerant�plants�(e.g.,�no�water�use).�Following�such�lists�can�often�achieve�the�non�invasive�species�point�and�zero�water�use�point.�Selecting�native�plants�species�(which�may�also�be�identified�on�these�lists)�can�then�earn�the�third�point.��
Pre�defined�lists�are�advantageous�because�they�are�straightforward�and�easy�to�follow;�plants�are�either�on�the�list�or�not.�However,�when�used�alone�they�may�not�provide�adequate�guidance�on�establishing�long�term�ecosystem�goals,�management�of�site�vegetation�after�planting,�appropriate�location�and�density�of�vegetation�and�other�more�advanced�concepts.��
Follow�a�Pre�Defined�Process�It�may�be�possible�to�identify�a�site�vegetation�process�that�has�been�approved�or�adopted�by�the�local�authority.�These�processes�typically�identify�the�site�vegetation�strategy�and�describe�the�actions�and�major�steps�needed�to�establish�site�vegetation.�These�plans�can�be�complex,�such�as�Western�Federal�Lands�Highway�Division’s�Roadside�Revegetation:�An�Integrated�Approach�to�Establishing�Native�Plants�(Steinfeld�et�al.�2007)�or�more�general�in�nature�like�Xeriscape�Colorado�(Colorado�Waterwise�2009).��
Sustainable�Sites�Initiative�One�robust�pre�defined�process�is�associated�with�the�Sustainable�Sites�Initiative�(www.sustainablesites.org).�This�is�“an�interdisciplinary�effort…to�create�voluntary�national�guidelines�and�performance�benchmarks�for�sustainable�land�design,�construction�and�maintenance�practices.”�(The�Sustainable�Site�Initiative�2009c).�A�roadway�project�participating�in�the�Sustainable�Sites�Initiative�program�and�recognized�as�a�“sustainable�site”�would�likely�quality�for�at�least�1�point�in�this�Voluntary�Credit�and,�depending�upon�which�Sustainable�Sites�credit�benchmarks�are�achieved,�could�achieve�all�3�points.�Overall,�the�Sustainable�Sites�Initiative�is�a�more�robust�set�of�benchmarks�for�site�vegetation�than�Greenroads�because�its�scope�is�limited�to�site�development�and�does�not�include�roadways,�mobility,�access�or�other�metrics�associated�with�transportation.���
Have�an�Expert�Develop�a�Site�Specific�Vegetation�Strategy�In�the�absence�of�existing�guidance,�it�may�be�necessary�to�have�an�expert�develop�an�entirely�new�site�specific�vegetation�plan.�While�this�is�an�acceptable�option,�the�expertise�and�time�to�develop�the�plan�can�be�expensive�in�relation�to�the�amount�of�site�vegetation;�especially�on�small�projects�where�vegetation�is�limited.�In�addition�to�careful�selection�of�appropriate�plants,�plan�development�requires�consideration�of�planting�bed�specifications,�topsoil�needs,�and�planting�techniques.�Finally,�long�term�maintenance�plans�and�goals�must�be�established�for�the�plant�community.��
Example: City of Portland, OR
The�City�of�Portland’s�Bureau�of�Planning�and�Sustainability�has�maintained�a�Portland�Plant�List�since�1991.�This�list�includes:�
� Native�plants.�Plants�historically�found�in�the�City�of�Portland.�They�are�grouped�by�type�(tree,�arborescent�shrubs,�shrubs�and�ground�covers)�and�include�the�scientific�name,�common�name,�and�wetland�indicator�status�and�habitat�type.��
� Nuisance�plants.�Plants�that�can�be�removed�manually�without�requiring�an�environmental�review�or�greenway�review.�Plants�are�considered�a�nuisance�because�they�have�a�tendency�to�dominate�plant�communities�or�are�harmful�to�humans.�Nuisance�plants�may�be�native,�exotic�or�naturalized.���
� Prohibited�plants.�Plants�prohibited�from�use�in�all�reviewed�landscaping�situations.�These�plants�pose�a�serious�threat�to�native�plant�and�animal�health/vitality.��
178

Greenroads™ Manual v1.5 Environment & Water
EW-5 Site Vegetation
Example: City of Seattle, WA
�The�City�of�Seattle�provides�guidance�for�project�site�vegetation�using:�
� Department�of�Transportation�suggested�plant�list�for�street�use.��� Links�to�plant�selection�databases.��� Tree�protection�ordinance,�specifications�and�standard�plans.�� Heritage�tree�program.�� Recommended�street�tree�list.�� Landscape�standard�plans.�
The�suggested�plant�list�for�street�use�is�called�the�“Seattle�Green�Factor�Plant�List”�(http://www.seattle.gov/dpd/static/Green%20Factor%20Plant%20List_LatestReleased_DPDP015968.pdf).��
Example: Western Federal Lands Highway Division
�In�2007,�Western�Federal�Lands�Highway�Division�(WFLHD)�published�a�native�revegetation�manual�(Steinfeld�et�al.�2007)�that�they�now�use�as�their�standard�process�for�revegetating�disturbed�land�on�roadway�projects.�This�manual�does�not�provide�a�specific�plant�list�but�rather�describes�a�comprehensive�process�for�roadside�revegetation�and�creation�of�a�sustainable�plant�community.�This�process�includes�(1)�necessary�integration,�(2)�initiation,�(3)�planning,�(4)�implementation�and�(5)�monitoring,�and�is�illustrated�on�the�web�at:�www.nativerevegetation.org.��
Example: Sustainable Sites Initiative Case Studies
The�Sustainable�Sites�Initiative�website�contains�a�number�of�case�studies�demonstrating�sustainable�landscape�practices�at:�http://www.sustainablesites.org/cases��
POTENTIAL ISSUES
1. Site�planting�without�proper�integration�with�other�roadway�activities�(e.g.,�maintenance,�roadside�safety).��2. Inadequate�plant�establishment.�3. Not�considering�the�suitability�of�a�plant�species�specific�for�site�conditions�including�cold/heat�tolerance,�salt�
tolerance�and�soil�pH,�sun/shade�requirements,�pest�susceptibility,�and�maintenance�requirements�(The�Sustainable�Sites�Initiative�2009).�The�roadway�environment�might�be�significantly�different�from�the�surrounding�area,�and�may�not�necessarily�support�its�indigenous�plant�species.��
4. Site�vegetation�must�be�considered�in�the�context�of�soils,�compaction,�slopes,�and�hydrology�in�order�to�be�successful�on�road�projects.��
5. Disturbed�soil�conditions�must�be�modified�to�create�conditions�that�will�sustain�native�plant�growth.�Planting�beds�should�be�prepared�based�on�disturbed�conditions�and�specified�in�project�docuements.�
6. This�Greenroads�credit�does�not�currently�track�projects�beyond�construction�to�ensure�continued�maintenance�and�no�water�use.���
RESEARCH Site�vegetation�can�impact�four�primary�roadway�sustainability�components:�ecology,�economic,�equity�and�extent.�In�the�broad�sense,�arguments�for�sustainable�site�vegetation�center�on�their�contribution�to�the�local�ecosystem,�which�leads�to�broad�arguments�for�how�ecosystems�and�ecosystem�services�affect�these�areas�of�sustainability.�In�a�more�narrow�sense,�arguments�for�sustainable�site�vegetation�center�on�how�they�may�influence�project�specific�ecological�issues,�costs,�safety,�culture,�and�durability.�While�these�issues�are�often�thought�of�as�self�evident,�it�can�be�difficult�to�find�quantifiable�empirical�evidence�to�use�as�proof.�The�following�sections�address�site�vegetation�impacts�by�category.��
179

Environment & Water Greenroads™ Manual v1.5
Site Vegetation EW-5
Ecological�Site�vegetation�is�part�of�the�local�ecosystem.�The�Millennium�Ecosystem�Assessment�(2005)�defines�an�ecosystem�as�“…a�dynamic�complex�of�plant,�animal,�and�microorganism�communities�and�the�nonliving�environment�interacting�as�a�functional�unit.”��These�can�be�systems�relatively�untouched�by�humans�(e.g.,�natural�forests)�or�those�that�have�been�significantly�modified�(e.g.,�urban�areas�and�agricultural�lands)�(MEA�2005).�In�looking�at�ecosystems�over�the�last�50�years�the�Millennium�Ecosystem�Assessment�(2005)�arrived�at�four�major�findings:�
� Over�the�past�50�years�humans�have�changed�ecosystems�more�rapidly�and�extensively�than�in�any�comparable�period�of�human�history.��
� Ecosystem�changes�have�contributed�to�substantial�net�gains�in�human�well�being�and�economic�development,�but�these�gains�are�at�the�expense�of�substantially�diminishing�the�benefits�that�future�generations�obtain�from�ecosystems.��
� The�degradation�of�ecosystem�services�could�grow�significantly�worse�during�the�first�half�of�the�twenty�first�century.��
� Reversing�ecosystem�degradation�can�be�done�but�involves�significant�changes�in�policies,�institutions�and�practices�that�are�not�currently�underway.��
Thus,�to�the�extent�that�site�vegetation�helps�manage�ecosystems�more�sustainably,�it�can�contribute�positively,�though�perhaps�only�slightly,�to�the�reversal�of�some�of�the�degradation�seen�over�the�last�50�years.�Benefits�attributed�to�more�sustainable�site�vegetation�include�the�regional�and�local�impacts�outlined�below�(MEA�2005):�
Regional:�� Better�air�quality�� Climate�regulation�� Water�regulation�� Erosion�regulation�� Water�quality�� Pest�regulation�� Pollination�� Natural�hazard�regulation��Local:�� Lower�water�use�� Reduced�erosion�� Prevention�of�exotic�plant�species�from�out�compete�native�species�� Better�survivability�of�site�vegetation�because�it�is�better�adapted�to�the�local�environment�(though�plants�
indigenous�to�the�local�ecosystem�are�not�necessarily�suitable�for�the�altered�roadway�environment).�
Economic�As�part�of�the�local�ecosystem,�site�vegetation�can,�in�a�broad�sense,�provide�economic�benefits�such�as�clean�air,�clean�water,�food,�renewable�resources�and�waste�decomposition�(The�Sustainable�Sites�Initiative,�2009b).�It�is�difficult�to�value�ecosystem�services�properly�because�(1)�our�attempts�to�value�them�are�generally�based�on�human�values�and�not�what�might�be�considered�objective�value�sets,�and�(2)�they�are�not�fully�valued�or�quantified�in�commercial�markets�or�policy�decisions�(Costanza�et�al.�1997).�Nonetheless,�attempts�have�been�made�to�value�ecosystem�services�that�can�provide�insight.�Costanza�et�al.�(1997)�provide�a�comprehensive�overview�on�the�value�of�the�world’s�ecosystem�services�based�on�a�synthesis�of�previous�work.�In�short,�they�found�a�range�of�potential�values�of�US$16��54�trillion/yr�with�a�mean�of�US$33�trillion/yr�for�17�ecosystem�services�(in�1994�US�dollars).�This�compares�to�a�world�gross�national�product�(GNP)�of�US$18�trillion�(1994�US�dollars)�making�ecosystem�services�about�1.8�times�the�global�GNP�if�the�mean�value�is�assumed.�This�estimate�is�based�on�marginal�cost�by�“…determining�the�differences�that�relatively�small�changes�in�these�services�make�to�human�welfare.”�(Costanza�et�al.�1997).�They�acknowledge�that�their�estimates�are�on�the�low�side,�incomplete�and�flawed�but�reason�that�some�estimate�is�better�than�none�(Costanza�et�al.�1997).��
180

Greenroads™ Manual v1.5 Environment & Water
EW-5 Site Vegetation
In�a�narrow�sense,�site�vegetation�contributes�to�individual�project�cost�over�its�life�cycle�if�costs�such�as�site�maintenance,�water�demand,�erosion�control�and�problematic�vegetation�control�are�considered�(Steinfeld�et�al.�2007a).�One�example�of�this�comes�from�the�City�of�Santa�Monica�in�their�garden\garden�demonstration�project.�In�this�project�the�City�and�Water�District�compared�two�landscape�strategies:�sustainable�vs.�traditional�(Santa�Monica�Office�of�Sustainability�and�Environment�2009).�Table�EW�5.1�summarizes�some�findings�from�the�comparison.�
Table�EW�5.1:�Landscape�Comparison�in�Santa�Monica,�CA�for�the�entire�year�of�2007�Category� Sustainable�Landscape Traditional�LandscapeInitial�Construction�Cost� $16,700 $12,400Water�Use� 14,300�gallons 76,700�gallonsAnnual�Water�Cost� $14 $74Yard�Waste� 250�lbs 670�lbsMaintenance�� 15�hours 80�hoursAnnual�Maintenance�Cost� $800 $3,000�It�should�be�noted�that�direct�comparisons�between�sustainable�and�traditional�vegetation�with�actual�values�for�cost,�water�use,�waste,�etc.�such�as�that�done�by�the�City�of�Santa�Monica�are�difficult�to�find.��
Equity�As�part�of�the�local�ecosystem,�site�vegetation�can�provide�human�equity�benefits�such�as�improved�human�health�(e.g.,�better�water�quality)�and�cultural�services�like�spiritual�and�religious�values,�recreation�and�aesthetics�(MEA�2005).��On�a�local�scale,�site�vegetation�can�contribute�to�improved�roadway�safety�by�improving�visibility�and�can�create�natural�beauty�that�is�appreciated�and�valued�by�motorists.��
Extent�Site�vegetation�can�also�have�an�impact�on�the�durability�of�a�particular�project,�which�affects�project�life�or�at�least�the�level�of�necessary�maintenance�to�achieve�a�specific�project�life.�For�instance,�native�revegetation�of�a�highway�roadside�can�be�better�than�traditional�non�native�turf�coverage�because�it�can�have�a�higher�probability�of�surviving,�last�longer,�require�less�maintenance�and�better�prevent�soil�erosion�based�on�a�deeper�and�more�hearty�root�structure�(see�comparison�between�Figures�EW�5.1�and�EW�5.2).���
�
Figure�EW�5.1:�A�failing�revegetation�effort�on�a�steep�slope�that�did�not�use�a�native�revegetation�approach�
(from�Steinfeld�et�al.�2007a).��
Figure�EW�5.2:�A�native�roadside�revegetation�in�Glacier�National�Park�(from�Steinfeld�et�al.�2007a,�
photo�by�Tara�Luna).���
181

Environment & Water Greenroads™ Manual v1.5
Site Vegetation EW-5
GLOSSARY
Native�plant� Plant�that�is�native�to�the�EPA�Level�III�ecoregion�that�contains�the�roadway�project�site�or�known�to�naturally�occur�within�200�miles�of�the�roadway�construction�site�(Sustainable�Sites�Initiative,�2009a).��
Plant�establishment�period Duration�of�time�that�allows�newly�installed�vegetation�to�reach�a�state�of�maturity�that�requires�minimal�ongoing�maintenance�for�survival.�Activities�during�the�plant�establishment�period�can�include:�removal�of�litter�and�trash,�weeding,�water�application�(even�for�non�irrigated�vegetation),�replacement�of�dead�plants�and�pest�control�(including�the�use�of�approved�pesticides).��
Xeriscape� A�set�of�gardening�principles�designed�to�save�water�while�creating�a�lush�and�colorful�landscape.�
�
REFERENCES Colorado�Waterwise.�(2009).�Xeriscape�Colorado.�Website.�Accessed�November�25,�2009.�
http://coloradowaterwise.org//index.php?option=com_content&task=view&id=88&Itemid=145.��
Costanza,�R.,�d’Arge,�R.,�de�Groot,�R.,�Farber,�S.,�Grasso,�M.,�Hannon,�B.,�Limburg,�K.,�Naeem,�S.,�O’Neill,�R.V.,�Paruelo,�J.,�Raskin,�R.G.,�Sutton,�P.,�van�den�Belt,�M.,�(1997).�The�value�of�the�world’s�ecosystem�services�and�natural�capital.�Nat.,�387,�253�260.��
Millennium�Ecosystem�Assessment�(MEA),�(2005).�Ecosystems�and�Human�Well�being:�Synthesis.�Island�Press,�Washington,�DC.�
Santa�Monica�Office�of�Sustainability�and�Environment.�(2009).�Landscape:�Demonstration�Gardens.�Website.�City�of�Santa�Monica,�CA.�Accessed�November�30,�2009�http://www.smgov.net/Departments/OSE/Categories/Landscape/Demonstration_Gardens.aspx�
Steinfeld,�D.E.,�Riley,�S.A.,�Wilkinson,�K.M.,�Landis,�T.D.�and�Riley,�L.E.�(2007a).�Roadside�Revegetation:�An�Integrated�Approach�to�Establishing�Native�Plants.�FHWA�WFL/TD�07�005.�Federal�Highway�Administration,�Western�Federal�Lands�Highway�Division,�Vancouver,�WA.�
Steinfeld,�D.E.,�Riley,�S.A.,�Wilkinson,�K.M.,�Landis,�T.D.�and�Riley,�L.E.�(2007b).�A�Manager’s�Guide�to�Roadside�Revegetation�Using�Native�Plants.�FHWA�WFL/TD�07�006.�Federal�Highway�Administration,�Western�Federal�Lands�Highway�Division,�Vancouver,�WA.�
The�Sustainable�Sites�Initiative.�(2009a).�Guidelines�and�Performance�Benchmarks.�American�Society�of�Landscape�Architects,�Lady�Bird�Johnson�Wildflower�Center�at�the�University�of�Texas�at�Austin,�United�States�Botanic�Garden.���
The�Sustainable�Sites�Initiative.�(2009b).�The�Case�for�Sustainable�Landscapes.�American�Society�of�Landscape�Architects,�Lady�Bird�Johnson�Wildflower�Center�at�the�University�of�Texas�at�Austin,�United�States�Botanic�Garden.��
�
182
Greenroads™ Manual v1.5 Environment & Water
EW-6 Habitat Restoration
HABITAT RESTORATION GOAL Offset�the�destruction�and�deterioration�of�natural�habitat�caused�by�road�construction.�Restore�and�protect�natural�habitat�beyond�regulatory�requirements.�
CREDIT REQUIREMENTS Complete�Option�A�or�B.�
Option�A�–�For�projects�required�to�mitigate�habitat�impacts�through�restorative�practices�(3�points)�Implement�a�restoration/preservation�plan�that�restores�and/or�preserves�more�area�by�5%�beyond�what�is�required�such�that�one�of�the�following�metrics�below�is�met:�
1. Total�area�of�restored�and/or�preserved�habitat�equals�or�exceeds�105%�of�total�required�mitigation�area�
2. Total�restoration�and/or�restoration�cost�equals�or�exceeds�105%�of�total�cost�required�for�restoration/preservation�due�to�the�roadway�project�
Option�B���For�projects�not�required�to�mitigate�habitat�impacts�through�restorative�practices�(3�points)�Conduct�a�biological�assessment�of�the�pre�development�condition�of�the�project�site�and�surrounding�ecosystem�or�watershed�and�implement�a�restoration�plan�that�includes�all�seven�items�below:�
1. Restores�an�area�equal�to�the�total�disturbed�surface�area�of�the�roadway�project.�2. States�quantifiable�goals�regarding�at�least�one�of�the�performance�metrics�outlined�
below.�3. Describes�ecological�design�or�engineering�elements�that�are�expected,�with�
reasonable�professional�certainty,�to�meet�the�goals�stated�above.�4. Lists�responsible�parties�for�restoration�activities�and�subsequent�monitoring�
efforts.�5. Lists�sources�of�funding�for�restoration�activities�and�subsequent�monitoring�
efforts.�6. Completes�restoration�activities�prior�to�the�roadway�facility�opens�to�traffic,�ideally�
during�project�planning.�7. Is�signed�and�approved�by�the�responsible�parties�or�the�project�ecologist.�
Details
Disturbed�surface�area�includes�all�cut�and�fill�soils�for�pavement�areas,�shoulders,�embankments,�bridge�abutments�and�construction�staging�areas.�In�other�words,�any�earthwork�area�that�is�required�for�the�road�itself�is�included,�but�the�area�designated�for�habitat�creation�or�restoration�is�not.�
The�total�required�surface�area�can�be�made�up�of�multiple�types�of�restoration�and�preservation�efforts,�so�long�as�the�project�team�can�show�that�the�total�restored�and�preserved�areas�meet�the�above�requirements.�
Preserved�habitat�areas�may�not�be�previously�designated�open�space.�Preservation�designations�must�be�directly�associated�with�the�project�and�be�in�place�by�40�
EW-6
3 POINTS
RELATED CREDITS
� EW�2�Runoff�Flow�Control�
� EW�3�Runoff�Quality�� EW�5�Site�Vegetation� EW�7�Ecological�
Connectivity�� EW�8�Light�Pollution�
SUSTAINABILITY COMPONENTS
� Ecology�� Equity�� Extent�� Experience�
BENEFITS
� Restores�Habitat�� Creates�Habitat�� Reduces�Manmade�
Footprint�� Increases�Aesthetics�
183

Environment & Water Greenroads™ Manual v1.5
Habitat Restoration EW-6
years�after�the�end�of�construction,�the�expected�design�lifetime�of�the�project,�or�local�regulations,�whichever�is�longest.�Preservation�areas�must�also�be:�
� Formally�designated�permanent�as�open�space�according�to�the�definitions�of�the�governing�agency�or�zoning�authority.�
� Clearly�and�publicly�attributed�to�the�work�done�for�the�roadway�project.�� Compliant�with�all�applicable�zoning�requirements�of�the�jurisdiction.�� Appropriately�vegetated�for�the�location�and�context.��
The�following�performance�metrics�are�considered�suitable�for�achieving�credit�where�a�restoration�plan�is�developed:�
� For�roadways�with�watersheds�receiving�stormwater�runoff�from�the�roadway,�determine�the�predevelopment�Index�of�Biological�Integrity�(IBI)�as�part�of�the�biological�assessment.�Predevelopment�IBI�(for�purposes�of�this�credit�only)�means�the�reference�condition�for�this�metric�that�is�established�exclusively�for�restoration�work�for�the�roadway�project,�measured�within�a�reasonable�amount�of�time�prior�to�groundbreaking�of�construction.�Set�a�target�IBI�that�meets�or�exceeds�predevelopment�conditions.�
� For�roadway�projects�including�stream�restoration,�set�a�target�limit�on�unstable�slopes.�This�target�should�not�exceed�predevelopment�conditions.�In�addition,�establish�a�minimum�riparian�buffer�width�for�the�stream.��
� For�forest�restoration,�maintain�areas�of�interior�habitat�equal�to�predevelopment�conditions.�Interior�habitat�requirements�(distance�to�forest�edge)�should�be�defined�in�the�biological�assessment.�
� Restoration�of�Brownfield�sites�must�result�in�removal�of�Brownfield�status.�This�should�result�in�land�that�is�suitable�for�development.�Note�that�this�includes�Brownfield�land�used�for�the�roadway�corridor.�
� If�a�specific�species�is�the�target�of�a�restoration�plan,�set�population�goals�for�the�target�species.�Plant�and�animal�species�are�both�acceptable,�but�must�be�native�to�the�project�region.�
� Other�restoration�goals�as�recommended�by�the�project�ecologist,�biologist,�or�other�restoration�expert.�Justification�of�this�goal�should�be�included�in�the�restoration�plan.�
While�these�metrics�represent�important�performance�indicators,�the�overall�goal�of�the�restoration�project�should�be�promotion�of�biodiversity�and�creation�of�dynamic,�functioning�habitat.�
DOCUMENTATION � Copy�of�the�executive�summary�from�the�biological�assessment.�� Copy�of�the�restoration/preservation�plan,�highlighting�the�boundaries�of�the�restored�areas�and�the�roadway�
project.�If�offsite,�provide�separate�plans�showing�both�areas.�� Copy�of�the�schedule�of�restoration�activities�or�preservation�efforts�demonstrating�that�the�completion�of�all�
restoration�activities�and�preservation�efforts�coincides�with�or�occurs�prior�to�opening�to�traffic.��
APPROACHES & STRATEGIES
� Follow�the�guidelines�for�habitat�restoration�outlined�in�the�Federal�Highway�Administration�Eco�logical:�An�Ecosystem�Approach�to�Developing�Infrastructure�Projects�(Brown,�2006).�Eco�logical�can�also�be�used�for�guidance�in�development�of�regional�ecological�frameworks.�This�document�is�available�at:�http://www.environment.fhwa.dot.gov/ecological/eco_index.asp�
� Involve�an�ecologist�or�other�biological�professional�early�in�the�planning�phase�of�the�project�to�determine�feasibility�of�restoration�work.�
� Coordinate�with�land�use�management�agencies�early�in�the�planning�phase�of�the�project�to�determine�scope�and�significance�of�potential�restoration�activities.�
� Coordinate�with�water�management�agencies�early�in�the�planning�phase�of�the�project�to�determine�IBI�for�the�biological�assessment,�especially�in�the�cases�where�stormwater�runoff�from�roadways�is�not�treated.�
184

Greenroads™ Manual v1.5 Environment & Water
EW-6 Habitat Restoration
� Use�geographic�information�systems�(GIS)�mapping�software�to�determine�calculations�for�disturbed�and�restored�surface�areas.�
� Anticipate�that�restoration�activities�take�a�significant�amount�of�thoughtful�planning,�and�are�best�started�prior�to�the�construction�of�the�roadway�project.�
� Start�a�community�stream�monitoring�effort.�Most�bioindicator�species�can�be�identified�by�amateurs�and�those�willing�to�learn�well�enough�to�establish�at�least�a�family�taxonomic�level.�(University�of�Washington,�2001)�
� Collaborate�with�adjacent�governing�agencies�to�create�mutually�beneficial�(and�potentially�mutually�funded)�restoration�projects�in�conjunction�with�the�roadway.�
� Coordinate�with�water�resources�professionals�early�in�the�planning�phase�of�the�project�to�develop�and�implement�a�watershed�management�plan�in�tandem�with�a�habitat�conservation�plan�(Brown,�2006).�Roadway�projects�can�be�integrated�into�both�types�of�plans,�including�establishing�minimum�goals�for�treatment�of�stormwater�impacts�on�water�quality�for�receiving�water�bodies�and�preservation�of�aquatic�habitat.�
� Avoid�introduction�of�invasive�species�through�landscaping�activities.�See�also�Credit�EW�5�Site�Vegetation.�
Example: Off-Site Mitigation - Springbrook Creek Wetland & Habitat Mitigation Bank
The�Springbrook�Creek�Wetland�&�Habitat�Mitigation�Bank�was�a�combination�of�wetland�enhancement�and�restoration�covering�130�acres�in�Renton,�Washington.�These�efforts�were�aimed�at�mitigating�the�increased�runoff�caused�by�construction�of�additional�lanes�on�Interstate�405�and�future�regional�transportation�projects,�as�well�as�creating�wildlife�habitat.�The�project�site�is�located�in�an�area�surrounded�by�heavy�development�and�two�major�freeways.�An�emphasis�was�placed�on�the�planting�of�a�large�variety�and�number�of�native�plants,�enhancing�the�attractiveness�of�the�site�to�local�fauna.�In�addition,�a�boardwalk�was�constructed�through�the�site�to�raise�public�awareness�of�the�importance�of�wetland�habitat.�Construction�was�completed�in�June,�2009.�Figures�EW�6.2�and�EW�6.3�show�the�restored�wetland�and�boardwalk,�as�well�as�local�wildlife.�
More�information�on�this�project�is�available�at:�http://www.wsdot.wa.gov/Projects/i405/Springbrook/�
�Figure�EW�6.2:�Geese�family�in�the�Springbrook�Creek�wetland�(Photo�by�WSDOT)�
�
185

Environment & Water Greenroads™ Manual v1.5
Habitat Restoration EW-6
�Figure�EW�6.3:�Great�blue�heron�perched�on�boardwalk�(Photo�by�WSDOT)�
�Example: Management Tools for Habitat Restoration
There�are�several�guidance�documents�available�for�roadway�projects�on�watershed�assessment�and�habitat�restoration�from�many�public�agencies.�� State�Wildlife�Action�Plans.�Comprehensive�wildlife�conservation�strategies�are�mandated�by�the�federal�
government�and�managed�by�the�states.�These�strategies�offer�broad�reaching�wildlife�goals�tailored�to�each�state.�Helpful�resources,�including�sample�plans,�are�available�through�the�Association�of�Fish�&�Wildlife�Agencies:�http://www.wildlifeactionplans.org�
� EPA’s�Handbook�for�Developing�Watershed�Plans�to�Protect�and�Restore�Our�Waters.�EPA�provides�a�wealth�of�informational�resources�on�watershed�planning:�http://water.epa.gov/polwaste/nps/handbook_index.cfm�
� The�National�Action�Plan�to�Implement�the�Hydrogeomorphic�Approach�to�Assessing�Wetland�Functions.�This�action�plan�provides�ways�to�measure�watershed�functions:�http://water.epa.gov/lawsregs/guidance/wetlands/hgm.cfm�
�Example: Indiana Department of Transportation and Indiana Bat Habitat
The�need�for�highway�improvements�near�the�Indianapolis�International�Airport�brought�together�several�agencies,�including�the�Indiana�Department�of�Transportation�and�the�local�Federal�Highway�Administration,�to�develop�a�plan�to�protect�and�conserve�local�habitat�for�the�Indiana�bat,�an�endangered�species.�The�plan,�called�the�HCP�(Habitat�Conservation�Plan)�has�the�following�features�that�would�help�meet�this�credit:�� 3,600�acres�protected�(approximately�10%�existing�bat�habitat)�� 346�acres�of�newly�planted�habitat�� A�public�outreach�program�� A�15�year�monitoring�program��The�HCP�was�completed�in�conjunction�with�approximately�$1.5�billion�in�highway�improvements�in�an�area�forecasted�for�high�urban�growth.�More�information�about�the�HCP�can�be�found�in�Eco�Logical�(Brown,�2006).�
�
POTENTIAL ISSUES
1. Ecologists�and�environmental�engineers�are�not�always�aware�of�all�biological�or�habitat�needs�of�all�species�that�may�be�targeted�for�a�habitat,�nor�can�all�of�the�resources�to�meet�these�needs�be�acquired�in�all�cases.�Thus,�there�is�a�large�amount�of�uncertainty�underlying�many�ecological�assumptions�made.�
186

Greenroads™ Manual v1.5 Environment & Water
EW-6 Habitat Restoration
2. Restored�or�engineered�wetland�and�habitat�areas�may�function�well,�but�placement�within�a�largely�developed�area�can�severely�limit�interaction�of�species�within�the�site.�
3. Adjacent�habitat�can�influence�whether�a�target�species�can�use�a�site�because�many�species�use�multiple�habitats�as�part�of�their�lifecycle.�In�particular,�most�large�species�also�do�not�live�in�one�habitat�during�their�entire�life.�
4. Habitat�age�can�influence�the�degree�to�which�species�use�an�area.�Created�sites�are�always�ecologically�young.�5. Completing�restoration�activities�in�tandem�with�roadway�construction�may�not�be�optimal.�Mitigating�
activities�such�as�restorations�often�function�best�when�completed�prior�to�the�start�of�construction�so�that�the�newly�mitigated�habitat�can�stabilize�and�be�fully�functional.�Specificity�of�design�does�not�necessarily�dictate�successful�use�by�particular�species�of�wildlife.�Detailed�targeting�efforts�do�not�always�work,�even�if�species�specific�design�features�of�a�habitat�are�incorporated.�
6. During�the�lifetime�of�a�habitat,�all�targeted�species�may�use�the�site,�but�not�necessarily�all�at�the�same�time.�Monitoring�expectations�should�therefore�be�set�accordingly.�
7. Some�habitats�cannot�be�fully�restored�to�predevelopment�conditions.�8. Loss�of�biodiversity�or�species�diversity�is�difficult,�if�not�impossible,�to�replace.�9. Many�newly�restored�habitats,�especially�sensitive�or�critical�ones,�may�not�function�as�efficiently�or�effectively�
as�planned�and�intended.�Only�some�of�the�functions�may�be�successfully�replaced�or�improved�artificially.�10. Planners�and�designers�should�be�taken�to�avoid�locating�or�creating�potentially�sensitive�habitat�near�edges�
and�boundaries�of�roadway�projects.�Where�possible,�the�roadway�clear�zone�should�be�maintained�to�preserve�safety�and�visibility.�
11. Monitoring�and�data�collection�efforts�should�be�tied�to�performance�metrics�determined�during�the�planning�stage�of�restoration�projects�to�make�them�meaningful.�
RESEARCH Natural�ecosystems�provide�a�variety�of�important�services�to�both�human�and�non�human�life,�and�rely�on�a�wide�array�of�complex�interactions�to�function.�Inevitably,�the�change�of�land�use�by�human�development�can�disrupt�these�delicate�processes,�or�eliminate�important�areas�of�ecosystem�altogether.�Habitat�restoration�is�the�process�of�retaining�the�natural�functionality�of�a�given�impacted�ecosystem,�through�local�improvement�or�the�creation�of�analogous�ecosystem�elsewhere.�In�practice,�many�restoration�projects�are�aimed�at�restoring�watershed�management�activities,�known�as�“wetland�restoration”.�However,�restoration�can�apply�to�damaged�non�aqueous�ecosystems�as�well,�which�are�not�always�regulated�to�similar�standards.�While�restoration�efforts�are�often�oriented�towards�a�particular�ecosystem�function,�it�is�recognized�that�ecosystems�function�most�effectively�under�natural�conditions�(EPA,�1994).�Restoration�is�a�delicate�process�requiring�significant�knowledge�of�the�specific�ecosystem�at�hand,�and�monitoring�efforts�are�usually�required�to�ensure�the�continuing�success�of�a�restored�habitat.�Legal�mandates�(primarily�the�Clean�Water�Act)�and�or�political�directives�generally�dictate�the�type�and�method�of�most�watershed�restoration�processes,�as�well�as�monitoring�requirements.��
Roads�and�Habitat�Loss�Roads�and�highways�can�negatively�impact�natural�habitat�in�a�number�of�ways.�These�impacts�have�traditionally�been�divided�into�destruction,�fragmentation,�and�degradation�of�habitat�(EPA,�1994;�Ament�et�al,�2008).�Destruction�refers�to�the�actual�replacement�of�habitat�by�roadway�placement.�This�includes�the�roadway�itself�as�well�as�any�substantially�altered�corridor.�Fragmentation�is�the�breaking�up�of�remaining�habitat�and�elimination�of�critical�migration�pathways.�In�addition,�fragmentation�of�habitat�area�increases�the�proportion�of�“edge”�habitat�exposed�to�the�outside�environment,�which�can�have�significantly�different�characteristics�from�interior�habitat�(Fuentes�Montemayor�et�Al,�2009).��Degradation�involves�disturbances�to�surrounding�habitat�due�to�factors�such�as�noise,�pollutant�contamination,�and�other�secondary�impacts.�Road�construction,�for�example,�can�introduce�invasive�species,�alter�soil�properties,�increase�erosion,�etc.�(Forman�and�Alexander,�1998).�
A�particularly�important�degradation�effect�of�roads�is�the�creation�of�polluted�runoff.�As�a�result�of�the�range�of�these�various�impacts,�road�construction�disturbs�habitat�in�an�area�much�greater�than�the�actual�roadway�corridor.�Because�roads�cover�approximately�one�percent�of�the�United�States,�their�ecological�effects�have�widespread�impacts�(Forman�and�Alexander,�1998).���
187

Environment & Water Greenroads™ Manual v1.5
Habitat Restoration EW-6
The�Importance�of�Habitat�Loss�Natural�ecosystems�provide�a�variety�of�important�services�to�both�human�and�non�human�life,�and�rely�on�the�presence�of�suitable�habitat�to�function.�Loss�of�habitat�disrupts�the�important�benefits�of�these�ecosystems.�Natural�processes�have�important�functions:�maintaining�air�and�water�quality,�regulating�climate,�production�of�goods,�and�other�important�processes�(Wilson,�2002).�The�global�value�of�these�services�has�been�estimated�to�be�between�16�and�54�trillion�dollars�annually�(Constanza�et�al,�1997).�
In�a�roadway�setting,�preservation�of�surrounding�habitat�can�aid�in�stormwater�control,�a�function�made�increasingly�important�by�the�extra�runoff�created�by�the�roadway�itself�(NCHRP,�2006).�In�addition,�habitat�destruction�leads�to�the�reduction�of�biodiversity�(Wilson,�2002).�Societal�acceptance�of�the�value�of�biodiversity�in�the�U.S.�has�been�exemplified�explicitly�in�legislation�such�as�the�Endangered�Species�Act�(1973),�which�states�that�“species�of�fish,�wildlife,�and�plants�are�of�esthetic,�ecological,�educational,�historical,�recreational,�and�scientific�value�to�the�Nation�and�its�people“.�In�addition,�biodiversity�is�often�considered�an�economic�good�based�on�its�importance�in�science,�industry,�and�medicine.�Therefore,�preservation�of�biodiversity�is�vital�to�both�to�ecosystem�health�and�human�health�(Wilson,�2002).����
Precedent�for�Restoration�Most�of�the�required�habitat�restoration�in�the�United�States�is�mandated�by�Section�404�of�the�Clean�Water�Act,�which�regulates�activity�in�U.S.�waters�including�wetlands.�To�obtain�a�permit�under�this�act,�the�developer�must�show�that�measures�have�been�taken�to�avoid�and�reduce�wetland�impacts,�and�that�any�necessary�impacts�have�been�compensated�for�(EPA,�2009a).�Habitat�restoration�can�be�considered�a�form�of�compensation�through�the�creation�of�new�wetland�environments.�Construction�of�wetlands�has�also�traditionally�been�used�as�a�“best�management�practice”�for�acquisition�of�a�permit�under�the�National�Pollutant�Discharge�Elimination�System�(NPDES),�which�is�generally�required�by�the�Clean�Water�Act�when�construction�will�cause�pollutant�discharge�to�surface�waters�(NCHRP,�2006).��
In�addition,�habitat�restoration�can�be�employed�to�meet�the�requirements�of�the�Endangered�Species�Act.�Actions�which�would�cause�incidental�harm�to�a�conserved�species�(including�habitat�loss)�require�submittal�of�a�Habitat�Conservation�Plan�(HCP).�These�HCP’s�must�show�that�“the�applicant�will,�to�the�maximum�extent�practicable,�minimize�and�mitigate�the�impacts�of�the�taking”.�Similar�to�the�provisions�of�the�clean�water�act,�restoration�of�previously�disturbed�habitat�can�satisfy�requirements�for�mitigation�efforts.�(U.S.�FWS,�2009)�
Brownfield�Restoration�The�term�brownfield�refers�to�an�area�in�which�development�or�use�has�been�complicated�by�a�threat�of�contamination.�This�is�commonly�a�result�of�previous�industrial�use�but�is�caused�by�other�activities�as�well.�Remediation�of�these�areas,�which�usually�involves�soil�and�groundwater�cleanup,�can�convert�the�land�back�to�usable�condition.�This�increases�the�value�of�the�property�and�can�help�preserve�undeveloped�land.�Private�developers�are�often�reluctant�to�remediate�brownfields�due�to�financial�risks�and�liability�issues,�however�many�different�government�agencies�incentivize�these�activities�(Opp,�2009).�The�Environmental�Protection�Agency�(EPA)�has�created�a�Brownfields�Program�that�provides�funding�to�brownfield�revitalization�projects,�which�has�in�turn�contributed�to�higher�levels�of�owner�investment,�creation�of�jobs,�and�increases�in�nearby�property�values�(EPA,�2009).�In�addition,�each�state�has�their�own�brownfield�program,�providing�varying�levels�of�funding�and�liability�protection�for�cleanup�efforts�(Opp,�2009).��
A�number�of�treatment�methods�exist�for�the�removal�of�hazardous�pollutants�from�soil�and�groundwater.�These�can�be�broken�down�into�techniques�that�remove�contaminants�through�biological,�chemical,�or�physical�processes�(Hamby,�1996).�Bioremediation�refers�to�the�use�of�microorganisms�that�can�break�down�or�transform�dangerous�chemical�compounds�through�their�own�metabolic�pathways.�When�appropriate,�this�can�be�a�low�cost�alternative�to�other�remediation�options�(Hamby,�1996,�EPA,�1991).�Phytoremediation,�another�example�of�a�biological�approach,�uses�plants�to�clean�soil�and�groundwater�through�sorption�and�water�uptake.�Chemical�methods�rely�on�the�introduction�of�compounds�that�can�destroy,�transform,�bind�to,�or�otherwise�render�contaminants�harmless.�Finally,�physical�techniques�include�treatments�such�as�stripping,�pumping,�and�washing�of�the�soil�or�water�in�question�(Hamby,�1996).�Both�of�these�categories�are�to�numerous�and�varied�to�be�discussed�in�detail�here.��
188

Greenroads™ Manual v1.5 Environment & Water
EW-6 Habitat Restoration
Index�of�Biological�Integrity�The�Index�of�Biological�Integrity�(IBI)�is�a�multi�metric�assessment�tool�that�characterizes�the�biological�functionality�of�a�water�body�based�on�a�number�of�sensitive�biological�measures.�Specifically,�IBI�(and�other�derivatives�of�this�metric)�measures�the�impacts�of�human�activities�on�biological�communities.�Integrity�of�living�systems�within�a�water�body�is�required�to�perform�necessary�ecosystem�services�(Karr�and�Chu,�1997).��Thus,�“biological�integrity”�is�the�“ability�to�support�and�maintain�a�balanced,�integrated�adaptive�assemblage�of�organisms�having�species�composition,�diversity,�and�functional�organization�comparable�to�that�of�natural�habitat�of�the�region"�(Karr�and�Dudley,�1981).�As�a�result,�the�IBI�provides�important�information�about�the�condition�of�a�water�body�relative�to�surrounding�levels�of�human�influence.�A�key�point�is�that�determination�of�the�IBI�requires�trained�biologists�familiar�with�the�specific�aquatic�ecosystem.�
Additionally,�since�it�is�a�relative�measure,�use�of�the�IBI�requires�determining�a�reference�condition�for�the�area.�The�EPA�(2006)�describes�the�reference�condition�for�biological�integrity,�RC(BI),�as�“the�natural�biological�condition�of�a�water�body,�undisturbed�by�human�activity.�As�a�conceptual�aid,�it�is�useful�to�think�of�an�absolute�‘natural’�or�pristine�condition�that�could�exist�in�the�absence�of�all�historical�and�current�human�disturbances.�This�definition�recognizes�the�need�for�a�reference�condition�term�reserved�for�‘naturalness’�or�’biological�integrity’�even�though�we�might�only�approximate�it�in�most�parts�of�the�world.”�It�also�requires�some�level�of�data�collection,�some�of�which�may�already�be�established�via�continuous�monitoring.�Data�for�computing�IBI�scores�is�based�on�the�“lowest�practical�taxonomic�level”�which�means�to�the�furthest�taxonomic�extent�allowed�by�current�science�(University�of�Washington,�2001)�for�local�“bioindicator�species”�(EPA,�2009b)�for�purposes�of�this�credit.�Examples�of�common�bioindicator�species�are�macroinvertebrates,�which�are�aquatic�insects�(“benthos,”�hence,�the�Benthic�IBI).�
GLOSSARY
Benthos� Greek�for�macroinvertebrates�B�IBI� Benthic�Index�of�Biological�IntegrityBiodiversity� Total�number�of�species�present�Bioindicator� See�“indicator�species”Biological�Integrity� The�ability�to�support�and�maintain�a�balanced,�integrated�adaptive�
assemblage�of�organisms�having�species�composition,�diversity,�and�functional�organization�comparable�to�that�of�natural�habitat�of�the�region�(Karr�and�Dudley,�1981).�
Brownfield� An�area�made�unsuitable�for�development�by�previous�use,�commonly�industrial.��
Ecosystem�Services� Natural�processes�that�provide�benefits�for�humankind�Fragmentation� Division�of�a�single�population�or�disruption�of�migration�routes�between�
smaller�populations�IBI� Index�of�Biological�IntegrityIndicator�species� A�species�which�responds�predictably�to�stressors�from�human�disturbance�
(EPA,�2009b)�RC(BI)� Reference�condition�for�biological�integrityReference�condition� The�natural�biological condition�of�a�water�body,�undisturbed�by�human�
activity.�As�a�conceptual�aid,�it�is�useful�to�think�of�an�absolute�‘natural’�or�pristine�condition�that�could�exist�in�the�absence�of�all�historical�and�current�human�disturbances�(EPA,�2006)�
Total�disturbed�area� Any�area�disturbed�for�construction�activities�including�construction�staging�areas�and�cleared�or�stripped�plant�life,�but�not�including�any�areas�designated�for�restoration�or�habitat�creation�purposes�
�
189

Environment & Water Greenroads™ Manual v1.5
Habitat Restoration EW-6
REFERENCES Association�of�Fish�&�Wildlife�Agencies.�(2007).�State�Wildlife�Action�Plans:�About.�Accessed�October�7,�2010.�
Available�at�http://www.wildlifeactionplans.org/about/index.html.�
Brown,�J.�and�U.S.�Department�of�Transportation,�Federal�Highway�Administration,�Research�and�Innovative�Technology�Administration,�Volpe�Transportation�Research�Center.�(2006,�April).�Eco�logical:�An�Ecosystem�Approach�to�Developing�Infrastructure�Projects.�[FHWA�HEP�06�011].�Washington,�DC:�Office�of�Project�Development�and�Environmental�Review,�Federal�Highway�Administration,�U.S.�Department�of�Transportation.�
Costanza,�R.,�d’Arge,�R.,�de�Groot,�R.,�Farber,�S.,�Grasso,�M.,�Hannon,�B.,�Limburg,�K.,�Naeem,�S.,�O’Neill,�R.V.,�Paruelo,�J.,�Raskin,�R.G.,�Sutton,�P.,�van�den�Belt,�M.�(1997).�The�value�of�the�world’s�ecosystem�services�and�natural�capital.�Nature,�387,�253�260.�
Endangered�Species�Act�of�1973�§�16�U.S.C.�§�1531� �
Federal�Interagency�Stream�Restoration�Working�Group�(2001).�Stream�Corridor�Restoration:�Principles,�Processes,�and�Practices.������������������������������������������������http://www.nrcs.usda.gov/technical/stream_restoration/newtofc.htm�
Forman,�R.�and�Alexander,�L.�(1998).�Roads�and�their�major�ecological�effects.�Annual�Review�of�Ecology�and�Systematics,�29,�207�231.��
Forman,�R.T.T.�and�Deblinger�R.D.�(2000).�The�Ecological�Road�Effect�Zone�of�a�Massachusetts�Suburban�Highway.�Conservation�Biology.�14,�1,�36�46.�
Hackney,�C.�T.�(1998).�Habitat�Restoration:�"Goal�Setting�and�Success�Criteria�for�Coastal�Habitat�Restoration"�Dept.�Biological�Sciences,�University�of�North�Carolina�at�Wilmington.��
Hamby,�D.M.�(1996).�Site�remediation�techniques�supporting�environmental�restoration�activities��a�review.�The�Science�of�the�Total�Environment.�191,�203�224.��
Karr,�J.R.,�Chu,�E.W.�(1997).�Biological�Monitoring�and�Assessment:�Using�Multimetric�Indexes�Effectively.�(EPA�235�R97�001)�
Karr,�J.R.�and�Dudley,�D.R.�(1981).�Ecological�perspective�on�water�quality�goals.�Environmental�Management,�5:55�68.�
Kentula,�M.�E.�(1998).�Perspectives�on�Setting�Success�Criteria�for�Wetland�Restoration�in:�Habitat�Restoration:�"Goal�Setting�and�Success�Criteria�for�Coastal�Habitat�Restoration"�Dept.�Biological�Sciences,�University�of�North�Carolina�at�Wilmington.�http://www.csc.noaa.gov/lcr/text/confsumm.html�
Keim,�R.F.,�A.B.�Price,�T.S.�Hardin,�A.E.�Skaugset,�D.S.�Bateman,�R.E.�Gresswell,�and�S.D.�Tesch.�(2003).�An�Annotated�Bibliography�of�Selected�Guides�for�Stream�Habitat�Improvement�in�the�Pacific�Northwest.�Research�Contribution�44,�Forest�Research�Laboratory,�Oregon�State�University,�Corvallis.�
Miller,�J.R.,�Hobbs,�R.J.�(2007).�Habitat�Restoration:�Do�We�Know�What�We’re�Doing?�Restoration�Ecology.�15,3,�382�390�
Montemayor�Fuentes,�E.,�Cuaron,�A.D.,�Vasquez�Dominguez�E.,�Malvido�Benitez,�J.,�Valenzuela�Galvan,�D.,�Andresen,�E.�(2009).�Living�on�the�edge:�roads�and�edge�effects�on�small�mammal�populations.�Journal�of�Animal�Ecology,�78,�857�865.�
190

Greenroads™ Manual v1.5 Environment & Water
EW-6 Habitat Restoration
National�Cooperative�Highway�Research�Program,�National�Research�Council�(U.S.),�American�Association�of�State�Highway�and�Transportation�Officials,�Oregon�State�University,�University�of�Florida,�GeoSyntec�Consultants,�et�al.�(2006).�Evaluation�of�best�management�practices�for�highway�runoff�control.�(Report�565)�Washington,�D.C.:�Transportation�Research�Board.�Washington,�DC:�Transportation�Research�Board.��
North�Carolina�Department�of�Transportation.�(2003).�Awards:�Lengyel�Mitigation�Site�in�New�Bern.�http://www.ncdot.org/programs/environment/awards/Lengyel.html�and�http://www.ncdot.org/doh/preconstruct/pe/NEU/Monitoring/2003Monitoring/LengyelReport2003.pdf�
Opp,�S.M.�(2009).�Experiences�of�the�States�in�Brownfield�Redevelopment.�Environmental�Practice.�11,�270�284.�
University�of�Washington.�Columbia�Basin�Research.�School�of�Fisheries�and�Aquatic�Sciences.�(2001,�June�29).�Salmonweb:�Community�Based�Monitoring�for�Biological�Integrity�of�Streams.�Accessed�December�1,�2009.�Available�at�http://www.cbr.washington.edu/salmonweb/��
U.S.�Environmental�Protection�Agency.�(1991).�Understanding�Bioremediation:�A�Guidebook�for�Citizens.�[EPA�540�2�91�00].�Washington�D.C.�
U.S.�Environmental�Protection�Agency.�(1994).�Evaluation�of�Ecological�Impacts�from�Highway�Development.�[EPA�300�B�94�006].�Washington,�DC:�Office�of�Federal�Activities.�
U.S.�Environmental�Protection�Agency.�(2006).�Best�Practices�for�Identifying�Reference�Conditions�in�Mid�Atlantic�Streams.�[EPA�260�F�06�002].�Washington,�DC:�Office�of�Environmental�Information.�
U.S.�Environmental�Protection�Agency.�(2009).�Wetland�Regulatory�Authority�from:�http://www.epa.gov/owow/wetlands/pdf/reg_authority_pr.pdf�
U.S.�Environmental�Protection�Agency.�(2010)�Brownfields�and�Land�Revitalization.�Retrieved�September�30th,�2010�from:�http://epa.gov/brownfields/�
Rumps,�J.M.,�S.L.�Katz,�K.�Barnas,�M.D.�Morehead,�R.�Jenkinson,�S.R.�Clayton,�P.�Goodwin.�(2007).�Stream�Restoration�in�the�Pacific�Northwest:�Analysis�of�Interviews�with�Project�Managers.�Restoration�Ecology�15,�3,�506�515.�
Sudduth,�E.B.,�Meyer,�J.L.,�Berhardt,�E.S.�(2007).�Stream�Restoration�Practices�in�the�Southeastern�United�States.�Restoration�Ecology.�15,�3,�573�583�
U.S.�Environmental�Protection�Agency.�(2009b,�December�31).�EPA�|�About�Biological�Indicators.�Accessed�January�9,�2010.�Available�at�http://www.epa.gov/bioindicators/html/about.html��
U.S.�Fish�and�Wildlife�Service.�(2009).�Habitat�Conservation�Plans�Under�the�Endangered�Species�Act.�Arlington,�VA:�Endangered�Species�Program.��
Wilson,�E.�O.�(2002).�The�future�of�life.�New�York:�Alfred�A.�Knopf.��� �
191

Environment & Water Greenroads™ Manual v1.5
Habitat Restoration EW-6
��
192

Greenroads™ Manual v1.5 Environment & Water
EW-7 Ecological Connectivity
ECOLOGICAL CONNECTIVITY GOAL Provide�or�improve�wildlife�access�and�mobility�across�roadway�facility�boundaries�and�reduce�vehicle�wildlife�collisions�and�related�accidents.�
CREDIT REQUIREMENTS Complete�a�site�specific�wildlife�assessment�for�the�roadway�project.�Report�the�resulting�impacts�that�the�roadway�has�on�surrounding�major�ecosystems,�identifying�all�non�human�life�that�is�impacted�by�the�roadway�facility�according�to�the�best�scientific�knowledge�available�for�the�ecosystem.�Both�point�scenarios�below�require�approval�of�the�project�ecologist.�
AND�
Complete�one�of�the�two�of�the�following�options:�
OPTION�A���Existing�Alignments�ONLY�(1�point)�Replace�in�kind,�retrofit,�or�upgrade�any�and�all�existing�culverts�and�wildlife�fencing�structures�deemed�structurally�deficient,�damaged,�obsolete,�insufficiently�sized,�or�otherwise�inadequate.�
OR�
OPTION�B���New�and�Existing�Alignments�(3�points)�Install�new�dedicated�wildlife�crossing�structures�and�protective�fencing�(if�needed)�as�recommended�by�the�wildlife�assessment.�In�addition,�existing�alignments�must�also�replace�in�kind,�retrofit,�or�upgrade�all�existing�culverts�and�fencing�structures�deemed�structurally�deficient,�damaged,�obsolete,�insufficiently�sized,�or�otherwise�inadequate.�
Details
Dedicated�wildlife�crossings�are�structural�features�of�the�roadway�that�are�not�used�by�motorized�vehicles.�Where�deemed�appropriate�by�an�ecologist,�crossings�may�be�shared�by�non�motorized�modes�of�transport.�No�points�will�be�awarded�in�the�following�conditions:�
1. For�projects�that�maintain�or�rehabilitate�existing�ecological�connections�to�out�of�date�or�current�standards�(i.e.�routine�maintenance�of�drainage�culverts�does�not�qualify).�
2. Pre�existing�ecological�connectivity�features:�all�new�features�or�upgrades�must�be�due�to�and�completed�as�part�of�the�roadway�project.�
3. Projects�that�add�wildlife�connectivity�features�where�such�features�are�clearly�outside�of�the�project�context.�
4. Projects�located�in�a�network�that�is�systematically�inadequate.�However,�points�could�be�awarded�for�such�projects�where�it�is�demonstrated�that�a�program�is�in�place�at�the�owner�agency�for�systematic�improvements�on�that�network,�and�that�this�project�fits�this�program.�
�
EW-7
1-3 POINTS
RELATED CREDITS
� PR�1�Environmental�Review�Process�
� PR�10�Site�Maintenance�Plan�
� EW�6�Habitat�Restoration�
� AE�1�Safety�Audit�
SUSTAINABILITY COMPONENTS
� Ecology�� Experience�
BENEFITS
� Restores�Habitat�� Reduces�Manmade�
Footprint�� Improves�Access�� Improves�Mobility�� Improves�Human�
Health�&�Safety�
193

Environment & Water Greenroads™ Manual v1.5
Ecological Connectivity EW-7
DOCUMENTATION 1. Copy�of�the�executive�summary�of�the�ecological�study�performed�for�the�project.�At�minimum,�this�summary�
should�contain:�
a. Site�location�map�and�site�plan.�Highlight�locations,�types�and�sizes�of�ecological�connections�in�the�facility.�b. A�list�of�non�human�species�identified.�Include�common�name,�Latin�name,�size,�photos�of�the�species,�and�
highlight�the�largest�species.�c. The�size�of�the�connection�required�in�order�to�accommodate�the�largest��species�identified�above�d. A�list�of�planned�new�dedicated�connections,�new�culverts�and�fencing�to�be�installed,�and�any�upgraded�
culverts�and�fencing�installations.�e. Signature�of�the�project�ecologist.�
2. Photos�of�all�culverts�and�fencing�(new�and�upgraded,�if�any)�and�dedicated�crossings�after�construction.�Use�a�familiar�object�in�the�photo�for�scaling�purposes�(hammer,�measuring�tape,�shovel,�etc.)�or�provide�scale�on�the�image.�
APPROACHES & STRATEGIES
� For�existing�projects,�use�roadkill�data�to�identify�key�species�in�the�project�area.�In�addition,�if�underpasses�or�other�similar�structures�exist�for�other�purposes�than�ecological�connectivity,�monitor�animal�or�aquatic�organism�movement�through�these�passages.��
� For�new�and�existing�projects,�determine�the�makeup�of�animal�populations�in�the�area�and�migration�patterns.�Animal�population�data�can�be�obtained�from�existing�ecological�records�or�by�more�traditional�methods�such�as�the�analysis�of�tracks�or�other�identifying�animal�features.�Migration�patterns�can�be�predicted�using�GIS�landscape�data,�GPS�tracking�collars,�analysis�of�animal�tracks,�and�most�commonly�through�use�of�cameras�along�the�proposed�or�existing�roadway.��
Example: Case Study - Banff National Park of Canada
Banff�National�Park�in�Canada�Highway�Fencing�and�Wildlife�Crossings�is�an�example�of�one�of�the�first�and�most�successful�projects�to�accommodate�terrestrial�habitat�connectivity.�In�response�to�high�and�rising�traffic�volumes,�sections�of�the�Trans�Canada�Highway�(TCH)�have�been�upgraded�from�a�two�lane�to�a�four�lane�divided�highway�in�Banff�National�Park.�
To�reduce�the�negative�impacts�of�a�larger�highway�on�wildlife�populations�in�Banff�National�Park:�
� Fencing�has�been�installed�on�both�sides�of�the�twinned�highway�sections�to�prevent�large�animals�from�getting�onto�the�highway.�Vehicle�wildlife�collisions�have�been�significantly�reduced.��
� Wildlife�underpasses�and�overpasses�have�been�installed�to�connect�vital�habitats�and�help�sustain�biodiversity.��
� In�1996,�the�highway�mitigation�research�project�began�studying�the�impacts�of�roads�on�wildlife�in�terms�of�road�mortality,�wildlife�movements�and�habitat�connectivity�in�the�Bow�Valley.�Research�results�are�being�applied�in�highway�upgrade�projects�in�the�mountain�parks�and�beyond,�including�other�countries.��
�Examples�of�connectivity�structures�are�shown�in�figures�EW�7.1�and�EW�7.2�below.�
194

Greenroads™ Manual v1.5 Environment & Water
EW-7 Ecological Connectivity
Figure�EW�7.1:�Wolverine�overpass� Figure�EW�7.2:�Deer�using�a�bridge�crossing�(http://www.pc.gc.ca/pn�np/ab/banff/docs/routes/sec3/page42_e.asp#redearth3)�
�For�more�information,�visit:�http://www.pc.gc.ca/pn�np/ab/banff/index_e.asp.��
Example: Case Study – Interstate 90 Snoqualmie Pass East Mitigation Project
Interstate�90,�which�stretches�across�the�northern�United�States,�is�currently�undergoing�a�number�of�improvements�along�a�five�mile�stretch�between�Hyak�and�Keechelus�Dam�including�the�addition�of�two�lanes�and�a�number�of�connectivity�features.�This�stretch�of�highway�is�a�vital�corridor�connecting�eastern�and�western�Washington�State.�To�meet�the�ecological�needs�of�the�area,�Washington�State�Department�of�Transportation�has�identified�a�number�of�Connectivity�Emphasis�Areas�(CEAs)�that�link�vital�patches�of�aquatic�or�terrestrial�habitat.�
To�facilitate�connectivity�across�the�roadway,�these�CEA’s�will�feature:�
� Bridges�ranging�from�120�to�900�feet�in�length�as�well�as�a�number�of�culverts�to�preserve�aquatic�migratory�ability�and�hydrologic�function.�
� Three�over�road�wildlife�crossings�combined�with�fences�to�direct�animals�to�these�locations.�
For�more�information,�visit:�http://www.wsdot.wa.gov/Projects/I90/SnoqualmiePassEast/Default.htm.�
POTENTIAL ISSUES
1. Identifying�ecological�connectivity�requirements�needs�well�designed�long�term�studies.�In�many�cases�these�may�need�to�be�conducted�over�multiple�years.�
2. Lack�of�ecological�or�species�data.�3. Development�conflicts�with�ecologically�sensitive�areas.�4. Design�of�connectivity�structures�that�will�be�accepted�and�used�by�target�organisms�can�be�difficult.�5. For�new�projects,�prior�migration�patterns�and�other�animal�and�aquatic�organism�behaviors�may�be�altered�by�
the�presence�of�the�roadway.�This�should�be�carefully�considered�as�a�long�term�impact,�especially�during�environmental�review.�
6. In�general,�cases�where�this�credit�may�not�be�appropriate�are�rare,�even�in�urban�environments,�but�are�heavily�dependent�on�available�ecosystem�data.�This�data�may�not�be�available�in�urbanized�ecosystems�that�are�not�closely�monitored.�
7. In�rare�cases,�projects�that�have�conducted�an�ecological�study�may�determine�that�ecological�connections�will�undermine�the�safety�of�human�users.�
195
Environment & Water Greenroads™ Manual v1.5
Ecological Connectivity EW-7
RESEARCH What�is�ecological�connectivity?��Ecological�connectivity�is�the�relative�ease�with�which�dispersive�and�dynamic�ecological�processes�(such�as�species�migration,�water�movement,�soil�transmission,�pollination,�etc.)�occur�across�various�ecosystem�boundaries�(Interstate�90�Snoqualmie�Pass�Development�Team�2006).�In�Greenroads,�specifically,�ecological�connectivity�refers�to�the�movement�of�non�human�organisms�(wildlife�and�plant�species)�across�various�manmade�ecosystem�boundaries,�such�as�roadways.�An�ecological�connection�is�a�deliberate�attempt�to�provide�a�pathway�for�transmission�of�non�human�life�across,�under,�above,�or�through�a�roadway�project�footprint�without�impacting�the�safety�of�human�users.�
Consideration�of�and�compensation�for�adverse�effects�on�ecological�connectivity�are�not�specific�requirements�of�the�National�Environmental�Policy�Act�(NEPA)�or�state�environmental�laws.�Instead,�consideration�of�ecological�connectivity�is�driven�by�stakeholders,�regulatory�and�natural�resource�agencies�such�as�the�U.�S.�Army�Corps�of�Engineers�(USACE),�Environmental�Protection�Agency�(through�Section�404�of�the�Clean�Water�Act),�the�U.�S.�Fish�and�Wildlife�Service,�federal�land�management�agencies,�or�the�state�natural�resources�management�agency.��
Why�is�ecological�connectivity�important?�Migration�ability�is�necessary�to�the�survival�of�many�species,�and�roads�that�disrupt�vital�habitat�corridors�have�the�potential�to�seriously�debilitate�an�ecosystem.�Animal�crossing�of�traditional�roads�has�huge�costs�in�the�form�of�human�and�animal�life�in�addition�to�monetary�losses.�However,�with�careful�planning,�wildlife�crossing�can�be�effectively�facilitated�in�a�safe�and�non�disruptive�manner.�It�is�important�to�note�that�there�is�no�single�solution�to�every�connectivity�problem,�and�there�is�not�necessarily�a�solution�for�every�species�that�might�be�encountered�on�a�project.�When�well�researched�and�tailored�to�a�specific�project,�connectivity�features�have�the�potential�to�create�safer�roads,�improve�habitat,�and�save�money.�Establishing�or�maintaining�ecological�connectivity�for�existing�and�new�projects,�respectively,�will�reduce�the�long�term�ecological�impacts�of�roads,�help�to�sustain�populations,�and�possibly�reduce�the�need�for�legal�protection�for�species.�
Access�&�Mobility�for�Wildlife�Among�the�animal�kingdom,�there�are�few�species�that�live�in�single,�static�ranges�throughout�their�lifetimes.�Suitable�habitat�for�a�specific�species�might�only�be�found�in�small�parcels�throughout�a�region,�which�often�forces�a�species�to�inhabit�small�isolated�chunks�of�land.�This�population�structure�is�defined�as�a�metapopulation,�or�a�group�of�small�populations�which�make�up�the�total�population.�Because�of�low�genetic�variability�within�these�smaller�populations,�the�threat�of�individual�group�extinction�and�the�need�for�a�constant�food�source,�connectivity�between�different�habitat�patches�is�vital�for�the�survival�of�many�species�(Freeman�et�al.�2005).�Ilka�Hansi,�who�extensively�studied�Glanville�butterfly�populations�in�one�of�the�defining�studies�of�population�dynamics,�concluded�that�the�ability�of�smaller�populations�to�be�replaced�by�individuals�from�other�groups�is�necessary�to�avoid�extinction�(Hanski,�1995).�
Roadways�and�highways�are�long�linear�structures�which�can�often�separate�animals�from�important�destinations,�resulting�in�a�loss�of�ecosystem�functionality�for�those�that�do�not�attempt�to�cross�and�a�more�direct�hazard�in�the�form�of�automobile�collision�for�those�that�do.�In�the�Appalachians,�areas�in�which�black�bears�commonly�attempt�to�cross�roads�have�significant�mortality�rates,�while�higher�traffic�roads�deter�bear�crossing�and�force�small,�isolated�populations�threatened�by�low�genetic�variability�(Donaldson�2007).�In�addition�to�terrestrial�animals,�population,�genetic�diversity,�and�long�term�survival�of�many�fish�species�can�be�significantly�reduced�by�loss�of�migration�ability,�which�can�be�hindered�or�prevented�by�typical�culverts�found�at�stream�and�river�crossings.�(Mirati�1999,�Fitch�1995)�
Human�Safety�The�crossing�of�roadways�by�animals�has�a�very�direct�human�cost�as�well.�In�2002,�an�estimated�1.5�million�collisions�between�automobiles�and�deer�occurred�in�the�United�States,�killing�about�150�people�and�causing�over�$1.1�billion�in�vehicle�damage.�(Hedlund�et.�Al�2003)�In�this�case,�there�is�little�threat�to�the�survival�of�the�species.�In�fact,�the�rapid�growth�rate�of�deer�population�indicates�that�this�trend�will�worsen�over�time.��
196

Greenroads™ Manual v1.5 Environment & Water
EW-7 Ecological Connectivity
In�most�cases,�the�installation�of�wildlife�passage�structures�has�led�to�increased�animal�crossing�and�reduced�collisions,�and�federal�funding�has�been�made�available�for�such�projects�under�the�Transportation�Equity�Act�of�1998.�(Hartmann�2003)�For�mammal�crossing�the�most�effective�crossing�systems�have�been�underpasses�coupled�with�fencing�to�funnel�animals�to�the�appropriate�point�(Hedlund�et.�al�2003;�Dodd�et.�al�2007).�Important�factors�influencing�the�use�of�such�underpasses�include�the�height�of�the�underpass,�surrounding�vegetation,�and�type�of�ground�surface�visible�(Donaldson�2007;�Dodd�et.�Al�2007).�Underpass�use�is�reported�for�deer�alone�in�seven�different�states,�and�both�underpasses�and�overpasses�have�been�used�to�allow�passage�of�elk,�bear,�panther,�mountain�goats,�and�salamanders�(Hartmann�2003;�Romin�and�Bissonette�1996).�A�series�of�underpasses�and�fencing�on�the�newly�reconstructed�Arizona�SR�260�is�estimated�to�save�$1�million�dollars�per�year�by�preventing�collisions�(primarily�with�elk),�which�have�been�reduced�56%�from�1992�1997�levels�despite�increased�traffic�volume.�(Dodd�et.�Al�2007,�Brown�and�Laird�1999)�In�Virginia,�underpasses�were�effectively�used�by�deer,�raccoons,�groundhogs,�and�a�wide�range�of�other�mammals,�birds,�amphibians�and�reptiles,�but�were�unable�to�allow�the�passage�of�black�bears,�one�of�the�targets�of�the�project.�(Donaldson�2007)�When�properly�researched�and�constructed,�underpasses�can�provide�critical�passageways�for�animals,�but�there�is�no�guarantee�that�a�given�population�will�be�willing�to�use�such�structures�without�prior�evidence.�
Aquatic�Connectivity�Culvert�design�for�stream�and�river�crossings�can�have�an�important�impact�on�the�ability�of�fish�to�successfully�cross�a�roadway.�High�water�velocities�caused�by�steep�slopes�and�narrowed�flow�are�often�impassable�to�certain�fish�species�(Belford�and�Gould�1989).�Because�of�this�and�other�factors,�the�slope�of�a�culvert�plays�a�key�role�in�the�effectiveness�of�a�crossing.�Ideally,�culverts�will�be�placed�at�grade�with�the�stream.�Culverts�at�lower�grade�risk�causing�dangerous�hydraulic�jumps�or�outlet�drops,�while�steep�grades�typically�mean�higher�velocity�flows�(Fitch�1995).�While�bridges�are�the�most�effective�way�to�eliminate�impediment�of�fish�travel,�this�is�often�a�prohibitively�expensive�option.�Well�designed�culverts�with�controlled�flow�velocity�placed�at�grade�can�successfully�accommodate�fish�passage�and�are�generally�a�more�feasible�alternative�(Fitch�1995).��
Additional�Resources�&�Tools�� The�most�comprehensive�review�of�relatively�recent�work�for�ecological�connections�and�societal�benefits�is�
presented�in�a�book�called�Road�Ecology:�Science�and�Solutions�by�R.�T.�T.�Forman�et�al.�(2003).�� The�Federal�Highway�Administration’s�website�called�“Wildlife�Protection�and�Habitat�Connectivity”�includes�
several�hundred�examples�of�projects�implemented�around�the�United�States�and�Europe:�http://www.fhwa.dot.gov/environment/hconnect/index.htm�
� Current�research,�policy�issues,�and�best�practices�are�posted�by�North�Carolina�State�University's�Institute�for�Transportation�Research�and�Education,�Center�for�Transportation�and�the�Environment�“Wildlife�Fisheries�and�Transportation�Web�Gateway”���http://www.cte.ncsu.edu/cte/gateway/home.asp��
GLOSSARY
Ecological�connection� A�deliberate�attempt�to�provide�a�pathway�for�transmission�of�non�human�life�across,�under,�above,�or�through�a�roadway�project�footprint�without�impacting�the�safety�of�human�users�
Ecological�connectivity� the�movement�of�non�human�organisms�(wildlife�and�plant�species)�across�various�manmade�ecosystem�boundaries,�such�as�roadways�
Genetic�diversity� The�number�of�different�kinds�of�genes�that�exist�within�a�population�or�group.�Populations�with�low�genetic�diversity�are�less�likely�to�be�able�to�adapt�to�changing�environmental�pressures�and�are�therefore�at�higher�risk�of�extinction.��
Metapopulation� A�population�consisting�of�a�number�of�smaller�dispersed�populations.�Individual�organisms�typically�move�between�smaller�groups�to�maintain�a�healthy�ecosystem.��
197

Environment & Water Greenroads™ Manual v1.5
Ecological Connectivity EW-7
REFERENCES Belford,�D.A�and�Gould,�W.R.�(1989)�An�Evaluation�of�Trout�Passage�Through�Six�Highway�Culverts�in�Montana.�
North�American�Journal�of�Fisheries�Management�9,�437�445.�
Brown,�Douglas,�Laird,�James�(1999)�Methods�Used�by�the�Arizona�Department�of�Transportation�to�Reduce�Wildlife�Mortality�and�Improve�Highway�Safety.�Arizona�Department�of�Transportation.� ���
Clevenger,�Anthony.�(1998).�Permeability�of�the�Trans�Canada�Highway�to�Wildlife�in�Banff�National�Park:�The�Importance�of�Crossing�Structures�and�Factors�Influencing�Their�Effectiveness.�Proceedings�of�the�International�Conference�on�Wildlife�Ecology�and�Transportation.�February�10��12,�Ft.�Meyers,�Florida.�FL�ER�69�98:�pp.109�119.�
Damas�and�Smith,�Ltd.�(1982).�Wildlife�Mortality�in�Transportation�Corridors�in�Canada's�National�Parks��Impact�and�Mitigation.�Parks�Canada.�2�volumes.�
Dodd,�N.L.,�J.W.�Gagnon,�S.�Boe,�A.�Manzo,�Schweinsburg�(2007)�Evaluation�of�Measures�to�Minimize�Wildlife�Vehicle�Collisions�and�Maintain�Permeability�Across�Highways.�Research�Branch,�Arizona�Game�and�Fish�Department�
Donaldson,�B.�(2007)�Use�of�Highway�Underpasses�by�Large�Mammals�and�Other�Wildlife�in�Virginia.�Transportation�Research�Record�2011,�157�164.�
Federal�Highway�Administration.�(2002).�Wildlife�Habitat�Connectivity�Across�European�Highways.�http://international.fhwa.dot.gov/wildlife_web.htm��
Fitch,�Michael�G.�(1995)�Nonanadromous�Fish�Passage�in�Highway�Culverts.�Virginia�Transportation�Research�Council�
Forman,�R.�T.�T.�et.�Al.�(2003).�Road�Ecology:�Science�and�Solutions.�Island�Press.�Washington,�D.�C.�481�pp.�
Foster,�M.L.�and�S.R.�Humphrey.�(1995).�Use�of�Highway�Underpasses�by�Florida�Panthers�and�other�Wildlife.�Wildlife�Society�Bulletin.�V.23(1):�pp.92�94.�
Freeman,�Scott.�(2005).�Biological�Science�(3rd�ed.).�New�Jersey:�Pearson�Prentice�Hall�
Graves,�A.T.,�S.�Farley,�M.�I.�Goldstein,�C.�Servheen�(2007)�Identification�of�Functional�Corridors�With�Movement�Characteristics�of�Brown�Bears�on�the�Kenai�Peninsula,�Alaska.�Landscape�Ecology�22,�765�772�
Hanski,�Ilkka�(1998)�Metapopulation�Dynamics.�Nature�396,�41�49� �
Hartmann,�Maureen�(2002)�An�Evaluation�of�Wildlife�Crossing�Structures:�Their�Use�and�Effectiveness.�Road�Ri�porter,�7.� �
Hedlund,�J.H.,�P.D.�Curtis,�G.A.�Curtis,�A.F.�Williams.�(2003)�Methods�to�Reduce�Traffic�Crashes�Involving�Deer:�What�Works�and�What�Does�Not.�Insurance�Institute�for�Highway�Safety�
Holsinger,�K.�Habitat�Fragmentation.�(2007).�http://darwin.eeb.uconn.edu/eeb310/lecture�notes/fragmentation/node1.html��
Migration� Either�a�one�time�or�repeating�movement�of�a�population�from�one�range�of�habitat�to�another.�
198

Greenroads™ Manual v1.5 Environment & Water
EW-7 Ecological Connectivity
Interstate�90�Snoqualmie�Pass�East�Mitigation�Development�Team.�(2006).�Recommendation�Package.�Prepared�for�Washington�Department�of�Transportation�and�Federal�Highway�Administration.�
Leeson,�B.F.�(1996).�Highway�Conflicts�and�Resolutions�In�Banff�National�Park,�Alberta,�Canada.�In:�Evink,�G.L.;�Garrett,�P.;�Ziegler,�D.;�and�J.�Berry�(Eds.)�Trends�In�Addressing�Transportation�Related�Wildlife�Mortality.�Proceedings�of�the�Transportation�Related�Wildlife�Mortality�Seminar.�
Maehr,�D.S.�(1984).�Animal�habitat�isolation�by�roads�and�agricultural�fields.�Biological�Conservatio,�29,�81�96.�
Mirati,�Albert�H.�Jr.�(1999)�Assessment�of�Road�Culverts�for�Fish�Passage�Problems�on�State��and�County�Owned�Roads.�Oregon�Department�of�Fish�and�Wildlife�
Parks�Canada.�(2009).�Banff�National�Park�Canada.�Retrieved�September�25,�2009,�from�http://www.pc.gc.ca/pn�np/ab/banff/index_e.asp�
Reed,�R.�A.,�Johnson�Barnard,�J.�and�W.L.�Baker.�(1996).�Contribution�of�Roads�to�Forest�Fragmentation�in�the�Rocky�Mountains.�Conservation�Biology,�10(4),�1098�1106.�
Romin,�A.L.,�J.A.�Bissonette�(1996)�Deer�vehicle�collisions:�status�of�state�monitoring�activities�and�mitigation�efforts.�Wildlife�Society�Bulletin�24,276�283�
Ruediger,�B.�,�J.�J.�Claar,�and�J.�F.�Gore.�No�date.�Restoration�of�Carnivore�Habitat�Connectivity�in�the�Northern�Rocky�Mountains.�http://www.defenders.org/resources/publications/programs_and_policy/habitat_conservation/habitat_and_highways/reports/restoration_of_the_carnivore_habitat.pdf�
Ruediger,�Bill.�(1996).�The�Relationship�Between�Rare�Carnivores�and�Highways.�In:�Evink,�G.L.;�Garrett,�P.;�Ziegler,�D.;�and�J.�Berry�(Eds.)�Trends�In:�Addressing�Transportation�Related�Wildlife�Mortality.�Proceedings�of�the�Transportation�Related�Wildlife�Mortality�Seminar.�
Smith,�D.J.;�Harris,�L.D.�and�F.J.�Mazzotti.�(1996).�A�landscape�approach�to�examining�the�impacts�of�roads�on�the�ecological�function�associated�with�wildlife�movement�and�movement�corridors:�Problems�and�solutions.�In:�Evink,�G.L.;�Garrett,�P.;�Ziegler,�D.;�and�J.�Berry�(Eds.)�Trends�In�Addressing�Transportation�Related�Wildlife�Mortality.�Proceedings�of�the�Transportation�Related�Wildlife�Mortality�Seminar.�
Washington�State�Department�of�Transportation.�(2009).�1�90�Snoqualmie�Pass�East.�Retrieved�September�24,�2009,�from�http://www.wsdot.wa.gov/Projects/I90/SnoqualmiePassEast/Default.htm�
� �
199

Environment & Water Greenroads™ Manual v1.5
Ecological Connectivity EW-7
�
200

Greenroads™ Manual v1.5 Environment & Water
EW-8 Light Pollution
LIGHT POLLUTION GOAL Safely�illuminate�roadways�while�minimizing�unnecessary�and�potentially�harmful�illumination�of�surrounding�sky�and�habitat.�
CREDIT REQUIREMENTS Provide�lighting�fixtures�that�are�Dark�Sky�compliant�or�equivalent.�A�list�of�Dark�Sky�approved�fixtures�can�be�found�at�http://www.DarkSky.org.�
Details
This�credit�addresses�two�key�components�of�roadway�design,�nighttime�safety�and�light�trespass�into�adjacent�ecosystems�and�the�night�sky.�
The�International�Dark�Sky�Association�(IDA)�fixture�certification�program�is�based�on�upward�light�emission.�Approved�fixtures�must�emit�no�light�above�90�degrees�(often�called�“full�cut�off”).�For�fixtures�to�become�certified,�photometric�imagery�from�a�certified�testing�lab�must�be�submitted�to�the�IDA�for�examination.�
“Equivalent”�standards�will�meet�the�criteria�for�IDA�but�may�not�carry�the�Dark�Sky�seal.�Equivalence�can�be�shown�by�providing�documentation�demonstrating�that�IDA�standards�are�met�or�exceeded�by�selected�fixtures.�Such�documentation�should�be�reviewed�and�approved�by�the�project�lighting�professional�or�electrical�engineer�and�a�letter�shall�be�provided�stating�equivalence.
Projects�that�deliberately�reduce�existing�lighting�or�completely�eliminate�lighting�are�eligible�for�this�credit�provided�that:�
a. Lighting�is�within�the�project�scope�or�otherwise�is�normally�required�by�standard�specifications�(e.g.,�a�preservation�hot�mix�asphalt�pavement�overlay�is�not�likely�to�have�roadway�lighting�within�its�scope�and�is�therefore�not�eligible�for�this�credit).�“Within�scope”�can�be�demonstrated�by�credit�PR�1�Environmental�Review�Process�or�by�AE�3�Context�Sensitive�Solutions.�
b. The�project�provides�evidence�to�show�that�lighting�is�not�required�to�meet�minimum�roadway�safety�requirements�or�that�reducing�existing�lighting�is�safe.�This�generally�means�an�intentional�decision�has�been�made�to�reduce�or�eliminate�lighting�within�the�alignment�based�on�a�full�safety�investigation.�(See�also�AE�1�Safety�Audit).�
c. Any�lighting�used�conforms�to�IDA�fixture�standards�or�equivalent.�
DOCUMENTATION � Executive�summary�of�the�lighting�safety�study�demonstrating�appropriateness�of�
lighting�configured�for�roadway,�signed�by�the�lead�electrical�professional.�� Lighting�or�electrical�plan.�Highlight�ALL�locations�of�fixture,�bulb�and�cover�
technology�used.�� A�list�of�the�fixtures,�bulbs�and�covers�installed,�including�name�of�technologies,�
wattage,�area�of�shade,�code�compliance�(if�any).�� Copy�of�the�Dark�Sky�certification�for�any�product�specified�and�installed.�
EW-8
3 POINTS
RELATED CREDITS
� AE�1�Safety�Audit�� AE�3�Context�
Sensitive�Solutions�� MR�6�Energy�
Efficiency�
SUSTAINABILITY COMPONENTS
� Ecology�� Experience�
BENEFITS
� Reduces�Fossil�Fuel�Use�
� Reduces�Greenhouse�Gases�
� Restores�Habitat�� Improves�Human�
Health�&�Safety�� Increases�Aesthetics�
201
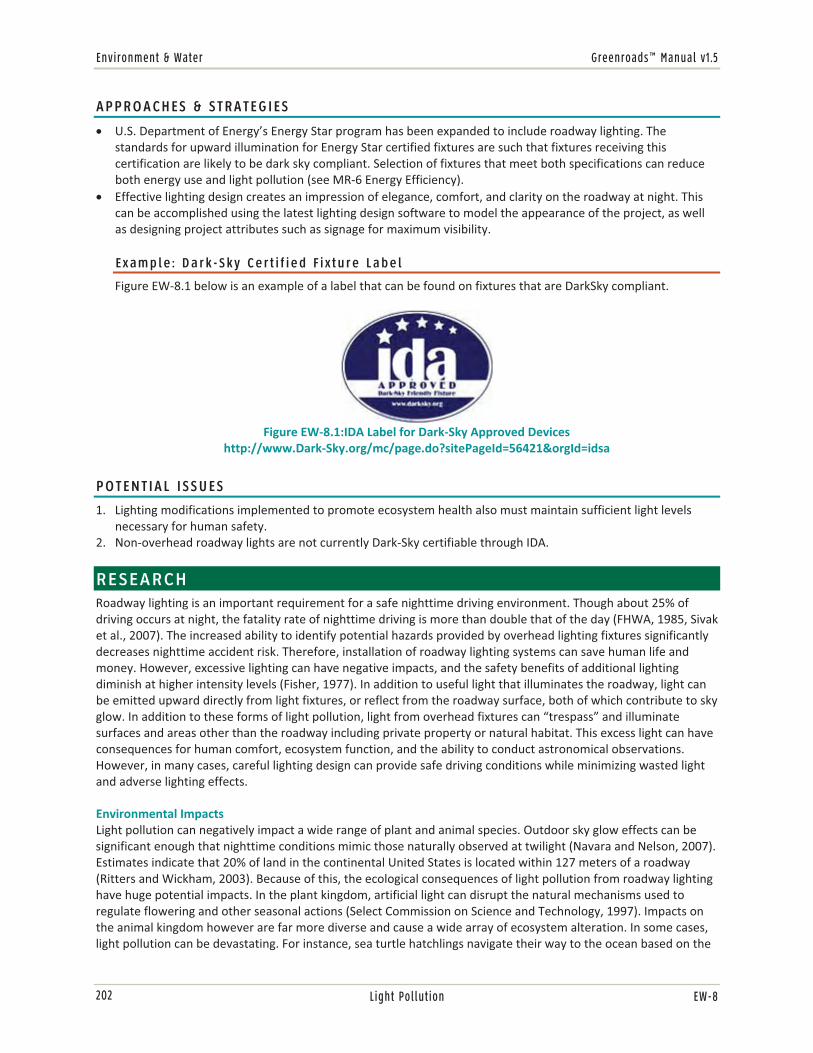
Environment & Water Greenroads™ Manual v1.5
Light Pollution EW-8
APPROACHES & STRATEGIES
� U.S.�Department�of�Energy’s�Energy�Star�program�has�been�expanded�to�include�roadway�lighting.�The�standards�for�upward�illumination�for�Energy�Star�certified�fixtures�are�such�that�fixtures�receiving�this�certification�are�likely�to�be�dark�sky�compliant.�Selection�of�fixtures�that�meet�both�specifications�can�reduce�both�energy�use�and�light�pollution�(see�MR�6�Energy�Efficiency).��
� Effective�lighting�design�creates�an�impression�of�elegance,�comfort,�and�clarity�on�the�roadway�at�night.�This�can�be�accomplished�using�the�latest�lighting�design�software�to�model�the�appearance�of�the�project,�as�well�as�designing�project�attributes�such�as�signage�for�maximum�visibility.�
Example: Dark-Sky Certified Fixture Label
Figure�EW�8.1�below�is�an�example�of�a�label�that�can�be�found�on�fixtures�that�are�DarkSky�compliant.�
POTENTIAL ISSUES
1. Lighting�modifications�implemented�to�promote�ecosystem�health�also�must�maintain�sufficient�light�levels�necessary�for�human�safety.�
2. Non�overhead�roadway�lights�are�not�currently�Dark�Sky�certifiable�through�IDA.���
RESEARCH Roadway�lighting�is�an�important�requirement�for�a�safe�nighttime�driving�environment.�Though�about�25%�of�driving�occurs�at�night,�the�fatality�rate�of�nighttime�driving�is�more�than�double�that�of�the�day�(FHWA,�1985,�Sivak�et�al.,�2007).�The�increased�ability�to�identify�potential�hazards�provided�by�overhead�lighting�fixtures�significantly�decreases�nighttime�accident�risk.�Therefore,�installation�of�roadway�lighting�systems�can�save�human�life�and�money.�However,�excessive�lighting�can�have�negative�impacts,�and�the�safety�benefits�of�additional�lighting�diminish�at�higher�intensity�levels�(Fisher,�1977).�In�addition�to�useful�light�that�illuminates�the�roadway,�light�can�be�emitted�upward�directly�from�light�fixtures,�or�reflect�from�the�roadway�surface,�both�of�which�contribute�to�sky�glow.�In�addition�to�these�forms�of�light�pollution,�light�from�overhead�fixtures�can�“trespass”�and�illuminate�surfaces�and�areas�other�than�the�roadway�including�private�property�or�natural�habitat.�This�excess�light�can�have�consequences�for�human�comfort,�ecosystem�function,�and�the�ability�to�conduct�astronomical�observations.�However,�in�many�cases,�careful�lighting�design�can�provide�safe�driving�conditions�while�minimizing�wasted�light�and�adverse�lighting�effects.��
Environmental�Impacts�Light�pollution�can�negatively�impact�a�wide�range�of�plant�and�animal�species.�Outdoor�sky�glow�effects�can�be�significant�enough�that�nighttime�conditions�mimic�those�naturally�observed�at�twilight�(Navara�and�Nelson,�2007).�Estimates�indicate�that�20%�of�land�in�the�continental�United�States�is�located�within�127�meters�of�a�roadway�(Ritters�and�Wickham,�2003).�Because�of�this,�the�ecological�consequences�of�light�pollution�from�roadway�lighting�have�huge�potential�impacts.�In�the�plant�kingdom,�artificial�light�can�disrupt�the�natural�mechanisms�used�to�regulate�flowering�and�other�seasonal�actions�(Select�Commission�on�Science�and�Technology,�1997).�Impacts�on�the�animal�kingdom�however�are�far�more�diverse�and�cause�a�wide�array�of�ecosystem�alteration.�In�some�cases,�light�pollution�can�be�devastating.�For�instance,�sea�turtle�hatchlings�navigate�their�way�to�the�ocean�based�on�the�
�Figure�EW�8.1:IDA�Label�for�Dark�Sky�Approved�Devices�
http://www.Dark�Sky.org/mc/page.do?sitePageId=56421&orgId=idsa�
202
Greenroads™ Manual v1.5 Environment & Water
EW-8 Light Pollution
relative�darkness�of�land�mass,�and�artificial�lights�can�render�this�ability�completely�ineffective�(Salmon,�2003).�Nocturnal�animals�are�also�particularly�vulnerable.�Street�lighting�limits�the�flying�routes�of�endangered�bat�species�and�can�cause�habitat�fragmentation�(Stone�et�al.,�2009).�When�nocturnal�habitats�are�fragmented,�populations�become�increasingly�at�risk�of�loss�of�genetic�diversity�and�local�extinction.�Increased�lighting�conditions�can�alter�reproductive�behavior�in�animals�such�as�frogs,�which�are�more�wary�in�the�absence�of�darkness,�or�glow�worms,�which�communicate�visually�to�attract�a�mate�(Longcore�and�Rich,�2004;�Navara�and�Nelson,�2007).�While�these�examples�are�far�from�a�comprehensive�list,�they�illustrate�the�kinds�of�important�ecosystem�disruptions�precipitated�from�a�seemingly�minor�environmental�change.��
Though�light�has�obvious�benefits�to�human�society,�excess�light�can�have�negative�human�impacts.�Surveys�have�indicated�public�displeasure�in�some�cases�with�freeway�lighting�that�inadvertently�lights�their�yards�and�houses�during�the�night�(Khan,�2003).�In�addition,�light�pollution�has�seriously�reduced�the�aesthetic�value�of�the�night�sky.�Most�urban�residents�are�now�unable�to�view�the�once�omnipresent�Milky�Way�galaxy.�In�addition,�many�astronomical�observatories�have�become�significantly�less�useful�as�even�a�small�change�in�sky�brightness�can�have�a�huge�impact�on�the�ability�to�view�extremely�distant�objects.�In�addition,�more�and�more�research�is�being�conducted�on�a�possible�link�between�light�pollution�and�certain�types�of�cancer.��
Light�Pollution�Prevention�Light�pollution�can�be�mitigated�in�a�number�of�ways.�LED�lighting�systems�are�generally�more�efficient�at�directing�light�to�desired�areas,�therefore�reducing�the�amount�of�light�escaping�to�nearby�environments�for�safe�levels�of�lighting.�While�only�about�half�the�light�from�traditional�roadway�luminaries�reaches�the�roadway,�as�much�as�85%�of�LED�lighting�can�do�so�(Wu�et�al.,�2009).�Direct,�physical�shielding�of�lamps�is�another�effective�method�of�curbing�stray�light.�However,�because�light�is�reflected�from�illuminated�surfaces,�light�pollution�cannot�be�eliminated�by�direction�and�shielding�alone�(Soardo�et�al.,�2008).�Therefore,�it�is�important�to�identify�the�minimum�light�intensity�needed�to�provide�safe�roadway�visibility.�This�needs�to�be�considered�carefully,�as�numerous�attempts�to�conserve�electricity�use�through�light�dimming�have�been�shown�to�have�increased�nighttime�accidents�(FHWA,�1985).�Sophisticated�tests�are�available�for�measurements�of�luminance�or�illuminance�to�determine�whether�roadways�are�significantly�lit�to�provide�a�safe�environment.�Light�fixtures�that�provide�more�uniform�lighting�can�provide�safe�conditions�on�all�points�on�a�roadway�with�less�total�light�output,�and�therefore�less�reflected�light�pollution.����
Scientific�analysis�of�the�consequences�of�light�pollution�is�a�relatively�new�phenomenon.�However,�research�to�date�has�already�uncovered�a�host�of�important�detriments�to�human�health�and�ecosystem�function�in�addition�to�the�degradation�of�the�intrinsic�aesthetic�value�of�the�cosmos.�Electrical�lighting�has�been�in�existence�for�a�time�period�that�is�insignificant�from�an�evolutionary�perspective,�meaning�that�humans�and�other�animals�have�had�no�opportunity�to�adapt�to�this�drastic�environmental�shift�(Pauley,�2004).�While�roadway�lighting�is�far�from�the�only�culprit,�streets�are�a�major�contributor�to�elevated�light�levels�and�are�a�significant�opportunity�for�reduction�of�light�pollution.��Roadway�illumination�is�responsible�for�approximately�70%�of�luminous�flux�in�urban�areas,�and�presents�the�only�major�source�of�artificial�light�in�certain�rural�settings�(Soardo�et�al.,�2008).�Light�pollution�and�trespass�are�not�only�wasteful,�but�also�damage�the�ability�of�our�built�environment�to�sustain�human�and�ecosystem�health.�
International�Dark�Sky�Association�(IDA)�Formed�in�1988,�the�International�Dark�Sky�Association�(IDA)�is�the�authoritative�voice�on�light�pollution.�IDA�educates�lighting�designers,�manufacturers,�technical�committees,�and�the�public�about�light�pollution�abatement.�The�IDA’s�goal�of�protecting�and�restoring�natural�night�environment�and�heritage�of�dark�skies�is�through�promotion�of�quality�outdoor�lighting.�They�have�developed�the�Fixture�Seal�of�Approval�(FSA)�program�for�dark�sky�friendly�fixtures.�
The�Fixture�Seal�of�Approval�provides�objective,�third�party�certification�for�luminaires�that�minimize�glare,�reduce�light�trespass,�and�don’t�pollute�the�night�sky.�For�a�modest�fee,�IDA�will�evaluate�the�photometric�data�of�any�luminaire�submitted�by�its�manufacturer.�When�the�fixture�is�approved,�the�manufacturer�receives�a�certificate�
203
Environment & Water Greenroads™ Manual v1.5
Light Pollution EW-8
and�the�Fixture�Seal�of�Approval.�Manufacturers�may�use�the�FSA�seal�to�promote�and�advertise�their�IDA�Approved™�dark�sky�friendly�products.�
GLOSSARY
Light�pollution� The�unwanted�contribution�of�manmade�lighting�to�nighttime�brightness�and�sky�glow.�
Light�trespass� Direct�shining�of�electrical�light�onto�surfaces�besides�those�meant�to�be�lit.��
REFERENCES Federal�Highway�Administration.�(2004).�Reduced�Lighting�on�Freeways�During�Periods�of�Low�Traffic�Density.�
(Report�No.�FHWA/RD�86/018)�U.S.�Department�of�Transportation.��
Fisher,�A.J.,�(1977).�Road�Lighting�as�an�Accident�Counter�Measure.�Australian�Road�Research,�7,�2–16.�
Internation�Dark�Sky�Association.�(2009).�Accessed�December�20,�2009�from�http://www.DarkSky.org�
Khan,�A.M.�(2003).�Highway�light�trespass:�Human�and�social�factors.�Insitute�of�Transportation�Engineers.�ITE�Journal,�73,�5.��
Longcore,�T.,�&�C.�Rich�(2004).�Ecological�Effects�of�Light�Pollution.�Frontiers�in�Ecology�and�the�Environment,�2,�191�198.�
Morgan�Taylor,�Martin.�(2008).�RCEP�Consultation�on�Artificial�Light�in�the�Environment.�Presented�to�the�Royal�Commission�on�Environmental�Pollution's�study�of�Artificial�Light�in�the�Environment.�
Navara,�K.J.,�&�R.J.�Nelson�(2007).�The�Dark�Side�of�Light�at�Night:Physiological,�Epidemiological,�and�Ecological�Consequences.�Journal�of�Pineal�Research,�43,�215�224�
Pauley,�S.�(2004).�Lighting�for�the�Human�Circadian�Clock.�Medical�Hypotheses,�63,�588�596�
Ritters,�K.H.�&�J.D.�Wickham.�(2003).�How�Far�to�the�Nearest�Road?�Frontiers�in�Ecology�and�the�Environment,�3,�125�129�
Salmon,�M�(2003).�Artificial�Night�Lighting�and�Sea�Turtles.�Biologist:�Journal�of�the�Institute�of�Biology,�50,�163�168�
Sivak,�M.,�J.�Luoma,�M.J.�Flannagan,�C.R.�Bingham,�D.W.�Eby,�&�J.T.�Shope�(2007).�Traffic�safety�in�the�U.S.:�Re�examining�major�opportunities.�Journal�of�Safety�Research,�38,�337�355.�
Soardo,�P.,�P.�Lacomussi,�G.�Rossi�&�Fellin,�L.�(2008).�Compatibility�of�road�lighting�with�star�visibility.�Lighting�Research�and�Technology,�40,�307�322.��
Stone,�E.L.,�Jones,�G.,�&�S.�Harris�(2009).�Street�Lighting�Disturbs�Commuting�Bats.�Current�Biology,�19,�1123�1127�
United�Kingdom�House�of�Commons�Commission�on�Science�and�Technology.�(1997).�The�Extent�and�Nature�of�Light�Pollution�(Seventh�Report)�London,�England.��
Wu,�M.S.,�Huang,�H.H.,�Huang,�B.J.,�Tang,�C.W.,�Cheng�C.W.�(2009)�Economic�Feasibility�of�Solar�Powered�LED�Roadway�Lighting.�Renewable�Energy,�34,�1934�1938.�
204

Greenroads Manual v1.5 © 2011
�
�
�
�
�
ACCESS & EQUITY
205

Greenroads Manual v1.5 © 2011
� �
206

Greenroads™ Manual v1.5 Access & Equity
AE-1 Safety Audit
SAFETY AUDIT GOAL Improve�roadway�safety�through�review�by�an�independent�audit�team.�
CREDIT REQUIREMENTS Conduct�a�road�safety�audit�(RSA)�on�the�project�roadway�in�accordance�with�the�procedures�set�forth�in�FHWA’s�Road�Safety�Audit�Guidelines.�The�Guidelines�define�three�general�phases�of�a�project�during�which�a�RSA�may�be�conducted.�
1�point�is�awarded�for�each�RSA�conducted�up�to�a�maximum�of�2�points.�
1. Preconstruction�phase�RSA.�Performed�before�construction�begins.�Recommended�changes�are�generally�less�costly�and�result�in�less�delay.�
2. Construction�phase�RSA.�Performed�during�preparations�construction.�They�allow�the�roadway�to�be�viewed�as�built�and�offer�a�last�chance�to�assess�safety�before�it�is�opened�to�the�public.��
3. Post�construction�phase�RSA.�Performed�on�existing�roads�to�identify�road�safety�issues�for�different�road�users.�
Note:�For�a�given�roadway�project,�it�is�likely�that�preconstruction�and�construction�phase�RSAs�are�appropriate.�A�post�construction�phase�RSA�in�addition�to�these�two�RSAs�would�typically�be�redundant�and�is�therefore�not�advisable.�See�the�“Examples”�section�for�situations�where�a�post�construction�phase�RSA�may�be�appropriate.�
Details
The�FHWA�RSA�Guidelines�are�available�at:��
� http://safety.fhwa.dot.gov/rsa/guidelines.�
Many�owner�agencies�already�have�safety�audit�programs�that�meet�RSA�guidelines,�but�the�programs�may�be�called�other�names.�Such�a�program�must�meet�the�intent�of�an�RSA�as�defined�in�the�FHWA’s�Road�Safety�Audit�Guidelines.�Specifically,�the�RSA�must�involve�a�review�by�an�independent�team�and�focus�solely�on�safety.��
DOCUMENTATION � Submit�a�copy�of�the�“RSA�report”�and�“formal�response”�as�defined�in�the�FHWA’s�
Road�Safety�Audit�Guidelines�(2006)�for�each�RSA.�
OR�
� For�agencies�with�existing�safety�audit�programs,�provide�a�letter,�signed�by�the�agency�representative�for�the�project,�stating�that�the�existing�agency�program�meets�or�exceeds�the�requirements�defined�in�the�FHWA’s�Road�Safety�Audit�Guidelines�(2006).�Submit�a�copy�of�agency�program�documents�that�meet�the�criteria�defined�in�FHWA’s�guidelines�as�noted�above.�
� �
AE-1
1-2 POINTS
RELATED CREDITS
� PR�1�Environmental�Review�Process�
� AE�3�Context�Sensitive�Solutions�
SUSTAINABILITY COMPONENTS
� Equity�� Expectations�
BENEFITS
� Improves�Human�Health�&�Safety�
207

Access & Equity Greenroads™ Manual v1.5
Safety Audit AE-1
APPROACHES & STRATEGIES
� Follow�advice�given�by�the�FHWA�Publication�No.�FHWA�SA�06�06,�available�at:�http://safety.fhwa.dot.gov/rsa/guidelines/documents/FHWA_SA_06_06.pdf.��
� Refer�to�the�recommendations�in�the�FHWA’s�Road�Safety�Audit�Guidelines�(Chapter�2)�for�introducing�RSAs�into�an�organization�as�an�internal�program.�These�recommendations�note�that�effective�and�successful�RSAs�require�a�management�commitment,�an�agreed�upon�policy,�informed�project�managers,�an�ongoing�training�program,�and�skilled�auditors�(FHWA,�2006).��
Example: Hypothetical Case Study
A�2�inch�overlay�is�scheduled�for�20�lane�miles�of�a�2�lane�rural�road.�A�pre�construction�RSA�is�conducted�and�makes�recommendations�on�moving�warning�signs�to�better�locations�and�installing�a�rumble�strip�along�the�centerline.�The�overlay�project�adopts�these�recommendations�and�includes�them�in�the�project.�The�project�would�receive�1�point�for�the�pre�construction�RSA.�A�construction�phase�RSA�could�be�conducted�to�achieve�another�point�however�the�project�team�did�not�see�benefit�in�this�and�elected�not�to�conduct�one.�
Example: When to Consider a Post-Construction RSA
A�post�construction�RSA�could�be�useful�in�the�following�situations:��
1. An�owner�agency�undertakes�a�roadway�project�on�a�section�of�road�that�previously�had�a�RSA�conducted�on�it�as�an�existing�facility.�This�RSA�would�provide�input�into�the�planning�and�design�phase�of�the�project�and�make�the�pre�construction�RSA�redundant.��
2. An�owner�agency�is�inventorying�all�Greenroads�points�it�can�obtain�for�a�given�network�rather�than�using�Greenroads�to�certify�an�individual�project�it�might�be�able�to�improve�its�network�score�by�including�the�RSAs�it�has�conducted�on�existing�facilities.�
3. An�owner�agency�desires�a�list�of�modifications�that�could�result�in�future�safety�issue�changes.�
Examples: FHWA Case Studies
For�further�examples,�the�FHWA’s�Road�Safety�Audit�Guidelines�contains�six�RSA�case�studies.�
POTENTIAL ISSUES
1. RSA�use�when�it�is�not�part�of�a�formal�agency�policy�may�seem�arbitrary�and�RSA�execution�may�be�cumbersome.��
2. The�RSA�process�as�described�in�the�FHWA’s�Road�Safety�Audit�Guidelines�(2006)�allows�a�design�team�to�essentially�disagree�with�all�audit�recommendations.�Therefore,�it�is�possible,�if�not�likely,�that�no�recommendations�are�implemented�and�the�roadway’s�overall�safety�does�not�benefit�from�the�RSA.�
RESEARCH Roadway�crashes�and�their�resultant�injuries�and�costs�have�an�immense�impact�on�society.�Each�year�highway�crashes�in�the�U.S.�injure�3�million,�kill�43,000�and�cost�over�$230�billion�(Wilson�and�Lipinski,�2004).�Generally,�society�views�these�deaths,�injuries�and�costs�as�avoidable�and�has�placed�a�high�premium�on�reducing�their�number�and�severity.�Three�examples�of�this�viewpoint�follow:�
� “…the�toll�of�deaths�and�injuries�on�our�roadways�is�among�the�most�compelling�public�health�issues�of�our�time.”�(AASHTO,�2007)�
� “…road�traffic�injuries�(pose)�a�global�public�health�crisis�requiring�urgent�national�and�international�action.”�(United�Nations,�2008)�
� “Safety�is�our�top�priority…”�(acting�FHWA�administrator�Jim�Ray�in�Roads�Can�be�Safer…,�2008)�
Most�of�this�section�provides�a�summary�of�road�safety�audits�from�two�main�documents:�
208
Greenroads™ Manual v1.5 Access & Equity
AE-1 Safety Audit
� NCHRP�Synthesis�336:�Road�Safety�Audits�(2004),�which�summarizes�RSA�processes�and�their�current�usage�in�the�U.S.�and�worldwide.��
� Road�Safety�Audit�Guidelines�(2006)�from�the�Federal�Highway�Administration,�which�provides�guidance�for�agencies�to�draw�upon�when�developing�RSA�policies�and�procedures.��
Roadway�Safety�Audits�One�method�that�has�shown�promise�in�improving�roadway�safety�is�what�is�commonly�referred�to�as�a�Road�Safety�Audit�(RSA).�“An�RSA�is�a�formal�safety�performance�examination�of�an�existing�or�future�road�or�intersection�by�an�independent�audit�team.�It�qualitatively�estimates�and�reports�on�potential�road�safety�issues�and�identifies�opportunities�for�improvements�in�safety�for�all�road�users”�(FHWA,�2006).�RSAs�are�generally�thought�of�as�an�additional�tool�to�improve�safety�rather�than�a�replacement�for�other�established�practices�such�as�safety�impact�studies,�modeling,�safety�impact�studies�and�safety�compliance�reviews�(FHWA,�2006).��
Applicable�Project�Types�RSAs�can�be�beneficial�to�all�types�of�projects.�The�FHWA�(2006)�specifically�mentions�the�following�types�of�projects�and�benefits:�
� Capital�improvement�projects.�RSAs�can�provide�significant�safety�benefits�in�the�design�process.�� Rehabilitation�projects.�The�scope�and�funding�of�such�projects�makes�incorporating�RSA�recommendations�
often�achievable�with�only�minor�changes�in�overall�design.�� Surface�improvement�projects.�Have�the�greatest�potential�to�benefit�from�RSAs.�Often�low�cost,�high�impact�
solutions�can�be�identified�and�implemented.��� Bridge�reconstruction�projects.�All�projects,�but�especially�broadly�scoped�ones,�can�be�successful�in�
incorporating�major�safety�improvements�recommended�by�an�RSA.��� Safety�projects.�These�may�only�use�reactive�techniques�in�identifying�hazards�and�could�benefit�from�the�
proactive�nature�of�RSAs.��� Developer�led�projects.�Generally,�they�are�candidates�by�no�specific�evidence�is�offered.��
When�to�Conduct�an�RSA�RSAs�are�generally�conducted�at�one�or�more�points�in�the�project�timeline:�
� Preconstruction�phase�RSA.�Performed�before�construction�begins.�Recommended�changes�are�generally�less�costly�and�result�in�less�delay.�
� Construction�phase�RSA.�Performed�during�preparations�construction.�They�allow�the�roadway�to�be�viewed�as�built�and�offer�a�last�chance�to�assess�safety�before�it�is�opened�to�the�public.��
� Post�construction�phase�RSA.�Performed�on�existing�roads�to�identify�road�safety�issues�for�different�road�users.���Performing�a�RSA�at�this�stage�may�be�the�most�beneficial�for�future�projects�as�changes�after�construction�can�be�costly.�
RSAs�can�impact�project�schedule�but�the�impact�depends�on�their�recommendations�and�how�they�are�addressed.�
Safety�Benefits�Both�U.S.�and�international�evidence�suggests�that�RSAs�are�low�cost�and�can�provide�substantial,�measurable�benefits.�Benefits�generally�come�from�reducing�reconstruction�costs�associated�with�safety�deficiencies,�reducing�life�cycle�costs,�reducing�societal�costs�associated�with�collisions�and�reducing�liability�claims.�Some�specific�examples�are�(Wilson�and�Lipinski,�2004;�FHWA,�2006):�
� A�UK�study�analyzed�crash�data�from�19�audited�and�19�non�audited�sites.�It�found�a�casualty�savings�of�1.25�per�year�(fatal�crash�rates�dropped�from�2.08�to�0.83�per�year)�for�the�audited�sites�and�only�0.26�per�year�(fatal�crash�rates�dropped�from�2.6�to�2.34�per�year)�for�the�non�audited�sites.��
� A�UK�study�analyzed�22�audited�trunk�road�sites�and�placed�the�average�savings�per�site�at�£11,373�per�site.��
209

Access & Equity Greenroads™ Manual v1.5
Safety Audit AE-1
� Austroads�described�9�audited�design�state�sites�that�reported�250�findings�with�benefit/cost�ratios�between�3:1�and�242:1.��
� The�New�York�Department�of�Transportation�reports�a�20�40%�reduction�in�crashes�at�more�than�300�high�crash�locations�that�had�received�safety�improvements�recommended�by�RSAs.��
� Early�South�Carolina�Department�of�Transportation�results�(at�the�1�year�point)�showed�decreased�crashes�and�economic�savings.�One�site�implementing�4�of�8�recommendations�showed�a�12.5%�decrease�in�crashes�with�a�savings�of�$40,000,�a�second�site�had�a�15.8%�increase�in�crashes�when�only�2�of�13�recommendations�were�implemented,�a�third�site�that�implemented�all�9�recommendations�saw�a�60%�reduction�in�fatalities�resulting�in�a�$3.66�million�savings,�and�a�fourth�site�that�implemented�25�of�37�recommendations�had�a�23.4%�reduction�in�crashes�and�a�savings�of�$147,000.��
Costs�&�Legal�Considerations�Generally�RSAs�cost�between�$1,000�and�$8,000�(Wilson�and�Lipinski,�2004),�which�usually�represents�a�small�fraction�of�engineering�design�costs.�Therefore,�analyses�that�calculate�rate�of�return�generally�give�values�of�over�100%.�This�is�especially�true�when�even�one�life�saved�is�attributed�to�the�RSA.�In�practice,�however,�it�is�difficult�to�attribute�saving�a�life�to�any�one�audit,�recommendation�or�action.�
The�FHWA�(2006)�mentions�that�some�agencies�have�been�reluctant�to�conduct�RSAs�due�to�a�fear�that�reports�will�be�used�against�them�in�tort�liability�lawsuits.�In�states�where�training�on�RSAs�was�conducted�local�legal�staffs�gave�a�common�message:�RSAs�are�a�positive�approach�and�do�not�increase�the�agency’s�liability�and,�in�fact,�help�in�the�defense�of�tort�liability�(Wilson�and�Lipinski,�2004).�
GLOSSARY
REFERENCES American�Association�of�State�Highway�and�Transportation�Officials�(AASHTO).�(2007).�Transportation:�Invest�in�
Our�Future.�AASHTO,�Washington,�DC.�Available�at�http://www.transportation1.org/tif5report/safer_america.html��
Federal�Highway�Administration�(FHWA).�(2006).�Road�Safety�Audit�Guidelines.�Publication�No.�FHWA�SA�06�06.�FHWA,�U.S.�Department�of�Transportation.�Available�at�http://safety.fhwa.dot.gov/index.cfm.�
United�Nations.�(2008).�General�Assembly�Adopts�Resolution�on�Easing�Global�Road�Safety�Crisis.�GA/10694.�Sixty�second�General�Assembly,�Plenary,�87th�meeting�(AM).��
U.S.�Department�of�Transportation�Office�of�Public�Affairs.�Press�release:�Roads�Can�Be�Safer,�Top�Federal�Highway�Official�Says.�(2008).�Available�at�http://www.fhwa.dot.gov/pressroom/fhwa0816.htm.�
Wilson,�E.M.�and�Lipinski,�M.E.�(2004).�NCHRP�Synthesis�336:�Road�Safety�Audits.�Transportation�Research�Board,�Washington,�D.C.��
FHWA� Federal�Highway�AdministrationRSA� Road�safety�audit
210

Greenroads™ Manual v1.5 Access & Equity
AE-2 Intelligent Transportation Systems
INTELLIGENT TRANSPORTATION SYSTEMS GOAL Meet�economic�and�social�needs�and�improve�mobility�without�adding�capacity,�or�improve�the�efficiency�of�transportation�systems.�
CREDIT REQUIREMENTS Include�intelligent�transportation�system�(ITS)�applications�listed�in�the�Federal�Highway�Administration’s�(FHWA)�Research�and�Innovative�Technology�Administration�(RITA)�Office�of�Intelligent�Transportation�Systems�Applications�Overview�portion�of�their�ITS�website�(see�at:�http://www.itsoverview.its.dot.gov).�Table�AE�2.1�(opposite�page)�lists�the�standard�ITS�applications�and�RITA�ITS�website�categories�allowable�for�this�credit.�
2�points�Install�at�least�1�application�in�2�separate�categories.�
3�points�Install�at�least�1�application�in�3�separate�categories.�
4�points�Install�at�least�1�application�in�4�separate�categories.�
5�points�Install�at�least�1�application�in�5�separate�categories.�
Details
Additionally,�in�order�for�an�ITS�application�to�count�for�this�credit�it�needs�to�exist�within�the�project�limits�in�a�meaningful�manner.�The�FHWA’s�RITA�ITS�website�separates�ITS�applications�into�broad�categories.�The�intention�of�this�credit�is�to�have�at�least�two�of�these�RITA�ITS�website�categories�represented�with�the�project�limits�to�earn�points.�So,�if�the�project�is�an�improvement�of�an�existing�facility�and�that�existing�facility�already�includes�one�or�more�ITS�applications,�those�existing�applications�can�be�counted�toward�the�total�points.�Additionally,�note�that�in�no�case�can�more�than�5�points�be�earned.�There�must�be�at�least�1�application�in�2�separate�categories�in�order�for�any�points�to�be�earned.�
DOCUMENTATION � A�list�of�the�ITS�applications�and�their�corresponding�categories�� Evidence�that�these�ITS�applications�are�physically�installed�on�the�project�or�are�
applicable�to�the�project�area.�This�evidence�can�be�any�one�of�the�following:�
� The�page(s)�in�the�project�plans�and�specifications�that�refer�to�the�application�� Documentation�that�shows�a�particular�application�is�operational�in�the�project�
area�(e.g.,�the�geographic�coverage�area�for�the�511�traveler�information�service,�a�screenshot�of�an�online�dynamic�map�that�identifies�the�project�area�and�clearly�shows�the�project�area�is�included�in�the�map)�
� Photo(s)�of�each�application�installed�if�it�is�a�physical�entity.�
AE-2
2-5 POINTS
RELATED CREDITS
� AE�3�Context�Sensitive�Solutions��
� AE�5�Pedestrian�Access�
� AE�6�Bicycle�Access�� AE�7�Transit�&�HOV�
Access�� MR�6�Energy�
Efficiency�
SUSTAINABILITY COMPONENTS
� Ecology�� Equity�� Economy�� Extent�� Expectations�� Experience�� Exposure�
BENEFITS
� Reduces�Fossil�Fuel�Use�
� Reduces�Air�Emissions�
� Reduces�Greenhouse�Gases�
� Improves�Mobility���� Improves�Human�
Health�&�Safety�� Reduces�Lifecycle�
Costs�� Increases�Awareness�
211

Access & Equity Greenroads™ Manual v1.5
Intelligent Transportation Systems AE-2
Table�AE�2.1:�Allowable�ITS�Applications�for�AE�2��Category� ApplicationSurveillance� Traffic� Infrastructure�Traffic�Control� Adaptive�Signal�Control� Advanced�Signal�Systems� Variable�Speed�Limits� Bicycle�&�Pedestrian� Special�EventsLane�Management� HOV�Facilities� Reversible�Flow�Lanes� Pricing� Lane�Control� Variable Speed�Limits� Emergency�EvacuationInformation�Dissemination� Dynamic�Message�Signs�(DMS)� Highway�Advisory�Radio�(HAR)Enforcement� Speed�Enforcement� Traffic�Signal�Enforcement� Ramp�Meter�Enforcement� HOV�Facilities�EnforcementRamp�Control� Ramp�Metering� Priority�AccessWarning�Systems� Ramp�Rollover� Curve�Speed�Warning� Downhill�Speed�Warning� Overheight/Overwidth�Warning�� Highway�Rail�Crossing�Warning�Systems�� Intersection�Collision�Warning� Pedestrian�Safety� Bicycle�Warning� Animal�WarningRoad�Weather�Management� Pavement�Conditions� Atmospheric�Conditions� Water�LevelTransit�Management� Dynamic�Routing/Scheduling� In�Terminal/Wayside�Information�DisseminationTraveler�Information� Internet/Wireless� 511� TelephoneElectronic�Payment/Pricing� Toll�Collection� Transit�Fare�PaymentTraffic�Incident�Management� Call�Boxes� Service�Patrols� Emergency�Vehicle�Signal�Preemption�Notes:�The�application�nomenclature�and�definitions�come�directly�from�the�FHWA’s�RITA�ITS�ApplicationsOverview�web�page�(http://www.itsoverview.its.dot.gov).�
212

Greenroads™ Manual v1.5 Access & Equity
AE-2 Intelligent Transportation Systems
APPROACHES & STRATEGIES
� The�FHWA’s�RITA�ITS�website�(http://www.its.dot.gov)�maintains�a�current�database�of�ITS�benefits,�costs,�lessons�learned�and�deployment�statistics.�It�is�an�excellent�resource�for�approaches�and�strategies.�
� ITS�America,�a�not�for�profit�organization,�also�maintains�a�website�(http://www.itsa.org)�with�substantial�documentation�on�ITS�efforts.��
Example: How to Calculate Points
3�points�A�freeway�on�ramp�is�being�upgraded�to�include�a�ramp�metering�system.�In�addition�there�are�already�video�surveillance�cameras�in�use�that�are�accessible�by�the�general�public�through�a�common�traffic�website.�The�area�is�also�covered�by�a�511�traffic�information�system�and�highway�advisory�radio�(HAR).�This�project�would�earn�3�points�because�3�application�categories�are�represented.�Note�that�a�project�cannot�earn�1�point�for�this�Voluntary�Credit.�At�least�2�categories�must�be�represented�to�earn�the�minimum�of�2�points.��
� Surveillance.�The�traffic�cameras�are�an�application�in�this�category.�� Traveler�information:�the�511�service�and�website�are�both�applications�in�this�category.�Although�this�
category�is�represented�by�two�separate�systems,�it�is�still�only�counted�once.��� Information�dissemination:�the�HAR�is�an�application�in�this�category.�
5�points�An�arterial�is�being�upgraded�to�be�more�context�sensitive.�Existing�arterial�facilities�that�remain�in�place�include�a�variable�message�sign�and�video�traffic�signal�enforcement.�The�project�is�adding�timed�signal�lights�and�sensors�to�include�it�in�the�area�wide�network�shown�online�at�the�agency’s�website.�Traffic�surveillance�cameras�are�also�being�added.�This�project�would�earn�5�points�because�5�application�categories�are�represented.�Note�that�a�project�cannot�earn�1�point�for�this�Voluntary�Credit.�At�least�2�categories�must�be�represented�to�earn�the�minimum�of�2�points.�
� Surveillance.�The�added�traffic�cameras�are�an�application�in�this�category.�� Traffic�control.�The�added�signal�timing�is�an�application�in�this�category.�� Information�dissemination.�The�existing�dynamic�message�sign�is�an�application�in�this�category.��� Enforcement.�The�existing�traffic�signal�video�enforcement�is�an�application�in�this�category.��� Traveler�information:�the�inclusion�of�this�arterial�in�the�agency’s�online�traffic�flow�map�is�an�application�in�
this�category.��
Example: ITS Categories
Some�examples�of�ITS�use�from�the�RITA’s�Intelligent�Transportation�Systems�Benefits,�Costs,�and�Lessons�Learned:�2008�Update�are�(these�are�direct�quotes�from�the�executive�summary,�italics�added�to�distinguish�from�other�text):��
Arterial�Management�Optimizing�signal�timing�is�considered�a�low�cost�approach�to�reducing�congestion.�Based�on�data�from�six�separate�studies,�the�costs�range�from�$2,500�to�$3,100�per�signal�per�update�(Sunkari�2004;�TEI�Engineering�2005;�Harris�2005;�NTOC�2005;�Luor�2006;�Heminger�2006).�Based�on�a�series�of�surveys�of�arterial�management�agencies�in�78�of�the�largest�U.S.�metropolitan�areas,�half�of�traffic�signals�in�these�metropolitan�areas�were�under�centralized�control�through�closed�loop�or�computer�control�in�2006.�
Freeway�Management�There�are�numerous�ITS�strategies�to�improve�freeway�operations.�Metropolitan�areas�that�deploy�ITS�infrastructure�including�dynamic�message�signs�(DMS)�to�manage�freeway�and�arterial�traffic,�
213

Access & Equity Greenroads™ Manual v1.5
Intelligent Transportation Systems AE-2
and�integrate�traveler�information�with�incident�management�systems�can�increase�peak�period�freeway�speeds�by�8�to�13�percent�(Smith�and�Perez�1992;�Birst�and�Ayman�2000),�improve�travel�time,�and�according�to�simulation�studies,�reduce�crash�rates�and�improve�trip�time�reliability�with�delay�reductions�ranging�from�1�to�22�percent�(Smith�and�Perez�1992;�FHWA�1999a;�FHWA�1999b;�Brist�and�Ayman�2000;�FHWA�2000;�FHWA�2001;�Jeannotte�2001).�In�Minneapolis�St.�Paul,�the�benefit�to�cost�ratio�for�a�ramp�metering�system�was�estimated�at�15:1�(Cambridge�Systematics�2001).�
Crash�Prevention�and�Safety�Downhill�speed�warning�systems�have�decreased�truck�crashes�by�up�to�13�percent�at�problem�sites�in�Oregon�and�Colorado�(Drakopoulos�2006).�As�part�of�an�evaluation�of�automated�truck�rollover�warning�systems,�the�Pennsylvania�DOT�researched�systems�in�other�states.�The�cost�of�these�systems�varied�significantly,�ranging�from�$50,000�to�$500,000,�as�did�their�configurations:�invasive�and�non�invasive�detection,�weight�based�versus�simplified�speed�class�algorithms,�and�system�calibrations�for�warnings�(Pento�2005).�The�three�most�widely�adopted�systems�are�curve�and�ramp�speed,�rail�crossing�warning�systems�and�pedestrian�safety�systems.�Next�in�popularity,�and�adopted�by�about�half�as�many�states,�are�downhill�warning�systems,�intersection�collision�avoidance�systems,�and�animal�warning�systems.�
Road�Weather�Management�Evaluation�data�show�that�80�to�94�percent�of�motorists�who�use�traveler�information�Web�sites�think�road�weather�information�enhances�their�safety�and�prepares�them�for�adverse�road�weather.(FHWA�2004;�FHWA�2006).�Studies�have�found�that�anti�icing�programs�can�lower�snow�and�ice�control�costs�by�10�to�50�percent�and�reduce�crash�rates�by�7�to�83�percent�(Breen�2001;�McCormick�Rankin�Corporation�and�Ecoplans�Ltd.�2004;�O’Keefe�and�Shi�2005).��
Electronic�Payment�and�Pricing�On�freeways,�variable�pricing�strategies�are�effective�at�influencing�traveler�behavior.�Although�initial�public�support�for�such�tolls�may�be�low,�research�indicates�that�road�users�value�time�savings�and�are�willing�to�pay�a�price�to�avoid�congestion�and�delay�(North�Central�Texas�Council�of�Governments�2005;�Douma�et�al.�2006).�In�California,�for�example,�public�support�for�variable�tolling�on�State�Route�91�was�initially�low;�but�after�18�months�of�operations,�nearly�75�percent�of�the�commuting�public�expressed�approval�of�virtually�all�aspects�of�the�express�lanes�program�(North�Central�Texas�Council�of�Governments�2005).�
Traveler�Information�Studies�show�that�drivers�who�use�route�specific�travel�time�information�instead�of�area�wide�traffic�advisories�can�improve�on�time�performance�by�5�to�13�percent�(Vasudevan�et�al.�2005).�Recent�evaluation�data�show�that�customer�satisfaction�with�regional�511�deployments�range�from�68�to�92�percent�(511�Deployment�Coalition�2005).�The�511�Deployment�Coalition�conducted�an�in�depth�cost�analysis�based�on�the�experience�from�nine�511�deployers.�On�average,�the�statewide�systems�cost�approximately�$2.5�million�to�design,�implement,�and�operate�during�the�first�year.�Metropolitan�systems�cost�an�average�of�$1.8�million�to�design,�implement,�and�operate�during�the�first�year�(511�Deployment�Coalition�2006).�The�two�most�popular�media�for�distributing�traveler�information�in�the�78�largest�U.S.�metropolitan�areas�are�Web�sites�and�e�mail,�followed�by�automatic�telephone�and�pagers.�Thirty�(30)�of�the�78�metropolitan�areas�use�dedicated�TV�to�distribute�traveler�information�and�18�use�kiosks,�a�medium�which�has�seen�no�growth�in�recent�years.�
POTENTIAL ISSUES
The�ITS�applications�used�should�provide�quantified�benefits�that�justify�their�cost.��
214
Greenroads™ Manual v1.5 Access & Equity
AE-2 Intelligent Transportation Systems
RESEARCH The�FHWA’s�RITA�ITS�website�(http://www.its.dot.gov)�maintains�a�current�database�of�ITS�benefits,�costs,�lessons�learned�and�deployment�statistics.�ITS�America,�a�not�for�profit�organization,�also�maintains�a�website�(http://www.itsa.org)�with�substantial�documentation�on�ITS�efforts.��
Perceived�and�Measured�Benefits�of�ITS�The�goal�area�definitions�listed�below�(which�can�be�found�at�the�bottom�of�this�website:�http://www.itsbenefits.its.dot.gov/its/benecost.nsf/ByInfo/WhatIsBClassifications#goal)�give�an�overview�of�the�perceived�and�measured�benefits�of�ITS.�The�most�relevant�sustainability�components�are�listed�at�the�end�of�each�goal�area�description.��
Safety�Several�specific�applications�aim�to�reduce�both�the�number�and�severity�of�crashes.�This�benefit�is�directly�related�to�the�equity�component�of�sustainability.�Measures�of�effectiveness�include�crash�rate,�fatality�rate,�and�injury�rate.�Equity�
Mobility�Many�applications�aim�to�reduce�travel�delay�and�travel�time.�This�benefit�is�related�to�the�equity�(improved�mobility),�economy�(lower�user�cost�associated�with�facility�use�due�to�faster�travel�time)�and�ecology�(more�efficient�use�can�but�may�not�always�lead�to�less�fuel�consumption�and�fewer�emissions).�Measures�of�effectiveness�include�delay�time�and�variability�of�travel�time.�Ecology,�economy�
Productivity�Some�applications�aim�to�reduce�operating�costs�and�allow�productivity�improvements.�This�includes�applications�that�may�save�time�in�completing�business�or�regulatory�processes,�systems�that�have�lower�life�cycle�costs�compared�to�traditional�transportation�systems,�and�information�collection/aggregation�applications�that�can�lead�to�economic�savings�or�performance�improvement.�Measures�of�effectiveness�are�usually�some�form�of�cost�savings�achieved�by�using�ITS.�Economy,�extent,�expectations.��
Efficiency�Many�applications�are�designed�to�improve�the�efficiency�of�existing�facilities�so�that�mobility,�access�and�other�needs�can�be�met�with�the�existing�or�less�physical�infrastructure�than�would�otherwise�be�possible.�Traditional�methods�of�measuring�capacity�(e.g.,�those�in�the�Highway�Capacity�Manual�2000)�often�do�not�account�for�ITS�applications�that�can�improve�capacity�beyond�that�for�a�traditional�roadway�without�ITS.�A�typical�measure�of�effectiveness�is�“effective�capacity”,�or�the�maximum�potential�rate�at�which�persons�or�vehicles�may�traverse�a�link,�node,�or�network�under�a�representative�composite�of�roadway�conditions�including�weather,�incidents,�and�variation�in�traffic�demand�patterns.�Economy,�equity,�extent,�expectations.�
Energy�and�Environment�Some�applications�have�the�secondary�effect�of�improving�air�quality�and�lessening�energy�impacts�of�transportation�because�of�improved�efficiency�or�other�improvement�measures.�Measures�of�effectiveness�include�modeled�or�simulated�reductions�in�emissions�and�energy�use.�Ecology,�economy.��
Customer�Satisfaction�Many�applications�provide�improved�customer�satisfaction�by�more�closely�meeting�traveler�expectations.�Typical�measures�of�effectiveness�are�traveler�surveys,�product�awareness,�expectation/realization�of�benefits�and�assessment�of�value.�Equity.��
215

Access & Equity Greenroads™ Manual v1.5
Intelligent Transportation Systems AE-2
GLOSSARY
Effective�capacity� The�maximum�potential�rate�at�which�persons�or�vehicles�may�traverse�a�link,�node,�or�network�under�a�representative�composite�of�roadway�conditions�including�weather,�incidents,�and�variation�in�traffic�demand�patterns.�
Intelligent�Transportation�System� An�application�of�integrated�information,�telecommunications�and�computer�based�technologies�to�infrastructure�and�vehicles�in�order�to�improve�safety�and�mobility�on�surface�transportation�networks.��
�
REFERENCES 511�Deployment�Coalition.�(2005).�America’s�Travel�Information�Number:�Implementation�and�Operational�
Guidelines�for�511�Services�Version�3.0,�511�Deployment�Coalition.��
511�Deployment�Coalition.�(2006).�511�Deployment�Costs:�A�Case�Study,�511�Deployment�Coalition.��
Birst,�S.�and�Ayman�S.�(2000).�An�Evaluation�of�ITS�for�Incident�Management�in�Second�Tier�Cities:�A�Fargo,�ND�Case�Study.�Paper�Presented�at�ITE�2000�Annual�Meeting.�Nashville,�Tennessee.�6–10�August�2000.��
Breen,�B.D.�(2001).�Anti�Icing�Success�Fuels�Expansion�of�the�Program�in�Idaho,�Idaho�Transportation�Department,�Snow�and�Ice�Pooled�Fund�Cooperative�Program.�http://ops.fhwa.dot.gov/weather/Publications/AntiicingIdaho.pdf.�Accessed�5�October�2001.��
Cambridge�Systematics.�(2001).�Twin�Cities�Ramp�Meter�Evaluation:�Final�Report.�Prepared�by�Cambridge�Systematics�for�the�Minnesota�DOT,�EDL�No.�13425.�St.�Paul,�MN.�
Douma,�F.;�Zmud,�J.�and�Patterson,�T.�(2006).�Pricing�Comes�to�Minnesota:�Baseline�Attitudinal�Evaluation�of�the�I�394�HOT�Lane�Project.�Paper�Presented�at�the�85th�Transportation�Research�Board�Annual�Meeting.�Washington,�DC.��
Drakopoulos,�A.�(2006).�CVO/Freight�and�ITS�Session.�Presentation�at�the�12th�annual�ITS�Forum,�Wisconsin�Chapter�of�ITS�America—Smartways,�Marquette�University.�Milwaukee,�WI.��
Federal�Highway�Administration�(FHWA).�(1999a).�Innovative�Traffic�Control�Technology�and�Practice�in�Europe,�U.S.�DOT�Federal�Highway�Administration,�Office�of�International�Programs.��
Federal�Highway�Administration�(FHWA).�(1999b).�ITS�Impacts�Assessment�for�Seattle�MMDI�Evaluation:�Modeling�Methodology�and�Results.�U.S.�DOT�Federal�Highway�Administration.�EDL�No.�11323.��
Federal�Highway�Administration�(FHWA).�(2000).�Metropolitan�Model�Deployment�Initiative:�San�Antonio�Evaluation�Report�(Final�Draft).�U.S.�DOT�Federal�Highway�Administration,�Report�No.�FHWA�OP�00�017,�EDL�No.�12883.��
Federal�Highway�Administration�(FHWA).�(2001).�Detroit�Freeway�Corridor�ITS�Evaluation,�U.S.�DOT�Federal�Highway�Administration.�EDL�No.�13586.��
Federal�Highway�Administration�(FHWA).�(2004).�Evaluation�of�Rural�ITS�Information�Systems�along�U.S.�395,�Spokane,�Washington.�U.S.�DOT�Federal�Highway�Administration,�EDL�No.�13955.�
Federal�Highway�Administration�(FHWA).�(2006).�Final�Evaluation�Report:�Evaluation�of�the�Idaho�Transportation�Department�Integrated�Road�Weather�Information�System.�U.S.�DOT�Federal�Highway�Administration,�EDL�No.�14267.�
216
Greenroads™ Manual v1.5 Access & Equity
AE-2 Intelligent Transportation Systems
Harris,�J.�(2005).�Benefits�of�Retiming�Traffic�Signals:�A�Reference�for�Practitioners�and�Decision�Makers�about�the�Benefits�of�Traffic�Signal�Retiming.�Presented�at�the�ITE�2005�Annual�Meeting�and�Exhibit.�Melbourne,�Australia.�7–10�August�2005.��
Heminger,�S.�(2006).�Regional�Signal�Timing�Program—2005�Cycle�Program�Performance.�Memorandum�to�the�California�Metropolitan�Transportation�Commission’s�Operations�Committee.�Oakland,�CA.��
Jeannotte,�K.�(2001).�Evaluation�of�the�Advanced�Regional�Traffic�Interactive�Management�and�Information�System�(ARTIMIS).�Paper�Presented�at�the�11th�Annual�ITS�America�Meeting.�Miami,�FL.��
Luor,�J.�(2006).�Conversation�with�Jerry�Luor,�Traffic�Engineering�Supervisor,�Denver�Regional�Council�of�Governments�(DRCOG).�October�2006.��
McCormick�Rankin�Corporation�and�Ecoplans�Ltd.�(2004).�Case�Study�#6:�Winter�Maintenance�Innovations�Reduce�Accidents�and�Costs—City�of�Kamloops,�Prepared�by�the�McCormick�Rankin�Corporation�and�Ecoplans�Limited�for�the�Insurance�Corporation�of�British�Columbia�and�Environment.�Canada.��
National�Transportation�Operations�Coalition�(NTOC).�(2005).�The�National�Traffic�Signal�Report�Card:�Technical�Report.�National�Transportation�Operations�Coalition.�Washington,�DC.�
North�Central�Texas�Council�of�Governments.�(2005).�2005�Regional�Value�Pricing�Corridor�Evaluation�and�Feasibility�Study:�Dallas/Fort�Worth—Value�Pricing�History�and�Experience.�North�Central�Texas�Council�of�Governments.�Arlington,�TX.��
O’Keefe,�K.�and�Shi,�X.�(2005).�Synthesis�of�Information�on�Anti�icing�and�Pre�wetting�for�Winter�Highway�Maintenance�Practices�in�North�America:�Final�Report.�Prepared�by�the�Montana�State�University�for�the�Pacific�Northwest�Snowfighters�Association�and�the�Washington�State�DOT.�
Pento,�R.J.�(2005).�Evaluation�of�PennDOT�ITS�Deployments,�PennDOT,�Bureau�of�Highway�Safety�and�Traffic�Engineering.�Presentation�to�the�2005�Transportation�Engineering�and�Safety�Conference.��
Smith,�S.�and�Perez,�C.�(1992).�Evaluation�of�INFORM—Lessons�Learned�and�Applications�to�Other�Systems,�Paper�Presented�at�the�71st�Annual�Meeting�of�the�Transportation�Research�Board.�Washington,�DC.��
Sunkari,�S.�(2004).�The�Benefits�of�Retiming�Traffic�Signals,�ITE�Journal.�April�2004.��
TEI�Engineering.�(2005).�Fee�Estimate—Millennia�Mall�Retiming�and�Scope�and�Schedule—Millennia�Mall�Retiming,�Bid�submitted�by�TEI�Engineering�to�the�City�of�Orlando,�FL.��
Transportation�Research�Board�(TRB).�(2000).�Highway�Capacity�Manual�2000.�TRB,�National�Research�Council,�Washington,�D.C.��
Vasudevan,�M.;�Wunderlich,�K.;�Larkin,�J.;�and�Toppen.�A.�(2005).�A�Comparison�of�Mobility�Impacts�on�Urban�Commuting�Between�Broadcast�Advisories�and�Advanced�Traveler�Information�Services.�Paper�Presented�at�the�84th�Annual�Transportation�Research�Board�Meeting.�Washington,�DC.�
�
�
�
�
217

Access & Equity Greenroads™ Manual v1.5
Intelligent Transportation Systems AE-2
�
218

Greenroads™ Manual v1.5 Access & Equity
AE-3 Context Sensitive Solutions
CONTEXT SENSITIVE SOLUTIONS GOAL Deliver�projects�that�synthesize�transportation�requirements�and�community�values�through�effective�decision�making�and�thoughtful�design.�
CREDIT REQUIREMENTS Design�the�project�according�to�the�principles�of�Context�Sensitive�Solutions�(CSS).��
Fill�out�the�submission�form�from�the�CSS�National�Dialog�website�for�project�design�and�construction.��The�form�can�be�found�here:�http://www.cssnationaldialog.org/documents/design.pdf.�
OR�
Create�a�short�white�paper�(narrative)�document�describing�the�following:�
1. The�purpose�and�need�for�the�project.�2. The�planning�horizon�and�proposed�timeline�or�schedule�for�project�completion.�3. A�list�or�organizational�chart�of�the�management�structure�for�the�project:�this�
includes,�project�planners,�design�professionals,�consultants,�agency�leads,�and�other�stakeholders�involved.�
4. �The�elements�of�the�decision�making�process�used.�5. The�local�and�regional�context�and�issues�surrounding�the�project,�other�federal�
context�and�issues,�and�applicable�jurisdictional�regulations�and�policies.�6. The�public�involvement�process�for�CSD�and�results�of�this�process.�7. The�transportation�modes�considered�and�results�of�this�consideration.�8. The�visual�and�aesthetic�components�of�the�project.�9. The�plan�for�long�term�on�going�monitoring�during�operations�(if�any).�10. The�final�alternatives�and�design�elements�chosen�for�implementation�(a�summary�
is�sufficient).�
Details
Note:�This�credit�must�be�earned�in�order�to�earn�credits�AE�4�Traffic�Emissions�Reduction,�AE�5�Pedestrian�Access,�AE�6�Bicycle�Access,�and�AE�7�Transit�Access.�
Context�Sensitive�Solutions�(also�Context�Sensitive�Design;�CSD)�is�defined�as�a�collaborative,�interdisciplinary�approach�that�involves�all�stakeholders�to�provide�a�transportation�facility�that�fits�its�setting.�It�is�an�approach�that�leads�to�preserving�and�enhancing�scenic,�aesthetic,�historic,�community,�and�environmental�resources,�while�improving�or�maintaining�safety,�mobility,�and�infrastructure�conditions.�(FHWA,�2009)�
DOCUMENTATION � Copy�of�the�implementation�of�CSS�in�transportation�project�design�and�
construction�form�OR�copy�of�the�Context�Sensitive�Planning�white�paper�addressing�all�10�items�above.�
AE-3
5 POINTS
RELATED CREDITS
� PR�1�Environmental�Review�Process�
� AE�4�Traffic�Emissions�Reduction�
� AE�5�Pedestrian�Access�
� AE�6�Bicycle�Access�� AE�7�Transit�&�HOV�
Access�� AE�8�Scenic�Views�� AE�9�Cultural�
Outreach�
SUSTAINABILITY COMPONENTS
� Ecology�� Equity�� Economy�� Extent�� Expectations�� Experience�� Exposure�
BENEFITS
� Reduces�Manmade�Footprint�
� Improves�Access�� Improves�Mobility�� Improves�Human�
Health�&�Safety�� Improves�
Accountability�� Increases�Awareness� Increases�Aesthetics�
219

Access & Equity Greenroads™ Manual v1.5
Context Sensitive Solutions AE-3
APPROACHES & STRATEGIES
The�CSS/CSD�Framework�� Consult�existing�guidance�documents�and�resources�to�understand�the�framework�and�review�a�variety�of�
examples.�See�the�“Additional�Resources”�listed�at�the�end�of�this�credit.�� Follow�the�CSS�framework�(Stamatiadis�et�al.,�2009;�Neuman�et�al.,�2002).�There�are�six�key�steps�in�the�CSS�
project�development�process:�
1. Develop�a�decision�making�process�and�management�structure.�2. Define�the�problem.�3. Develop�the�project�and�the�evaluation�framework�for�the�project.�4. Determine�alternatives.�5. Screen�the�alternatives.�6. Evaluate�and�select�an�alternative.�
Interdisciplinary�Decision�Making�� Collaborate�with�local�experts�in�both�transportation�and�non�transportation�planning�and�design�professions.�� Use�a�transparent�decision�process�with�clear�channels�for�community�participation.�This�will�ensure�design�of�a�
project�that�meets�the�needs�of�the�transportation�system�as�well�as�the�community�as�a�whole.�� Incorporate�the�following�five�elements�in�the�decision�process�throughout�the�project�for�the�most�effective�
approach�(from�Neuman�et�al.,�2002):�
1. The�decision�points�in�the�process�or�project�milestones.�2. Who�will�make�each�decision.�3. Who�will�make�recommendations�for�each�decision.�4. Who�will�be�consulted�on�each�decision.�5. How�recommendations�and�comments�will�be�transmitted�to�decision�makers.�
� Document�each�of�these�elements�clearly�in�the�project�paper�trail.�This�will�help�ensure�that�project�decision�makers�are�held�accountable�for�their�responsibilities�and�actions.�
Planning�and�Design�Considerations�� Consider�the�appropriateness�of�including�bike,�pedestrian�or�transit�facilities�in�the�design�of�the�roadway�
during�project�planning.�This�might�be�as�simple�as�constructing�bike�lanes�and�sidewalks�as�called�for�in�local�design�standards.�
� Review�local�plans�for�roadway�design�standards�and�functions.�� Consult�with�local�planners�from�appropriate�agencies�(parks�dept.,�public�works,�planning,�transportation�and�
transit)�to�determine�if�your�assessment�is�complete.�� Use�visualization�tools,�such�as�photograph�rendering�or�computer�models.�These�can�often�can�help�in�design�
alternative�selection�process.�� Consider�the�project�no�build�condition.�Some�local�standards�may�require�elements�that�may�not�be�
appropriate�for�environmental�or�engineering�reasons�and�may�be�able�to�be�granted�an�exception�which�can�be�pursued�during�planning.�An�example�would�be�designing�narrower�streets�than�required�by�standard�specifications�in�a�residential�neighborhood,�which�can�improve�safety�by�slowing�neighborhood�traffic.�
CSD�for�Multimodal�Access�� Consider�all�modes�at�the�initial�stages�of�planning.�While�each�individual�roadway�does�not�have�to�
accommodate�people�using�all�modes,�a�system�should�be�accessible�to�people�on�bikes,�foot,�and�transit,�as�well�as�in�cars�and�trucks,�where�the�purpose�and�need�statement�for�the�project�define�these�elements�as�appropriate.�
220

Greenroads™ Manual v1.5 Access & Equity
AE-3 Context Sensitive Solutions
� Consult�local�plans�for�existing�and�future�planned�bike,�pedestrian�and�transit�elements�to�see�if�the�project�includes�or�crosses�named�elements.�Many�jurisdictions�have�adopted�plans�related�to�bike,�pedestrian�and�transit�systems.�
� Incorporate�new�modal�elements�such�as�bike�lanes,�sidewalks�or�trails,�and�transit�facilities�should�be�included�in�designs�where�applicable.�Generally,�design�standards�or�plans�will�dictate�placement�of�these�elements,�or�they�may�be�requested�by�the�public�during�project�scoping.�
� Considering�roadway�improvements�which�may�impact�the�existing�or�master�planned�bike,�pedestrian�and�transit�networks.�Improvements�to�these�modal�elements�should�be�made�as�appropriate�to�mitigate�user�impacts.�
Public�Involvement�Considerations�� Consult�with�stakeholders�to�understand�community�issues,�to�envision�solutions,�and,�ultimately,�to�
understand�how�a�project�fits�into�a�community.�Through�this�process,�planners�and�designers�are�more�likely�to�design�a�project�that�minimizes�impacts�to�the�community�and�supports�the�community’s�vision.��
� Conduct�an�appropriately�scaled�stakeholder�consultation�process�in�project�planning�for�the�whole�project�and�specific�issues�as�needed.�This�process�might�be�as�simple�as�holding�a�project�open�house�to�identify�community�concerns,�issues�or�opportunities,�or�it�might�be�a�long�process�with�multiple�opportunities�for�stakeholder�engagement�including�public�workshops,�committee�meetings,�and�other�engagement�opportunities.��
� Include�in�the�public�involvement�plan�the�following�steps:�issue�identification,�development�of�evaluation�criteria,�development�of�potential�solutions,�evaluation�of�solutions,�and�selection�of�a�solution�that�best�meets�the�evaluation�criteria.�
� Follow�the�guidance�available�on�stakeholder�consultation,�such�as�the�FHWA’s�Public�Involvement�Techniques�for�Transportation�Decision�Making�and�How�to�Engage�Low�Literacy�and�Limited�English�Proficiency�Populations�in�Transportation�Decisionmaking.�
� Development�a�plan�for�stakeholder�involvement�so�that�the�sessions�run�smoothly�and�achieve�objectives.�This�plan�requires�an�understanding�of�the�community�that�can�be�informed�by�conversations�with�local�leaders�or�jurisdictional�staff,�research�on�the�web,�or�previous�work�in�the�community.�The�plan�should�identify�milestones�for�stakeholder�involvement,�a�clear�decision�process�that�illustrates�how�input�will�be�used,�and�tools�or�methods�for�involving�stakeholders.�
� Document�and�track�public�input�and�how�that�input�is�reflected�in�project�planning�and�design.��� Set�up�a�comment�and�resolution�log�that�lists�community�comments�and�team�actions.�� Use�narratives�or�minutes�that�describe�input�gathered�at�each�project�milestone�and�how�that�input�will�be�
reflected�in�the�process.�� Remember�that�the�stakeholder�consultation�process�does�not�require�acquiescence�to�every�stakeholder�
request.��Some�requests�will�be�too�expensive,�will�be�out�of�step�with�the�project�purpose,�or�will�not�reflect�the�values�of�the�community�as�a�whole.�
� Developing�an�evaluation�framework�that�reflects�community�goals�and�project�goals�creates�a�filter�for�determining�which�requests�are�integrated�into�the�project�and�which�are�set�aside.�
Example: Aurora Avenue North Multimodal Corridor Project — Shoreline, WA
The�City�of�Shoreline�implemented�a�new�roadway�design�for�three�miles�of�State�Route�99�(also�known�as�Aurora�Avenue�North)�to�alleviate�traffic�congestion,�improve�business�access,�and�provide�pedestrian�access.�Context�Sensitive�Solutions�(CSS)�were�used�to�design�an�environmentally�conscious�roadway�that�protected�salmon�and�provided�multimodal�mobility�improvements�to�the�Northwest,�including�pedestrians,�bicyclists,�motorists,�and�freight�truckers.�See�Figures�AE�3.1�through�AE�3.3.�
Some�highlights�of�the�CSS�process�followed�by�the�project�include:�
� Photosimulations�helped�stakeholders�visualize�the�impact�of�proposed�solutions�
221

Access & Equity Greenroads™ Manual v1.5
Context Sensitive Solutions AE-3
� Multimodal�connectivity�was�successfully�provided�for�cyclists�and�pedestrians�via�the�Interurban�Trail,�which�sails�across�the�roadway,�giving�safe�and�dedicated�access�for�these�travelers.�Continuous�11�foot�wide�sidewalks�with�disability�access�were�also�installed,�reducing�pedestrian�fatalities�and�injuries.�
� Transit�service�was�enhanced�via�Bus�Rapid�Transit�(BRT:�Figure�AE�3.2),�including�dedicated�bus�lanes,�in�line�stops,�access�improvements�at�bus�zones�and�shelters,�and�signal�priority.�These�enhancements�resulted�in�major�efficiency�(80%�speed�increase)�and�scheduling�improvements�(600%�reliability�increase).�
�Figure�AE�3.1:�Bicycle�and�Pedestrian�Bridge.�
Photo�by�CH2M�Hill.�
�Figure�AE�3.2:�Aerial�view�of�Aurora�Avenue�and�BRT.�
Photo�by�CH2M�Hill.�
Figure�AE�3.3:�Interurban�Trail�Bicycle�and�Pedestrian�Bridge�over�SR�99.�Photo�by�CH2M�Hill.��
� Stakeholders�worked�along�with�planners�and�designers�to�reach�a�consensus�that�best�fit�goals�and�values,�(though�a�good�portion�of�the�remaining�SR�99�corridor�is�still�a�matter�of�public�debate.)�
� Traffic�efficiency�improvements,�such�as�intersection�capacity,�corridor�wide�traffic�management,�new�signals�and�access�locations,�resulted�in�flow�improvements�over�36%�over�the�no�build�condition.�
� Access�management�and�illumination�of�the�corridor�increased�safety�by�reducing�severity�of�crashes�and�reducing�total�crashes�by�25%.�
� Aesthetic�improvements�were�incorporated,�including�landscaping,�trees,�screening�and�burying�utilities,�public�art�and�architectural�features.�This�resulted�in�increased�property�values�and�redevelopment�and�a�more�livable�community.�
� Stormwater�management�incorporated�biofiltration�areas�and�in�Right�of�Way�treatment�facilities,�ultimately�reducing�impervious�surface�by�15%�and�improving�stormwater�quality�by�100%�over�no�build.�
More�information�about�the�SR�99�Improvements�is�available�here�from�the�Washington�State�Department�of�Transportation:�http://www.wsdot.wa.gov/projects/SR99/Shoreline_NCTHOV/��
Example: Case Study — Whittier Access Project — Whittier, Alaska
The�Alaska�Department�of�Transportation�and�Public�Facilities�began�the�Whittier�Access�Project�to�increase�access�and�mobility�to�the�region�for�both�train�and�highway�travel.�For�the�first�time�in�50�years,�Whittier�
222

Greenroads™ Manual v1.5 Access & Equity
AE-3 Context Sensitive Solutions
would�have�a�highway,�providing�access�to�emergency�services,�recreation,�tourism,�travel�and�commerce�in�the�environmentally�sensitive�setting�of�Prince�William�Sound�and�the�Chugach�National�Forest.�
Two�fundamental�objectives�guided�the�project:�meet�transportation�access�needs�for�residents,�freight�and�visitors�and�minimize�environmental�impact�from�construction.�Planning�for�the�4�mile�access�road,�two�tunnels�(one�500�feet�and�another�2.5�mile�combined�access�for�rail�and�highway),�two�bridges�,�and�portal�buildings�began�in�1993.�The�completed�project�opened�to�the�public�in�2000.�Note�that�pedestrian�and�bicycle�access�is�not�provided�for�safety�reasons.�Additionally,�there�is�no�public�transit�in�Whittier.�See�Figure�AE�3.4.�
�Figure�AE�3.4:�Whittier�Access�project.�Photo�by�CH2M�Hill.�
�Some�project�highlights�include:�
� The�roadway�alignments�used�existing�topographical�features�to�minimize�visual�impact�by�screening�the�road�with�the�new�500�foot�long�tunnel.�
� The�alignments�also�minimized�impacts�to�sensitive�plants,�salmon�spawning�grounds,�wildlife�and�provided�drainage�structures�adequate�for�fish�passage.�
� Blasting�techniques�were�used�as�an�aesthetic�tool�to�leave�an�irregular�surface�that�was�similar�to�the�look�of�natural�rock�formations.�This�minimized�visual�impacts�from�the�nearby�Portage�Lake.�
� The�bridges�were�designed�to�be�low�profile�and�minimum�footprint�with�single�column�piers�to�allow�boating�access�and�minimize�obstruction�of�a�nearby�glacial�viewpoint.�
� Bridge�girders�were�sandblasted�and�textured�to�match�surroundings.�
More�information�about�the�Whittier�Access�project�can�be�found�from�the�Alaska�Department�of�Transportation�and�Public�Facilities�here:�http://www.dot.state.ak.us/creg/whittiertunnel/index.shtml��
223

Access & Equity Greenroads™ Manual v1.5
Context Sensitive Solutions AE-3
POTENTIAL ISSUES
1. For�smaller�projects�that�typically�do�not�require�involvement�of�many�people,�or�direct�management�by�stakeholders,�this�credit�requires�that�an�additional�document�is�generated.�
2. CSS�does�not�guarantee�effectiveness�of�the�final�design�alternative.�This�is�especially�true�relative�to�cost�and�scheduling�concerns.�
3. CSS�does�not�address�construction�management�issues�except�broadly.�4. This�particular�credit�does�not�have�any�means�of�tracking�or�monitoring�the�success�(or�failure)�of�a�project�
after�it�is�constructed,�i.e.�to�determine�if�the�CSS�planning�process�resulted�in�a�positive�or�negative�outcome.�
RESEARCH “If�highway�designers�are�not�aware�of�opportunities�to�use�their�creative�abilities,�the�standard�or�conservative�use�of�the�Green�Book�criteria�and�related�State�standards,�along�with�a�lack�of�full�consideration�of�community�values,�can�cause�a�road�to�be�out�of�context�with�its�surroundings.�It�may�also�preclude�designers�from�avoiding�impacts�on�important�natural�and�human�resources”�(Federal�Highway�Administration,�1997).�Context�sensitive�design�(CSD),�sometimes�called�Context�Sensitive�Solutions�(CSS),�is�a�well�documented�approach�to�project�delivery�that�relies�on�an�understanding�of�and�response�to�the�project’s�context�–�its�physical�and�social�place�–�in�all�aspects�of�design.�There�are�several�definitions�of�CSS,�but�all�of�them�are�consistent�with�industry�best�practice�(ICF�International,�2009).�According�to�the�FHWA,�the�definition�of�CSS�is:�
A�collaborative,�interdisciplinary�approach�that�involves�all�stakeholders�to�provide�a�transportation�facility�that�fits�its�setting.�It�is�an�approach�that�leads�to�preserving�and�enhancing�scenic,�aesthetic,�historic,�community,�and�environmental�resources,�while�improving�or�maintaining�safety,�mobility,�and�infrastructure�conditions.�(FHWA,�2009)�
CSS�synthesizes�conventional�engineering,�professional�expertise�and�thoughtful�planning�with�human�values�through�a�systems�approach�for�project�delivery.�Integrating�CSS�into�project�decision�making�requires�a�multidisciplinary�approach�to�planning�and�design�and�an�open�dialogue�with�stakeholders.�CSS�also�refers�to�an�overall�product�or�outcome:�a�roadway�project�that�is�generally�more�suitable�and�valuable�to�its�community�(ICF�International,�2009).�
Several�federal,�state�and�local�laws�mandate�(or�otherwise�strongly�recommend)�the�use�of�context�sensitive�design.�The�most�recent�federal�regulation�that�was�relevant�to�CSS�was�the�Safe,�Accountable,�Flexible,�Transportation�Efficiency�Act:�A�Legacy�for�Users�(SAFETEA�LU),�which�recently�expired�and�has�not�been�replaced�by�a�subsequent�regulation�as�of�this�writing.�Section�6008�Historically,�CSS�concepts�have�been�embedded�in�federal�law�since�the�institution�of�the�National�Environmental�Policy�Act�(NEPA)�at�the�start�of�1970.�(American�Association�of�State�Highway�Transportation�Officials:�AASHTO,�2010;�Context�Sensitive�Solutions.org,�2010)�
While�environmental�review�processes�like�the�NEPA�share�some�traits�with�CSS�planning�and�design�approaches,�they�are�not�one�and�the�same.�Instead,�CSS�and�the�environmental�review�process�are�complementary�decision�making�processes.�Both�processes�(and�their�resulting�implementation)�are�comprehensive�in�nature,�but�their�focus�is�generally�different.�For�example,�harmonizing�environmental�needs�for�the�project�in�the�CSS�process�could�easily�be�addressed�in�the�environmental�review�process,�if�required�by�the�agency�or�jurisdiction.�Many�project�teams�use�CSS�as�an�opportunity�to�complete�the�environmental�review�process�even�if�the�project�is�not�subject�to�NEPA�or�local�requirements.�This�choice�is�generally�seen�as�a�way�to�minimize�backtracking�for�documentation�that�would�need�to�occur�if,�for�instance,�the�project�happened�to�qualify�midway�through�the�design�process�for�federal�funding.�(Neuman�et�al.,�2002).�
Characteristics�of�CSS�Interestingly�(and�unlike�other�credits�in�Greenroads),�there�is�no�clear�corollary�to�CSS�in�the�building�industry�or�in�the�LEED�Green�Building�Rating�system.�CSS�is�an�approach�exclusive�to�transportation�in�planning�and�development.�The�best�analogy�is�that�CSS�is�to�transportation�as�architecture�and�urban�design�are�to�the�built�
224
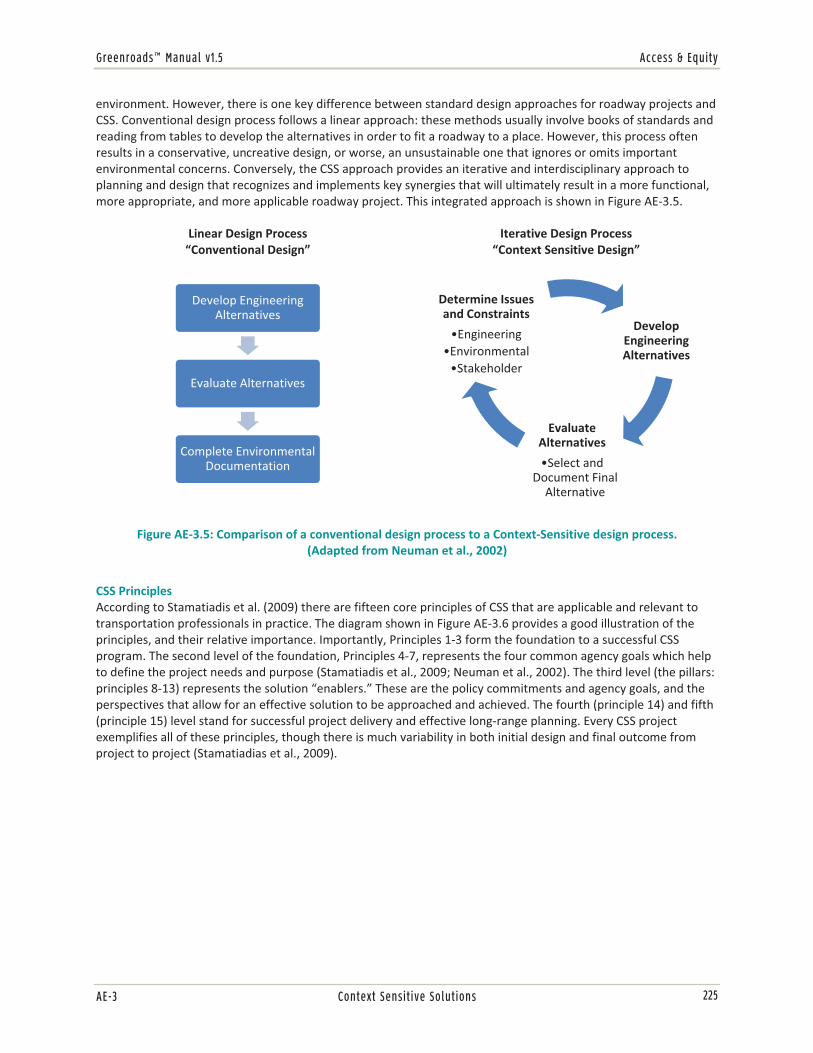
Greenroads™ Manual v1.5 Access & Equity
AE-3 Context Sensitive Solutions
environment.�However,�there�is�one�key�difference�between�standard�design�approaches�for�roadway�projects�and�CSS.�Conventional�design�process�follows�a�linear�approach:�these�methods�usually�involve�books�of�standards�and�reading�from�tables�to�develop�the�alternatives�in�order�to�fit�a�roadway�to�a�place.�However,�this�process�often�results�in�a�conservative,�uncreative�design,�or�worse,�an�unsustainable�one�that�ignores�or�omits�important�environmental�concerns.�Conversely,�the�CSS�approach�provides�an�iterative�and�interdisciplinary�approach�to�planning�and�design�that�recognizes�and�implements�key�synergies�that�will�ultimately�result�in�a�more�functional,�more�appropriate,�and�more�applicable�roadway�project.�This�integrated�approach�is�shown�in�Figure�AE�3.5.�
Linear�Design�Process�“Conventional�Design”�
Iterative�Design�Process�“Context�Sensitive�Design”�
��
Figure�AE�3.5:�Comparison�of�a�conventional�design�process�to�a�Context�Sensitive�design�process.(Adapted�from�Neuman�et�al.,�2002)�
�
CSS�Principles�According�to�Stamatiadis�et�al.�(2009)�there�are�fifteen�core�principles�of�CSS�that�are�applicable�and�relevant�to�transportation�professionals�in�practice.�The�diagram�shown�in�Figure�AE�3.6�provides�a�good�illustration�of�the�principles,�and�their�relative�importance.�Importantly,�Principles�1�3�form�the�foundation�to�a�successful�CSS�program.�The�second�level�of�the�foundation,�Principles�4�7,�represents�the�four�common�agency�goals�which�help�to�define�the�project�needs�and�purpose�(Stamatiadis�et�al.,�2009;�Neuman�et�al.,�2002).�The�third�level�(the�pillars:�principles�8�13)�represents�the�solution�“enablers.”�These�are�the�policy�commitments�and�agency�goals,�and�the�perspectives�that�allow�for�an�effective�solution�to�be�approached�and�achieved.�The�fourth�(principle�14)�and�fifth�(principle�15)�level�stand�for�successful�project�delivery�and�effective�long�range�planning.�Every�CSS�project�exemplifies�all�of�these�principles,�though�there�is�much�variability�in�both�initial�design�and�final�outcome�from�project�to�project�(Stamatiadias�et�al.,�2009).�
Develop�Engineering�Alternatives
Evaluate�Alternatives
Complete�Environmental�Documentation
Develop�Engineering�Alternatives
Evaluate�Alternatives
•Select�and�Document�Final�
Alternative
Determine�Issues�and�Constraints
•Engineering•Environmental
•Stakeholder
225

Access & Equity Greenroads™ Manual v1.5
Context Sensitive Solutions AE-3
Figure�AE�3.6:�Graphical�depiction�of�15�principles�of�Context�Sensitive�Solutions.�(Stamatiadis�et�al.,�2009)�
Benefits�of�CSS�There�are�several�benefits�of�CSS.�Stamatiadis�et�al.�(2009)�recently�attempted�to�identify�the�quantifiable�benefits�of�CSS.�His�group�established�22�quantifiable�benefits�of�applying�CSS�principles.�These�are�shown�in�Table�AE�3.1.�
Table�AE�3.1:�22�Benefits�of�CSS�(adapted�from�NCHRP�Report�No.�690�by�Stamatiadis�et�al.,�2009)�Improved�by�CSS� Optimized�by�CSSPerformance�predictability�and�project�delivery Maintenance�and�operationsScoping�and�budgeting�process� Design�appropriate�for�context�Long�term�decisions�and�investments� Increased�by�CSSEnvironmental�stewardship Risk�management�protectionMobility�for�users� Stakeholder/public�feedbackWalkability�and�bikeability� Stakeholder/public�participation,�ownership�and�trustSafety�(vehicles,�pedestrians�and�bikes)� Partnering�opportunitiesAccess�to�multi�modal�options�(including�transit) Minimized�by�CSSCommunity�satisfaction� Overall�impact�to�human�and�natural�environmentQuality�of�life�for�community� Construction�related�disruption�Speed�management� Overall�costs�for�project�delivery�� Overall�time�for�project�delivery��In�addition�to�the�quantifiable�benefits,�some�qualitative�highlights�of�CSS�planning�and�design�principles�are:�
� CSS�is�universal.�A�key�strength�of�CSS/CSD�is�its�universality�and�applicability�to�all�stakeholders�in�the�project,�including�owner�agencies,�the�public�and�design�professionals.�The�NCHRP�480�(Neuman�et�al.,�2002)�document�summarizes�strategies�and�approaches�based�on�six�areas�of�people�who�have�a�stake�in�the�overall�outcome�of�the�project.�The�document�is�organized�into�sections�based�on�professional�area�and�the�reader�is�referred�to�this�document�instead�of�summarizing�each�of�those�approaches�herein.�
226
Greenroads™ Manual v1.5 Access & Equity
AE-3 Context Sensitive Solutions
� CSS�is�applicable�and�effective�at�a�project�level.�CSS�projects�require�effective�and�successful�project�delivery�based�on�structured�decision�making,�thoughtful�consideration�of�community�input�and�values,�environmental�awareness,�protection�of�safety,�and�an�understanding�of�how�the�project�fits�within�organizational�needs�and�constraints�(Neuman�et�al.,�2002)�
� CSS�promotes�environmental�stewardship.�Environmental�resources�are�identified�and�goals�are�set�to�manage�these�resources�at�the�beginning�of�the�project.�This�approach�helps�to�prevent�unnecessary�or�minimize�environmental�impacts�(ICF�International,�2009).�
� CSS�allows�a�clear�definition�of�scope.�Implementing�a�project�management�structure�that�aligns�with�CSS�principles�can�clearly�define�the�project�needs�and�scope.�This�helps�prioritize�problems�that�may�arise�during�construction�or�even�preempt�them�through�thoughtful�planning.�(Stamitidias�et�al.,�2009)�It�also�allows�for�a�unified�vision�statement;�FHWA,�2007)�
� CSS�offers�a�more�informed�decision�making�process.�Effective�decision�making�requires�information�from�all�collaborating�parties.�CSS�accomplishes�this�collaboration�by�instituting�a�mantra�of�informed�consent,�through�active�stakeholder�engagement�and�open�communication.�(Stamitidias�et�al.,�2009;�ICF�International,�2009)�
� CSS�engages�stakeholders.�Stakeholder�involvement�is�a�core�principle�of�CSS.�Collection�and�integration�of�stakeholder�values�translates�those�values�directly�into�the�final�project�outcomes.�(FHWA,�2009;�AASHTO,�pavement�conference;�Neuman�et�al.,�2002;�Stamiditidiadlas;�ICF�International,�2009)�CSS�opens�lines�of�communication�with�all�stakeholders�early�and�keeps�them�open�throughout�project�development�and�delivery�(FWHA,�2007)�
� CSS�is�interdisciplinary.�Decisions�made�are�consensus�based,�and�draw�from�project�managers,�environmental�managers,�roadway�designers�and�engineers,�owner�agencies,�and�the�public�(Neuman�et�al.,�2002).�
� CSS�is�cost�effective.�In�a�study�by�the�Washington�State�Department�of�Transportation�(WSDOT)�and�the�University�of�Washington,�WSDOT�found�that�context�sensitive�planning�for�community�design�elements�in�main�street�areas�of�urban�centers�help�to�preempt�scope�and�scheduling�changes,�which�resulted�in�potential�overall�savings�for�the�agency.�(Nicholls�and�Reeves,�2009)�
� CSS�can�be�integrated�into�policy.�CSS�is�a�well�established�best�practice�that�has�been�successfully�integrated�within�many�agencies�to�help�achieve�internal�goals�and�objectives,�such�as�at�WSDOT�and�the�Utah�Department�of�Transportation�(UDOT)�(FHWA,�2007;�ICF�International,�2009).�
� CSS�is�ubiquitous.�The�CSS/CSD�process�for�projects�(and�for�guidance�documents)�is�well�suited�to�an�online,�collaborative�and�interactive�environment.�Many�tools�are�available�for�project�teams�to�create�and�manage�the�CSS�elements�of�the�project,�including�public�involvement.�The�depth�of�the�internet�infrastructure�that�supports�CSS�ideas�and�implementation.�The�online�database�of�CSS,�http://www.contextsensitivesolutions.org�is�just�one�example�of�the�resources�available.�Additionally,�the�FHWA�and�AASHTO�Center�for�Environmental�Excellence�have�created�an�open�forum�for�all�practitioners�and�professionals:�
CSS�and�Sustainability�CSS�is�well�established�and�accepted�as�a�best�practice�for�roadway�designers.�However,�it�may�be�said�that�while�using�AASHTO’s�Green�Book�is�considered�a�best�practice�for�designing�many�roads,�it�certainly�does�not�guarantee�that�the�road�itself�will�be�“green”�or�more�sustainable.�Sustainability�is�a�system�characteristic�that�describes�that�system’s�capacity�to�support�natural�laws�and�human�values.�What�actually�makes�the�roadway�more�sustainable�though�is�a�team�of�proactive�and�thoughtful�professionals�making�a�deliberate�attempt�to�be�considerate�of�community�needs,�values�and�environmental�surroundings�while�planning�and�designing�the�project.�The�multi�disciplinary,�consensus�based,�whole�system�approach�is�the�key�difference�between�conventional�practice�and�CSS,�and�it�is�also�the�reason�why�CSD�usually�results�in�a�more�sustainable�project.�In�fact,�CSS�addresses�all�seven�sustainability�components�under�its�wide�umbrella�of�characteristics.�Table�AE�3.2�shows�how�the�15�principles�of�Context�Sensitive�Solutions�address�the�seven�components�of�sustainability�and�how�they�align�with�the�Greenroads�taxonomy�of�sustainability�benefits.��
� �
227

Access & Equity Greenroads™ Manual v1.5
Context Sensitive Solutions AE-3
Table�AE�3.2:�CSS�and�Sustainability�(Adapted�from�Stamatidias�et�al.,�2009)�No.� CSS�Principle� Sustainability�Components Potential�Benefits�1� Use�of�interdisciplinary�teams.� � Experience � Improves�Business�Practice2� Involve�stakeholders.� � Expectations
� Exposure�� Increases�Awareness�
3� Seek�broad�based�public�involvement.��
� Exposure � Increases��Awareness�� Improves�Business�Practice�� Creates�New�Information�
4� Use�a�full�range�of�communication�strategies��
� Exposure� Experience�
� Improves�Business�Practice� Increases�Awareness�
5� Achieve�consensus�on�purpose�and�need�
� Expectations � Improves�Business�Practice� Increases�Lifecycle�Savings�
6� Address�alternatives�and�all�modes�
� Extent� Experience�
� Improves�Business�Practice� Increases�Lifecycle�Savings�
7� Consider�a�safe�facility�for�users�and�community�
� Equity � Improves�Human�Health�&�Safety
8� Maintain�environmental�harmony� � Ecology� Experience�
� Optimizes�Habitat�&�Land�Use
9� Address�community�and�social�issues�
� Equity� Exposure�
� Improves�Access�&�Mobility� Improves�Human�Health�&�Safety� Improves�Business�Practice�� Aesthetics�
10� Address�aesthetic�treatments�and�enhancements�
� Exposure � Aesthetics�
11� Utilize�a�full�range�of�design�choices�
� Experience� Extent�
� Optimizes�Habitat�&�Land�Use� Improves�Access�&�Mobility�� Increases�Lifecycle�Savings�� Increases�Lifecycle�Service�
12� Document�project�decisions� � Expectations � Improves�Business�Practice13� Track�and�meet�all�commitments� � Expectations � Improves�Business�Practice14� Use�agency�resources�effectively� � Economy � Increases�Lifecycle�Savings
� Improves�Business�Practice�15� Create�long�lasting�community�
value�� Extent� Expectations�� Equity�
� Optimizes�Habitat�&�Land�Use� Improves�Human�Health�&�Safety� Improves�Access�&�Mobility�� Increases�Lifecycle�Service�� Aesthetics�
�Following�the�CSS�framework�does�not�ultimately�guarantee�roadway�sustainability�as�an�end�product,�nor�does�it�imply�that�sustainability�must�be�necessarily�considered�during�project�development.�However,�CSS�and�sustainability�are�complementary�approaches�to�the�same�endpoint.�The�CSS�framework�is�well�suited�to�accommodating�sustainability�considerations,�such�as�those�outlined�by�Greenroads,�early�in�project�development.�
Limitations�of�This�Credit�Generally,�CSS�is�a�planning�and�design�step�that�is�comprehensive�because�it�involves�consideration�of�the�entire�project�lifecycle�and�uses�systems�thinking�to�create�solutions.�This�lifecycle�perspective�necessitates�an�evaluation�or�assessment�process�that�occurs�during�the�operation�and�maintenance�phase�of�the�project�(i.e.�long�term�performance�monitoring).�However,�the�credit�requirements�do�not�require�detailed�discussion�of�planning�considerations�for�the�roadway�maintenance.�This�is�because�such�plans�and�documentation�for�lifetime�maintenance�and�operations�are�covered�elsewhere�in�Greenroads�(in�fact,�they�are�required�under�the�Project�Requirements�PR�9�Pavement�Maintenance�and�PR�10�Site�Maintenance).�Currently�there�is�no�credit�given�for�
228

Greenroads™ Manual v1.5 Access & Equity
AE-3 Context Sensitive Solutions
monitoring�or�evaluation�because�there�is�no�feasible�mechanism�available�for�a�rating�system�to�enforce�or�validate�such�activities.�
Additional�Resources�There�are�many,�many�resources�available�for�CSS,�from�guidebooks�to�websites�to�formal�research�reports.�Many�of�the�ideas�overlap�and�are�shared�between�resources.�The�reader�is�referred�to�these�sources�for�more�detailed�information�on�CSS.�A�brief�description�and�a�link�(where�applicable)�are�provided�below:�
� The�hub�for�all�things�context�sensitive�can�be�found�at�ContextSensitiveSolutions.org:�http://www.contextsensitivesolutions.org�
� The�AASHTO�Center�for�Environmental�Excellence�Context�Sensitive�Solutions�page�includes�a�brief�history�and�applicable�federal,�state�and�local�laws,�policies�and�guidance�documents.�Additionally,�a�number�of�user�forums�are�available�for�public�use.�This�page�is�available�at:�http://environment.transportation.org/environmental_issues/context_sens_sol/�
� The�Flexibility�in�Highway�Design�provides�one�of�the�earlier�foundation�documents�for�CSS�and�includes�practical�guidance�for�creating�highways�that�are�safe,�effective�and�efficient�using�CSS�principles.�
� Two�reports�from�NCHRP�are�heavily�referenced�in�this�discussion.�They�are�NCHRP�480:�A�guide�to�best�practices�for�achieving�context�sensitive�solutions�and�NCHRP�642:�Quantifying�the�benefits�of�Context�Sensitive�Solutions.�The�first�offers�a�very�qualitative�review,�and�the�second,�a�quantitative�one.�
� Public�involvement�is�a�core�issue�and�there�are�two�definitive�FHWA�resources�available�for�facilitating�effective�stakeholder�communication�and�public�involvement�processes.�They�are�Public�Involvement�Techniques�for�Transportation�Decision�Making�and�How�to�Engage�Low�Literacy�and�Limited�English�Proficiency�Populations�in�Transportation�Decisionmaking.�
GLOSSARY
Context�sensitive�design� See�context�sensitive�solutionsContext�sensitive�solutions� A�collaborative,�interdisciplinary�approach�that�involves�all�stakeholders�to�
provide�a�transportation�facility�that�fits�its�setting.�It�is�an�approach�that�leads�to�preserving�and�enhancing�scenic,�aesthetic,�historic,�community,�and�environmental�resources,�while�improving�or�maintaining�safety,�mobility,�and�infrastructure�conditions�(also�Context�Sensitive�Design)�
CSD� Context�sensitive�designCSS� Context�sensitive�solutionsMultimodal� Concerning�more�than�one�transportation�modeFHWA� Federal�Highway�AdministrationNCHRP� National�Cooperative�Highway�Research�ProgramAASHTO� American�Association�of�State�Highway�and�Transportation�Officials�
REFERENCES American�Association�of�State�Highway�Transportation�Officials�(AASHTO)�Center�for�Environmental�Excellence.�
(2010).�Center�for�Environmental�Excellence�by�AASHTO:�Context�Sensitive�Solutions.�Accessed�January�9,�2010.�Available�at:�http://environment.transportation.org/environmental_issues/context_sens_sol�
American�Association�of�State�Highway�Transportation�Officials�(AASHTO).�(2004).�AASHTO�Green�Book���A�policy�on�geometric�design�of�highways�and�streets.�Washington,�D.C.:�American�Association�of�State�Highway�and�Transportation�Officials.��
City�of�Shoreline.�(2010,�January�8).�City�of�Shoreline,�WA�:�Aurora�Corridor�Project.�Accessed�January�9,�2010.�Available�at�http://www.shorelinewa.gov/index.aspx?page=227��
229

Access & Equity Greenroads™ Manual v1.5
Context Sensitive Solutions AE-3
CSS�National�Dialog.�(2009).�Submission�Forms��Accessed�September�16,�2010.�Available�at�http://www.cssnationaldialog.org/forms.asp�
Context�Sensitive�Solutions.org.�(2010).�Welcome�to�CSS�|�Context�Sensitive�Solutions.org����A�CSS�support�center�for�the�transportation�community.�Accessed�January�9,�2010.�Available�at�http://www.contextsensitivesolutions.org.��
Federal�Highway�Administration�(FHWA)�Office�of�Planning.�(2006,�February).�How�to�Engage�Low�Literacy�and�Limited�English�Proficiency�Populations�in�Transportation�Decisionmaking.�[FHWA�HEP�06�009].�Report�to�the�FHWA�by�PBS&J.�Available�at�http://www.fhwa.dot.gov/hep/lowlim/lowlim1.htm.�
Federal�Highway�Administration�(FHWA).�(2009,�April�13)�A�Guide�to�Building�CSS�Knowledge�and�Skills�for�Successful�Project�Delivery.�Accessed�January�9,�2010.��Report�to�the�FHWA�by�the�Louis�Berger�Group,�Inc.,�Oldham�Historic�Properties,�Inc.�and�Project�for�Public�Spaces.�Available�at�http://www.fhwa.dot.gov/context/trainingguide/��
ICF�International,�CH2M�Hill,�Inc.�and�Trans�Tech.�(2009,�June�30).�Integrating�Context�Sensitive�Solutions�into�Transportation�Practice�Guide.�Accessed�January�9,�2010.�Available�at�http://www.contextsensitivesolutions.org/content/reading/integrating_context_sensitive_s_//resources/Integrating_CSS_into_Transportation_Practice_Guide.pdf��
Neuman,�T.�R.�et�al.�(2002).�A�guide�to�best�practices�for�achieving�context�sensitive�solutions.�National�Cooperative�Highway�Research�Program�–�NCHRP�Report�480.�Washington,�D.C.:�Transportation�Research�Board.��
Nicholls,�J.�and�Reeves,�P.�(2009).�State�highways�as�main�streets:�A�study�of�community�design�and�visioning.�[WA�RD�733.1]�Seattle,�Wash:�Washington�State�Transportation�Center,�University�of�Washington.��
Stamatiadis,�N.�et�al.�(2009).�Quantifying�the�benefits�of�Context�Sensitive�Solutions.�National�Cooperative�Highway�Research�Program�–�NCHRP�Report�642.�Washington,�D.C.:�Transportation�Research�Board.�
State�of�Alaska,�Department�of�Transportation�and�Public�Facilities.�(n.d.)�Anton�Anderson�Memorial�Tunnel�–�Whittier,�Alaska.�Accessed�January�9,�2010.�Available�at�http://www.dot.state.ak.us/creg/whittiertunnel/index.shtml�
United�States�Department�of�Transportation,�Federal�Highway�Administration�(FHWA)�Flexibility�in�Highway�Design.�[FHWA�PD�97�062]�Report�by�the�Federal�Highway�Administration.�Available�at�http://www.fhwa.dot.gov/environment/flex/index.htm�
United�States�Department�of�Transportation,�Federal�Highway�Administration.�(2007,�March)�Results�of�Joint�AASHTO/FHWA�Context�Sensitive�Solutions�Strategic�Planning�Process�Summary�Report.�Prepared�by�the�Center�of�Transportation�and�the�Environment,�North�Carolina�University.�Available�at�http://environment.transportation.org/pdf/context_sens_sol/portlandsummary_final.pdf�
United�States�Department�of�Transportation,�Federal�Highway�Administration�and�Federal�Transit�Administration.�(1996).�Public�Involvement�Techniques�for�Transportation�Decision�Making.�[FHWA�PD�96�031]�Report�to�the�FHWA�and�FTA.�Prepared�by�Howard/Stein�Hudson�Associates,�Inc.�and�Parsons�Brinckerhoff�Quade�and�Douglas.�Available�at�http://www.fhwa.dot.gov/reports/pittd/cover.htm.�
230

Greenroads™ Manual v1.5 Access & Equity
AE-4 Traffic Emissions Reduction
TRAFFIC EMISSIONS REDUCTION GOAL Reduce�operational�mobile�source�emissions�to�improve�air�quality�and�human�health.�
CREDIT REQUIREMENTS Show�that�congestion�pricing�was�used�on�this�project.�This�usually�is�part�of�a�larger�congestion�pricing�program.�Use�the�EPA�MOVES2010�software�to�compute�the�total�greenhouse�gas�emissions�and�criteria�pollutant�emissions�reduced�by�the�tolling�or�pricing�program�compared�to�the�non�priced�alternative�for�the�length�of�the�project.����
Details
Emissions�modeling�will�require�establishing�a�baseline�case.�This�should�consist�of�the�length�of�the�project�without�congestion�pricing�and�should�use�the�same�assumptions�that�are�made�in�the�congestion�pricing�case.�Congestion�pricing�schemes�reduce�the�number�of�vehicles�on�a�roadway�by�charging�money�for�use�during�peak�periods,�therefore�reducing�fuel�use�and�total�emissions.��Congestion�pricing�need�not�apply�to�all�lanes�of�a�roadway.�
DOCUMENTATION Copy�of�the�project�design�report�showing�the�project’s�planned�congestion�pricing�and�a�copy�of�the�executive�summary�for�the�MOVES2010�traffic�model�study�completed�for�the�project�for�both�the�baseline�case�and�congestion�pricing�case.�The�summary�should�include�the�same�details�of�the�model�as�noted�above.�
�
AE-4
5 POINTS
RELATED CREDITS
� PR�1�Environmental�Review�Process�
� AE�2�Intelligent�Transportation�Systems�
� AE�3�Context�Sensitive�Solutions�
� AE�5�Pedestrian�Access�
� AE�6�Bicycle�Access�� AE�7�Transit�&�HOV�
Access�
SUSTAINABILITY COMPONENTS
� Ecology�� Equity�� Economy�� Extent�� Expectations�
�
BENEFITS
� Reduces�Fossil�Fuel�Use��
� Reduces�Air�Emissions�
� Reduces�Greenhouse�Gases�
� Improves�Mobility�� Increases�Service�Life� Improves�Human�
Health�&�Safety�� Reduces�Lifecycle�
Cost�
231

Access & Equity Greenroads™ Manual v1.5
Traffic Emissions Reduction AE-4
APPROACHES & STRATEGIES
� Become�an�early�adopter�agency�of�the�MOVES2010�software.�� Consider�implementing�intelligent�transportation�systems�(ITS)�for�dynamic�pricing�and�conversion�of�existing�
high�occupancy�vehicle�(HOV)�lanes�to�high�occupancy�toll�(HOT)�lanes.�� Note�that�some�tolled�facilities�were�not�installed�to�manage�congestion.�In�order�for�toll�facilities�to�meet�the�
intent�of�this�credit,�roadway�projects�within�a�tolled�system,�especially�if�the�user�cost�is�static,�reduces�congestion�using�the�MOVES2010�software�and�providing�supporting�information�as�noted.�
Example: Congestion Pricing in Puget Sound – Traffic Choices Study
In�2002,�the�Puget�Sound�Regional�Council�(PSRC)�received�a�grant�to�become�a�pilot�project�with�the�Value�Pricing�Pilot�(VPP)�program�with�the�Federal�Highway�Administration.�The�object�of�the�study�was�to�monitor�behavioral�changes�(number�of�trips,�mode,�route,�and�time�of�vehicle�trips)�to�variable�or�congestion�based�tolling.�The�Traffic�Choices�Study�(PSRC,�2008)�used�global�positioning�system�(GPS)�tolling�meters�to�track�driving�patterns�for�275�volunteer�households,�before�and�after�experimental�tolls�were�charged�for�use�of�major�freeways�and�arterials�in�Seattle.�While�no�cost�was�incurred�by�the�volunteers,�several�important�changes�in�travel�demand�were�observed�that�have�significant�implications�on�reducing�emissions.�These�results�included:�
� All�trips�(tours�per�week)�decreased�7%�� Vehicle�miles�traveled�(miles�per�week)�decreased�12%�� Drive�time�(minutes�of�driving�per�week)�decreased�8%�� Tour�segments�(segments�of�tours�per�week)�decreased�6%�� Miles�driven�on�tolled�roads�(tolled�miles�per�week)�decreased�13%.�
More�information�about�the�Traffic�Choices�Study�is�available�at:�http://www.psrc.org/transportation/traffic.��
POTENTIAL ISSUES
1. Note�that�the�transportation�sector�designation�of�many�energy�use�or�GHG�emissions�statistics�do�not�include�processes�for�design�or�construction�of�roadways.�This�is�likely�due�to�the�small�time�scale�of�construction�activities�when�compared�to�the�much�longer�service�life�of�the�road�itself.�Depending�on�the�lifecycle�model�used�and�what�the�system�boundaries�of�that�model�are,�either�the�use�phase�(i.e.�vehicular�emissions)�or�the�production�of�materials�(i.e.�the�manufacturing�or�construction�process)�have�been�shown�to�have�the�highest�overall�impact�on�GHG�and�energy�use.�These�values�are�highly�variable�dependent�on�location,�capacity,�type�of�roadway,�multi�modal�access,�maintenance,�and�amount�of�congestion,�to�name�just�a�few.�
2. The�EPA�MOVES2010�model�is�currently�the�best�available�quantitative�approach�to�modeling�use�phase�vehicle�emissions.�(EPA,�2009f)�As�with�any�software�program,�this�model�has�built�in�assumptions�that�may�be�counter�indicative�of�appropriateness�for�a�particular�roadway�project.�The�limitations�of�EPA�MOVES2010�should�be�understood�prior�to�pursuing�this�credit.�
RESEARCH Though�Greenroads�is�intended�to�be�most�easily�implemented�during�the�design�and�construction�phases�of�the�roadway�lifecycle,�the�impact�of�the�use�and�operations�phase�and�the�planning�implications�of�the�roadway�in�this�phase�are�unavoidable.�Ignoring�these�implications�would�be�remiss,�since�clearly�implementing�such�emissions�reduction�programs�results�in�a�roadway�that�is�more�sustainable�overall.�This�credit�rewards�planning�steps�that�have�been�implemented�in�order�to�reduce�the�overall�lifecycle�emissions�impact�due�to�vehicular�traffic�from�roads�in�order�to�promote�human�and�environmental�health.�Additionally,�research�in�these�areas�also�shows�that�there�are�external�benefits,�such�as�increased�service�life�(and�therefore,�reduced�long�term�maintenance�costs)�and�human�health�improvements,�that�are�associated�with�systematic�tolling�programs.�
232

Greenroads™ Manual v1.5 Access & Equity
AE-4 Traffic Emissions Reduction
Air�Emissions�Impacts�of�the�Transportation�Sector�The�most�recent�statistical�data�available�from�the�EPA�(2009a)�and�the�Department�of�Energy�(DOE:�Davis,�Diegel�&�Boundy,�2009)�show�that�the�transportation�sector�is�one�of�the�biggest�contributors�for�many�of�the�air�emissions�considered�greenhouse�gases�and�criteria�pollutants.�This�is�primarily�due�to�the�combustion�of�fossil�fuels,�most�commonly�gasoline�and�diesel.�The�amounts�of�these�gases�that�are�released�during�combustion�depend�primarily�on�the�carbon�content�of�the�fuel.�(Davis,�Diegel�&�Boundy,�2009)�
What�are�Greenhouse�Gases?�Greenhouse�gases�(GHGs)�are�a�group�of�22�long�lived�chemical�compounds�(Solomon�et�al.,�2007)�that�are�found�in�air�emissions�from�human�activities�and�natural�processes.�Increasing�concentrations�of�these�gases�in�the�Earth’s�atmosphere�have�been�identified�to�be�major�factors�in�global�warming�and�climate�change�(sometimes�these�are�combined�to�one�term�“global�change”).�High�levels�of�these�gases�in�the�atmosphere�disturb�the�energy�balance�of�Earth’s�climate�systems�and�act�like�a�blanket�around�the�Earth,�trapping�heat�from�solar�radiation�within�the�Earth’s�atmosphere�which�might�otherwise�escape�via�normal�climate�processes.�The�potency�or�concentration�of�these�gases�is�measured�in�units�of�change�in�radiative�forcing,�which�is�a�reflection�of�their�overall�warming�(or�cooling)�influence.�Currently,�most�GHG�emissions�are�not�as�strictly�regulated�or�otherwise�monitored�by�the�EPA.�
The�four�GHGs�that�have�been�identified�are�carbon�dioxide�(CO2),�methane�(CH4),�nitrous�oxide�(N2O)�and�halocarbons�(a�group�of�gases�with�fluorine,�chlorine�or�bromine).�Each�gas�has�a�different�influence�on�global�warming�due�to�their�properties�and�lifetimes.�Typically,�the�gases�are�compared�to�a�baseline�unit�of�CO2�using�an�index�(multiplier)�called�Global�Warming�Potential�(GWP)�that�reflects�that�compounds�relative�radiative�forcing�compared�to�CO2.�GWP�is�usually�expressed�in�units�of�carbon�dioxide�equivalent�(CO2e,�sometimes�CO2�eq)�emissions,�but�does�not�necessarily�reflect�the�same�climate�responses.�(Bernstein�et�al.,�2007)��For�example,�1�unit�emission�of�methane�has�a�GWP�in�100�years�equivalent�to�25�units�of�carbon�dioxide�according�to�the�Intergovernmental�Panel�on�Climate�Change�Fourth�Assessment�Report,�so�it�is�expressed�as�25�CO2e.�(Solomon�et�al.,�2007;�Bernstein�et�al.,�2007)�
The�2009�U.S.�Greenhouse�Gas�Inventory�Report�(EPA,�2009a)�states:�
From�1990�to�2007,�transportation�emissions�rose�by�29�percent�due,�in�large�part,�to�increased�demand�for�travel�and�the�stagnation�of�fuel�efficiency�across�the�U.S.�vehicle�fleet.�The�number�of�vehicle�miles�traveled�by�light�duty�motor�vehicles�(passenger�cars�and�light�duty�trucks)�increased�40�percent�from�1990�to�2007,�as�a�result�of�a�confluence�of�factors�including�population�growth,�economic�growth,�urban�sprawl,�and�low�fuel�prices�over�much�of�this�period.�A�similar�set�of�social�and�economic�trends�has�led�to�a�significant�increase�in�air�travel�and�freight�transportation�by�both�air�and�road�modes�during�the�time�series.�
According�to�this�report,�the�transportation�sector�was�responsible�for�33%�of�CO2�emissions,�26%�methane�(CH4)�emissions,�and�67%�of�nitrous�oxide�(N2O)�emissions�from�fossil�fuel�combustion.�These�statistics�have�been�adjusted�for�end�use�sector�(so�contributions�due�to�electricity�generation�have�been�included)�and�do�not�include�air�and�freight�modes.�Generally,�the�end�use�adjustment�increases�overall�percentage�contributions�and�direct�emissions�are�less.�The�transportation�sector�is�also�accountable�for�0.9%�of�the�halocarbon�emissions,�mostly�in�the�form�of�the�refrigerant�HFC�134a.�(EPA,�2009a).�End�use�adjusted�statistics�were�not�specified�for�halocarbons�in�the�transportation�sector.�
What�are�Criteria�Pollutants?�The�criteria�pollutants�are�six�common�pollutants�in�air�that�are�known�have�detrimental�human�health�impacts�as�well�as�potential�to�damage�property.�The�pollutants�are�particulate�matter�(PM10�and�PM2.5),�ground�level�ozone�(O3),�nitrogen�oxides�(NOx),�carbon�monoxide�(CO),�sulfur�dioxide�(SO2),�and�lead�(Pb).�Of�these�pollutants,�particle�pollution�and�ground�level�ozone�are�the�greatest�threats�to�human�health�and�environmental�damage.�(EPA,�2009d)�The�six�pollutants�are�called�“criteria”�pollutants�because�concentrations�
233

Access & Equity Greenroads™ Manual v1.5
Traffic Emissions Reduction AE-4
in�the�air�are�regulated�by�the�EPA,�who�compares�tested�levels�to�allowable�levels�set�in�the�1990�Clean�Air�Act�(CAA)�amendments�(40�CFR�§�50)�National�Ambient�Air�Quality�Standard�(NAAQS).�(EPA,�2009b;�EPA,�2009c)�
It�is�important�to�note�fuel�combustion�also�accounts�for�most�of�the�indirect�greenhouse�gases�(EPA,�2009a)�which�include�CO,�NOX,�non�methane�volatile�organic�compounds�(NMVOCs),�and�SO2.�Indirect�greenhouse�gases�“do�not�have�a�direct�global�warming�effect,�but�indirectly�affect�terrestrial�radiation�absorption�by�influencing�the�formation�and�destruction�of�tropospheric�and�stratospheric�ozone,�or,�in�the�case�of�SO2,�by�affecting�the�absorptive�characteristics�of�the�atmosphere.�Additionally,�some�of�these�gases�may�react�with�other�chemical�compounds�in�the�atmosphere�to�form�compounds�that�are�greenhouse�gases.”�(EPA,�2009a)�
Table�AE�4.1�summarizes�the�percentage�contributions�of�selected�pollutants�from�the�transportation�sector.�Most�of�the�emissions�come�from�use�of�highway�vehicles�and�heavy�trucks.�Also,�notably,�transportation�accounts�for�the�majority�of�carbon�monoxide�and�nitrogen�oxide�emissions�in�the�United�States�(Davis,�Diegel�&�Boundy,�2009).�
Table�AE�4.1:�Transportation’s�Share�of�U.S.�Emissions�of�Various�Pollutants,�2007�(Adapted�from�Table�12.1�in�Davis,�Diegel�&�Boundy,�2009)�Pollutants� Chemical�Symbol Percentage of�Total�U.S.�Emissions�(%)�in�2007Carbon�monoxide� CO 68.4�Nitrogen�oxides� NOX 57.1�Volatile�organic�compounds�(VOC)� Various 33.9�Sulfur�dioxide� SO2 8.9�Ammonia� NH3 5.7�Particulate�matter� PM10 2.7�� PM2.5 7.2�Lead� Pb Not�included�Ozone� O3 Not�Included�
�Note�that�the�term�transportation�sector�means�human�use�of�vehicles�on�roadways,�and�commonly�the�air�pollutant�contributions�due�to�construction�are�omitted�from�statistical�reports.�The�DOE�data�in�Table�AE�4.1�were�also�not�specifically�adjusted�for�end�use�electricity�or�energy�for�the�transportation�sector�and�includes�contributions�from�air�and�freight�modes.�Due�to�the�increased�availability�of�unleaded�gasoline�and�related�regulations�since�the�mid�1980s,�the�prevalence�of�the�criteria�pollutant�lead�has�decreased�significantly�(EPA,�2009d)�and�it�is�not�included�in�the�statistics�shown.�Similarly,�ground�level�ozone�is�not�included�because�it�is�not�emitted�directly;�instead,�it�is�formed�due�to�a�chemical�reaction�of�nitrogen�oxides�and�VOCs�in�sunlight�(2009d).��
How�are�Air�Emissions�from�Transportation�Modeled?�The�EPA�is�required�by�the�CAA�to�continually�track�and�update�air�quality�data�from�mobile�source�emissions,�as�well�as�its�software�models�used�to�measure�vehicle�emissions.�Prior�to�the�December�2009�release�of�MOVES2010�software�from�the�Office�of�Transportation�and�Air�Quality�(OTAQ),�either�MOBILE6.2�or�previous�versions�of�the�MOVES�program�were�required�to�be�used�to�develop�emissions�models�during�creation�of�state�implementation�plans�for�air�quality�performance.�Now,�the�EPA�states�that�MOVES2010�is�the�best�available�tool�for�emissions�modeling�for�transport.�(EPA,�2009f)�Recent�data�(collected�within�the�last�10�years�using�the�best�available�technologies�and�improved�monitoring�and�controls)�was�used�to�develop�the�emissions�algorithms�in�MOVES2010.�Currently,�there�is�a�two�year�grace�period�before�the�EPA�will�require�adoption�of�the�MOVES2010�software�in�all�regulated�agencies.�(EPA,�2009f)�The�added�features�of�MOVES2010,�when�compared�to�MOBILE6.2,�allow�improved�calculation�of�greenhouse�gas�emissions�(as�well�as�criteria�pollutants)�because�it�is�based�upon�user�inputs�for�transportation�planning,�vehicle�miles�traveled�(VMT)�and�speeds�and�not�solely�upon�fuel�consumption.�(ICF�Consulting,�2006)�
234
Greenroads™ Manual v1.5 Access & Equity
AE-4 Traffic Emissions Reduction
Human�Health,�Air�Quality�&�Public�Policy�Human�health�impacts�due�to�poor�air�quality,�especially�due�to�criteria�pollutants�from�mobile�sources�like�traffic,�are�well�documented.�A�systematic�review�by�Woodcock�et�al.�(2007)�found�that�the�health�impacts�of�transport�pollution�are�evidenced�by�increased�total�deaths,�increased�respiratory�and�cardiovascular�death�and�diseases,�increased�allergies�and�also�potentially�link�to�cases�of�lung�cancer.��Additional�deaths�result�from�health�dangers�such�as�traffic�accidents,�and�are�commonly�argued�to�be�due�to�behavioral�choices�and�lifestyles.�An�excerpt�from�the�foreword�of�the�2005�World�Health�Organization�(WHO)�report,�Health�Effects�of�Transport�Related�Air�Pollution,�frames�the�situation�well:�
Transport�plays�a�fundamental�role�in�the�lives�of�societies�and�individuals:�how�people�interact,�work,�play,�organize�production,�develop�cities,�and�get�access�to�services,�amenities�and�goods�is�inextricably�linked�with�the�development�of�mobility�and�the�choices�people�make�about�it.�In�societies�that�rely�heavily�and�increasingly�on�private�motorized�transport,�vehicles�are�expected�to�become�safer,�more�luxurious�and�powerful,�and�to�be�driven�more�frequently.�These�expectations,�however,�often�do�not�take�account�of�the�ensuing�consequences:�increased�fuel�consumption,�greater�emissions�of�air�pollutants�and�greater�exposure�of�people�to�hazardous�pollution�that�causes�serious�health�problems.�The�increased�intensity�of�and�reliance�on�transport�also�increase�the�risk�of�road�traffic�injuries,�exposure�to�noise�and�sedentary�lifestyles.�These�risks�are�a�disproportional�threat�to�the�most�vulnerable�groups�in�the�population,�such�as�children�and�the�elderly,�and�they�raise�important�questions�about�social�inequalities.�(Krzy�anowski,�Kuna�Dibbert,�&�Schneider,�2005)�
While�the�health�effects�of�criteria�pollutants�are�both�well�documented�and�regulated,�the�health�effects�of�greenhouse�gas�emissions�are�less�well�understood.�In�2009,�Haines�et�al.�published�a�summary�for�policy�makers�at�the�end�of�a�comprehensive�series�of�studies�on�the�public�health�impact�of�greenhouse�gases.�All�scenarios�modeled�by�that�group�(see�Woodcock�et�al.�2009)�demonstrated�significant�increases�in�total�human�health�based�on�three�indicators�(physical�activity,�outdoor�air�pollution�and�road�traffic�injury)�when�sustainable�transport�policies�were�implemented,�as�well�as�active�transport�and�multi�modal�solutions.�Also,�all�scenarios�demonstrated�decreases�in�overall�CO2e�emissions.�(Woodcock�et�al.�2009)�However,�Chan�(2009)�notes�that�many�policy�makers�have�not�made�the�connection�between�climate�change�and�public�health.�She�also�notes�that�the�carbon�reduction�policy�can�provide�benefits�to�public�health�which�could�be�substantial,�and�includes�reductions�in�chronic�health�problems�such�as�heart�disease,�cancer,�obesity,�diabetes�and�respiratory�ailments.�Some�regions�have�recently�begun�to�change�course�and�carbon�reduction�policy�is�becoming�more�prevalent�(Chan,�2009).�
Haines�et�al.�(2009)�provide�some�key�messages�to�policy�makers,�some�of�which�are�highlighted�below:�
� Substantial�health�benefits�can�be�recognized�by�policies�and�measures�made�toward�reducing�greenhouse�gas�emissions�at�both�regional�and�global�levels.�
� Specific�transportation�policies�that�can�reduce�GHG�emissions�and�improve�public�health�are�increased�walking�and�cycling�modal�access�and�reduced�private�vehicle�use�in�urban�areas.�
� Some�measures�may�have�negative�health�effects�too,�but�these�tradeoffs�must�be�weighed�accordingly�during�decision�making�(for�example,�reducing�the�danger�of�car�accidents�by�encouraging�cycling�may�increase�danger�of�bicycle�accidents).�
� Costs�of�these�measures�vary�but�may�be�offset�by�the�savings�in�healthcare�costs,�and�in�some�cases�the�savings�may�outweigh�costs�in�the�long�term.��
� Woodcock�et�al.�(2009)�also�state�that�the�avoided�costs�of�healthcare�are�potentially�enormous,�though�difficult�to�model.�
The�Role�of�Congestion�Pricing�The�concept�of�congestion�pricing�is�not�new�(Congressional�Budget�Office:�CBO,�2009).�Pollution�due�to�congestion�is�higher�because�stop�and�go�traffic�tends�to�increase�fuel�demand�and�therefore�can�produce�more�emissions.�Increasing�roadway�physical�capacity�to�meet�traffic�demand�has�been�found�to�encourage�additional�demand�and�therefore�increase�vehicle�trips,�fossil�fuel�use,�and�air�pollutant�emissions.�While�
235

Access & Equity Greenroads™ Manual v1.5
Traffic Emissions Reduction AE-4
substantial�improvements�in�vehicle�fuel�efficiency�have�been�achieved�in�the�past�decades,�there�are�simply�more�drivers�on�the�road�at�peak�hours�in�many�locations�than�can�fit�comfortably.�Congestion�pricing�offers�a�means�of�approaching�these�challenges�through�more�effective�use�of�roadway�capacity�and�influencing�traveler�behaviors�through�economic�tools.�
Congestion�pricing�works�by�applying�a�variable�cost�to�the�users�of�the�roadway�facility�during�peak�travel�times,�thereby�lowering�travel�demand,�reducing�the�number�of�vehicles�on�a�roadway,�and�reducing�emissions�due�to�fewer�idling�vehicles�(CBO,�2009;�Daniel�&�Bekka,�2000).��Daniel�&�Bekka�(2000)�note�that�“Travelers�do�not�consider�costs�of�delay�or�pollution�they�impose�on�others,�but�only�their�own�travel�costs.�Assessing�congestion�fees�equal�to�the�additional�travel�costs�that�travelers�impose�on�others�internalizes�these�costs�and�promotes�efficient�use�of�limited�roadway�capacity.”�Because�congestion�pricing�improves�efficiency�(by�not�overloading�the�structural�capacity�of�the�pavement),�the�lifetime�of�the�roadway�is�increased,�which�corresponds�to�less�lifetime�maintenance�need�and�therefore�reduced�lifecycle�costs.�Also,�congestion�pricing�has�also�been�found�to�produce�enormous�net�social�benefits�valued�between�$19�45�billion�(2005�dollars)�(CBO,�2009),�and�once�implemented,�has�a�surprisingly�low�public�disapproval�rating�in�most�cases�(Verbruggen,�2008).�
A�Brief�Note�on�Equity�The�role�of�equity�in�the�debate�over�air�quality�in�transportation�policy�is�complex,�as�with�any�ethical�debate�regarding�politics,�economics�and�communities�of�people.�Woodcock�et�al.�(2007)�notes�that�current�levels�of�automobile�use�in�high�income�communities�are�not�sustainable�because�they�do�not�provide�equal�access�or�mobility.�A�recent�study�by�Dietz�&�Atkinson�(2005)�highlights�several�of�the�core�equity�issues,�including�disparity�between�pollution�distribution�because�of�physical�processes�(i.e.�some�areas�have�lower�air�quality�than�others),�economic�policy�(where�the�economic�or�tax�burden�of�transport�policies�is�often�unevenly�distributed,�and�sometimes�hardest�hit�are�low�income�groups),�and�accountability�for�the�generation�of�transportation�emissions.�However,�the�CBO�(2009)�reports�that�studies�of�the�equity�challenges�due�to�congestion�pricing�have�found�support�among�all�income�groups�where�it�has�been�implemented.�Notably,�Dietz�&�Atkinson�(2005)�point�out�“the�fact�that�some�enjoy�cleaner�air�than�others�is�significant.”�From�this�it�follows�that�because�cleaner�air�benefits�everyone�and�the�environment,�the�human�equity�discussion�(while�both�important�and�inevitable)�is�secondary�to�the�overall�environmental�quality�goal.�Also,�other�important�equity�issues�can�arise�between�communities�and�roadways�due�to�certain�placement�or�location�near�high�density�traffic�areas�(Appatova,�Ryan,�LeMasters�&�Grinshpun,�2008),�or�proximity�and�density�of�certain�communities�to�low�rise�structures�which�can�trap�pollutants�in�a�“street�canyon”�effect�(Salizzoni,�Soulhac�&�Mejean,�2009).�Equity�issues�regarding�access�and�mobility�needs�are�further�addressed�in�subsequent�Greenroads�credits�for�multi�modal�transport�alternatives�and�solutions.�However,�Greenroads�does�not�address�land�use,�planning�and�zoning�or�other�community�location�issues;�it�is�not�known�if�this�is�either�possible�or�appropriate�for�such�a�metric,�and�in�general�these�issues�fall�outside�the�scope�of�Greenroads.�
Project�Level�Implications�The�Clean�Air�Act�(CAA)�and�well�as�former�federal�mandates,�such�as�the�Intermodal�Surface�Transportation�Efficiency�Act�(ISTEA),�the�Transportation�Equity�Act�for�the�21st�Century�(TEA�21),�and�the�Safe,�Accountable,�Flexible,�Efficient�Transportation�Equity�Act:�A�Legacy�for�Users�(SAFETEA�LU)�give�state�agencies�the�authority�to�regulate�and�control�air�pollution�through�a�variety�of�means�(Daniel�&�Bekka,�2000)�[Note�that�as�of�this�writing,�the�SAFETEA�LU�regulation�has�expired�and�no�replacement�has�been�passed�by�Congress.�It�is�assumed�the�state�authority�will�be�preserved.]�In�general,�implementing�broad�agency�policies�that�provide�mitigation�strategies�for�curbing�air�emissions�are�likely�to�be�very�challenging�(Fisher�&�Costanza,�2005)�and�also�unfamiliar.�Congestion�pricing�schemes�may�also�be�unfamiliar�(or�worse,�unwanted)�by�public�stakeholders�(Verbruggen,�2008,�CBO,�2009).�But,�D’Avignon�et�al.�(2009)�show�that�while�global�air�emissions�impacts�do�not�translate�well�enough�to�be�measured�easily�or�meaningfully�at�local�and�regional�scales,�the�impacts�of�local�emissions�policies�can�still�be�effective�at�reducing�local�sector�contributions.�Similarly,�congestion�pricing�has�been�well�established�as�an�effective�measure�for�reducing�vehicle�emissions�and�increasing�efficiency�of�roadway�capacity.�(FHWA,�2009;�Hecker,�2003;�CBO,�2009;�Verbruggen,�2008)��
236

Greenroads™ Manual v1.5 Access & Equity
AE-4 Traffic Emissions Reduction
D’Avignon�et�al.�(2009)�state�that�this�is�true�especially�when�emissions�inventories�are�used�to�establish�initial�policy�benchmarks,�reduction�targets,�and�local�action�plans�for�mitigation.�(For�more�information�on�emissions�inventories,�see�Project�Requirement�PR�3�Life�Cycle�Inventory).�While�an�emissions�action�plan�or�policy�does�not�guarantee�success�or�effectiveness,�especially�if�targets�are�continually�unmet�or�pushed�further�into�the�future,�it�does�allow�for�increased�local�adaptability�for�long�range�climate�change�planning�and�project�specificity�for�emissions,�as�well�as�uniformity�of�local�and�regional�policy�and�practice�(Fisher�&�Costanza,�2005).��The�introduction�of�pricing�schemes�in�the�short�term�might�assist�in�future�acceptance�of�such�policies.�
Pricing�schemes�differ�in�utility�at�a�project�level�compared�to�regional�policies�because�they�can�be�applied�on�a�project�by�project�basis.�Basically,�this�allows�a�corridor�to�be�built�and�pricing�to�be�implemented�in�a�piecewise�manner,�which�is�more�manageable�and�realistic�on�a�project�scale.�However,�piecewise�management�also�comes�with�tradeoffs�because�it�still�requires�adequate�and�thoughtful�planning�as�well�as�public�involvement�prior�to�being�implemented�successfully�and�effectively.�
Additional�Resources�The�American�Association�of�State�Highway�and�Transportation�Officials�(AASHTO)�as�part�of�National�Cooperative�Highway�Research�Program�(NCHRP)�of�the�Transportation�Research�Board�(TRB)�Task�25�25�completed�a�comprehensive�study�in�2006�of�available�assessment�techniques�for�modeling�greenhouse�gas�emissions�in�transportation�projects�(ICF�Consulting,�2006).�This�report�reviews�the�best�available�techniques�and�policy�recommendations�for�transportation�planners,�and�also�highlights�various�tools�for�calculation,�strategic�planning,�and�energy/economic�forecasting.�The�document�discusses�the�advantages�and�limitations�of�the�EPA�MOVES�software�for�emissions�modeling.�More�information�is�available�in�NCHRP�25�25(17),�Assessment�of�Greenhouse�Gas�Analysis�Techniques�for�Transportation�Projects.�
The�EPA�provides�up�to�date�and�detailed�statistical�information�about�GHG,�indirect�GHG,�and�criteria�pollutant�emissions�due�to�fossil�fuel�combustion�and�the�transportation�sector.�Additionally,�the�EPA�provides�and�manages�distribution�of�the�free�MOVES2010�software�and�provides�policy�guidance�for�implementing�in�SIPs.�More�information�on�these�topics�is�available�here:�
� 2010�U.S.�Greenhouse�Gas�Inventory�Report:�http://www.epa.gov/climatechange/emissions/usinventoryreport.html�
� Green�Book:�Non�Attainment�Areas�on�Criteria�Pollutants�(includes�NAAQS�and�data�links):�http://www.epa.gov/oar/oaqps/greenbk/index.html��
� The�Motor�Vehicle�Emissions�Simulator�(MOVES2010)�and�all�relevant�guidance�and�technical�documentation:�http://www.epa.gov/otaq/models/moves/index.htm��
While�the�United�States�did�not�ratify�the�Kyoto�Protocol,�many�individual�states�have�become�involved�at�a�policy�level�in�climate�change�and�emissions�targeting�(Fisher�&�Costanza,�2005;�Mayors’�Climate�Protection�Center,�2009).�The�Mayors�Climate�Protection�Center�lists�1,016�individual�cities�whose�mayors�have�agreed�to�reduce�local�emissions�from�1990�values�by�7%�in�2012.�There�are�also�many�regional�initiatives,�such�as�the�Regional�Greenhouse�Gas�Initiative�(RGGI)�and�the�Western�Climate�Initiative�which�have�started�CO2�budget�trading�programs.�More�information�about�local�and�regional�GHG�initiatives�can�be�found�here:�
� Mayors�Climate�Protection�Center:�http://usmayors.org/climateprotection/list.asp�� Western�Climate�Initiative:�http://www.westernclimateinitiative.org/��� Regional�Greenhouse�Gas�Initiative:�http://www.rggi.org/home��
The�Congressional�Budget�Office�(CBO)�recently�(2009)�published�a�comprehensive�review�of�congestion�pricing�in�the�United�States,�Using�Congestion�Pricing�to�Reduce�Traffic�Congestion.�This�document�is�available�for�free�at�http://www.cbo.gov/ftpdocs/97xx/doc9750/03�11�CongestionPricing.pdf��
237

Access & Equity Greenroads™ Manual v1.5
Traffic Emissions Reduction AE-4
GLOSSARY
AASHTO� American�Association�of�State�Highway�and�Transportation�OfficialsBaseline�case� The�benchmark�used�to�compare�alternative�emissions�scenarios�CAA� Clean�Air�ActCBO� Congressional�Budget�OfficeCongestion�pricing� An�economic�transportation�planning�tool�increases�the�efficiency�of�the�
roadway�by�charging�for�use�during�peak�periods�Criteria�pollutant� One�of�six�common�pollutants�in�air�that�are�known�have�detrimental�human�
health�impacts�as�well�as�potential�to�damage�property�EPA� Environmental�Protection�AgencyFHWA� Federal�Highway�AdministrationGHG� Greenhouse�gasGreenhouse�gas� A�long�lived�chemical�compound�found�in�the�atmosphere�as�a�result�of�
human�and�natural�activities�ISTEA� Intermodal�Surface�Transportation�Efficiency�ActNAAQS� National�Ambient�Air�Quality�StandardNCHRP� National�Cooperative�Highway�Research�ProgramNon�attainment�area� Areas�of�the�U.S.�where�air�pollution�levels�persistently�exceed�the�national�
ambient�air�quality�standards�SAFETEA�LU� Safe,�Accountable,�Flexible,�Efficient�Transportation�Equity�Act:�A�Legacy�for�
Users�SIP� State�implementation�planState�implementation�plan A�plan�for�a�state�that�shows�how�it�is�to�comply�with�the�Clean�Air�ActTEA�21� Transportation�Equity�Act�for�the�21st CenturyTRB� Transportation�Research�BoardWHO� World�Health�Organization�
REFERENCES Appatova,�A.,�Ryan,�P.,�LeMasters,�G.,�&�Grinshpun,�S.�(2008).�Proximal�exposure�of�public�schools�and�students�to�
major�roadways:�a�nationwide�US�survey.�Journal�of�Environmental�Planning�and�Management.�51�(5),�631�646.�
Bernstein,�L.�et�al.�(2007)�Technical�Summary.�Climate�Change�2007:�Synthesis�Report.�Fourth�Assessment�Report�of�the�Intergovernmental�Panel�on�Climate�Change.�Cambridge,�UK:�Cambridge�University�Press.�
Chan,�M.�(2009).�Cutting�carbon,�improving�health.�The�Lancet.�374�(9705),�1870�1871.�
Congressional�Budget�Office�(CBO).�(2009).�Using�pricing�to�reduce�traffic�congestion.�Washington,�D.C.:�Congress�of�the�U.S.,�Congressional�Budget�Office.�Available�at�http://www.cbo.gov/ftpdocs/97xx/doc9750/03�11�CongestionPricing.pdf�
Daniel,�J.�I.�&�Khalid�Bekka.�(2000).�The�environmental�impact�of�highway�congestion�pricing.�Journal�of�Urban�Economics.�47�(2),�180�215.�
Davis,�S.C.,�Diegel,�S.W.,�&�Boundy,�R.G.�(2009).�Transportation�Energy�Data�Book:�Edition�28.�(ONRL�6984)�U.S.�Department�of�Energy,�Energy�Efficiency�and�Renewable�Energy.�Washington,�D.C.:�U.S.�Department�of�Energy.�Available�at�http://cta.ornl.gov/data.�
Dietz,�S.�&�Atkinson,�G.�(2005).�Public�perceptions�of�equity�in�environmental�policy:�Traffic�emissions�policy�in�an�english�urban�area.�Local�Environment.�10�(4),�445�459.��
238

Greenroads™ Manual v1.5 Access & Equity
AE-4 Traffic Emissions Reduction
Environmental�Protection�Agency.�(2009a,�April�15).�Inventory�of�U.S.�Greenhouse�Gas�Emissions�and�Sinks:�1990�–�2007.�(EPA�430�R�09�004)�Office�of�Atmospheric�Programs.�Washington,�DC:�Environmental�Protection�Agency.�
Environmental�Protection�Agency�(2009b,�July�14)�National�Ambient�Air�Quality�Standards�(NAAQS)�|�Air�&�Radiation�|�US�EPA.�Accessed�December�28,�2009.�Available�at�http://www.epa.gov/air/criteria.html��
Environmental�Protection�Agency�(2009c,�October�30)�Design�Values�|�Air�Trends�|�Air�&��Radiation�|�EPA.�Accessed�December�28,�2009.�Available�at�http://www.epa.gov/airtrends/values.html��
Environmental�Protection�Agency.�(2009d,�November�17)�Criteria�Pollutants�|�Green�Book�|�US�EPA.�Accessed�December�30,�2009.�Available�at�http://www.epa.gov/oaqps001/greenbk/multipol.html��
Environmental�Protection�Agency.�(2009e,�November�17)�Green�Book�Non�Attainment�Areas�|�Green�Book�|�US�EPA.�Accessed�December�30,�2009.�Available�at�http://www.epa.gov/oar/oaqps/greenbk/index.html��
Environmental�Protection�Agency.�(2009f,�December)�EPA�Releases�MOVES2010�Mobile�Source�Emissions�Model:�Questions�and�Answers.�(EPA�420�F�09�073)�Office�of�Transportation�and�Air�Quality.�Washington,�D.C.�Environmental�Protection�Agency.�Available�at:�http://www.epa.gov/otaq/models/moves/420f09073.pdf��
Environmental�Protection�Agency�(2009g,�December�23)�MOVES�(Motor�Vehicle�Emissions�Simulator)�|�Modeling�&�Inventories�|�US�EPA.�Accessed�December�28,�2009.�Available�at�http://www.epa.gov/oms/models/moves/index.htm�
Federal�Highway�Administration�(FHWA).�(2009,�October�8).�Value�Pricing�Pilot�Program���Tolling�and�Pricing�Program���FHWA�Operations.�Accessed�December�28,�2009.�Available�at�http://ops.fhwa.dot.gov/tolling_pricing/value_pricing/��
Fisher�B,�&�Costanza�R.�(2005).�Environmental�policy:�regional�commitment�to�reducing�emissions.�Nature.�438�(7066),�301�2.�
Haines,�A.�et�al.�(2009).�Public�health�benefits�of�strategies�to�reduce�greenhouse�gas�emissions:�overview�and�implications�for�policy�makers.�Lancet.�374�(9707),�2104�2114.�
ICF�Consulting.�(2006).�Assessment�of�Greenhouse�Gas�Analysis�Techniques�for�Transportation�Projects.�Prepared�for�American�Association�of�State�Highway�and�Transportation�Officials�Standing�Committee�on�Environment�for�the�National�Cooperative�Highway�Research�Program�Task�25�25(17).�Fairfax,�VA:�ICF�Consulting.�
Krzy�anowski,�M.,�Kuna�Dibbert,�B.,�&�Schneider,�J.�(2005).�Health�effects�of�transport�related�air�pollution.�Copenhagen:�World�Health�Organization�Europe.�Hecker,�J.�Z.�(2003).�Reducing�congestion�Congestion�pricing�has�promise�for�improving�use�of�transportation�infrastructure.�(Testimony,�GAO�03�735�T).�Washington,�D.C.:�U.S.�General�Accounting�Office.��
Mayors�Climate�Protection�Center.�(2007)�List�of�Participating�Mayors�–�Mayors�Climate�Protection�Center.�Accessed�December�28,�2009.�Available�at:�http://usmayors.org/climateprotection/list.asp�
Puget�Sound�Regional�Council.�(2008).�Traffic�Choices�Study���Summary�Report:�a�global�positioning�system�based�pricing�pilot�project:�evaluating�traveler�response�to�variable�road�tolling�through�a�sample�of�volunteer�participants.�Seattle,�WA:�The�Council.�Available�at�http://www.psrc.org/transportation/traffic��
Regional�Greenhouse�Gas�Initiative.�(n.d.)�Regional�Greenhouse�Gas�Initiative�(RGGI)�CO2�Budget�Trading�Program���Welcome.�Accessed�December�28,�2009.�Available�at:�http://www.rggi.org/home�
239

Access & Equity Greenroads™ Manual v1.5
Traffic Emissions Reduction AE-4
Salizzoni,�P.,�Soulhac,�L.,�&�Mejean,�P.�(2009).�Street�canyon�ventilation�and�atmospheric�turbulence.�Atmospheric�Environment.�43�(32),�5056.��
Solomon,�S.�et�al.�(2007)�Synthesis�Report.�Climate�Change�2007:�Synthesis�Report.�Fourth�Assessment�Report�of�the�Intergovernmental�Panel�on�Climate�Change.�Cambridge,�UK:�Cambridge�University�Press.�
VerBruggen,�R.�(2008).�Toll�Talk���Congestion�pricing�is�the�cure�for�our�overcrowded�highways.�National�Review.�60�(21),�28.�
Washington�State�Department�of�Ecology.�(2009).�2020�Collaboration�|�Climate�Change�|�Washington�State�Department�of�Ecology.�Accessed�December�30,�2009.�Available�at:�http://www.ecy.wa.gov/climatechange/2020collaboration.htm�
Washington�State�Department�of�Ecology.�(2009).�2009�Executive�Order�|�Climate�Change�|�Washington�State�Department�of�Ecology.�Accessed�December�30,�2009.�Available�at:�http://www.ecy.wa.gov/climatechange/2009EO.htm��
Western�Climate�Initiative.�(2009).�Western�Climate�Initiative.�Accessed�December�28,�2009.�Available�at:�http://www.westernclimateinitiative.org/��
Woodcock,�J.�et�al.�(2007).�Energy�and�transport.�Lancet.�370�(9592),�1078�88.�
Woodcock,�J.�et�al.�(2009).�Public�health�benefits�of�strategies�to�reduce�greenhouse�gas�emissions:�urban�land�transport.�Lancet.�374�(9705),�1930�43.�
�
240

Greenroads™ Manual v1.5 Access & Equity
AE-5 Pedestrian Access
PEDESTRIAN ACCESS GOAL Promote�walkable�communities�by�providing�sidewalk�facilities�within�the�roadway�right�of�way.�
CREDIT REQUIREMENTS Achieve�Credit�AE�3�Context�Sensitive�Solutions�(CSS)�and�describe�the�need,�purpose�and�appropriateness�for�planned,�new,�or�upgraded�pedestrian�facilities�in�the�submitted�documentation�for�Credit�AE�3.�The�CSS�document�should�clearly�note�whether�pedestrian�facilities�or�improvements�are�required�or�have�otherwise�been�requested�by�the�public.�Table�AE�5.1�shows�the�points�available�for�this�credit.�
Table�AE�5.1:�Available�Points�for�Credit�AE�5�Points� Requirements�
1� Implement�new�(or�improve�existing)�operations�or�technologies�for�pedestrian�facilities.�This�includes�added�signage�or�minor�access�improvements�for�pedestrians,�such�as�signalized�intersections�or�crosswalks,�shelters,�and�wheelchair�ramps.�
2� Implement�physical�or�constructed�changes�to�the�roadway�structure,�dimensions�or�form�that�provide�pedestrian�access�within�the�ROW,�such�as�a�sidewalk,�raised�crosswalk,�bulb�out�or�pedestrian�bridge�structure.�
Details
Pedestrian�is�defined�as�a�person�whose�main�mode�of�transportation�is�walking,�including�disabled�individuals�that�need�assistance�devices�for�personal�travel�and�mobility.�
Sidewalk�is�defined�as�a�paved�surface�provided�specifically�for�pedestrian�travel�that�is�separate�from�the�roadway�and�located�within�the�roadway�Right�of�Way.�
Shared�use�pathway�is�defined�as�a�multi�use�pathway�for�all�non�motorized�users�including�pedestrians�and�bicyclists.�This�may�be�located�within�a�roadway�Right�of�Way�yet�must�be�separated�from�the�roadway�and�have�wider�widths�than�sidewalks.�
Current�facilities�do�not�qualify�for�this�credit�without�additional�effort,�such�as�upgrades,�improvements�or�construction�of�new�facilities.�The�attempt�to�provide�pedestrian�access�must�be�deliberate�and�as�a�direct�result�of�the�project.�
DOCUMENTATION � Copy�of�the�section�that�focuses�on�pedestrian�facilities�in�the�Credit�AE�3:�Context�
Sensitive�Solutions�documentation.�This�section�should�address:�a. Purpose�and�need�for�pedestrian�access�on�the�roadway�project,�including�how�
it�fits�with�existing�land�uses�and/or�existing�General�and�Transportation�Plans��b. Regulatory�or�jurisdictional�standards�addressed,�if�any�c. Results�of�public�input�on�proposed�pedestrian�facilities,�if�any�d. Total�cost�associated�with�new�or�improved�pedestrian�facilities�e. Copy�of�the�contract�specifications�and�plans�for�proposed�pedestrian�facilities.��
AE-5
1-2 POINTS
RELATED CREDITS
� AE�3�Context�Sensitive�Solutions�
� AE�4�Traffic�Emissions�Reduction�
� AE�6�Bicycle�Access�� AE�7�Transit�&�HOV�
Access�
SUSTAINABILITY COMPONENTS
� Equity�� Economy�
�
BENEFITS
� Reduces�Fossil�Fuel�Use�
� Reduces�Air�Emissions�
� Reduces�Greenhouse�Gases�
� Improves�Access�� Improves�Mobility�� Improves�Health�&�
Safety�� Improves�Local�
Economies�
241
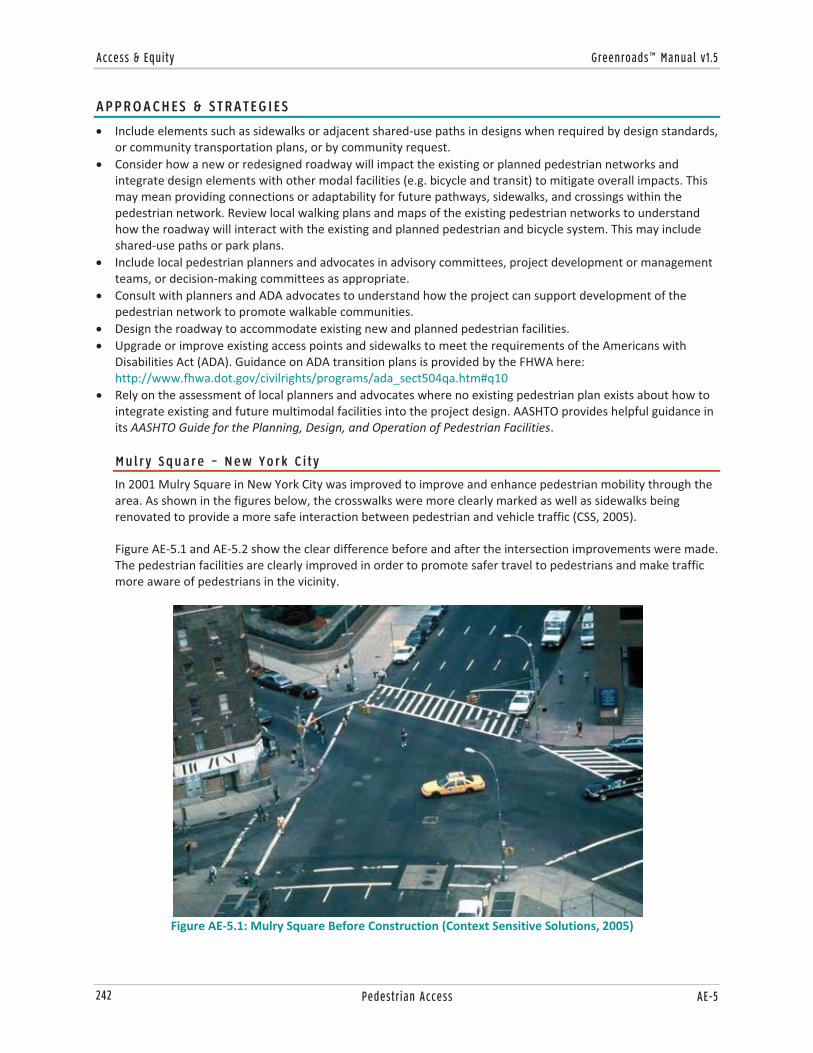
Access & Equity Greenroads™ Manual v1.5
Pedestrian Access AE-5
APPROACHES & STRATEGIES
� Include�elements�such�as�sidewalks�or�adjacent�shared�use�paths�in�designs�when�required�by�design�standards,�or�community�transportation�plans,�or�by�community�request.�
� Consider�how�a�new�or�redesigned�roadway�will�impact�the�existing�or�planned�pedestrian�networks�and�integrate�design�elements�with�other�modal�facilities�(e.g.�bicycle�and�transit)�to�mitigate�overall�impacts.�This�may�mean�providing�connections�or�adaptability�for�future�pathways,�sidewalks,�and�crossings�within�the�pedestrian�network.�Review�local�walking�plans�and�maps�of�the�existing�pedestrian�networks�to�understand�how�the�roadway�will�interact�with�the�existing�and�planned�pedestrian�and�bicycle�system.�This�may�include�shared�use�paths�or�park�plans.�
� Include�local�pedestrian�planners�and�advocates�in�advisory�committees,�project�development�or�management�teams,�or�decision�making�committees�as�appropriate.�
� Consult�with�planners�and�ADA�advocates�to�understand�how�the�project�can�support�development�of�the�pedestrian�network�to�promote�walkable�communities.�
� Design�the�roadway�to�accommodate�existing�new�and�planned�pedestrian�facilities.�� Upgrade�or�improve�existing�access�points�and�sidewalks�to�meet�the�requirements�of�the�Americans�with�
Disabilities�Act�(ADA).�Guidance�on�ADA�transition�plans�is�provided�by�the�FHWA�here:�http://www.fhwa.dot.gov/civilrights/programs/ada_sect504qa.htm#q10�
� Rely�on�the�assessment�of�local�planners�and�advocates�where�no�existing�pedestrian�plan�exists�about�how�to�integrate�existing�and�future�multimodal�facilities�into�the�project�design.�AASHTO�provides�helpful�guidance�in�its�AASHTO�Guide�for�the�Planning,�Design,�and�Operation�of�Pedestrian�Facilities.�
Mulry Square – New York City
In�2001�Mulry�Square�in�New�York�City�was�improved�to�improve�and�enhance�pedestrian�mobility�through�the�area.�As�shown�in�the�figures�below,�the�crosswalks�were�more�clearly�marked�as�well�as�sidewalks�being�renovated�to�provide�a�more�safe�interaction�between�pedestrian�and�vehicle�traffic�(CSS,�2005).�
Figure�AE�5.1�and�AE�5.2�show�the�clear�difference�before�and�after�the�intersection�improvements�were�made.�The�pedestrian�facilities�are�clearly�improved�in�order�to�promote�safer�travel�to�pedestrians�and�make�traffic�more�aware�of�pedestrians�in�the�vicinity.�
�Figure�AE�5.1:�Mulry�Square�Before�Construction�(Context�Sensitive�Solutions,�2005)�
242
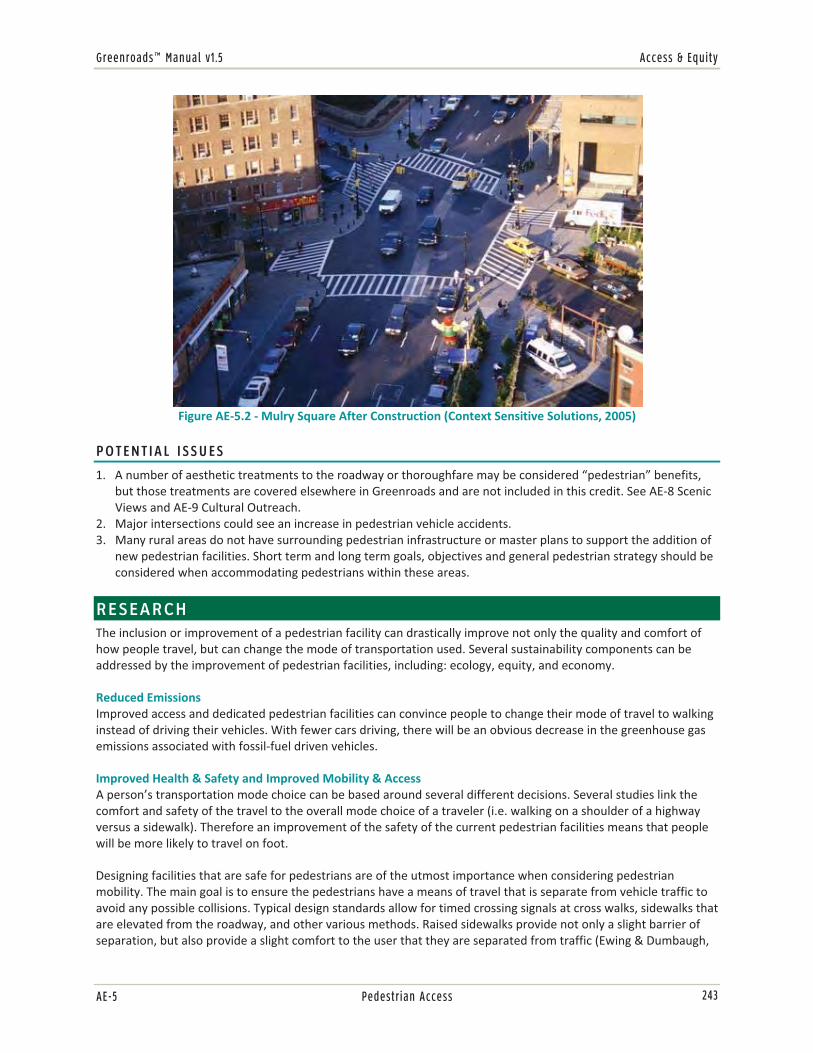
Greenroads™ Manual v1.5 Access & Equity
AE-5 Pedestrian Access
�Figure�AE�5.2���Mulry�Square�After�Construction�(Context�Sensitive�Solutions,�2005)�
�
POTENTIAL ISSUES
1. A�number�of�aesthetic�treatments�to�the�roadway�or�thoroughfare�may�be�considered�“pedestrian”�benefits,�but�those�treatments�are�covered�elsewhere�in�Greenroads�and�are�not�included�in�this�credit.�See�AE�8�Scenic�Views�and�AE�9�Cultural�Outreach.�
2. Major�intersections�could�see�an�increase�in�pedestrian�vehicle�accidents.�3. Many�rural�areas�do�not�have�surrounding�pedestrian�infrastructure�or�master�plans�to�support�the�addition�of�
new�pedestrian�facilities.�Short�term�and�long�term�goals,�objectives�and�general�pedestrian�strategy�should�be�considered�when�accommodating�pedestrians�within�these�areas.�
RESEARCH The�inclusion�or�improvement�of�a�pedestrian�facility�can�drastically�improve�not�only�the�quality�and�comfort�of�how�people�travel,�but�can�change�the�mode�of�transportation�used.�Several�sustainability�components�can�be�addressed�by�the�improvement�of�pedestrian�facilities,�including:�ecology,�equity,�and�economy.�
Reduced�Emissions�Improved�access�and�dedicated�pedestrian�facilities�can�convince�people�to�change�their�mode�of�travel�to�walking�instead�of�driving�their�vehicles.�With�fewer�cars�driving,�there�will�be�an�obvious�decrease�in�the�greenhouse�gas�emissions�associated�with�fossil�fuel�driven�vehicles.�
Improved�Health�&�Safety�and�Improved�Mobility�&�Access�A�person’s�transportation�mode�choice�can�be�based�around�several�different�decisions.�Several�studies�link�the�comfort�and�safety�of�the�travel�to�the�overall�mode�choice�of�a�traveler�(i.e.�walking�on�a�shoulder�of�a�highway�versus�a�sidewalk).�Therefore�an�improvement�of�the�safety�of�the�current�pedestrian�facilities�means�that�people�will�be�more�likely�to�travel�on�foot.�
Designing�facilities�that�are�safe�for�pedestrians�are�of�the�utmost�importance�when�considering�pedestrian�mobility.�The�main�goal�is�to�ensure�the�pedestrians�have�a�means�of�travel�that�is�separate�from�vehicle�traffic�to�avoid�any�possible�collisions.�Typical�design�standards�allow�for�timed�crossing�signals�at�cross�walks,�sidewalks�that�are�elevated�from�the�roadway,�and�other�various�methods.�Raised�sidewalks�provide�not�only�a�slight�barrier�of�separation,�but�also�provide�a�slight�comfort�to�the�user�that�they�are�separated�from�traffic�(Ewing�&�Dumbaugh,�
243

Access & Equity Greenroads™ Manual v1.5
Pedestrian Access AE-5
2009).�Other�means�of�safe�design�include,�increasing�the�distance�between�the�stop�line�and�cross�walk�at�an�intersection�and�putting�up�some�sort�of�notification�to�drivers�(signs,�lights,�etc.)�that�pedestrians�are�likely�to�be�present�in�the�area�(Ewing�&�Dumbaugh,�2009).�
Benefits�of�Active�Transport�Increased�pedestrian�travel�can�also�provide�health�benefits.�A�recent�study�compared�the�current�state�of�travel�and�modeled�a�more�sustainable�type�of�travel�using�more�walking�and�bicycles�and�reducing�the�amount�of�cars�on�the�road.�The�study�found�the�tendency�for�several�chronic�diseases�could�be�reduced�by�having�a�higher�population�of�travelers�whom�use�walking�or�bicycles�as�their�main�mode�of�transportation�(Woodcock�et.�al.,�2009).�
Considerations�for�Disabled�Users�The�goal�of�providing�pedestrian�facilities�is�to�provide�a�means�for�everyone�to�travel,�including�people�with�special�needs.�Some�improvements�to�sidewalks�are�mandated�by�the�Americans�with�Disabilities�Act�(ADA)�of�1990�and�specific�guidelines�are�available�at:�http://www.access�board.gov/adaag/html/adaag.htm.�For�transportation�facilities�this�could�include:�sidewalks�sloped�for�easy�access�or�noise�making�devices�installed�at�intersection�crosswalks.�
Boost�Local�Economies�&�Improve�Mobility�The�advent�of�new�facilities�on�its�own�can�also�encourage�travel�throughout�the�area.�This�is�simply�based�on�increasing�the�overall�pedestrian�network�throughout�the�area.�With�gaps�in�a�pedestrian�network,�it�can�increase�the�distance�a�pedestrian�is�forced�to�travel,�and�can�discourage�them�from�using�walking�as�a�primary�mode�of�transportation�(Randall�&�Baetz,�2001).�
GLOSSARY
REFERENCES American�Association�of�State�Highway�Transportation�Officials.�(2004).�AASHTO Guide for the Planning,
Design, and Operation of Pedestrian Facilities.�1st�ed.�Washington,�DC:�AASHTO.�
Context�Sensitive�Solutions.�(2005).�New�York�City,�Mulry�Square.�Accessed�at:�http://www.contextsensitivesolutions.org/content/case_studies/mulry�square��
Ewing,�R.,�&�Dumbaugh,�E.�(2009).�The�Built�Environment�and�Traffic�Safety:�A�Review�of�Empirical�Evidence.�Journal�of�Planning�Literature,�23(4),�347�367.�doi:�10.1177/0885412209335553.��
Randall,�T.�A.,�&�Baetz,�B.�W.�(2001).�Evaluating�Pedestrian�Connectivity�for�Suburban�Sustainability.�Journal�of�Urban�Planning�and�Development,�127(1),�1�15.�doi:�10.1061/(ASCE)0733�9488(2001)127:1(1).��
Woodcock,�J.,�Edwards,�P.,�Tonne,�C.,�Armstrong,�B.�G.,�Ashiru,�O.,�Banister,�D.,�et�al.�(2009).�Public�health�benefits�of�strategies�to�reduce�greenhouse�gas�emissions:�urban�land�transport.�Lancet.�374(9705),�1930�1943.��
Zhou,�H.,�Zhao,�J.,�Hsu,�P.,�&�Rouse,�J.�(2008).�Identify�Factors�Affecting�Number�of�Students�Walking�or�Biking�to�School.�In�ASCE�Conf.�Proc.�(Vol.�330,�p.�253).�Chengdu,�China:�ASCE.�doi:�10.1061/40996(330)253.�
ADA� Americans�with�Disabilities�Act�Pedestrian� A�person�whom�is�traveling�without�the�use�of�a�mechanical�device�and�main�
mode�of�transportation�is�walking.�Sidewalk� A�surface�provided�specifically�for�pedestrian�travel�that�is�separate�from�the�
roadway�
244

Greenroads™ Manual v1.5 Access & Equity
AE-6 Bicycle Access
BICYCLE ACCESS GOAL Promote�bicycling�in�communities�by�providing�dedicated�cycling�facilities�within�the�project�right�of�way.�
CREDIT REQUIREMENTS Achieve�Credit�AE�3�Context�Sensitive�Solutions�(CSS)�and�describe�the�need,�purpose�and�appropriateness�for�planned,�new,�or�upgraded�bicycle�facilities�in�the�submitted�document�for�Credit�AE�3.�The�CSS�document�should�clearly�note�whether�bicycle�facilities�or�improvements�are�required�or�have�otherwise�been�requested�by�the�public.�In�order�to�achieve�this�credit,�a�bicycle�only�facility�must�be�present�within�the�ROW�at�the�start�of�construction�or�result�from�construction�of�this�project.�Table�AE�6.1�shows�the�points�available�for�this�credit.�
Table�AE�6.1:�Available�Points�for�Credit�AE�6�Points� Requirements�
1� Implement�new�(or�improve�existing)�operations�or�technologies�for�bicycle�facilities.�This�includes�(but�is�not�limited�to)�added�signage�or�minor�access�improvements�for�bicycles,�such�as�installing�bicycle�detectors�in�driving�lanes�or�granting�signal�priority,�adding�bicycle�friendly�stormwater�drains,�code�required�dimension�upgrades,�resurfacing�existing�bicycle�lanes,�or�adding�new�streetside�bicycle�storage�facilities�(lockers,�racks,�etc.).�
2� Implement�physical�or�constructed�changes�to�the�roadway�structure,�dimensions,�or�form�that�provide�bicycle�only�facilities�with�dedicated�access�within�the�ROW,�such�as�a�bicycle�lane,�or�other�bikeway.�Lanes�shared�with�motorized�vehicles�do�not�meet�this�requirement.�
�Details
For�purposes�of�this�credit,�the�term�bicycle�refers�to�a�pedal�driven,�human�powered�vehicle�with�at�least�one�seat�for�an�operator.��Shared�use�pathway�is�defined�as�a�multi�use�pathway�for�all�non�motorized�users�including�pedestrians�and�bicyclists.�This�may�be�located�within�a�roadway�Right�of�Way�yet�must�be�separated�from�the�roadway�and�have�wider�widths�than�sidewalks.�
Current�facilities�do�not�alone�qualify�for�this�credit�without�additional�effort,�such�as�upgrades,�improvements�or�construction�of�new�facilities.�The�attempt�to�provide�pedestrian�access�must�be�deliberate�and�as�a�direct�result�of�the�project.�
DOCUMENTATION � Copy�of�the�section�that�focuses�on�bicycle�facilities�in�the�Credit�AE�3:�Context�
Sensitive�Solutions�documentation.�This�section�should�address:�
a. Purpose�and�need�for�bicycle�access�on�the�roadway�project�determined�through�a�project�analysis�or�a�Bicycle�Master�planning�process.�
b. Regulatory�or�jurisdictional�standards�addressed,�if�any�c. Results�of�public�input�on�proposed�bicycle�facilities,�if�any�d. Total�cost�associated�with�new�or�improved�bicycle�facilities�e. Contract�specifications�and�plans�for�proposed�bicycle�facilities��
AE-6
1-2 POINTS
RELATED CREDITS
� AE�3�Context�Sensitive�Solutions�
� AE�4�Traffic�Emissions�Reduction�
� AE�5�Pedestrian�Access�
� AE�7�Transit�&�HOV�Access�
SUSTAINABILITY COMPONENTS
� Equity�� Economy�
BENEFITS
� Reduces�Fossil�Fuel�Use�
� Reduces�Air�Emissions�
� Reduces�Greenhouse�Gases�
� Improves�Access��� Improves�Mobility�� Improves�Human�
Health�&�Safety�� Improves�Local�
Economies�
245

Access & Equity Greenroads™ Manual v1.5
Bicycle Access AE-6
APPROACHES & STRATEGIES
� Include�elements�such�as�bicycle�lanes,�separated�bicycle�paths�or�adjacent�shared�use�paths�in�designs�when�required�by�design�standards,�or�community�transportation�plans,�or�by�community�request.�
� Review�local�bicycle�plans�and�maps�of�the�existing�bicycle�networks�to�understand�how�the�roadway�will�interact�with�the�existing�and�planned,�roadway�transportation,�and�bicycle�and�pedestrian�systems..�This�may�include�shared�use�pathways�or�park�plans.�
� Include�local�bicycle�planners�and�advocates�in�advisory�committees,�project�development�or�management�teams,�or�decision�making�committees�as�appropriate.�Consult�with�planners�to�understand�how�the�project�can�support�the�development�of�the�bicycle�network�and�to�promote�cycling�in�communities.�
� Design�roadway�improvements�and�new�roadways�to�accommodate�existing,�new�and�planned�bicycle�facilities.�� Rely�on�the�assessment�of�local�planners�and�advocates�where�no�existing�bicycle�plan�exists�about�how�to�
integrate�existing�and�future�multimodal�facilities�into�the�project�design.�� Consider�how�a�new�or�redesigned�roadway�will�impact�the�existing�or�planned�bicycle�networks�and�integrate�
design�elements�with�other�modal�facilities�(e.g.�bicycle�and�transit)�to�mitigate�overall�impacts.�This�may�mean�providing�connections�or�adaptability�for�future�bicycle�lanes,�shared�use�pathways,�crossings�or�other�facilities�within�the�bicycle�network.�
Example: Dedicated Access on a Roadway
�Below,�Figure�AE�6.1�shows�how�a�dedicated�access�for�bicycles�should�be�marked�according�to�the�Manual�for�Uniform�Traffic�Control�Devices�(FHWA,�2009).��
�1�point� 1�point�
�1�point�
Figure�AE�6.1:�Examples�of�appropriate�signage�for�dedicated�bicycle�access.�(FHWA,�2009)��
Figure�AE�6.2�is�an�example�of�lane�markings�that�promote�dedicated�bicycle�access�(FHWA,�2009).�As�shown�in�the�figure,�bicyclists�are�provided�their�own�separate�lane�on�a�roadway�for�travel.�
Figure�AE�6.3�shows�how�access�should�be�marked�for�bicycles�that�are�utilizing�the�same�space�as�motor�vehicles;�however�while�the�sign�above�earns�one�point�(if�none�previously�existed)�because�this�helps�increases�awareness�of�bicycle�users�on�a�route�with�motor�vehicles�(and�theoretically�increases�safety),�the�lane�itself�by�definition�does�not�provided�dedicated�access�for�bicyclists.�
246

Greenroads™ Manual v1.5 Access & Equity
AE-6 Bicycle Access
��Figure�AE�6.2:�Examples�of�dedicated�lanes�for�bicycle�access.�2�points�if�new�or�improved�to�meet�or�
exceed�these�minimum�dimensions.�(FHWA,�2009)�
��Figure�AE�6.3:��Access�for�bicycles�in�a�motorized�vehicle�lane.�No�points.�(FHWA,�2009)�
247
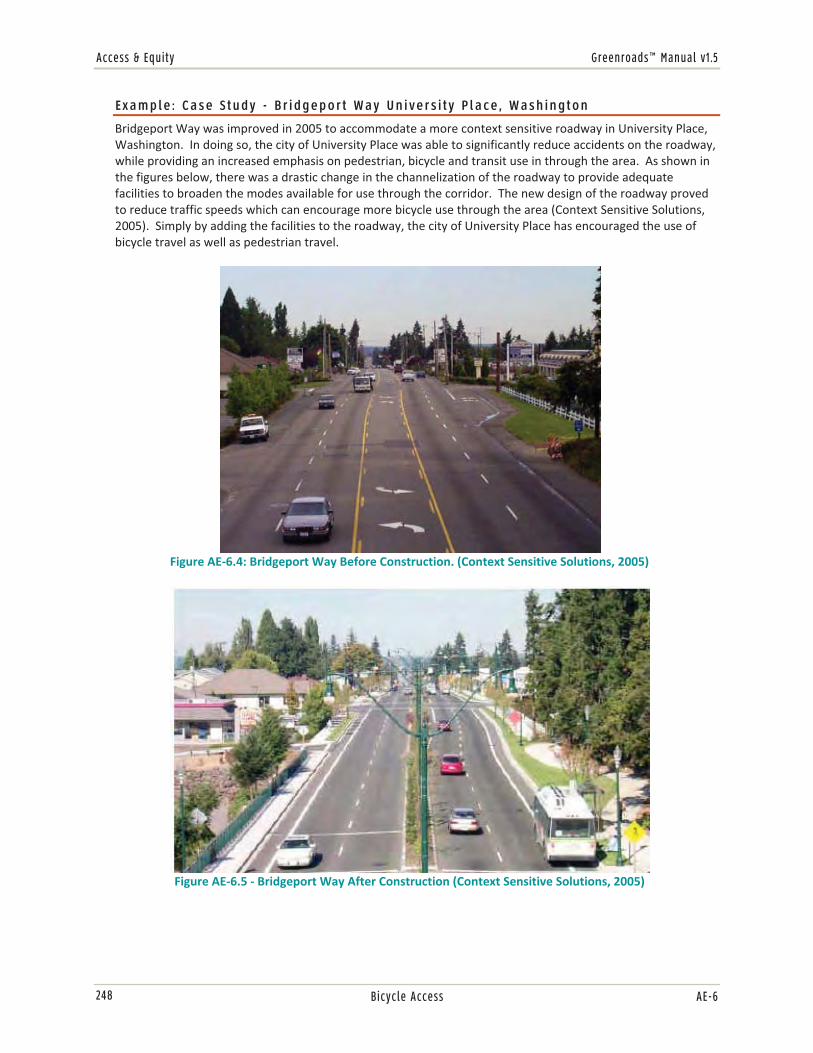
Access & Equity Greenroads™ Manual v1.5
Bicycle Access AE-6
Example: Case Study - Bridgeport Way University Place, Washington
Bridgeport�Way�was�improved�in�2005�to�accommodate�a�more�context�sensitive�roadway�in�University�Place,�Washington.��In�doing�so,�the�city�of�University�Place�was�able�to�significantly�reduce�accidents�on�the�roadway,�while�providing�an�increased�emphasis�on�pedestrian,�bicycle�and�transit�use�in�through�the�area.��As�shown�in�the�figures�below,�there�was�a�drastic�change�in�the�channelization�of�the�roadway�to�provide�adequate�facilities�to�broaden�the�modes�available�for�use�through�the�corridor.��The�new�design�of�the�roadway�proved�to�reduce�traffic�speeds�which�can�encourage�more�bicycle�use�through�the�area�(Context�Sensitive�Solutions,�2005).��Simply�by�adding�the�facilities�to�the�roadway,�the�city�of�University�Place�has�encouraged�the�use�of�bicycle�travel�as�well�as�pedestrian�travel.�
�Figure�AE�6.4:�Bridgeport�Way�Before�Construction.�(Context�Sensitive�Solutions,�2005)�
�
�Figure�AE�6.5���Bridgeport�Way�After�Construction�(Context�Sensitive�Solutions,�2005)�
�
248
Greenroads™ Manual v1.5 Access & Equity
AE-6 Bicycle Access
POTENTIAL ISSUES
Encouraging�cycling�in�areas�where�there�was�previously�no�cycling�may�result�in�increased�bicycle�crashes�and�collisions.�Careful�planning�for�bicycles�and�meeting�engineering�and�safety�standards�can�help�to�mitigate�these�instances.�
RESEARCH Increasing�the�bicycle�facilities�along�a�given�corridor�can�have�a�beneficial�result�on�the�overall�sustainability�of�a�given�roadway.��The�benefits�of�including�bicycle�facilities�can�include�making�a�more�equitable�roadway,�decreasing�the�amount�of�current�traffic�on�the�roadway,�and�also�provide�health�benefits�to�users�of�the�facilities.�Bicycles�and�pedestrians�are�often�grouped�together�because�they�are�easily�distinguished�from�motorized�modes�that�use�a�right�of�way.�Also,�both�walking�and�bicycling�are�considered�“active�transport”�(Woodcock�et�al.,�2009)�modes.�Therefore,�much�of�supporting�research�for�this�credit�and�Credit�AE�5�Pedestrian�Access�overlap,�and�will�not�be�repeated�here�for�brevity.�Improved�mobility�and�access,�environmental�and�economic�benefits,�and�health�improvements�of�these�active�modes�are�addressed�in�Credit�AE�5.��
Bicycle�Safety�The�safety�considerations�for�bicyclists�are�typically�involved�in�driving�on�the�same�surface�as�motor�vehicles.��Several�safety�measures�are�available�to�increases�the�safety�of�both�motor�vehicles�and�bicyclists.��The�American�Association�of�State�Highway�and�Transportation�Officials�recommends�that�bike�lanes�have�dimensions�of�at�least�four�feet�in�width�and�are�located�between�the�lane�of�travel�and�sidewalk�or�parking�lane.�This�reduces�the�chance�of�accidents�between�bicycles�and�vehicles�(AASHTO,�1999).�
However,�Ewing�and�Dumbaugh�(2009)�show�that�the�best�method�to�increase�safety�for�bicycles�and�pedestrians�is�by�increasing�awareness�through�notification�or�signage�along�a�right�of�way.�They�also�show�that�increases�in�overall�numbers�of�bicyclists�(and�pedestrians)�offer�“safety�in�numbers”�because�of�heightened�awareness.�Furthermore,�dedicated�access�for�bicycles�provides�comfortable�travel�without�lane�sharing�as�well�as�improved�safety.�Reynolds�et�al.�(2009)�has�shown�dedicated�access�can�reduce�bicycle�vehicle�accidents�by�up�to�50�percent�compared�to�shared�use�lanes.�
GLOSSARY
REFERENCES American�Association�of�State�Highway�and�Transportation�Officials�(AASHTO).�(1999).�Guide�for�the�development�
of�bicycle�facilities.�Washington,�D.C.:�American�Association�of�State�Highway�and�Transportation�Officials.��
Context�Sensitive�Solutions.�(2005).�Bridgeport�Way�–�University�Place,�Washington.�Available�at�http://www.contextsensitivesolutions.org/content/case_studies/kentucky_bridgeport/��
Federal�Highway�Administration�(FHWA).�(2009).�Manual�for�Uniform�Traffic�Control�Devices�(MUTCD).�Washington,�DC:�FHWA.�Available�at�http://mutcd.fhwa.dot.gov/htm/2009/html_index.htm��
Ewing,�R.,�&�Dumbaugh,�E.�(2009).�The�Built�Environment�and�Traffic�Safety:�A�Review�of�Empirical�Evidence.�Journal�of�Planning�Literature,�23(4),�347�367.�doi:�10.1177/0885412209335553.��
AASHTO� American�Association�of�State�Highway�and�Transportation�OfficialsActive�transport� Walking�or�biking�(human�powered�transport)Bicycle� A�pedal�driven,�human�powered�vehicle�with�at�least�one�seat�for�an�
operator�FHWA� Federal�Highway�Administration
249

Access & Equity Greenroads™ Manual v1.5
Bicycle Access AE-6
Reynolds,�C.C.,�Harris,�M.A.,�Teschke,�K.,�Cripton,�P.A.,�&�Winters,�M.�(2009).�The�impact�of�transportation�infrastructure�on�bicycling�injuries�and�crashes:�a�review�of�the�literature.�Environmental�Health:�a�Global�Access�Science�Source.�8.�
Woodcock,�J.,�Edwards,�P.,�Tonne,�C.,�Armstrong,�B.�G.,�Ashiru,�O.,�Banister,�D.,�et�al.�(2009).�Public�health�benefits�of�strategies�to�reduce�greenhouse�gas�emissions:�urban�land�transport.�Lancet.�374(9705),�1930�1943.�
�
250
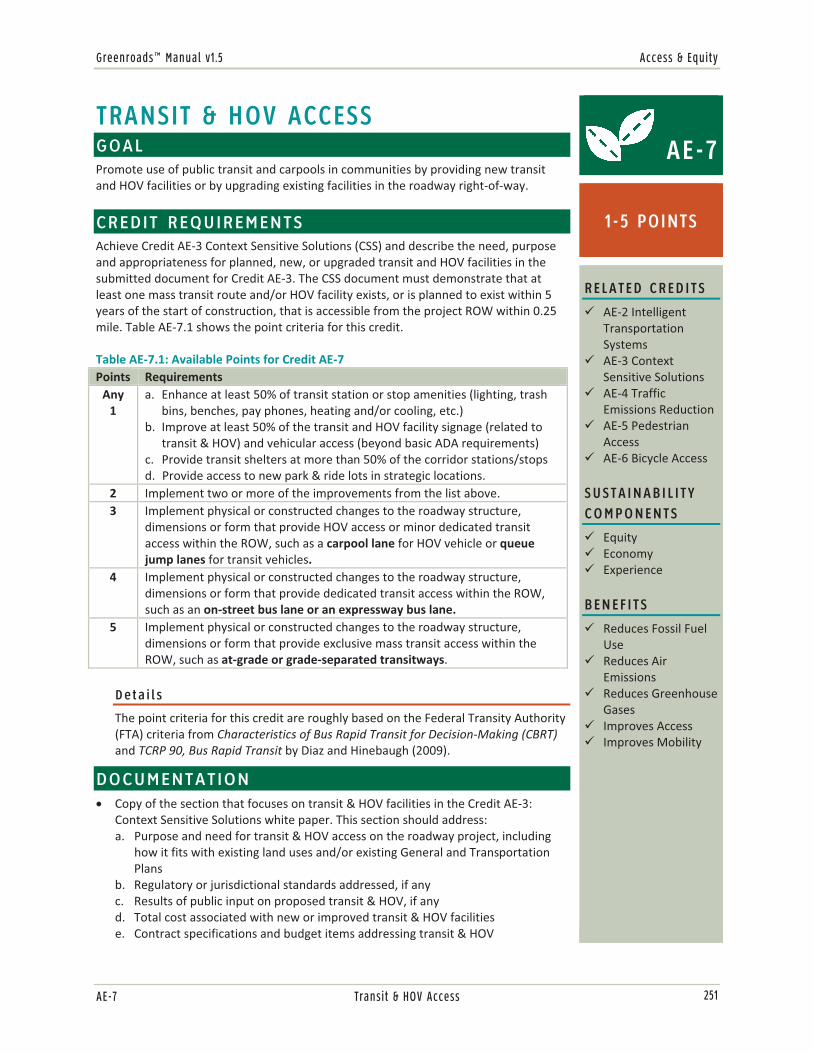
Greenroads™ Manual v1.5 Access & Equity
AE-7 Transit & HOV Access
TRANSIT & HOV ACCESS GOAL Promote�use�of�public�transit�and�carpools�in�communities�by�providing�new�transit�and�HOV�facilities�or�by�upgrading�existing�facilities�in�the�roadway�right�of�way.�
CREDIT REQUIREMENTS Achieve�Credit�AE�3�Context�Sensitive�Solutions�(CSS)�and�describe�the�need,�purpose�and�appropriateness�for�planned,�new,�or�upgraded�transit�and�HOV�facilities�in�the�submitted�document�for�Credit�AE�3.�The�CSS�document�must�demonstrate�that�at�least�one�mass�transit�route�and/or�HOV�facility�exists,�or�is�planned�to�exist�within�5�years�of�the�start�of�construction,�that�is�accessible�from�the�project�ROW�within�0.25�mile.�Table�AE�7.1�shows�the�point�criteria�for�this�credit.�
Table�AE�7.1:�Available�Points�for�Credit�AE�7�Points� Requirements�Any�1�
a. Enhance�at�least�50%�of�transit�station or�stop�amenities (lighting,�trash�bins,�benches,�pay�phones,�heating�and/or�cooling,�etc.)��
b. Improve�at�least�50%�of�the�transit�and�HOV�facility�signage�(related�to�transit�&�HOV)�and�vehicular�access�(beyond�basic�ADA�requirements)�
c. Provide�transit�shelters�at�more�than�50%�of�the�corridor�stations/stops�d. Provide�access�to�new�park�&�ride�lots�in�strategic�locations.�
2� Implement�two�or�more�of�the�improvements�from�the�list�above.3� Implement�physical�or�constructed�changes�to�the�roadway�structure,�
dimensions�or�form�that�provide�HOV�access�or�minor�dedicated�transit�access�within�the�ROW,�such�as�a�carpool�lane�for�HOV�vehicle�or�queue�jump�lanes�for�transit�vehicles.�
4� Implement�physical�or�constructed�changes�to�the�roadway�structure,�dimensions�or�form�that�provide�dedicated�transit�access�within�the�ROW,�such�as�an�on�street�bus�lane�or�an�expressway�bus�lane.�
5� Implement�physical�or�constructed�changes�to�the�roadway�structure,�dimensions�or�form�that�provide�exclusive�mass�transit�access�within�the�ROW,�such�as�at�grade�or�grade�separated�transitways.��
�Details
The�point�criteria�for�this�credit�are�roughly�based�on�the�Federal�Transity�Authority�(FTA)�criteria�from�Characteristics�of�Bus�Rapid�Transit�for�Decision�Making�(CBRT)�and�TCRP�90,�Bus�Rapid�Transit�by�Diaz�and�Hinebaugh�(2009).�
DOCUMENTATION � Copy�of�the�section�that�focuses�on�transit�&�HOV�facilities�in�the�Credit�AE�3:�
Context�Sensitive�Solutions�white�paper.�This�section�should�address:�a. Purpose�and�need�for�transit�&�HOV�access�on�the�roadway�project,�including�
how�it�fits�with�existing�land�uses�and/or�existing�General�and�Transportation�Plans�
b. Regulatory�or�jurisdictional�standards�addressed,�if�any�c. Results�of�public�input�on�proposed�transit�&�HOV,�if�any�d. Total�cost�associated�with�new�or�improved�transit�&�HOV�facilities�e. Contract�specifications�and�budget�items�addressing�transit�&�HOV�
AE-7
1-5 POINTS
RELATED CREDITS
� AE�2�Intelligent�Transportation�Systems�
� AE�3�Context�Sensitive�Solutions�
� AE�4�Traffic�Emissions�Reduction�
� AE�5�Pedestrian�Access�
� AE�6�Bicycle�Access�
SUSTAINABILITY COMPONENTS
� Equity�� Economy�� Experience�
BENEFITS
� Reduces�Fossil�Fuel�Use�
� Reduces�Air�Emissions�
� Reduces�Greenhouse�Gases�
� Improves�Access�� Improves�Mobility�
251

Access & Equity Greenroads™ Manual v1.5
Transit & HOV Access AE-7
APPROACHES & STRATEGIES
� Review�local�plans�and�existing�transit�service�plans�to�understand�how�the�roadway�will�interact�with�the�existing�and�planned�transit�system.�Because�of�the�strong�connections�between�the�pedestrian�and�bike�system�and�transit,�this�may�overlap�with�bike�and�pedestrian�planning.�See�related�credits�for�further�details.�
� Include�the�local�transit�provider(s)�in�advisory�committees,�project�development�or�management�teams,�or�decision�making�committees�as�appropriate.�
� Consult�with�local�transit�provider(s)�to�understand�how�the�roadway�project�can�support�their�operations�and�future�expansion.�
� Consider�how�a�new�or�redesigned�roadway�will�impact�the�existing�or�planned�pedestrian�networks�and�integrate�design�elements�with�other�modal�facilities�(e.g.�bicycle�and�transit)�to�mitigate�overall�impacts.�For�example,�this�might�mean�including�a�pedestrian�crossing�on�a�major�arterial�that�could�be�a�barrier�to�residents�reaching�a�transit�facility.�
� Survey�existing�routes�and�ask�stakeholders�for�suggestions�on�how�to�improve�access�to�existing�transit�facilities�during�the�public�involvement�process.�
� Locate�enhancements�to�transit�station/stop�amenities�at�more�than�50%�of�the�stations/stops�along�the�corridor�based�on�cost.�Amenities�could�include�installing�safety�lighting,�trash�receptacles,�benches,�pay�phones,�heating�and/or�cooling�and�other�similar�enhancements.�This�should�be�reflected�somewhere�in�the�project�bid�list�or�budget.�
� Install�signage�and�improve�access�that�is�exclusively�for�transit�and�HOV�vehicles�only�to�earn�this�credit.�This�distinction�is�not�to�discourage�a�comprehensive�signage�program;�however,�signage�for�pedestrian�and�bicycles�are�addressed�in�Credit�AE�5�Pedestrian�Access�and�Credit�AE�6�Bicycle�Access.�A�comprehensive�approach�to�signage�and�access�improvements�at�a�transit�and�HOV�facility�can�ultimately�include�all�modes�and�be�eligible�for�points�in�multiple�credits.�
� Identify�trouble�spots�for�transit�and�combine�transit�signal�priority�with�queue�jump�lanes�to�create�an�efficient�transit�facility�at�minimal�cost.�This�can�also�earn�points�with�Credit�AE�2�Intelligent�Transportation�Systems.�
� Consider�adding�a�carpool�lane,�which�encourages�multiple�passengers�in�each�vehicle�and�can�improve�transit�travel�times�and�reliability.�
� Improve�access�beyond�basic�requirements,�such�as�ADA.�� Improve�signage�beyond�basic�requirements�where�signage�already�exists.�Types�of�signage�improvements�
could�include�providing�passenger�information�amenities�(maps,�schedules,�real�time�signage)�at�facilities�and�signs�along�the�roadway�to�designate�transit�stations.�
� Place�additional�park�and�ride�lots�in�strategic�transit�and/or�carpool�access�locations.�� Provide�extra�width�on�sidewalks�to�accommodate�transit�shelters.�� Design�the�roadway�to�accommodate�an�exclusive�transit�lane.�� Accommodate�any�planned�fixed�guideways�by�constructing�grade�separated�crossings.�
Example: Point Calculations
2�points�A�roadway�with�several�major�transit�routes�is�being�resurfaced�and�above�ground�electrical�wires�are�being�buried�as�a�component�of�the�project.�Along�with�the�roadway�improvements,�all�(100%)�of�the�major�transit�stops�along�the�route�are�being�enhanced�with�real�time�bus�arrival�information,�lighting,�surveillance�cameras,�area�map�displays�and�trash�cans.�This�project�would�earn�2�points�because�it�includes�significant�improvements�(over�50%)�to�both�(a)�amenities�and�(b)�signage.�
4�points�A�bus�rapid�transit�project�includes�a�roadway�widening�and�restriping�to�add�an�outside�dedicated�transit�lane�with�signal�priority�at�intersections.�The�project�also�includes�station�enhancements�at�all�the�stations�along�the�corridor�with�new�shelters,�grade�separated�pedestrian�access,�real�time�passenger�information,�bicycle�storage�lockers�and�several�station�amenities.�This�project�would�receive�4�points�under�Transit�&�HOV�Access.�The�transit�signal�priority�improvements�would�be�eligible�for�the�ITS�credit�and�pedestrian�and�bicycle�improvements�would�be�eligible�for�the�Pedestrian�Access�and�Bicycle�Access�credits.�See�Figure�AE�7.1.�
252

Greenroads™ Manual v1.5 Access & Equity
AE-7 Transit & HOV Access
�Figure�AE�7.1:�An�on�street�bus�lane�in�Vancouver,�Canada.�4�points.�(Photo�by�K.�Watkins)�
5�points�See�examples�of�a�grade�separated�transitway�in�Figure�AE�7.2�and�an�at�grade�transitway�in�Figure�AE�7.3.�
�Figure�AE�7.2:�A�grade�separated�transitway�in�Ottawa,�Canada�worth.�5�points.�(Photo�by�K.�Watkins)�
253

Access & Equity Greenroads™ Manual v1.5
Transit & HOV Access AE-7
�Figure�AE�7.3:�An�at�grade�transitway�in�Eugene,�Oregon.�5�points.�(Photo�by�K.�Watkins)�
�
POTENTIAL ISSUES
1. Many�transit�and�HOV�facilities�(such�as�park�and�ride�lots�and�transit�centers)�will�involve�improvements�that�cross�multiple�modes.�In�order�to�award�credit�here,�especially�where�no�drastic�physical�changes�to�the�roadway�structure�or�form�are�implemented,�improvements�and�changes�should�be�exclusive�to�HOV�and�transit�users�and�distinguishable,�via�a�budget�item�for�example,�from�other�amenities�that�are�for�pedestrian�and�bicyclists.�An�example�would�be�improvements�to�bus�stops�where�the�sidewalk�grades�are�raised�to�accommodate�bus�ramps�for�disable�passengers.�Although�the�integration�of�transit�with�bicycles�and�pedestrians�is�key�to�obtaining�higher�ridership,�amenities�which�are�included�in�the�Pedestrian�Access�credit�AE�5�and�Bicycle�Access�credit�AE�6�cannot�be�applied�again�here.�
2. This�credit�presupposes�the�integrity�of�the�designer:�appropriate�signage�and�safety�must�be�preserved�with�the�higher�points�available�in�this�credit.�This�means�that�a�transit�or�HOV�facility�such�as�a�dedicated�busway�or�carpool�lane�is�assumed�to�be�signed�appropriately�and�will�not�be�designed�to�increase�safety�risk.�Additional�points�are�not�awarded�for�signage�and�access�improvements�for�the�higher�value�credits�for�this�reason.�
3. Intelligent�Transportation�Systems�(ITS),�transit�&�HOV�often�go�hand�in�hand�but�are�explicitly�not�covered�in�this�credit�because�they�are�included�in�Credit�AE�2�Intelligent�Transportation�Systems.�However,�many�ITS�applications,�such�as�traveler�information,�transit�management,�and�lane�management�pair�nicely�with�the�improvements�in�this�credit.��
254

Greenroads™ Manual v1.5 Access & Equity
AE-7 Transit & HOV Access
4. Aesthetic�improvements�to�transit�and�HOV�facilities�or�other�public�art,�while�considered�amenities,�are�not�included�in�this�credit.�See�Credit�AE�9�Cultural�Outreach.�It�is�possible�to�include�all�of�these�things�and�earn�points�across�multiple�credits.�
5. Light�rail�or�busway�projects�can�qualify�for�this�credit�if�they�meet�the�criteria�and�are�completed�within�the�roadway�right�of�way.�In�general,�many�of�the�credits�available�in�Greenroads�are�broadly�applicable�and�may�also�be�applied�to�these�types�of�projects,�but�they�may�lack�the�specificity�needed�to�be�effective�as�a�metric�for�such�facilities.�
6. This�credit�focuses�in�two�areas,�runningways�and�stations.�This�is�the�supporting�infrastructure�for�transit�and�HOV�access,�facilities�and�system�services.�Corridor�enhancements�such�as�service�improvements�(increased�service,�new�or�specialized�service,�route�restructuring),�branding,�marketing�and�partnership�programs,�information�systems,�fare�innovations,�and�new�or�enhanced�vehicles�are�encouraged�but�are�outside�the�scope�of�the�Greenroads�Rating�System.�
RESEARCH The�societal�benefits�of�public�transportation�are�numerous.�Transit�provides�mobility�to�those�who�cannot�or�chose�not�to�drive,�including�access�to�jobs,�education�and�medical�services.��Transit�reduces�congestion,�gasoline�consumption�and�the�nation’s�carbon�footprint�(America’s�Public�Transportation�Association:�APTA,�2008).�In�2007,�public�transportation�saved�646�million�hours�of�travel�delay�and�398�million�gallons�of�fuel�in�the�U.S.,�resulting�in�a�savings�of�$13.7�billion�in�congestion�costs�(Schrank�and�Lomax,�2009).�Use�of�public�transportation�reduced�U.S.�carbon�dioxide�(CO2)�emissions�by�6.9�million�metric�tons�in�2005�(Davis�and�Hale,�2007).�The�increased�use�of�transit�on�a�per�capita�basis�is�critical�to�the�nation’s�economy�and�meeting�environmental�goals.��
Improvements�to�public�transportation�infrastructure�are�critical�to�any�plan�to�improve�the�sustainability�of�transportation.�In�the�Urban�Land�Institute’s�recently�produced�“Moving�Cooler”�report�(Cambridge�Systematics,�2009),�transit�capital�investments�had�the�ability�to�produce�cumulative�greenhouse�gas�reductions�of�0.4�to�1.1�percent�of�baseline�emissions.�The�report�identifies�public�transportation�improvements�as�one�of�nine�key�categories�that�can�be�bundled�to�reduce�emissions.�Further,�the�World�Bank�(Gwilliam,�Kojima,�and�Johnson,�2004)�identifies�modal�shifts�to�non�SOV�modes�as�a�key�to�reducing�transport�sector�emissions.�They�point�out�however,�that�mixing�cars,�other�vehicles�and�nonmotorized�transport�with�public�transport�vehicles�“reduces�the�average�speed�of�traffic�and�makes�it�difficult�to�establish�an�effective�bus�system.”�
Infrastructure�improvements�should�include�means�to�separate�transit�vehicles�from�general�purpose�traffic�to�make�the�mode�competitive�(Vuchic,�2005;�2007).��Without�exclusive�right�of�way,�transit�vehicles�are�held�captive�by�the�congestion�caused�by�low�occupancy�vehicles�and�cannot�improve�the�efficiency�of�the�transportation�system.�For�this�reason,�this�credit�includes�higher�point�values�as�the�exclusivity�of�transit�right�of�way�improves.�
Additional�Resources�Two�of�the�most�useful�references�to�understanding�the�elements�for�this�credit�are:�
� The�Federal�Transit�Administration’s�Characteristics�of�Bus�Rapid�Transit�for�Decision�Making�(CBRT)�guidance�document�by�Diaz�and�Hinebaugh�(2009),�which�is�available�at:�http://www.fta.dot.gov/documents/CBRT_2009_Update.pdf�
� Transportation�Research�Board’s�Transit�Cooperative�Research�Program�(TCRP)�90,�Bus�Rapid�Transit:�Volume�2:�Implementation�Guidelines,�by�Levinson�et�al.�(2003).�This�document�is�available�at:�http://onlinepubs.trb.org/onlinepubs/tcrp/tcrp_rpt_90v2.pdf�
Many�additional�references�are�included�for�consideration�of�other�applicable�planning�and�design�guidelines.�Although�credits�are�obtained�for�including�elements,�proper�design�is�critical�to�the�functionality�of�the�facilities�and�the�References�section�at�the�end�of�this�credit�should�be�considered�a�starting�point.��
255

Access & Equity Greenroads™ Manual v1.5
Transit & HOV Access AE-7
GLOSSARY
At�grade�transitway� Roads�for�the�exclusive�use�of�transit�vehicles�with�access�allowed�only�at�designed�points,�however�intersections�and�other�crossings�are�at�grade�and�subject�to�signalization�
BRT� Bus�rapid�transit – a�flexible,�high�performance�rapid�transit�mode�that�combines�a�variety�of�physical,�operating�and�system�elements�into�a�permanently�integrated�system�with�a�quality�image�and�unique�identity�
CBRT� Characteristics�of�Bus�Rapid�Transit�for�Decision�Making,�an�FTA�document�describing�the�major�elements�of�BRT�and�impact�on�system�performance�
Carpool�lane� A�roadway�lane�designated�for�vehicles�with�more�than�one�occupantDedicated�lane� A�lane�designated�for�only�transit�or�only�HOV�useExpressway�bus�lane� Bus�lane�on�an�expressway�dedicated�to�bus�use�only�FTA� Federal�Transit�AdministrationGrade�separated�transitway� Roads�for�the�exclusive�use�of�transit�vehicles�with�access�allowed�only�at�
designed�points,�include�overpasses�or�other�grade�separate�at�crossings�to�minimize�conflicts�with�other�vehicles�
HOV� High�Occupancy�Vehicle�– a�vehicle�with�two�or�more�occupants�HOV�facility� A�physical�entity,�structure�or�space�that�provides�HOV�access�or�services�to�
or�in�the�ROW,�such�as�a�park�and�ride,�carpool�lane�or�transit�center�ITS� Intelligent�transportation�systems � the�integration�of�information�and�
electronics�technology�into�transportation�infrastructure�to�relieve�congestion,�improve�safety�and�enhance�productivity�
Mass�transit� See�transitOn�street�bus�lane� A�lane�on�an�arterial�or�collector�street�reserved�for�bus�use�only�Public�transit� See�transitQueue�jump�lane� A�lane�used�at�a�bottleneck�location�(typically�intersections)�to�allow�transit�
vehicles�to�come�to�the�front�of�waiting�traffic�and�bypass�the�queues�by�receiving�an�early�green�signal�
Single�Occupant�Vehicle� Vehicles�with�one�occupant�of�driving�age�(the�driver)�Station� Transit�passenger�pick�up�and�drop�off�locations�that�serve�as�the�entry�and�
exit�point�from�the�public�transportation�system�Runningway� The�track�or�roadway�on�which�transit�operatesTCRP� Transit�Cooperative�Research�Program � a�Transportation�Research�Board�
research�initiative�for�public�transportation�Transit� A�mode�of�transportation�that includes�vehicles�open�to�public�use�such�as�
buses,�light�rail,�subways,�ferries�and�trains�Transit�signal�priority� Alters�signal�timing�to�give�priority�to�transit�vehicles�by�extending�green�
time,�giving�early�green�time�or�providing�an�exclusive�transit�phase��
REFERENCES American�Public�Transportation�Association�(2007).�Public�Transportation:�Benefits�for�the�21st�Century.�Available�at�
http://www.apta.com/resources/reportsandpublications/Documents/twenty_first_century.pdf�
American�Public�Transportation�Association�(2008).�Public�Transportation�Facts�at�a�Glance.�Available�at�http://www.apta.com/resources/reportsandpublications/Documents/facts_at_a_glance.pdf�
American�Public�Transportation�Association�(2009).�Changing�the�Way�America�Moves:�Creating�a�More�Robust�Economy,�a�Smaller�Carbon�Footprint�and�Energy�Independence.�Available�at�http://www.apta.com/resources/reportsandpublications/Documents/america_moves_09.pdf�
256

Greenroads™ Manual v1.5 Access & Equity
AE-7 Transit & HOV Access
Cambridge�Systematics�(2009).�Moving�Cooler:�An�Analysis�of�Transportation�Strategies�for�Reducing�Greenhouse�Gas�Emissions.�Urban�Land�Institute.�Accessed�January�5,�2010.�Available�at�http://www.movingcooler.info/�
Cleghorn,�D.;�Clavelle,�A.;�Boone,�J.;�Masliah,�M.�&�Levinson,�H.�(2009).�Improving�Pedestrian�and�Motorist�Safety�Along�Light�Rail�Alignments.�Transit�Cooperative�Research�Program�Report�137.�Transportation�Research�Board.�Available�at�http://onlinepubs.trb.org/onlinepubs/tcrp/tcrp_rpt_137.pdf�
Davis,�T.�&�Hale,�M.�(2007).�Public�Transportation’s�Contribution�to�U.S.�Greenhouse�Gas�Reduction.�Science�Applications�International�Corporation.�Accessed�January�5,�2010.�Available�at�http://www.apta.com/resources/reportsandpublications/Documents/climate_change.pdf�
Diaz,�R.�&�Hinebaugh,�D.�(2009).�Characteristics�of�Bus�Rapid�Transit�for�Decision�Making.�Federal�Transit�Administration.�Accessed�January�5,�2010.�Available�at�http://www.fta.dot.gov/documents/CBRT_2009_Update.pdf�
Federal�Transit�Administration�(2009).�Transit�Green�Building�Action�Plan.�Accessed�January�5,�2010.�Available�at�http://www.fta.dot.gov/documents/Transit_Green_Building_Action_Plan.pdf�
Gray,�G.;�Kelley,�N.�&�Larwin,�T�(2006).�Bus�Rapid�Transit:�A�Handbook�for�Partners.�Mineta�Transportation�Institute.�Accessed�January�5,�2010.�Available�at�http://transweb.sjsu.edu/mtiportal/research/publications/documents/BRT2006/BRT_06_02%20book.pdf�
Gwilliam,�K.;�Kojima,�M.�&�Johnson,�T.�(2004).�Reducing�Air�Pollution�from�Urban�Transport.�The�World�Bank.�Accessed�January�5,�2010.�Available�at�http://www.cleanairnet.org/infopool/1411/articles�60133_resource_1.pdf�
Hecker,�J.�(2003).�Federal�Transit�Administration:�Bus�Rapid�Transit�Offers�Communities�a�Flexible�Mass�Transit�Option.�United�States�General�Accounting�Office.�Accessed�January�5,�2010.�Available�at�http://www.gao.gov/new.items/d03729t.pdf�
Hodges,�T.�(2009).�Public�Transportation’s�Role�in�Responding�to�Climate�Change.�Federal�Transit�Administration.�Accessed�January�5,�2010.�Available�at�http://www.fta.dot.gov/documents/PublicTransportationsRoleInRespondingToClimateChange.pdf�
Kittelson�&�Associates;�Herbert�Levinson�Transportation�Consultants�and�DMJM+Harris�(2007).�Bus�Rapid�Transit�Practioner’s�Guide.�Transit�Cooperative�Research�Program�Report�118.�Transportation�Research�Board.�Accessed�January�5,�2010.�Available�at�http://onlinepubs.trb.org/onlinepubs/tcrp/tcrp_rpt_118.pdf�
Kittleson�&�Associates;�KFH�Group;�Parsons�Brinckerhoff�Quade�&�Douglas�and�Hunter�Zaworski,�K.�(2003).�Transit�Capacity�and�Quality�of�Service�Manual,�2nd�Edition.�Transit�Cooperative�Research�Program�Report�100.�Transportation�Research�Board.�Accessed�January�5,�2010.�Available�at�http://www.trb.org/Publications/Blurbs/Transit_Capacity_and_Quality_of_Service_Manual_2nd_153590.aspx�
Korve,�H.;�Farran,�J.;�Mansel,�D.;�Levinson,�H.;�Chira�Chavala,�T.;�&�Ragland,�D.�(1996).�Integration�of�Light�Rail�Transit�into�City�Streets.�Transit�Cooperative�Research�Program�Report�17.�Transportation�Research�Board.�Accessed�January�5,�2010.�Available�at�http://onlinepubs.trb.org/onlinepubs/tcrp/tcrp_rpt_17�a.pdf�
Levinson,�H.;�Zimmerman,�S.;�Clinger,�J.;�Gast,�J.;�Rutherford,�S.�&�Bruhn,�E.�(2003).�Bus�Rapid�Transit:�Volume�2:�Implementation�Guidelines.�Transit�Cooperative�Research�Program�Report�90.�Transportation�Research�Board.�Accessed�January�5,�2010.�Available�at�http://onlinepubs.trb.org/onlinepubs/tcrp/tcrp_rpt_90v2.pdf�
Nelson�&�Nygaard�(2006).�Toolkit�for�the�Assessment�of�Bus�Stop�Accessibility�and�Safety.�Easter�Seals�Project�Action.�Accessed�January�5,�2010.�Available�at�http://projectaction.easterseals.com�
257

Access & Equity Greenroads™ Manual v1.5
Transit & HOV Access AE-7
Pucher,�J.�&�Buehler,�R.�(2009).�Integrating�Bicycling�and�Public�Transport�in�North�America.�Journal�of�Public�Transportation,�Volume�12,�No.�3.�http://www.nctr.usf.edu/jpt/pdf/JPT12�3Pucher.pdf�
Schneider,�R.�(2005).�Integration�of�Bicycles�and�Transit:�A�Synthesis�of�Transit�Practice.�Transit�Cooperative�Research�Program�(TCRP)�Synthesis�62,�Transportation�Research�Board.��
Schrank,�D.�&�Lomax,�T.�(2009).�Urban�Mobility�Report.�Texas�Transportation�Institute.�Accessed�January�5,�2010.�Available�at�http://tti.tamu.edu/documents/mobility_report_2009.pdf�
St.�Jacques,�K.�&�Levinson,�H.�(1997).�Operational�Analysis�of�Bus�Lanes�on�Arterials.�Transit�Cooperative�Research�Program�Report�26.�Transportation�Research�Board.�Accessed�January�5,�2010.�Available�at�http://onlinepubs.trb.org/onlinepubs/tcrp/tcrp_rpt_26�a.pdf�
Texas�Transportation�Institute�(1996).�Guidelines�for�the�Location�and�Design�of�Bus�Stops.�Transit�Cooperative�Research�Program�Report�19.�Transportation�Research�Board.�Accessed�January�5,�2010.�Available�at�http://onlinepubs.trb.org/onlinepubs/tcrp/tcrp_rpt_19�a.pdf�
TranSystems;�Planners�Collaborative�and�Tom�Crikelair�Associates�(2007).�Elements�Needed�to�Create�High�Ridership�Transit�Systems.�Transit�Cooperative�Research�Program�Report�111.�Transportation�Research�Board.�Accessed�January�5,�2010.�Available�at�http://onlinepubs.trb.org/onlinepubs/tcrp/tcrp_rpt_111.pdf�
United�States�Department�of�Transportation�(USDOT).�(2010).�Report�to�Congress:�Transportation’s�Role�in�Reducing�U.S.�Greenhouse�Gas�Emissions.�Volume�1:�Synthesis�Report�and�Volume�2:�Technical�Report.�Washington,�DC:�USDOT.�605pp.�Available�at�http://ntl.bts.gov/lib/32000/32700/32779/DOT_Climate_Change_Report_�_April_2010_�_Volume_1_and_2.pdf�
United�States�General�Accounting�Office�(2001).�Mass�Transit:�Bus�Rapid�Transit�Shows�Promise.�Accessed�January�5,�2010.�Available�at�http://www.gao.gov/new.items/d01984.pdf�
Vuchic,�V.�(2005).�Urban�Transit�Operations,�Planning�and�Economics.�John�Wiley�&�Sons.�
Vuchic,�V.�(2007).�Urban�Transit�Systems�and�Technology.�John�Wiley�&�Sons.�
Wright,�L.�&�Hook,�W.�(2007).�Bus�Rapid�Transit�Planning�Guide.�Institute�for�Transportation�&�Development�Policy.�Accessed�January�5,�2010.�Available�at�http://www.itdp.org/index.php/microsite/brt_planning_guide/�
�
258

Greenroads™ Manual v1.5 Access & Equity
AE-8 Scenic Views
SCENIC VIEWS GOAL Feature�National�Scenic�Byways�Program�(NSBP)�values�in�a�roadway.�
CREDIT REQUIREMENTS EITHER�requirement�may�be�met�for�credit.�
1�Point:�Any�portion�of�the�project�is�part�of�the�National�Scenic�Byways�Program�(NSBP)�(http://www.byways.org)�meaning�it�has�been�designated�as�one�of�America’s�Byways®�(National�Scenic�Byway�or�All�American�Road),�a�State�Scenic�Byway,�or�an�Indian�Tribe�Scenic�Byway�because�of�its�scenic,�natural,�and/or�recreational�qualities.�
OR�
2�Points:�Provide�at�least�one�access�from�the�project�to�a�designated�area�for�vehicles�to�exit�the�traffic�stream,�stop�and�experience�scenic,�natural�or�recreational�features�along�the�roadway.�These�areas�may�be�scenic�viewpoints�or�overlooks,�welcome�centers,�tourist�activities�or�information�centers�or�recreation�areas.�They�must�be�identified�with�signage�conforming�to�23�CFR�655�(the�Manual�on�Uniform�Traffic�Control�Devices,�current�revision)�Part�2�–�Signs.�
Details
The�NSBP�is�a�broad�program�that�captures�many�roadway�qualities.�These�can�best�be�categorized�as�scenic,�historical,�cultural,�natural,�recreational�and�archeological.�This�credit�covers�scenic,�natural�and�recreational�qualities.�Credit�AE�9�Cultural�Outreach�covers�historical,�cultural�and�archeological�features.�
DOCUMENTATION If�a�scenic�route�designation�is�used�to�satisfy�this�credit,�provide�documentation�of�national,�State,�or�Indian�tribe�designation.�Also�provide�a�picture�of�the�route�that�best�captures�its�scenery�or�other�important�features.�
OR�
If�a�roadside�access�point�is�used�to�satisfy�this�credit,�indicate�in�the�submitted�plans�and�specifications�where�the�viewpoint�or�overlook�is�drawn�and�specified.�Also�provide�a�picture�of�the�access�point�and�a�picture�of�the�related�attraction.��
AE-8
1-2 POINTS
RELATED CREDITS
� PR�11�Educational�Outreach�
� AE�3�Context�Sensitive�Solutions�
� AE�9�Cultural�Outreach�
SUSTAINABILITY COMPONENTS
� Ecology�� Equity�� Exposure�
BENEFITS
� Increases�Awareness� Increases�Aesthetics��
259

Access & Equity Greenroads™ Manual v1.5
Scenic Views AE-8
APPROACHES & STRATEGIES
� Work�through�formal�channels�to�have�a�roadway�or�portion�of�roadway�designated�as�a�National�Scenic�Byway,�an�All�American�Road,�a�State�scenic�byway,�or�and�Indian�Tribe�scenic�byway..�This�can�be�done�through�the�National�Scenic�Byways�Program�or�through�a�State�or�Indian�Tribe�program�that�formally�recognizes�scenic�roadways.�
� Provide�locations,�such�as�viewpoints�or�pullouts,�where�drivers�can�stop�to�enjoy�a�scenic,�historic,�cultural,�natural,�recreational,�or�archaeological�feature�of�the�roadway�area.�
� For�America’s�Byways®�and�State�designated�byways,�apply�for�a�grant�with�the�NBSP�to�enhance�one�of�the�above�qualities.�
Example: National Scenic Byways Program
The�National�Scenic�Byways�Program�(NSBP),�part�of�the�Federal�Highway�Administration,�has�a�mission�to�“…provide�resources�to�the�byway�community�in�creating�a�unique�travel�experience�and�enhanced�local�quality�of�life�through�efforts�to�preserve,�protect,�interpret,�and�promote�the�intrinsic�qualities�of�designated�byways.”�(NSBP,�2009).�The�program�formally�recognizes�certain�roads�for�their�archaeological,�cultural,�historic,�natural,�recreational�and�scenic�qualities.�To�become�an�official�“Byway”�(the�overarching�term�the�NSBP�uses�to�describe�these�roads)�a�roadway�must�be�nominated�(the�nomination�can�originate�from�any�person�or�organization)�through�a�detailed�process.�The�NSBP�defines�six�intrinsic�roadway�qualities�that�a�roadway�can�possess.�National�Scenic�Byways�possess�“characteristics�or�regional�significance”�in�at�least�one�of�these�intrinsic�qualities,�while�All�American�Roads�possess�“characteristics�of�national�significance”�in�at�least�two�of�these�intrinsic�qualities�(NSBP,�2009).�The�six�intrinsic�qualities�are�(paraphrased�from�NSBP,�2009):�
� Archaeological.�Physical�evidence�of�historic�or�prehistoric�human�life�or�activity�that�is�visible�and�capable�of�being�inventoried�and�interpreted.��
� Cultural.�Evidence�and�expressions�of�the�customs�or�traditions�of�a�distinct�group�of�people.��� Historic.�Legacies�of�the�past�that�are�distinctly�associated�with�physical�elements�of�the�landscape,�whether�
natural�or�manmade,�that�are�of�such�historic�significance�that�they�educate�the�viewer�and�stir�an�appreciation�for�the�past.��
� Natural.�Those�features�in�the�visual�environment�that�are�in�a�relatively�undisturbed�state.�These�features�predate�the�arrival�of�human�populations�and�may�include�geological�formations,�fossils,�landform,�water�bodies,�vegetation,�and�wildlife.��
� Recreational.�Outdoor�recreational�activities�directly�association�with�and�dependent�upon�the�natural�and�cultural�elements�of�the�corridor's�landscape.�They�provide�opportunities�for�active�and�passive�recreational�experiences.��
� Scenic.�Heightened�visual�experience�derived�from�the�view�of�natural�and�manmade�elements�of�the�visual�environment�of�the�scenic�byway�corridor.��
Figure�AE�8.1�shows�a�map�of�registered�National�Scenic�Byways�and�All�American�Roads�in�the�U.S.�as�classified�by�the�NSBP.�The�NSBP�website�gives�maps�and�locations�for�Byways�(Figure�AE�8.2)�that�can�be�used�to�determine�if�a�particular�project�encompasses�part�of�one.��
260
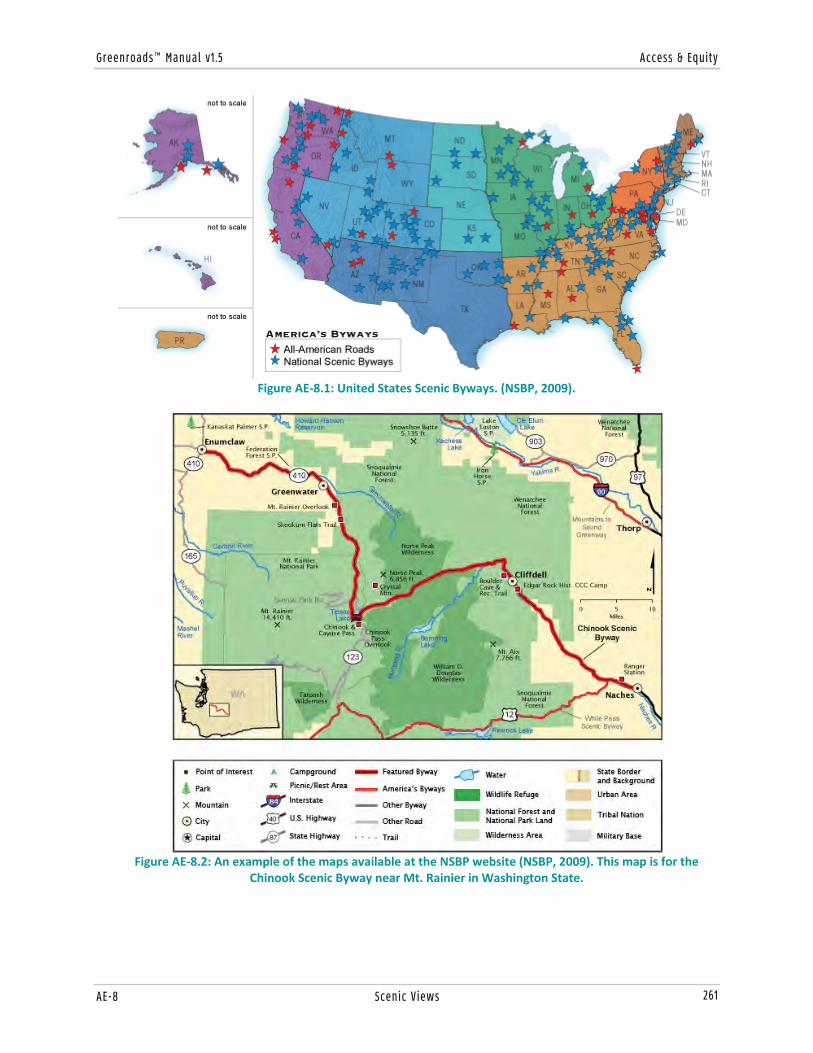
Greenroads™ Manual v1.5 Access & Equity
AE-8 Scenic Views
�
�Figure�AE�8.1:�United�States�Scenic�Byways.�(NSBP,�2009).�
�Figure�AE�8.2:�An�example�of�the�maps�available�at�the�NSBP�website�(NSBP,�2009).�This�map�is�for�the�
Chinook�Scenic�Byway�near�Mt.�Rainier�in�Washington�State.��
261

Access & Equity Greenroads™ Manual v1.5
Scenic Views AE-8
Example: Oregon Scenic Byways
Oregon�has�its�own�Scenic�Byways�Program�that�includes�federal,�state,�city�and�county�defined�scenic�roads�and�highways.�Some�are�in�the�NSBP�and�some�are�not.�This�program�lists�its�scenic�byways�at:�http://www.oregon.gov/ODOT/HWY/SCENICBYWAYS/index.shtml.�As�an�example,�the�Silver�Falls�Scenic�Byway�is�a�55�mile�route�near�Salem,�OR�that�goes�through�Silver�Falls�State�Park.�Although�it�is�not�part�of�the�NSBP,�it�still�qualifies�for�this�Voluntary�Credit�based�on�its�designation�by�the�state�of�Oregon.��
Example: Scenic Viewpoint
Roadways�can�offer�opportunities�to�safely�view�scenery�by�providing�designated�pullouts�or�viewing�areas�that�allow�motorists�to�stop�and�exit�their�vehicles�to�take�in�scenery.��These�viewing�areas�can�be�large�constructed�parking�lots�with�visitor�amenities�(Figure�AE�8.3)�or�can�be�simple�widened�shoulder�pullouts�(Figure�AE�8.4).�In�either�case�the�viewpoint�or�overlook�should�be�properly�signed�and�identified.��
�
Figure�AE�8.3:�Scenic�viewpoint�showing�Mt.�St.�Helens�accessible�from�Forest�Highway�25��in�the�Gifford�Pinchot�National�Forest.��
��
262
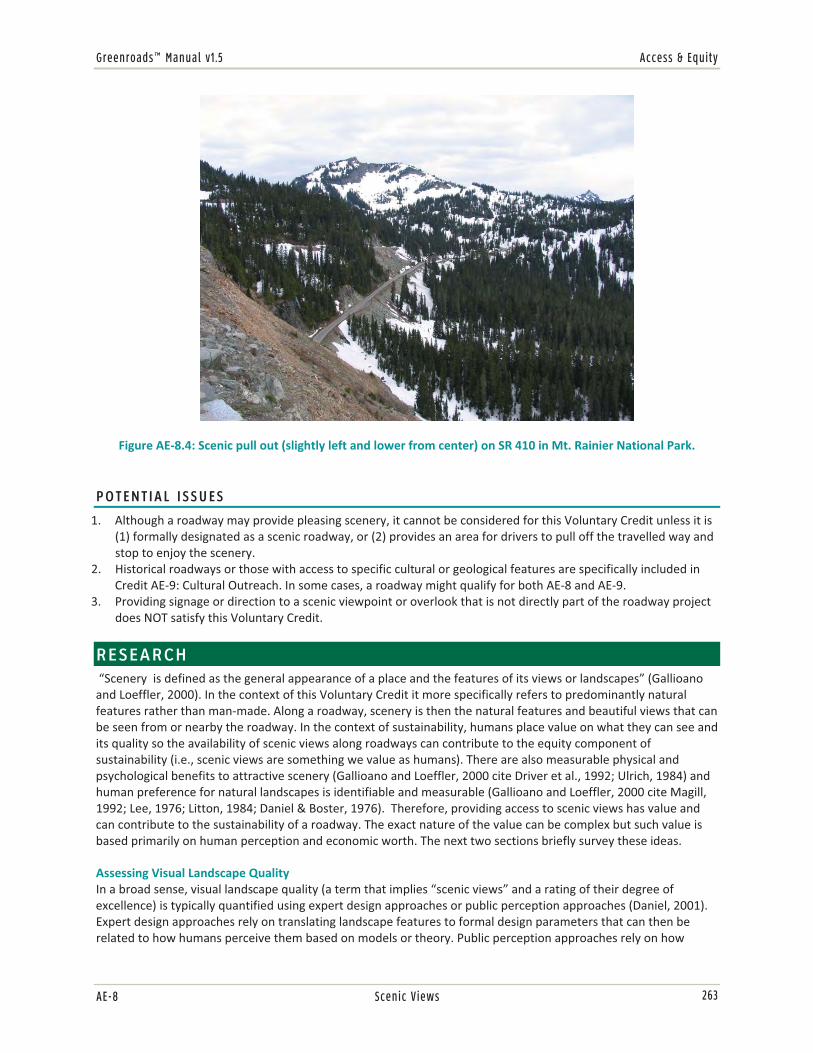
Greenroads™ Manual v1.5 Access & Equity
AE-8 Scenic Views
�
Figure�AE�8.4:�Scenic�pull�out�(slightly�left�and�lower�from�center)�on�SR�410�in�Mt.�Rainier�National�Park.���
POTENTIAL ISSUES
1. Although�a�roadway�may�provide�pleasing�scenery,�it�cannot�be�considered�for�this�Voluntary�Credit�unless�it�is�(1)�formally�designated�as�a�scenic�roadway,�or�(2)�provides�an�area�for�drivers�to�pull�off�the�travelled�way�and�stop�to�enjoy�the�scenery.��
2. Historical�roadways�or�those�with�access�to�specific�cultural�or�geological�features�are�specifically�included�in�Credit�AE�9:�Cultural�Outreach.�In�some�cases,�a�roadway�might�qualify�for�both�AE�8�and�AE�9.�
3. Providing�signage�or�direction�to�a�scenic�viewpoint�or�overlook�that�is�not�directly�part�of�the�roadway�project�does�NOT�satisfy�this�Voluntary�Credit.���
RESEARCH �“Scenery��is�defined�as�the�general�appearance�of�a�place�and�the�features�of�its�views�or�landscapes”�(Gallioano�and�Loeffler,�2000).�In�the�context�of�this�Voluntary�Credit�it�more�specifically�refers�to�predominantly�natural�features�rather�than�man�made.�Along�a�roadway,�scenery�is�then�the�natural�features�and�beautiful�views�that�can�be�seen�from�or�nearby�the�roadway.�In�the�context�of�sustainability,�humans�place�value�on�what�they�can�see�and�its�quality�so�the�availability�of�scenic�views�along�roadways�can�contribute�to�the�equity�component�of�sustainability�(i.e.,�scenic�views�are�something�we�value�as�humans).�There�are�also�measurable�physical�and�psychological�benefits�to�attractive�scenery�(Gallioano�and�Loeffler,�2000�cite�Driver�et�al.,�1992;�Ulrich,�1984)�and�human�preference�for�natural�landscapes�is�identifiable�and�measurable�(Gallioano�and�Loeffler,�2000�cite�Magill,�1992;�Lee,�1976;�Litton,�1984;�Daniel�&�Boster,�1976).��Therefore,�providing�access�to�scenic�views�has�value�and�can�contribute�to�the�sustainability�of�a�roadway.�The�exact�nature�of�the�value�can�be�complex�but�such�value�is�based�primarily�on�human�perception�and�economic�worth.�The�next�two�sections�briefly�survey�these�ideas.��
Assessing�Visual�Landscape�Quality�In�a�broad�sense,�visual�landscape�quality�(a�term�that�implies�“scenic�views”�and�a�rating�of�their�degree�of�excellence)�is�typically�quantified�using�expert�design�approaches�or�public�perception�approaches�(Daniel,�2001).�Expert�design�approaches�rely�on�translating�landscape�features�to�formal�design�parameters�that�can�then�be�related�to�how�humans�perceive�them�based�on�models�or�theory.�Public�perception�approaches�rely�on�how�
263
Access & Equity Greenroads™ Manual v1.5
Scenic Views AE-8
landscape�features�function�as�stimuli�to�evoke�human�response.�Either�method�is�fundamentally�related�to�how�humans�perceive�landscape�features.�These�perceptions�are,�on�average,�quite�consistent�in�that�people�tend�to�prefer�natural�appearing�landscapes�(Lee,�1976;�McGuire,�1979;�Newby,�1971;�Noe,�1988)�and�generally�like�the�same�things�(Zube,�1976).�Therefore,�in�a�broad�sense�it�is�possible�to�predict�human�preferences�for�visual�quality�and�plan�for�them�in�a�roadway.�An�opposite�approach�that�is�gaining�momentum�seeks�to�directly�assess�the�ecological�function�of�the�landscape�and�deem�human�perception�and�preferences�irrelevant�(Daniel,�2001).��This�approach�may�even�find�that�not�building�any�road�may�be�the�best�approach�to�preserving�visual�landscape�quality.��
Economic�Value�of�Scenery�Scenery�can�also�be�judged�based�on�its�economic�value.�Most�research�in�this�area�investigates�what�humans�have�paid�for�the�privilege�of�enjoying�a�view�or�what�they�would�be�willing�to�pay.��For�example,�in�looking�at�Hong�Kong�apartments�Jim�and�Chen�(2009)�found�that�people�are�willing�to�pay�a�premium�for�attractive�views;�e.g.,�a�broad�harbor�view�of�Hong�Kong�Harbor�could�increase�the�apartment�value�by�2.97%�or�about�$15,173.�In�something�perhaps�more�related�to�roadway�scenery,�Batistan�et�al.�(2002)�looked�at�the�value�of�agricultural�land�in�Wyoming�(near�Yellowstone�and�Grand�Teton�National�Parks)�and�found�that�“…remote�agricultural�lands,�which�include�wildlife�habitat,�angling�opportunities�and�scenic�vistas,�command�higher�prices�per�acre�than�those�which�primarily�possess�agricultural�production�capacity.”�Another,�perhaps�simpler,�way�to�demonstrate�the�economic�value�of�scenic�views�is�to�look�at�the�pricing�of�hotel�rooms.�Lange�and�Shaeffer�(2001)�looked�at�room�pricing�in�Zurich,�Switzerland�and�found�there�to�be�significant�value�in�views�(a�somewhat�obvious�conclusion�but�nonetheless�supported�by�proper�statistical�analysis).�Such�economic�analysis�is�not�entirely�new�either.�An�1879�article�in�the�New�York�Times�(Jarves,�1879)�provides�an�early�view�into�what�scenery�is�worth.�In�this�article�Jarves�looks�at�tourist�visits�to�Switzerland�and�claims�1.4�million�visitors�have�spent�over�$45�million,�which,�he�argues,�can�be�viewed�as�the�interest�at�5%�on�$900�million,�“…which�may�be�considered�the�actual�market�value�of�the�landscape�alone…”�In�2009�dollars�that�conservatively�comes�to�well�over�$20�billion.��
The�National�Scenic�Byway�Program�(NSBP)�The�NSBP�chooses�less�scientifically�rigorous�methods�for�selecting�roadways�for�designation�as�National�Scenic�Byways�or�All�American�Roads.�The�definition�of�their�six�intrinsic�qualities�that�these�roads�have�(archaeological,�cultural,�historic,�natural,�recreational,�scenic)�indicates�that�the�NSBP�definition�is�broader�than�the�Gallioano�and�Loeffler�(2000)�definition�of�“general�appearance�and�the�qualities�of�its�view�and�landscapes.”�However�a�review�of�these�six�intrinsic�qualities�shows�that�each�one�must�essentially�be�represented�by�a�physical�presence�that�can�be�viewed�or�experienced.�The�specific�requirements�for�scenic�byway�designation�are�outlined�by�the�FHWA�in�their�interim�policy�on�Scenic�Byways�(National�Scenic�Byways�Program,�1995).�Specifically,�roadways�nominated�should:�
� Safely�and�conveniently�accommodate�two�wheel�drive�automobiles�with�standard�clearances.�� Accommodate,�wherever�feasible,�bicycle�and�pedestrian�travel.�� Safely�accommodate�conventional�tour�buses.�� Have�a�scenic�byways�corridor�management�plan.�For�All�American�Roads,�there�must�be�a�demonstration�
of�the�extent�to�which�enforcement�mechanisms�are�being�implemented�by�communities�along�the�highway�in�accordance�with�the�corridor�management�plan.�
� User�facilities�(e.g.�overlooks,�food�services,�etc.)�should�be�available�for�travelers.�� Have�continuity.�Roadways�should�have�too�many�gaps�but�rather�should�be�as�continuous�as�possible�and�
should�minimize�intrusions�on�the�visitor’s�experience.��
Also,�and�importantly,�any�road�nominated�for�the�National�Scenic�Byway�or�All�American�Road�designation�is�considered�to�be�designated�a�State�scenic�byway.�Many�of�the�scenic�byways�running�through�the�United�States�are�not�just�viewed�as�part�of�the�how�people�travel,�but�can�be�recognized�as�cultural�landmarks�(Youngs,�White�and�Wodrich,�2008).��
264
Greenroads™ Manual v1.5 Access & Equity
AE-8 Scenic Views
GLOSSARY
REFERENCES Bastian,�C.T.;�McLeod,�D.M.;�Germino,�M.J.;�Reiners,�W.A.�&�Blasko,�B.J.�(2002).�Environmental�amenities�and�
agricultural�land�values:�a�hedonic�model�using�geographic�information�systems�data.�Ecological�Economics,�40,�pp.�337�349.��
Daniel,�T.C.�&�Boster,�R.�(1976).�Measuring�landscape�esthetics:�the�scenic�beauty�estimation�method.�Research�Paper.�RM�167.�U.S.�Department�of�Agriculture,�Forest�Service,�Rocky�Mountain�Forest�and�Range�Experiment�Station,�Fort�Collins,�CO.����
Daniel,�T.C.�(2001).�Whither�scenic�beauty?�Visual�landscape�quality�assessment�in�the�21st�century.�Landscape�and�Urban�Planning,�54,�pp.�267�281.��
Driver,�B.L.;�Brown,�P.J.�&�Peterson,�G.�(1992).�Benefits�of�leisure.�State�College,�PA:�Venture�Publishing,�Inc.��
Gallioano,�S.J.�&�Loeffler,�G.M.�(2000).�Scenery�Assessment:�Scenic�Beauty�at�the�Ecoregion�Scale.�Interior�Columbia�Basin�Ecosystem�Management�Project:�Scientific�Assessment,�Quigley,�T.M.,�ed.�PNW�GTR�472.�U.S.�Department�of�Agriculture,�Forest�Service,�Pacific�Northwest�Research�Station,�Portland,�OR.��
Haefele,�M.�(2009).�Scenery�holds�economic�value.�The�Wilderness�Society.�http://wilderness.org/content/scenery�holds�economic�value.�Accessed�8�December�2009.��
Jarves,�J.J.�(18�October�1879).�Money�Value�of�Scenery;�Revenue�from�Natural�Attractions.�New�York�Times.�http://query.nytimes.com/gst/abstract.html?res=9B0DEFD7103EE73BBC4C53DFB7678382669FDE.��
Jim,�C.Y.�&�Chen,�W.Y.�(2009).�Value�of�scenic�views:�Hedonic�assessment�of�private�housing�in�Hong�Kong.�Landscape�and�Urban�Planning,�91(4),�pp.�226�234.�
Lange,�E.�&�Schaeffer,�P.V.�(2001).�A�comment�on�the�market�value�of�a�room�with�a�view.�Landscape�and�Urban�Planning,�55(2),�pp.�113�120.��
Lee,�R.G.�(1976).�Assessing�public�concern�for�visual�quality—landscape�sensitivity�research�and�administrative�studies.�PSW�19.�U.S.�Department�of�Agriculture,�Forest�Service,�Pacific�Southwest�Forest�and�Range�Experiment�Station,�Berkeley,�CA.�
Litton,�R.B.,�Jr.�(1984).�Visual�vulnerability�of�the�landscape:�control�of�visual�quality.�Research�Paper.�WO�39.�U.S.�Department�of�Agriculture,�Forest�Service,�Washington,�DC.�
All�American�Road� A�road�designated�by�the�National�Scenic�Byways�Program�and�possessing�characteristics�of�national�significance�within�at�least�two�of�the�following�intrinsic�qualities:�archaeological,�cultural,�historic,�natural,�recreational�and�scenic.���
National�Scenic�Byway� A�road�designated�by�the�National�Scenic�Byways�Program�and�possessing�characteristics�of�regional�significance�within�at�least�one�of�the�following�intrinsic�qualities:�archaeological,�cultural,�historic,�natural,�recreational�and�scenic.���
Scenery� The�general�appearance�of�a�place�and�the�features�of�its�views�or�landscapes.��
Scenic�View� A�pleasing�sight�or�vista�that�involves�a�landscape�predominated�by�natural�(as�opposed�to�man�made)�features.��
265

Access & Equity Greenroads™ Manual v1.5
Scenic Views AE-8
Magill,�A.W.�(1992).�Managed�and�natural�landscapes:�What�do�people�like?�Research�Paper.�PSW�RP�213.�U.S.�Department�of�Agriculture,�Forest�Service,�Pacific�Southwest�Research�Station,�Albany,�CA.�
National�Scenic�Byways�Program�(NSBP)�Online.�(2009).�National�Scenic�Byways�Program.�Website.�http://www.bywaysonline.org.�Accessed�3�December�2009.���
National�Scenic�Byways�Program,�60�Fed.�Reg.�26759�(1995).�
Ulrich,�R.S.�(1984).�View�through�a�window�may�influence�recovery�from�surgery.�Science,�224,�pp.�420�421.���
�Youngs,�Y.L.�(2008).�Transportation�Systems�as�Cultural�Landscapes�in�National�Parks:�The�Case�of�Yosemite.�Society�and�Natural�Resources,�21,�797�811.�
�
266

Greenroads™ Manual v1.5 Access & Equity
AE-9 Cultural Outreach
CULTURAL OUTREACH GOAL Promote�cultural�awareness,�community�connectivity�and�art.�
CREDIT REQUIREMENTS 1�point�Any�part�of�the�project�or�any�item�within�10�miles�of�the�project�boundary�is�either:�
� Listed�in�the�United�States�National�Register�of�Historic�Places�� Subject�of�a�Determination�of�Eligibility�(DOE)�made�by�a�State�Historic�Preservation�
Officer.�� Part�of�the�National�Scenic�Byways�Program�(NSBP)�(http://www.byways.org)�
meaning�it�has�been�designated�as�one�of�America’s�Byways®�(National�Scenic�Byway�or�All�American�Road),�a�State�Scenic�Byway,�or�an�Indian�Tribe�Scenic�Byway�because�of�its�cultural,�historical,�or�archeological�features.��
AND��
Install�informational�infrastructure�(e.g.,�viewpoint,�kiosk,�sign,�or�other�small�scale�installation�for�visitors�detailing�historical,�cultural,�or�archeological�significance)�to�explain�the�site�or�direct�roadway�users�to�the�site.�An�existing�installation�meets�this�informational�infrastructure�portion�of�the�requirement.��
2�points�Dedicate�a�minimum�of�1%�of�the�total�project�budget�(not�to�exceed�$200,000)�to�art�or�community�culture�installations�along�the�roadway�right�of�way�(ROW).�
Details
Many�National�Park�System�(NPS)�units�are�automatically�listed�in�the�National�Register�of�Historic�Place.�As�of�December�2009�those�include:�international�historic�sites,�national�battlefields,�national�battlefield�parks,�national�battlefield�sites,�national�historic�sites,�national�historical�parks,�national�memorial,�national�military�parks�and�national�monuments.��
The�NSBP�is�a�broad�program�that�captures�many�roadway�qualities.�These�can�best�be�categorized�as�scenic,�historical,�cultural,�natural,�recreational�and�archeological.�This�credit�covers�historical,�cultural,�and�archeological�qualities.��Credit�AE�8�Scenic�Views�covers�scenic,�natural,�and�recreational�qualities.�
For�the�purposes�of�Greenroads,�“art”�is�broadly�defined�as�the�behavior�of�making�things�special.��
DOCUMENTATION 1�point�� A�copy�of�the�registration�of�the�item�or�location�in�the�United�States�National�
Register�of�Historic�Places�or�documentation�of�NSBP�designation.�A�screenshot�of�the�item�listed�in�the�National�Register�of�Historic�Places�on�the�official�website�(www.nps.gov/nr)�is�acceptable.�Or,�if�a�DOE�is�used,�a�copy�of�the�official�DOE.���
AE-9
1-2 POINTS
RELATED CREDITS
� PR�11�Educational�Outreach�
� AE�3�Context�Sensitive�Solutions�
� AE�8�Scenic�Views�
SUSTAINABILITY COMPONENTS
� Equity�� Exposure�
BENEFITS
� Increases�Awareness� Increases�Aesthetics�
267

Access & Equity Greenroads™ Manual v1.5
Cultural Outreach AE-9
� A�map�showing�that�the�item�or�location�is�in�the�project�area�or�within�10�miles�of�the�project�boundary.��� A�photograph�of�the�item�or�location�and�the�informational�infrastructure.���
2�points�� Copy�of�the�project�budget�showing�a�minimum�of�1%�of�the�total�budget�or�$200,000�(whichever�is�less)�has�
been�dedicated�toward�art.��� At�least�one�photograph�of�the�installed�artwork.�
APPROACHES & STRATEGIES
� Integrate�context�sensitive�aesthetic�treatments,�as�determined�by�participating�stakeholders,�into�the�design�of�transportation�facilities.�Examples�may�include�treatments�to�sound�walls,�structures,�street�furniture,�screening,�fences,�signage,�piers�or�lighting.�
� Set�aside�0.5%�of�the�total�project�budget�toward�art�or�cultural�installations.�Allow�for�community�contributions�and�suggestions�during�the�public�involvement�process�during�project�scoping.�
� Encourage�public�engagement�through�mural�painting�or�other�participatory�activities.�� Investigate�places�on�the�National�Register�of�Historical�Places�to�see�if�any�may�help�the�project�qualify�for�this�
Voluntary�Credit.��� Investigate�registering�an�item�or�place�on�the�National�Register�of�Historical�Places.��
Example: National Register of Historic Places
The�National�Register�of�Historic�Places�(www.nps.gov/nr)�is�the�official�list�of�U.S.�historic�places�worthy�of�preservation.�It�is�authorized�by�the�National�Historical�Preservation�Act�of�1966�and�is�maintained�by�the�National�Park�Service.�The�National�Register�of�Historic�Places�program�maintains�a�nomination�process�(states,�tribes�and�other�federal�agencies�may�nominate�properties�for�inclusion�in�the�list);�offers�guidance�and�helps�qualified�properties�receive�preservation�benefits.�Roads�can�be�and�are�included�in�the�register.�For�example,�record�number�336109�concerns�the�Columbia�River�Highway�District,�which�addressed�an�historical�roadway�that�travels�along�the�Oregon�side�of�the�Columbia�River.��
Example: Historic Roads Website
This�resource�(www.historicroads.org)�provides�ideas�for�what�constitutes�an�historic�road�and�resources�to�assist�with�documentation�and�designation/recognition.�
Example: Wisconsin’s Rustic Roads Program
Established�in�1973,�the�Wisconsin�Rustic�Roads�program�(http://www.dot.wisconsin.gov/travel/scenic/rusticroads.htm)�helps�citizens�and�local�government�to�preserve�scenic,�lightly�traveled�country�roads.�There�are�now�108�such�roads,�designated�with�an�“R”�in�front�of�the�route�number�(e.g.,�R62�or�R108).�According�to�the�Wisconsin�Department�of�Transportation�a�road�must�have�the�following�characteristics�to�qualify�for�the�Rustic�Road�program:��
� Outstanding�natural�features�along�its�borders�such�as�rugged�terrain,�native�vegetation,�native�wildlife,�or�include�open�areas�with�agricultural�vistas�which�singly�or�in�combination�uniquely�set�this�road�apart�from�other�roads.��
� Lightly�traveled�local�access�road,�one�which�serves�the�adjacent�property�owners�and�those�wishing�to�travel�by�auto,�bicycle,�or�hiking�for�purposes�of�recreational�enjoyment�of�its�rustic�features.��
� Not�scheduled�nor�anticipated�for�major�improvements�which�would�change�its�rustic�characteristics.��� Have,�preferably,�a�minimum�length�of�2�miles�and,�where�feasible,�should�provide�a�completed�closure�or�
loop,�or�connect�to�major�highways�at�both�ends�of�the�route.��
268

Greenroads™ Manual v1.5 Access & Equity
AE-9 Cultural Outreach
Example: Percentage for Art Programs
Incorporating�a�percentage�of�the�project�budget�for�art�or�cultural�endeavors�is�common�in�many�major�municipalities.�Examples�are:�
� The�City�of�Seattle�has�a�Public�Art�Ordinance�(passed�in�1973)�that�dedicates�1%�of�construction�costs�to�art.�Importantly,�the�City�defines�“construction�project”�as�“…any�capital�project�paid�for�wholly�or�in�part�by�the�City�to�construct�or�remodel�any�building,�structure,�park,�utility,�street,�sidewalk,�or�parking�facility,�or�any�portion�thereof,�within�the�limits�of�The�City�of�Seattle.”�(City�of�Seattle,�2009a).�
� Sound�Transit�(in�the�Puget�Sound�region�of�Washington�State)�administers�the�Start�Public�Art�Program,�which�allocates�1%�of�project�construction�costs�to�art�(Sound�Transit,�2009).�
� Washington�State’s�Art�in�Public�Places�Program�adds�0.5%�for�the�acquisition�of�artwork�to�new�construction�budgets�for�state�owned�buildings�(Washington�State�Arts�Commission,�2009).��
� New�York’s�City�Art�Program�uses�one�percent�of�a�total�public�project�budgets�to�fund�artistic�installations�at�public�buildings�(Heartney�&�New�York�Department�of�Cultural�Affairs,�2005).�
� Oregon’s�Percent�for�Art�legislation�(passed�in�1975)�guides�the�acquisition�of�Oregon’s�State�Art�Collection.�It�sets�aside�“…1%�of�the�direct�construction�funds�of�new�or�remodeled�state�buildings�with�construction�budgets�of�$100,000�or�greater�for�the�acquisition�of�art�work�which�may�be�an�integral�part�of�the�building,�attached�thereto,�or�capable�of�display�in�other�State�Buildings"�(Oregon�Arts�Commission,�2009).��
� Hawaii’s�Art�in�Public�Places�Program�(established�in�1967)�was�created�to�“…enhance�the�environmental�quality�of�state�public�buildings�and�spaces�throughout�the�state�for�the�enjoyment�and�enrichment�of�the�public;�cultivate�the�public's�awareness,�understanding�and�appreciation�of�visual�arts�in�all�media,�styles�and�techniques;�contribute�toward�the�development�and�recognition�of�a�professional�artistic�community;�and�acquire,�interpret,�preserve�and�display�works�of�art�expressive�of�the�character�of�the�Hawaiian�Islands,�the�multicultural�heritage�of�its�people,�and�the�various�creative�interests�of�its�artists.”�(Hawaii�State�Foundation�on�Culture�and�the�Arts,�2009).��
�Figures�AE�9.1�through�AE�9.3�are�examples�of�streetscape�art�in�the�greater�Seattle�area.���
�
Figure�AE�9.1:�Richard�Beyer’s�People�Waiting�for�the�Interurban�(1979)�at�the�corner�of�Fremont�Avenue�North�and�North�34th�Street.�Paid�for�by�community�donations,�the�Seattle�Arts�Commission�(Now�the�Office�
of�Arts�&�Cultural�Affairs)�and�the�Washington�State�Arts�Commission�(City�of�Seattle,�1979).��
269

Access & Equity Greenroads™ Manual v1.5
Cultural Outreach AE-9
�
Figure�AE�9.2:�Jack�Mackie’s�Dancers'�Series:�Steps�(1982)�found�in�8�locations�along�Broadway�Avenue�in�the�Capitol�Hill�area�of�Seattle.�Paid�for�by�the�Engineering�Department�(now�part�of�Seattle�Public�Utilities)�1%�for�
Art�and�private�businesses�in�the�Broadway�Local�Improvement�District�(City�of�Seattle,�2009b).���
��
Figure�AE�9.2:�Tom�Askman�and�Lea�Anne�Lake’s�Ballard�Gateway�(2003)�on�the�15th�Avenue�N.W.�approach�to�the�Ballard�Bridge.�Paid�for�by�the�Seattle�Department�of�Transportation�1%�for�Art,�Seattle�City�Light�1%�for�Art�
and�Millennium�Lighting�Funds,�Department�of�Neighborhoods�Matching�Funds�(City�of�Seattle,�2009b).�
270

Greenroads™ Manual v1.5 Access & Equity
AE-9 Cultural Outreach
POTENTIAL ISSUES
1. It�may�not�always�be�appropriate�or�possible�to�include�cultural�outreach�or�art�on�a�project.��2. Art�can�be�controversial.��3. Sometimes�it�is�difficult�to�specify�exactly�what�art�is.�Beyond�the�general�definition�used�in�this�Voluntary�
Credit,�something�more�precise�is�generally�needed�to�include�in�contract�documents�in�order�to�define�what�qualifies�as�“art.”�
RESEARCH Construction�of�transportation�infrastructure�represents�a�large�public�investment�in�many�communities.�Roadway�projects�not�only�connect�places�and�economies,�they�also�connect�people�to�place.�Roadway�designers�and�contractors�are�in�position�to�offer�more�to�society�than�simply�meeting�basic�needs,�project�deadlines,�and�bottom�lines.�Designing�aesthetic�treatments�that�reflect�community�identity�or�integrating�public�art�into�transportation�projects�is�an�opportunity�to�enhance�communities,�particularly�those�without�resources�to�pursue�independent�public�art�or�landscape�programs.�Most�civil�engineering�works,�by�definition,�meet�needs�and�serve�to�better�the�greater�good�of�the�public.�In�roadway�projects,�opportunities�for�promoting�this�sense�of�community�can�be�accomplished�through�incorporating�historical�and�cultural�information�facilities,�connection�to�national�landmarks�and�community�centered�artwork.�This�research�section�attempts�to�define�what�art�is�and�why�it�might�be�viewed�as�important.��
Ethnologic�View�of�Art�The�following�discussion�of�Art�is�largely�taken�from�the�work�of�Ellen�Dissanayake,�an�Affiliate�Professor�in�the�School�of�Music�at�the�University�of�Washington.�She�generally�takes�an�ethological�view�of�art;�that�is�she�approaches�art�as�something�living�creatures�(humans)�do�in�their�everyday�life�that�somehow�has�an�adaptive�or�selective�value�in�human�evolution.��
What�is�Art?�Dissanayake�(1980)�broadly�defines�art�as�“…the�ability�to�recognize�or�confer�‘specialness,’�a�level�or�order�different�from�the�everyday.”�In�short,�art�is�the�act�of�making�special.�This�encompasses�a�broad�range�of�items�including�song,�dance,�ritual,�play�and�even�organized�sports.�Importantly,�the�idea�of�art�does�not�include�a�quality�judgment�or�involve�an�understanding�of�how�art�manages�to�achieve�specialness.���
Why�is�Art�Important?�Human�ethologists�believe�that�certain�human�behaviors�have�persisted�over�time�because�they�contribute�positively�to�the�evolution�and�success�of�the�species�(Dissanayake,�1980).�In�terms�of�art,�this�means�that�as�a�behavior�art�exists�because�it�is�somehow�important�to�the�success�of�the�human�species.�Art�would�not�exist�universally�if�it�did�not�have�selective�value.�Art�is�not,�as�the�modern�view�goes�“for�its�own�sake”�(i.e.,�no�practical�value).�Art�is�also�not�just�for�artists;�it�is�a�common�behavior�to�all�humans.��
“It�is�the�degree�to�which�art�embodies�and�communicates�experience�that�makes�it�unique�and�irreplaceable�(gives�it�value).�Although�there�are�likely�many�who�appear�to�do�just�fine�without�art�(as�we�know�it�today)�it�is�only�recently�(last�100�or�so�years)�that�art�has�become�detached�from�the�rest�of�life�and�regarded�for�its�own�sake.�For�most�of�history,�the�activity�of�giving�meaning�and�embellishing�life�was�not�an�impractical�leisure�time�activity�but�rather�the�way�the�human�mind�worked�–�a�way�of�comprehending�the�world.”�(Dissanayake,�1980).��
Art�contributes�essential�social�benefits�such�as�documentation,�expression,�storytelling,�entertainment,�display�of�wealth�and�power�and�representation�of�custom�and�tradition.�In�other�words,�art�gives�shape�to�and�embellishes�life;�what�makes�art�unique�and�irreplaceable�is�the�degree�to�which�art�embodies�and�communicates�experience�(Dissanayake,�1980).�Only�in�the�last�100�years�or�so�has�art�become�detached�from�ritual�and�play�and�been�viewed�as�an�independent�activity.�For�most�of�human�existence,�the�primary�task�of�
271

Access & Equity Greenroads™ Manual v1.5
Cultural Outreach AE-9
artists�was�to�give�shape�to�and�embellish�life;�to�help�find�meaning�in�life.�Artists�recorded�events,�decorated�homes�and�embellished�ceremonial�observances�(Dissanayake,�1980).���
In�summary,�there�four�key�points�to�take�away�from�the�ethological�viewpoint:�
1. Art�is�the�ability�to�“make�special.”�Art�recognizes�or�confers�‘specialness,’�a�level�or�order�different�from�everyday.�Equally�important�is�the�behavior�of�appreciating�that�some�things�are�special.�These�ideas�are�fundamental�and�universal.�
2. Art�has�selective�value,�i.e.,�in�some�way�it�enhances�the�survival�of�the�species.�Art�would�not�exist�universally�if�it�did�not�have�selective�value.�It’s�not,�as�the�modern�view�goes�“for�its�own�sake”�(i.e.,�no�practical�value).��
3. The�behavior�of�art�is�a�common�behavior�to�all�human�beings,�not�just�artists.�It’s�important�to�note�that�“art”�does�not�mean�“good�art.”�
4. Art�is�valuable�because�it�gives�meaning�and�embellishes�life.�As�humans,�we�simply�cannot�bear�senselessness�or�lack�of�meaning.��
How�Art�is�Publically�Funded�Magie�(1997)�reviewed�major�sources�of�public�funding�for�the�arts.�Among�the�art�funding�sources�she�discussed,�the�following�could�apply�to�roadway�construction�art�funding:�
General�fund�appropriations.�The�most�common�public�funding�mechanism.�Art�is�often�included�as�a�line�item�in�a�state,�city,�county,�etc.�budget.�Usually,�general�fund�allocations�require�strong�advocacy�and�political�support.�In�general,�support�at�the�state�and�federal�level�has�been�declining,�however�support�and�the�city,�county�and�local�level�has�been�increasing.��
Taxes�and�fees.�Many�public�organizations�have�set�up�taxes�or�fees�whose�revenue�support�or�partially�supports�the�arts.�Special�tax�districts,�sales�taxes,�property�taxes,�hotel�motel�(transient�occupancy)�taxes,�entertainment�taxes�(e.g.,�theaters,�concerts,�sports),�franchise�fees�(e.g.,�from�cable�companies),�real�estate�taxes�and�even�a�portion�of�lottery/gambling�proceeds�have�been�used�to�generate�arts�funds.��
Endowments.�This�approach�collects�money�by�similar�pubic�mechanism�as�the�“taxes�and�fees”�section,�however�the�money�is�held�onto�and�only�the�interest�payments�are�used�to�support�the�arts.��
Bonds.�Funding�for�infrastructure�can�be�large�and�many�public�organizations�have�issued�bonds�for�the�express�purposes�of�supporting�art�and�culture�infrastructure.�For�instance,�the�Rock�and�Roll�Hall�of�Fame�and�Museum�was�built�largely�with�bond�funding.���
Percent�for�art�programs.�These�programs�specify�that�a�percentage�(often�1%)�of�capital�construction�costs�for�a�new�or�renovated�building�be�set�aside�for�artwork.�These�programs�began�in�the�1960s�but�now�there�are�more�than�135�state�and�locally�funded�programs�in�the�U.S.��
Transportation�mitigation�or�enhancement�funds.�While�public�art�in�roadway�construction�is�still�developing,�public�organizations�often�support�art�through�mitigation�or�enhancement�funds�that�are�dedicated�to�add�value�to�property�and�areas�that�have�been�negatively�impacted�by�roadway�construction.���
Corporate�support.�Corporate�sponsors�have�often�been�instrumental�in�art�programs�and�infrastructure�to�support�such�programs.�However,�corporate�sponsorship�has�not�been�heavily�used�in�roadway�related�art.��
�Examples�of�Art�in�Roadway�Projects�The�following�figures�show�some�examples�of�how�art�has�been�incorporated�into�roadway�projects.��
272

Greenroads™ Manual v1.5 Access & Equity
AE-9 Cultural Outreach
�
Figure�AE�9.3:�Art�incorporated�into�the�fascia�for�an�I�5�freeway�wall�associated�with�an�expansion�project�on�I�5�near�its�intersection�with�SR�16�in�Tacoma,�WA.�
�
�Figure�AE�9.4:�Seattle�to�Bremerton�ferry�tunnel�in�Bremerton,�WA.��Photo�from�the�Washington�State�Department�of�Transportation.�
273

Access & Equity Greenroads™ Manual v1.5
Cultural Outreach AE-9
�Figure�AE�9.5:�James�Angus,�Ellipsoidal�Freeway�Sculpture�(2008)�
Eastlink�freeway:�Nunawading�to�Frankston,�Melbourne.�Photo�from�the�Roslyn�Oxley9�Gallery�(http://www.roslynoxley9.com.au/artists/5/James_Angus/1116/41258).��
�
GLOSSARY
Art� The�act�of�making�special.United�States�National�Register�of�Historic�Places�
Official�list�of�U.S.�historic�places�worthy�of�preservation.�Authorized�by�the�National�Historical�Preservation�Act�of�1966�and�maintained�by�the�National�Park�Service.�
�
REFERENCES American�Society�of�Civil�Engineers�(ASCE).�(2009).�Historic�Civil�Engineering�Landmark�Program.�
http://content.asce.org/history/ce_landmarks.html.�Accessed�22�December�2009.��
City�of�Seattle�(2009b).�Permanently�Sited:�Streetscapes.�http://www.seattle.gov/arts/publicart/permanent.asp?cat=3.�Accessed�22�December�2009.��
City�of�Seattle.�(2009a).�Public�Art�Ordinance.�http://www.seattle.gov/arts/publicart/ordinance.asp.�Accessed�22�December�2009.��
Dissanayake,�E.�(1980).�Art�as�a�Human�Behavior:�Toward�an�Ethological�View�of�Art.�Journal�of�Aesthetics�and�Art�Criticism�38(4),�397�406.�http://ellendissanayake.com/publications/pdf/EllenDissanayake_5624714.pdf.���
Hawaii�State�Foundation�on�Culture�and�the�Arts.�(2009).�Art�in�Public�Places.�http://hawaii.gov/sfca/grants.php?article_id=17.�Accessed�22�December�2009.�
Heartney,�E.,�&�New�York�Dept.�of�Cultural�Affairs.�(2005).�City�art:�New�York's�Percent�for�Art�Program.�London:�Merrell.��
Magie,�D.�(1997).�Arts�Funding�into�the�21st�Century.�Essay�prepared�for�Creative�America,�a�report�by�the�President’s�Committee�on�the�Arts�and�the�Humanities,�Washington,�D.C.���
274

Greenroads™ Manual v1.5 Access & Equity
AE-9 Cultural Outreach
Oregon�Arts�Commission.�(2009).�Oregon’s�Percent�for�Art�Program:�A�Public�Legacy.�http://www.oregonartscommission.org/pdf/oac_connections_percent.pdf.�Accessed�22�December�2009.��
Sound�Transit.�(2009).�Public�Art�Projects.�Sound�Transit,�Seattle,�WA.�http://www.soundtransit.org/x1250.xml.�Accessed�22�December�2009.�
Washington�State�Arts�Commission.�(2009).�Art�in�Public�Places�–�1/2�of�1%.�http://www.arts.wa.gov/public�art/percent.shtml.�Accessed�22�December�2009.��
� �
275

Access & Equity Greenroads™ Manual v1.5
Cultural Outreach AE-9
�
�
�
�
�
�
276

Greenroads Manual v1.5 © 2011
�
�
�
�
�
�
CONSTRUCTION ACTIVITIES
� �
277

Greenroads Manual v1.5 © 2011
� �
278

Greenroads™ Manual v1.5 Construction Activities
CA-1 Quality Management System
QUALITY MANAGEMENT SYSTEM GOAL Improve�construction�quality�by�using�a�contractor�that�has�a�formal�quality�management�process.��
CREDIT REQUIREMENTS The�prime�contractor,�design�builder�or�construction�management�firm�shall�have�a�documented�quality�management�system�(QMS)�for�the�entire�company�or�at�least�the�portion(s)�of�the�company�participating�in�the�project.�The�QMS�must�be�in�place�for�the�duration�of�project�construction.�As�a�minimum,�the�QMS�and�its�documentation�shall�meet�the�requirements�of�International�Standards�Organization�(ISO)�9001:2008�or�ISO�9001:2000.���
Details
The�prime�contractor,�design�builder�or�construction�management�firm�is�considered�to�have�a�documented�QMS�if�it�is:�
� Is�ISO�9001:2008�or�ISO�9001:2000�certified�� Has�a�QMS�that�meets�ISO�9001:2008�or�ISO�9001:2000�requirements�but�is�not�
formally�certified�� The�recipient�of�the�Malcolm�Baldrige�National�Quality�Award�(any�year)�
DOCUMENTATION Submit�one�(1)�of�the�following�items:�
1. Documentation�of�the�ISO�9001:2008�or�ISO�9001:2000�certification�for�the�prime�contractor,�design�builder�or�construction�management�firm�
2. A�copy�of�the�prime�contractor,�design�builder�or�construction�management�firm’s�QMS�documentation�to�include:�
� Quality�policy�and�objective�� Quality�manual�� Listing�of�documented�procedures�� Listing�of�records�retained�in�accordance�with�their�QMS�
3. Documentation�of�the�Malcolm�Baldrige�National�Quality�Award�awarded�to�the�prime�contractor,�design�builder�or�construction�management�firm�
CA-1
2 POINTS
RELATED CREDITS
� PR�1�Environmental�Review�Process�
� PR�4�Quality�Control�Plan�
� PR�11�Educational�Outreach�
� EW�1�Environmental�Management�System
� CA�2�Environmental�Training�
SUSTAINABILITY COMPONENTS
� Extent�� Expectations�� Experience�� Exposure�
BENEFITS
� Improves�Human�Health�&�Safety�
� Improves�Accountability�
� Increases�Awareness�
279

Construction Activities Greenroads™ Manual v1.5
Quality Management System CA-1
APPROACHES & STRATEGIES
� Have�a�prime�contractor�with�ISO�9001:2008�or�ISO�9001:2000�certification.��� Have�a�prime�contractor�with�a�documented�QMS�that�meets�the�requirements�of�ISO�9001:2008�or�ISO�
9001:2000.��� Select�a�prime�contractor�that�has�won�the�Malcolm�Baldrige�National�Quality�Award.�As�of�2009,�no�prime�
contractor,�design�builder�or�construction�management�firm�has�won�this�award.���
Example Quality Manuals
While�it�is�not�possible�to�present�an�entire�QMS,�there�are�many�examples�of�key�QMS�documents�available�on�the�Web�including�the�following�quality�manuals:�
� R&D�Systems:�http://www.rndsystems.com/DAM_public/5722.pdf��� Continental�Steel�&�Tube�Co.:�http://www.continentalsteel.com/pdf/continental�steel�quality�manual.pdf�� Cirrus�logic:�http://cirrus.com/en/pubs/misc/Quality_Manual.pdf�� PAR�Nuclear�supplier�quality�manual:�http://www.parnuclear.com/PaRNuclear/docs/SQM.pdf�� Westinghouse�Nuclear:�
http://www.westinghousenuclear.com/Our_Company/Quality_Management_System/docs/E6_qms.pdf���There�are�also�companies�that�will�sell�quality�manual�templates�to�assist�in�getting�started.��
POTENTIAL ISSUES
1. Smaller�firms�may�not�be�able�to�afford�the�ISO�certification�process.�2. Documentation�of�a�QMS�is�not�the�same�has�having�an�effective�QMS,�however�collection�of�documentation�
(in�lieu�of�an�actual�audit)�is�an�efficient�way�of�gathering�evidence�of�an�effective�QMS.�
RESEARCH According�to�ISO�(2009),�a�QMS�is�refers�to�what�the�organization�does�to�manage�its�processes,�or�activities,�so�that�its�products�or�services�satisfy�the�customer's�quality�requirements�and�comply�with�regulations.�One�of�the�more�comprehensive�descriptions�of�such�a�system�comes�from�ISO�in�their�9000�family�of�standards.��
ISO�9000�According�to�ISO�(2009),�“The�ISO�9000�family�of�standards�represents�an�international�consensus�on�good�quality�management�practices.�It�consists�of�standards�and�guidelines�relating�to�quality�management�systems�and�related�supporting�standards.”�Essentially,�it�is�a�formal�description�of�a�QMS�and�all�that�is�involved�in�its�creation,�implementation�and�use.�Just�as�ASTM�International�or�the�American�Association�of�State�Highway�and�Transportation�Officials�(AASHTO)�set�standards,�so�does�ISO.��
Certification:�ISO�9001�While�the�entire�QMS�standard�is�contained�in�the�ISO�9000�family�of�standards,�the�actual�requirements�for�certification�are�contained�in�ISO�9001.�Therefore,�organizations�are�certified�in�accordance�with�ISO�9001;�the�number�is�appended�with�the�year�of�the�standard�that�applied�when�the�organization�was�certified.�The�most�current�version�is�ISO�9001:2008,�however�many�organizations�still�have�ISO�9001:2000�certifications�(the�prior�version).���
ISO�does�not�certify�organizations�itself.�Most�countries�have�formed�formal�groups�or�“certification�bodies,”�which�audit�organizations�applying�for�ISO�9001�certification.�Through�mutual�agreements�these�bodies�ensure�that�certification�audit�standards�are�relatively�the�same�worldwide.�Certification,�once�granted,�must�be�renewed�at�standard�intervals;�often�three�years.��
280

Greenroads™ Manual v1.5 Construction Activities
CA-1 Quality Management System
ISO�does�not�require�certification�and�many�organizations�just�choose�to�follow�ISO�9000�requirements�but�forego�certification.�However,�it�is�common�practice�in�many�parts�of�the�world�(e.g.,�western�Europe,�China,�India,�etc.)�to�require�ISO�certification�as�a�prerequisite�for�doing�business.�Therefore,�countries�that�require�this�usually�see�the�highest�certification�rates.�
Arguments�for�Certification�Arguments�for�certification�typically�cite�the�general�idea�that�proper�management�of�quality�improves�business,�which�can�be�measured�by�larger�market�share,�sales�growth,�higher�margins,�competitive�advantage�and�other�metrics.��
Arguments�against�Certification�Arguments�against�certification�claim�that�the�actual�act�of�certification�and�existence�of�documentation�do�not,�in�and�of�themselves,�guarantee�improved�business.�Further,�they�point�out�that�ISO�9001�certification�can�be�an�expensive�process�that�does�not�guarantee�results.��
Certification�Cost�According�to�the�survey�completed�by�Yates�and�Aniftos�(1997),�the�cost�of�the�ISO�certification�process�ranged�from�$0�to�$500,000,�but�certification�costs�generally�range�from�$300,000�to�$400,000.�This�reported�data�range�is�unclear�due�to�how�the�survey�question�was�posed.�It�is�possible�that�some�companies�reported�additional�costs�including�internal�training�budgets,�neglected�the�cost�of�the�certification�itself,�or�that�some�did�not�have�any�additional�costs.�Certification�through�ISO�requires�approximately�12�to�18�months,�on�average.�
Worldwide�ISO�9001�Certification�Data�from�2006�show�worldwide�ISO�9001�certifications�at�625,742�in�170�different�countries�and�growing�(Figure�CA�1.1).�In�December�2006�the�U.S.�had�44,883�certifications,�which�ranked�sixth�worldwide�(Figure�CA�1.2).�ISO�9001�certification�is�far�more�popular�in�Europe�and�the�Far�East�(Eastern�Asia)�with�46%�and�34%�of�worldwide�certifications�respectively.�North�America�(consisting�of�only�the�U.S.,�Canada�and�Mexico)�comprised�almost�7%�of�the�worldwide�total.�According�to�Yates�and�Aniftos�(1996,�1997),�very�little�participation�by�organizations�within�the�United�States�has�been�noted.�The�majority�of�the�ISO�standard�stakeholders�are�in�the�European�community�and�the�bulk�of�influence�on�the�globalization�of�such�standards�comes�from�a�group�called�the�European�Committee�for�Standardization�(CEN).��
281

Construction Activities Greenroads™ Manual v1.5
Quality Management System CA-1
�
Figure�CA�1.1:�ISO�9001�certification�worldwide�growth�2002�2006�(data�from�ISO,�2006).��
�
Figure�CA�1.2:�Top�10�countries�in�terms�of�number�of�ISO�9001�certifications�in�2006�(data�from�ISO,�2006).�
�
ISO�9001�Certification�in�the�U.S.�Construction�Industry�ISO�9000�enjoys�substantial�worldwide�popularity,�however�relatively�few�U.S.�construction�firms�are�certified.�The�2006�ISO�Survey�of�Certifications�reported�80,432�construction�companies�certified�worldwide.�Of�the�39�industrial�sectors�listed�construction�ranked�first�with�12.9%�of�the�total�certified�companies.�However,�relatively�few�
167,124�
497,919�
660,132�
773,867�
897,866�
�
100,000�
200,000�
300,000�
400,000�
500,000�
600,000�
700,000�
800,000�
900,000�
1,000,000�
2002 2003 2004 2005 2006
Num
ber�o
f�ISO�900
1�Ce
rtificatio
ns�W
orldwide
Year
162,259�
105,799�
80,518�
57,552�
46,458�
44,833�
40,967�
40,909�
21,349�
18,922�
� 20,000� 40,000� 60,000� 80,000� 100,000� 120,000� 140,000� 160,000� 180,000�
China
Italy
Japan
Spain
Germany
USA
India
UK
France
Netherlands
Number�of�ISO�9001�Certifications� in�December�2006
282

Greenroads™ Manual v1.5 Construction Activities
CA-1 Quality Management System
construction�firms�in�the�U.S.�have�adopted�ISO�9000�standards�and�become�certified�(Chini�&�Valdez,�2003).�Reasons�given�for�this�lack�of�adoption�tend�to�focus�on�the�idea�that�ISO�9000�is�not�promoted�or�required�by�U.S.�clients�or�government�like�it�is�elsewhere�(Ahmed�et�al.,�2005)�so�there�is�no�perceived�advantage�of�formal�certification.�Chini�and�Valdez�(2003)�show�evidence�of�this�when�they�found�36%�of�U.S.�certified�construction�related�firms�were�located�in�Michigan�and�another�14%�in�Ohio.�Not�coincidentally,�these�states�are�where�U.S.�automakers,�companies�that�require�ISO�9001�certification�from�those�they�contract�with,�are�largely�located�(at�least�in�2000).��
Evidence�to�support�the�positive�outcomes�of�ISO�9001�certification�generally�comes�from�surveys�of�or�interviews�with�contractors�that�are�already�ISO�certified�(e.g.,�Ahmed�et�al.,�2005;�Chini�&�Valdez,�2003;�Moatazed�Keivani�et�al.,�1999)�so�it�is�not�surprising�that�results�indicate�a�general�benefit�to�ISO�9001�certification.�Even�so,�there�is�ample�evidence�to�suggest�that�ISO�9000�is�at�least�applicable�to�construction�and�can�be�adopted�(Nee,�1996;�Chung,�1999)�and�arguments�have�been�made�that�it�can�help�standardize�corporate�procedures�(Chung,�1999),�reduce�waste,�improve�quality�and�provide�independent�verification�that�such�things�are�being�done�(Love�&�Li,�2000).�A�comparison�of�the�U.S.�and�Hong�Kong�construction�industries�(Ahmed�et�al.,�2005)�found�that�promotion�of�ISO�9001�certification�amongst�clients�and�government�is�minimal�in�the�U.S.�while�it�is�prominent�in�Hong�Kong.��
GLOSSARY
ISO� International�Standards�OrganizationQMS� Quality�process�management�systemQuality� Degree�to�which�a�set�of�inherent�characteristics�fulfills�requirements.�This�is�
a�broad�definition.�Note�that�in�this�context�is�does�not�refer�to�a�degree�of�excellence.��
REFERENCES Chini,�A.R.�and�Valdez,�H.E.�(2003).�ISO�9000�and�the�U.S.�Construction�Industry.�J.�of�Management�in�Engineering,�
19(2),�pp.�69�77.�
Chung,�H.�W.�(1999).�Understanding�quality�assurance�in�construction:�a�practical�guide�to�ISO�9000,�E�&�F�Spon,�London,�UK.�
International�Organization�for�Standardization�(ISO).�(2006).�The�ISO�Survey�of�Certifications�2006.�ISO,�Geneva,�Switzerland.��
International�Organization�for�Standardization�(ISO).�(2009).�ISO�9000�essentials.�ISO�website.�Available�at�http://www.iso.org/iso/iso_catalogue/management_standards/iso_9000_iso_14000/iso_9000_essentials.htm����Accessed�29�October�2009.�
International�Organization�for�Standardization.�ISO�9001:2008�Quality�management�systems���Requirements.�1st�ed.�2008:�IHS.�
Ketola,�J.,�&�Roberts,�K.�(2008).�ISO�9001:2008�Update:�The�year�2008�revision�of�ISO�9001�has�made�its�way�to�a�Final�Draft�International�Standard.�Quality�Digest.�20,�33�36.�
Love,�P.�E.�D.�&�Li,�H.�(2000).��Overcoming�the�problems�associated�with�quality�certification.’�Construction�Management�and��Economics,�18(2),�pp.�139�149.�
Moatazed�Keivani,�R,;�Ghanbari�Parsa,�A.R.,�&�Kagaya,�S.�(1999).�ISO�9000�standards:�perceptions�and�experiences�in�the�UK�construction�industry.�Construction�Management�and�Economics,�17,�pp.�107�119.��
Nee,�P.A.�(1996).�ISO�9000�in�Construction.�Wiley,�New�York,�NY.�
283

Construction Activities Greenroads™ Manual v1.5
Quality Management System CA-1
Yates,�J.�K.,�&�Aniftos,�S.�(1997).�International�Standards�and�Construction.�Journal�of�Construction�Engineering�and�Management.�123�(2),�127.�
Yates,�J.�K.,�&�Aniftos,�S.�C.�(1996).�International�Standards:�The�US�Construction�Industry's�Competitiveness.�Cost�Engineering�:�a�Publication�of�the�American�Association�of�Cost�Engineers.�38�(7),�32.�
284
Greenroads™ Manual v1.5 Construction Activities
CA-2 Environmental Training
ENVIRONMENTAL TRAINING GOAL Provide�construction�personnel�with�the�knowledge�to�identify�environmental�issues�and�best�practice�methods�to�minimize�environmental�impacts.�
CREDIT REQUIREMENTS Provide�an�environmental�training�plan�that�is�customized�to�the�project,�including:�
1. List�of�the�types�of�project�personnel�to�be�trained.�This�may�be�a�list�by�job�type�or�by�employer�need�not�contain�actual�employee�names.�
2. Description�of�the�types,�goals�and�objectives�of�training�to�be�given.�3. A�process�to�track�training�efforts,�including�dates,�means�(e.g.,�online,�classroom,�
field�training),�topics,�the�identification�of�those�participating�in�training,�and�attendance�numbers�
4. A�process�to�measure�of�training�effectiveness�such�as�self�assessment,�pre�test�and�post��test,�and�productivity�measurement.�
Details
The�environmental�awareness�training�plan�shall�address�the�following�training�elements,�or�state�why�any�are�inappropriate:�
a. Permit�conditions,�performance�standards,�environmental�commitments,�and�environmental�regulations�related�to�the�project�
b. Overall�importance�of�environmental�issues�(i.e.,�ecological�impact�of�actions)�c. Identifying�work�activities�that�present�the�greatest�risk�for�compliance�(i.e.,�
specific�environmental�sensitivities�of�the�project)�d. Required�environmental�qualifications�and�certifications�e. Environmental�records�management�f. Environmental�compliance�monitoring�and�reporting�procedures�g. Unanticipated�historic�resource�or�archaeological�discoveries�h. Environmental�notification�triggers�and�emergency�response�procedures�i. Oil�spill�prevention�and�response�procedures�j. Construction�stormwater�management�(including�monitoring�sites�and�
monitoring�and�reporting�procedures)�k. Erosion�and�sediment�control�procedures�(including�dust�mitigation)�l. In�water�work�m. Reduction�of�air�pollution�n. Management�of�known�or�suspected�contamination�o. Waste�management�and�recycling�p. Hazardous�materials�management�q. Management�of�noise�impacts�r. Littering�and�good�housekeeping�s. Plan�for�training�subcontractors�and�field�personnel�not�immediately�involved�at�
project�start�or�planning.�These�personnel�must�also�receive�training.�
DOCUMENTATION � A�copy�of�the�environmental�training�plan�and�any�updates�to�that�plan�that�occur�
throughout�the�construction.�� A�signed�letter�from�an�owner’s�representative�stating�that�the�contractor(s)�
followed�the�environmental�training�plan�as�submitted�and�updated.�
CA-2
1 POINT
RELATED CREDITS
� PR�11�Educational�Outreach�
� EW�1�Environmental�Management�System
� CA�1�Quality�Management�System
SUSTAINABILITY COMPONENTS
� Ecology�� Equity�� Expectations�� Experience�� Exposure�
BENEFITS
� Reduces�Air�Emissions�
� Reduces�Water�Pollution�
� Reduces�Solid�Waste�� Improves�Human�
Health�&�Safety�� Improves�
Accountability�� Increases�Awareness�
285

Construction Activities Greenroads™ Manual v1.5
Environmental Training CA-2
APPROACHES & STRATEGIES
� Provide�environmental�training�as�part�of�standard�orientation�training�to�a�construction�project.�Done�in�combination�with�construction�health�and�safety�training�can�ensure�that�all�personnel�are�reached�before�entering�the�work�site,�and�can�reduce�training�cost�by�avoiding�multiple�training�sessions.��
� Deliver�activity�specific�toolbox�or�tailgate�talk�topics�onsite,�targeting�the�pertinent�construction�personnel�prior�to�each�new�activity.�Toolbox�environmental�talks�might�rely�on�commercially�available�presentations,�supplemented�by�customized�project�and�work�location�specific�topics.�
� Deliver�environmental�training�on�regular�or�as�needed�bases�via�teleconferences,�periodic�e�mail�environmental�alerts,�environmental�awareness�meetings,�design�review�meetings,�weekly�project�meetings,�pre�construction�meetings�for�each�work�phase/activity,�and�field�discussions�during�site�monitoring�and�inspection.�
� Focus�environmental�training�components�on�target�audiences�with�appropriate�frequencies�as�follows:�
� Environmental�Stewardship�training:�Discuss�stewardship�principles�at�the�construction�kick�off�meeting.��� Baseline�environmental�awareness�training:�Provide�environmental�orientation�for�all�field�personnel,�
personally�delivered�prior�to�entry�into�work�phases�via�a�consistent�audiovisual�presentation;�address�permit�conditions,�performance�standards,�environmental�commitments,�environmental�regulations,�and�overall�importance�of�environmental�issues.�
� Environmental�design�training:�Deliver�this�training�to�designers�at�design�review/validation�meetings�during�the�construction�phase�(i.e.,�design�build�projects).�
� Project�management�team�training:�Conduct�training�during�steering�meetings.�Discuss�upcoming�construction�schedule�and�corresponding�environmental�compliance�challenges.�Address�environmental�commitments�and�applicable�content�of�environmental�guidance�manuals.�Orient�discussion�to�the�specific�and�appropriate�work�stages,�time�of�year,�or�work�activity.�
� Construction�training:�Meet�onsite�to�give�construction�workers�tool�box/tailgate�training�in�specific�activities�prior�to�initiating�construction.�Highlight�pre�construction�and�awareness�of�compliance�needs�and�how�to�support�the�zero�violations�goal.�Provide�pre�activity�environmental�compliance�pocket�checklists�for�improved�environmental�performance.�
� Environmental�staff�training:�Provide�the�environmental�team�with�bi�weekly�or�as�needed�specific�instruction�in�monitoring�tasks,�performance�documentation�and�compliance,�and�environmental�compliance�support�procedures.�
� Skill��and�need�specific�training:�Ensure�competency�among�selected�environmental�staff�and�crews�in�water�quality�monitoring�procedures,�erosion�and�sediment�control�inspections,�in�water�work,�etc.�
Examples
Washington�State�Department�of�Transportation�(WSDOT)�WSDOT’s�Environmental�Management�System�delivers�environmental�training�to�provide�tools�and�information�to�assist�staff�in�ensuring�that�projects�stay�in�compliance�with�environmental�laws,�regulations,�and�policies�(WSDOT,�2008a).�A�key�component�of�their�Construction�Environmental�Management�Program�is�training�the�appropriate�personnel�on�the�applicable�procedures�to�ensure�compliance�with�environmental�requirements�during�construction.�Training�sessions�target�various�audiences,�including�environmental�practitioners,�construction�staff,�and�maintenance�and�operations�staff.�For�example:�
� Drainage�design�lead�engineers�who�are�responsible�for�stormwater�design�(including�downstream�analysis,�bridge�scour�analysis,�and�floodplain�fill�and�hydraulic�impact�mitigation�evaluations)�must�complete�WSDOT's�training�course�in�the�Highway�Runoff�Manual.��
� WSDOT�trains�contractors�to�ensure�water�quality�is�monitored�in�accordance�with�the�Highway�Runoff�Manual�protocols,�project�specific�permit�conditions,�performance�standards,�and�environmental�commitments.��
� Erosion�and�sediment�control�design�must�be�prepared�by�an�individual�who�has�successfully�completed�WSDOT’s�Construction�Site�Erosion�and�Sediment�Control�course.�
286

Greenroads™ Manual v1.5 Construction Activities
CA-2 Environmental Training
Some�types�of�environmental�training�are�required�by�regulation.�For�example,�spill�prevention,�containment,�and�response�training�for�all�spill�responders�is�required�in�Washington�in�accordance�with�Washington�Administrative�Code�(WAC)�296�824.�Hazardous�materials�surveys,�including�asbestos�containing�materials/lead�based�paint�(ACM/LBP)�must�be�completed�by�an�Asbestos�Hazard�Emergency�Response�Act�(AHERA)�certified�inspector.�
Measuring�Performance�of�Environmental�Training�Research�suggests�that�environmental�training�as�a�component�of�environmental�management�systems�(e.g.,�ISO�14001�standards)�improves:�(1)�employee�awareness,�(2)�operational�efficiency,�(3)�managerial�awareness,�and�(4)�operational�effectiveness�(Rondinelli�&�Vastag,�2000;�Sroufe,�2003).�
DOTs�prepare�quarterly�and�annual�reports�on�program�wide�environmental�performance.�For�example,�Washington�DOT’s�Gray�Notebook�indicates�environmental�performance�through�Environmental�Compliance�Assurance�metrics�(WSDOT,�2008b).�Washington�DOT�believes�that�its�Environmental�Compliance�Assurance�Procedures�and�the�environmental�compliance�for�construction�inspectors�training�course�have�raised�the�general�awareness�of�non�compliance�events,�with�events�being�cited�and�quickly�resolved�with�increasing�numbers.��
POTENTIAL ISSUES
1. Construction�personnel�may�turn�over�during�the�project.�2. Some�subcontractors,�operators�and�drivers�may�be�onsite�only�once�or�infrequently.�
RESEARCH This�research�section�covers�the�idea�of�environmental�training�in�two�distinct�sections.�First,�the�value�of�training�in�general�is�addressed�(e.g.,�why�should�any�organization�spend�money�on�training?)�and�then�examples�of�and�reasons�for�construction�related�environmental�training�are�discussed.�
The�Value�of�Training�in�General�Knowledge�is�a�vital�organizational�asset.��This�is�the�essential�unstated�assumption�associated�with�almost�all�training�discussions.��While�American�corporations�spend�in�excess�of�$50�billion�annually�on�training�(Galvin,�2002)�and�numerous�authors�espouse�the�virtue�and�necessity�of�training,�few�make�an�effort�to�actually�show�its�value.�This�section�highlights�the�fundamental�premise�for�continued�and�even�increased�support�for�training:�it�is�an�investment�in�a�valuable�commodity�that�produces�high�returns.��
Knowledge�is�Valuable�Today,�in�the�information�age,�organizations�are�routinely�valued�not�on�their�physical�but�rather�their�intellectual�capital.��Edvinsson�and�Malone�(1997)�define�intellectual�capital�as�“the�possession�of�the�knowledge,�applied�experience,�organizational�technology,�customer�relationships�and�professional�skills�that�provide�[an�organization]�with�a�competitive�edge�in�the�market.”��Bassi�and�Van�Buren�(1999)�point�out�that�“intellectual�capital�is�the�only�source�of�competitive�advantage�within�a�growing�number�of�industries.”��For�instance,�the�market�value�of�Microsoft�far�exceeds�the�value�of�its�physical�assets.��To�be�sure,�much�of�this�value�is�based�on�speculation,�but�much�is�also�based�on�Microsoft’s�intellectual�capital�–�what�it�knows.�
Training�is�one�of�the�chief�methods�of�maintaining�and�improving�intellectual�capital.��Because�of�this,�an�organization’s�training�can�affect�its�value.��Bassi�and�Van�Buren�(1999)�found�training�as�a�percentage�of�payroll�to�be�significantly�correlated�with�the�market�to�book�value�of�publicly�traded�companies.��Where�the�average�U.S.�employer�spent�about�0.9%�of�payroll�on�education�and�training�(Bassi�et�al.,�1996),�training�magazine’s�2002�top�100�training�companies�averaged�4%�with�Pfizer�ranking�first�at�14%.�
287

Construction Activities Greenroads™ Manual v1.5
Environmental Training CA-2
Training�is�an�Investment�General�accounting�standards�classify�training�as�an�expense.��However,�training�is�really�an�investment:�an�organization�typically�invests�upfront�to�train�its�employees�(in�the�form�of�enrollment�fees,�travel�expenses�and�opportunity�cost�of�the�employees’�time)�and,�in�return,�expects�future�returns�(in�the�form�of�increased�knowledge,�skills�and�productivity).��As�with�any�other�investment,�if�the�returns�outweigh�the�investment,�training�is�a�worthwhile�endeavor.���
Training�is�also�an�investment�from�the�employee’s�perspective.��Training�increases�skills�and�knowledge,�which�can�lead�to�better�pay�or�promotion.��So�who�benefits�most�from�the�training�investment:�the�employee�with�increased�wages�and/or�promotion�or�the�employer�with�increased�productivity?��Loewenstein�and�Spletzer�(1998)�researched�this�question�and�concluded,�“...the�effect�of�an�hour�of�training�on�productivity�growth�is�about�five�times�as�large�as�the�effect�on�wage�growth.”��Therefore,�employers�“reap�almost�all�the�returns�to�company�training”�(Bartel,�2000).��This�may�be�oversimplifying�because�employees�generally�view�training�as�either�a�gift�from�the�employer�or�at�least�a�sign�of�commitment�on�the�part�of�the�employee,�which�is�important�to�job�satisfaction�(Barrett�&�O’Connell,�2001).�
In�sum,�both�the�employee�and�employer�benefit�from�the�training�investment.��The�question�now�shifts�to�one�of�measurement:�do�the�returns�on�training�outweigh�the�investment?�
Training�Return�on�Investment�(ROI)�When�calculated�using�sound�methodology,�training�has�been�shown�to�provide�significant�return�on�investment:�on�the�order�of�5�to�200�percent.��The�problem�is�that�methods�used�to�quantify�training�ROI�can�often�be�suspect�or�even�outright�self�promotion.��Furthermore,�it�is�often�very�difficult�to�quantify�the�effects�of�training.��For�instance,�one�of�training’s�effects�can�be�increased�job�satisfaction,�which�is�difficult�if�not�impossible�to�quantify.��Intuitively�we�know�this�is�important�in�retaining�good�employees;�however�it�will�not�show�up�on�a�ROI�calculation.���
In�2000,�Bartel�provided�one�of�the�best�objective�looks�at�the�value�of�training�to�the�employer.��She�looked�at�10�large�data�set�surveys�and�16�individual�case�studies�in�an�attempt�to�determine�the�employer’s�return�on�investment�for�employee�training.��She�found�the�following:�
� Methods�using�large�data�sets�to�compare�many�different�organizations�estimated�training�ROI�from�7�to�50�percent.�
� Individual�case�studies�estimated�training�ROI�from�100�to�5900�percent.��Bartel�believes�the�high�ROIs�in�this�category�are�based�on�faulty�methodology.��Her�in�depth�analysis�of�two�well�constructed�internal�case�studies�revealed�a�100�to�200�percent�ROI.�
Therefore,�even�the�most�conservative�estimate�puts�training’s�ROI�at�7�percent�–�an�acceptable�rate�of�return�by�most�standards.��Additionally,�although�it�is�not�appropriate�to�generalize�based�on�the�results�of�two�case�studies,�it�can�be�said�that�based�on�Bartel’s�in�depth�analysis�of�two�well�constructed�internal�case�studies,�training’s�ROI�can�be�much�higher:�approaching�100�to�200�percent.�
Summary�Training�is�a�valuable�commodity�that,�if�viewed�as�an�investment�rather�than�an�expense,�can�produce�high�returns.��While�it�is�true�that�training�costs�money�and�uses�valuable�employee�time�and�resources,�studies�tend�to�show�training�provides�a�positive�return�on�investment�–�sometimes�in�the�neighborhood�of�several�hundred�percent.��Therefore,�although�training�might�seem�like�a�luxury�expense�in�tight�financial�times,�it�is,�in�fact,�one�of�the�most�sure�and�sound�investments�available.�
Environmental�Training�Environmental�training�is,�for�the�most�part,�a�response�to�public�demand�for�better�environmental�performance�in�infrastructure�construction.�This�is�generally�seen�in�two�ways:�(1)�public�owner�agencies�have�begun�to�require�not�only�that�projects�meet�environmental�regulations�but�also�that�they�incorporate�employee�environmental�training�
288

Greenroads™ Manual v1.5 Construction Activities
CA-2 Environmental Training
in�order�to�improve�understanding�and�compliance,�and�(2)�private�firms�(e.g.,�construction�firms)�using�training�programs�as�a�way�to�gain�competitive�advantage�based�on�owner�requirements�and�also�as�a�component�in�their�approach�to�addressing�owner�and�shareholder�(in�the�case�of�public�companies)�demands�for�environmental�accounting.��
Owner�Agency�Training�and�Required�Training�for�Contract�Work�Many�state�departments�of�transportation�(DOTs)�provide�environmental�training�to�their�employees�and�some�are�beginning�to�require�training�of�certain�key�personnel�from�contractors�working�on�public�projects.��In�a�2002�survey�of�state�DOTs�(Venner�Consulting�&�Parsons�Brinderhoff,�2004),�24�were�performing�general�nature�resources�and/or�regulatory�training�for�engineers�and/or�construction�personnel;�while�about�60%�offered�general�training�in�the�National�Environmental�Policy�Act�(NEPA),�public�involvement,�environmental�processes�and�best�management�practices�(BMPs)�for�maintenance�and�water�quality.��
It�is�also�becoming�more�common�for�owner�agencies�to�require�contractor�training�in�stormwater�pollution�prevention�methods,�commonly�referred�to�as�temporary�erosion�and�sediment�control�(TESC)�on�construction�sites.�Typically�a�supervisor�NPDES�to�have�a�trained�erosion�and�sediment�control�person�on�site�to�manage�a�project’s�temporary�erosion�and�sediment�control�efforts.�For�example,�for�construction�in�high�quality�or�impaired�waters,�Tennessee�requires�the�contractor’s�erosion�prevention�and�sediment�control�inspector�and�environmental�supervisor�to�have�completed�a�specified�formal�course�(or�equivalent)�(TDOT,�2005).��
Construction�Firm�Training�Construction�firms�have�begun�to�recognize�a�need�to�formally�manage�their�impact�on�the�environment�and�have�included�training�programs�(both�company�wide�and�project�specific)�to�help.�Reasons�for�having�an�environmental�training�program�include:��
a. Compliance�help.�The�number�and�complexity�of�existing�U.S.�environmental�regulations�and�their�associated�costly�fines�if�violated�(see�U.S.�EPA,�2005)�necessitates�an�organized�approach�to�understanding�and�complying�with�these�regulations.�In�a�Hong�Kong�study�(Tam�et�al.,�2006)�“management�and�training”�was�identified�as�the�most�important�evaluation�factor�for�assessing�environmental�issues�in�construction�projects.�
b. �Showing�commitment�to�the�public.�Publically�held�companies,�especially�those�listed�in�European�exchanges,�are�under�pressure�to�show�their�sustainability�efforts�to�their�stockholders.�These�often�include�“environmental�management�systems”�(EMS)�–�see�EW�1.�A�fundamental�component�of�an�EMS�is�an�employee�training�plan�(Christini�et�al.,�2004).�Thus,�those�companies�with�EMSs�or�those�progressing�towards�them�have�a�need�for�environmental�training.�
c. Competitive�advantage.�Some�public�contracts,�especially�design�build�ones,�have�a�scoring�system�that�awards�environmental�considerations�beyond�regulatory�compliance.�Also,�some�clients�may�soon�require�contractors�to�have�an�EMS�(including�the�training�component)�in�place�(Christini�et�al.,�2004).�
REFERENCES Barrett,�A.�&�O’Connell,�P.J.��(April�2001).��Does�Training�Generally�Work?��The�Returns�to�In�Company�Training.��
Industrial�and�Labor�Relations�Review,�54(3).��pp.�647�662.���
Bartel,�A.P.��(July�2000).��Measuring�the�Employer’s�Return�on�Investments�in�Training:�Evidence�from�the�Literature.��Industrial�Relations,�39(3).��pp.�502�524.���
Bassi,�L.J.�&�Van�Buren,�M.E.��(1999).��Valuing�investments�in�intellectual�capital.��International�Journal�of�Technology�Management,�18(5/6/7/8).��pp.�414�432.�
Bassi,�L.J.;�Gallagher,�A.L.�&�Schroer,�E.��(1996).��The�ASTD�Training�Data�Book.��American�Society�for�Training�and�Development.��Alexandria,�VA.�
289
Construction Activities Greenroads™ Manual v1.5
Environmental Training CA-2
Christini,�G.;�Fetsko,�M.�&�Hendrickson,�C.�(2004).�Environmental�Management�Systems�and�ISO�14001�Certification�for�Construction�Firms.�J.�of�Construction�Engineering�and�Management,�130(3),�pp.�330�336.�
Edvinsson,�L.�&�Malone,�M.S.��(1997).��Intellectual�Capital:�Realizing�Your�Company’s�True�Value�by�Finding�its�Hidden�Brainpower.��Harper�Business.��New�York,�NY.�
Galvin,�T.��(October�2002).��2001�Industry�Report.��Training,�38(10).���pp.�40�75.��
�Loewenstein,�M.A.�&�Spletzer,�J.R.��(November�1994).��Informal�Training:�A�Review�of�Existing�Data�and�Some�New�Evidence.��National�Longitudinal�Surveys�Discussion�Paper.��U.S.�Department�of�Labor,�Bureau�of�Labor�Statistics.��Washington,�D.C.��http://www.bls.gov/ore/pdf/nl940050.pdf.�
Tam,�V.W.Y.;�Tam,�C.M.;�Yiu,�K.T.W.�&�Cheung,�S.O.�(2006).�Critical�factors�for�environmental�performance�assessment�(EPA)�in�the�Hong�Kong�construction�industry.�Construction�Management�and�Economics,�24(11),�pp.�1113�1123.�
Tennessee�Department�of�Transportation�(TDOT).�(2005).�Rules�of�Tennessee�Department�of�Transportation�Construction�Division,�Chapeter�1680�5�2�Contractor�Qualifications�for�Construction�in�High�Quality�or�Impaired�Waters.�http://www.state.tn.us/sos/rules/1680/1680�05/1680�05�02.pdf.��
U.S.�Environmental�Protection�Agency�(EPA).�(2005).�Managing�Your�Environmental�Responsibilities:�A�Planning�Guide�for�Construction�and�Development.�Office�of�Compliance,�Office�of�Enforcement�and�Compliance�Assurance,�U.S.�EPA,�Washington,�D.C.��
Venner�Consulting�&�Parsons�Brinderhoff.�(2004).�Environmental�Stewardship�Practices,�Procedures,�and�Policies�for�Highway�Construction�and�Maintenance.�NCHRP�Project�25�25(04),�Transportation�Research�Board,�Washington,�D.C.��
WSDOT.�2008a.�Environmental�Management�Programs.�Washington�Department�of�Transportation,�Olympia,�WA.�http://www.wsdot.wa.gov/Environment/EMS/ems_training.htm#enviromental.�Accessed�7�December�2008.�
WSDOT.�2008b.�Measures,�Markers�and�Mileposts.�The�Gray�Notebook�28.�Washington�Department�of�Transportation,�Olympia,�WA.�
�
�
290

Greenroads™ Manual v1.5 Construction Activities
CA-3 Site Recycling Plan
SITE RECYCLING PLAN GOAL Minimize�the�amount�of�construction�related�waste�destined�for�landfill�and�promote�environmental�stewardship�through�good�housekeeping�practices�at�the�work�site.�
CREDIT REQUIREMENTS Establish,�implement,�and�maintain�a�formal�Site�Recycling�Plan�as�part�of�the�Construction�and�Demolition�Waste�Management�Plan�(CWMP)�during�construction.��
The�Site�Recycling�Plan�must�clearly�describe�the�plan�for�implementing,�communicating,�monitoring�and�maintaining�appropriate�recycling�and�diversion�practices�on�site.�The�following�topics�must�be�specifically�addressed.�
1. Expected�types,�quantities,�processing�or�disposal�facilities,�locations�of�receptacles�and�proper�handling�for�recyclable�(or�reusable)�roadway�materials�generated�from�roadway�construction�processes�such�as�(but�not�limited�to):�
� Paving�process�waste�(e.g.�hot�mix�asphalt,�concrete)�� Milling�waste,�concrete�slough�and�grindings,�cobble�� Excess�steel�rebar�and�other�metal�products�or�scraps�� Excess�plastic�pipes�and�packaging�� Excavated�soil�cuttings�and�boulders�� Land�clearing�debris�and�topsoil�� Wood�and�paper�products�(e.g.�packaging�materials,�cardboard�and�pallets)�
2. Expected�types,�quantities,�processing�or�disposal�facilities,�locations�of�receptacles��and�proper�handling�for�recyclable�(or�reusable)�materials�generated�from�mobile�office�(e.g.�job�trailer,�site�office)�activities�and�personal�worker�(household)�waste�such�as�(but�not�limited�to):�
� Paper,�copier�paper,�paper�products�� Plastic�� Aluminum�and�various�household�metals�� Glass�� Household�trash�or�compostables�
3. Communication�expectations�for�jobsite�housekeeping�practices�for�the�general�contractor�(also�intended�for�any�subcontractors)�regarding:�
� Litter�control�� Expected�types�of�site��and�worker�generated�recyclables.�� Collection�practices�for�site��and�worker�generated�recyclables.�� Locations�of�recycling�receptacles.�� Training�requirements�for�all�site�employees�and�means�of�corrective�action.�
DOCUMENTATION � Copy�of�the�Site�Recycling�Plan.�
CA-3
1 POINT
RELATED CREDITS
� PR�6�Waste�Management�Plan�
� PR�10�Site�Maintenance�Plan�
� EW�1�Environmental�Management�System
� MR�4�Recycled�Materials�
� CA�2�Environmental�Training�
SUSTAINABILITY COMPONENTS
� Ecology�� Expectations�� Exposure�
BENEFITS
� Reduces�Air�Emissions�
� Reduces�Solid�Waste� Reduces�Manmade�
Footprint�� Reduces�Lifecycle�
Costs�� Improves�
Accountability�� Increases�Awareness�
291

Construction Activities Greenroads™ Manual v1.5
Site Recycling Plan CA-3
APPROACHES & STRATEGIES
� Include�the�Site�Recycling�Plan�in�agency�contract�documents,�bid�packages,�and/or�specifications.�� Set�waste�reduction�goals�and�explicitly�state�them�in�the�Site�Recycling�Plan.�� Locate�receptacles�in�easily�accessible�or�highly�frequented�locations�on�the�jobsite.�Receptacles�should�not�be�
placed�in�areas�where�they�may�cause�harm�to�workers�or�the�local�environment.�See�PR�7�Pollution�Prevention�Plan�for�more�information.�
� Clearly�label�receptacles�and�recycling�locations.�Large�color�photos�of�what�is�recyclable�and�what�is�not�are�often�very�helpful,�especially,�for�multi�lingual�work�environments.�
� Provide�waste�receptacles�that�are�smaller�than�the�recycling�receptacles,�slightly�more�difficult�to�open,�or�slightly�more�difficult�to�access.�This�provides�a�visual�or�behavioral�cue�indicating�that�the�trash�is�supposed�to�be�limited�and�there�are�ample�recycling�alternatives.�
� Include�instructions�or�warnings�on�the�waste�bin�such�as:�“Are�You�Sure�This�Is�Not�Recyclable?”�� Many�recycling�facilities�can�accept�co�mingled�recyclables,�which�means�that�less�sorting�and�fewer�
receptacles�are�required.�However,�quantities�of�these�co�mingled�materials�are�often�harder�to�track�and�require�detailed�receipts�from�the�waste�transport�agency�to�assess�the�composition�of�co�mingled�streams.�
� Designate�a�particular�person�or�a�few�people�to�be�the�site�monitor�for�helping�workers�recycle�properly.�� Review�local�environmental�maintenance�plans�used�for�litter�control�and�roadway�cleanup�activities.�These�
plans�may�be�helpful�references�when�developing�the�Site�Recycling�Plan,�or�at�minimum,�reduce�potential�for�conflict�between�existing�policy�and�practice.�See�also�PR�10�Site�Maintenance�Plan.�
� Hire�a�contractor�with�an�Environmental�Management�System�(EMS)�in�place.�(See�Credit�EW�1�Environmental�Management�System).�These�employers�already�have�internal�office�procedures�established�to�reduce�office�related�pollution�and�may�be�familiar�with�local�agency�recovery�efforts�and�recycling�or�salvage�facilities.�
� Develop�and�deliver�training�to�workers�to�educate�them�on�waste�recovery�efforts�being�implemented�onsite�and�compliance�with�the�general�CWMP�and�the�Site�Recycling�Plan.�This�step�will�be�critical�to�all�projects.�See�Credit�CA�2�Environmental�Training�for�more�approaches�and�strategies�for�education�programs.�
� Create�an�incentive�or�recognition�plan�for�workers�to�engage�actively�in�recycling�efforts�of�personal�trash�that�rewards�positive�and�successful�behavior.�
� Hire�an�experienced�waste�transport�company�to�manage�site�waste�and�monitor�waste�streams�for�unacceptable�materials.�
� Identify�local�facilities�that�accept�recyclables�or�salvaged�materials.�This�is�important�in�designating�type�of�waste�to�separate,�and�in�making�arrangements�for�drop�off�or�delivery�of�materials.�
� Identify�existing�recycling�collection�facilities�that�may�be�decentralized�(i.e.�recycle�bins�along�a�city�street).�Many�urbanized�areas�will�have�access�or�provisions�for�local�recycling�programs�and�may�have�resources�available�for�use.�
� The�2007�Contractor’s�Guide�by�the�King�County�Solid�Waste�Division�and�Seattle�Public�Utilities�provides�many�helpful�waste�management�and�reduction�strategies�for�the�entire�project.�A�sample�waste�management�plan�adapted�from�this�guide�is�provided�in�the�examples�below.�
Example: Sample Specification Language for Site Recycling Plan
� The�King�County�Solid�Waste�Division�(King�County,�2009)�provides�some�helpful�tools�for�writing�clear�and�manageable�recycling�and�diversion�expectations�into�contract�documents�at�http://www.greentools.us.�A�sample�of�“Section�01505�(or�1524)�–�Construction�Waste�Management”�is�provided�at�the�link�below�in�Construction�Specifications�Institute�(CSI)�MasterFormat�(King�County,�2008):�http://your.kingcounty.gov/solidwaste/greenbuilding/documents/Sect01505_const_waste�mgmt.pdf�
� Communicating�the�plan�expectations�with�subcontractors�is�equally�important.�Following�is�a�sample�clause�for�subcontractor�agreements:�
"The�subcontractor�will�make�a�good�faith�effort�to�reduce�the�amount�of�waste�generated�on�the�jobsite�and�recycle�material�as�per�the�contractor's�waste�management�plan.�The�subcontractor�will�follow�the�designated�handling�procedures�for�each�type�of�waste�generated�on�site�and�provide�documentation�to�verify�material�reuse,�recycling�and�disposal�as�indicated�in�the�waste�management�plan."�(King�County,�2008)�
292

Greenroads™ Manual v1.5 Construction Activities
CA-3 Site Recycling Plan
Example: Sample Construction Waste Management Plan with Materials Recovery
The�following�example�content�has�been�adapted�from�the�2007�Seattle/King�County�Contractor’s�Guide,�which�is�available�here:�http://your.kingcounty.gov/solidwaste/greenbuilding/documents/ConGuide.pdf.�Projects�teams�should�consider�customizing�the�Site�Recycling�Plan�information�based�on�project�goals�and�agency�or�client�expectations.�
SITE RECYCLING PLAN
General�Contractor:���Project�Name:�Site�Recycling�Coordinator:�Phone:�Debris�Collection�Agency:��Site�Recycling/Diversion�Goals:��Steps�to�inform�contractors/subcontractors�of�Site�Recycling�Plan�policies.�1.�2.�3.�4.�5.��
C&D�Materials�Expected�to�be�Generated�and�Proposed�Diversion�Method�The�following�charts�identify�materials�expected�to�be�generated�by�this�project�and�the�planned�method�for�diverting�these�materials�from�disposal�as�a�waste.�
DECONSTRUCTION�&�DEMOLITION�PHASEMaterial� Quantity�(units) Diversion�Method�&�Location Handling�Procedure� � � � � � � � � � � � � � � �� � � � � � � � � � � � � � � �� � � � � � � � � � � � � � � �� � � � � � � � � � � � � � � �� � � � � � � � � � � � � � � �� � �
CONSTRUCTION�PHASEMaterial� Quantity�(units) Diversion�Method��&�Location Handling�Procedure� � � � � � � � � � � � � � � �� � � � � � � � � � � � � � � �� � � � � � � � � � � � � � � �� � � � � � � � � � � � � � � �� � � � � � � � � � � � � � � �� � � � � � � � � � � � � � � �� � � � � � � � � � � � � � � �� � � � � � � � � � � � � � � �� � � � � � � � � � � � � � � �� � � � � � � � � � � � � � � �� � �
Figure�CA�3.1:�Sample�site�recycling�plan�format.�
293

Construction Activities Greenroads™ Manual v1.5
Site Recycling Plan CA-3
POTENTIAL ISSUES
1. A�central�location�for�collecting�recyclables�on�a�roadway�project�may�not�be�feasible�for�jobsites�that�consistently�change�starting�locations�on�a�daily�basis�(i.e.�several�miles�down�the�roadway�away�from�the�collection�area).�This�may�result�in�unnecessary�vehicle�or�worker�trips�to�and�from�a�particular�location�just�to�deposit�something�in�a�correct�recycling�receptacle.�The�authors�are�unaware�of�any�practices�that�have�been�used�on�roadway�construction�projects�that�could�solve�or�avoid�this�problem.�
2. There�is�a�trade�off�between�transport�costs�(including�environmental�costs�from�emissions)�and�the�overall�utility�or�value�of�the�recycled�or�salvaged�materials.�Some�locations,�especially�many�rural�areas,�may�have�difficulty�finding�recovery�facilities�that�are�located�near�enough�to�the�project�to�be�financially�or�environmentally�cost�effective.�
3. Technology�is�quickly�developing�for�recycling�of�materials�into�reconstituted�building�materials�(See�credit�MR�4).�However,�new�technologies�may�not�be�available�locally�or�in�rural�areas.�
4. Careless�behavior�or�lack�of�stewardship�may�be�an�issue�that�can�result�in�recyclables�being�disposed�of�in�waste�only�receptacles,�or�vice�versa,�especially�if�objectives�of�a�Site�Recycling�Plan�are�not�meaningful�or�communicated�well�to�workers.�This�behavior�can�contaminate�the�recyclables�stream�and�make�an�entire�receptacle�unsuitable�for�reprocessing�or�salvage,�or�accidentally�send�recyclables�to�a�landfill.�
5. Proper�handling�of�recyclable�materials�is�a�key�safety�issue�for�new�and�unfamiliar�recycling�activities.�Communication�and�training�is�critical�to�minimize�risk�and�preserve�safety.�
6. Safety�and�security�considerations�should�be�taken�into�account�relative�to�on�site�storage�of�recoverable�materials�of�high�value.�Opportunities�for�theft�may�be�increased,�especially�for�some�types�of�metals�that�are�commonly�used�in�infrastructure�or�electrical�utilities�like�copper�wire.�
7. Storage�areas�must�comply�with�relevant�regulations�and�the�pollution�prevention�plan�(see�Project�Requirement�PR�7).�
8. At�this�time,�points�are�not�available�for�achieving�waste�reduction�based�on�percentage�of�total�waste.�This�is�due�to�lack�of�data�regarding�waste�management�for�roadway�construction�activities.�
RESEARCH This�section�describes�known�challenges�about�implementing�a�recycling�and�recovery�plan�at�roadway�construction�sites�and�explores�the�potential�environmental�benefits�of�such�plans.�For�detailed�background�information�on�what�is�known�about�construction�and�demolition�(C&D)�waste�management�for�roadways,�the�reader�is�referred�to�Project�Requirement�PR�6�Waste�Management�Plan.�Similarly,�for�detailed�information�on�planning�for�bulk�roadway�materials�recycling,�recovery�or�reuse�(the�first�requirement�for�the�Site�Recovery�Plan),�the�reader�is�directed�toward�the�Materials�&�Resources�Credits�MR�2�Pavement�Reuse,�MR�3�Earthwork�Balance,�and�MR�4�Recycled�Materials.�These�credits�contain�many�approaches�and�strategies�that�may�be�synergistic�when�pursuing�this�credit.�
This�section�addresses�two�key�points�which�are�not�addressed�in�the�requirements�or�credits�noted�above:�what�is�known�about�the�state�of�recycling�housekeeping�practices�and�municipal�solid�waste�(MSW,�also�known�as�household�or�personal�waste)�generation�on�construction�sites�and�the�benefits�and�costs�of�applicable�construction�materials�recovery�activities.�Helpful�resources�are�also�listed�at�the�end�for�more�information.�
State�of�the�Road�Industry�Recycling�Practice�While�several�agencies�and�authors�promote�recycling�material�waste�products�used�in�roadway�construction,�information�on�the�recyclable�material�wastes�generated�by�roadway�construction�and�demolition�projects�is�hard�to�locate.�The�following�list�identifies�areas�of�construction�activities�for�which�there�is�currently�little�or�no�relevant�data:�
� Waste�management�plans�for�transportation�contractors�� Sorting,�segregation�and�processing�activities�for�roadway�construction�waste,�and�where�these�activities�occur�
(i.e.�on�site,�off�site)�� Behaviors�and�stewardship�practices�of�road�construction�employees��
294

Greenroads™ Manual v1.5 Construction Activities
CA-3 Site Recycling Plan
� Generation�rates�and�quantities�of�personal�trash�� Generation�rates�and�quantities�of�office�related�trash�for�construction�site�offices�� Costs�associated�with�C&D�and�MSW�management�from�construction�worksites�
Existing�regulatory�requirements�focus�mainly�on�stormwater,�sediment�and�dust�control�and�other�standard�pollution�prevention�activities,�such�as�the�National�Pollution�Discharge�and�Elimination�System�(see�also�Project�requirement�PR�7�Pollution�Prevention�Plan).�Some�agencies�may�also�have�Environmental�Management�Systems�(EMS)�in�place�(see�Credit�EW�1�Environmental�Management�System)�which�often�institute�personal�and�office�waste�management�policies,�but�no�information�is�available�relative�to�whether�these�EMS�plans�are�implemented�and�followed�at�the�construction�site.�
The�lack�of�information�is�likely�partly�because�recycling�activities�represent�a�materials�feedback�loop�at�many�levels�of�the�roadway�system,�from�design�and�construction�to�start�and�end�of�the�supply�chain.�Waste�management�and�recovery�of�resources�fit�near�the�end�of�the�pollution�prevention�scheme,�but�these�activities�themselves�can�inject�materials�into�various�lifecycle�phases�of�the�overall�project�(EPA,�2009b).�This�makes�environmental�costs�and�benefits�of�recycling�difficult�to�quantify,�characterize�and�compare�between�different�projects.�Some�environmental�costs�of�materials�and�products�due�to�extraction�and�initial�production�are�effectively�extended�into�a�second�service�life�through�downcycling�recovery�activities�(where�some�original�value�is�lost),�general�recycling�or�upcycling�(value�is�gained)�practices.�(McDonough�&�Braungart,�2002)�It�also�means�long�range�and�upstream�planning�and�reduction�strategies�can�often�provide�more�evident�reduction�benefits�later�in�the�lifecycle�(EPA,�2009b).�
Rajendran�and�Gambetese�(2007)�estimated�waste�rates�for�C&D�material�types�based�on�literature�review�and�quantitative�modeling.�Their�estimates,�however,�do�not�include�MSW�materials�generated�from�personal�or�office�activities�or�behaviors�of�site�staff�(their�estimated�rates�are�itemized�in�Table�PR�6.1).�Solid�waste�recovery�for�construction�and�demolition�debris�is�addressed�in�PR�6�and�MR�4.�
Cost�Effectiveness�of�Construction�Recycling�Programs�A�few�authors�(Seydel�et�al.,�2002;�Kourmpanis�et�al.,�2008;�Schultmann�&�Sunke,�2007)�have�attempted�to�quantify�costs�and�perceived�benefits�associated�with�construction�waste�management�practices.�Those�that�have�done�so�successfully�have�only�followed�construction�of�buildings�and�building�site�infrastructure�components.�Because�building�sites�are�relatively�compact�compared�to�the�linear�nature�of�roads,�and�because�of�the�vast�difference�in�the�expected�types�of�material�quantities�(e.g.�hot�mix�asphalt�and�concrete�materials),�the�relevance�of�these�studies�may�be�minor.�However,�the�recycling�activities�and�methods�used�for�buildings�projects�vary�widely.�Many�different�waste�management�or�waste�recovery�processes�may�also�be�applicable�to�roadway�and�bridge�demolition�and�construction.�Additionally,�no�quantitative�cost�models�were�based�on�U.S.�data.�
Schultmann�and�Sunke�(2007)�use�a�lifecycle�energy�analysis�model�to�show�that�recovery�of�waste�construction�materials�reduces�lifecycle�costs,�mostly�due�to�reduced�energy�use�during�extraction�of�materials.�These�savings�appear�to�translate�well�to�roadway�materials�based�on�the�energy�analysis�for�roadway�construction�completed�by�Rajendran�and�Gambetese�(2007),�which�does�use�relevant�U.S�data.�Schultmann�and�Sunke�(2007),�as�well�as�the�Construction�Industry�Research�and�Information�Association�(CIRIA,�2004),�also�note�that�closed�loop�design�and�planning�for�deconstruction�activities,�also�known�as�complete�selective�demolition�(Kourmpanis�et�al.,�2008),�instead�of�destruction�activities�presents�a�valuable�route�to�potential�cost�savings�for�many�material�products.�Kourmpanis�et�al.�(2008)�also�suggest�that�a�combination�of�conventional�demolition�and�deconstruction�activities�(partial�selective�demolition)�and�complete�selective�demolition�of�buildings�can�lower�material�handling�and�transport�costs�and�increased�recovered�value�of�materials.�However,�transport�costs�and�machinery�costs�for�on�site�activities�must�be�weighed�because�they�are�highly�variable�between�projects,�especially�by�location.�
Seydel,�Wilson�and�Skitmore’s�(2002)�study�(which�tracked�only�three�materials�in�one�building�project�in�Australia)�demonstrated�that�recycling�and�sorting�practices�require�heightened�environmental�awareness,�more�supervision�of�handling�operations�and�more�overall�sorting�that�is�perceived�to�be�in�addition�to�normal�environmental�controls.�Their�highest�effort�recovery�scenario,�including�sorting�and�disposal,�reduced�transport�and�disposal�
295

Construction Activities Greenroads™ Manual v1.5
Site Recycling Plan CA-3
costs�of�the�waste�by�18%�from�traditional�practices�and�9.5%�from�minimally�controlled�waste.�However,�the�bottom�line�cost�was�increased�due�to�the�more�complicated�waste�plan�and�more�time�spent�managing�and�monitoring�contractor�employee�waste�activities.�The�authors�state�that�the�overall�potential�for�the�waste�recovery�plan�to�be�successfully�cost�effective�and�environmentally�beneficial�was�not�realized�due�to�contractor�inexperience�with�such�planning.�Additionally,�they�suggest�that�added�planning�and�environmental�stewardship�could�increase�cost�competitiveness�among�construction�contractors.�
Poon�et�al.�(2001)�state�that�source�separation,�which�takes�place�at�the�construction�site,�is�heavily�dependent�on�an�environmentally�educated�work�force,�including�subcontractors,�that�has�been�trained�in�proper�materials�handling�and�sorting�procedures.�“For�most�of�them,�it�is�usually�a�long�learning�process�to�be�familiar�and�feel�comfortable�with�performing�waste�separation.”�(p.�169).�Proper�training�has�cost�implications�which�are�discussed�further�in�Credit�CA�2�Environmental�Training.�Crude�separation,�however,�lowers�the�overall�value�of�the�recoverable�material,�because�it�often�reduces�the�sorting�efficiency�downstream�and�requires�specialized�employees�to�complete�the�separation�at�an�off�site�location�(Poon�et�al.,�2001).�Off�site�waste�sorting�is�typically�the�preferred�option�of�most�building�contractors�because�it�does�not�require�additional�labor�force,�supervised�work�on�site,�no�additional�facilities,�or�added�training�costs�(Poon�et�al.,�2001).�Put�simply:�out�of�“site,”�out�of�mind.�Because�this�management�option�avoids�on�site�stewardship�practices�entirely,�this�method�is�not�recommended�(Poon�et�al.,�2001).���
Notable�Recycling�Statistics�for�MSW�None�of�the�studies�noted�above�consider�MSW�streams�originating�from�any�type�of�construction�project.�What�follows�in�this�section�are�general�statistics�that�may�be�useful�in�identifying�and�characterizing�the�MSW�portion�of�the�waste�stream�generated�on�roadway�and�bridge�construction�sites.�
Generally,�in�the�U.S.�municipal�solid�waste�generation�has�increased�over�the�last�five�decades,�but�recycling�and�composting�rates�have�also�increased�(EPA,�2009b;�EPA,�2009c).�The�waste�stream�for�MSW�landfills�has�been�well�studied�and�characterized�by�the�EPA.�Data�below�is�from�the�EPA’s�Municipal�Solid�Waste�Generation,�Recycling,�and�Disposal�in�the�United�States:�Facts�and�Figures�for�2008�and�includes�statistics�for�waste�types�that�may�be�potential�encountered�at�construction�sites.�
� Out�of�250�million�tons�of�MSW�disposed,�about�83�million�tons�were�recycled�or�composted�in�2008.�Of�the�total�waste�generated,�the�EPA�estimates�that�approximately�35%�to�45%�was�from�commercial�and�institutional�locations�but�the�majority�was�residential�origin.�
� The�U.S.�waste�stream�was�31%�paper�and�paper�products�(before�recycling).�See�Figure�CA�3.2.��� Approximately�54%�of�all�MSW�is�discarded,�while�33%�is�recovered�for�recycling,�and�the�remainder�is�
burned�at�landfills�for�energy�production.�Figure�CA�3.3�shows�the�trends�and�distributions�of�MSW�since�1960�to�2008.�
� By�weight,�paper�and�paper�products�are�the�largest�source�of�waste,�with�the�highest�overall�recovered�weight�(55.5%�recovered),�though�other�materials�have�higher�rates�of�recovery�and�less�recovered�mass.��Specifically,�71%�percent�of�office�related�paper�materials�were�recovered.�
� Figure�CA�3.4�shows�a�table�of�EPA�2008�statistics�that�includes�all�materials�characterized�in�the�waste�streams�monitored.�Many�could�be�commonly�found�in�site�offices�and�personal�belongings,�including�food�products.�In�fact,�vegetative�wastes�and�debris,�containers,�and�packaging�account�for�44%�of�the�total�MSW�stream�sent�to�landfill�and�15%�of�wood�packaging�was�recovered�(which�was�mostly�pallets).��
� As�noted�in�PR�6�Waste�Management�Plan,�some�municipal�solid�waste�landfills�also�accept�construction�and�demolition�debris�(EPA,�2008a;�EPA,�2008d).�Materials�such�as�hot�mix�asphalt�and�concrete�make�up�a�small�percentage�of�the�total�MSW�waste�stream�and�are�categorized�in�Figures�CA�3.2�and�CA�3.4�as�“Other.”�
296

Greenroads™ Manual v1.5 Construction Activities
CA-3 Site Recycling Plan
�Figure�CA�3.2:�Composition�of�2008�U.S.�MSW�waste�stream,�
250�million�tons�total�(before�recycling)�(EPA,�2009c).�
Figure�CA�3.3:�Disposal�trends�for�MSW�in�the�United�States,�1960�2008�(EPA,�2009b).�
297

Construction Activities Greenroads™ Manual v1.5
Site Recycling Plan CA-3
Figure�CA�3.4:�Generation�and�Recovery�of�Materials�in�MSW,�2008�(in�millions�of�tons��and�percent�of�generation�of�each�material)�(EPA,�2009c).�
�
Benefits�of�Recycling�MSW�The�EPA�(2009c)�states,�“Recycling�has�environmental�benefits�at�every�stage�in�the�life�cycle�of�a�consumer�product—from�the�raw�material�with�which�it’s�made�to�its�final�method�of�disposal.�Aside�from�reducing�[greenhouse�gas]�emissions,�which�contribute�to�global�warming,�recycling�also�reduces�air�and�water�pollution�associated�with�making�new�products�from�raw�materials.”�In�2008,�the�83�million�tons�of�MSW�that�were�recovered�represent�182�million�metric�tons�of�carbon�dioxide�equivalent�emissions�saved�annually.�This�is�similar�to�removing�the�air�emissions�impact�generated�by�33�million�passenger�cars�in�one�year�(EPA,�2009c).�
For�MSW�products,�paper�and�wood�products�(organic�materials)�are�the�most�common�materials�in�the�waste�stream�that�end�up�in�landfills.�Diversion�of�these�materials�from�landfills,�as�well�as�other�organics�such�as�topsoils�and�land�clearing�debris,�offers�reduced�methane�emissions�due�to�fewer�landfill�emissions�from�decomposition�of�these�organic�materials.�Methane�is�a�greenhouse�gas�that�contributes�21�times�as�much�to�global�warming�and�climate�change�as�carbon�dioxide�emissions.�(Intergovernmental�Panel�on�Climate�Change,�2007)�Also,�paper�waste�
298

Greenroads™ Manual v1.5 Construction Activities
CA-3 Site Recycling Plan
is�easily�and�commonly�recycled,�reducing�the�overall�need�for�forested�materials.�Therefore,�the�EPA�(2008)�states�that�by�not�decreasing�trees,�more�carbon�dioxide�is�able�to�be�stored�in�forest�resources,�(EPA,�2008)�and�priceless�habitat�is�preserved.��
The�EPA�promotes�solid�waste�management�through�prevention�(source�reduction),�recycling�and�composting�(2008c)�as�three�clear�ways�to�reduce�climate�change�impacts�due�to�greenhouse�gas�emissions�and�energy�consumption.�“Less�energy�is�needed�to�extract,�transport,�and�process�raw�materials�and�to�manufacture�products�when�people�reuse�things�or�when�products�are�made�with�less�material.”�(EPA,�2009a).�As�shown�in�Schultmann�and�Sunke�(2001),�materials�that�can�reduce�fossil�energy�need�means�fewer�associated�emissions�from�the�energy�sector�with�the�recycled�material�than�for�a�new�material�that�has�been�extracted�and�manufactured�from�virgin�materials�(EPA,�2008b).�Waste�prevention�practices�(also�known�as�pollution�prevention�or�P2:�EPA,�2008e),�which�are�supported�by�the�EPA�as�the�most�effective�way�to�reduce�environmental�impacts,�can�reduce�lifecycle�emissions�and�energy�use�than�construction�and�demolition�and�MSW�recycling�(2008b).�
Future�of�this�Credit�Other�familiar�sustainability�rating�systems,�such�as�LEED�(USGBC,�2009)�for�buildings�and�the�Sustainable�Sites�Initiative�(2009),�award�credit�for�reduction�of�solid�waste�and�diversion�practices�for�construction�and�demolition�materials.�Currently,�no�minimum�recycling�standard�or�data�on�average�waste�generated�per�project�is�available�for�common�types�of�roadway�construction�projects.�At�this�time,�Greenroads�cannot�justify�awarding�points�to�one�project�over�another�based�on�waste�management�practices�or�goal�setting�without�a�known�benchmark�for�this�best�practice.�
Additional�Resources�� CIRIA,�the�Construction�Industry�Research�and�Information�Association,�provides�some�helpful�hints�for�design�
and�construction�best�practice�for�managing�waste�and�resources�(2004):�http://www.ciria.org.uk/cwr/good_practice_pointers.htm�
� The�California�Integrated�Waste�Management�Board�(CIWMB)�offers�a�number�of�resources�and�tools,�including�videos�of�recycling�best�practices,�(2009)�available�at:�http://www.ciwmb.ca.gov/Recycle/��
� The�EPA’s�P2�(Pollution�Prevention)�Resource�Exchange�provides�contact�information�for�regional�agencies�that�can�help�connect�project�leaders�to�the�right�resources�and�opportunities�for�creating�new�waste�management�programs:�http://www.epa.gov/p2/pubs/p2rx.html�
� WasteCap�Resource�Solutions�offers�tips�and�tricks�used�by�the�building�industry.�Of�particular�interest�and�applicability�to�roadway�projects�are�pre�written�specifications�(free)�and�additional�links�and�resources.�Training�videos�and�receptacle�magnetic�signs�are�also�available�for�a�small�fee.�WasteCap�also�offers�an�online�documentation�program�for�waste�management�planning�called�WasteCapDirect�(price�not�specified).�More�information�is�available�here:�http://www.wastecapwi.org/resources/construction�demolition�
GLOSSARY
C&D� Construction�and�demolitionCIRIA� Construction�Industry�Research�and�Information�Association�CIWMB� California�Integrated�Waste�Management�BoardClosed�loop�design� An�approach�that�considers�waste�management�in�project�planning�in�order�
to�avoid�or�eliminate�processes�that�generate�waste�Complete�selective�demolition� See�“deconstruction”CSI� Construction�Specifications�InstituteCWMP� Construction�Waste�Management�PlanDeconstruction� The�whole�or�partial�disassembly�of�a�product�to�facilitate�
component�reuse�and�materials�recycling�Demolition� Conventional�means�of�disassembly,�or�taking�apart,�a�product�or�facility�that�
is�typically�destructive�and�generally�un�planned�
299
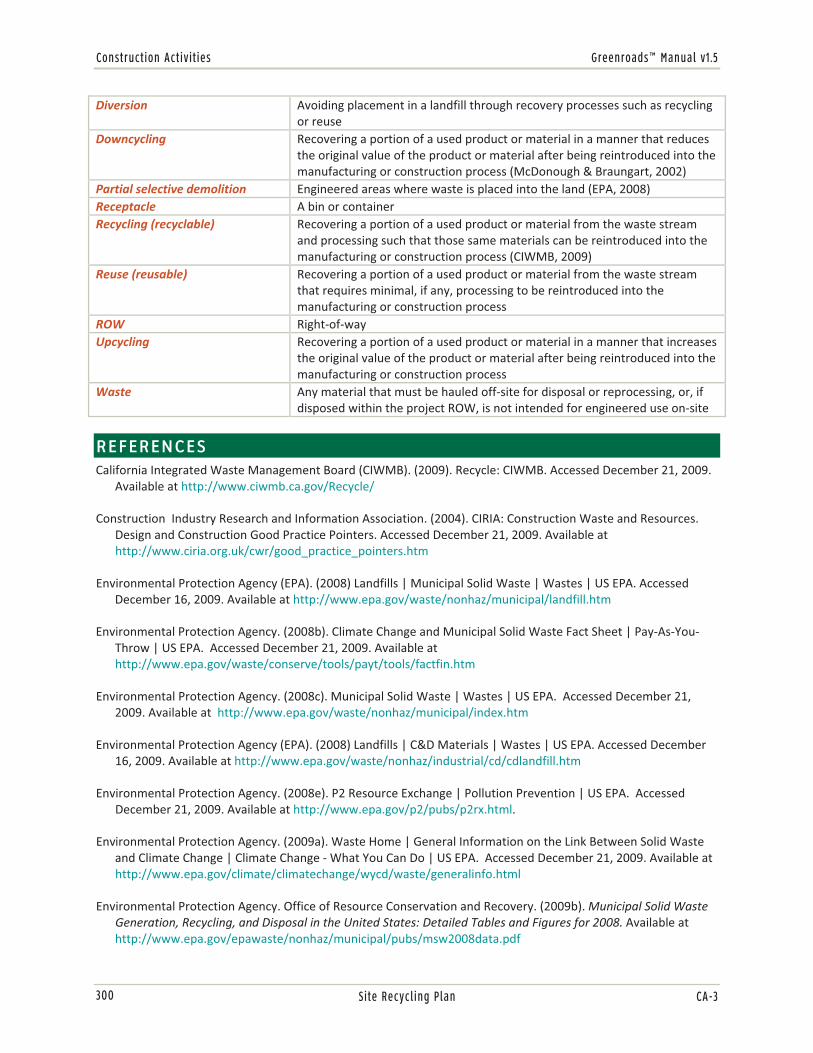
Construction Activities Greenroads™ Manual v1.5
Site Recycling Plan CA-3
Diversion� Avoiding�placement�in�a�landfill�through�recovery�processes�such�as�recycling�or�reuse�
Downcycling� Recovering�a�portion�of�a�used�product or�material�in�a�manner�that�reduces�the�original�value�of�the�product�or�material�after�being�reintroduced�into�the�manufacturing�or�construction�process�(McDonough�&�Braungart,�2002)�
Partial�selective�demolition� Engineered�areas�where�waste�is�placed�into�the�land�(EPA,�2008)�Receptacle� A�bin�or�containerRecycling�(recyclable)� Recovering�a�portion�of�a�used�product�or�material�from�the�waste�stream�
and�processing�such�that�those�same�materials�can�be�reintroduced�into�the�manufacturing�or�construction�process�(CIWMB,�2009)�
Reuse�(reusable)� Recovering�a�portion�of�a�used�product�or�material�from�the�waste�stream�that�requires�minimal,�if�any,�processing�to�be�reintroduced�into�the�manufacturing�or�construction�process�
ROW� Right�of�wayUpcycling� Recovering�a�portion�of�a�used�product�or�material�in�a�manner�that�increases�
the�original�value�of�the�product�or�material�after�being�reintroduced�into�the�manufacturing�or�construction�process�
Waste� Any�material�that�must�be�hauled�off�site�for�disposal�or�reprocessing,�or,�if�disposed�within�the�project�ROW,�is�not�intended�for�engineered�use�on�site�
�
REFERENCES California�Integrated�Waste�Management�Board�(CIWMB).�(2009).�Recycle:�CIWMB.�Accessed�December�21,�2009.�
Available�at�http://www.ciwmb.ca.gov/Recycle/��
Construction��Industry�Research�and�Information�Association.�(2004).�CIRIA:�Construction�Waste�and�Resources.�Design�and�Construction�Good�Practice�Pointers.�Accessed�December�21,�2009.�Available�at��http://www.ciria.org.uk/cwr/good_practice_pointers.htm��
Environmental�Protection�Agency�(EPA).�(2008)�Landfills�|�Municipal�Solid�Waste�|�Wastes�|�US�EPA.�Accessed�December�16,�2009.�Available�at�http://www.epa.gov/waste/nonhaz/municipal/landfill.htm�
Environmental�Protection�Agency.�(2008b).�Climate�Change�and�Municipal�Solid�Waste�Fact�Sheet�|�Pay�As�You�Throw�|�US�EPA.��Accessed�December�21,�2009.�Available�at�http://www.epa.gov/waste/conserve/tools/payt/tools/factfin.htm��
Environmental�Protection�Agency.�(2008c).�Municipal�Solid�Waste�|�Wastes�|�US�EPA.��Accessed�December�21,�2009.�Available�at��http://www.epa.gov/waste/nonhaz/municipal/index.htm��
Environmental�Protection�Agency�(EPA).�(2008)�Landfills�|�C&D�Materials�|�Wastes�|�US�EPA.�Accessed�December�16,�2009.�Available�at�http://www.epa.gov/waste/nonhaz/industrial/cd/cdlandfill.htm�
Environmental�Protection�Agency.�(2008e).�P2�Resource�Exchange�|�Pollution�Prevention�|�US�EPA.��Accessed�December�21,�2009.�Available�at�http://www.epa.gov/p2/pubs/p2rx.html.��
Environmental�Protection�Agency.�(2009a).�Waste�Home�|�General�Information�on�the�Link�Between�Solid�Waste�and�Climate�Change�|�Climate�Change���What�You�Can�Do�|�US�EPA.��Accessed�December�21,�2009.�Available�at�http://www.epa.gov/climate/climatechange/wycd/waste/generalinfo.html��
Environmental�Protection�Agency.�Office�of�Resource�Conservation�and�Recovery.�(2009b).�Municipal�Solid�Waste�Generation,�Recycling,�and�Disposal�in�the�United�States:�Detailed�Tables�and�Figures�for�2008.�Available�at�http://www.epa.gov/epawaste/nonhaz/municipal/pubs/msw2008data.pdf�
300

Greenroads™ Manual v1.5 Construction Activities
CA-3 Site Recycling Plan
Environmental�Protection�Agency.�(2009c).�Municipal�Solid�Waste�Generation,�Recycling,�and�Disposal�in�the�United�States:�Facts�and�Figures�for�2008.�(EPA�530�F�009�021)�Available�at�http://www.epa.gov/epawaste/nonhaz/municipal/pubs/msw2008rpt.pdf�
Intergovernmental�Panel�on�Climate�Change�(IPCC).�(2007).�Pachauri,�R.K�&�Reisinger,�A.�eds.��Climate�Change�2007:�Synthesis�Report.�“Contribution�of�Working�Groups�I,�II�and�III�to�the�Fourth�Assessment.�Report�of�the�Intergovernmental�Panel�on�Climate�Change.”�IPCC:�Switzerland,�2007.�104�pp.�
King�County�Solid�Waste�Division�and�Seattle�Public�Utilties.�(2007).�2007�Contractors�Guide���King�County�Solid�Waste�Division.�Available�at�http://your.kingcounty.gov/solidwaste/greenbuilding/documents/ConGuide.pdf�
King�County�Solid�Waste�Division.�(2008).�Design�specifications�and�waste�management�plans�for�green�building�projects�in�King�County,�WA.�Accessed�December�20,�2009.�Available�at�http://your.kingcounty.gov/solidwaste/greenbuilding/construction�recycling/specifications�plans.asp�
King�County�Solid�Waste�Division.�(2009)�Green�Building���King�County�Solid�Waste�Division.�Accessed�December�20,�2009.�Available�at:�http://www.greentools.us��
Kourmpanis,�B.,�Papadopoulos,�A.,�Moustakas,�K.,�Stylianou,�M.,�Haralambous,�K.,�&�Loizidou,�M.�(2008).�Preliminary�study�for�the�management�of�construction�and�demolition�waste.�Waste�Management�&�Research.�26�(3),�267�275.�
McDonough,�W.,�&�Braungart,�M.�(2002).�Cradle�to�cradle:�Remaking�the�way�we�make�things.�New�York:�North�Point�Press.��
Poon,�C.�S.,�Yu,�A.�T.�W.,�&�Ng,�L.�H.�(2001).�On�site�sorting�of�construction�and�demolition�waste�in�Hong�Kong.�Resources,�Conservation,�and�Recycling.�32�(2),�157.� �
Rajendran,�S.,�&�Gambatese,�J.�A.�(2007).�Solid�Waste�Generation�in�Asphalt�and�Reinforced�Concrete�Roadway�Life�Cycles.�Journal�of�Infrastructure�Systems.�13�(2),�88.�
Seydel,�A.,�Wilson,�O.�D.,�&�Skitmore,�R.�M.�(2002).�Financial�Evaluation�of�Waste�Management�Methods.�Journal�of�Construction�Research.�3�(1),�167�179.�
Schultmann,�F.,�&�Sunke,�N.�(2007).�Energy�oriented�deconstruction�and�recovery�planning.�Building�Research�&;�Information.�35�(6),�602�615.�
Sustainable�Sites�Initiative.�(2009)�The�Sustainable�Sites�Initiative:�Guidelines�and�Performance�Benchmarks�2009.�Available�at�http://www.sustainablesites.org/report/�
United�States�Green�Building�Council�(USGBC).�(2009).�LEED�2009�for�New�Construction�and�Major�Renovations�Rating�System.�Available�at�http://www.usgbc.org/DisplayPage.aspx?CMSPageID=220��
WasteCap�Resource�Solutions.�WasteCap�Resource�Solutions���Construction�&�Demolition.�Accessed�December�21,�2009.�Available�at�http://www.wastecapwi.org/resources/construction�demolition/�
� �
301

Construction Activities Greenroads™ Manual v1.5
Site Recycling Plan CA-3
�
302
Greenroads™ Manual v1.5 Construction Activities
CA-4 Fossil Fuel Reduction
FOSSIL FUEL REDUCTION GOAL Reduce�the�overall�consumption�of�fossil�fuels�by�nonroad�construction�equipment.���
CREDIT REQUIREMENTS Reduce�the�fossil�fuel�requirements�of�nonroad�construction�equipment�by�using�biofuel�or�biofuel�blends�as�a�replacement�for�fossil�fuel.�Points�are�awarded�as�follows:�
1�point��Reduce�the�fossil�fuel�requirements�of�the�nonroad�construction�equipment�fleet�by�15%�through�the�use�of�biofuel�or�biofuel�blends�as�a�replacement�for�fossil�fuel.��
2�points��Reduce�the�fossil�fuel�requirements�of�the�nonroad�construction�equipment�fleet�by�25%�through�the�use�of�biofuel�or�biofuel�blends�as�a�replacement�for�fossil�fuel.�
Details
For�this�credit,�at�least�15%�(for�1�point)�or�25%�(for�2�points)�of�the�fuel�consumed�by�nonroad�construction�equipment�on�the�project�should�be�from�a�source�other�than�fossil�fuel.�In�most�cases,�the�most�straightforward�way�of�achieving�this�is�by�using�a�biofuel�(B100)�or�biofuel�blend�(e.g.,�B20,�B50)�as�onsite�fuel�for�the�equipment�fleet.��
DOCUMENTATION 1. A�signed�letter�from�the�prime�contractor�that�describes�the�fossil�fuel�use�
reduction�measures�used�and�the�percentage�reduction�achieved.��2. A�spreadsheet�summarizing�all�receipts�for�all�fuel�used�in�nonroad�equipment�for�
the�project.�The�spreadsheet�should�indicate�(and�receipts�should�show)�associated�biofuel�blend�(e.g.,�B5,�B20,�B100)�used.�
� �
CA-4
1-2 POINTS
RELATED CREDITS
� CA�5�Equipment�Emission�Reduction�
� CA�6�Paving�Emissions�Reduction�
SUSTAINABILITY COMPONENTS
� Ecology�� Economy�
BENEFITS
� Reduces�Fossil�Fuel�Use�
� Reduces�Air�Emissions��
� Reduces�Greenhouse�Gases���
303
Construction Activities Greenroads™ Manual v1.5
Fossil Fuel Reduction CA-4
APPROACHES & STRATEGIES
� Support�the�environmental�and�health�benefits�of�biodiesel�by�providing�economic�incentive�to�the�general�contractor.�This�can�be�done�either�by�budgeting�for�added�costs�of�biodiesel�fuel�sources�to�help�offset�potential�costs�or�through�other�contract�related�incentives.�
� Purchase�and�use�biodiesel�as�the�on�site�diesel�fuel.�Using�B20�as�the�exclusive�on�site�diesel�would�be�a�means�to�ensure�at�least�a�20%�reduction�in�fossil�fuel�use�is�achieved.�
Example
Some�example�scenarios�are�provided�below�based�on�a�hypothetical�nonroad�construction�equipment�fleet�that�consumes�1,000�gallons�of�fuel�during�project�construction.��
No�points�� B5�(a�fuel�that�is�5%�biofuel�and�95%�petroleum�diesel)�is�used�for�all�1,000�gallons�of�fuel.�This�amounts�to�
a�5%�reduction�in�fossil�fuel�use.��� B100�(a�fuel�that�is�100%�biofuel)�is�used�for�100�gallons�of�fuel�and�petroleum�diesel�is�used�for�the�
remaining�900�gallons.�This�amounts�to�a�10%�reduction�in�fossil�fuel�use.�
1�point�� B20�(a�fuel�that�is�20%�biofuel�and�80%�petroleum�diesel)�is�used�for�all�1,000�gallons�of�fuel.�This�amounts�
to�a�20%�reduction�in�fossil�fuel�use,�which�exceeds�15%�but�is�less�than�25%.�
2�points�� B50�(a�fuel�that�is�50%�biofuel�and�50%�petroleum�diesel)�is�used�for�200�gallons�of�fuel�and�B20�is�used�for�
the�remaining�800�gallons.�This�amounts�to�a�26%�reduction�in�fossil�fuel�use.�� B50�(a�fuel�that�is�50%�biofuel�and�50%�petroleum�diesel)�is�used�for�500�gallons�of�fuel�and�B20�is�used�for�
the�remaining�500�gallons�of�fuel.�This�amounts�to�a�35%�reduction�in�fossil�fuel�use.�
Example: Turner Construction Company Case Study
B99,�a�99%�proportion�of�biodiesel�to�conventional�fuel,�was�used�during�the�construction�of�the�Microsoft�Windows�Live�Columbia�One�Data�Center�in�Quincy,�Washington�to�fuel�equipment�operated�by�subcontractors�hired�by�Turner�Construction�Company.�Discussions�with�the�Safety�Manager�assigned�to�the�project�reveal�that�the�reason�behind�the�switch�to�biodiesel�for�the�on�site�construction�equipment�was�to�provide�a�remedy�for�the�noxious�diesel�fumes�that�were�emitted�by�the�nonroad�construction�equipment.�Workers�reported�no�issues�with�air�quality�during�the�first�half�of�the�project,�however�the�second�half�of�the�project�was�when�a�considerable�portion�of�the�construction�work�was�performed�within�the�semi�enclosed�shell�and�core�structure.�It�was�during�this�stage�when�the�particulate�matter�and�carbon�monoxide�levels�emitted�by�the�nonroad�construction�equipment�became�a�concern�to�the�operators�and�laborers�working�alongside.�The�situation�was�promptly�brought�to�the�attention�of�the�Safety�Manager.��
Upon�the�Safety�Manager’s�recommendation,�Turner�Construction�negotiated�the�use�of�biodiesel�fuel�for�the�equipment�being�leased�from�the�subcontractor�who�was�providing�the�equipment�for�the�project.�The�project�called�for�approximately�15�20�pieces�of�construction�equipment�which�was�leased�from�RSC�Equipment�Rentals�based�out�of�Ellensburg,�Washington�(National�Biodiesel�Board,�2008).�Discussions�with�the�Turner�Construction’s�Safety�Manager�and�the�Equipment�Manager�from�RSC�Equipment�Rentals�confirmed�that�no�retrofitting�was�required�for�the�equipment�prior�to�making�the�switch�to�biodiesel�fuel.��
As�a�proactive�means�to�provide�preventative�maintenance,�and�as�a�result�of�the�anticipated�cleansing�of�the�fuel�delivery�system�attributed�to�the�solvent�action�of�biodiesel,�fuel�filters�for�each�piece�of�equipment�were�replaced�after�the�first�and�third�tankfuls�of�fuel.�Observations�from�the�equipment�operators�detected�no�noticeable�loss�in�fuel�efficiency�during�the�operation�of�the�equipment.�Fuel�use�was�not�monitored�on�an�individual�equipment�basis�and,�as�a�result,�data�is�unavailable�to�calculate�and�confirm�improvements�or�
304

Greenroads™ Manual v1.5 Construction Activities
CA-4 Fossil Fuel Reduction
reductions�to�the�fuel�efficiency�of�the�equipment.�Furthermore,�operators�observed�no�significant�loss�of�power�for�the�equipment�operating�on�biodiesel�although�the�operator�of�a�CAT�330�excavator�noticed�a�small�power�loss�near�full�operating�load.�The�lack�of�a�noticeable�power�loss�for�the�majority�of�the�equipment�was�likely�due�to�the�equipment�not�being�utilized�to�its�full�power�potential.��
Air�quality�data�was�collected�by�Turner�Construction�Company�and�the�Washington�State�Department�of�Labor�&�Industries�shortly�after�making�the�switch�to�biodiesel.�Unfortunately,�the�data�collected�by�Turner�Construction’s�Safety�Manager�was�lost�as�a�result�of�damage�to�the�Safety�Manager’s�portable�computer.�Based�on�the�Safety�Manager’s�recollection�however,�the�following�information�pertains�to�the�air�quality�management�proceedings:�
� The�air�quality�was�assessed�during�the�operation�of�concrete�pump�trucks�fueled�with�B99�biodiesel�and�measured�while�operating�within�the�confines�of�the�shell�and�core�structure.�The�measurement�was�taken�at�the�truck�exhaust�using�an�air�monitor.�Readings�were�as�follows:��� Turner�Construction:�2�ppm�CO�at�the�exhaust�� Department�of�Labor�&�Industries:�3�4�ppm�CO�at�the�exhaust�
Air�quality�regulations�permit�carbon�monoxide�concentrations�at�the�exhaust�to�approach�40�45�ppm.�An�interesting�side�comment�made�by�Department�of�Labor�&�Industry�technicians,�and�noted�by�the�Safety�Manager,�was�that�the�proper�functioning�of�their�air�monitors�were�called�into�question�because�the�carbon�monoxide�measurements�were�unexpectedly�low.�
POTENTIAL ISSUES
1. Currently,�biodiesel�in�the�most�common�form,�B20�(a�20�percent�blend�of�ethanol�and�conventional�diesel)�offers�no�significant�economic�advantage�and�the�environmental�and�social�advantages�are�often�overlooked.�
2. There�may�be�a�cost�premium�per�gallon�for�biodiesel�over�that�of�conventional�diesel�fuel.��3. Biodiesel�is�currently�not�produced�in�sufficient�quantities�to�meet�widespread�demand.�4. Engine�manufacturers�may�not�honor�diesel�engine�warranties�if�such�engines�use�biofuels.�As�of�2009,�most�
engine�manufacturers�allow�B5�and�some�allow�up�to�B20�under�their�current�warranties.�5. Lack�of�industry�data�for�engine�performance�leads�to�skeptic�equipment�manufacturers.�6. Limited�availability�of�ethanol�feedstock�because�of�the�tradeoff�within�the�agricultural�industry�for�production�
of�food�versus�production�of�fuel.�7. There�are�a�limited�number�of�nonroad�construction�equipment�models�that�offer�hybrid�electric�drive�engines.��
RESEARCH A�fuel�that�exhibits�properties�similar�to�that�of�conventional�diesel�but�offers�several�associated�benefits�resulting�from�its�use�is�biodiesel.�Biodiesel�can�be�used�as�a�direct�replacement�for�conventional�diesel�in�its�purest�or�blended�forms�and�is�produced�from�the�esters�of�vegetable�oils�and�animal�fats�(Van�Gerpen�et�al.,�2007).�This�fuel�source�can�be�used�to�power�diesel�engines�and�typically�requires�no�equipment�modifications�and�is�able�to�utilize�the�current�fueling�infrastructure�for�distribution�(USDOE,�1995).�
Biodiesel�is�produced�through�the�transesterfication�process.�This�process�requires�feedstock�materials�which�include�rapeseed,�soybean,�vegetable�oils�and�animal�fats�(USDOE,�1995).�The�animal�fat�or�vegetable�oil�is�combined�with�alcohol�in�the�first�stage�of�the�process�in�a�chemical�reaction�which�combines�the�feedstock�material�with�an�alcohol�to�produce�an�ester�and�glycerol�(Van�Gerpen�et�al.,�2007).�Alcohols�typically�used�in�the�process�include�methanol�and�ethanol�though�methanol�is�more�commonly�used�as�a�result�of�its�lower�cost�(You,�2007).�This�reaction�is�usually�catalyzed�to�improve�the�reaction�rate�and�the�quantity�that�can�be�produced.�The�byproduct�of�this�reaction�is�glycerol�which�is�removed�and�separated�from�the�alcohol/ester�mixture.�The�alcohol�is�further�separated�from�the�ester.�It�is�the�remaining�esters�which�make�up�the�raw�biodiesel�(You,�2007).�
305

Construction Activities Greenroads™ Manual v1.5
Fossil Fuel Reduction CA-4
Biofuels�such�as�ethanol�and�biodiesel�are�derived�from�biomass�and�offer�several�advantages.�They�are�considered�renewable�forms�of�fuel�because�their�use�involves�a�closed�carbon�cycle�(Puppan,�2001).�In�addition�to�helping�reduce�our�dependency�on�foreign�oil,�the�use�of�biodiesel�has�shown�several�environmental�and�human�health�benefits�associated�with�its�use�as�a�construction�fuel.�For�example,�the�use�of�biodiesel�mitigates�the�impacts�of�global�warming�and�climate�change�since�there�is�no�net�production�of�carbon�dioxide�during�the�lifecycle�of�biodiesel�production�and�use�(Van�Gerpen�et�al.,�2007).�Furthermore,�since�biodiesel�is�an�oxygenated�fuel,�it�produces�fewer�hydrocarbons,�less�carbon�monoxide�and�less�particulate�matter�than�that�of�conventional�No.�2�diesel�fuel�from�the�combustion�process�in�a�diesel�engine�(Van�Gerpen�et�al.,�2007).�As�a�result,�the�use�of�biodiesel�promotes�localized�improvement�to�air�quality�and�worker�health�from�the�decrease�in�the�emission�of�compounds�that�are�classified�as�human�health�hazards�such�as�carbon�monoxide,�sulfur�dioxide,�lead�and�particulate�matter�(Puppan,�2001).�
Other�advantages�include�the�lubricity�properties�of�biodiesel�that�permit�it�to�contribute�to�enhancing�the�efficiency�of�an�engine�as�well�as�improving�the�life�expectancy�of�the�equipment�(Van�Gerpen�et�al.,�2007).�Moreover,�biodiesel�features�a�detergent�action�or�solvent�property�which�improves�engine�efficiency�by�removing�sedimentation�and�deposits�from�an�engine’s�fuel�system�(USDOE,�2001).�These�factors�contribute�to�the�possibility�of�eventual�long�term�cost�savings�as�a�result�of�decreased�maintenance�costs�over�that�observed�when�conventional�diesel�is�used�to�fuel�equipment.�
The�cost�to�retrofit�equipment�to�operate�on�biodiesel�is�typically�negligible.�Usually�no�retrofitting�of�engine�components�is�required�to�permit�equipment�to�utilize�biodiesel�for�fuel.�However,�the�fuel�system�for�the�engine�should�have�no�rubber�parts�such�as�rubber�hoses,�seals�and�gaskets�which�could�deteriorate�from�any�physical�contact�with�biodiesel�(USDOE,�1995).�Rubber�components�typically�exist�in�equipment�manufactured�prior�to�1994�and�engine�damage�as�a�result�of�fuel�system�failure�resulting�from�the�deterioration�of�engine�components�could�result�from�the�solvent�action�of�biodiesel�(USDOE,�2001).��
An�important�economic�advantage�to�the�use�of�biodiesel�is�that�it�can�be�used�in�its�pure�form�(as�B100)�or�blended�with�petroleum�derived�diesel.�As�such,�the�use�of�biodiesel�requires�little�to�no�modifications�to�the�current�fueling�infrastructure�or�vehicle�engine�and�fuel�delivery�systems�in�preparation�for�its�use�(USDOE�Clean�Cities�Fact�Sheet).�
The�results�of�a�limited�scope�life�cycle�assessment�(LCA)�of�the�construction�of�one�lane�mile�of�portland�cement�concrete�roadway�using�a�generic�set�of�non�road�construction�equipment�required�to�place�the�concrete�(i.e.�a�paving�machine�and�texture/curing�machine)�indicated�that�the�production�and�utilization�of�biodiesel�consumes�more�energy�than�that�required�to�produce�and�utilize�conventional�or�ultra�low�sulfur�diesel�fuel.�However,�based�on�the�data�collected�from�the�LCA,�it�is�clear�that�biodiesel�is�the�fuel�source�that�is�the�least�contributing�to�the�potential�for�global�warming.�In�other�words,�conventional�diesel�and�ultra�low�sulfur�diesel�contribute�more�to�global�warming�than�biodiesel.�The�difference�in�the�level�of�contribution�between�conventional�and�ultra�low�sulfur�diesel�was�found�to�be�almost�negligible.�On�the�other�hand,�biodiesel�was�determined�to�bring�about�a�larger�contribution�to�smog�formation�due�to�the�increased�formation�of�NOX�and�further�reaction�of�the�NOX�with�VOCs�to�form�smog.�Difference�in�the�contribution�to�smog�formation�between�conventional�diesel�and�ultra�low�sulfur�diesel�was�found�to�be�negligible.�
GLOSSARY
Biofuel� Renewable�fuels�derived�from�biological�materials�that�can�be�regenerated.�This�distinguishes�them�from�fossil�fuels�which�are�considered�nonrenewable.�Examples�of�biofuels�are�ethanol,�methanol,�and�biodiesel.�
Hybrid�electric� A�power�system�that�combines�a�conventional�internal�combustion�engine�(e.g.,�diesel)�and�an�electric�motor�and/or�storage�system�to�provide�the�primary�power�for�the�vehicle.�
306
Greenroads™ Manual v1.5 Construction Activities
CA-4 Fossil Fuel Reduction
B5,�B20,�B50,�B100� Short�notation�to�describe�a�blend�of�biodiesel�with�traditional�petroleum�diesel.�The�number�describes�the�percentage�of�biodiesel�(e.g.,�B20�is�20%�biodiesel�and�80%�petroleum�diesel).��
�
REFERENCES BioPower�London.�(2006).�“Frequently�Asked�Questions.”�Available�at�http://www.biopowerlondon.co.uk/index.htm.��
Energy�Information�Administration.�(2010).�“Gasoline�and�Diesel�Fuel�Update.”�Available�at�http://tonto.eia.doe.gov/oog/info/gdu/gasdiesel.asp.�
European�Biodiesel�Board.�(2010).�“Statistics.”�Available�at�http://www.ebb�eu.org/stats.php.�
Frentress,�Dave.�“Biodiesel�and�Other�Green�Initiatives�at�Glacier�Northwest.”�Stone,�Sand�&�Gravel�Review,�(Jan/Feb�2008):�50�53.�
Heijungs,�R.�&�Suh,�S.�(2002).��A�Computational�Structure�of�Life�Cycle�Assessment.�Kluwer�Academic�Publishers,�Netherlands.�
National�Biodiesel�Board.�(2008).��Available�at�http://www.biodiesel.org/.�
Radich,�Anthony.�(2004).�“Biodiesel�Performance,�Costs,�and�Use.”�Energy�Information�Administration.�Available�at�http://www.eia.doe.gov/oiaf/analysispaper/biodiesel.�
Sawyer,�Tom.�(December�3,�2007).�“Developer’s�Challenge�to�Construction:�Innovate�for�Destiny.”�Engineering�News�Record,�24�27.��
U.�S.�Department�of�Energy.�(1995).�National�Renewable�Energy�Laboratory.�Biofacts:�Fueling�a�Stronger�Economy.�
U.�S.�Department�of�Energy.�(2001).�Energy�Efficiency�and�Renewable�Energy�Office�of�Transportation�Technology.�Clean�Cities:�Alternative�Fuel�Information�Series:�Technical�Assistance�Fact�Sheet.�
U.�S.�Department�of�Energy.�(2008).�“Environmental�Programs�–�Onsite�Air�Quality�Assessment.”��
U.�S.�Department�of�Transportation.�(2007).�Federal�Transit�Administration.�Biodiesel�Fuel�Management�Best�Practices�for�Transit.��
U.�S.�Environmental�Protection�Agency.�(2004a).�Office�of�Transportation�and�Air�Quality.�EPA420P�04�005,�Median�Life,�Annual�Activity,�and�Load�Factor�Values�for�Nonroad�Engine�Emissions�Modeling.��
U.�S.�Environmental�Protection�Agency.�(2004b).�Office�of�Transportation�and�Air�Quality.�EPA420R�04�007,�Final�Regulatory�Impact�Analysis.��
U.�S.�Environmental�Protection�Agency.�(2005).�Office�of�Transportation�and�Air�Quality.�EPA420R�05�022,�Nonroad�Engine�Population�Estimates.��
U.�S.�Environmental�Protection�Agency.�(2007).�Office�of�Transportation�and�Air�Quality.�EPA420R�07�005.�Diesel�Retrofit�Technology:�An�Analysis�of�the�Cost�Effectiveness�of�Reducing�Particulate�Matter�and�Nitrogen�Oxides�Emissions�from�Heavy�Duty�Nonroad�Diesel�Engines�Through�Retrofits.�
U.�S.�Environmental�Protection�Agency.�(2008a).�“Air�and�Radiation.”�Available�at�http://www.epa.gov/oar.��
307

Construction Activities Greenroads™ Manual v1.5
Fossil Fuel Reduction CA-4
U.�S.�Environmental�Protection�Agency.�(2008b).�“Climate�Change.”�http://www.epa.gov/climatechange.�(Accessed�Sep.�29,�2008).��
U.S.�Department�of�Labor.�Bureau�of�Labor�Statistics.�(2008).�“Consumer�Price�Index.”�Available�at�http://www.bls.gov/cpi.��
United�States�General�Accounting�Office�Report�to�Congressional�Committee.�(1999).�Mass�Transit:�Use�of�Alternative�Fuels�in�Transit�Buses.��
Van�Gerpen,�J.�H.,�Peterson,�C.�L.,�&�Goering,�C.�E.�(2007).�“Biodiesel:�An�alternative�Fuel�for�Compression�Ignition�Engines.”�American�Society�of�Agricultural�and�Biological�Engineers.�Presentation�at�the�2007�Agricultural�Equipment�Technology�Conference�on�11�14�February�2007.��
You,�Yii�Der,�et.�al.�(2008).�Economic�Cost�Analysis�of�Biodiesel�Production:�Case�in�Soybean�Oil.�Energy�and�Fuels�22,�no.�1:�182�9.�
308
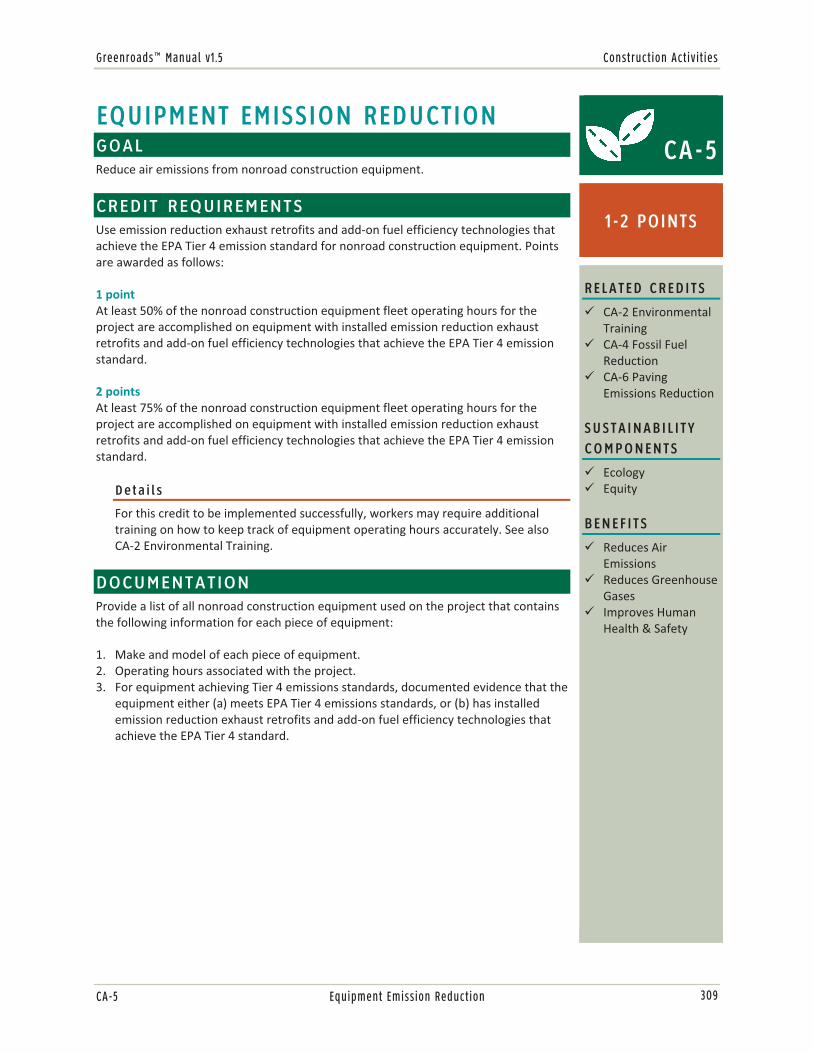
Greenroads™ Manual v1.5 Construction Activities
CA-5 Equipment Emission Reduction
EQUIPMENT EMISSION REDUCTION GOAL Reduce�air�emissions�from�nonroad�construction�equipment.��
CREDIT REQUIREMENTS Use�emission�reduction�exhaust�retrofits�and�add�on�fuel�efficiency�technologies�that�achieve�the�EPA�Tier�4�emission�standard�for�nonroad�construction�equipment.�Points�are�awarded�as�follows:�
1�point��At�least�50%�of�the�nonroad�construction�equipment�fleet�operating�hours�for�the�project�are�accomplished�on�equipment�with�installed�emission�reduction�exhaust�retrofits�and�add�on�fuel�efficiency�technologies�that�achieve�the�EPA�Tier�4�emission�standard.��
2�points�At�least�75%�of�the�nonroad�construction�equipment�fleet�operating�hours�for�the�project�are�accomplished�on�equipment�with�installed�emission�reduction�exhaust�retrofits�and�add�on�fuel�efficiency�technologies�that�achieve�the�EPA�Tier�4�emission�standard.�
Details
For�this�credit�to�be�implemented�successfully,�workers�may�require�additional�training�on�how�to�keep�track�of�equipment�operating�hours�accurately.�See�also�CA�2�Environmental�Training.�
DOCUMENTATION Provide�a�list�of�all�nonroad�construction�equipment�used�on�the�project�that�contains�the�following�information�for�each�piece�of�equipment:��
1. Make�and�model�of�each�piece�of�equipment.�2. Operating�hours�associated�with�the�project.��3. For�equipment�achieving�Tier�4�emissions�standards,�documented�evidence�that�the�
equipment�either�(a)�meets�EPA�Tier�4�emissions�standards,�or�(b)�has�installed�emission�reduction�exhaust�retrofits�and�add�on�fuel�efficiency�technologies�that�achieve�the�EPA�Tier�4�standard.�
�
CA-5
1-2 POINTS
RELATED CREDITS
� CA�2�Environmental�Training�
� CA�4�Fossil�Fuel�Reduction�
� CA�6�Paving�Emissions�Reduction�
SUSTAINABILITY COMPONENTS
� Ecology�� Equity�
BENEFITS
� Reduces�Air�Emissions�
� Reduces�Greenhouse�Gases�
� Improves�Human�Health�&�Safety��
309
Construction Activities Greenroads™ Manual v1.5
Equipment Emission Reduction CA-5
APPROACHES & STRATEGIES
� Retrofit�exhaust�equipment�on�nonroad�vehicles.�� Replace�engines�where�this�option�is�more�cost�effective�than�retrofit.�� Switch�to�use�ultra�low�sulfur�diesel�(ULSD)�in�conjunction�with�the�add�on�fuel�efficiency�technologies�installed�
in�the�equipment�fleet.��
Example: Scenarios
Some�example�scenarios�are�provided�below�based�on�a�hypothetical�nonroad�fleet�operating�for�a�total�of�1,000�equipment�hours.��
No�points�� 400�of�1,000�total�operating�hours�(40%)�are�associated�with�equipment�that�achieve�the�EPA�Tier�4�
emissions�standard.��
1�point�� 500�of�1,000�total�operating�hours�(50%)�are�associated�with�equipment�that�achieve�the�EPA�Tier�4�
emissions�standard.�
2�points�� 800�of�1,000�total�operating�hours�(80%)�are�associated�with�equipment�that�achieve�the�EPA�Tier�4�
emissions�standard.�
Example: Case Studies Documented by the U.S. EPA
The�EPA�describes�several�diesel�engine�emission�reduction�effort�case�studies�at:�http://www.epa.gov/diesel/construction/casestudies.htm��
Example: Washington State Department of Ecology Strategy
One�example�of�an�overall�statewide�approach�that�this�Voluntary�Credit�is�consistent�with�is�the�Washington�State�Department�of�Ecology’s�“Diesel�Particulate�Emission�Reduction�Strategy.”�The�goals�expected�under�this�approach�are�(Ecology,�2006):��
1. Install�emission�reduction�exhaust�retrofits�on�fifty�percent�of�the�public�legacy�diesel�fleet�in�four�years.��
2. Install�emission�reduction�exhaust�retrofits�and�add�on�fuel�efficiency�technologies�on�fifty�percent�of�the�private�legacy�diesel�fleet�in�eight�years.��
3. Evaluate,�develop�and�implement�an�idle�reduction�program�that�addresses�and�remedies�unnecessary�idling�through�on�board�retrofits,�on�the�ground�infrastructure�and�anti�idling�regulations.��
4. Replace�twenty�five�percent�of�older�(pre�1996�for�non�road)�legacy�vehicles�in�the�private�fleet�in�eight�years.��
POTENTIAL ISSUES
1. Retrofits�and�replacements�of�engines�can�represent�a�significant�added�cost�to�the�contractor.�
RESEARCH Construction�air�emissions�are�largely�from�three�main�sources:�(1)�dust�and�particles�from�the�construction�activities,�also�called�fugitive�dust,�(2)�emissions�from�construction�equipment�exhausts,�or�(3)�emissions�from�
310

Greenroads™ Manual v1.5 Construction Activities
CA-5 Equipment Emission Reduction
construction�materials�(such�as�fumes�and�vapors�from�hot�asphalt).�This�Voluntary�Credit�addresses�construction�equipment�emissions�in�general�and�specifically,�diesel�exhaust�emissions�from�nonroad�diesel�equipment.�
Nonroad�Engine�Defined�40�CFR�Part�1068�(the�General�Compliance�Provisions�for�Nonroad�Programs)�defines�precisely�what�a�nonroad�diesel�engine�is�and�is�not.�In�summary�(40�CFR�1068�has�exact�definitions�and�exclusions),�a�nonroad�engine�is�defined�to�be�any�internal�combustion�engine�that�is:�
1. In�or�on�a�piece�of�equipment�that�is�self�propelled�or�serves�a�dual�purpose�by�both�propelling�itself�and�performing�another�function.�
2. In�or�on�a�piece�of�equipment�that�is�intended�to�be�propelled�while�performing�its�function.�3. That,�by�itself�or�in�or�on�a�piece�of�equipment,�is�portable�or�transportable.��
In�general,�diesel�powered�self�propelled�and�portable�construction�equipment�with�an�internal�combustion�engine�are�considered�to�be�nonroad�engines.��
Health�Effects�Diesel�engines�emit�a�complex�mixture�of�gaseous�pollutants�and�fine�particles�and�are�a�major�source�of�air�pollution.�Particular�emissions�are�nitrogen�oxides�(NOx),�particulate�matter�(PM),�sulfur�oxide�gases�(SOx),�and�other�toxic�air�pollutants�which�contribute�to�serious�adverse�health�and�environmental�effects�(EPA,�1995;�ICF,�2005).�Emissions�from�diesel�engines�have�been�found�to�include�over�forty�cancer�causing�substances,�and�the�U.S.�Environmental�Protection�Agency�(EPA)�has�concluded�that�diesel�exhaust�is�likely�to�be�carcinogenic�to�humans�by�inhalation�at�occupational�and�environmental�levels�of�exposure�(EPA,�2002).�In�Washington�State,�the�Washington�State�Department�of�Ecology�has�identified�diesel�exhaust�as�the�air�pollutant�most�harmful�to�public�health�in�Washington�State.�They�found�that�70%�of�the�cancer�risk�from�airborne�pollutants�is�from�diesel�exhaust,�mainly�due�to�the�PM�2.5�emissions�(Washington�State�Department�of�Ecology,�2006).�Until�the�mid�1990s,�emissions�from�these�engines�were�largely�uncontrolled.�In�order�to�combat�the�health�effects�of�diesel�emissions,�the�EPA�started�a�program�in�2007�to�reduce�diesel�engine�emissions�in�the�U.S.�(EPA,�2004).�The�plan�is�estimated�to�reduce�emissions�by�more�than�90%�by�2030.��
Contribution�of�Nonroad�Diesel�Engines�to�Emissions�Inventory�According�to�EPA’s�National�Emission�Inventory�(2008�year�data)�(NEI,�2009),�nonroad�diesel�engines�(using�the�category�of�“off�highway”)�are�responsible�for�26%�of�NOx�emissions�nationally�(4,255,000�tons�per�year),�and�for�5.8%�of�fine�particulate�emissions�(PM�2.5)�(283,000�tons�per�year)�nationally.�These�percentages�can�be�considerably�higher�in�some�urban�areas.�In�Washington�State,�the�Department�of�Ecology�states�that�construction�activities�are�responsible�for�18%�of�the�State’s�PM�2.5�emissions�(2002�data)�(Figure�CA�5.1).�
311

Construction Activities Greenroads™ Manual v1.5
Equipment Emission Reduction CA-5
�
Figure�CA�5.1:��(Washington�State�Department�of�Ecology,�2006).�
1. �
Improvement�Efforts�Recognizing�the�large�impact�that�diesel�engine�exhaust�has�on�human�health�and�the�environment�(e.g.,�CARB,�n.d.),�there�are�substantial�efforts�to�reduce�diesel�exhaust�emissions�through�burning�cleaner�diesel�fuels�(e.g.,�ultra�low�sulfur�diesel�or�ULSD),�installing�exhaust�retrofits�to�reduce�emissions�from�existing�engines�and�producing�new�diesel�engines�that�emit�less.��
Pace�of�Change�Although�efforts�to�reduce�diesel�emissions�are�underway,�significant�impacts�may�be�years�away.�Nonroad�diesel�equipment�can�last�20�to�30�years�and�typical�new�emissions�standards�are�not�required�to�be�met�by�existing�equipment.�Therefore,�the�impacts�of�such�changes�are�likely�to�be�felt�as�a�majority�of�equipment�fleets�age�and�are�replaced�by�equipment�meeting�newer,�more�stringent�regulations.�Furthermore,�change�and�its�pace�will�likely�be�controlled�by�the�private�sector�as�they�own�nearly�90�percent�of�diesel�vehicles�and�diesel�engines�(Washington�State�Department�of�Ecology,�2006).�Thus,�efforts�to�incent�the�private�sector�to�change�ahead�of�natural�equipment�turnover�rates�may�help�make�diesel�emission�reductions�happen�sooner.��
Cost�Considerations�A�majority�of�construction�companies�are�small�firms.�To�retrofit�or�change�their�equipment�requires�large�capital�investments,�which�they�may�not�be�able�to�bear.�For�many�private�smaller�construction�companies,�this�cost�is�significant�and�interferes�with�the�environmental�benefits�this�would�achieve.�Also�the�cost�of�using�alternative�fuel�or�low�sulfur�fuel�is�an�issue.�
The�EPA�estimates�the�incremental�cost�of�producing�500�ppm�fuel�to�be�on�average�2.5�cents�per�gallon,�and�15�ppm�around�5�cents�per�gallon.�(This�takes�into�account�all�the�necessary�changes�in�both�refining�and�distribution�practices,�however�this�estimated�costs�vary�widely�for�equipment�of�different�sizes�and�for�different�applications)�(EPA,�2003).�For�the�vast�majority�of�equipment,�the�cost�of�meeting�emission�standards�will�be�roughly�1�2%�compared�with�the�typical�retail�price.�As�an�example,�EPA�estimates�that�for�a�175�hp�bulldozer,�it�will�cost�an�additional�$2,600�to�add�the�advanced�emission�control�systems�to�the�engine�and�to�
312

Greenroads™ Manual v1.5 Construction Activities
CA-5 Equipment Emission Reduction
design�the�bulldozer�to�accommodate�the�modified�engine.�A�new�175�hp�bulldozer�costs�approximately�$230,000�(EPA,�2003),�so�the�increased�costs�are�about�1�%�of�the�total�purchase�price.�Costs�could�be�higher�for�some�types�of�equipment.�As�a�benefit,�engines�running�on�low�sulfur�fuel�will�have�reduced�maintenance�expenses�(EPA,�2003).�As�incentive,�there�are�several�grant�programs�available�at�local�and�federal�level�for�companies�to�retrofit�or�change�part�of�their�equipment�fleet�(Washington�State�Department�of�Ecology,�2006;�EPA,�2009).��
In�the�broader�context,�the�benefits�to�society�of�reduced�health�costs�resulting�from�fewer�emissions�are�substantial.�The�EPA�estimated�the�benefit�to�cost�ratio�(health�benefits�to�compliance�cost)�of�30�(CARB,�n.d.).�In�general,�the�California�Air�Resources�Board�(CARB)�reports�benefit�cost�ratios�in�the�literature�from�2�to�8.�
GLOSSARY
REFERENCES California�Air�Resources�Board�(CARB).�(no�date�given).�Health�Effects�of�Diesel�Exhaust�Particulate�Matter.�CARB.�
Available�at�http://www.arb.ca.gov/research/diesel/dpm_health_fs.pdf.�Accessed�14�December�2009.��
ICF�Consulting.�(2005).�Emission�Reduction�Incentives�for�Off�Road�Diesel�Equipment�Used�in�the�Port�and�Construction�Sectors.�Prepared�for�EPA.�Available�at�http://www.epa.gov/sectors/pdf/emission_20050519.pdf.�Accessed�14�December�2009.��
National�Emissions�Inventory�(NEI).�(2009).�National�Emissions�Inventory,�Air�Pollutant�Trends�Data,�Average�annual�emissions�1978�2002,�all�criteria�pollutants.�Available�at�http://www.epa.gov/ttn/chief/trends/index.html#tables.�
U.S.�Environmental�Protection�Agency�(EPA).�(1995).�Compilation�of�Air�Pollutant�Emission�Factors,�Volume�1:�Stationary�Point�and�Area�Sources,�Chapter�13.2.3�Heavy�Construction�Operations,�AP�42,�Fifth�Edition.�U.S.�EPA,�Washington,�D.C.�
U.S.�Environmental�Protection�Agency�(EPA).�(2002).�Health�Assessment�Document�for�Diesel�Engine�Exhaust.�National�Center�for�Environmental�Assessment,�Office�of�Research�and�Development,�U.S.�EPA,�Washington,�D.C.�
U.S.�Environmental�Protection�Agency�(EPA).�(2003).�Summary�of�EPA's�Proposed�Program�for�Low�Emission�Nonroad�Diesel�Engines�and�Fuel.�EPA420�F�03�008,�U.S.�EP,�Washington,�D.C.�http://www.epa.gov/nonroad�diesel/420f03008.htm.�Accessed�14�December�2009.��
U.S.�Environmental�Protection�Agency�(EPA).�(2004).�Clean�Air�Nonroad�Diesel�Rule.�Regulatory�Announcement,�Office�of�Transportation�and�Air�quality,�EPA420�F�04�032.�U.S.�EPA,�Washington,�D.C.�
Tier�4�emission�standard� EPA�standards�that�require�emissions�to�be�reduced�over�current�Tier�2�and�3�standards.�Reductions�of�particulate�matter�(PM)�for�engines�above�19kW�and�nitrous�oxides�(NOx)�for�engines�larger�than�56�kW�are�substantial.�Hydrocarbon�limits�are�also�substantially�reduced�for�engines�larger�than�56�kW.�Such�emission�reductions�can�be�achieved�through�the�use�of�control�technologies�including�advanced�exhaust�gas�after�treatment.�Tier�4�standards�are�to�be�phased�in�over�the�period�of�2008�2015.�
Ultra�low�sulfur�diesel�(ULSD)� Standard�term�for�diesel�fuel�having�less�than�15�ppm�sulfur.�As�of�2009,�most�on�highway�diesel�fuel�sold�at�retail�locations�is�ULSD.�The�previous�standard,�low�sulfur�diesel�(LSD),�allowed�500�PPM�sulfur.�
313

Construction Activities Greenroads™ Manual v1.5
Equipment Emission Reduction CA-5
U.S.�Environmental�Protection�Agency�(EPA).�(2009).�National�Clean�Diesel�Campaign.�U.S.�EPA,�Washington,�D.C.�http://www.epa.gov/otaq/diesel/index.htm.�Accessed�14�December�2009.�
US�Environmental�Protection�Agency.�(2003).�Draft�Regulatory�Impact�Analysis:�Control�of�Emissions�from�Nonroad�Diesel�Engines.�EPA420�R�03�008,�U.S.�EPA,�Washington,�D.C.�
Washington�State�Department�of�Ecology�(2006).�Diesel�Particulate�Emission�Reduction�Strategy�for�Washington�State.�Washington�State�Department�of�Ecology�Air�Quality�Program.�
�
�
314
Greenroads™ Manual v1.5 Construction Activities
CA-6 Paving Emissions Reduction
PAVING EMISSIONS REDUCTION GOAL Improve�human�health�by�reducing�worker�exposure�to�asphalt�fumes.�
CREDIT REQUIREMENTS Place�at�least�90%�of�the�hot�mix�asphalt�(HMA)�on�the�project�using�a�paver�that�is�certified�to�have�met�National�Institute�for�Occupational�Safety�and�Health�(NIOSH)�emission�guidelines�as�set�forth�in�Engineering�Control�Guidelines�for�Hot�Mix�Asphalt�Pavers,�Part�1:�New�Highway�Class�Pavers�(Department�of�Health�and�Human�Services�(NIOSH)�Publication�No.�97�105,�April�1997�printing).�
Details
If�more�than�one�paver�is�used�on�a�project,�the�percentage�of�HMA�placed�by�each�paver�shall�be�determined�using�the�total�weight�of�HMA�placed�by�each�paver.�Use�Equation�CA�6.1�to�compute�the�total�percentage�placed�by�the�NIOSH�paver.�Calculations�should�be�done�by�weight�of�HMA�placed.�For�the�purposes�of�this�calculation,�all�placed�bituminous�asphaltic�mixtures�(e.g.,�hot�mix�asphalt,�warm�mix�asphalt,�open�graded�asphalt,�stone�matrix�asphalt,�etc.)�shall�be�counted�as�“HMA.”�
Equation�CA�6.1:�
�
DOCUMENTATION � Copy�of�the�manufacturing�certification�provided�with�the�paver(s)�when�
purchased.�Page�5�of�the�NIOSH�(1997)�document�provides�an�example�of�the�certification�wording.�
� Signed�statement�by�a�paving�contractor�representative�indicating�that�the�certified�paver(s)�referenced�in�the�first�document�was�(were)�used�on�the�job�and�did�place�at�least�90%�of�the�HMA.�
CA-6
1 POINT
RELATED CREDITS
� CA�4�Fossil�Fuel�Reduction�
� CA�5�Equipment�Emission�Reduction�
� PT�3�Warm�Mix�Asphalt�
SUSTAINABILITY COMPONENTS
� Ecology�� Equity�
BENEFITS
� Reduces�Air�Emissions�
� Reduces�Greenhouse�Gases�
� Improves�Human�Health�&�Safety�
315

Construction Activities Greenroads™ Manual v1.5
Paving Emissions Reduction CA-6
APPROACHES & STRATEGIES
� Use�a�paver�that�meets�NIOSH�engineering�control�guidelines.�A�quick�check�can�be�done�by�locating�the�exhaust�stack�or�required�3��by�5�inch�information�plate�(Figure�CA�6.1)�on�the�paver�being�used.�These�information�plates�are�required�to�be�attached�by�the�manufacturer.��
Example: Photos
Figures�CA�6.2�and�CA�6.3�show�examples�of�pavers�with�and�without�exhaust�ventilation�systems.�
�Figure�CA�6.2:�The�large�black�exhaust�stack�to�the�right�of�the�operator�
is�part�of�a�NIOSH�compliant�exhaust�ventilation�system.��
�Figure�CA�6.1:�Example�of�a�manufacturer�information�plate�(from�NIOSH,�1997).�
316
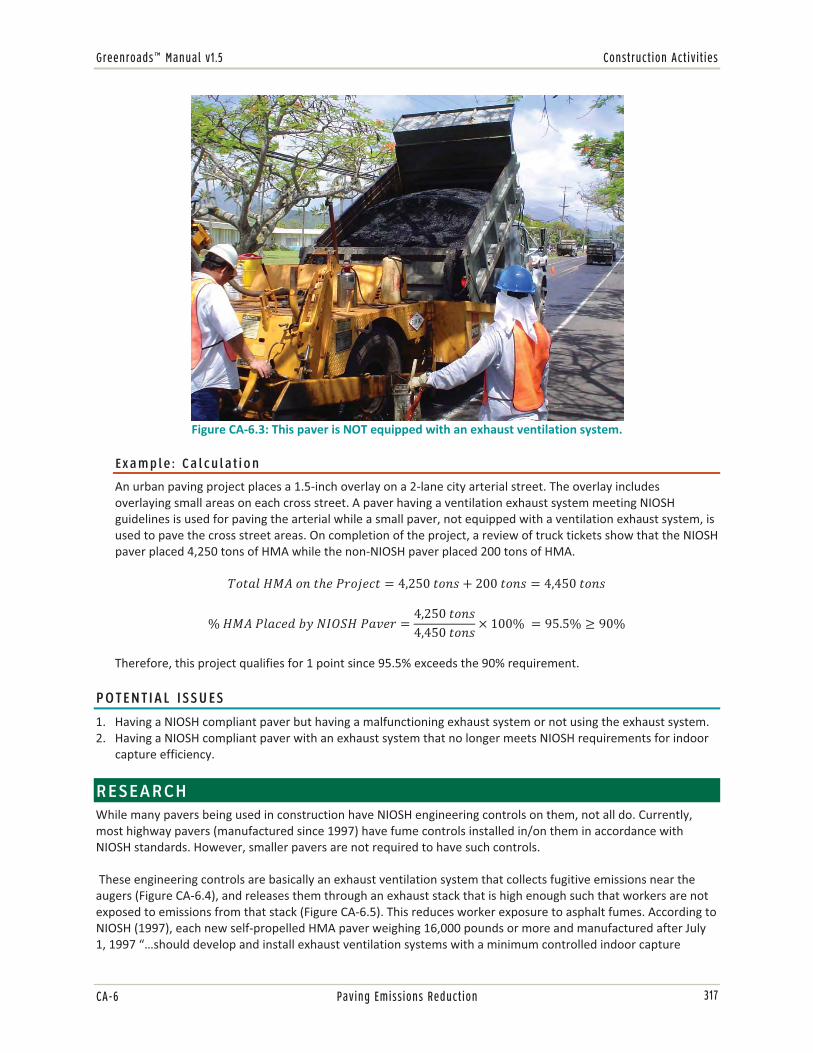
Greenroads™ Manual v1.5 Construction Activities
CA-6 Paving Emissions Reduction
�Figure�CA�6.3:�This�paver�is�NOT�equipped�with�an�exhaust�ventilation�system.�
�Example: Calculation
An�urban�paving�project�places�a�1.5�inch�overlay�on�a�2�lane�city�arterial�street.�The�overlay�includes�overlaying�small�areas�on�each�cross�street.�A�paver�having�a�ventilation�exhaust�system�meeting�NIOSH�guidelines�is�used�for�paving�the�arterial�while�a�small�paver,�not�equipped�with�a�ventilation�exhaust�system,�is�used�to�pave�the�cross�street�areas.�On�completion�of�the�project,�a�review�of�truck�tickets�show�that�the�NIOSH�paver�placed�4,250�tons�of�HMA�while�the�non�NIOSH�paver�placed�200�tons�of�HMA.�
������ !���"��#$��%�&$'� � ���� ���"( � � ���"( � ���� ���"(�)� !�����'$*�+,�-./0 ���1$% � ���� ���"(���� ���"( 2 � )� � 3���) 4 3 )�
Therefore,�this�project�qualifies�for�1�point�since�95.5%�exceeds�the�90%�requirement.�
POTENTIAL ISSUES
1. Having�a�NIOSH�compliant�paver�but�having�a�malfunctioning�exhaust�system�or�not�using�the�exhaust�system.�2. Having�a�NIOSH�compliant�paver�with�an�exhaust�system�that�no�longer�meets�NIOSH�requirements�for�indoor�
capture�efficiency.�
RESEARCH While�many�pavers�being�used�in�construction�have�NIOSH�engineering�controls�on�them,�not�all�do.�Currently,�most�highway�pavers�(manufactured�since�1997)�have�fume�controls�installed�in/on�them�in�accordance�with�NIOSH�standards.�However,�smaller�pavers�are�not�required�to�have�such�controls.�
�These�engineering�controls�are�basically�an�exhaust�ventilation�system�that�collects�fugitive�emissions�near�the�augers�(Figure�CA�6.4),�and�releases�them�through�an�exhaust�stack�that�is�high�enough�such�that�workers�are�not�exposed�to�emissions�from�that�stack�(Figure�CA�6.5).�This�reduces�worker�exposure�to�asphalt�fumes.�According�to�NIOSH�(1997),�each�new�self�propelled�HMA�paver�weighing�16,000�pounds�or�more�and�manufactured�after�July�1,�1997�“…should�develop�and�install�exhaust�ventilation�systems�with�a�minimum�controlled�indoor�capture�
317

Construction Activities Greenroads™ Manual v1.5
Paving Emissions Reduction CA-6
efficiency�of�80%...”�The�NIOSH�(1997)�document,�which�was�developed�in�concert�with�the�National�Asphalt�Pavement�Association�(NAPA),�describes�the�detailed�requirements�for�the�exhaust�ventilation�system�including�the�performance�testing�criteria,�labeling,�certification,�operation,�maintenance�and�training.�
�
The�NIOSH�summary�of�health�effects�of�occupational�exposure�to�asphalt�fumes�generally�indicates�that�there�are�acute�(immediate�or�short�term)�and�chronic�(long�term)�impacts�to�human�health.�While�not�all�studies�agree�on�
�Figure�CA�6.4:�Drawing�of�the�collection�hoods�used�to�collect�fumes�near�the�auger��
(from�Construction�Innovation�Forum,�2006)�
Figure�CA�6.5:�Drawing�of�the�exhaust�ventilation�system�with�key�parts�labeled��(from�Construction�Innovation�Forum,�2006).�
318

Greenroads™ Manual v1.5 Construction Activities
CA-6 Paving Emissions Reduction
the�effects�or�their�significance�there�is�generally�strong�enough�evidence�to�show�that�such�effects�can�be�present.�Given�that,�it�is�beneficial�to�reduce�asphalt�fume�exposure�to�paving�workers�even�if�it�is�below�established�limits.�Established�exposure�limits�are�generally�to�prevent�acute�effects;�in�some�cases�they�do�not�fully�address�chronic�effects�and�it�is�very�difficult�to�do�so.�
More�information�is�available�in�the�full�NIOSH�document�on�the�web�at:�http://www.cdc.gov/niosh/asphalt.html��
GLOSSARY
REFERENCES Construction�Innovation�Forum�(CIF).�(2006).�2006�NOVA�Award�Nomination�12:�Highway�Asphalt�Paver�Fume�
Controls.�Construction�Innovation�Forum,�Walbridge,�OH.�Available�at�http://www.cif.org/nom2006/Nom�12�2006.pdf.�Accessed�6�January�2009.�
National�Institute�for�Occupational�Safety�and�Health�(NIOSH).�(April�1997�second�printing).�Engineering�Guidelines�for�Hot�Mix�Asphalt�Pavers:�Part�1�New�Highway�Class�Pavers.�DHHS�(NIOSH)�Publication�No.�97�105.�U.S.�Department�of�Health�and�Human�Services,�Public�Health�Service,�Centers�for�Disease�Control�and�Prevention,�National�Institute�for�Occupational�Safety�and�Health,�Cincinnati,�OH.�Available�at�http://www.cdc.gov/niosh/asphalt.html��
� �
HMA� Hot�mix�asphaltNAPA� National�Asphalt�Pavement�AssociationNIOSH� National�Institute�of�Occupational�Health�and�Safety�WMA� Warm�mix�asphalt�(see�also�Credit�PT�3)
319

Construction Activities Greenroads™ Manual v1.5
Paving Emissions Reduction CA-6
�
320
Greenroads™ Manual v1.5 Construction Activities
CA-7 Water Use Tracking
WATER USE TRACKING GOAL Generate�project�level�information�about�construction�water�use.��
CREDIT REQUIREMENTS Create�a�spreadsheet�that�records�total�water�use�during�construction.�This�spreadsheet�should�identify,�at�minimum:�
1. Dates�of�use.�2. Amounts�of�use.�3. Locations�and�sources�of�water�used.�4. Potability�of�water�source(s).�5. Each�construction�activity�requiring�water�use.�6. Total�water�quantity�used�in�each�construction�activity.�7. Method�of�measurement�to�determine�total�quantity�used.�8. Disposal�practice�for�unused�water.�9. Type�of�water�use�permit,�if�any.�10. Total�cost�of�water�used�from�each�source,�if�any.�
Details
Water�use�can�be�measured�by�meter,�hose�capacity,�number�of�water�tanks,�pumping�rate�over�time,�or�other�appropriate�source�dependent�estimates.�
The�credit�does�not�require�specific�performance�criteria�for�water�conservation.�Eventually,�water�use�data�will�be�compiled�to�establish�benchmarks�for�roadway�construction�water�efficiency�and�to�develop�guidelines�for�appropriate�water�conservation�practices�and�principles�to�reduce�potable�water�usage�and�negative�impacts�to�the�environment.�
DOCUMENTATION � Copy�of�the�spreadsheet�used�to�record�construction�water�use.�
CA-7
2 POINTS
RELATED CREDITS
� PR�7�Pollution�Prevention�Plan�
� PR�10�Site�Maintenance�
SUSTAINABILITY COMPONENTS
� Ecology�� Expectations�� Exposure�
BENEFITS
� Improves�Accountability�
� Increases�Awareness� Creates�New�
Information�
321

Construction Activities Greenroads™ Manual v1.5
Water Use Tracking CA-7
APPROACHES & STRATEGIES
� Ask�individual�workers�to�record�water�use�on�their�daily�reports.�� Provide�copies�of�the�tracking�spreadsheet�at�locations�where�water�is�used�and�measured�for�gathering�
consistent�recordings.�
Example: Sample Spreadsheet
Sample�spreadsheet�entries�for�different�construction�activities�that�commonly�use�water�are�shown�in�Table�CA�7.1�for�three�different�types�of�projects.�Note�that�each�activity�has�a�separate�column�and�associated�data.�Note�that,�realistically,�the�data�for�the�project�will�require�information�for�each�activity�on�the�project�that�uses�water�and�will�likely�be�larger�than�the�small�sample�shown.�
Table�CA�7.1:�Sample�Water�Use�Spreadsheet�Entries�for�Different�Types�of�Projects�Project�Type� Urban Rural�(Delivered�Water)� Rural�(Well Water)Date(s)� 6/1/09 � 6/12/09 January � May 2009 August�2009Construction�Activity� Dust�suppression Mixing�concrete Equipment�cleaningWater�Volume�Used� 12,000 27,000 3,500�Volume�Unit� Gal gal Gal�Measurement�Method� City�water�meter 750�gallon�tanks Hose�meterWater�Location/Source� Hydrant Tank�delivery On�site�wellPotable�Water?� Yes No Yes�Disposal�Practice�of�Unused�Water� Stormdrain Storage Ground�surfaceWater�Use�Permit�Type� Hydrant None None�Water�Cost�(per�gal)� � �� $8.13� $0.08��Water�Cost�(per�ccf)� $4.00� � �� ������Total�Cost� $64.16� $219,510.00� $280.00��Notes� Hydrant�permit�
fees�not�included.�Includes�delivery�charge�
��
�Some�commonly�useful�conversions�for�water�volume�are�shown�in�Table�CA�7.2.�
Table�CA�7.2:�Typical�Units�of�Water�Volume�U.S.�Customary�Units� Metric�Units��(S.I.)
1�cubic�foot�(cf)�=�7.481�gallons�(gal) 1�liter�(L)�=�0.001�cubic�meters��(m3)�100�cubic�feet�(cf)�=�1�centum�cubic�foot�(ccf) 1�cubic�meters��(m3)=�1000�liters�(L)�
�Example: Monitored Water Sources for Road Construction in the U.S.
� Montana�limits�water�leases�for�construction�to�60,000�gallons/day�or�120,000�gallons/day/project�(Overcast,�2001).�Requests�for�more�water�must�be�accompanied�by�an�analysis�of�potential�adverse�effects�and�a�description�of�planned�mitigation�actions�at�the�proposed�point�of�diversion.�
� Oregon�allows�public�agencies�to�register�a�water�use�for�road�and�highway�maintenance,�construction;�in�lieu�of�a�permit�for�a�water�right�(Oregon�Water�Resources�Department,�2007).�
� The�City�of�Bend,�Oregon�requires�hydrant�use�permits�for�water�measurement,�protection�of�drinking�water�quality,�water�system�operational�protection,�and�fire�hydrant�integrity�and�maintenance.�The�permits�apply�to�water�obtained�by�normal�meter�installation,�daily�fill�station�use,�monthly�hydrant�meter�and�backflow�units,�or�custom�water�supply�installation.�
� The�City�of�Southlake,�Texas�regulates�water�use�only�during�drought�conditions.�
322
Greenroads™ Manual v1.5 Construction Activities
CA-7 Water Use Tracking
POTENTIAL ISSUES
1. Tracking�water�use�on�roadway�construction�projects�may�be�unfamiliar�to�site�workers.�Training�may�be�necessary�to�accurately�track�all�relevant�water�data.�
2. Water�use�for�road�construction�may�be�regulated�by�local�jurisdictions.�Check�with�authorities�to�determine�water�use�requirements.��
3. Where�roadway�construction�includes�the�use�of�non�potable�water,�there�is�an�obligation�to�ensure�that�workplace�health�and�safety�is�not�negatively�affected�by�the�use�of�the�water.�This�must�include�the�management�of�any�risks�arising�from�the�use,�handling,�storage,�transport,�and�disposal�of�the�water�at�the�project�site.�
RESEARCH Growing�cities�are�putting�stress�on�available�water�supplies,�and�demand�for�water�is�growing�faster�than�the�human�population.�A�recent�government�survey�showed�that,�under�normal�conditions,�at�least�36�states�are�anticipating�local,�regional,�or�statewide�water�shortages�by�2013,�and�drought�conditions�will�exacerbate�shortage�impacts�(GAO,�2003).�Communities�in�water�supply�challenged�regions�of�the�world�have�begun�to�address�the�ongoing�issue�of�potable�(or�drinking�quality)�water�use�on�road�construction�and�maintenance�projects�(CFV,�MAV�and�IPWEA,�2007).�Critical�to�understanding�the�issue�is�to�determine�exactly�how�much�water�is�used�during�roadway�construction�and�maintenance.�
Water�Uses�in�Roadway�Construction�Water�has�many�uses�for�roadway�construction.�However,�there�is�little�information�available�on�the�amount�of�water�used�during�road�construction.�Sand�and�gravel�operations�are�major�users,�and�cement�production�relies�heavily�on�water.�On�site�construction�uses�of�water�include:�concrete�mixing,�concrete�curing,�dust�control,�construction�equipment�washing,�vegetation�establishment,�geotechnical�borings,�adding�water�to�backfill�material/soil�compaction,�pipe�flushing�and�pressure�testing,�and�site�clean�up.�
Water�Sources�for�Roadway�Construction�Typical�water�sources�include�natural�waterbodies,�potable�water�supply�pipelines�(e.g.,�hydrants),�non�potable�water�from�stormwater�or�industrial�discharges,�and�reused�water�from�wastewater�treatment�plants.�Water�withdrawals�from�these�facilities�may�or�may�not�be�regulated�by�the�governing�jurisdiction.�Frequently,�water�use�from�public�supplies�requires�a�temporary�water�right�or�permit�allowing�the�local�jurisdiction�control�over�the�amount�and�method�of�water�withdrawn�for�approved�construction�uses.�Many�regions�also�regulate�potential�harm�to�fish�from�water�withdrawal�from�natural�waterbodies.�For�example,�the�National�Marine�Fisheries�Service�(NMFS)�developed�intake�pumping�and�screening�criteria�for�fish�protection�that�must�be�installed,�operated,�and�maintained�when�protected�aquatic�species�are�present�(NMFS,�2008).��Occasionally,�these�policies�require�water�systems�to�measure�and�account�for�all�water�delivered.�However,�these�systems�are�also�likely�to�be�provided�by�private�water�suppliers.�
Estimates�of�actual�water�use�by�project�activity�are�needed�for�making�more�informed�water�use�decisions.�To�enable�information�sharing�for�improved�water�sourcing�decisions,�some�regions�are�developing�a�centralized�“Water�Atlas”�of�all�alternative�water�sources,�including�quality�and�quantity�information,�to�reduce�demand�on�potable�supplies.�Also,�in�development�is�an�“Industrial�Waste�Water�Exchange”�to�match�producers�of�suitable�industrial�waste�water�with�users�of�water�for�construction�purposes,�allowing�industrial�users�to�have�their�waste�water�disposed�of�and�reused,�resulting�in�potentially�lower�costs�for�both�parties�and�less�overall�potable�water�use.�(CCFV,�MAV�and�IPWEA,�2007)�
Water�Potability�and�Quality�Issues�Large�volumes�of�potable�water�are�commonly�used�in�road�construction,�but�drinking�water�is�subject�to�competing�demands�by�human�populations.�Also,�many�municipalities�chlorinate�their�water�supply,�and�the�level�of�chlorine�in�chlorinated�tap�water�(as�high�as�1.0�milligram�of�chlorine�per�liter�of�water)�is�toxic�to�fish�and�other�
323

Construction Activities Greenroads™ Manual v1.5
Water Use Tracking CA-7
aquatic�organisms�(Greater�Vancouver�Regional�District,�1997)�and�may�be�unsuitable�for�roadway�use�without�prior�mitigation.�
Alternative�water�supplies�alleviate�demand�for�potable�drinking�water�through�management�of�related�health�and�environmental�risks�associated�with�construction�work�activities.�Brackish�and�oil�contaminated�water�show�promise�for�road�construction�in�water�limited�regions�(Taha�et�al.,�2005;�Kansas�Department�of�Health�and�Environment,�2000).�Construction�site�managers�are�increasingly�harvesting�stormwater�from�their�own�sites�and�storing�it�for�later�use�(Queensland�Government,�2007a).�Recycled�water�from�municipal�wastewater�treatment�plants�is�a�potable�water�substitute�for�operational�and�landscaping�purposes�(Queensland�Government,�2007b).�
Discharges�of�construction�site�water�are�governed�by�the�Environmental�Protection�Agency�National�Pollution�Discharge�and�Elimination�System�(NPDES)�permits,�or�state�or�local�equivalent�policies.�
GLOSSARY
Brackish� Water�with�more�salinity�than�fresh�water�but�less�than�seawater�Potability� Water�that�is�suitable�for�human�consumption�
REFERENCES Civil�Contractors�Federation�of�Victoria,�the�Municipal�Association�of�Victoria�and�the�Institute�of�Public�Works�
Engineering�of�Australia�(CCFV,�MAV,�and�IPWEA).�(2007,�March�29).�Water�Use�on�Road�works�–�A�Community�Wide�Issue.�Use�of�Potable�Water�for�Road�Works�Summit.�
Greater�Vancouver�Regional�District.�(1997).�Construction�Water�Use�Guidelines�for�Release�of�Municipal�Tap�Water�to�the�Environment.�Greater�Vancouver�Regional�District,�Metro�Vancouver,�BC.�Available�at�www.metrovancouver.org/about/publications/Publications/ConstructionWaterUseGuidelines.pdf.�
Kansas�Department�of�Health�and�Environment.�(2000).�Kansas�Administrative�Regulations,�Article�47—Use�Of�Oil�and�Gas�Field�Salt�Water�in�Road�Construction�and�Maintenance�Projects�(28�47�1�to�28�47�7).�Kansas�Secretary�of�State.�
National�Marine�Fisheries�Service.�(2008).�Anadromous�salmonid�passage�facility�design.�National�Marine�Fisheries�Service,�Northwest�Region,�Portland,�OR.��
Oregon�Water�Resources�Department.�(2007).�Register�Water�Use�for�Road�and�Highway�Maintenance,�Construction�and�Reconstruction.�Oregon�Water�Resources�Department,�Salem,�OR.�ORS�537.040�and�OAR�690�340�040.��
Overcast,�Kim.�2001.�Water�rights�and�road�construction.�Water�Resources�Division,�Montana�Department�of�Natural�Resources�&�Conservation,�Helena,�MT.�WATER�LINES.�4(1),�1.�
Queensland�Government.�(2007a).�Workplace�Health�and�Safety�Queensland:�Model�Water�Management�Plan�for�the�Civil�Construction�Industry.�Version�1–June�2007.�Department�of�Employment�and�Industrial�Relations,�Queensland�Government,�Australia.�Available�at�http://www.deir.qld.gov.au/workplace/resources/pdfs/model_watermgt.pdf.�
Queensland�Government.�(2007b).�Guide�to�the�workplace�use�of�non�potable�water,�including�recycled�waters.�Workplace�Health�and�Safety�Queensland,�Department�of�Employment�and�Industrial�Relations,�Queensland.�www.nebo.qld.gov.au/council/Non�potable�water_guide.pdf.�
Roads�and�Traffic�Authority.�(2004).�Water�Policy.�Roads�and�Traffic�Authority,�New�South�Wales,�Australia.�Available�at�http://www.rta.nsw.gov.au/environment/downloads/wpolicy.pdf.�
324

Greenroads™ Manual v1.5 Construction Activities
CA-7 Water Use Tracking
Taha,�Ramzi,�Amer�Al�Rawas,�Salim�Al�Oraimi,�Hossam�Hassan,�&�Mohammed�Al�Aghbari.�(2005).�The�Use�of�Brackish�and�Oil�Contaminated�Water�in�Road�Construction.�ENVIRONMENTAL�AND�ENGINEERING�GEOSCIENCE.�11(2),�163�169.�
United�States�General�Accounting�Office�(GAO).�(2003).�Freshwater�Supply:�States’�Views�of�How�Federal�Agencies�Could�Help�Them�Meet�the�Challenges�of�Expected�Shortages.�U.S.�General�Accounting�Office,�Washington,�DC.�GAO�03�514.�
� �
325

Construction Activities Greenroads™ Manual v1.5
Water Use Tracking CA-7
�
326

Greenroads™ Manual v1.5 Construction Activities
CA-8 Contractor Warranty
CONTRACTOR WARRANTY GOAL Incorporate�construction�quality�into�the�public�low�bid�process�through�the�use�of�warranties.��
CREDIT REQUIREMENTS The�project�construction�contract�shall�include,�as�a�minimum,�a�3�year�warranty�for��constructed�portions�of�the�pavement�structure�to�include�surfacing�(e.g.,�hot�mix�asphalt,�portland�cement�concrete,�etc.)�as�well�as�any�underlying�layers�(e.g.,�granular�base�material).�Other�items�may�also�be�included�in�the�warranty�but�are�not�required�to�be�for�this�credit.�
The�terms�of�the�warranty�shall�be�defined�by�the�owner�and�may�include�contractor�input�if�desired.�As�a�minimum,�the�contractual�warranty�specifications�shall�include:�
� Definition�of�what�product(s)�are�warranted�� Length�of�the�warranty�period�� Responsibilities�of�the�owner�� Responsibilities�of�the�contractor�� Responsibility�for�maintenance�� Conflict�resolution�process�� Contractor�quality�control�plan�� Measurement�methods�� Performance�based�requirements�and�associated�threshold�levels�that�require�
corrective�action�by�the�contractor�� Requirements�for�remedial�corrective�action�� Requirements�for�elective�or�preventative�actions�� Basis�of�payment�� Final�warranty�acceptance
�Details
The�intention�of�this�credit�is�to�include�a�short�term�3�year�pavement�warranty�in�the�contract�specifications.�This�warranty�duration�is�intended�to�be�long�enough�to�cover�any�pavement�performance�issues�due�to�poor�quality�construction�but�short�enough�so�as�not�to�create�warranty�bonding�issues�associated�with�contractor�assumption�of�risk�for�unduly�long�periods�of�time.�
Ultimately,�warranties�must�meet�all�applicable�local�and�federal�regulations.�Federal�regulations�are�described�in�23�CFR�635,�Subpart�D,�Section�413,�Guarantee�and�Warranty�Clauses.��
DOCUMENTATION � A�copy�of�the�warranty�specifications�included�in�the�contract.�
CA-8
3 POINTS
RELATED CREDITS
� PR�4�Quality�Control�Plan�
� PR�9�Pavement�Management�System
� CA�1�Quality�Management�System
� PT�6�Pavement�Performance�Tracking�
SUSTAINABILITY COMPONENTS
� Ecology�� Economy�� Extent�� Expectations�� Experience�
BENEFITS
� Increases�Service�Life� Reduces�Lifecycle�
Costs�� Improves�
Accountability�
327

Construction Activities Greenroads™ Manual v1.5
Contractor Warranty CA-8
APPROACHES & STRATEGIES
Develop�a�standard�warranty�policy�(or�a�specific�one�for�the�project�in�question)�that�has�been�vetted�with�industry�that�includes:�
� The�types�of�work�to�be�covered�by�the�warranty�(i.e.�the�surface�course�or�entire�pavement�section)�� The�warrantee�guarantee�and�bonding�requirements�� An�outlet�for�conflict�resolution�for�both�contractor�and�owner�� Pavement�distress�thresholds�and�remedial�action�� Agency�Maintenance�Responsibilities�� Method�of�performance�based�measurement�for�monitoring�the�pavement�� Final�warranty�acceptance�� A�selection�process�of�projects�for�which�warranties�will�be�included�
The�NCHRP�Project�10�68�“Guidelines�for�the�Use�of�Highway�Pavement�Warranties”�final�report�should�serve�as�an�excellent�source�for�viable�approaches�when�released.�As�of�October�2010,�it�is�still�in�final�editing.�
Example: Wisconsin Department of Transportation Asphalt Pavement Warranty
NCHRP�Report�451�(Anderson�&�Russell,�2001)�describes�a�standard�process�model�for�warranty�contracting�(Figure�CA�8.1)�and�then�shows�a�case�study�of�Wisconsin�Department�of�Transportation�(DOT)�warranted�asphalt�pavements�in�its�Appendix�A�as�an�example.���
328
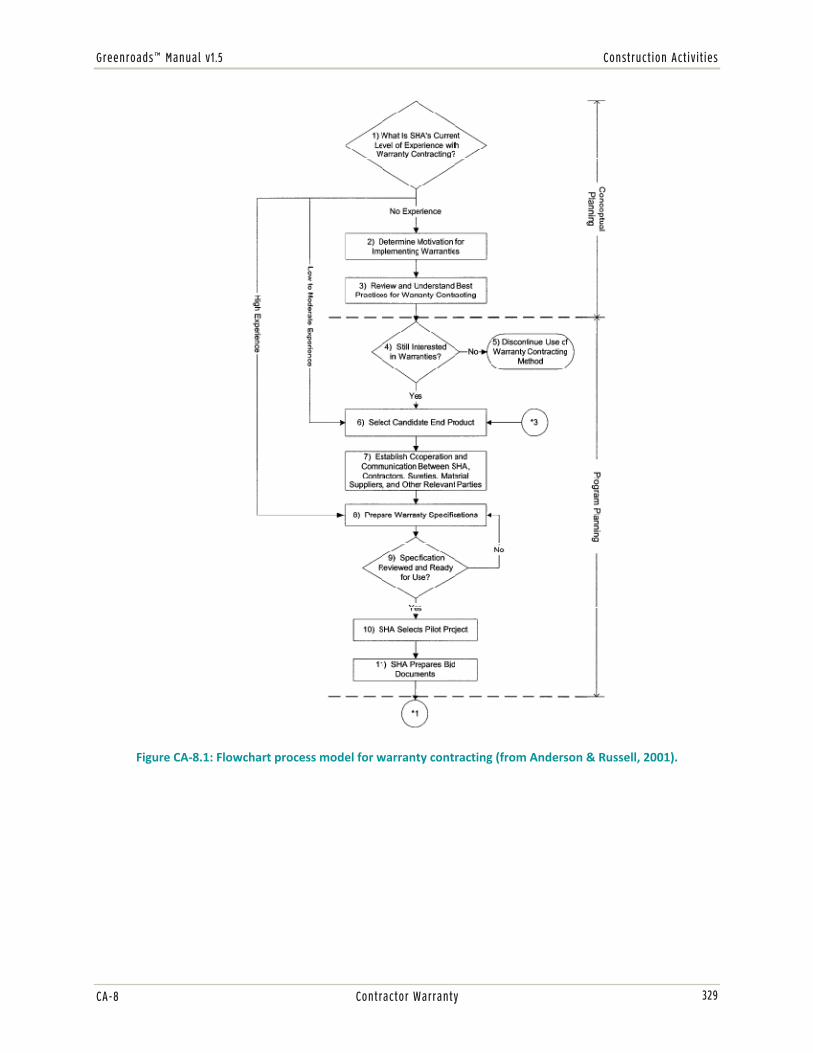
Greenroads™ Manual v1.5 Construction Activities
CA-8 Contractor Warranty
�
Figure�CA�8.1:�Flowchart�process�model�for�warranty�contracting�(from�Anderson�&�Russell,�2001).�
329

Construction Activities Greenroads™ Manual v1.5
Contractor Warranty CA-8
�
Figure�CA�8.1�(continued):�Flowchart�process�model�for�warranty�contracting�(from�Anderson�&�Russell,�2001).��
330

Greenroads™ Manual v1.5 Construction Activities
CA-8 Contractor Warranty
�
Figure�CA�8.1�(continued):�Flowchart�process�model�for�warranty�contracting�(from�Anderson�&�Russell,�2001).��Specifics�of�the�case�study�can�be�viewed�at:�http://144.171.11.40/news/blurb_detail.asp?id=5476.��
POTENTIAL ISSUES
1. Using�a�warranty�clause�in�roadway�construction�contracts�is�typically�a�programmatic�decision�(must�be�implemented�as�standard�practice�within�an�owner�agency)�and�not�a�project�specific�one.�
2. Warranty�provisions�as�a�matter�of�standard�practice�can�reduce�contractor�competition�as�sureties�decide�which�contractors�to�bond�and�which�ones�not�to.�Experience�to�date�has�been�that�bonding�for�short�term�warranties�(like�the�5�year�warranty�in�this�credit)�have�not�been�an�issue�when�done�correctly.�
3. Long�term�performance�warranties�can�reduce�contractor�bonding�capacity�because�of�the�increased�risk�they�must�carry�on�their�books.�
4. Warranties�are�not�free.�They�are�generally�priced�based�on�the�risk�or�perceived�risk�they�transfer�to�the�contractor.�
5. Performance�measures�on�which�a�completed�project�is�to�be�judged�can�be�difficult�to�agree�upon.�It�can�also�be�difficult�to�firmly�establish�a�link�between�contractor�construction�and�performance�parameter�measurement.�
331

Construction Activities Greenroads™ Manual v1.5
Contractor Warranty CA-8
6. Instituting�a�new�warranty�program�can�be�difficult�because�of�the�learning�period�involved�where�both�contractors�and�owners�adjust�to�the�warranty�clause,�its�implementation�and�interpretation.�
7. A�warranty�does�not�guarantee�improved�quality,�however,�most�research�to�date�cites�better�quality�as�an�outcome�of�contractor�warranty�programs.���
RESEARCH A�warranty�is�a�fairly�common�tool�in�consumer�transactions.�Essentially,�a�warranty�is�an�assurance�by�the�seller�that�property�or�goods�are�as�represented�or�promised.�This�assurance�is�often�backed�by�a�specifically�stated�remedy�in�the�event�the�property�or�good�fails�to�meet�the�warranty.��
A�Brief�History�In�roadways,�warranties�have�been�used�in�association�with�pavements�for�quite�some�time.�The�earliest�pavement�warranties�arose�in�the�late�1800s;�one�example�being�the�15�year�warranty�offered�by�the�Warren�Brothers�Company�on�their�patented�Warrenite�Bitulithic�Pavement�(FHWA,�2009).�In�the�1900s�warranties�fell�out�of�favor.�For�instance,�prior�to�1991�a�longstanding�FHWA�policy�used�to�restricted�warranties�on�federal�aid�projects�to�electrical�and�mechanical�equipment�because�it�was�felt�that�without�this�restriction�federal�funds�could�be�used�for�routine�maintenance,�which�was�illegal�(FHWA,�2007).�In�the�1990s�pavement�warranties�began�to�make�a�comeback.�Rule�changes�and�an�evolving�view�of�warranties�led�to�several�agencies�experimenting�with�and�then�using�warranties�on�a�regular�basis.�Although�they�are�still�more�common�elsewhere�(e.g.,�Europe)�warranties�are�common�for�some�owner�agencies�in�the�U.S.�For�other�agencies,�they�are�either�not�used�or�expressly�forbidden.��
Reasons�for�Warranty�Use�Warranty�use�can�be�viewed�as�driven�largely�by�two�forces:�(1)�the�desire�to�improve�pavement�quality�and�durability,�and�(2)�the�desire�to�reduce�owner�oversight�during�construction�(AGC,�n.d.).�The�first�concern�(improved�quality)�can�also�be�addressed�by�other�non�warranty�solutions�such�as�a�quality�control�specification�or�tighter�specifications.�Also,�a�warranty�requirement�does�not�directly�ensure�any�greater�quality;�it�only�requires�a�contractor�to�provide�a�remedy�if�certain�parameters�(e.g.,�smoothness,�cracking,�rutting)�are�not�met.�As�with�all�warranties,�a�pavement�warranty�is�priced�and�bid�accordingly.�In�an�extreme�situation,�a�contractor�may�choose�to�include�the�cost�of�an�entire�overlay�or�partial�reconstruction�into�the�bid�price�to�mitigate�the�risk�of�corrective�actions�required�by�the�warranty.�The�second�reason�(reduced�oversight)�may�not�be�realized�because�owner�personnel�are�usually�needed�to�oversee�warranted�pavements�(AGC,�n.d.).��
Types�of�Warranties�In�general,�there�are�three�basic�types�of�pavement�warranties:��
� Materials�and�workmanship.�Almost�all�construction�is�covered�by�a�short�duration�(usually�1�year)�materials�and�workmanship�warranty.�This�type�of�warranty�assigns�risk�to�the�contractor�for�following�agency�specifications�in�regards�to�materials�and�workmanship.�If�a�problem�or�defect�is�detected�within�the�warranty�period,�the�agency�usually�uses�a�forensic�analysis�to�determine�the�cause.�If�it�is�determined�that�specification�non�compliance�caused�the�problem,�it�is�repaired�at�the�contractor's�expense.�Otherwise,�the�agency�assumes�repair�costs.�This�type�of�warranty�is�almost�universal,�rarely�collected�on�and�is�usually�covered�by�sureties�at�no�additional�charge�to�the�contractor.��
� Short�term�performance.�A�warranty�based�on�the�performance�of�the�finished�pavement�product�that�lasts�for�2�7�years.�These�warranties�specify�a�number�of�performance�parameters�that�the�pavement�must�meet�over�time.�If�they�are�not�met�the�contractor�is�required�to�repair/replace�the�poor�performing�pavement.�The�general�intent�of�these�short�term�performance�warranties�is�to�place�the�risk�of�poor�construction�on�the�contractor.�In�most�situations,�poor�pavement�construction�will�manifest�itself�in�poor�pavement�condition�within�about�2�5�years.��
� Long�term�performance.��A�warranty�based�on�the�performance�of�the�finished�pavement�product�that�lasts�for�up�to�20�years�and�beyond.�These�warranties�specify�a�number�of�performance�parameters�that�the�pavement�must�meet�over�time.�If�they�are�not�met�the�contractor�is�required�to�repair/replace�the�poor�performing�
332

Greenroads™ Manual v1.5 Construction Activities
CA-8 Contractor Warranty
pavement.�These�long�term�performance�warranties�essentially�make�the�contractor�responsible�for�maintenance�and�rehabilitation�of�the�pavement�in�question.��
Benefits�and�Market�Realities�of�Warranties�Most�often,�owners�pursue�warranties�because�of�a�perceived�benefit.�However,�the�use�of�contracted�warranties�also�creates�a�number�of�market�conditions�that�may�or�may�not�negate�any�perceived�benefits.�The�following�is�a�brief�listing�of�warranty�benefits�and�market�realities.��
Benefits�Allow�evaluation�based�on�performance.�Warranty�contracts�often�provide�little�direction�in�materials�and�methods�and�relay�instead�on�defining�performance�over�time�as�the�key�contract�element.�This�allows�owner�agencies�and�contractors�to�concentrate�their�efforts�on�end�results�rather�than�methods.�This�aligns�owner�evaluation�of�construction�with�the�public�perception�of�the�construction�as�well�as�allows�contractors�substantial�latitude�to�innovate�since�methods�are�not�defined�in�the�contract.��
Improved�quality.�In�2004,�Bayraktar�et�al.�(2004)�showed�13�states�were�experienced�with�warranty�contracting�with�varying�degrees�of�success.�Michigan,�Ohio,�Florida,�and�South�Carolina�had�the�highest�amount�of�warranty�contracts�each�having�a�10�to�30�percent�of�construction�contracts�containing�a�pavement�warranty.�In�the�same�study,�69�percent�of�the�state�departments�of�transportation�that�responded,�noted�an�improvement�in�the�overall�quality�of�the�final�product�(Bayraktar�M.�et�al.,�2004).���
Reduced�owner�risk.�Warranties�tend�to�place�more�of�the�risk�of�poor�construction�on�the�contractor.�Typically,�even�a�poorly�constructed�pavement�is�likely�to�last�1�year�(the�typical�duration�of�a�materials�and�workmanship�warranty)�in�fairly�good�condition.�With�a�warranty,�an�owner�can�collect�from�a�contractor�for�poor�construction�based�on�pavement�condition�measured�over�the�life�of�the�warranty.�
Inclusion�of�construction�quality�in�a�competitive�bid.�In�most�traditional�competitively�bid�design�bid�build�pavement�contracts,�pavement�quality�is�assumed�to�be�a�minimum�standard�to�be�met�rather�than�the�subject�of�contractor�competition.�Warranty�requirements�usually�will�require�contractors�to�build�their�perceived�cost�of�the�warranty�(their�price�for�the�risk�incurred)�into�their�competitive�bid.�Therefore,�contractors�that�build�high�quality�pavement�and�have�good�knowledge�of�their�construction�quality�are�theoretically�able�to�reduce�their�bid�amount�because�of�a�known�lower�risk.�In�essence,�pavement�quality�becomes�a�competitively�bid�item.��
Market�Realities�(AGC,�n.d.)�Limiting�competition.�Asking�contractors�to�assume�risk�for�pavements�after�they�are�built�generally�means�that�sureties�are�required�to�provide�warranty�bonds.�Sureties�can�be�selective�in�their�issuance�of�warrant�bonds,�which�may�limit�competition.��
Reduced�bonding�capacity.�The�value�of�the�warranty�bonds�a�contractor�carries�can�reduce�its�bonding�capacity,�thus�limiting�the�number�and�value�of�jobs�it�can�bid.�Long�term�pavement�warranties�can�especially�tax�bonding�capacity�and�sureties�because�the�long�duration�they�must�be�carried.�Also,�there�is�considerable�pressure�on�sureties;�those�who�bond�contractors.�With�a�warranty�essentially�holding�a�contractor�at�risk�for�the�warranty�period,�the�surety�will�also�be�held�liable�for�the�warranty�period.�The�requirement�of�a�separate�warranty�bond�has�been�the�common�practice�for�contractors�participating�in�pavement�warranty�contracts.�Sureties�have�a�very�different�responsibility�when�evaluating�contractors�bidding�on�warranty�contracts.�Some�sureties�view�the�process�as�a�difficult�situation.��For�instance,�they�are�essentially�required�to�predict�that�the�contractors�that�they�insure�will�be�in�business�for�the�entire�warranty�period.�For�sureties,�the�major�sources�of�risk�when�evaluating�contractors�for�warranty�projects�include�warranty�period,�financial�strength,�project�experience,�and�past�performance�(Bayraktar�et�al.,�2006).���
Increased�cost.�Warranties�may�increase�construction�costs�because�(1)�higher�quality�construction�may�cost�more�because�better�materials�or�more�meticulous�methods�are�used,�or�(2)�the�cost�of�warranties�are�bid�into�
333

Construction Activities Greenroads™ Manual v1.5
Contractor Warranty CA-8
contracts.�Ultimately,�a�warranty�transfers�risk�to�the�contractor�and�that�risk�is�priced.�The�inclusion�of�a�warranty�provision�can�increase�contract�costs�by�5�10%�(Bayraktar�M.�et�al.,�2004).��However,�warranties�have�also�led�to�lower�pavement�life�cycle�costs�(Singh�et�al.,�2007).��Specifically�in�Indiana,�some�estimates�have�shown�an�increase�of�over�thirty�percent�in�the�expected�cost�effectiveness�of�a�warranty�program�(Singh�et�al.,�2007).�
Difficulty�in�setting�objective�performance�measures.�It�is�difficult�to�settle�on�an�objective�set�of�performance�measures�by�which�an�owner�can�judge�a�pavement�and�determine�if�defects�are�due�to�contractor�construction.�Typical�performance�measures�can�be�roughness,�rut�depth,�surface�friction�and�cracking.�It�is�often�difficult�to�establish�that�such�items�are�directly�related�to�construction�quality�and�not�some�other�factor�such�as�heavier�than�anticipated�loading�or�poor�subgrade.���
Difficulting�in�starting�a�warranty�program.�Outside�states�using�warranties�regularly,�contractor�experience�is�limited.�The�majority�of�owner�agencies�using�warranties�have�seen�a�similar�number�of�bidders�on�projects�compared�to�projects�without�warranties.�However,�when�West�Virginia�began�its�warranty�program,�it�had�many�projects�that�contained�a�single�bidder�(Bayraktar�M.�et�al.,�2006).��Contractors�showed�a�tendency�to�either�not�bid�due�to�being�concerned�about�the�risk,�or�to�charge�more�on�a�given�bid.�Ultimately,�there�may�be�some�time�involved�where�contractors�and�owner�agencies�become�familiar�with�the�terms�of�warranties�and�how�these�terms�are�enforced.�During�this�time,�it�is�not�uncommon�for�contractors�to�bid�higher�to�compensate�for�increased�risk.����
State�of�the�Practice�The�Federal�Highway�Administration�(FHWA)�maintains�a�website�on�construction�warranties�in�federal�aid�contracts.�They�also�include�a�subsection�on�pavement�warranties�(FHWA,�2009).�Table�CA�8.1�lists�various�states�with�warranty�experience�in�roadway�construction.��
Table�CA�8.1:�Warranty�Provisions�Used�by�Various�States�(FHWA�2007)�
�For�further�discussion�of�warranty�contracting,�see�NCHRP�Report�451�Guidelines�for�Warranty,�Multi�Parameter,�and�Best�Value�Contracting�(Anderson�&�Russell,�2001).��
GLOSSARY
HMA/Rubberized�HMA� 3�8�years AL,�CA,�CO,�FL,�IN,�ME,�MI,�MO,�MS,�OH,�NM,�UT,�WIHMA�Crack�Treatment� 2�years MIPCC�Pavement� 5�10�years KY,�ME,�MI,�MS,�UT,�WIBridge�Components� 5�10�years WA,�ME,�NMBridge�Painting� 2�10�years IN,�MA,�MD,�ME,�MI,�NHChip�Sealing� 1�2�years CA,�MIITS�Components/Buildings� 2�3�years VA,�NCLandscaping/Irrigation� 1�year WYMicrosurfacing� 2�years CO,�MI,�NV,�OHPavement�Marking� 2�6�years FL,�MT,�OR,�PA,�UT,�WVSign�Sheeting� 7�12�years WVRoofing� 10�years HI
Warranty� A�collateral�assurance�or�guarantee�by�a�seller�that�a�property�or�goods�are�as�represented�or�promised.�This�assurance�is�often�backed�by�a�specifically�stated�remedy�in�the�even�the�property�or�good�fails�to�meet�the�warranty.��
334
Greenroads™ Manual v1.5 Construction Activities
CA-8 Contractor Warranty
REFERENCES Anderson,�S.D.�&�Russell,�J.S.�(2001).�National�Cooperative�Highway�Research�Program�(NCHRP)�Report�451�
Guidelines�for�Warranty,�Multi�Parameter,�and�Best�Value�Contracting.�Transportation�Research�Board,�National�Research�Council,�Washington,�D.C.��Available�at�http://144.171.11.40/news/blurb_detail.asp?id=5476.�
Aschenbrener,�T.,�Goldbaum,�J.,�&�Shuler,�S.�(2008).�Evaluation�of�Short�Term�Warranty�and�Prescriptive�Specifications�for�Hot�Mix�Pavements�After�8�Years.�Transportation�Research�Record:�Journal�of�the�Transportation�Research�Board,�2081(�1),�130�138.�doi:�10.3141/2081�14.���
Association�of�General�Contractors�(AGC).�(no�date�given).�Pavement�Warranty�Task�Force�Report.�Available�at�http://www.agc.org/cs/industry_topics/additional_industry_topics/pavement_warranties.�Accessed�31�December�2009.�
Bayraktar,�M.�E.,�Cui,�Q.,�Hastak,�M.,�&�Minkarah,�I.�(2004).�State�of�Practice�of�Warranty�Contracting�in�the�United�States.�Journal�of�Infrastructure�Systems,�10(2),�60�68.��
Bayraktar,�M.�E.,�Cui,�Q.,�Hastak,�M.,�&�Minkarah,�I.�(2006).�Warranty�Bonds�from�the�Perspective�of�Surety�Companies.�Journal�of�Construction�Engineering�and�Management,�132(4),�333�337.���
Federal�Highway�Administration�(FHWA).�(2007).�Briefing:�Warranty�Clauses�in�Federal�Aid�Highway�Contracts.�Available�at�http://www.fhwa.dot.gov/programadmin/contracts/warranty.cfm.�Accessed�31�December�2009.�
Federal�Highway�Administration�(FHWA).�(2009).�Pavement�Warranties.�Available�at�http://www.fhwa.dot.gov/Pavement/warranty.�Accessed�31�December�2009.�
Federal�Highway�Administration�(FHWA).(2009).��Short�Term�Pavement�Warranties�Program�for�HMA�Cliff�Notes.�http://www.fhwa.dot.gov/pavement/warranty/cliffnotes.cfm�.�Accessed�10�October�2010.�
Gharaibeh,�N.,�&�Miron,�A.�(2008).�Warranty�Specifications�for�Highway�Construction;�Current�Practices�and�Evolution�to�Advanced�Quality�Systems.�Transportation�Research�Record�2081,�77�82.���
Moynihan,�G.,�Zhou,�H.,�&�Cui,�Q.�(2009).�Stochastic�Modeling�for�Pavement�Warranty�Cost�Estimation.�Journal�of�Construction�Engineering�and�Management,�135(5),�352�359.���
Sees,�E.,�Cui,�Q.,�&�Johnson,�P.�(2009).�Legal�Environment�for�Warranty�Contracting.�Journal�of�Management�in�Engineering,�25(3),�115�121.��
Singh,�P.,�Oh,�J.�E.,�Labi,�S.,�&�Sinha,�K.�C.�(2007).�Cost�Effectiveness�Evaluation�of�Warranty�Pavement�Projects.�Journal�of�Construction�Engineering�and�Management,�133(3),�217�224.���
Thompson,�B.�P.,�Anderson,�S.�D.,�Russell,�J.�S.,�&�Hanna,�A.�S.�(2002).�Guidelines�for�Warranty�Contracting�for�Highway�Construction.�Journal�of�Management�in�Engineering,�18(3),�129�137.��
�
� �
335

Construction Activities Greenroads™ Manual v1.5
Contractor Warranty CA-8
�
336

Greenroads Manual v1.5 © 2011
�
�
�
�
�
MATERIALS & RESOURCES
� �
337

Greenroads Manual v1.5 © 2011
� �
338
Greenroads™ Manual v1.5 Materials & Resources
MR-1 Lifecycle Assessment
LIFECYCLE ASSESSMENT GOAL Create�new�lifecycle�assessment�information�for�roads.�
CREDIT REQUIREMENTS Conduct�a�detailed�process�based�lifecycle�assessment�(ISO�LCA)�or�hybrid�economic�input�output�lifecycle�assessment�(Hybrid�EIO)�according�to�the�ISO14040�standard�frameworks�for�the�final�roadway�design�alternative.�Include�all�items�on�the�project�bid�list�in�the�initial�scope�of�the�study�before�any�streamlining�of�the�scope�is�done.�Use�primary�data�for�all�processes�where�possible.�Where�no�primary�data�exists,�use�the�best�available�data�and�justify�the�substitution.�Choose�at�least�three�impact�categories�to�report�for�the�lifecycle�impact�assessment�(LCIA)�from�the�Environmental�Protection�Agency�(EPA)�Framework�for�Responsible�Environmental�Decision�Making�(FRED:�2000).�Use�equivalency�factors�for�the�impact�assessment�based�on�the�most�current�version�of�the�indicator�model�referenced.�FRED�is�available�from�the�American�Center�for�Life�Cycle�Assessment�here:�http://www.lcacenter.org/library/pdf/fred.pdf.�Note�that�some�equivalency�factors�in�this�document�are�outdated.�See�the�following�MR�1�Research�section�for�more�details.�
Details
The�LCA�may�be�streamlined�according�to�the�streamlining�process�recommendations�from�the�1999�Society�of�Environmental�Toxicology�and�Chemistry�(SETAC)�report�“Streamlined�Life�Cycle�Assessment:�A�Final�Report�from�the�SETAC�North�America�Streamlined�LCA�Workgroup”�(Weitz�et�al.,�1999).�
Social�impact�assessment�is�not�required�for�this�credit,�but�may�be�completed�if�social�metrics�or�indices�are�appropriate�or�relevant�for�the�project.�
DOCUMENTATION Copy�of�the�completed�LCA.�This�document�should�include,�at�minimum,�the�following�specific�information.�
� Name�and�contact�information�of�person(s)�who�conducted�the�LCA.��Be�sure�to�list�any�LCA�Certified�Professionals�(LCACP)�involved�in�the�project.�
� A�list�of�all�data�sources�used,�and�the�input�data�used.�If�data�is�proprietary,�list�the�owner�and�contact�information,�and�identify�all�processes�included�in�the�proprietary�data�sets.�
� List�any�material�inputs�not�listed�in�PR�3�but�included�in�the�LCA�(these�will�be�non�pavement�items).�
� Detailed�results�of�the�life�cycle�inventory�(LCI).�� Life�cycle�impact�assessment�(LCIA)�results�showing�a�minimum�of�three�impact�
categories�(i.e.�global�warming�potential,�acidification,�photochemical�smog,�human�health,�etc.)�from�FRED.�List�sources�of�equivalency�factors�used.�
� The�data�quality�score�of�the�final�alternative�(see�MR�1�Research�section.)�� A�list�of�the�top�three�contributing�processes�to�the�impact�categories�(based�on�
normalized�results,�such�as�annual�energy�use�per�American�household,�etc.)�� A�list�of�all�limitations�of�the�study�scope�and�data�used.�
MR-1
2 POINTS
RELATED CREDITS
� PR�2�Lifecycle�Cost�Analysis�
� PR�3��Lifecycle�Inventory�
� PR�6�Waste�Management�Plan�
� EW�4�Stormwater�Cost�Analysis��
� CA�3�Site�Recycling�Plan�
� CA�7�Water�Use�Tracking�
SUSTAINABILITY COMPONENTS
� Ecology�� Economy�� Extent�� Expectations�� Exposure�
BENEFITS
� Improves�Accountability�
� Increases�Awareness� Creates�New�
Information�
339

Materials & Resources Greenroads™ Manual v1.5
Lifecycle Assessment MR-1
APPROACHES & STRATEGIES
� Create�a�spreadsheet�to�capture�all�of�the�processes�for�production�of�the�roadway�project�and�complete�an�LCA�in�accordance�with�the�referenced�ISO�standards.�
� Hire�a�professional�third�party�consultant�if�possible�to�review�the�project�and�produce�a�final�LCA�report.�The�benefits:�sometimes�they�have�access�to�some�proprietary�data�and�software�that�is�more�recent�or�higher�quality�than�publicly�available�sources.��
� Use�an�open�source�software�program�for�LCA.�These�are�becoming�more�common�and�are�publically�available�for�free�via�a�number�of�LCA�organizations.�
� Consider�using�a�hybrid�EIO�model�that�incorporates�both�economic�sector�data�and�process�based�data.�� Collect�primary�emissions�data�wherever�possible.�� Use�data�that�is�current,�local�or�otherwise�project�specific�to�improve�data�quality�for�the�project�LCA�model.�
Example: Comprehensive Process-Based LCA Approach (Stripple, 2001)
While�not�a�complete�LCA�because�the�impact�assessment�and�interpretation�steps�were�not�completed,�Stripple�(2001)�provides�the�best�available�example�to�date�of�what�should�be�considered�in�a�comprehensive�roadway�lifecycle�inventory�analysis�and�impact�assessment�based�on�an�ISO�LCA�model�(from�SETAC�Europe).�The�lifecycle�phases�studied�were�construction,�operation,�maintenance�and�associated�transportation�activities.�Extraction�activities�and�traffic�were�included,�but�disposal�of�waste�and�production�of�capital�equipment�were�not�considered.�In�a�truly�comprehensive�study,�waste�generation�and�recycling�activities�for�most�pavements�will�have�a�large�role�in�the�overall�assessment�of�the�roadway.�Capital�equipment�production�may�also�be�included�but�it�is�not�unusual�for�it�to�be�excluded�via�the�streamlining�process.�
Following�is�a�list�of�unit�processes�(and�equipment)�that�were�considered�for�the�inventory�analysis�within�his�defined�Goal,�Scope,�and�system�boundaries�(slightly�adapted�for�clarity).�(Stripple,�2001)�
Table�MR�1.1:�Example�unit�processes�in�Stripple�(2001)�� Aggregate�production�(blasting,�
crushing)�� Aluminium�[sic]�production�� Bitumen�production�� Cement�production�� Cement�stabilization�of�base�
course�in�concrete�road�construction��
� Land�clearing�of�right�of�way��� Clearing�snow�� Cold�mix�asphalt�production���� Concrete�production�(mixing)�� Concrete�texturing�� Driving�diesel�maintenance�
vehicles�� Electricity�production�� Erection�and�removal�of�snow�
posts�� Extraction�of�quarry�gravel�and�
sand���� Extraction�of�salt�for�winter�
road�maintenance�
� Felling�(trees)�� Foundation�reinforcement�
using�cement/lime�columns�� Foundation�reinforcement�
using�concrete�piles���� Freight�transportation�by�sea�� Hot�mix�asphalt�production�� Laying�of�concrete�wearing�
course�in�concrete�road�construction���
� Laying�of�road�markings�� Minor�operational�activities�
(minor�repairs,�other)�� Mowing�of�right�of�way��� Operating�asphalt�pavers�� Operating�asphalt�rollers�� Operating�dump�trucks�� Operating�excavators�� Operating�the�tack�coat�truck�� Operating�wheel�loaders��� Polyethylene�plastic�
production�
� Quicklime�production��� Road�marking,�sign,�lighting,�
traffic�light,�other�railing�and�fence�production�
� Salt�gritting�of�road�in�winter�road�maintenance���
� Sand�gritting�of�road�in�winter�road�maintenance���
� Saw�cutting�joints�in�concrete�� Sealing�concrete�joints��� Steel�production�� Surface�milling�of�concrete�and�
asphalt�paving�� Synthetic�rubber�(EPDM)�
production�� Trench�digging�in�road�
maintenance�� Truck�transportation�� Washing�of�road�signs��� Washing�of�roadside�posts���� Wildlife�fences��� Zinc�production�
�
340
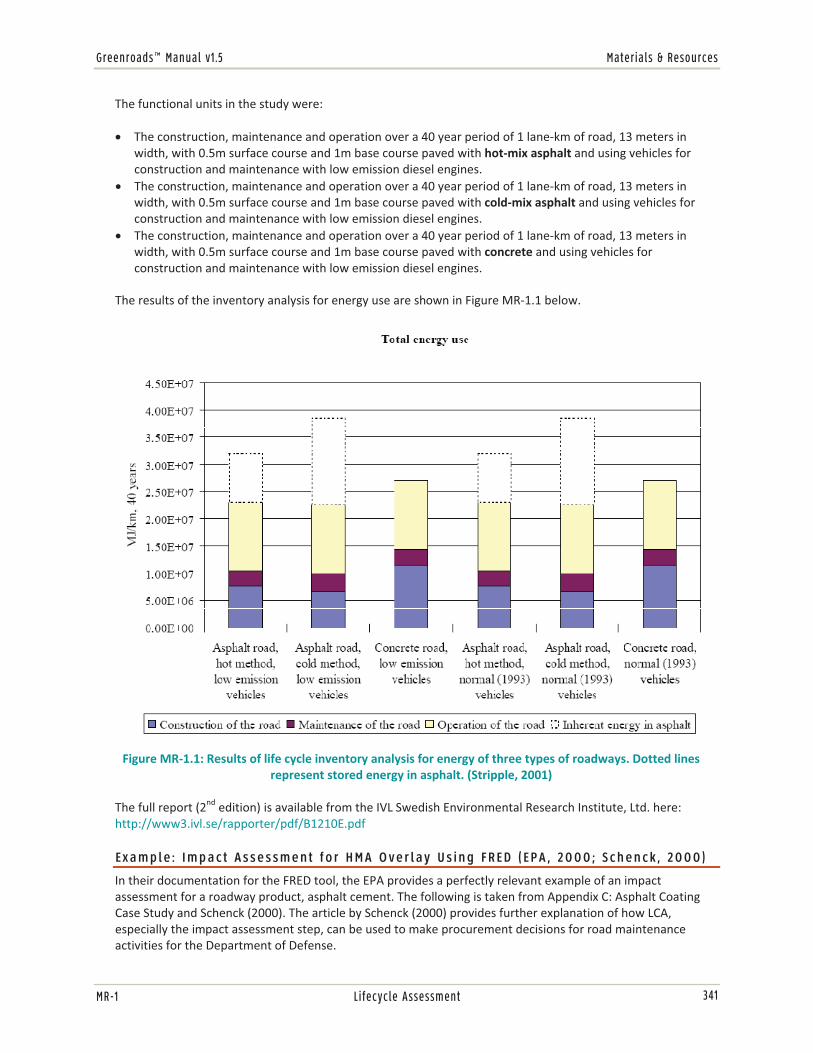
Greenroads™ Manual v1.5 Materials & Resources
MR-1 Lifecycle Assessment
The�functional�units�in�the�study�were:�
� The�construction,�maintenance�and�operation�over�a�40�year�period�of�1�lane�km�of�road,�13�meters�in�width,�with�0.5m�surface�course�and�1m�base�course�paved�with�hot�mix�asphalt�and�using�vehicles�for�construction�and�maintenance�with�low�emission�diesel�engines.�
� The�construction,�maintenance�and�operation�over�a�40�year�period�of�1�lane�km�of�road,�13�meters�in�width,�with�0.5m�surface�course�and�1m�base�course�paved�with�cold�mix�asphalt�and�using�vehicles�for�construction�and�maintenance�with�low�emission�diesel�engines.�
� The�construction,�maintenance�and�operation�over�a�40�year�period�of�1�lane�km�of�road,�13�meters�in�width,�with�0.5m�surface�course�and�1m�base�course�paved�with�concrete�and�using�vehicles�for�construction�and�maintenance�with�low�emission�diesel�engines.�
The�results�of�the�inventory�analysis�for�energy�use�are�shown�in�Figure�MR�1.1�below.�
Figure�MR�1.1:�Results�of�life�cycle�inventory�analysis�for�energy�of�three�types�of�roadways.�Dotted�lines�represent�stored�energy�in�asphalt.�(Stripple,�2001)�
�The�full�report�(2nd�edition)�is�available�from�the�IVL�Swedish�Environmental�Research�Institute,�Ltd.�here:�http://www3.ivl.se/rapporter/pdf/B1210E.pdf��
Example: Impact Assessment for HMA Overlay Using FRED (EPA, 2000; Schenck, 2000)
In�their�documentation�for�the�FRED�tool,�the�EPA�provides�a�perfectly�relevant�example�of�an�impact�assessment�for�a�roadway�product,�asphalt�cement.�The�following�is�taken�from�Appendix�C:�Asphalt�Coating�Case�Study�and�Schenck�(2000).�The�article�by�Schenck�(2000)�provides�further�explanation�of�how�LCA,�especially�the�impact�assessment�step,�can�be�used�to�make�procurement�decisions�for�road�maintenance�activities�for�the�Department�of�Defense.��
341

Materials & Resources Greenroads™ Manual v1.5
Lifecycle Assessment MR-1
Goal�&�Scope�of�Study�The�study�modeled�a�1.5�inch�thick�overlay�applied�with�a�frequency�of�7�9�years�over�a�20�year�time�period�and�estimated�the�temperature�of�application�at�or�above�165°F.�For�purposes�of�this�Example,�the�inventory�and�impact�assessment�results�for�the�water�based�asphalt�emulsion�alternative,�GSB�88�(gilsonite),�are�omitted�to�minimize�confusion�with�the�LCIA�process�that�is�required�for�this�credit.�Note�that�in�general,�this�was�a�very�simplified�life�cycle�assessment�model�due�to�the�simplicity�of�the�product�itself�(EPA,�2000).�Explicit�data�criteria�limits�ensured�that�Input�and�output�data�was�not�collected�if�it�represented�less�than�one�percent�of�the�total�mass,�energy,�or�expected�toxicity�score�contribution�(human�health�and�ecosystem�health�indicators).�Table�MR�1.2�below�shows�the�processes�and�material�data,�sources�and�types�of�data�collected�for�the�model.�
Table�MR�1.2:�Data�Sources�for�LCA�Study�(Schenck,�2000;�EPA,�2000)�Process�or�Material�Data� Type SourceAsphalt� Industry�Average Industry�Association�Aggregate� Primary Manufacturer�Diesel�(HMA�Production)� Primary:�surrogate ApplierDiesel�(Construction�Vehicle�Fuels)� Industry�Average Published�Data�Sand� Primary Manufacturer�Gilsonite� Primary Manufacturer�Hydrochloric�acid�(HCl)� Primary Manufacturer�Water� Primary Manufacturer�NP�40�(Detergent)� Primary Manufacturer�Surfactant� Industry�Average Published�Data�Light�Cycle�Oil� Primary Manufacturer�Land�Use�(Road,�m2)� Calculated This�studyLand�Use�(Manufacturing,�m2)� Mixed Manufacturer,�Engr.�Estimate
Inventory�Analysis�Table�MR�1.3�presents�the�results�of�the�lifecycle�inventory�analysis�for�the�HMA�application�only.�A�zero�indicates�that�a�particular�raw�material�was�used�to�make�the�“Thin�Layer�of�HMA”�product.�
Table�MR�1.3:�Summary�of�HMA�Inventory�System�Description�(Raw�Materials)� Thin�Layer�of�HMA�(2�Applications)�lb/lane�mi/20�yrAsphalt� 122,621Aggegate� 2,181,960Diesel�(Construction�Vehicle�Fuels)� 3,063Diesel�(HMA�Production)� 884Sand� 0Gilsonite� 0Hydrochloric�acid�(HCl)� 32Water� 4,779NP�40�(Detergent)� 0Surfactant� 156Light�Cycle�Oil� 0Land�Use�(Road,�m2)� 5888Land�Use�(Manufacturing,�m2)� <10
Impact�Assessment�Table�MR�1.4�presents�the�results�of�the�lifecycle�impact�assessment�for�the�HMA�application�only.�Notably,�the�values�in�Table�MR�1.3�above�translate�through�to�Table�MR�1.4:�a�zero�indicates�that�a�particular�value�in�the�inventory�analysis�was�also�zero.�This�is�because�the�MR�1.3�values�are�multiplied�by�equivalency�factors�as�defined�in�the�FRED.�(Technically,�it�could�also�mean�that:�1.�the�equivalency�factor�assigned�to�a�particular�
342

Greenroads™ Manual v1.5 Materials & Resources
MR-1 Lifecycle Assessment
impact�was�zero�though�generally�an�impact�with�zero�equivalency�would�not�be�reported�(i.e.�not�studied),�or�2.�the�result�could�be�considered�negligible�and�reported�as�zero.)�
Table�MR�1.4:�LCIA�Results�Impact� Thin�Layer�of�HMA�(2�Applications)�lb/lane�mi/20�yrIndicator� LCIA�ResultsGlobal�Warming�Potential�(kg�CO2e)� 40,000Ozone�Depletion�(kg�CFC�11e)� 0Acidification�(kg�SO2e)� 300Eutrophication�(kg�PO4e)� 0.02Photochemical�Smog�(kg�O3e)� 80Human�Toxicity�� Cancer� 0.2� Non�Cancer� 5Ecotoxicity�(dimensionless)� 2000Resource�Depletion�� Fossil�(tons�oil�equivalent)� 90000� Mineral�(equivalent�tons)� 0� Precious�metals�(equivalent�tons)� 0Other�Indicators�� Land�Use�(ha)� 0.6� Water�Use�(m3)� 2� Solid�Waste�(ton)� 800
�Figure�MR�1.2�shows�an�example�of�a�contribution�analysis,�where�the�relative�contributions�(on�a�scale�of�100�percent)�are�shown�as�assigned�to�each�lifecycle�stage.�A�contribution�analysis�may�also�be�done�with�the�LCIA�results�to�show�which�processes�contribute�most�to�certain�impacts.�
�
Figure�MR�1.2:�Example�contribution�analysis�for�LCIA�of�asphalt�cement.�(Schenck,�2000)��
343

Materials & Resources Greenroads™ Manual v1.5
Lifecycle Assessment MR-1
Some�Notes�on�Results�(Interpretation)�This�Example�only�shows�half�the�picture,�but�the�full�LCA�was�actually�completed�on�both�types�of�maintenance�techniques�and�is�explained�in�Schenck�(2000)�and�the�FRED�documentation.�However,�evaluating�these�two�alternatives�by�comparing�the�impacts�of�the�two�products�must�take�into�account�the�relative�data�quality�available.�A�few�brief�examples�of�notes�that�might�be�useful�to�a�reader�of�an�LCA�report�for�the�interpretation�step�follow:�
� In�Table�MR�1.2,�secondary�data�(average�data)�for�asphalt�production�was�used�and�may�not�be�representative�of�the�actual�product�studied.�Information�from�the�manufacturer�for�the�GSB�88�was�from�primary�sources�and�may�be�more�representative.�If�primary�data�were�available�for�the�asphalt,�the�results�may�be�different�than�those�produced�by�the�model.�This�is�true�for�many�different�parts�of�the�data�used.�
� Close�scrutiny�of�the�data�in�the�inventory�analysis�shows�that�many�of�the�data�values�were�not�available�or�not�reported�for�either�product,�as�denoted�by�“NA”�in�the�FRED�case�study.��
� If�the�FRED�case�study�is�compared�to�the�published�results�of�the�LCIA,�it�is�clear�that�there�is�very�high�uncertainty�in�the�results�because�the�computed�results�report�up�to�five�significant�digits.�The�amount,�for�example,�of�GWP�that�was�computed�was�44,368�kg�CO2e.�That�computed�level�of�precision�is�not�reasonable,�and�the�value�reported�only�reflects�one�significant�digit�(40,000�kg�CO2e).�
� It�is�unclear�why�the�inventory�amount�reported�for�“Resource�Depletion���Minerals”�is�0.�This�should�probably�have�been�documented�somewhere.�
� It�is�unclear�what�the�assumed�transportation�distance�was�for�either�product�(both�in�Schenck�and�the�FRED�documentation).�
Further�discussion�and�the�full�lifecycle�inventory,�impact�assessment,�and�interpretation�for�this�EPA�case�study�are�available�in�the�FRED�guidance�document�available�at:�http://www.lcacenter.org/library/pdf/fred.pdf.�The�reader�is�referred�to�that�resource�to�make�his/her�own�interpretations�of�the�case�studies�provided.�
POTENTIAL ISSUES
1. Missing�or�otherwise�unavailable�data�(such�as�from�proprietary�sources).�Wherever�possible,�data�should�be�collected�for�the�project.�This�includes�(but�is�not�limited�to)�emissions�and�energy�use�such�as�emissions�data�gathered�from�at�the�hot�mix�asphalt�(HMA)�batch�plant,�amounts�of�water�used�in�concrete�mixes,�fuel�types,�tipping�fee�receipts,�cut/fill�volumes,�etc.�In�general,�secondary�data�choices�should�be�based�on�realistic�project�based�information.�
2. Professional�lifecycle�assessment�may�incur�an�added�cost�to�the�project.�Projects�should�budget�for�this�additional�cost�where�possible�when�planning�to�attempt�this�credit.�
3. Data�management�in�process�based�LCAs�can�require�much�manpower,�be�time�consuming,�and�also�high�cost.�4. There�is�no�such�thing�as�a�simple�product.�All�products�and�processes�are�more�complicated�than�humans�
could�ever�conceive.�LCAs�still�only�present�a�simplified�model�of�the�actual�lifecycle.�The�goal�is�that�the�LCA�model�is�realistic�and�representative,�not�exact.��
5. Stakeholders�involved�in�LCA�tend�to�set�system�boundaries�and�conditions�to�their�credit.�This�can�skew�or�discredit�results�in�some�cases.�Transparency�is�a�key�issue�in�part,�for�this�reason.�
6. Professional�lifecycle�assessment�infers�that�final�results�may�be�proprietary.�Verify�rights�to�share�this�information�prior�to�submitting�documentation�for�this�credit.�Where�possible,�use�data�sources�or�LCA�software�that�does�not�incorporate�proprietary�data�unless,�adequately�referenced�and�documented�for�the�project.�Using�OpenSource�LCA�programs�may�be�able�to�help�avoid�such�issues.�
7. Any�uncertainties�or�assumptions�made�in�the�LCA�must�be�clearly�specified�or�documented�(per�the�ISO�standards).�Additionally,�any�substitutions�or�generic�data�used�must�be�explicitly�stated.�
8. Allocation�procedures�used�for�estimations�or�assumptions�should�be�transparent�and�supporting�documentation�(including�references)�should�be�provided�(where�publishing�and�proprietary�rights�permit).�
9. Comprehensive�lifecycle�assessments�require�detailed�attention�to�data�quality.�
344
Greenroads™ Manual v1.5 Materials & Resources
MR-1 Lifecycle Assessment
RESEARCH This�particular�credit�is�available�as�a�supplement�to�the�three�related�Project�Requirements:�PR�1�Environmental�Review�Process,�PR�2�Lifecycle�Cost�Analysis,�and�PR�3�Lifecycle�Inventory.�This�credit�represents�both�an�added�step�(impact�assessment)�to�the�basic�process�involved�in�these�three�credits�and�an�expanded�roadway�system�scope�for�the�inventory�analysis�step�completed�for�PR�3.�PR�2�and�PR�3�provide�decision�making�information�about�cost�and�baseline�environmental�performance�(specifically�energy�use�and�carbon�dioxide�emissions)�for�the�roadway�pavement�section.�Similarly,�social�impact�classification�and�characterization�is�part�of�the�environmental�review�process�(see�PR�1)�for�many�roadway�projects,�but�generally�this�process�will�not�require�or�specify�the�use�of�any�particular�social�metric�(e.g.�birth�and�death�rates,�obesity�rates,�productivity�rates,�etc.)�for�measurement�of�these�impacts.�This�credit�requires�an�expanded�scope�of�these�three�Project�Requirements�that�includes�the�entire�roadway�project�system�as�well�as�an�impact�assessment�step�for�the�project.�
Note�that�an�introduction�to�LCA,�its�basic�framework�components,�and�variety�of�LCA�methods�is�provided�in�the�Research�section�of�PR�3.�This�research�discussion�is�supplemental.�
Existing�Literature�Most�existing�literature�for�roadway�lifecycle�assessments�focus�on�the�initial�construction�and�maintenance�of�pavement�sections�alone.�To�our�knowledge�no�studies�have�completed�a�full�system�wide�LCA�for�a�roadway�project.�However,�one�study�completed�by�Stripple�et�al.�(2001),�has�completed�a�full�life�cycle�inventory�(LCI)�that�incorporates�all�aspects�of�a�roadway,�from�production�processes�of�several�kinds�of�pavement�all�the�way�to�the�components�of�the�roadway�such�as�electric�utilities�and�wildlife�fencing.�This�study�followed�the�recommendations�for�the�LCA�process�by�the�Society�of�Environmental�Toxicology�and�Chemistry�(SETAC�Europe),�but�is�considered�an�incomplete�LCA�because�the�impact�assessment�and�interpretation�steps�were�not�done.�However,�the�paper�serves�as�a�great�example�of�the�first�two�steps�in�LCA,�but�note�that�the�applicability�and�utility�of�the�primarily�European�data�set�is�questionable�for�applications�in�the�United�States�(i.e.�it�is�difficult�to�justify�substitution�of�Stripple’s�inventory�data�into�a�non�European�LCA�study�without�close�scrutiny�of�his�data).�However,�because�SETAC�references�the�same�methodology�for�LCA,�namely�the�International�Standards�Organization�(ISO)�14040�and�14044�standards,�this�paper�is�a�great�example�of�the�framework�and�approach�for�this�credit.�See�the�first�Example�in�the�previous�section�for�more�details.�
LCA�Methodology�Steps�A�lifecycle�is�defined�as�“consecutive�and�interlinked�stages�of�a�product�[or�project]�system,�from�raw�material�acquisition�or�generation�from�natural�resources�to�final�disposal�or�[end�of�life:�EOL]”�(International�Standards�Organization:�ISO,�2006a).�Generally,�there�are�four�basic�steps�to�any�type�of�lifecycle�assessment.�A�different�interpretation�of�these�steps�than�that�shown�in�Figure�PR�3.2�is�shown�in�Figure�MR�1.3�from�SETAC.�Definition�of�the�goal�and�scope�(the�boundaries�and�extent�of�the�study)�will�always�take�place�for�every�LCA�project,�and�the�variation�in�methodology�will�result�from�the�initial�choices�made�in�this�initial.�Inventory�Analysis,�the�second�step,�will�take�place�as�one�of�three�general�types�as�noted�in�PR�3.�These�are�briefly:�
� Process�Based�LCA�(also�ISO�LCA)�� Economic�Input�Output�LCA�(EIO�LCA)�� Hybrid�LCA�(also�Hybrid�EIO�LCA)�
Each�of�these�approaches�will�produce�different�results�for�the�inventory�analysis�and�in�general�cannot�be�compared�cross�platform�because�the�processes�considered�and�system�boundaries�will�vary�widely.�
345

Materials & Resources Greenroads™ Manual v1.5
Lifecycle Assessment MR-1
�Figure�MR�1.3:�The�framework�for�Life�Cycle�Assessment�(Consoli,�1993)�
�The�final�two�steps�of�the�LCA�are�the�impact�assessment�and�interpretation�of�the�results.�The�impact�assessment�step�involves�an�assignment�or�application�of�subjective�values,�wherein�particular�indicators�or�metrics�are�chosen�to�weigh�the�results�of�the�inventory�analysis�according�to�those�subjective�values.�These�values�also�need�to�be�explicitly�defined�in�the�goal�and�scope�in�order�to�produce�a�meaningful�result�for�interpretation.�Due�to�the�iterative�nature�of�LCAs,�however,�it�is�more�practical�to�state�that�the�interpretation�step�really�happens�throughout�the�entire�LCA�process,�and�often�results�in�refining�the�scope�when�data�is�collected�and�analyzed�in�the�inventory�analysis.��
Choosing�the�LCA�Model�A�process�based�lifecycle�assessment�is�one�that�is�conducted�(usually)�according�to�the�standards�set�by�the�International�Standards�Organization�(ISO)�lifecycle�assessment�standards,�ISO14040�and�ISO14044�(2006a,�2006b).��The�ISO�clearly�outlines�the�steps�and�iterative�process�behind�a�technical�LCA�in�both�of�those�standards.�The�basic�idea�of�a�process�based�LCA�is�that�everything�is�made�of�a�sum�of�different�parts.�Those�parts�are�also�results�of�different�processes.�Fundamentally,�every�part�and�process�needs�materials�and�energy�(e.g.�“makes”)�in�order�to�fit�together�into�a�whole�(e.g.�“takes”).�
For�a�simple�example,�making�one�ton�of�the�product�called�“hot�mix�asphalt”�(“HMA”)�is�actually�the�result�of�taking�two�materials,�“asphalt�binder”�and�“aggregate”,�through�a�process�that�makes�HMA,�“mixing.”�So�the�processes�that�that�the�HMA�product�actually�takes�are:�asphalt�binder�production�(material),�aggregate�production�(material),�and�HMA�mixing�(a�process).�
These�three�processes�could�be�further�broken�down�into�even�more�specific�processes,�called�“unit�processes.”��For�example,�“HMA�mixing”�is�composed�of�“heating,”�“drum�plant�operating,”�and�“fuel�combustion�for�heating,”�etc.�The�model,�and�also�the�data�collection�requirement,�expands�as�the�processes�get�more�specific.�Similarly,�each�of�these�processes�“take”�more�than�just�asphalt�and�aggregate�to�make�HMA:�they�also�require�energy�from�electricity,�capital�equipment�and�workers,�who�also�need�food�and�housing,�healthcare,�a�car�to�drive�to�work,�and�so�on.�If�the�process�based�model�were�continued�and�scaled�up�to�include�such�information,�it�would�become�incredibly�complex�and�difficult.�Clearly,�the�scope,�system�boundaries�and�purpose�of�the�LCA�are�key�issues.�
This�scoping�issue�is�somewhat�alleviated�by�Economic�Input�Output�LCA�(EIOLCA)�models.�EIOLCA�uses�a�basis�of�economic�input�output�(EIO)�analysis�to�model�how�sector�based�national�industries�interact�and�how�products�are�intertwined.�LCA�was�easily�combined�with�EIO�data�because�the�computational�structure�was�similar�to�the�EIO�
346

Greenroads™ Manual v1.5 Materials & Resources
MR-1 Lifecycle Assessment
approach.�EIOLCA�uses�only�publicly�available�information�to�determine�economy�wide,�system�level�results�instead�of�process�specific�results�(Hendrickson�et�al.,�1998).�This�means�that�EIOLCA�aggregates�sector�level�of�data�to�quantify�the�environmental�impact�contributed�directly�or�indirectly�by�each�sector�of�the�economy.�It�is�typically�based�on�monetary�inputs�instead�of�dimensions�or�mass�and�outputs�a�handful�of�common�environmental�impacts,�depending�on�the�index�selected.�This�method�will�not�earn�Greenroads�credit.�
Hybrid�LCA�is�a�combination�of�process�based�and�EIO�based�LCA�(Bilec�et�al.,�2006),�effectively�eliminating�most�of�the�disadvantages�of�either�model�aside�from�built�in�uncertainties�in�data.�EIO�data�are�usually�used�for�common�products�or�processes,�while�others�are�described�by�the�process�based�method.�Hybrid�LCA�can�be�further�categorized�into�following�types:�tiered�hybrid�analysis,�input�output�based�hybrid�analysis,�integrated�hybrid�analysis,�and�augmented�process�based�hybrid�analysis�(Suh,�2004;�Bilec�et�al.,�2006).�These�types�differ�in�technical�details�such�as�how�data�is�allocated�or�aggregated,�where�the�specific�boundaries�are�drawn�between�process�and�EIO�analysis,�and�general�data�processing�techniques.�
Streamlined�LCA�is�a�proposed�method�of�minimizing�data�collection�efforts�at�the�start�of�a�LCA�project�by�scoping�out�particular�processes�through�educated�assumptions�(most�of�the�time).�This�inevitably�leads�to�a�technically�non�ISO�conformant�framework,�because�valuation�is�applied�at�the�start,�before�data�has�been�collected�and�analyzed.�Curran�et�al.�(1996)�note�that�streamlining�is�really�part�of�a�continuum�that�falls�somewhere�between�the�level�of�detail�for�an�ISO�LCA�and�an�EIO�LCA,�and�also�technically�all�LCAs�are�streamlined�to�some�extent�due�to�their�iterative�nature.�
A�comparison�of�the�advantages�and�disadvantages�of�the�common�types�of�LCA�are�shown�in�Table�MR�1.5.�Ultimately�it�is�up�to�the�project�team�to�determine�which�method�will�be�most�appropriate.�
Table�MR�1.5:�Process�Based�LCA�and�EIO�LCA�(Expanded�from�Hendrickson,�Lave�&�Matthews,�2006)�LCA�Method� Advantages� Disadvantages�
Process�Based�LCA�(ISO�LCA)�(ISO,�2006a;�ISO�2006b)�
� Detailed,�process�specific�results� � System�boundaries�are�subjective�(or�project�specific)�
� Allows�for�specific�product�comparisons� � May�be�high�cost�and�time�intensive�� Identifies�areas�in�supply�chain�for�
improvement�(weakest�links,�or�lack�of�data)�� Hard�to�use�when�initially�developing�a�
process�or�product�� Provides�a�basis�for�process�specific�
information�that�may�be�used�for�other�development�processes�and�assessments�
� Often�use�proprietary�data�
� Can�be�done�with�publicly�available�data� � Cannot�be�replicated�if�confidential�data�is�used�
� � Uncertainty�in�data�or�missing�data�EIO�LCA�(Hendrickson�et�al,�1998;�Hendrickson,�Matthews�&�Lave,�2006)��NOTE:��METHOD�WILL�NOT�EARN�THIS�CREDIT.�DO�NOT�USE.�
� Results�are�economy�wide,�comprehensive�assessments��
� Product�assessments�contain�aggregate�data�(such�as�food�that�feeds�workers�and�the�wood�that�makes�their�housing)�
� Allows�for�systems�level�comparisons� � Process�assessments�are�difficult�
� Provides�information�on�every�commodity�in�the�economy�
� Must�link�monetary�values�with�physical�units�
� Provides�a�basis�for�information�that�may�be�used�for�other�future�development�of�products�and�processes�and�assessments�
� Economic�imports�are�treated�as�products�created�within�economic�(region,�state�or�country)�boundaries�
� Can�be�done�with�publicly�available�data� � Lack�of�complete�data�for�environmental�effects�
� � Difficult�to�apply�to�an�open�economy�(with�substantial�non�comparable�imports)�
� � Uncertainty�in�data�
347

Materials & Resources Greenroads™ Manual v1.5
Lifecycle Assessment MR-1
LCA�Method� Advantages� Disadvantages�
Tiered�Hybrid�LCA�(Suh�&�Huppes,�2005)�
� Combines�process�and�EIO�data�to�produce�more�representative�result�
� Double�counting�errors�may�be�present�in�results�
� Facilitates�inventory�analysis� � May�omit�important�processes�
� Reduces�data�collection�time� � Does�not�always�model�interaction�between�process�and�I�O�data�appropriately�
� Incorporates�advantages�from�both�ISO�and�EIO�models�
� Incorporates�some�disadvantages�from�both�ISO�and�EIO�models�
Hybrid�EIO�(Treloar,�1997;�Joshi,�2000;�Crawford,�2008)�
� Combines�process�and�EIO�data�to�produce�more�representative�result�
� Requires�iteration�
� Disaggregates�I�O�key�sectors�and�substitutes�detailed�economic�information�
� Incorporates�some�disadvantages�from�both�ISO�and�EIO�models�
� Incorporates�advantages�from�both�ISO�and�EIO�models�
� Substitution�of�IO�data�for�missing�processes�may�reduce�model�reliability�
� Use�and�disposal�phases�are�addressed�manually�instead�of�by�sector�
�
� Fills�process�data�gaps�where�previously�no�information�existed�
�
Integrated�Hybrid�(Suh,�2004;�Bilec�et�al.,�2006)�
� Combines�process�and�EIO�data�to�produce�more�representative�result�
� Incorporates�some�disadvantages�from�both�ISO�and�EIO�models�
� Incorporates�advantages�from�both�ISO�and�EIO�models�
� Computationally�complex�
� Connects�process�and�EIO�models�in�matrix� � Difficult�to�learn�
� Eliminates�need�for�tiered�analysis� � Data�intensive�
� Addresses�interactions�between�sector�and�process�data�
� Time�intensive�
� Consistent�computational�framework� �
� No�double�counting� �
Augmented�Process�Based�Hybrid�(Guggemos,�2003;�Guggemos�&�Horvath,�2005)�
� Starts�with�process�data�and�system�and�scales�up�
� Incorporates�some�disadvantages�from�both�ISO�and�EIO�models�
� Uses�economy�as�ultimate�system�boundary� �
� Uses�mostly�process�data� �
Streamlined�LCA�(Curran�et�al.,�1996;�Weitz�et�al.,�1999)�
� May�save�money� � Excludes�upstream�and/or�downstream�processes�
� May�save�time� � Limits�raw�material�input�considerations�
� Requires�reasonable�data�management�efforts�
� Results�may�be�more�subjective�due�to�weighting�assigned�early�(by�scoping�out�processes�or�data�requirements)�
� Processes�assigned�significance�early�in�scoping�and�align�with�goals�of�study�
� May�ignore�important�impacts�unintentionally�
� Provides�focused�assessment� � May�result�in�reporting�incomplete�results�to�public�
Additional�Notes�on�LCIA:�FRED�Framework�Equivalency�factors�for�impact�classification�and�characterization�for�this�Greenroads�credit�are�provided�by�the�Environmental�Protection�Agency’s�(EPA)�Framework�for�Responsible�Environmental�Decision�Making�(FRED)�(EPA,�2000).�The�factors�are�subdivided�into�eight�categories�and�three�general�types�of�flows�are�investigated:�(1)�emissions�to�air,�(2)�emissions�to�water,�and�(3)�resource�depletion�(includes�raw�materials,�fuels,�water�and�land).�We�recognize�that�there�are�a�number�of�metrics,�indicators�and�indices�available�for�use;�the�FRED�framework�is�
348

Greenroads™ Manual v1.5 Materials & Resources
MR-1 Lifecycle Assessment
flexible,�broadly�applicable,�comprehensive,�and�documented�respectably.�Currently�this�is�the�most�transparent�and�flexible�tool�that�is�publicly�available�for�impact�assessment.�
FRED�is�based�on�a�variety�of�different�indicator�tools�or�metrics�that�have�been�developed�by�different�institutions,�and�reflect�global�averages�or�indicators.�However,�documentation�for�some�of�the�indicators�used�in�the�tool�has�not�been�updated,�likely�due�to�lack�of�funding.�The�user�may�consult�those�individual�sources�in�order�to�check�for�updates,�determine�applicability,�or�substitute�regional�and�local�indicator�values�where�appropriate�(EPA,�2000).�“The�designers�of�FRED�consider�impact�model�selection�to�be�an�iterative�process.�As�the�science�and�the�data�supporting�the�science�[develop],�newer,�more�environmentally�relevant�models�will�gradually�replace�the�current�models”�(EPA,�2000).��Some�other�limitations�of�the�FRED�tool�are�provided�explicitly�in�the�documentation.�Notably,�any�data�uncertainties�in�the�established�equivalency�factors�that�are�used�within�the�tool�itself�are�inherent�issues.�Also,�FRED�does�not�include�any�social�or�economic�impacts.�
Greenroads�has�provided�some�suggested�resources�to�use�in�place�of�those�listed�in�the�FRED�documentation.�Either�may�be�used�in�support�of�this�credit�(the�process�is�what�we�are�looking�for�here),�but�references�for�the�selected�indicator�must�be�cited�to�earn�this�credit.�Table�MR�1.6�(next�page)�lists�the�FRED�impact�categories�with�some�typical�examples�that�would�be�found�in�an�LCI�and�used�in�the�impact�assessment.�Note�that�this�is�only�a�sample,�and�that�the�FRED�documentation�provides�a�number�of�chemical�compounds�to�track.�
Note�that�ideally�FRED�is�designed�to�compare�two�or�more�products�that�have�the�same�functional�unit.�The�utility�of�completing�an�impact�assessment�for�just�one�single�project�is�that�there�is�not�necessarily�any�established�industry�average�in�terms�of�environmental�performance�that�can�be�used�for�comparison�of�pavements.�This�credit�aims�to�help�develop�this�information�in�a�systematic�way�by�using�the�framework�provided�for�impact�assessment�by�the�EPA’s�FRED�tool.�Results�of�the�impact�assessment�may�therefore�not�be�suitable�for�evaluative�purposes�(EPA,�2000),�however,�this�does�not�mean�that�two�different�design�alternatives�should�not�be�compared�using�LCA.�For�reporting�purposes�in�this�Greenroads�credit,�we�just�want�to�know�about�the�final�design�alternative.�
Other�LCIA�Tools�� Another�EPA�tool,�the�Tools�for�Reduction�and�Assessment�of�Chemical�and�Other�Releases�(TRACI),�is�no�
longer�available�from�the�EPA.�As�of�this�writing,�we�understand�that�this�tool�is�currently�being�updated.�(EPA,�2008).�
� Commonly�used�proprietary�software�tools�may�have�built�in�impact�assessment�indicators,�such�as�GaBi�and�SimaPro.�These�tools�often�report�a�single�value�for�all�impacts�(an�index)�that�does�not�necessarily�disaggregate�contributions�to�that�index�from�each�impact�or�process,�and�may�not�be�appropriate�for�use�in�this�credit�because�the�weighting�can�lack�transparency.�
� Other�tools�for�impact�assessment�are�available�through�the�National�Institute�of�Science�and�Technology�(NIST),�such�as�the�BEES�(Building�or�Environmental�and�Economic�Sustainability)�tool.�The�caveat�with�BEES�is�that�it�is�mostly�used�in�the�building�industry,�so�valuation�and�weighting�systems�used�by�NIST�impact�assessment�tools�may�not�be�adequate�for�weighting�impacts�of�pavement�or�infrastructure�projects�without�further�adjustment�and�review.�Also,�this�software�tool�generates�only�one�index�as�a�“score”�instead�of�reporting�disaggregated�impacts.�
� �
349

Materials & Resources Greenroads™ Manual v1.5
Lifecycle Assessment MR-1
Table�MR�1.6:�FRED�Impact�Categories�and�Indicator�Models�for�the�FRED�LCA�System�(EPA,�2000)�Impact�Category�
Impact�Indicator�Model/Source�
Indicator* Example�LCI�Data�Needed�for�Model�
Greenroads�Comment�
Global�Warming�Potential�
Intergovernmental�Panel�on�Climate�Change�(IPCC)�
CO2e�(kg) Carbon�dioxide�(CO2)�Nitrous�oxide�(N2O)�Methane�(CH4)�Halons�
Recommend�using�updated�equivalency�factors�from�IPCC�2007�FAR�(Solomon�et.�al.),�especially�for�CH4,�N2O.�Others�are�less�prevalent�in�roads/paving.�
Stratospheric�Ozone�Depletion�
World�Meterological�Organization�(WMO)�
CFC�11e Methyl�bromideChlorofluorocarbons�(CFCs)�Hydrofluorocarbons�(HCFCs)��
Recommend�using�updated�indicator�for�equivalency�factors:�Effective�Equivalent�Stratospheric�Chlorine�concentration�(EECl,�EESC).�See�EPA’s�2006�Air�Quality�Criteria�for�Ozone�and�Other�Photochemical�Oxidants�
Acidification� Chemical�Equivalents�
Acidification�Potential�(AP)�
AmmoniaNitric�oxide�Nitrogen�dioxide�Sulfur�dioxide�
Photochemical�Smog�
Empirical�Kinetic�Modeling�Approach�(EKMA)�
Maximum�Incremental�Reactivity�(MIR)�
AcetoneCarbon�Monoxide�Formaldehyde�Alkanes�Aromatics�(VOCs)�Napthalenes�
Recommend�using�a�box�or�Eulerian�model�and�MIR�values�from�Carter�(2009)�with�binned�reactivities�based�upon�n�alkane,�iso�alkane,�cyclo�alkane,�aromatics�and�napthalenes.�See�also�Leuken�and�Mebust�(2008).�
Eutrophication� Redfield�Ratio� PO4e�(kg) PhosphatesNitric�oxide�Nitrates�Ammonia�
Human�Health� University�of�California,�Berkeley�(UCB)�TEPs�
Benzene�TEP�(cancer)Toulene�TEP�(non�cancer)�
Toxic�chemicals Recommend�using�current�data�from�the�Environmental�Defense�Fund��(EDF)�Scorecard�and�UCB�TEPs�as�shown�in�FRED�documentation.�See�also�McKone�and�Hertwich�(2001)�and�Hertwich�et�al.�(2006)�
Ecological�Toxicity�
Research�Triangle�Institute�(RTI)�LCIA�Expert�(Version�1)�
N/A Toxic�chemicals Recommend�RTI�model�and�data�from�EPA’s�ECOTOX�database�to�determine�specific�weighting�as�shown�in�FRED�documentation�(EPA,�2000;�2010)�
Resource�Depletion�
Life�Cycle�Stressor�Environmental�Assessment�(LCSEA)�Model�by�Scientific�Certification�Systems�
Mass,�volume�(water)�or�land�area�
Various Recommend�using�computed�“resource�depletion”�equivalency�factors�using�updated�SCS��002�2008�(Draft)�as�shown�in�FRED�document�(EPA,�2000;�SCS,�2008)��
Data�Quality�The�most�important�step�in�the�interpretation�phase�of�the�LCA�is�the�identification�of�the�data�quality�and�statement�of�uncertainties.�Quality�of�data�used�in�an�LCA�can�be�evaluated�during�the�interpretation�stage�of�the�LCA�using�data�quality�scores.�For�this�credit,�each�piece�of�data�should�be�rated�with�numbers�1�to�5�and�scored�according�to�the�criteria�set�forward�by�the�University�of�Washington�Design�for�Environment�Lab�(College�of�
350

Greenroads™ Manual v1.5 Materials & Resources
MR-1 Lifecycle Assessment
Engineering,�Department�of�Mechanical�Engineering,�under�the�direction�of�Dr.�Joyce�Cooper),�based�on�ISO14040:2006�requirements.�The�scoring�is�shown�in�Table�MR�1.7.�
Table�MR�1.7:�Data�quality�scores�(DQS)�by�the�University�of�Washington�Department�Of�Mechanical�Engineering�Design�for�Environment�Lab�(Cooper�et�al.,�n.d.)�
Score�ID��
ISO14040�Data�Quality�Indicators�
Supporting�Information�
Scoring�Method
DQS1� Time�Related�Coverage�Data�(i.e.�data�age)�
Start�date�of�valid�time�span�
Deviation�from�intended�period�(difference�in�years�to�year�of�study)�1. Less�than�3�years�2. Less�than�6�years�3. Less�than�10�years�4. Less�than�15�years�5. Age�of�data�unknown�or�more�than�15�years�
End�date�of�valid�time�span�
DQS2� Geographical�Coverage�
Area�and�country�names�
Deviation�from�intended�area1. Data�from�study�area�2. Average�data�from�larger�area�which�includes�study�area�3. Data�from�area�under�similar�production�conditions�4. Data�from�area�with�slightly�similar�production�conditions�5. Data�from�unknown�area�or�area�with�different�
production�conditions�
DQS3� Technology�Coverage�
Technology�description�
Deviation�from�intended�technology�1. Data�from�enterprises,�processes�and�materials�under�
study�2. Data�from�processes�and�materials�under�study�but�
different�enterprises�3. Data�from�processes�and�materials�under�study�but�
different�technology�4. Data�on�related�process�and�materials�but�same�
technology�5. Data�on�related�process�and�materials�but�different�
technology�
Included�processes
Extrapolations
DQS4� Precision,�completeness,�and�representativeness�of�the�data�
Sampling�procedure Representativeness�for�intended�process��1. Very�high�(data�represent�all�aspects�of�system�under�
study)�2. High�(data�represent�a�majority�subset�of�the�system�
under�study)�3. Moderate�(data�represent�a�minority�subset�of�the�system�
under�study)�4. Low�(data�represent�an�example�of�the�system�under�
study)�5. Very�low�or�unknown�(the�extent�to�which�the�data�
represents�the�study�is�unknown)�
Number�of�samples
Absolute�sample�volume�
Relative�sample�volume�
Extrapolations
Uncertainty�adjustments�
351

Materials & Resources Greenroads™ Manual v1.5
Lifecycle Assessment MR-1
Score�ID��
ISO14040�Data�Quality�Indicators�
Supporting�Information�
Scoring�Method
DQS5� Consistency�and�reproducibility�of�the�methods�used�throughout�the�LCA�
Description�of�method�for�data�collection�and�data�treatment�
1. Very�high�(data�are�based�on�direct�measurements�using�a�widely�accepted�test�method�or�on�sound�engineering�models�representing�the�current�technology�and�have�been�extensively�peer�reviewed.�Also,�the�source�provides�a�transparent�account�of�the�assumptions�made.)�
2. High�(although�the�data�are�based�on�a�generally�sound�test�method�or�model�and�the�source�provides�a�transparent�account�of�the�assumptions�made,�the�data�are�dated�or�lack�enough�detail�for�adequate�validation�or�have�not�been�extensively�peer�reviewed)�
3. Moderate�(data�are�based�on�an�unproven�or�new�methodology�or�are�lacking�a�significant�amount�of�background�information)�
4. Low�(data�are�based�on�a�generally�unacceptable�method,�but�the�method�may�provide�an�order�of�magnitude�flow)
5. Very�low�or�unknown�(data�are�based�on�an�unknown�method,�but�the�method�may�provide�an�order�of�magnitude�value�of�the�flow)�
DQS6� Sources�and�their�representativeness�
References�used�for�data�collection�and�data�treatment�
Type�of�reference1. Data�from�reviewed�source�2. Data�from�public�written�source�(not�reviewed)�3. Data�from�closed�written�source�(not�reviewed)�4. Other�sources�5. Unknown�source�
DQS7� Uncertainty�of�the�information�
Mean�value Coefficient�of�variance1. Below�10%�2. 10�25%�3. 25�50%�4. 50�100%�5. Over�100%�or�unknown�
Standard�deviation
Uncertainty�type
Description�of�strengths�and�weaknesses�(e.g.�occurrence�of�data�gaps)�
�
GLOSSARY
CO2� Carbon�dioxideCO2e� Carbon�dioxide�equivalent�emission�e� EquivalentEIO� Economic�Input�OutputEIO�LCA� Economic�Input�Output�for�Life�Cycle�AssessmentEOL� End�of�lifeFunctional�unit� The�quantified�performance�of�a�product�system�for�use�as�a�reference�unit�
(ISO,�2006a)�Hybrid�LCA� A�type�of�LCA�that�combines�both�process�based�and�economic�input�output�
models�ISO� International�Standards�Organization
352

Greenroads™ Manual v1.5 Materials & Resources
MR-1 Lifecycle Assessment
ISO�LCA� Process�based�LCALCA� Lifecycle�assessmentLCCA� Lifecycle�cost�analysisLCI� Lifecycle�inventory�analysisLCIA� Lifecycle�impact�assessmentLifecycle� consecutive�and�interlinked�stages�of�a�product�[or�project]�system,�from�raw�
material�acquisition�or�generation�from�natural�resources�to�final�disposal�or�[end�of�life:�EOL]�(ISO,�2006a)�
Lifecycle�assessment� Compilation�and�evaluation�of�the�inputs,�outputs�and�the�potential�environmental�impacts�of�a�product�system�throughout�its�lifecycle�(ISO,�2006a)�
Process�based�LCA� An�LCA�conducted�according�to�ISO�Standard�14040�Reference�flow� The�measure�of�the�outputs�from�processes�in�a�given�product�system�
required�to�fulfil�[sic]�the�function�expressed�by�the�functional�unit�(ISO,�2006a)�
SETAC� Society�of�Enviornmental�Toxicology�and�Chemistry�Streamlined�LCA� Identification�of�elements�of�an�LCA�that�can�be�omitted�or�where�surrogate�
or�generic�data�can�be�used�without�significantly�affecting�the�accuracy�of�the�results�(Weitz�et�al.,�1999)�
System�boundary� Set�of�criteria�defining�which�unit�processes�are�part�of�a�system�(ISO,�2006a)Unit�process� Smallest�unit�considered�in�the�lifecycle�inventory�analysis�for�which�input�
and�output�data�are�quantified�(ISO,�2006a)��
REFERENCES Bilec,�M.�R.,�Robert,�&�Matthews,�H.�S.�S.,�Aurora�L.�(2006).�Example�of�a�Hybrid�Life�Cycle�Assessment�of�
Construction�Processes.�Journal�of�Infrastructure�Systems.�12�(4),�207.�
Carnegie�Mellon�Green�Design�Institute.�(2008).�Economic�Input�Output�Life�Cycle�Assessment���Carnegie�Mellon�University�(EIO�LCA).�US�1997�Industry�Benchmark�model.�Accessed�December�11,�2008,�Available�at��http://www.eiolca.net.�
Carter,�W.P.L.�(2009,�June�22).�Updated�Maximum�Incremental�Reactivity�Scale�and�Hydrocarbon�Bin�Reactivities�for�Regulatory�Applications.�Prepared�for�California�Air�Resources�Board�Contract�07�339.�Riverside,�CA:�College�of�Engineering�Center�for�Environmental�Research�and�Technology,�University�of�California.�Accessed�January�8,�2010.�Available�at�http://www.engr.ucr.edu/~carter/SAPRC/MIR10.pdf.�
Consoli,�F.�(1993).�Guidelines�for�life�cycle�assessment:�A�"code�of�practice.”�Pensacola,�FL,�U.S.A.:�Society�of�Environmental�Toxicology�and�Chemistry�(SETAC).�
Cooper,�J.S.�et�al.�(2007).�University�of�Washington�(UW)�Department�of�Mechanical�Engineering�Design�for�Environment�(DfE)�Lab:�Data�Quality�Scores.�
Crawford�R.H.�(2008).�Validation�of�a�hybrid�life�cycle�inventory�analysis�method.�Journal�of�Environmental�Management.�88�(3),�496�506.�
Curran,�M.A.�&�Young,�S.�(1996).�Report�to�the�EPA�on�Streamlining�LCA.�International�Journal�of�Life�Cycle�Assessment.�1(1),�7�60.�
Environmental�Protection�Agency.�(2000,�October).�Framework�for�Responsible�Environmental�Decision�Making�(FRED):�Using�Life�Cycle�Assessment�to�Evaluate�Preferability�of�Products.�(EPA/600/R�00/095).�Accessed�March�12,�2008.�Available�at�http://www.lcacenter.org/library/pdf/fred.pdf��
353

Materials & Resources Greenroads™ Manual v1.5
Lifecycle Assessment MR-1
Environmental�Protection�Agency.�(2008,�4�March).�Tool�for�the�Reduction�and�Assessment�of�Chemical�and�Other�Environmental�Impacts�(TRACI).�Accessed�July�29,�2008.�Available�at�http://www.epa.gov/nrmrl/std/sab/traci/��
Environmental�Protection�Agency.�(2009,�September�15).�Air�Quality�Criteria�for�Ozone�and�Related�Photochemical�Oxidants�(2006�Final�|�National�Center�for�Environmental�Assessment�|�US�EPA.�Accessed�January�8,�2010.�Available�at�http://cfpub.epa.gov/ncea/cfm/recordisplay.cfm?deid=149923��
Environmental�Protection�Agency.�(2010,�January�8).�EPA:�Welcome�to�ECOTOX.�Accessed�January�8,�2010.�Available�at�http://cfpub.epa.gov/ecotox/ecotox_home.cfm��
Guggemos,�A.�A.�(2003).�Environmental�impacts�of�on�site�construction�processes:�Focus�on�structural�frames.�Thesis�(Ph.�D.�in�Engineering�Civil�and�Environmental�Engineering)��University�of�California,�Berkeley,�Spring�2003.�
Guggemos,�A.�A.,�&�Horvath,�A.�(2005).�Comparison�of�Environmental�Effects�of�Steel�and�Concrete�Framed�Buildings.�Journal�of�Infrastructure�Systems.�11�(2),�93�101.�
Hendrickson,�C.�T.,�Lave,�L.�B.,�&�Matthews,�H.�S.�(2006).�Environmental�life�cycle�assessment�of�goods�and�services:�An�input�output�approach.�Washington,�DC:�Resources�for�the�Future.��
Hendrickson,�C.,�Horvath,�A.,�Joshi,�S.,�&�Lave,�L.�(1998).�Economic�Input�Output�Models�for�Environmental�Life�Cycle�Assessment.�Environmental�Science�and�Technology.�32�(7),�184A�191A.�
Hertwich,�E.�G.�M.,�Sarah�F.;�Pease,�William�S.;�McKone,�Thomas�E.�(2006).�An�update�of�the�Human�Toxicity�Potential�with�special�consideration�of�conventional�air�pollutants.�
Hertwich,�E.�G.�M.,�Sarah�F.;�Pease,�William�S.;�McKone,�Thomas�E.�(2006).�An�update�of�the�Human�Toxicity�Potential�with�special�consideration�of�conventional�air�pollutants.�Working�Report�No.�1.�Norwegian�University�of�Science�and�Technology,�Industrial�Ecology�Programme�Program�for�industriell�økologi.�Accessed�January�8,�2010.�Available�at:�http://ntnu.diva�portal.org/smash/get/diva2:121810/FULLTEXT01�
International�Organization�for�Standardization.�ISO�14040:2006(E)�Environmental�Management�—�Life�Cycle�Assessment�—�Principles�and�Framework.�2nd�ed.�2006:�IHS.�
International�Organization�for�Standardization.�ISO�14044:2006(E)�Environmental�Management�—�Life�Cycle�Assessment�—�Requirements�and�Guidelines.�1st�ed.�2006:�IHS.�
Joshi,�S.�(2000).�Product�Environmental�Life�Cycle�Assessment�Using�Input�Output�Techniques.�Journal�of�Industrial�Ecology.�3�(2/3),�95�120.�
Luecken,�D.�J.,�&�Mebust,�M.�R.�(2008).�Technical�Challenges�Involved�in�Implementation�of�VOC�Reactivity�Based�Control�of�Ozone.�Environmental�Science�&�Technology.�42�(5),�1615.�
McKone,�T.�E.�&�Hertwich,�E.�G.�(2001).�The�Human�Toxicity�Potential�and�a�Strategy�for�Evaluating�Model�Performance�in�Life�Cycle�Impact�Assessment.�International�Journal�of�Life�Cycle�Assessment.�6,�106�109.�
National�Institute�of�Standards�and�Technology�(NIST).�(2007,�August�20).�BFRL:�Office�of�Applied�Economics:�BEES�4.0.�Accessed�January�8,�2010.�Available�at�http://www.bfrl.nist.gov/oae/software/bees/��
PE�International.�(n.d.)�GaBi���Life�Cycle��Assessment�(LCE/LCA)�software�system�for�economic,�ecological,�and�technical�decision�support�in�sustainable�production�and�product�design.�Accessed�January�8,�2010.�Available�at�http://www.gabi�software.com/��
354

Greenroads™ Manual v1.5 Materials & Resources
MR-1 Lifecycle Assessment
Product�Ecology�Consultants�(Pré).�(2009,�September�6)�SimaPro�LCA�Software.�Accessed�January�8,�2010.�Available�at�http://www.pre.nl/simapro/��
Schenck,�R.�(2000).�Using�LCA�for�Procurement�Decisions:�A�Case�Study�Performed�for�the�U.S.�Environmental�Protection�Agency.�Environmental�Progress.�19,�110�116.��
Scientific�Certification�Systems.�(2008).�Type�III�Life�Cycle�Impact�Profile�Declarations�for�Materials,�Products,�Services�and�Systems.�(SCS�002�2008)�[Draft�Standard�for�Comment].�Accessed�January�8,�2010.�Available�at�http://www.scscertified.com/lcs/docs/SCS_002_0808_FR.pdf�
Solomon,�S.�et�al.�(2007)�Synthesis�Report.�Climate�Change�2007:�Synthesis�Report.�Fourth�Assessment�Report�of�the�Intergovernmental�Panel�on�Climate�Change.�Cambridge,�UK:�Cambridge�University�Press.�
Stripple,�H.,�(2001).�Life�Cycle�Assessment�of�Road:�A�Pilot�Study�for�Inventory�Analysis,�Second�Revised�Edition.�IVL�Swedish�Environmental�Research�Institute�Ltd.�Report�for�the�Swedish�National�Road�Administration.�
Suh,�S.�(2004).�Functions,�commodities�and�environmental�impacts�in�an�ecological�economic�model.�Ecological�Economics�:�the�Journal�of�the�International�Society�for�Ecological�Economics.�48�(4),�451.�
Suh,�S.,�&�Huppes,�G.�(2005).�Methods�for�Life�Cycle�Inventory�of�a�product.�JOURNAL�OF�CLEANER�PRODUCTION.�13�(7),�687�697.��
Treloar,�G.�J.�(1997).�Extracting�Embodied�Energy�Paths�from�Input�Output�Tables:�Towards�an�Input�Output�based�Hybrid�Energy�Analysis�Method.�Economic�Systems�Research.�9�(4),�375�392.�
Weitz,�K.,�Sharma,�A.�Vigon,�B.,�Price,�E.�Norris,�G.�et�al.�Todd,�J.A.�&�Curran,�M.A.,�eds.�Streamlined�Life�Cycle�Assessment:�A�Final�Report�from�the�SETAC�North�America�Streamlined�LCA�Workgroup.�1999�Society�of�Environmental�Toxicology�and�Chemistry�(SETAC)�Report.��
World�Meteorological�Organization�(WMO),�United�States�National�Aeronautics�and�Space�Administration,�United�States�National�Oceanic�and�Atmospheric�Administration.�United�Nations�Environment�Programme,�&�European�Commission.�(2007).�Scientific�assessment�of�ozone�depletion,�2006:�Executive�summary.�Global�Ozone�Research�and�Monitoring�Project�report,�no.�50.�Geneva,�Switzerland:�World�Meteorological�Organization.�Accessed�January�8,�2010.�Available�at�http://ozone.unep.org/Assessment_Panels/SAP/Scientific_Assessment_2006�
� �
355

Materials & Resources Greenroads™ Manual v1.5
Lifecycle Assessment MR-1
�
356

Greenroads™ Manual v1.5 Materials & Resources
MR-2 Pavement Reuse
PAVEMENT REUSE GOAL Reuse�existing�pavement�and�structural�materials.�
CREDIT REQUIREMENTS Reuse�at�a�minimum,�a�percentage�of�existing�pavement�materials�or�structural�elements�by�estimated�volume�or�weight�as�shown�in�Table�MR�2.1.�The�materials�considered�in�volume�calculations�can�include�but�are�not�limited�to�hot�mix�asphalt�(HMA),�portland�cement�concrete�(PCC),�unbound�granular�base�material,�stabilized�base�material,�reinforced�concrete,�structural�steel,�and�timber.�In�general,�pavement�materials�will�be�easier�to�calculate�by�volume�while�structural�materials�should�be�calculated�in�terms�of�weight,�unless�material�volumes�are�adjusted�for�density.�
Table�MR�2.1:�Points�for�Estimated�Volume�or�Weight�of�Reused�Materials�Credit�MR�2�Points� 1 2 3 4 5%�Reuse�of�Existing�Pavement�Materials�or�Structural�Elements 50 60 70 80 90
�Details
“Reuse”�is�defined�as�a�continued�use�or�repurposing�of�existing�materials�within�the�project�limits.�Specifically,�this�means�the�material�in�question�has�not�been�transported�beyond�the�project�limits�at�any�time�during�project�construction�and�that�it�has�been�minimally�processed�or�changed�from�its�original�condition.�
This�definition�differentiates�“reuse”�from�“recycle.”�Pavement�reuse�methods�are�intentionally�used�to�extend�the�life�of�the�existing�pavement�structure�in�place.�Similarly,�in�most�cases,�reuse�of�structures,�such�as�bridges�or�retaining�walls,�is�typically�known�as�a�“retrofit,”�where�specific�methods�are�implemented�to�extend�the�life�of�the�existing�structure�in�place.�Reused�materials�may�be�used�in�place,�or�they�may�be�temporarily�removed�from�their�original�location�if:�
1. The�materials�substantially�remain�in�the�same�condition�as�they�were�removed.�2. The�materials�are�replaced�in�the�same�location�on�the�project�or�are�moved�to�
a�new�location�on�the�project�and�repurposed�without�processing.��“Retrofit”�is�defined�as�the�reinforcement�of�structures�to�become�more�resistant�and�resilient�to�the�forces�of�natural�hazards�and�other�environmental�factors�such�as�aging�and�weathering.�It�involves�the�consideration�of�changes�in�the�mass,�stiffness,�damping,�load�path�and�ductility�of�materials,�as�well�as�radical�changes�such�as�the�introduction�of�energy�absorbing�dampers�and�base�isolation�systems.�
“Recycle”�is�defined�as�recovering�a�portion�of�a�used�product�or�material�from�the�waste�stream�for�reprocessing�and/or�repurposing�with�minimal�or�no�transport�offsite�or�within�the�project�limits.�A�“recycled�material”�is�any�material,�from�any�project,�that�has�been:�
1. Processed�at�a�location�outside�of�the�roadway�project�limits�2. Processed�at�a�location�inside�of�the�project�limits,�but�substantially�displaced�or�
otherwise�moved�or�removed�from�its�existing�location�specifically�in�order�to�process�the�material,�such�as�temporary�or�mobile�on�site�recycling�facilities.�
MR-2
1-5 POINTS
RELATED CREDITS
� PR�2�Lifecycle�Cost�Analysis�
� PR�9�Asset�Management�Plan�
� MR�3�Earthwork�Balance�
� MR�4�Recycled�Materials�
� PT�1�Long�Life�Pavement�
� PT�6�Pavement�Performance�Tracking�
SUSTAINABILITY COMPONENTS
� Ecology�� Economy�
BENEFITS
� Reduces�Raw�Materials�
� Reduces�Fossil�Fuel�Use�
� Reduces�Air�Emissions�
� Reduces�Greenhouse�Gases�
� Reduces�Solid�Waste� Reduces�Manmade�
Footprint�� Increases�Service�Life� Reduces�Lifecycle�
Costs�
357

Materials & Resources Greenroads™ Manual v1.5
Pavement Reuse MR-2
3. Material�from�any�outside�source�that�has�been�repurposed�for�use�on�the�roadway�project,�even�if�salvaged�and�still�its�original�condition.��
“Existing�pavement�material”�is�defined�as�all�material�within�the�project�limits�in�the�existing�pavement�structure�(including�surfacing�and�base�material).�This�includes�travelled�lanes�and�shoulders,�and�pavement�structures�for�physically�separated�bicycle�and�pedestrian�pathways.�
“Existing�structural�material”�is�defined�as�all�material�within�the�project�limits�in�existing�non�pavement�structures�such�as�bridges�(including�overpasses),�retaining�walls,�and�stormwater�infrastructure�such�as�vaults,�pipes�and�culverts.�All�existing�structural�materials�include�their�foundations,�for�which�volumes�may�be�difficult�to�estimate.�Where�actual�weights�are�not�available,�reasonable�estimates�may�be�used�or�volume�may�be�estimated.�To�compute�volume�of�hollow�structural�sections�such�as�prefabricated�members�or�corrugated�steel,�estimate�the�mass�of�the�material�and�adjust�for�material�density�to�determine�volume.�Note�that�for�typical�reinforced�concrete�sections,�the�steel�does�not�need�to�be�separated�from�the�composite�section�for�purposes�of�volume�calculations�and�a�composite�density�may�be�used.�
In�order�to�achieve�credit,�some�activity�must�be�done�to�either�the�pavement�or�a�structure�such�that�the�materials�or�assembly�is�improved�or�upgraded�in�some�way.�Cleaning,�regular�maintenance�and�minor�repairs�done�as�part�of�routine�operations�and�maintenance�do�not�qualify�for�this�credit.�
This�credit�is�NOT�appropriate�for�construction�of�an�entirely�new�roadway�or�bridge�replacement,�nor�does�it�apply�to�materials�in�existing�subgrade�(natural�in�situ�material),�fill�material�or�sidewalks�that�are�not�explicitly�part�of�the�pavement�structure�or�structural�element.�Additionally,�this�reuse�credit�does�not�include�minor�structural�elements�such�as�luminaires,�signs,�or�signals�because�they�do�not�make�up�a�significant�amount�of�the�total�volume�of�materials�on�the�project�and�they�do�not�bear�regular�loads�of�people�or�vehicles.�
This�credit�IS�appropriate�for:�
� Pavement�rehabilitation�actions�that�place�new�material�over�the�existing�pavement�structure�such�as�hot�mix�asphalt�(HMA)�overlays,�PCC�overlays�(either�bonded�or�unbounded)�and�pavement�surface�treatments�(e.g.,�chip�seals,�slurry�seals).�
� In�place�reprocessing�operations�(even�though�some�are�referred�to�as�“recycling”)�such�as�hot�in�place�recycling,�cold�in�place�recycling,�full�depth�reclamation,�portland�cement�concrete�(PCC)�crack�and�seat�and�rubblization.�
� Repurposing�of�existing�material�for�other�purposes�in�the�same�project.�The�material�must�not�leave�the�project�boundary�to�be�considered.�If�it�does�leave�the�project�boundary�it�may�still�be�considered�in�the�Recycled�Materials�credit.�
� Any�of�several�bridge�retrofit�methods:�� Stainless�steel�wire�mesh�(SSWM)�composites�� Full�height�steel�jackets�� Elastomeric�bearings�� Steel�restrainer�cables�� Shear�keys�� Fiber�reinforced�polymers�(FRP)�wraps�� Shape�memory�alloy�(SMA)�devices�� Metallic�and�viscoelastic�dampers�� Pipe�seat�extenders�
� Reuse�and�repairs�of�structural�foundations�� Retaining�wall�retrofits�such�as�leveling,�seismic�retrofits,�and�slope�stabilization�methods�that�leave�a�
majority�of�the�original�wall�in�place.�
358

Greenroads™ Manual v1.5 Materials & Resources
MR-2 Pavement Reuse
DOCUMENTATION A�calculation�that�shows�the�computed�percent�of�material�reused�including�the�following�four�items�at�minimum:��
1. Total�volume�of�existing�pavement�structure�2. Total�volume�of�reused�pavement�structure�3. The�computed�percentage�of�the�total�reused�volume,�and��4. A�short�written�description�of�how�the�structure�was�reused.�
APPROACHES & STRATEGIES
� Where�feasible,�undertake�pavement�preservation�efforts�(e.g.,�overlays,�diamond�grinds,�etc.)�that�preserve�a�majority�of�the�existing�pavement�structure.�Pavement�structure�should�not�be�reused�if�its�engineering�properties�are�inadequate�for�the�pavement’s�intended�function.�In�this�instance,�this�credit�serves�as�a�reward�for�an�agency�maintaining�an�active�pavement�preservation�program�that�addresses�deteriorated�pavement�early�enough�so�as�to�avoid�a�total�reconstruction�as�the�only�viable�remedy.��
� Use�in�place�recycling�techniques�such�as�hot�in�place�recycling,�cold�in�place�recycling�and�full�depth�reclamation.�These�methods�qualify�as�reuse�because�the�material�has�not�crossed�project�boundaries.��
� Use�a�crack�and�seat�or�rubblization�option�for�deteriorated�PCC�rather�than�removing�and�replacing�the�existing�PCC.�Such�operations�usually�involve�paving�additional�structure�over�the�cracked�and�seated�or�rubblized�PCC;�therefore,�additional�considerations�would�be�bridge�clearance,�drainage�flows�and�matching�grades�for�cross�streets,�ramps�and�other�access�roads.�
� Retrofit�or�refurbish�existing�structures.�There�are�a�variety�of�methods�available�for�retrofits�depending�on�existing�issues.�
� Perform�a�lifecycle�cost�analysis�of�retrofit�options�for�bridges�when�considering�design�alternatives.�� Reuse�the�pavement�on�bridges�where�it�exists.�� Plan�to�reuse�foundations�because�it�reduces�environmental�impacts,�especially�for�in�water�work.�� Reuse�subassemblies�and�components�of�structures�if�the�entire�structural�element�cannot�be�reused.�� Evaluate�the�structural�condition�of�existing�elements�such�as�bridges�and�retaining�walls.�This�is�typically�
determined�by�a�structural�engineer.�Do�not�reuse�elements�that�have�been�damaged�by�corrosion�or�natural�hazards�without�review�by�a�structural�engineer.�
� Where�structural�elements�are�determined�to�be�inadequate�for�reuse,�consider�salvaging�them�or�deconstructing�them�for�use�on�another�project�or�purpose.�
Example: “Reuse” versus “Recycle”
Greenroads�makes�a�distinction�between�the�terms�“reuse”�and�“recycle.”�The�following�discussion�provides�more�details�for�distinguishing�between�the�two.�
Reused�materials:�These�materials�originate�from�within�the�project�limits�and�are�either�maintained�in�place�(such�as�existing�pavement�structure)�or�disturbed/removed�but�are�not�transported�outside�the�project�limits.�Examples�include:�
� Overlaying�an�existing�pavement�structure�with�new�pavement�material.�The�existing�structure�is�counted�as�reused�material.�This�is�specific�to�pavements�since,�for�instance,�a�stop�sign�that�remains�undisturbed�during�a�roadway�project�does�not�count�as�being�reused.��
� Removing�crushed�aggregate�base�course�from�one�location�and�reusing�it�as�crushed�aggregate�base�course�in�another�location�within�the�project.��
� Hot�in�place�recycling�(HIR).�The�processing�and�treatment�of�an�existing�HMA�pavement�section�(usually�1�2�inches�of�the�surface�only).�Treatment�involves�heating�the�existing�HMA�surface,�the�addition�of�bituminous�and/or�chemical�additives�and,�often,�some�additional�new�HMA.�The�existing�pavement�materials�remain�in�place�and�essentially�serve�their�original�purpose.�
359

Materials & Resources Greenroads™ Manual v1.5
Pavement Reuse MR-2
� Cold�in�place�recycling�(CIR).�The�processing�and�treatment�with�bituminous�and/or�chemical�additives�of�an�existing�HMA�pavement�section�without�heating�to�produce�a�restored�pavement�layer.�The�existing�pavement�materials�remain�in�place�and�essentially�serve�their�original�purpose.��In�many�cases�the�resultant�product�is�used�as�a�stabilized�base�course�that�may�or�may�not�be�subsequently�overlaid�with�a�new�surface�course.��
� Full�depth�reclamation�(FDR).�The�processing�and�treatment�with�bituminous�and/or�chemical�additives�of�an�existing�HMA�pavement�(may�also�include�base�material)�without�heating�to�produce�a�restored�pavement�layer.�The�existing�pavement�materials�remain�in�place�and�essentially�serve�their�original�purpose.��In�many�cases�the�resultant�product�is�used�as�a�stabilized�base�course�that�may�or�may�not�be�subsequently�overlaid�with�a�new�surface�course.�
Recycled�materials:�These�materials�may�originate�within�or�external�to�the�project�limits�and�are�diverted�from�final�disposal�(i.e.�landfill)�and�are�reprocessed�or�repurposed�for�use�in�the�project.�The�essential�difference�between�“recycling”�and�“reuse”�is�that�recycling�involves�reprocessing/repurposing�and,�usually,�substantial�transportation�(usually�to�and�from�the�reprocessing�facility�and�sometimes�to�and�from�the�project�site).�Also,�a�recycled�material�can�often�originate�from�outside�the�project�limits�before�use�on�the�project,�whereas�reused�material�does�not.�Examples�include:�
� HMA�from�the�project�in�question�or�another�project,�commonly�called�reclaimed�asphalt�pavement�(RAP),�is�transported�to�a�storage�location�or�HMA�plant�location�and�included�as�a�constituent�of�a�new�HMA�mixture�for�the�project�in�question.��
� An�existing�concrete�structure�from�the�project�in�question�or�another�project�is�demolished�and�crushed�into�an�appropriate�gradation�and�used�as�a�crushed�aggregate�base�material�or�an�aggregate�component�in�new�PCC�on�the�project�in�question.��
� An�industrial�byproduct�(e.g.,�coal�fly�ash,�silica�fume,�ground�granulated�blast�furnace�slag)�is�incorporated�as�a�component�in�a�new�material�(e.g.,�PCC).��
� Diverted�waste�material�(e.g.,�discarded�rubber�tires,�crushed�glass)�is�incorporated�as�a�component�in�a�new�material�(e.g.,�HMA,�PCC).��
Example: What Is and What Is Not “Existing Pavement Structure”
Figures�MR�2.1�through�MR�2.4�show�examples�of�what�should�and�should�not�be�included�in�this�calculation.�
� Figure�MR�2.1:�This�bicycle�path�should�NOT�be�counted�as�existing�pavement�structure�because�it�is�a�separate�bicycle/pedestrian�path�that�is�not�accessible�to�automobiles.�
� Figure�MR�2.2:�This�bicycle�lane�should�be�counted�as�existing�pavement�structure�because�although�it�is�marked�as�a�bicycle�lane,�it�is�accessible�to�automobiles.�Specifically,�it�must�be�crossed�by�vehicles�accessing�curbside�parking.��
� Figure�MR�2.3:�This�paved�median�should�NOT�be�counted�as�existing�pavement�structure�because�it�is�separated�from�the�travelled�way�by�a�curb�structure�and�is�not�accessible�to�automobiles.�
� Figure�MR�2.4:�This�paved�median�area�should�be�counted�as�existing�pavement�structure�because�it�is�accessible�to�automobiles�even�though�the�double�yellow�line�implies�that�they�should�stay�out.�
360

Greenroads™ Manual v1.5 Materials & Resources
MR-2 Pavement Reuse
Figure�MR�2.1:�A�bicycle�path�in�Auburn,�AL.� Figure�MR�2.2:�A�bicycle�path�as�part�of�the�roadway�(image�from�Google�Maps).�
�
�Figure�MR�2.3:�A�paved�non�accessible�median�
(image�from�Bing�Maps).�
�Figure�MR�2.4:�A�paved�accessible�median�on�US�101�
in�Washington�State.�
Example: Calculation for Widening an Existing Roadway
Description:�Four�miles�of�an�existing�two�lane�road�with�12�foot�wide�lanes�and�no�shoulders�is�to�be�widened�to�include�a�10�foot�wide�two�way�left�turn�lane�and�8�foot�shoulders.�The�existing�pavement�structure�consists�of�5�inches�of�HMA�over�8�inches�of�crushed�aggregate.�The�existing�pavement�is�kept�in�place�except�that�the�top�1.5�inches�of�HMA�is�removed�by�a�milling�machine.�New�pavement�of�the�same�structure�is�built�on�either�side�of�the�existing�pavement�structure�to�accommodate�the�wider�final�alignment.��
Calculation�logic:�All�8�inches�of�the�base�material�and�3.5�inches�of�the�HMA�are�reused.�The�1.5�inches�removed�by�the�milling�machine�is�not�considered�“reused.”�If�it�is�recycled�then�it�may�qualify�for�consideration�under�MR�4�Recycled�Materials.��
Calculation:�Total�volume�of�existing�pavement:�
�
Reused�volume�of�existing�pavement:�
�
361

Materials & Resources Greenroads™ Manual v1.5
Pavement Reuse MR-2
Percentage�of�existing�pavement�reused:�
���33��,*�� �����,*� � ��� � ��)�%$5($�
This�project�would�qualify�for�4�points.��
Example: Calculation for Bridge Retrofit Project – State Route 99 Aurora Bridge
Description:�The�landmark�Aurora�Bridge�in�the�City�of�Seattle�was�built�in�1932�and�has�undergone�several�rehabilitation�activities.�Currently,�it�is�scheduled�for�additional�retrofit�of�18�of�its�48�unique�columns,�as�well�as�its�supporting�trusses,�girders�and�beams�starting�in�late�2010.�The�columns�are�“cruciform”�shaped,�which�makes�it�difficult�to�use�traditional�retrofit�options�such�as�steel�column�jackets.�The�Washington�State�Department�of�Transportation�intends�to�spend�$2.1�million�to�complete�the�upgrade�the�seismic�capacity�of�the�bridge.�
�Figure�MR�2.5:�Aurora�Bridge,�Seattle,�WA�(Photo�Courtesy�of�WSDOT)�
Calculation�logic:�The�entire�bridge�structure�is�to�remain�in�place�for�the�planned�2010�retrofit,�therefore�100%�of�it�is�reused.�
Calculation:�None�needed.�All�existing�structural�materials�are�reused.�
This�project�would�qualify�for�5�points.�
Example: Calculation for Bridge Retrofit Project – State Route 104 Hood Canal Bridge
Description:�The�Hood�Canal�Bridge�is�the�longest�floating�bridge�over�saltwater�in�the�world.�At�1.5�miles,�the�bridge�is�comprised�of�two�approaches,�two�transition�spans�and�36�pontoons.�The�west�“half”�of�the�bridge�has�19�pontoons�and�the�east�has�17.�The�west�approach�span�of�the�bridge�and�some�of�the�existing�pontoon�structures�were�retrofitted.�This�portion�of�the�bridge�had�been�replaced�in�1982�after�sinking�in�1979.�The�east�“half”�of�the�bridge�was�completely�replaced�with�construction�completing�in�early�2010.�
362
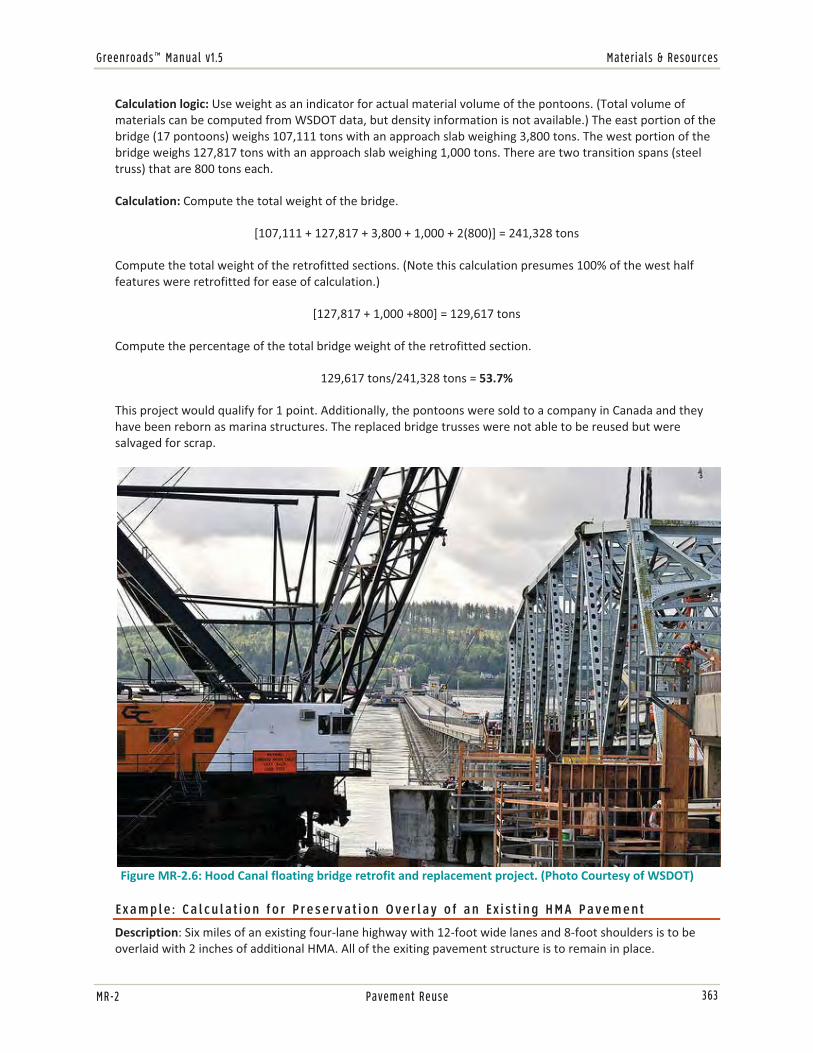
Greenroads™ Manual v1.5 Materials & Resources
MR-2 Pavement Reuse
Calculation�logic:�Use�weight�as�an�indicator�for�actual�material�volume�of�the�pontoons.�(Total�volume�of�materials�can�be�computed�from�WSDOT�data,�but�density�information�is�not�available.)�The�east�portion�of�the�bridge�(17�pontoons)�weighs�107,111�tons�with�an�approach�slab�weighing�3,800�tons.�The�west�portion�of�the�bridge�weighs�127,817�tons�with�an�approach�slab�weighing�1,000�tons.�There�are�two�transition�spans�(steel�truss)�that�are�800�tons�each.�
Calculation:�Compute�the�total�weight�of�the�bridge.�
[107,111�+�127,817�+�3,800�+�1,000�+�2(800)]�=�241,328�tons�
Compute�the�total�weight�of�the�retrofitted�sections.�(Note�this�calculation�presumes�100%�of�the�west�half�features�were�retrofitted�for�ease�of�calculation.)�
[127,817�+�1,000�+800]�=�129,617�tons�
Compute�the�percentage�of�the�total�bridge�weight�of�the�retrofitted�section.�
129,617�tons/241,328�tons�=�53.7%�
This�project�would�qualify�for�1�point.�Additionally,�the�pontoons�were�sold�to�a�company�in�Canada�and�they�have�been�reborn�as�marina�structures.�The�replaced�bridge�trusses�were�not�able�to�be�reused�but�were�salvaged�for�scrap.�
�Figure�MR�2.6:�Hood�Canal�floating�bridge�retrofit�and�replacement�project.�(Photo�Courtesy�of�WSDOT)�
Example: Calculation for Preservation Overlay of an Existing HMA Pavement
Description:�Six�miles�of�an�existing�four�lane�highway�with�12�foot�wide�lanes�and�8�foot�shoulders�is�to�be�overlaid�with�2�inches�of�additional�HMA.�All�of�the�exiting�pavement�structure�is�to�remain�in�place.��
363

Materials & Resources Greenroads™ Manual v1.5
Pavement Reuse MR-2
Calculation�logic:�All�of�the�existing�pavement�structure�is�to�remain�in�place�therefore�100%�of�it�is�reused.��
Calculation:�None�needed.�All�existing�pavement�is�reused.��
This�project�would�qualify�for�5�points.��
Example: Calculation for Rubblization of an Existing PCC Roadway
Description:�Three�miles�of�a�four�lane�highway�with�12�foot�wide�lanes�and�8�foot�shoulders�is�to�be�rubblized�and�overlaid�with�6�inches�of�HMA.�The�existing�pavement�structure�across�all�lanes�and�shoulders�consists�of�9�inches�of�PCC�over�12�inches�of�crushed�aggregate.�
Calculation�logic:�All�of�the�existing�pavement�structure�is�to�remain�in�place�therefore�100%�of�it�is�reused.��
Calculation:�None�needed.�All�existing�pavement�is�reused.��
This�project�would�qualify�for�5�points.��
Example: Calculation for Hot In-Place Recycling of an Existing HMA Roadway
Description:�Two�miles�of�a�two�lane�highway�with�12�foot�wide�lanes�and�4�foot�shoulders�is�to�be�hot�in�place�recycled.�Hot�in�place�recycling�will�be�done�on�the�top�2�inches�of�HMA�pavement�using�a�heater�scarification�approach�(http://pavementinteractive.org/index.php?title=HIPR).�This�method�uses�a�plant�that�heats�the�pavement�surface�(typically�using�propane�radiant�heaters),�scarifies�the�pavement�surface�using�a�bank�of�non�rotating�teeth,�adds�a�rejuvenating�agent�to�improve�the�asphalt�binder�viscosity,�then�mixes�and�levels�the�mix�using�a�standard�auger�system.�The�pavement�is�then�compacted�using�conventional�compaction�equipment.��
Calculation�logic:�All�of�the�existing�pavement�structure�is�reprocessed�and�reused�on�the�project,�therefore�100%�is�reused.���
Calculation:�None�needed.�All�existing�pavement�is�reused.��
This�project�would�qualify�for�5�points.��
Example: Calculation for Reconstruction of One Lane of an Existing Roadway
Description:�One�mile�of�the�outside�southbound�lane�of�an�existing�six�lane�arterial�with�12�foot�wide�lanes�is�to�be�removed�and�replaced�with�PCC�to�accommodate�a�bus�rapid�transit�lane.�The�arterial�has�no�shoulders�and�has�a�raised�vegetated�median�that�is�not�accessible�to�automobiles.�The�existing�pavement�structure�consists�of�7�inches�of�HMA�over�9�inches�of�crushed�aggregate.��The�outside�southbound�lane�construction�requires�a�pavement�structure�of�12�inches�of�PCC�over�7�inches�of�crushed�aggregate.�Therefore,�all�the�pavement�structure�in�the�outside�lane�must�be�removed�and�a�further�three�inches�of�excavation�must�be�done�to�accommodate�the�thicker�pavement�section.�Once�the�excavation�is�done,�7�inches�of�the�previously�removed�crushed�aggregate�is�placed.�Then,�12�inches�of�new�PCC�is�placed.�The�project�scope�includes�all�southbound�lanes�because�other�median�work�and�restriping�is�to�be�done.�The�project�scope�does�not�include�the�northbound�lanes.��
Calculation�logic:�The�project�scope�only�includes�the�southbound�lanes;�only�material�in�these�lanes�shall�be�included�in�the�calculation.�Also,�since�7�inches�of�the�existing�crushed�aggregate�was�reused�as�base�course�for�the�new�PCC�lane,�it�can�be�included.����
Calculation:�Total�volume�of�existing�pavement�in�the�southbound�lanes:�
364

Greenroads™ Manual v1.5 Materials & Resources
MR-2 Pavement Reuse
����6�����"'#$(� � 3��"'#$( 7 ��6�����"'#$(8 ���9��$ 7
���� �6�9��$ 8 : ��,*����6��; � 3�����,*��
Reused�volume�pavement�in�the�two�left�hand�existing�lanes�(those�not�reconstructed):�
����6�����"'#$(� � 3��"'#$( 7 ��6�����"'#$(8 ���9��$ 7
���� �6�9��$ 8 : ��,*����6��; � ������,*��
Reused�volume�of�crushed�aggregate�in�the�reconstructed�right�hand�lane:�
����6�����"'#$( 7 ��6�����"'#$(8 ���9��$ 7
���� �6�9��$ 8 : ��,*����6��; � ������,*��
Percentage�of�existing�pavement�reused:�
������,*� � ������,*��3�����,*� � ��� � ��)�%$5($�
This�project�would�qualify�for�4�points.��
If�the�project�did�not�reuse�the�existing�aggregate�in�the�right�lane,�the�calculation�would�be�as�follows:�
������,*��3�����,*� � ��� � ��)�%$5($�
The�project�would�qualify�for�2�points.��
POTENTIAL ISSUES
1. A�project�may�misclassify�a�material�as�“reused”�instead�of�“recycled.”�Usually�this�is�a�minor�issue�since�both�processes�can�receive�Greenroads�points.�See�MR�4�Recycled�Materials�for�more�information.�
2. Pavement�thickness�in�older�road�sections�may�be�highly�variable;�therefore�estimating�existing�volume�may�be�difficult.�In�such�cases,�it�is�important�to�clearly�state�assumptions�and�the�sources�of�information�you�are�using.�
RESEARCH Reused�materials�are�a�valuable�and�cost�effective�resource�that�may�be�used�to�help�reduce�the�ecological�impacts�and�lifecycle�costs�of�roadway�construction.�In�many�forms�of�roadway�infrastructure�(especially�pavements)�existing�materials�can�be�reused�for�their�original�intended�purpose�if�they�meet�minimum�engineering�standards.�Badly�deteriorated�hot�mix�asphalt�(HMA)�pavement,�for�example,�may�be�ground�up�in�place,�stiffened�with�a�binding�agent�and�recompacted�to�form�the�base�material�for�a�new�pavement.�This�process�is�typically�referred�to�as�cold�in�place�recycling.�
For�the�built�environment,�materials�reuse�typically�refers�to�the�idea�of�carefully�deconstructing�a�building�instead�of�demolishing�it.�Deconstruction�means�disassembling�a�building�in�such�a�way�that�the�materials�can�be�reused�for�new�construction�(BMRA,�2010).�Thus,�items�like�floor�joists,�windows,�doors,�plumbing�fixtures�and�siding�that�still�have�remaining�life�can�be�reused�for�new�construction�rather�than�demolished�and�either�sent�to�landfill�or�recycled�as�more�basic�materials�(e.g.,�wood,�steel,�etc.).�For�instance,�an�assembly�of�materials�like�a�door�(possibly�consisting�of�wood,�aluminum,�brass,�glass,�plastic�and�more)�can�be�reused�rather�than�disposed�of�or�separated�into�its�constituent�components�for�recycling.�
365

Materials & Resources Greenroads™ Manual v1.5
Pavement Reuse MR-2
Pavement�Reuse�Defined�Pavement�Reuse:�the�process�by�which�pavement�materials�within�the�project�limits�are�either�maintained�in�place�(such�as�existing�pavement�structure)�or�disturbed/removed�but�are�not�transported�outside�the�project�limits.��
By�this�definition�Greenroads�distinguishes�“reuse”�from�“recycle”�because�recycling�is�defined�more�broadly�as�the�process�by�which�materials�within�or�external�to�the�project�limits�are�diverted�from�final�disposal�(i.e.�landfill)�and�are�reprocessed�or�repurposed�for�use�in�the�project.�The�essential�difference�between�“recycling”�and�“reuse”�is�that�recycling�involves�reprocessing/repurposing�and,�usually,�substantial�transportation�(usually�to�and�from�the�reprocessing�facility).�Also,�a�recycled�material�need�not�originate�from�the�project�in�question.��Therefore,�material�reuse�as�defined�by�Greenroads�offers�the�same�sustainability�benefits�of�recycling�(see�MR�4�Recycled�Materials�for�a�discussion�of�benefits,�current�waste�streams�and�diversion�rates)�with�the�added�benefit�of�reduced�transportation�and�an�associated�reduction�in�energy,�emissions�and�cost.��
This�credit�focuses�exclusively�on�reuse�of�pavement�materials�because�of�(1)�the�dominance�of�pavements�materials�on�roadway�projects,�and�(2)�the�ability�to�reuse�large�percentages�of�existing�pavement�structures.�First,�pavements�are�the�most�prevalent�structure�in�roadway�construction,�accounting�for�about�70%�of�state�and�local�roadway�expenditures�(BTS,�2008).�On�most�projects�(except�for�perhaps�bridges�and�tunnels)�they�make�up�a�majority�of�the�material�by�weight.�Second,�it�is�quite�common�to�undertake�a�roadway�construction�project�that�keeps�in�place�the�entire�existing�pavement�structure�(essentially�100%�reuse).�This�can�occur�in�roadway�expansion�projects,�projects�that�reprocess�existing�materials�in�place�and,�importantly,�routine�preservation�projects�that�either�add�to�the�existing�structure�or�only�replace�the�top�few�inches�of�an�existing�pavement�structure.�For�the�purposes�of�Greenroads,�these�types�of�preservation�“overlays”�and�“mill�and�fill”�(remove�a�thin�layer�of�pavement�and�replace�with�a�comparable�thickness)�jobs�are�deemed�to�have�reused�the�entire�remaining�pavement�structure.�In�this�way,�the�pavement�reuse�credit�can�serve�as�a�reward�for�an�owner�that�pursues�a�preservation�program�designed�to�maintain�pavement�network�condition�through�timely�periodic�surface�overlays�or�treatments�rather�than�wholesale�remove�and�replace�procedures.����
Pavement�Reuse�Methods�This�section�briefly�overviews�some�of�the�more�common�pavement�reuse�methods�that�meet�the�Greenroads�“reuse”�definition.�These�are:�
� Surface�treatments�� Overlay�/�Mill�and�Fill�� Hot�in�place�recycling�(HIR)�� Cold�in�place�recycling�(CIR)�� Full�depth�reclamation�(FDR)�� Crack�and�Seat�of�PCC�pavements�� Rubblization�of�PCC�pavements�
In�the�cases�of�CIR,�FDR,�crack�and�seat�and�rubblization�the�existing�material�is�effectively�downcycled;�that�is�it�is�reused�for�a�lesser�purpose�(as�an�aggregate�material�instead�of�a�bound�concrete�material).�In�all�cases,�these�methods�are�considered�“reuse”�as�defined�by�Greenroads�because�no�existing�material�leaves�the�project�site.��
Surface�Treatments�Pavement�surface�treatments�are�materials�placed�on�the�existing�pavement�surface�in�order�to�correct�minor�surface�defects,�improve�wear�course�characteristics�(i.e.,�friction)�and�provide�a�waterproof�covering.�Surface�treatments�are�generally�quite�thin�(e.g.,�less�than�1�inch�thick)�and�can�consist�of�a�number�of�different�treatments�including:�
� Fog�seal�(Figure�MR�2.7).�A�light�application�of�a�diluted�slow�setting�asphalt�emulsion�to�the�surface�of�an�aged�(oxidized)�pavement�surface.��
366

Greenroads™ Manual v1.5 Materials & Resources
MR-2 Pavement Reuse
� Slurry�seal�(Figure�MR�2.8).�A�homogenous�mixture�of�emulsified�asphalt,�water,�well�graded�fine�aggregate�and�mineral�filler�used�as�a�maintenance�treatment�or�wearing�course.�Microsurfacing�is�an�advanced�form�of�slurry�seal�that�uses�the�basic�ingredients�and�combines�them�with�polymer�additives�to�achieve�better�engineering�properties.��
� Chip�seal�(Figure�MR�2.9�and�MR�2.10).�Also�known�as�a�seal�coat�or�bituminous�surface�treatment,�a�chip�seal�is�a�thin�protective�wearing�surface�applied�to�a�pavement�surface.�At�its�most�basic,�a�chip�seal�consists�of�a�layer�of�asphalt�(often�applied�as�an�emulsion)�applied�to�the�existing�pavement�surface�in�which�a�single�layer�of�aggregate�is�embedded.�More�exotic�chip�seals�can�use�several�layers�(e.g.,�double�chip�seal),�different�stone�sizes�(e.g.,�racked�in�seal),�and�be�combined�with�other�surface�treatments�(e.g.,�cape�seal�–�combined�with�a�slurry�seal)�(Gransberg�&�James,�2005).��
Figure�MR�2.7:�No�fog�seal�(left),�fog�seal�(right).� Figure�MR�2.8:�Microsurfacing�(from�the�Washington�State�Department�of�Transportation).�
�
Figure�MR�2.9:�Chip�seal�asphalt�emulsion�application.�
Figure�MR�2.10:�Chip�seal�aggregate�application.�
Overlay�/�Mill�&�Fill�Overlays�(Figure�MR�2.11)�are�operations�where�either�PCC�or�HMA�is�placed�over�an�existing�pavement.�Overlays�can�be�used�to�add�additional�structure�to�the�existing�pavement�(called�“structural�overlays”)�or�can�be�used�to�provide�a�new�pavement�surface�free�of�defects�(called�“non�structural�overlays”).�A�“mill�and�fill”�is�a�variation�of�an�overlay�where�the�existing�pavement�surface�is�partially�removed�by�a�pavement�milling�machine�(cold�planer,�Figure�MR�2.12)�before�the�overlay�is�applied.�This�is�usually�done�to�either:�
1. Remove�existing�surface�defects�in�order�to�improve�overall�pavement�quality,�or�2. Maintain�existing�pavement�elevations�after�the�overlay�is�complete.�
367

Materials & Resources Greenroads™ Manual v1.5
Pavement Reuse MR-2
In�many�instances�(especially�the�second)�the�milling�depth�is�the�same�as�the�subsequent�overlay�depth.��For�HMA�pavements,�overlays�and�mill�and�fills�are�the�most�common�form�of�pavement�preservation�and�can�constitute�the�majority�of�HMA�placed�for�most�owners�(as�opposed�to�new�pavements).�PCC�overlays�can�consist�of�bonded�or�unbounded�overlays.�Bonded�overlays,�often�referred�to�as�“whitetopping”�when�placed�on�existing�HMA�pavements,�consist�of�a�thin�PCC�layer�(usually�2�to�7�inches)�that�is�bonded�to�the�existing�underlying�pavement.�An�unbounded�overlay�is�a�PCC�layer�placed�over�an�existing�pavement�without�bonding.�Since�there�is�no�bonding,�the�new�PCC�layer�essentially�performs�like�an�independent�structure�and�therefore�must�be�thicker;�often�the�minimum�thickness�for�an�unbounded�overlay�is�5�to�7�inches.���
Figure�MR�2.11:�1.8�inch�overlay.� Figure�MR�2.12:�Milling�machine.�
Hot�In�Place�Recycling�(HIR)�HIR�involves�in�place�reprocessing�of�the�top�of�an�existing�HMA�pavement.�The�process�is�accomplished�by�heating�the�existing�pavement�surface�to�aid�in�remixing,�additive�addition�and�removal�of�defects.�Despite�its�name,�Greenroads�considers�HIR�to�be�reuse�since�the�existing�material�does�not�leave�the�project�site.�There�are�generally�three�methods�of�HIR:�
� Heater�scarification.�Heats�the�pavement�surface�(typically�using�propane�radiant�heaters),�scarifies�the�pavement�surface�using�a�bank�of�non�rotating�teeth,�adds�a�rejuvenating�agent�to�improve�the�recycled�asphalt�binder�viscosity,�then�mixes�and�levels�the�recycled�mix�using�a�standard�auger�system.�The�recycled�asphalt�pavement�is�then�compacted�using�conventional�compaction�equipment.�
� Repaving.�Heats�the�pavement�surface�(typically�using�propane�radiant�heaters),�removes�(by�scarification�and/or�grinding)�the�top�1�to�2�inches�of�the�existing�HMA�pavement,�adds�a�rejuvenating�agent�to�improve�the�recycled�asphalt�binder�viscosity,�places�the�recycled�material�back�on�the�remaining�existing�pavement�using�a�primary�screed,�and�may�simultaneously�place�a�HMA�overlay.��
� Remixing�(Figures�MR�2.13�and�MR�2.14).�Similar�to�repaving�but�adds�new�virgin�aggregate�or�new�HMA�to�the�recycled�material�before�it�is�replaced.�
368

Greenroads™ Manual v1.5 Materials & Resources
MR-2 Pavement Reuse
Figure�MR�2.13:�HIR�heating�equipment.� Figure�MR�2.14:�HIR�equipment�heating�and�removing�the�top�layer�of�existing�HMA.�
Cold�In�Place�Recycling�(CIR)�CIR�(Figure�MR�2.15)�involves�milling�and�crushing�the�existing�HMA�pavement,�mixing�in�measured�amounts�of�emulsified�liquid�asphalt�and�lime�slurry,�and�placing�and�compacting�the�reprocessed�material�to�construct�a�new�roadway�base.��Following�CIR,�the�base�is�overlaid�with�HMA�or,�in�some�cases,�a�chip�seal.�The�depth�of�milling�is�generally�2�to�4�inches�and,�importantly,�does�not�extend�beyond�the�existing�HMA�layer.��
Figure�MR�2.15:�CIR�process�train�(photo�from�the�Washington�State�Department�of�Transportation).��
Full�Depth�Reclamation�(FDR)�FDR�(Figures�MR�2.16�and�MR�2.17)�involves�pulverizing�the�full�existing�pavement�structure�and�a�portion�of�the�underlying�subgrade�and�combining�the�resultant�material�with�water�and/or�a�stabilizing�agent�to�form�a�uniform�stabilized�base�course�(ARRA,�n.d.).��Typical�FDR�depths�are�6�to�9�inches�(ARRA,�n.d.).�After�FDR,�it�is�typical�to�pave�either�a�thin�HMA�pavement�or�chip�seal.���
369

Materials & Resources Greenroads™ Manual v1.5
Pavement Reuse MR-2
Figure�MR�2.16:�Road�reclaimer�used�in�FDR�(photo�from�Grace�Pacific,�Inc.).�
Figure�MR�2.17:�Finished�FDR�material�before�overlay�(photo�from�Grace�Pacific,�Inc.).�
PCC�Crack�and�Seat�Crack�and�Seat�is�a�method�for�rehabilitating�failed�plain�jointed�PCC�pavement�that�involves�breaking�up�the�existing�PCC�pavement�into�small�pieces�(typically�1�to�4�foot�pieces),�seating�those�pieces�with�a�heavy�proof�roller�and�then�overlaying�the�cracked�and�seated�PCC�with�new�HMA.�This�method�avoids�removing�the�old�PCC;�instead�using�it�as�a�high�quality�base�material.�Typically,�PCC�is�cracked�using�a�drop�hammer�truck�(Guillotine�Breaker,�Figure�MR�2.18)�that�repeatedly�drops�a�heavy�weight�onto�the�pavement�surface.��
�Figure�MR�2.18:�Guillotine�breaker�used�for�crack�and�seat.�
�Crack�and�seat�projects�have�performed�relatively�well�to�date.�For�instance,�Rajagopal�et�al.�(2004)�showed�that�the�crack�and�seat�technique�reduced�reflection�cracking�over�at�least�a�9�year�period�for�the�conditions�analyzed.��
PCC�Rubblization�Rubblization�is�a�method�for�rehabilitating�failed�PCC�pavement�(typically�plain�jointed�PCC�pavement)�that�involves�rubblizing�the�existing�PCC�pavement�(particles�sizes�of�2�to�15�inches�in�diameter�depending�upon�the�specific�method�used)�and�then�overlaying�the�rubblized�PCC�with�HMA�pavement.�This�method�avoids�removing�the�old�PCC;�instead�using�it�as�a�high�quality�base�material.�Rubblization�is�typically�accomplished�by�one�of�two�methods:��
� Resonant�breaker�(Figure�MR�2.19).�A�machine�that�strikes�the�pavement�at�a�high�frequency�(around�44�Hz,�the�resonant�frequency�of�the�PCC�pavement)�and�low�amplitude�(0.5�0.75�inches)�using�the�resonant�
370

Greenroads™ Manual v1.5 Materials & Resources
MR-2 Pavement Reuse
frequency�to�fracture�the�existing�PCC�into�small�diameter�particles.�The�breaking�shoe�can�be�2�to�12�inches�wide.��
� Multi�head�breaker�(Figure�MR�2.20).�A�machine�that�strikes�the�pavement�with�a�series�of�drop�hammers�(1�to�5�foot�drop�height)�and�uses�the�impact�energy�to�fracture�the�existing�PCC�pavement�into�small�diameter�particles.��
Figure�MR�2.19:�RMI�resonant�breaker��(photo�from�Resonant�Machines,�Inc.).�
Figure�MR�2.20:�Antigo�multi�head�breaker��(photo�from�Antigo�Construction,�Inc.).�
�Limited�evidence�suggests�that�rubblized�pavements,�if�constructed�properly,�can�perform�well.�Wolters�et�al.�(2005)�examined�rubblized�pavements�in�2005�that�were�3�8�years�old�and�found�them�to�be�in�good�condition�with�the�exception�of�those�sections�that�did�not�have�well�drained�base�layers.���
GLOSSARY
CIR� Cold�in�place�recycling�(sometimes�CIPR)Cold�In�Place�Recycling� In�place�reprocessing�of�a�portion�of�existing�HMA�pavement�(usually�the�top�204�
inches)�into�a�high�quality�base�material�by�milling,�crushing�and�stabilizing.�Usually�this�base�is�then�covered�by�a�thin�HMA�layer�or�surface�treatment.�
Crack�and�Seat� Method�for�rehabilitating�failed�plain�jointed�PCC�pavement�that�involves�breaking�up�the�existing�PCC�pavement�into�small�pieces�(typically�1�to�4�foot�pieces),�seating�those�pieces�with�a�heavy�proof�roller�and�then�overlaying�the�cracked�and�seated�PCC�with�new�HMA.�
Downcycling� The�recycling�of�a�material�to�a�material�of�lower�quality�or�reduced�functionality.FDR� Full�depth�reclamationFull�Depth�Reclamation� In�place�reprocessing�of�a�HMA�pavement�structure�(including�the�granular�base�
course�and�some�subgrade�material)�into�a�high�quality�base�material�by�pulverizing�and�stabilization.�Usually�this�base�is�then�covered�by�a�thin�HMA�layer�or�surface�treatment.�
HIR� Hot�in�place�recycling�(sometimes�HIPR)HMA� Hot�mix�asphaltHot�In�Place�Recycling� In�place�reprocessing�of�a�thin�top�layer�(usually�less�than�2�inches)�of�an�existing�
HMA�pavement�by�scarification,�rejuvenation�and�repaving.��Mill�and�Fill� A�variation�of�an�overlay�for�existing�HMA�pavements�where�the�existing�pavement�
surface�is�partially�removed�by�a�pavement�milling�machine�before�the�overlay�is�applied.��
Overlay� A�layer�of�either�PCC�or�HMA�that�is�placed�over�an�existing�pavement.�Overlays�can�be�used�to�add�additional�structure�to�the�existing�pavement�(called�“structural�overlays”)�or�can�be�used�to�provide�a�new�pavement�surface�free�of�defects�(called�
371

Materials & Resources Greenroads™ Manual v1.5
Pavement Reuse MR-2
“non�structural�overlays”).PCC� Portland�cement�concreteRecycle� A�process�that�diverts�materials�within�or�external�to�the�project�limits�from�final�
disposal�in�a�landfill�by�reprocessing�or�repurposing�them�for�use�in�the�project.�Reuse� A�process�that�maintains�materials�in�place�(such�as�existing�pavement�structure)�or�
disturbs�or�removes�them�by�means�that�does�not�include�transport�outside�the�project�limits.�
Rubblization� Method�for�rehabilitating�failed�PCC�pavement�(typically�plain�jointed�PCC�pavement)�that�involves�reducing�the�existing�PCC�pavement�to�small�particles�(2�15�inches�in�diameter�depending�upon�the�specific�method�used)�and�then�overlaying�the�rubblized�PCC�with�HMA�pavement.�
Surface�Treatment� Materials�placed�on�the�existing�pavement�surface�in�order�to�correct�minor�surface�defects,�improve�wear�course�characteristics�(i.e.,�friction)�and�provide�a�waterproof�covering.��
�
REFERENCES Andrawes,�B.,�&�Desroches,�R.�(2007).�Comparison�between�Shape�Memory�Alloy�Seismic�Restrainers�and�Other�
Bridge�Retrofit�Devices.�Journal�of�Bridge�Engineering. 12�(6),�700.��Asphalt�Recycling�and�Reclaiming�Association�(ARRA).�(n.d.).�Full�Depth�Reclamation:�A�Century�of�Advancement�for�
the�New�Millennium.�ARRA,�Annapolis,�MD.�
Binici�B.�(2008).�Design�of�FRPs�in�circular�bridge�column�retrofits�for�ductility�enhancement.�Engineering�Structures. 30�(3),�766�776.�
Building�Materials�Reuse�Association�(BMRA).�(2010).�Website.�Available�at�http://www.bmra.org.�
Bureau�of�Transportation�Statistics�(BTS).�(2008).�Transportation�Statistics�Annual�Report�2007.�TABLE�G�8�Public�Expenditures�on�Construction�of�Highways�and�Streets:�January�2006�May�2007.�Washington,�DC:�Research�and�Innovative�Technology�Administration�(RITA),�U.S.�Department�of�Transportation�(US�DOT).�
Choi,�Jun�Hyeok.�(2008).�Seismic�retrofit�of�reinforced�concrete�circular�columns�using�stainless�steel�wire�mesh�composite.�Canadian�Journal�of�Civil�Engineering, 35(2),�140�147.�
�Earthquake�Engineering�Research�Center�(EERC),�University�of�California,�Berkeley.�(n.d.)�Northridge�Earthquake.�
Accessed�June�2,�2010.�Available�at�http://nisee.berkeley.edu/northridge/��
Gransberg,�D.�&�James,�D.M.B.�(2005).�NCHRP�Synthesis�342:�Chip�Seal�Best�Practices.�Washington,�DC:�National�Cooperative�Highway�Research�Program,�Transportation�Research�Board.��
International�Strategy�for�Disaster�Reduction�(ISDR).�(2004,�March�31).�ISDR�:�Terminology.�Accessed�June�5,�2010.�Available�at�http://www.unisdr.org/eng/library/lib�terminology�eng�home.htm�
�Padgett�J.E.,�&�DesRoches�R.�(2008).�Three�dimensional�nonlinear�seismic�performance�evaluation�of�retrofit�
measures�for�typical�steel�girder�bridges.�Engineering�Structures. 30�(7),�1869�1878.��Padgett,�J.�E.,�Dennemann,�K.,�&�Ghosh,�J.�(2010).�Risk�based�seismic�life�cycle�cost�benefit�(LCC�B)�analysis�for�
bridge�retrofit�assessment.�Structural�Safety.�32�(3),�165.��Rajagopal,�A.,�Minkarah,�I.,�Green,�R.�&�Morse,�A.�(2004).�Long�Term�Performance�of�Broken�and�Seated�
Pavements.�Transportation�Research�Record.�(869),�3�15.�
372

Greenroads™ Manual v1.5 Materials & Resources
MR-2 Pavement Reuse
Stanton,�J.�F.,�Roeder,�C.W.,�Mackenzie�Helnwein,�P.,�White,�C.,�Kuester,�C.�et�al.�National�Cooperative�Highway�Research�Program�(NCHRP).�(2008).�NCHRP�Report�596���Rotation�limits�for�elastomeric�bearings. Washington,�D.C.:�Transportation�Research�Board.�
�Volpe,�John�A.�Northridge�Earthquake��Preliminary�Summary�Report.�Effects�of�Catastrophic�Events�on�
Transportation�System�Management.�22�Apr.�2002.�Accessed�June�2,�2010.�Available�at�http://ntl.bts.gov/lib/jpodocs/repts_te/13775.html�
�Washington�Department�of�Transportation�(WSDOT).�(2010).�WSDOT�–�SR�99�–�Aurora�Bridge�Seismic�Retrofit�
Project.�Accessed�August�20,�2010.�Available�at�http://www.wsdot.wa.gov/Projects/SR99/AuroraBridgeSeismicRetrofit/projectPhotos�
�Washington�Department�of�Transportation�(WSDOT).�(2010).�WSDOT�–�SR�104�–�Hood�Canal�Bridge�–�2009�
Frequently�Asked�Questions.�Accessed�August�20,�2010.�Available�at�http://www.wsdot.wa.gov/Projects/SR104HoodCanalBridgeEast/faq.htm�
�Washington�Department�of�Transportation�(WSDOT).�(2010).�SR�104�–�Hood�Canal�Bridge�–�By�the�Numbers.�
Accessed�August�20,�2010.�Available�at�http://www.wsdot.wa.gov/Projects/SR104HoodCanalBridgeEast/numbers.htm�
�Wolters,�A.S.,�Smith,�K.D.�&�Peterson,�C.V.�2007.�Evaluation�of�Rubblized�Pavement�Sections�in�Michigan.�
Transportation�Research�Record.�(2005),�18�26.�
�
� �
373

Materials & Resources Greenroads™ Manual v1.5
Pavement Reuse MR-2
�
�
�
�
�
�
374

Greenroads™ Manual v1.5 Materials & Resources
MR-3 Earthwork Balance
EARTHWORK BALANCE GOAL Reduce�need�for�transport�of�earthen�materials�by�balancing�cut�and�fill�quantities.�
CREDIT REQUIREMENTS Minimize�earthwork�cut�(excavation)�and�fill�(embankment)�volumes�such�that�the�percent�difference�between�cut�and�fill�is�less�than�or�equal�to�10%�of�the�average�total�volume�of�material�moved.�For�purposes�of�this�credit,�use�the�method�and�definitions�detailed�in�Chapter�8�(Earthwork)�of�the�Road�Design�Manual�from�the�South�Dakota�Department�of�Transportation�(SDDOT),�or�equivalent,�to�compute�cut�and�fill�volumes.�Include�miscellaneous�additional�cut�and�fill�such�as�outlet�ditches�and�muck�excavations�(see�definitions�in�Chapter�8�of�the�Manual)�and�account�for�moisture�and�density�as�well�as�shrink�and�swell.��
Balance�cut�and�fill�material�volumes:�
A�=�Volume�of�Cross�Section�Cut�B�=�Volume�of�Cross�Section�Fill�C�=�Volume�of�Miscellaneous�Cut�D�=�Volume�of�Miscellaneous�Fill��For�points,�show�that�design�volumes�AND�actual�construction�volumes�meet:�
�
Note�that�for�purposes�of�this�credit,�all�volumes�are�positive�quantities.�SDDOT’s�Chapter�8�is�available�here:�http://www.sddot.com/pe/roaddesign/plans_rdmanual.asp��
Details
� Projects�with�minimal�earthwork�or�with�no�earthwork�do�not�qualify�for�this�credit.�“Minimal�earthwork”�means�that�the�total�excavated�cut�or�imported�fill�volume�is�less�than�one�full�dump�truck�volume,�based�on�the�smallest�dump�truck�used�on�the�project.�
� Where�soil�stabilizer�materials�or�other�soil�additives�are�used,�include�the�volume�of�those�materials�in�the�total�imports.�Mechanical�stabilizers�such�as�rock�bolts�and�geotextile�fabric�materials�do�not�need�to�be�included�in�volume�calculations.�
� Removed�topsoil�materials�must�be�included�in�calculations.��� Unused�cut�or�imported�fill�materials�placed�in�stockpiles�that�serve�no�purpose�
on�the�project�must�be�treated�as�exported�materials�and�may�not�be�used�to�count�toward�the�final�“balanced”�section�for�purposes�of�calculating�this�credit.�Sometimes�this�practice�is�called�“soil�banking”�since�these�materials�are�often�placed�in�embankments�that�may�be�used�at�some�later�time,�often�on�different�nearby�sites.�This�practice�often�helps�successfully�avoid�import�of�new�materials,�so�it�still�may�qualify�for�1�point.�
� Structural�aggregate�for�base�courses�in�pavements,�foundations,�or�
MR-3
1 POINT
RELATED CREDITS
� PR�8�Low�Impact�Development�
� MR�2�Pavement�Reuse�
� MR�4�Recycled�Materials�
� MR�5�Regional�Materials�
SUSTAINABILITY COMPONENTS
� Ecology�� Economy�� Extent�� Experience�
BENEFITS
� Reduces�Fossil�Fuel�Use��
� Reduces�Air�Emissions�
� Reduces�Greenhouse�Gases�
� Reduces Solid Waste� Reduces�Manmade�
Footprint�� Reduces�First�Costs�� Reduces�Lifecycle�
Costs�
375
� Ecolog� Econom� Extent� Experie

Materials & Resources Greenroads™ Manual v1.5
Earthwork Balance MR-3
superstructures�such�as�bridges�need�not�be�included�in�the�total�volume�calculations.�� Structural�backfill�and�drain�rock�specifically�intended�for�utility�trenches�and�stormwater�infrastructure�
need�not�be�included�in�the�total�volume�calculations.�� Rock�(Stable�Rock,�defined�by�the�Occupational�Health�and�Safety�Administration)�cuts�sourced�within�the�
project�boundary�that�are�intended�for�use�as�structural�aggregate�within�the�project�boundary�do�not�count�toward�the�total�cut�volume�of�materials.�
DOCUMENTATION � Copy�of�the�grading�plan.�The�grading�plan�must�report�total�cut�and�fill�quantities,�total�miscellaneous�cut/fill,�
and�show�that�they�are�within�10%�of�one�another.�� Calculate�and�report�actual�construction�earthwork�volume�for�the�project.�This�calculation�shall�show�the�
following:�
� Actual�cut�and�fill�volumes�during�construction.�� Actual�volume�of�unused�embankment�materials�(include�excess�import�and�excess�cut�materials)�� Actual�volume�of�earthwork�material�imported�to�the�project�site.��� Actual�volume�of�earthwork�material�exported�from�the�site.�� Show�that:�
�< � = ���> � ?�� �< � = � >� ?
2 � ) @ � )�
APPROACHES & STRATEGIES
� Use�a�project�design�that�balances�cut�and�fill�volumes.�This�assumes�that�cut�material�from�one�area�of�the�project�site�is�suitable�for�use�as�fill�material�in�another.�This�may�not�always�be�possible.��
� Use�soil�improvement�or�stabilization�techniques�in�an�effort�to�avoid�removing�existing�soil.�
� Apply�binding�agents,�additives�and�other�processes�to�unsuitable�soils�such�that�they�become�suitable�for�use.�This�often�involves�improving�their�bearing�capacity�so�they�can�accept�overburden�or�structures.��
� Use�in�situ�mitigation�techniques�to�solve�problems�with�unsuitable�soils�through�ground�improvement�solutions�such.�Usually�this�involves�forms�of�compacting,�preloading,�installed�drains�(to�lower�moisture�levels)�or�other�similar�methods.��
� Improve�load�bearing�capacity�of�soils�by�placing�geosynthetics�over�them.�This�can�force�the�potential�bearing�capacity�failure�surface�to�develop�along�alternate,�higher�strength�surfaces.��
� Use�recycled�material�from�other�structures�(e.g.,�crushed�recycled�concrete�material�–�RCM�or�reclaimed�asphalt�pavement�–�RAP).��
� Use�design�software�and�computer�aided�drawings�(CAD)�to�calculate�the�design�volumes�of�earthwork�to�be�reported�in�relation�to�this�credit.�Note�that�these�drawings�and�calculations�will�be�superseded�by�final�volume�calculations�in�the�field�in�the�event�that�they�differ.�
Example: Sample Calculation
The�South�Dakota�Department�of�Transportation�Road�Design�Manual,�Chapter�8,�contains�a�detailed�example�of�balancing�cut�and�fill�volumes�using�computer�software,�titled�“Example�of�Earthwork�Quantities�with�Moisture�&�Density�Control�(Undercut)”�(p.�8�6).�The�example�below�shows�how�the�calculation�can�be�done�by�hand�for�this�credit.�There�are�a�number�of�additional�sample�calculations�in�the�referenced�chapter.�
Variable� Description Volume�(cy)�
A� Normal�cross�section�excavation 54,889�
376

Greenroads™ Manual v1.5 Materials & Resources
MR-3 Earthwork Balance
A� Adjustment�for�moisture�and�density 9,233�C� Miscellaneous�extra�excavation�(unstable�
material�below�undercut)��805�
B� Normal�cross�section�embankment 49426�B� Adjustment for�moisture�and�density 11079�D� Miscellaneous�additional�embankment�
(unstable�material�below�undercut)��1490�
D� Adjustment�for�moisture�and�density 298�A+C� Total�volume�of�excavated�materials 64927�B+D� Total�volume�of�embankment�materials 62993�½�(A+B+C+D)� Average�total�volume�of�materials 63557�
�
���3�� � ��33������ 2 � ) � A� BC) @ � )���DEFGHIJ�KLMNOPOHQ�RFE���SFOTJ�
�Example: O’Hare Airport Modernization Program – Phase 1
The�Chicago�O’Hare�Airport�Modernization�Program�(OMP),�which�was�ongoing�as�of�early�2010,�made�a�substantial�effort�to�be�more�sustainable�in�their�approach�to�airport�design�and�construction.�One�of�the�features�of�their�sustainability�efforts�is�balanced�earthwork.�Phase�1�moved�15�million�cubic�yards�of�soil�under�a�“balanced�earthwork�plan”�that�reportedly�saved�over�$100�million�by�reducing�truck�trips�and�fees�for�dumping�at�landfills.��
�Figure�MR�3.1:�Runway�10C�28C�Paving�and�Electrical�(West):�Excavation�in�Area�G5��
(Photo�Courtesy�Chicago�O’Hare�Moderization�Program)�
377

Materials & Resources Greenroads™ Manual v1.5
Earthwork Balance MR-3
�Figure�MR�1.2:�June�2010�Runway�10C�28C�Paving�and�Electrical�(West):�Placing�and�compacting�Bit�concrete�
base�course�on�taxiway�(Photo�Courtesy�Chicago�O’Hare�Moderization�Program)��
Example: Wattstown Business Park Road Extension
The�Wattstown�Business�Park�Road�Extension�Project�in�Coleraine,�Ireland�implemented�a�balanced�cut�and�fill�strategy�that�allowed�all�of�the�excavated�materials�to�be�re�used�on�site�including�excavated�topsoils�in�order�to�minimize�waste�and�hauling.�The�vertical�alignment�of�the�road�was�also�kept�to�a�minimum�in�order�to�minimize�earthwork.��
�Figure�MR�3.3:�Wattstown�Business�Park�(CEEQUAL,n.d.)�
Example: Kicking Horse Canyon – British Columbia Ministry of Transportation
The�Kicking�Horse�Canyon�project�near�Golden,�British�Columbia,�is�a�26�km�corridor�upgrade�that�began�construction�in�2002.�One�of�the�project�goals�was�to�minimize�the�need�for�earthwork�along�the�entire�corridor�in�order�to�reduce�greenhouse�gas�emissions�from�hauling�trips�(and�to�save�money)�in�accordance�with�
378

Greenroads™ Manual v1.5 Materials & Resources
MR-3 Earthwork Balance
objectives�of�the�British�Columbia�Ministry�of�Transportation�(BCMoT)�Climate�Action�Program.�This�balanced�earthwork�program�also�included�addressing�safety�concerns�on�the�project,�which�called�for�improvements�to�slope�stability�on�roadway�excavations�as�well�as�avalanche�control�and�rockfall�protection�in�several�locations�along�the�corridor’s�new�alignments.��
Slope�stabilization�on�Phase�2�of�the�project�was�accomplished�in�some�steep�areas�using�11,000�m3�of�high�tensile�strength�steel�mesh�that�also�allowed�for�seeding�to�grow,�which�can�add�stability�to�upper�soil�layers�(BCMOT,�n.d.).�The�mesh�is�tied�to�rock�layers�below�the�slope�to�stabilize�the�hillside�(see�Figure�4).�Rockfall�areas�are�protected�by�approximately�20,000�m3�of�drapery�mesh�(BCMOT,�n.d.).�Excess�fill�soils�were�also�stockpiled�within�the�corridor�for�future�lanes�of�highway�(BCMOT,�2006).�Construction�of�Phase�3�East���Brake�Check�to�Yoho�National�Park�(underway)�is�also�following�a�balanced�earthwork�design�program�(see�Figures�MR�3.6�and�MR�3.7).�
�Figure�MR�3.2:�Tecco®�high�strength�steel�mesh�used�for�slope�reinforcement.�(BCMOT,�2010)�
�
�Figure�MR�3.3:�West�Alignment�of�Phase�2,�Kickinghorse�Canyon,�showing�approximate�cut�and�fill�boundary�for�
corridor�segment�(BCMOT,�2006)�
379

Materials & Resources Greenroads™ Manual v1.5
Earthwork Balance MR-3
�Figure�MR�3.4:�Phase�3�of�The�Kicking�Horse�Project:�Excavation�on�north�side�of�the�highway�(BCMOT,�2010)�
�
�Figure�MR�3.5:�Phase�3�earthwork�on�east�side�of�highway�(BCMOT,�2010)�
�Example: Software Tools for Designers
The�most�straightforward�means�of�balancing�earthwork�is�to�design�and�construct�the�project�such�that�the�volume�of�cut�within�the�project�is�equal�to�the�volume�of�fill.�For�designers�and�contractors�there�are�numerous�software�packages�that�can�provide�exact�and/or�estimated�earthwork�quantities.�The�following�are�examples�of�software�packaging�that�can�be�used�to�achieve�balanced�cut�and�fill.��
380

Greenroads™ Manual v1.5 Materials & Resources
MR-3 Earthwork Balance
� Trakware�Inc.��Earthworks�Software�� Pizer�Inc.�EARTH�Software�� Trimble�Inc.�Paydirt�Software�� Vertigraph�Inc.�SiteWorx/OS��� Roctek�Inc.�WinEx�Master�Software�
POTENTIAL ISSUES
1. When�using�stabilization�material�it�is�possible�that�the�life�cycle�inputs�for�such�material�(e.g.,�energy�use�and�emissions�associated�with�their�manufacture,�transport�and�use)�may�be�greater�than�that�associated�with�moving�soil�associated�with�unbalanced�earthwork.��
2. Subsurface�conditions�may�not�be�well�known�for�the�project�site.�Therefore,�a�balanced�earthwork�design�that�assumes�a�certain�soil�type�and�characteristics�may�not�be�feasible�if,�during�earthwork,�different�soil�types,�moisture�conditions�or�other�characteristics�are�found.��
3. Geosynthetics�and�stabilization�additives�may�add�significant�cost�over�conventional�methods.�4. Contractor�familiarity�and�experience�with�alternative�methods�and�materials�can�be�highly�variable.�5. Some�roadwork�does�not�lend�itself�to�a�balanced�earthwork�plan.�For�instance,�work�in�an�urban�area�may�not�
work�because�the�primary�concern�is�typically�maintaining�existing�elevation.�Therefore,�if�a�thicker�pavement�section�is�placed,�some�earth�must�be�removed.��
6. In�a�waterway�corridor�(area�near�a�river�or�other�waterway)�balanced�earthwork�may�not�be�sufficient.�It�is�more�important�to�ensure�that�earthwork�does�not�reduce�either�the�flood�storage�or�flood�carrying�capacity�of�the�waterway�area�(City�of�Brisbane,�n.d.).�
7. Rain�events�or�prolonged�wet�periods�can�render�on�site�material�unsuitable�for�fill�until�it�is�sufficiently�dried.�There�may�not�be�enough�time�in�the�construction�schedule�to�allow�adequate�drying�time.��
8. Designers�may�neglect�to�consider�or�poorly�estimate�shrink�or�swell�of�soil�material.�9. Earthwork�on�a�phased�project�may�not�be�completed�by�the�same�contractor.�10. Efforts�across�phases�may�be�difficult�to�coordinate�without�clear�documentation�of�intent�of�stockpiled�
materials.�
RESEARCH Most�roadway�construction�involves�some�earthwork�(moving�of�soil�mass�from�one�location�to�another).�Earthwork�can�represent�a�significant�project�expense,�especially�in�roadway�projects.�Because�of�the�cost�of�landfill�and�truck�transport�most�roadway�designs�seek�to�minimize�earthwork�as�much�as�possible.�When�other�ecological�costs�are�added�(i.e.,�landfilled�waste,�fuel�use,�truck�emissions)�the�incentive�to�minimize�earthwork�grows.�Thus,�the�goal�is�to�minimize�the�earth�moved�and�to�minimize�the�distance�it�is�moved.�Ideally,�a�balanced�earthwork�project�is�one�that�matches�cut�and�fill�volumes�and�therefore�does�not�required�cut�export�or�fill�import.�This�section�reviews�typical�methods�used�to�achieve�balanced�earthwork.�
Balancing�Earthwork��The�most�straightforward�means�of�balancing�earthwork�is�to�design�and�construct�the�project�such�that�the�volume�of�cut�within�the�project�is�equal�to�the�volume�of�fill.�In�rural�projects�this�can�often�be�accomplished�by�choosing�the�appropriate�gradeline�(roadway�profile)�so�that�cut�volumes�are�roughly�equal�to�fill�volumes.�For�urban�environments,�this�may�be�more�difficult�as�urban�projects�are�often�severely�constrained�by�right�of�way�or�required�to�match�existing�abutting�elevations�(e.g.,�other�streets,�parks,�drainage�conveyances,�etc.).�For�designers�and�contractors�there�are�numerous�software�packages�that�can�provide�exact�and/or�estimated�earthwork�quantities.��
Once�in�construction,�a�balanced�earthwork�design�may�not�be�achievable�for�several�reasons.�First,�earthwork�often�involves�unknown�quantities.�Although�geotechnical�engineers�can�attempt�to�characterize�existing�soil�with�test�pits,�soil�borings�and�laboratory�tests,�these�characterizations�are�usually�only�done�on�a�few�locations�within�the�project�site�and�cannot�guarantee�the�condition�of�untested�locations.�Therefore,�it�is�possible�that�unexpected�soil�is�encountered�that�when�excavated�is�unsuitable�for�use�as�fill�elsewhere.�Second,�environmental�conditions�
381

Materials & Resources Greenroads™ Manual v1.5
Earthwork Balance MR-3
can�change�causing�previously�acceptable�soil�to�become�unacceptable.�For�instance�precipitation�can�substantially�alter�the�moisture�content�of�in�situ�material�making�it�unsuitable�for�use�as�fill�elsewhere.�Finally,�design�estimation�may�be�inaccurate�or,�more�likely,�changes�to�the�design�during�construction�may�add�cut�or�fill�quantities�such�that�the�overall�effect�is�unbalanced�earthwork.��
Unsuitable�Material�One�of�the�most�common�impediments�to�balanced�earthwork�is�in�situ�material�that�is�either�(1)�unsuitable�to�be�used�as�fill�elsewhere,�or�(2)�unsuitable�to�be�used�as�a�foundation�for�other�items�such�as�structures�(bridges,�walls,�etc.)�and�pavements.�The�most�straightforward�option�in�these�cases�is�often�to�remove�the�unsuitable�material�and�replace�it�with�suitable�fill.�While�this�is�feasible,�it�may�result�in�unbalanced�earthwork.�It�may�be�advantageous�to�treat�the�in�situ�soil�rather�than�remove�and�replace�it.�This�section�discusses�several�treatment�options.��
Traditional�Soil�Stabilization�Soil�stabilization�is�the�process�of�improving�the�engineering�properties�of�soils�through�the�use�of�additives�that�are�mixed�into�the�soil�(Army,�Navy,�Air�Force,�1994).�These�improved�engineering�properties�can�include:�
� Reduced�plasticity�� Drying�� Reduced�swelling�� Improved�stability�
Stabilization�can�be�done�by�mixing�soils�of�two�different�gradations�to�achieve�desirable�qualities�(mechanical�stabilization)�or�by�adding�binding�materials�(additive�stabilization).�This�section�briefly�reviews�three�common�soil�stabilization�additives.�The�Army,�Navy�and�Air�Force�Soil�Stabilization�for�Pavements�(1994)�offers�a�means�to�choose�between�portland�cement,�lime�and�asphalt�as�soil�stabilization�additives.��
� Portland�cement.�When�added�with�water,�portland�cement�hydrates�and�binds�adjacent�soil�particles�together�resulting�in�a�stiffer�and�perhaps�stronger�stabilized�material.�Portland�cement�can�generally�be�used�with�well�graded�granular�materials�with�sufficient�fines�to�mix�with�the�portland�cement�(Army,�Navy,�Air�Force,�1994).��
� Lime.�Added�in�the�form�of�quicklime�(CaO),�hydrated�lime�(Ca[OH]2)�or�lime�slurry.�Lime�does�three�basic�things:�drying�(through�hydration�with�existing�water�in�the�soil),�modification�(Ca�ions�migrate�to�clay�particle�surfaces�and�displace�water�making�the�soil�more�granular),�stabilization�(increases�the�pH�of�the�soil�causing�clay�particles�to�break�down).�The�National�Lime�Association�(2004)�states,�“When�added�with�In�general,�fine�grained�clay�soils�(with�a�minimum�of�25�percent�passing�the�#200�sieve�(74mm)�and�a�Plasticity�Index�greater�than�10)�are�considered�to�be�good�candidates�for�stabilization.”��
� Asphalt�emulsions.�Most�suitable�for�silty�sand�and�granular�materials�since�these�are�more�likely�to�have�all�particles�fully�coated�by�the�emulsion.��
Ecological�Impacts�of�Soil�Stabilization�Mroueh�et�al.�(2001)�reviewed�several�different�combinations�of�industrial�byproducts�for�use�in�earthwork.�Results�generally�show�that�soil�stabilization�(as�Mroueh�et�al.�describe�it�this�involves�cement�stabilization)�generally�has�a�higher�environmental�loading�than�simple�soil�replacement�in�most�all�areas�(e.g.,�fuel�use,�energy,�CO,�particulate,�SO2,�CO2,�VOC)�except�the�amount�of�natural�materials�used.��
GLOSSARY
Additives� Manufactured�commercial�products�that,�when�added�to�the�soil�in�the�proper�quantities,�improve�some�engineering�characteristics�of�the�soil�such�as�strength,�texture,�workability,�and�plasticity�(Army,�Navy,�Air�Force�1994).�
382

Greenroads™ Manual v1.5 Materials & Resources
MR-3 Earthwork Balance
REFERENCES British�Columbia�Ministry�of�Transportation�and�Infrastructure.�(2010).�Kicking�Horse�Canyon�Project�Fact�Sheet.�
Accessed�14�August�2010.�Available�at�http://www.th.gov.bc.ca/kickinghorse/updates/KHCP_Fact_Sheet.pdf.��
British�Columbia�Ministry�of�Transportation�and�Infrastructure.�(2010).�Kicking�Horse�Canyon�Project:�Photo�Gallery�Phase�3�East�Construction.�Accessed�14�August�2010.�Available�at�http://www.th.gov.bc.ca/kickinghorse/khc_gallery�01�Phase3_east.htm��
British�Columbia�Ministry�of�Transportation�and�Infrastructure.�(2010).�Kicking�Horse�Canyon�Project.�Accessed�14�August�2010.�Available�at�http://www.th.gov.bc.ca/kickinghorse/index.htm��
British�Columbia�Ministry�of�Transportation�and�Infrastructure�and�Partnerships�British�Columbia.�(2006,�June).�Project�Report:�Achieving�Value�for�Money���Kicking�Horse�Canyon�–�Phase�2�Project.�Available�at�http://www.th.gov.bc.ca/kickinghorse/reports/0606_PBCKickingHorse.pdf��
British�Columbia�Ministry�of�Transportation.�(n.d.).�Did�You�Know?�Accessed�August�15,�2010.�Available�at�http://www.th.gov.bc.ca/kickinghorse/documents/KHCP_Did_You_Know_080304.pdf��
CEEQUAL.�(2010).�Wattstown�Business�Park�Road�Extension:�Interim�Client�and�Outline�Design�Award.�Accessed�13�August�2010.�Available�at�http://www.ceequal.co.uk/awards_063.htm��
City�of�Brisbane.�(n.d.).�Compensatory�Earthwork�Planning�Scheme�Policy.�Accessed�12�January�2010.�Available�at�http://www.brisbane.qld.gov.au/bccwr/lib181/appendix2_compensatoryearthworks_psp.pdf.��
City�of�Chicago,�Aviation.�(2010).�City�of�Chicago:�Construction�Progress.�Accessed�August�16,�2010.�Available�at�http://www.cityofchicago.org/city/en/depts/doa/provdrs/omp/svcs/blank.html�
Department�of�the�Army,�the�Navy�and�the�Air�Force.�(1994).�Soil�Stabilization�for�Pavements.�ARMY�TM�5�822�14,�AIR�FORCE�AFJMAN�32�1019.�
Mroueh,�U�M.,�Eskola,�P.�&�Laine�Ylijoki,�J.�(2001).�Life�cycle�impacts�of�the�use�of�industrial�by�products�in�road�and�earth�construction.�Waste�Management,�21,�271�277.�
National�Lime�Association.�(2004).�Lime�Treated�Soil�Construction�Manual:�Lime�Stabilization�and�Lime�Modification.�National�Lime�Association.�
Pizer�Inc.�EARTH:�Earthwork�Quantity�Software.�Accessed�14�August�2010.�Available�at�http://www.earthworksoftware.com/��
Roctek�Inc.�Excavation/�Cut�and�Fill:�WinEx�Master.�Available�at�http://www.roctek.com/�
Trakware�Inc.�Earthworks�Excavation�Software.�Accessed�14�August�2010.�Available�at�http://www.trakware1.com/��
Trimble�Inc.�Trimble�Paydirt.�Accessed�14�August�2010.�Available�at�http://www.trimble.com/paydirt.shtml��
Vertigraph�Inc.�SiteWorx/OS.�Accessed�14�August�2010.�Available�at�http://www.interworldna.com/vertigraph/siteworx_os.php��
Stabilization� Process�of�blending�and�mixing�materials�with�a�soil�to�improve�certain�properties�of�the�soil.�Can�be�done�mechanically�(blending�gradations�of�soils)�or�by�using�additives�(Army,�Navy,�Air�Force�1994).�
383

Materials & Resources Greenroads™ Manual v1.5
Earthwork Balance MR-3
�
384

Greenroads™ Manual v1.5 Materials & Resources
MR-4 Recycled Materials
RECYCLED MATERIALS GOAL Reduce�lifecycle�impacts�from�extraction�and�production�of�virgin�materials.�
CREDIT REQUIREMENTS Use�recycled�materials�as�a�substitute�for�virgin�materials.�The�fraction�of�recycled�materials�used�can�be�calculated�using�one�of�four�options�below:�
1. Consider�only�the�pavement�binder�materials.�This�typically�means�the�cement�or�asphalt�in�the�pavement�section.�No�other�materials�(e.g.,�aggregate�in�the�pavement,�granular�base,�fill,�walls,�bridge, signs, other structures, etc.) areconsidered.�
2. Consider�only�the�hot�mix�asphalt�(HMA)�or�portland�cement�concrete�(PCC)�pavement�materials.�This�encompasses�the�material�in�Option�1�plus�the�aggregate�as�well�as�any�other�additive�materials.�No�other�materials�(e.g.,�granular�base,�fill,�walls,�bridge,�signs,�other�structures,�etc.)�are�considered.�
3. Consider�all�pavement�materials�including�granular�base�layers.�This�encompasses�the�material�in�Options�1�and�2�plus�the�granular�base�layers�(either�unbound�or�bound�with�a�binding�agent�such�as�lime,�cement�or�asphalt�emulsion)�as�well�as�any�other�added�materials.�No�other�materials�(e.g.,�fill,�walls,�bridge,�signs,�other�structures,�etc.)�are�considered.�
4. Consider�all�project�materials.�This�encompasses�the�material�in�Options�1,�2�and�3�plus,�as�a�minimum,�all�materials�in�the�fill�and�wall�structures�of�the�project.�Other�structures�(e.g.,�bridges)�and�material�(e.g.,�signs,�traffic�control�devices,�etc.)�may�be�considered�if�desired.��
Calculate�the�average�recycled�material�content�by�weight�using�one�of�the�above�four�methods�and�Equation�MR�4.1.�Table�MR�4.1�shows�the�point�scale.��
Table�MR�4.1:�Points�for�Average�Recycled�Content�(Percent�by�Weight�of�Materials)�Points�Earned� 1� 2� 3� 4� 5�Percent�recycled�material�required��for�Options�1�and�2�
10%� 20%� 30%� 40%� 50%�
Percent�recycled�material�required��for�Options�3�and�4�
20%� 30%� 40%� 50%� 60%�
Use�Equation�MR�4.1�to�compute�the�average�recycled�content�(ARC)�that�will�be�achieved�by�the�pavement�section�or�by�the�binders.��
� �(Equation�MR�4.1)�
Where:��
� rn�is�the�total�weight�of�recycled�materials�for�that�individual�material�or�assembly�� Wn�is�the�total�weight�of�each�individual�material�or�assembly�� n�represents�the�number�of�materials�used�in�the�pavement�section�
Details
It�may�be�difficult�to�measure�the�recycled�content�of�a�material�in�place.�For�the�
MR-4
1-5 POINTS
RELATED CREDITS
� PR�2�Lifecycle�Cost�Analysis�
� PR�3�Lifecycle�Inventory�
� MR�1�Lifecycle�Assessment�
� MR�2�Pavement�Reuse�
� PT�3�Warm�Mix�Asphalt�
SUSTAINABILITY COMPONENTS
� Ecology�� Economy�� Expectations�� Experience�
BENEFITS
� Reduces�Raw�Materials��
� Reduces�Air�Emissions�
� Reduces GreenhouseGases�
� Reduces�Solid�Waste�
� (Equation MR�4.1)
Where:
385

Materials & Resources Greenroads™ Manual v1.5
Recycled Materials MR-4
purposes�of�this�credit,�it�is�sufficient�to�use�the�approved�mix�design�or�specified�amount�of�recycled�material�as�an�estimate�of�the�fraction�of�recycled�material.�Therefore,�if�paving�rubberized�HMA�(RHMA)�and�the�asphalt�rubber�mix�design�specifies�20%�crumb�rubber�modifier�(CRM)�by�weight�then�this�number�can�be�used�as�the�percent�recycled�material�in�the�binder�provided�that�standard�quality�control�and�quality�assurance�testing�shows�the�produced�material�meets�the�mix�design�specifications.�
Similarly,�if�the�PCC�mix�design�specifies�20%�recycled�concrete�aggregate�(RCA)�as�a�minimum�then�this�number�can�be�used�as�the�percent�recycled�material�in�the�PCC�provided�that�standard�quality�control�and�quality�assurance�testing�shows�the�produced�material�meets�the�mix�design�specifications.�If�a�minimum�recycled�content�is�specified�but�a�contractor�chooses�to�use�more�than�the�minimum�amount,�records�showing�the�actual�recycled�content�must�be�submitted�if�credit�for�the�actual�amount�is�to�be�given.�Otherwise,�the�minimum�specified�shall�be�assumed�to�be�present�in�the�material.��
DOCUMENTATION � A�spreadsheet�that�clearly�notes�which�calculation�method�is�used�and�lists:�total�weight�of�each�material�used,�
total�weight�of�recycled�materials,�and�computed�ARC�for�the�project.�� Copy�of�the�approved�mix�design�for�the�pavement�materials�and�(if�options�3�or�4�are�chosen)�copies�of�the�
specifications�for�the�additional�materials�that�state�the�required�or�minimum�recycled�content�if�available.��� Supporting�test�documents�(usually�from�quality�assurance�or�quality�control�testing)�such�as�plant�
proportioning�records,�mix�tickets,�and�manufacturer’s�documentation�for�products�(steel,�rebar,�etc.)�that�state�the�actual�recycled�material�content�(if�no�minimum�is�specified�or�if�the�contractor�chooses�to�use�more�than�the�specified�minimum).�
APPROACHES & STRATEGIES
� Specify�the�total�percentage�of�recycled�material�to�be�used�in�the�mix�design�and�the�type�of�allowable�waste�materials�in�the�contract�documents.�Many�state�departments�of�transportation�(DOTs)�already�allow�a�certain�percentage�of�recycled�content�in�their�standard�specifications�for�certain�material�mixtures�such�as�PCC�or�HMA.�(See�the�Figures�and�explanations�provided�in�the�“Research”�section�of�this�credit.)�
� Update�agency�standard�specifications�to�specify�a�certain�percentage�of�recycled�material.�� During�construction,�keep�updated�records�of�all�materials�and�recycled�materials�used�on�the�project.�� Build�a�basic�spreadsheet�or�other�mechanism�to�track�weights�of�materials�for�the�project.�Use�the�
spreadsheet�to�compute�the�sum�of�weight�of�the�recycled�materials,�compare�it�to�the�sum�of�the�weight�of�all�materials,�and�compute�the�average�percent�recycled�content.�
Example: Calculation for a Rubber-Modified Hot Mix Asphalt
Description:�A�1.5�mile,�one�lane�HMA�construction�project�uses�CRM�as�a�binding�material�additive.�By�mix�design,�the�CRM�is�20%�of�the�binding�material�by�weight.�No�other�recycled�materials�are�used.�The�HMA�mix�design�calls�for�9.2%�binder�by�total�weight�of�mix.��
Calculation�logic:�Since�the�binder�material�only�constitutes�9.2%�of�the�total�mixture�weight,�even�if�it�were�100%�recycled�material�it�would�still�not�qualify�for�any�points�in�this�credit�if�methods�2,�3�or�4�are�used�for�the�calculation.�Therefore,�use�Option�1.��
Calculation:��
�UV) � W$�X#���6�VU!W$�X#���6�+�"*$% 2 � ) � �
� 2 � ) � � )�
This�project�would�qualify�for�2�points�according�to�Option�1.�Note�that�it�is�not�necessary�to�weigh�the�CRM�and�asphalt�binder�since�that�is�normally�not�done.�In�this�case�the�mix�design,�if�followed,�is�sufficient.��
386

Greenroads™ Manual v1.5 Materials & Resources
MR-4 Recycled Materials
Example: Calculation for HMA using Reclaimed Asphalt Pavement (RAP)
Description:�A�1.5�mile�urban�arterial�preservation�project�consists�of�removing�and�replacing�(mill�and�fill)�the�top�2�inches�of�pavement�with�HMA.�The�design�for�the�HMA�is�as�follows:�5.4%�binder�content;�PG�70�22�asphalt�binder.�The�project�uses�2,720�tons�of�HMA�of�which�630�tons�is�reclaimed�asphalt�pavement�(RAP).�No�other�recycled�materials�are�used.��
Calculation�logic:�Since�RAP�is�included�in�the�mixture�and�no�recycled�material�is�included�in�the�binder,�the�highest�percentage�of�recycled�material�would�be�obtained�by�using�Option�2�for�the�calculation.��
Calculation:��
�UV) � �� ���"��� ���" 2 � ) � ���)�
This�project�would�qualify�for�2�points�according�to�Option�2.�
Example: Calculation for PCC Using Type 1-SM Cement
Description:�A�0.75�mile�long�road�is�being�constructed�to�consist�of�two�12�ft�wide�lanes�and�no�shoulders.�The�pavement�structure�is�8�inches�of�PCC�placed�on�top�of�10�inches�of�granular�base�material.�The�PCC�mix�design�is�as�follows:�
� Type�1�SM�(slag�modified)�cement:�565�lbs/yd3.��� The�cement�manufacturer�provides�documentation�that�shows�Type�1�SM�cement�contains�80%�Type�1�
portland�cement�and�20%�ground�granulated�blast�furnace�slag�(GGBFS).�� Course�aggregate�#1:�631�lbs/yd3�of1.5�to�0.75�inch�aggregate�� Course�aggregate�#2:�1,354�lbs/yd3�of�0.75�inch�to�#4�aggregate�� Course�sand:�682�lbs/yd3��� Fine�sand:�464�lbs/yd3��� Water:�237�lb/yd3�� Water/cement�ratio:�0.42�� No�other�recycled�materials�are�used�in�the�pavement�structure.��
Calculation�logic:�Since�the�GGBFS�is�only�in�the�binding�agent,�Option�1�will�give�the�highest�percentage.�
Calculation:�Start�by�computing�the�volume�of�PCC�pavement�to�be�placed.�
� ����9��$( 7���� �6�9��$ 8 �����"$( 7���6���"$ 8 ����"'#$(�*$$Y 7��6�
����"'#$(8:��,*����6��; � ������,*��
Next,�determine�the�total�weight�of�cementitious�material�and�the�total�weight�of�GGBFS.�
������'$9$"�����5(�9��$%��� � ������,*� 2 ���� �+ ,*� � ������ ����+Z �
������[[\�0 � ������,*� 2 ���� �+ ,*� 2 �� � ���������+�'$9$"�����5(�9��$%���Z �
Then,�compute�the�average�recycled�content�for�the�cementitious�material.�
�UV) � W$�X#���6�[[\�0W$�X#���6�'$9$"�����5(�9��$%��� 2 � ) � �������
������ �� 2 � ) � � )�
387

Materials & Resources Greenroads™ Manual v1.5
Recycled Materials MR-4
Note�that�the�result,�20%,�logically�matches�the�percentage�of�GGBFS�in�the�cement.�Therefore,�an�alternate�way�of�doing�this�calculation�is�to�use�the�mix�design�ratio,�which�is�computed�as�follows:�
�UV) � W$�X#���6�[[\�0W$�X#���6�'$9$"�����5(�9��$%��� 2 � ) � �
� 2 � ) � � )�
This�project�would�qualify�for�2�points�based�on�Option�1.�
Example: Calculation for an Aggregate Base Using 100% Recycled PCC
Description:�A�1�mile�highway�rehabilitation�project�is�going�to�use�crushed�recycled�PCC�from�a�nearby�pavement�demolition�site�as�the�base�material.�The�existing�highway�is�consisting�of�four�12�foot�wide�lanes.�Existing�shoulders�are�to�be�left�in�place.�The�surface�course�is�9�inches�of�PCC,�the�base�course�is�6�inches�of�crushed�recycle�concrete�material�(RCM).�No�other�recycled�material�is�used.�The�density�of�the�PCC�is�150�lb/yd3�and�the�density�of�the�RCM�base�course�is�132�lb/yd3.�
Calculation�logic:�Since�the�recycled�material�is�in�the�base�course,�Option�3�should�be�used.��
Calculation:�Start�by�computing�the�volume�of�PCC�pavement�to�be�placed.�
���9��$ 7���� �6�9��$ 8 �����"$( 7���6���"$ 8 �3��"'#$(�*$$Y 7��6�
����"'#$(8 � �3 � � �6���
Compute�the�weight�of�new�PCC�pavement:�
]$�X#���6�"$W��VV � �3 � � �6�� 2 �� � �+ 6�� 2 ����"�� ��+( �^ ���������"(�
Compute�the�volume�of�RCM�base�course:�
���9��$ 7���� �6�9��$ 8 �����"$( 7���6���"$ 8 ����"'#$(�*$$Y 7��6�
����"'#$(8 � ��������6����Compute�the�weight�of�RCM�base:�
]$�X#���6�UV!��VV � ���������6�� 2 ���� �+ 6�� 2 ����"�� ��+( �^ ��������"(�
Compute�the�average�recycled�content:�
7 ��������"(��������"( � ���������"(8 2 � ) � ��)�
This�project�would�qualify�for�2�points�by�Option�3.�Note�that�by�volume�the�recycled�content�is�40%�but�the�density�difference�results�in�a�37%�recycled�material�content.�
Example: Calculation for Rubber-Modified Hot Mix Asphalt with RAP
Description:�5�miles�of�a�6�lane�Interstate�highway�will�be�overlayed�with�a�rubber�modified�HMA�in�one�0.75�inch�lift.�Lanes�are�12�feet�wide.�The�asphalt�binder�contains�20%�CRM�by�weight�of�binder.�The�HMA�mixture�contains�15%�of�RAP�by�total�weight�of�mixture�and�has�a�density�of�2.05�tons/yd3�in�place�after�compaction.�The�target�asphalt�content�is�9.1%.�A�small�section�of�pavement�is�failing�structurally�and�must�be�replaced.�The�replace�section�involves:�
388

Greenroads™ Manual v1.5 Materials & Resources
MR-4 Recycled Materials
� 1,200�yd3�PCC�surface�course�with�the�following�mix�design:�� Type�1�cement:�565�lbs/yd3�� Course�aggregate�#1:�631�lbs/yd3�of1.5�to�0.75�inch�aggregate�� Course�aggregate�#2:�1,354�lbs/yd3�of�0.75�inch�to�#4�aggregate�� Course�sand:�682�lbs/yd3��� Fine�sand:�464�lbs/yd3��� Water:�237�lb/yd3�
� 1,000�yd3�of�crushed�base�material�that�is�50%�RAP�by�total�weight,�with�the�rest�being�virgin�crushed�rock.��� The�density�of�the�HMA�is�145�lb/yd3�=�1.96�tons/yd3�� The�density�of�the�PCC�is�146�lb/yd3�=�1.97�tons/yd3�� The�density�of�the�virgin�base�course�is�135�lb/yd3.�� The�density�of�the�RAP�base�course�is�136�lb/yd3.�
Calculation�logic:�This�scenario�involves�recycled�material�in�the�binder,�HMA�and�base�material.�Since�there�is�no�base�layer�being�placed,�Option�3�is�not�applicable,�but�Options�1,�2�or�4�could�be�used.���
Option�1�Calculation�Weight�of�rubber�modified�HMA�pavement�to�be�placed.��
���9��$( 7���� �6�9��$ 8 �����"$( 7���6���"$ 8 � �����"'#$( 7��6�
����"'#$(8:��,*����6��; 7
��3����"(,*� 8 � ��������"(�
Weight�of�rubber�modified�binder�at�9.1%�binder�content�by�total�weight�of�mix:�
������+�"*$%�1��59$ � ��������"( 2 � 3� � ������"(�
Weight�of�CRM�at�20%�by�weight�of�binder:�
VU!�1��59$ � ������"( 2 �� � ������"(�
Weight�of�PCC�binder�in�pavement�repair�section:�
]$�X#���VV�+�"*$% � ���� �+ ,*�Z ���� �,*� 7 ����"�� ��+8 � ��3���"(�
Percent�recycled�material�in�the�binder:�
�UV) � W$�X#���6�VU!W���6�U !��+�"*$% � W���6��VV�+�"**$% 2 � ) � ������"(
������"( � ��3���"( 2 � ) � ��)�
Note�that�it�is�generally�assumed�that�the�binder�content�of�the�RAP�contributes�to�the�mixture�binder.�Therefore,�if�the�binder�content�of�the�RAP�is�determined�then�it�can�be�counted�as�recycled�material�in�the�binder.�In�this�case,�as�is�often�the�case�in�RAP�additions,�the�binder�content�of�the�RAP�is�essentially�ignored.��
The�project�would�qualify�for�1�point�according�to�Option�1.�
Option�2�Calculation�Weight�of�RAP�to�be�placed�(15%�of�volume�of�rubber�modified�HMA�to�be�placed:�
U���_��59$ � ���������"(� ��� � ���3����"(�
Weight�of�the�PCC�to�be�placed:�
389

Materials & Resources Greenroads™ Manual v1.5
Recycled Materials MR-4
�VV�_��59$ � ���� �,*�����3� ��"( ,*�Z � � ��������"(�
Percent�recycled�material�in�the�HMA�and�PCC:�
�UV��) � `%`] �2 � ) � ���3����"(�U�� � ������"(�VU!��������"(�U !� � ��������"(��VV � ��)�
The�project�would�qualify�for�1�point�according�to�Option�2.�
Option�4�Calculation�This�method�includes�the�small�pavement�repair�section�materials.��
Compute�the�weight�of�materials�in�the�pavement�repair�base:�
U����"�+�($ � � �� ��� �,*� :���6��,*� ; ���� �+ 6��Z 7 ����"�� ��+(8 � 3�����"(�
_�%X�"�+�($ � � �� ��� �,*� :���6��,*� ; ���� �+ 6��Z 7 ����"�� ��+(8 � 3�����"(�
������+�($�W$�X#� � 3�����"( � 3�����"( � ����3���"(�
Percent�recycled�material�in�the�HMA,�PCC�and�base:�
�UV��) � `%`] �2 � ) � ���3����"(�U�� � ������"(�VU!� 3�����"(�U����"�+�($��������"(�U !� � ��������"(��VV � ����3���"(�+�($ � ��)�
The�project�would�not�qualify�for�any�points�according�to�Option�4.�
Best�Option�Choose�either�Option�1�or�2.�The�project�qualifies�for�1�point�with�both�of�these�Options.�Depending�on�the�type�of�project�and�the�extent�of�the�work,�one�of�these�methods�may�require�less�paperwork�or�be�significantly�less�complicated�to�compute.�
POTENTIAL ISSUES
1. Workability,�compaction�and�other�performance�qualities�change�as�amounts�of�recycled�materials�included�in�the�material�change.�
2. Additional�testing�and�inspection�is�often�required�for�higher�compositions�of�recycled�materials�for�some�cases�and�may�represent�an�added�cost.�
3. Weather,�performance,�location�and�availability�issues�may�limit�the�amount�of�recycled�content�that�can�feasibly�be�included�in�project�materials.��
4. Transport�of�recycled�materials�is�sometimes�costly,�depending�on�availability�and�distance�of�transport.�Occasionally�this�cost�exceeds�the�total�benefit�of�using�the�recycled�material.��
RESEARCH Recycled�materials�present�a�valuable,�common,�and�cost�effective�material�resource�that�may�be�used�to�help�reduce�the�ecological�impacts�life�cycle�cost�or�roadway�construction.�In�many�forms�of�roadway�infrastructure�(e.g.,�pavements,�base�material,�walls,�etc.)�recycled�materials�can�be�used�in�place�of�virgin�materials�without�degrading�final�product�performance.�Ultimately,�this�reduces�the�need�for�production�of�virgin�material,�including�extraction,�processing�and�manufacturing,�which�eliminates�related�costs,�waste�disposal,�emissions�and�energy�
390
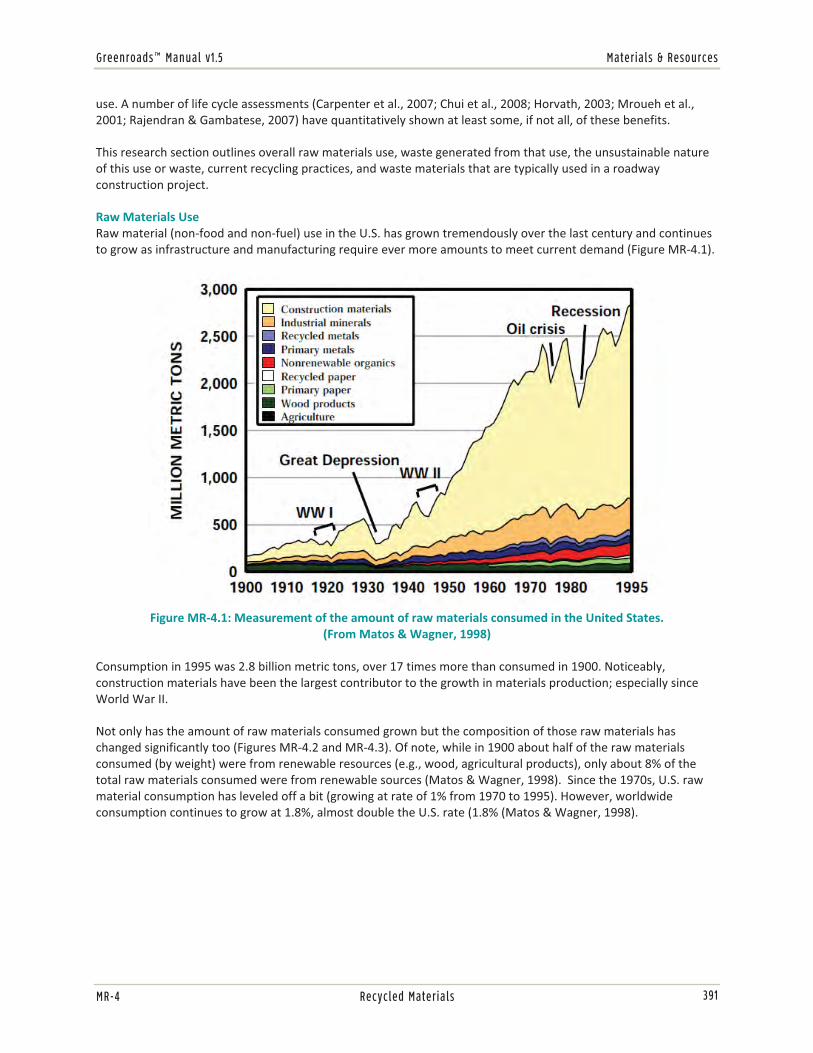
Greenroads™ Manual v1.5 Materials & Resources
MR-4 Recycled Materials
use.�A�number�of�life�cycle�assessments�(Carpenter�et�al.,�2007;�Chui�et�al.,�2008;�Horvath,�2003;�Mroueh�et�al.,�2001;�Rajendran�&�Gambatese,�2007)�have�quantitatively�shown�at�least�some,�if�not�all,�of�these�benefits.�
This�research�section�outlines�overall�raw�materials�use,�waste�generated�from�that�use,�the�unsustainable�nature�of�this�use�or�waste,�current�recycling�practices,�and�waste�materials�that�are�typically�used�in�a�roadway�construction�project.�
Raw�Materials�Use�Raw�material�(non�food�and�non�fuel)�use�in�the�U.S.�has�grown�tremendously�over�the�last�century�and�continues�to�grow�as�infrastructure�and�manufacturing�require�ever�more�amounts�to�meet�current�demand�(Figure�MR�4.1).�
�Figure�MR�4.1:�Measurement�of�the�amount�of�raw�materials�consumed�in�the�United�States.�
(From�Matos�&�Wagner,�1998)��Consumption�in�1995�was�2.8�billion�metric�tons,�over�17�times�more�than�consumed�in�1900.�Noticeably,�construction�materials�have�been�the�largest�contributor�to�the�growth�in�materials�production;�especially�since�World�War�II.��
Not�only�has�the�amount�of�raw�materials�consumed�grown�but�the�composition�of�those�raw�materials�has�changed�significantly�too�(Figures�MR�4.2�and�MR�4.3).�Of�note,�while�in�1900�about�half�of�the�raw�materials�consumed�(by�weight)�were�from�renewable�resources�(e.g.,�wood,�agricultural�products),�only�about�8%�of�the�total�raw�materials�consumed�were�from�renewable�sources�(Matos�&�Wagner,�1998).��Since�the�1970s,�U.S.�raw�material�consumption�has�leveled�off�a�bit�(growing�at�rate�of�1%�from�1970�to�1995).�However,�worldwide�consumption�continues�to�grow�at�1.8%,�almost�double�the�U.S.�rate�(1.8%�(Matos�&�Wagner,�1998).�
391

Materials & Resources Greenroads™ Manual v1.5
Recycled Materials MR-4
�Figure�MR�4.2:�Measurement�of�the�amount�of�renewable�and�nonrenewable�materials�consumed��
in�the�United�States.�(From�Matos�&�Wagner,�1998).�
�Figure�MR�4.3:�Measurement�of�the�amount�of�materials�consumed�in�the�United�States�and�the�world.�
(From�Matos�&�Wagner,�1998)��
In�sum,�this�level�of�domestic�and�worldwide�raw�materials�extraction�is�generally�thought�to�be�unsustainable�for�a�number�of�reasons�(Fiksel,�2006):��
� Depletion�of�non�renewable�resources.�These�resources�(e.g.,�oil,�gas,�coal,�etc.)�can�be�extracted�at�any�time�but�cannot�be�replenished�(at�least�not�on�a�typical�human�time�scale).��
� Over�exploitation�of�renewable�resources�(e.g.,�timber).�Renewable�resources�are�often�referred�to�as�“natural�capital”�because�they�can�be�replenished�over�time�as�long�as�the�existing�stock�is�not�exhausted.�
� Life�cycle�impacts�associated�with�materials�extraction,�transportation�and�use.�
392

Greenroads™ Manual v1.5 Materials & Resources
MR-4 Recycled Materials
Waste�The�other�end�of�a�typical�linear�manufacturing�flow�is�waste.�After�materials�are�extracted�and�used�they�eventually�end�up�as�waste.�Worldwide,�general�estimates�are�that�industrialized�countries�(loosely�defined�as�those�being�members�of�the�Organization�of�Economic�Cooperation�and�Development�–�OECD)�generate�waste�at�about�12�lbs�per�day�per�capita�while�developing�countries�can�be�as�low�as�about�2�lb�per�day�per�capita.�Estimates�of�waste�stream�composition�in�the�U.S.�vary�but�they�are�generally�similar�to�Figure�MR�4.4.�The�contribution�of�construction�and�demolition�waste�(the�type�of�waste�associated�with�roadway�construction)�is�generally�estimated�at�between�20�and�40%�of�the�total�waste�stream�(Cascadia�Consulting�Group,�Inc.,�2004;�GDRC,�n.d.).�This�fraction�is�second�only�to�organic�(e.g.,�food,�etc.)�waste.�In�absolute�numbers,�a�2003�EPA�estimate�put�construction�and�demolition�waste�from�buildings�(not�including�roads)�at�about�170�million�tons�or�about�3.2�lbs/day�per�capita.�Information�on�roadway�construction�and�demolition�waste�is�essentially�speculative,�but�it�is�not�unreasonable�to�assume�that�the�total�amount�would�approach�that�for�buildings.�More�detail�about�infrastructure�construction�waste�is�given�in�Project�Requirement�PR�6�Waste�Management�Plan.�
�Figure�MR�4.4:�Material�classes�in�California’s�overall�disposed�waste�stream,�2003.�
(Cascadia�Consulting�Group,�Inc.,�2004)�
Current�Materials�Extraction�and�Disposal�Patterns�are�Generally�not�Sustainable�One�simple�measure�of�sustainability�often�sited�is�an�ecological�footprint,�which�in�this�case�refers�to�the�amount�of�nature’s�productive�capacity�(in�terms�of�land�area)�needed�to�support�our�human�demands.�Wackernagel�(2001)�estimates�the�amount�of�biologically�productive�capacity�available�worldwide�at�2.1�hectares�per�capita.�He�also�estimates�human�demand�on�average�across�the�planet�at�2.8�hectares�per�capita.�Thus,�by�this�estimate�current�human�activity�cannot�be�supported�by�nature�indefinitely.�The�numbers�are�worse�for�industrialized�countries:�12.3�hectares�for�the�U.S.,�6.3�for�Germany�and�5.9�for�Japan�(Wackernagel,�2001).��
Recycling�One�means�to�reduce�the�required�raw�materials�and�waste�stream�volumes�are�to�recover,�process�and�repurpose�waste�materials�as�a�substitute�for�raw�materials.�Generally,�this�is�referred�to�as�recycling.�Generally,�“recycling”�implies�some�sort�of�waste�stream�recovery�or�diversion�as�well�as�some�sort�of�applied�process�to�condition�the�recovered�material�into�a�usable�form.�This�is�distinct�from�“reuse,”�which�in�Greenroads�refers�to�a�material�that�is�either�used�again�with�no�processing�or�at�least�is�used�again�with�no�significant�transport�outside�of�site�boundaries.�McDonough�&�Braungart�(2002)�go�further�and�make�a�clear�distinction�between�“recycling”�(reusing�the�material�for�the�same�purpose�for�which�it�was�originally�made)�and�what�they�term�“downcycling”�(reusing�
393
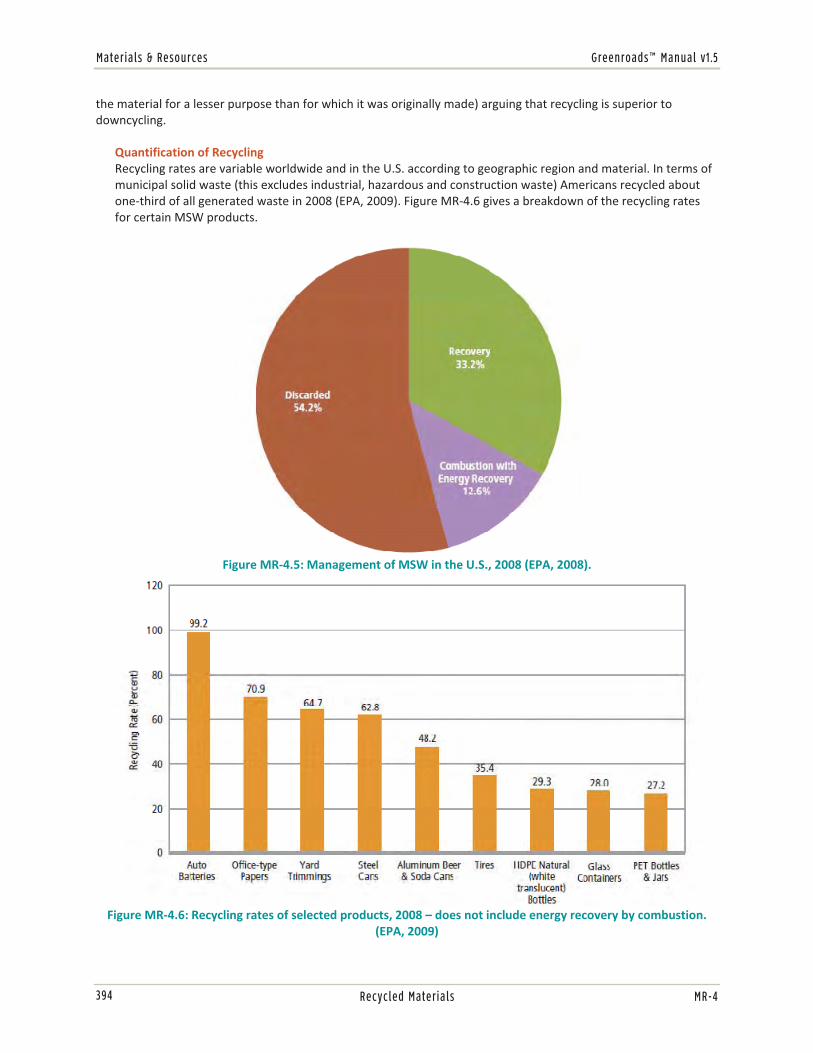
Materials & Resources Greenroads™ Manual v1.5
Recycled Materials MR-4
the�material�for�a�lesser�purpose�than�for�which�it�was�originally�made)�arguing�that�recycling�is�superior�to�downcycling.��
Quantification�of�Recycling�Recycling�rates�are�variable�worldwide�and�in�the�U.S.�according�to�geographic�region�and�material.�In�terms�of�municipal�solid�waste�(this�excludes�industrial,�hazardous�and�construction�waste)�Americans�recycled�about�one�third�of�all�generated�waste�in�2008�(EPA,�2009).�Figure�MR�4.6�gives�a�breakdown�of�the�recycling�rates�for�certain�MSW�products.��
�Figure�MR�4.5:�Management�of�MSW�in�the�U.S.,�2008�(EPA,�2008).�
�Figure�MR�4.6:�Recycling�rates�of�selected�products,�2008�–�does�not�include�energy�recovery�by�combustion.�
(EPA,�2009)��
394

Greenroads™ Manual v1.5 Materials & Resources
MR-4 Recycled Materials
Data�on�recycling�in�the�construction�and�demolition�field�is�less�exact;�however�some�numbers�exist�for�certain�materials.�Recycling�rates�for�hot�mix�asphalt�(HMA)�and�portland�cement�concrete�(PCC)�are�quite�high.�The�most�common�citation�in�the�HMA�industry�is�that�about�80%�of�the�HMA�waste�stream�is�recycled�(Bloomquist�et�al.,�1993).�PCC�recycling�rates�are�similar,�if�not�higher.�Data�from�the�Washington�State�Department�of�Ecology�(DOE)�show�that�PCC�and�HMA�together�are�the�largest�contributors�to�the�diverted�waste�stream�(waste�that�is�either�recycled�or�reused�and�thus,�kept�out�of�landfills).�About�30%�of�all�diverted�waste�in�Washington�State�(by�weight;�2.3�million�tons�combined)�was�PCC�and�HMA�(Washington�DOE,�2007).�Ferrous�materials�at�1�million�tons�were�second.��
�Figure�MR�4.7:�Disposition�of�generated�waste�in�Washington�State�(data�from�Washington�DOE,�2007).��
Using�Recycled�Materials�in�Roadway�Construction�Materials�A�substantial�fraction�of�roadway�materials�are�recycled�(about�80%�in�the�case�of�HMA).�Much�of�this�is�used�in�roadway�construction�and,�thus,�replaces�at�least�some�virgin�raw�material.�Additionally,�other�waste�materials�outside�of�construction�and�demolition�waste�can�also�be�used�in�roadway�construction�materials.�This�section�briefly�reviews�the�major�materials�in�a�pavement�structure�and�the�types�of�recycled�materials�used�in�each.�
With�all�of�these�materials,�one�of�the�primary�issues�to�overcome�is�the�general�non�uniformity�of�recycled�materials.�Their�variability�is�often�greater�than�that�of�the�virgin�raw�materials�which�they�replace,�and�this�variability�can�make�quality�control�more�difficult.�Often,�this�issue�leads�to�a�limit�or�maximum�fraction�of�recycled�materials�that�is�allowed�in�a�construction�material.�In�other�instances�a�maximum�fraction�is�specified�so�as�to�prevent�a�substantial�undesirable�change�in�material�properties�from�that�of�a�material�made�entirely�from�virgin�raw�materials.��
Recycled�Materials�in�Granular�Base,�Subbase�and�Fill�Recycled�materials�can�be�used�in�granular�material�and�in�some�instances�can�impart�desirable�qualities.�Table�MR�4.2�list�typical�materials�that�can�and�have�been�used�in�granular�or�stabilized�base�materials.��
0.89 1.12 1.45 1.60 2.00 1.782.30
3.02�3.15�
3.46� 3.63�
4.23�5.28�
5.39�
6.58� 6.23�6.08�
6.12�
7.06�
8.12�7.91�
0
2
4
6
8
10
12
14
16
18
2000 2001 2002 2003 2004 2005 2006
Millions�of�Ton
s
Year
Landfilled
Other�Diverted�Waste
Diverted�HMA�and�PCC
30%�ofdivertedwaste
395

Materials & Resources Greenroads™ Manual v1.5
Recycled Materials MR-4
Table�MR�4.2:�Some�Examples�of�Base�and�Sub�Base�Assemblies�(FHWA,�1997)�Assembly�� Possible�Recycled�Materials��Granular�Base�and�Embankment�FillGranular�Base�� Blast�Furnace�Slag
Coal�Boiler�Slag�Mineral�Processing�Wastes�Municipal�Solid�Waste�Combustor�Ash�Nonferrous�Slags�Reclaimed�Asphalt�Pavement�Reclaimed�Concrete�Steel�Slag�Waste�Glass��
Embankment�or�Fill�� Coal�Fly�AshMineral�Processing�Wastes�Nonferrous�Slags�Reclaimed�Asphalt�Pavement�Reclaimed�Concrete�Scrap�Tires��
Stabilized�Base��Cementitious�Materials�� Coal�Fly�Ash
Cement�Kiln�Dust�Lime�Kiln�Dust�Sulfate�Wastes��
Aggregate�� Coal�Bottom�AshCoal�Boiler�Slag��
Flowable�Fill��Cementitious�Material�� Coal�Fly�Ash
Cement�Kiln�Dust�Lime�Kiln�Dust��
Aggregate�� Coal�Fly�AshFoundry�Sand�Quarry�Fines��
�According�to�rough�estimates�by�the�U.S.�Geological�Survey�(2000),�about�half�(53%)�of�recycled�HMA�is�used�as�a�granular�base�material.�While�this�is�counted�as�“recycling”�it�may�be�more�appropriately�classified�as�downcycling�since�using�reclaimed�asphalt�pavement�(RAP)�as�a�granular�fill�does�not�take�advantage�of�the�asphalt�binder�in�the�mixture;�the�most�expensive�(in�terms�of�cost�and�ecological�impact)�component.�The�predominant�belief�is�as�RAP�content�increases�to�higher�levels,�the�shear�strength�of�the�base�material�decreases�and�other�material�properties�change�too�(McGarrah,�2007).�Because�of�this,�many�states�limit�the�RAP�content�in�base�materials�to�50%�or�lower�(McGarrah,�2007).�
Similarly,�according�to�rough�estimates�by�the�U.S.�Geological�Survey�(2000),�about�two�thirds�(68%)�of�recycled�PCC�is�used�as�a�granular�base�material�or�other�rock�like�material�such�as�fill�or�rip�rap.�The�Michigan�Department�of�Transportation�has�found�that�portland�cement�concrete�has�shown�to�have�similar�properties�to�that�of�aggregate�when�used�in�base�(Venner,�2004).�Most�states�use�or�at�least�allow�crushed�recycled�concrete�material�(RCM)�as�base�material�(Figure�MR�4.8).�
396

Greenroads™ Manual v1.5 Materials & Resources
MR-4 Recycled Materials
�
Figure�MR�4.8:�States�recycling�PCC�as�aggregate�base�(from�FHWA,�2004).��
Recycled�Material�in�Hot�Mix�Asphalt�Recycled�materials�can�be�used�in�HMA�and�in�some�instances�can�impart�desirable�qualities.�Table�MR�4.3�list�typical�materials�that�can�and�have�been�used�in�granular�or�stabilized�base�materials.��
Table�MR�4.3:�Some�Examples�of�Base�and�Sub�Base�Assemblies�(FHWA,�1997)�Assembly�� Possible�MaterialsHot�Mix�Asphalt�(HMA)�Asphalt�Binder�� Modifiers
Recycled�asphalt�binder�from�RAP�Aggregate�� Blast�Furnace�Slag
Coal�Bottom�Ash�Coal�Boiler�Slag�Foundry�Sand�Mineral�Processing�Wastes�Municipal�Solid�Waste�Combustor�Ash�Nonferrous�Slags�Reclaimed�Asphalt�Pavement�Roofing�Shingle�Scrap�Scrap�Tires�Steel�Slag�Waste�Glass��
�By�far,�the�most�common�recycled�material�in�new�HMA�is�RAP�(reclaimed�asphalt�pavement,�or�“old�HMA”).�In�the�U.S.�the�qualities�of�RAP�are�generally�assumed�to�be�identical�to�that�of�virgin�raw�materials�and�thus�no�additional�testing�on�HMA�mixtures�that�contain�RAP�is�required.�However,�in�both�gradation�and�asphalt�quality�RAP�is�different�than�virgin�aggregate�and�asphalt.�Therefore,�as�percentages�get�higher,�they�tend�to�affect�overall�mixture�behavior,�which�necessitates�special�testing.�As�a�result,�most�agencies�set�limits�for�the�amount�of�RAP�allowed�but�require�no�special�mix�design�if�you�use�RAP.�A�survey�by�the�National�Asphalt�Pavement�Association�(NAPA,�2008)�identified�allowable�RAP�percentages�and�typically�RAP�inclusion�rates�in�the�U.S.�Results�are�summarized�in�Figures�MR�4.9�and�MR�4.10.�
397

Materials & Resources Greenroads™ Manual v1.5
Recycled Materials MR-4
�Figure�MR�4.9:�RAP�use�in�HMA�base�courses�(from�Newcomb�&�Jones,�2008).��
�
�Figure�MR�4.10:�RAP�use�in�HMA�surface�courses�(from�Newcomb�&�Jones,�2008).��
�Note�that� in�almost�all�cases�the�average�RAP�content� in�HMA�mixtures� is�somewhat� less�than�the�maximum�allowed.��
Recycled�Material�in�Portland�Cement�Concrete�Recycled�materials�can�be�used�in�PCC�and�in�some�instances�can�impart�desirable�qualities.�Table�MR�4.4�lists�typical�materials�that�can�and�have�been�used�in�granular�or�stabilized�base�materials.��
398

Greenroads™ Manual v1.5 Materials & Resources
MR-4 Recycled Materials
Table�MR�4.4:�Some�Examples�of�Portland�Cement�Concrete�(PCC)�Assemblies�(FHWA,�1997)�Assembly�� Possible�MaterialsPortland�Cement�Concrete�(PCC)Cementitious�Material�� Coal�Fly�Ash
Silica�Fume�Ground�Granulated�Blast�Furnace�Slag��
Aggregate�� Reclaimed�ConcreteWaste�Glass�Foundry�Sand��
�Only�about�9%�of�RCM�is�used�in�new�PCC�(USGS,�2000)�and�few�states�do�it�(Figure�MR�4.11).�When�used�in�new�PCC,�RCM�has�several�key�properties�that�distinguish�it�from�virgin�aggregate�(Celeen,�2007):�
� Lower�specific�gravity.�Specifically,�it�is�about�5�10%�lower.��� High�absorption.�The�constituent�cement�paste�is�more�absorptive�than�virgin�aggregate.�Typical�absorption�for�
virgin�aggrgate�is�in�the�1�2%�range�while�RCM�may�be�from�2�8%.��� Lower�slump.�This�really�means�lower�workability.�Likely�this�is�due�to�the�more�angular�shape�of�the�RCM.�� Alkalia�silica�reactivity�(ASR)�potential.�This�is�really�dependent�on�the�old�concrete’s�susceptibility�to�ASR.�RCM�
will�not�necessarily�be�susceptible�to�ASR�but�one�should�check�on�the�old�concrete�source�since�the�recycled�stuff�is�likely�to�have�the�same�issues.�
� Drying�shrinkage.�About�40�100%�more�for�RCM�due�to�the�mortar�and�cement�paste�in�the�RCM.��
In�general�there�seems�to�be�an�unofficial�“30%�rule”�that�when�natural�sand�is�used,�it�is�generally�accepted�that�up�to�30%�of�natural�crushed�coarse�aggregate�can�be�replaced�with�coarse�recycled�aggregate�without�significantly�affecting�any�of�the�mechanical�properties�of�the�concrete.�Some�agencies�go�above�this�rule�but�it�is�still�often�followed�(Celeen,�2007).��
.� �Figure�MR�4.11:�States�recycling�PCC�as�aggregate�new�PCC�(from�FHWA,�2004).��
�Coal�fly�ash�and�ground�granulated�blast�furnace�slag�(GGBFS)�are�the�most�recycled�materials�used�in�PCC�for�roadway�applications.�Headwaters�Resources�(n.d.)�reports�that�all�50�states�allow�fly�ash�in�PCC.�In�pavement�use,�typically�fly�ash�replacement�is�limited�to�15�25%�of�the�cementitious�material�by�specification�(FHWA,�n.d.).�Ground�granulated�blast�furnace�slag�limits�are�similar.��
GLOSSARY
Diversion� Avoiding�placement�in�a�landfill�through�recovery�processes�such�as�recycling�or�reuse�
399

Materials & Resources Greenroads™ Manual v1.5
Recycled Materials MR-4
Downcycling� Recovering�a�portion�of�a�used�product�or�material�in�a�manner�that�reduces�the�original�value�of�the�product�or�material�after�being�reintroduced�into�the�manufacturing�or�construction�process�(McDonough�and�Braungart�2002)�
HMA� Hot�mix�asphaltPCC� Portland�cement�concreteRAP� Reclaimed�asphalt�pavementRCA� Recycled�concrete�aggregate�(see�also�RCM)RCM� Recycled�concrete�material�(see�also�RCA)Recycling�(recyclable,�recycled)� Recovering�a�portion�of�a�used�product�or�material�from�the�waste�stream�
and�processing�such�that�those�same�materials�can�be�reintroduced�into�the�manufacturing�or�construction�process�(CIWMB�2009)�
Reuse�(reusable)� Recovering�a�portion�of�a�used�product�or�material�from�the�waste�stream�that�requires�minimal,�if�any,�processing�to�be�reintroduced�into�the�manufacturing�or�construction�process�
Waste� Any�material�that�must�be�hauled�off�site�for�disposal�or�reprocessing,�or,�if�disposed�within�the�project�right�of�way�(ROW),�is�not�intended�for�engineered�use�on�site�
�
REFERENCES Bloomquist,�D.,�Diamond,�G.,�Oden,�M.,�Ruth,�B.,�&�Tia,�M.�(1993).�Engineering�and�Environmental�Aspects�of�
Recycled�Materials�for�Highway�Construction.�Western�Research�Institute�for�U.S.�Department�of�Transportation,�Federal�Highway�Administration,�McLean,�VA�and�U.S.�Environmental�Protection�Agency,�Cincinnati,�OH.�
California�Integrated�Waste�Management�Board�(CIWMB).�(2009).�Recycle:�CIWMB.�Accessed�21�December�2009.�Available�at�http://www.ciwmb.ca.gov/Recycle.�
Carpenter,�A.C.,�Gardner,�K.H.,�Fopiano,�J.,�Benson,�C.H.�&�Edil,�T.B.�(2007).�Life�Cycle�based�risk�assessment�of�recycled�materials�in�roadway�construction.�Waste�Management�27,�1458�1464.��
Cascadia�Consulting�Group,�Inc.�(2004).�Statewide�Waste�Characterization�Study.�Publication�No.�340�04�005.�For�the�California�Integrated�Waste�Management�Board�(CIWMB).�� �
Celeen,�S.�(2007).�A�Review�of�the�Current�Specifications�and�Practices�of�the�Use�of�Recycled�Concrete�Aggregate�Nationwide.�Unpublished�graduate�research�paper,�University�of�Washington,�Seattle,�WA.�
Chui,�C�T.,�Hsu,�T�H.�&�Yang,�W�F.�(2008).�Life�cycle�assessment�on�using�recycled�materials�for�rehabilitating�asphalt�pavements.�Resources,�Conservation�and�Recycling�52,�545�556.�
Federal�Highway�Administration�(FHWA).�(1997).�User�Guidelines�for�Waste�and�By�product�Materials�in�Pavement�Construction.�FHWA�RD�97�148,�U.S.�DOT,�FHWA,�Washington,�D.C.��
Federal�Highway�Administration�(FHWA).�(2004).�Transportation�Applications�of�Recycled�Concrete�Aggregate,�FHWA�State�of�the�Practice�National�Review.�U.S.�DOT,�FHWA,�Washington,�D.C.�
Federal�Highway�Administration�(FHWA).�(n.d.).�Fly�Ash.�Accessed�8�January�2010.�Available�at�http://www.fhwa.dot.gov/infrastructure/materialsgrp/flyash.htm.�
Fiksel,�J.�(2006).�A�Framework�for�Sustainable�Materials�Management.�JOM�58(8),�15�22.�
400

Greenroads™ Manual v1.5 Materials & Resources
MR-4 Recycled Materials
Global�Development�Research�Center�(GDRC).�(n.d.).�Waste�Management:�Fact�Sheet.��Accessed�8�January�2010.�Available�at�http://www.gdrc.org/uem/waste/waste�factsheet.html.�
Headwaters�Resources.�(n.d.).�Fly�Ash�for�Concrete.�Brochure.��Accessed�8�January�2010.�Available�at�http://www.flyash.com/data/upimages/press/HWR_brochure_flyash.pdf.��
Horvath,�A.�(2003).�Life�cycle�environmental�and�economic�assessment�of�using�recycled�materials�for�asphalt�pavements.�Berkeley,�Calif:�University�of�California�Transportation�Center.�Available�at�http://www.uctc.net/papers/683.pdf����
Matos,�G.�&�Wagner,�L.�(1998).�Consumption�of�Materials�in�the�United�States,�1900�1995.�US�Geological�Survey,�Washington,�DC.�http://pubs.usgs.gov/annrev/ar�23�107/aerdocnew.pdf.��
McDonough,�W.,�&�Braungart,�M.�(2002).�Cradle�to�cradle:�Remaking�the�way�we�make�things.�New�York:�North�Point�Press.��
McGarrah,�E.�J.�(2007).�Evaluation�of�Current�Practices�of�Reclaimed�Asphalt�Pavement/Virgin�Aggregate�as�Base�Course�Material.�Thesis,�University�of�Washington,�Seattle.�
Mroueh,�U.�M.,�Eskola,�P.,�&�Laine�Ylijoki,�J.�(2001).�Life�cycle�impacts�of�the�use�of�industrial�by�products�in�road�and�earth�construction.�Waste�Management.�21�(3),�271.�
Newcomb,�D.,�&�Jones,�C.�(2008).�The�State�of�HMA�Recycling�in�the�US.�HMAT,�July/August�2008,�20�25.�
Rajendran,�S.�&�Gambatese,�J.�A.�(2007).�Solid�Waste�Generation�in�Asphalt�and�Reinforced�Concrete�Roadway�Life�Cycles.�Journal�of�Infrastructure�Systems.�13�(2),�88.�
Saeed,�A.�(2008).�NCHRP�Report�598:�Performance�Related�Tests�of�Recycled�Aggregates�for�Use�in�Unbound�Pavement�Layers.�Washington�DC:�National�Cooperative�Highway�Research�Program,�Transportation�Research�Board.�pp.�50�51.�
�U.S.�Environmental�Protection�Agency�(EPA).�(2009).�Municipal�Solid�Waste�Generation,�Recycling,�and�Disposal�in�the�United�States:�Facts�and�Figures�for�2008.�U.S.�EPA,�Washington,�D.C.��
U.S.�Geological�Survey�(USGS).�(2000).�Recycled�Aggregates—Profitable�Resource�Conservation.�USGS�Fact�Sheet�FS–181–99,�U.S.�Department�of�the�Interior,�USGS.�
Venner,�M.�(2004).�In�NCHRP�Project�25�25�(04)�Interim�Report:�Environmental�Stewardship�Practices,�Procedures,�and�Policies�for�Highway�Construction�and�Maintenance.�Washington,�DC:�National�Cooperative�Highway�Research�Program,�Transportation�Research�Board.�pp.�395�414.�
Wackernagel,�M.�(2001).�Advancing�Sustainable�Resource�Management:�Using�Ecological�Footprint�Analysis�for�Problem�Formulation,�Policy�Development,�and�Communication.�Report�to�DG�Environment,�European�Commission.�
Washington�State�Department�of�Ecology�(DOE).�(2007).�Waste�in�Washington�State:�Sixteenth�Annual�Status�Report.�Publication�No.�07�07�048,�Washington�DOE�Solid�Waste�&�Financial�Assistance�Program,�Olympia,�WA.�
� �
401

Materials & Resources Greenroads™ Manual v1.5
Recycled Materials MR-4
�
402

Greenroads™ Manual v1.5 Materials & Resources
MR-5 Regional Materials
REGIONAL MATERIALS GOAL Promote�use�of�locally�sourced�materials�to�reduce�impacts�from�transportation�emissions,�reduce�fuel�costs,�and�support�local�economies.�
CREDIT REQUIREMENTS Make�an�itemized�list�of�all�materials,�parts,�components�and�products�intended�for�permanent�installation�on�the�project�including�weights,�total�costs,�shipping�costs,�and�location�of�purchase�and/or�source�of�these�materials.�Using�a�spreadsheet�or�table�is�recommended�for�documentation�of�this�credit.�Show�that�your�project�meets�the�requirements�of�Option�1�or�Option�2�below.�
Option�1.�Choose�local�materials�and�product�suppliers.�Compute�the�total�cost�of�all�materials,�parts,�components�and�products�used�for�project�construction�including�all�shipping�and�transport�costs�based�on�the�project�bid�list.�Compute�the�percentage�of�this�total�cost�that�has�been�paid�to�materials�suppliers,�processors,�distributors�and�producers�within�a�50�mile�radius�of�the�geographic�center�of�the�project.�Points�are�awarded�according�to�the�minimum�percentages�shown�in�Table�MR�5.1.�
Option�2.�Minimize�travel�distance�for�project�construction�materials.�Disaggregate�each�material,�part,�component�or�product�into�its�“basic�materials”�by�weight�and�express�as�a�percentage�of�the�sum�of�these�weights.�Compute�the�cumulative�fronthaul�distance�traveled�for�each�basic�material�from�point�of�origin�to�the�final�endpoint�on�the�project.�Note�this�distance�includes�all�intermediary�points,�such�as�assembly�or�distribution,�between�the�original�source�and�the�final�placement�on�the�project.�Report�the�total�distance�in�terms�of�total�freight�miles�(road,�air,�rail�or�barge)�traveled�for�each�basic�material.�Show�that�at�least�95%�of�these�basic�materials�by�weight�have�traveled�less�than�the�maximum�haul�distances�shown�in�Table�MR�5.1.�
Table�MR�5.1:�Point�Scale*�Credit�MR�5�Points� 1 2 3 4 5Option�1�by�%�of�total�cost� 60 75 84 90 95Option�2�by�maximum�fronthaul�distance�(miles) 500 337.5 225 150 100Both�options�assume�exponential�difficulty�associated�with�achieving�this�credit.�
Details
A�“basic�material”�used�in�the�project�may�include�(but�is�not�limited�to):�any�and�all�binders�(asphalt,�cement�products,�etc.),�aggregate,�base�and�subbase�or�embankment�materials,�metal,�finished�plastic�and�wood�or�whole�components�assembled�with�these�materials.�The�rule�of�thumb�for�determining�“basic”�is�that�it�cannot�be�taken�apart�without�changing�the�chemical�composition�of�the�material�component�itself.�For�example,�typical�new�asphalt�pavement�is�made�of�two�basic�materials:�rocks�and�an�asphalt�binder.�However,�existing�asphalt�pavement�is�a�basic�material�when�used�as�recycled�asphalt�pavement�(RAP).�This�is�because�it�is�difficult�to�separate�the�asphalt�binder�from�the�rocks.�
Generally,�the�“origin”�or�“source”�of�a�basic�material�means�where�it�came�out�of�the�Earth�or�was�initially�fabricated.�“Fronthaul”�means�traveling�from�the�origin�of�
MR-5
1-5 POINTS
RELATED CREDITS
� PR�2�Lifecycle�Cost�Analysis�
� MR�1�Lifecycle�Assessment�
� MR�2�Pavement�Reuse�
� MR�3�Earthwork�Balance�
� MR�4�Recycled�Materials�
SUSTAINABILITY COMPONENTS
� Ecology�� Equity�� Economy�� Extent�
BENEFITS
� Reduces�Fossil�Fuel�Use�
� Reduces�Air�Emissions�
� Reduces�Greenhouse�Gases�
� Improves�Local�Economies�
� Reduces�First�Costs�� Reduces�Lifecycle�
Costs�
403

Materials & Resources Greenroads™ Manual v1.5
Regional Materials MR-5
the�basic�material�and�any�of�the�places�it�has�traveled�on�its�way�to�the�final�destination�in�the�project.�This�includes�any�material�that�is�sourced�at�the�site�and�taken�offsite�for�reprocessing,�such�as�recycling,�later�to�return�at�the�site�in�a�different�form.�By�contrast,�the�term�“backhaul”�is�typically�used�to�describe�materials�taken�away�from�the�site,�usually�destined�for�landfill,�but�sometimes�is�just�an�empty�truck�returning�to�its�point�of�origin�for�another�load.�The�distance�traveled�by�emptied�vehicles�leaving�the�site�(backhaul)�need�not�be�considered�for�purposes�of�this�credit.�Also,�waste�materials�not�intended�for�reuse�or�recycling�on�the�project�(i.e.�they�are�transported�offsite�and�do�not�come�back)�need�not�be�included�in�calculations.�Materials�that�qualify�for�credit�MR�2�Pavement�Reuse�may�not�be�counted�toward�this�credit.�However,�recycled�materials�that�originate�from�the�project�site�and�are�transported�offsite�for�reprocessing�before�being�returned�to�the�site�are�considered.�Be�sure�to�track�weights�of�any�added�or�lost�materials�during�such�a�recycling�process.�
Two�options�are�available�for�this�credit�and�projects�may�elect�to�demonstrate�either�of�them,�whichever�is�most�beneficial.�Note�that�a�50�mile�radius�has�a�100�mile�diameter,�so�the�highest�potential�points�available�in�both�Options�are�essentially�consistent.�Also,�most�pavement�and�structural�materials�are�high�in�weight,�and�constitute�the�majority�of�most�roadway�project�materials�by�cost.�However,�most�high�value�items,�such�as�binders,�may�not�be�as�easily�locally�sourced,�and�represent�a�limited�amount�of�the�total�material�weight.�In�some�cases,�both�Options�may�earn�the�same�number�of�points,�but�in�most�cases�one�will�govern�depending�on�the�project�location.�Also,�depending�on�the�location�and�the�types�of�materials�used�on�the�project,�one�option�may�be�substantially�easier�to�document�and�track�than�the�other.�Option�1,�for�example,�addresses�where�the�project�money�for�materials�actually�goes.�For�large�projects�this�may�be�a�less�complex�approach�and�simply�requires�tracking�material�costs�according�to�the�project�bid�list�and�picking�a�nearby�materials�contractor.�On�the�other�hand,�Option�2�for�this�credit�intends�to�minimize�the�total�transportation�(and�therefore�fuel�costs,�energy�and�emissions)�associated�with�transportation�of�materials�to�the�site.�This�may�be�easier�for�smaller�projects�with�limited�complexity�of�materials,�or�for�projects�that�are�not�near�urban�centers.�For�consistency�between�all�projects,�map�and�compute�haul�distances�using�the�Google�Maps�tool�(http://maps.google.com).�For�products�that�are�shipped�by�air,�barge,�or�rail,�use�weights�and�distances�reported�by�shipping�agency�or�organization.�
DOCUMENTATION Option�1�� A�spreadsheet�including�an�itemized�list�of�all�purchased�basic�materials�used�on�the�project�and�the�billing�
address�of�the�source�for�each.�� A�computation�of�the�total�percentage�of�basic�materials�sourced�within�a�50�mile�radius�of�the�project.�� A�map�showing�the�geographic�center�(in�latitude�and�longitude)�of�the�project.�This�may,�in�many�cases,�be�a�
milepost�or�station.�The�map�must�show:�� The�name�and�location�of�the�project.�� The�geographic�center�of�the�project.�Show�the�latitude�and�longitude�or�mile�marker.�� A�clearly�drawn�circle�with�a�radius�of�50�miles�drawn�to�scale.�� A�scale.�� Labels�or�icons�for�each�basic�material�with�a�billing�address�that�lies�within�the�50�mile�radius.�
Option�2�� A�spreadsheet�showing:�
� The�name�and�location�of�the�project.�� An�itemized�list�of�each�basic�material�and�its�weight.�� Cumulative�fronthaul�distance�for�each�basic�material.�� A�list�of�the�locations�that�the�basic�material�visited�during�fronthaul.�
� A�computation�showing�95%�of�the�total�material�weight�meets�the�maximum�haul�distance�requirements�to�qualify�for�points�in�Table�MR�5.1.�Fuel�receipts,�mix�tickets,�dump�tickets,�and�similar�supporting�documents�may�be�requested�to�verify�spreadsheet�calculations.�
404

Greenroads™ Manual v1.5 Materials & Resources
MR-5 Regional Materials
APPROACHES & STRATEGIES
� Establish�a�documentation�pipeline�for�materials�extraction�and�fabrication�before�construction�starts.�� Ensure�that�a�local�materials�clause�is�written�into�the�special�provisions�in�the�construction�contract.�� Make�sure�that�the�project�has�local�contractors�that�can�perform�the�work.�
Example: Option 1 Calculation – New Roadway in Suburban Neighborhood
A�small�new�road�is�being�constructed�in�a�suburban�neighborhood�development.�The�HMA�aggregate�is�mined�at�the�location�of�the�asphalt�plant,�which�is�35�miles�away�from�the�project.�The�asphalt�binder�is�sourced�from�an�out�of�town�supplier�that�is�located�220�miles�away�from�the�project�site,�and�the�marking�paint�was�shipped�from�86�miles�north�of�the�geographic�center�of�the�project.�No�electrical�or�stormwater�infrastructure�materials�are�included�in�the�scope�of�work,�because�these�utilities�are�already�in�place.�
The�bid�list�costs�for�all�material�components�or�products�on�the�project�are:�
� HMA�Aggregate Asphalt Aggregate�Base� Paint�for�Markings�
Weight�(ton)� 21,200 896 17,300 0.21Distance�(mi)� 25 220 25 86Unit�Cost�($/ton)� $7.50 $100 $7.50 $153,377Total�Cost�($)�with�shipping� $159,000 $89,600 $129,750� $32,080
�The�total�cost�for�materials�is�$410,430.�The�total�cost�of�the�items�that�originate�from�within�a�50�mile�radius�of�the�geographic�center�of�the�project�(the�HMA�aggregate�and�aggregate�base)�is�$288,750.�This�equates�to�70.3%�of�the�materials�by�cost�being�located�within�a�50�mile�radius,�which�would�allot�1�point�to�the�project.�
Example: Option 2 Calculation – Rural Overlay with Stormwater Treatment
A�new�project�to�overlay�two�miles�of�a�rural�county�road�will�be�occurring�in�the�next�few�months.�Stormwater�is�to�be�treated�in�linear�ditches�along�the�roadway�using�compost�amended�soil�provided�from�a�farmer�whose�plot�is�approximately�120�miles�from�the�project,�where�it�is�produced�and�mixed.�The�HMA�aggregates�are�being�trucked�into�a�mobile�plant�located�45�miles�from�the�quarry�and�35�miles�from�the�project.�The�asphalt�binder�is�being�trucked�via�tanker�from�the�nearest�refinery�which�is�located�295�miles�away�to�the�mobile�plant.�Paint�for�markings�is�provided�from�the�nearest�city�center�which�is�410�miles�west�of�the�project.�
� Aggregate�for�HMA�
AsphaltBinder�
HMA Compost Soil Compost�Amended�Soil�
Paint�for�Markings�
Weight�(ton)� 5,200� 200 � 350 325 �� 0.25Distance�(mi)� 45� 295 35 0 0 120� 410%�of�Total�Weight� 85.6%� 3.3% 88.9% 5.8% 5.3% 11.1%� 0.0%
�The�total�distance�travelled�by�the�aggregate�from�source�to�plant�to�project�site�(front�haul�only)�is�80�miles�and�this�material�accounts�for�85.6%�of�the�total�weight�of�materials�for�this�overlay.�However,�since�this�is�less�than�95%�of�the�total�weight�of�materials,�the�critical�material�component�is�actually�the�compost�amended�soil.�The�total�distance�traveled�by�the�compost�amended�soil�is�120�miles,�meaning�that�96.7%�of�the�total�materials�by�weight�have�traveled�120�miles�or�less�from�point�of�origin�to�the�project�site.�This�qualifies�the�project�for�4�points�according�to�table�MR�5.1.�
For�this�example,�note�that�the�total�distance�travelled�by�the�asphalt�binder�from�source�to�plant�to�project�site�is�330�miles,�but�this�only�accounts�for�3.3%�of�the�total�weight�of�materials.�The�paint�materials�also�did�not�contribute�measurably�to�the�total�weight�of�materials�transported�to�the�site.�These�products�are�likely�to�have�high�unit�cost,�making�it�unlikely�the�project�would�score�as�highly�according�to�the�Option�1�method.�
405

Materials & Resources Greenroads™ Manual v1.5
Regional Materials MR-5
Example: Case Study - I-5 James to Olive Project (Mixed Pavement)
The�I�5�James�to�Olive�project�was�constructed�in�downtown�Seattle�in�2005.�This�project�consisted�of�constructing�2�miles�of�13�inch�concrete�pavement�over�3�inches�of�HMA.�The�HMA�was�supplied�approximately�30�miles�from�the�job�site�by�road.�Aggregates�for�HMA�were�mined�at�the�batch�plant�location.��Steel�was�supplied�from�a�local�supplier�that�was�approximately�35�miles�from�the�job�site.�Portland�cement�concrete�aggregates�were�quarried�within�a�radial�distance�of�30�miles�from�the�project,�but�were�trucked�25�miles�to�a�concrete�batch�plant�located�12�miles�from�the�project�by�road.�Asphalt�was�trucked�from�out�of�town�150�miles�away�to�the�HMA�plant.�Portland�cement�concrete�and�ground�granulated�blast�furnace�slag�(GGBFS)�were�produced�5�miles�from�the�concrete�batch�plant�and�in�a�10�mile�radius�from�the�project�site.�
For�Option�1�the�materials�cost�breakdown�would�look�like:�
Material�or�Component Aggregatefor�HMA�
AsphaltBinder�
Aggregate�for�PCC�
Cement�Binder�
GGBFS� Steel
Weight�(ton)� 2,400� 100 7800 3250 1950� 35Radial�Distance�(mi)� 30� 150 30 10 10� 35Cost�of�Materials�($/ton)� 7.50� 100.00 7.50 50.00 30.00� 650.00Cost� $18,000� $10,000 $58,500 $162,500 $58,500� $22,750
�The�total�cost�for�these�materials�was�$330,250.�The�total�cost�of�materials�that�were�located�within�50�miles�was�$320,250�which�amounts�to�96%�of�the�materials�cost.�This�would�score�5�points�towards�this�credit.�
For�Option�2�the�materials�breakdown�would�look�like:�
Material�or�Component�
HMA�Aggregate�
AsphaltBinder�
HMA Aggregate�for�PCC�
CementBinder�
GGBFS� PCC� Steel
Weight�(ton)� 2400� 100 2500 7800 3250 1950� 1,000� 35Travel�Distance�(mi)� 30� 180 30 37 17 17� 12� 35Total�Weight�(ton)� � 2500 � 13000 35
�The�total�weight�of�the�materials�is�15,535�tons.�The�asphalt�binder,�which�traveled�farthest�(180�miles�from�source�to�plant�to�project�site),�accounts�for�0.6%�of�the�total�weight�of�pavement�assembly�materials.�The�remaining�99.3%�of�materials�traveled�less�than�100�miles�to�their�final�destination�on�site.�This�method�would�also�score�5�points.�
Example: Case Study - Mountlake Terrace Freeway Station, Mountlake Terrace, WA
The�Mountlake�Terrace�Freeway�Station�project�began�construction�in�May�2009�to�provide�I�5�median�access�to�the�recently�constructed�Mountlake�Terrace�Transit�Center.�Currently,�buses�must�merge�across�I�5�to�exit�and�use�surface�streets�to�reach�the�transit�center.�The�freeway�station�will�allow�buses�to�load�and�unload�riders�without�straying�from�the�HOV�lanes.�The�covered�freeway�station�will�connect�to�the�transit�center�through�a�pedestrian�bridge,�and�is�designed�to�increase�bus�speed�and�reliability.�The�roadway�project�consists�of�underground�utility�work�for�infrastructure�improvements,�sound�walls,�and�also�standard�pavements.��
Option�1�is�used�to�compute�the�points�for�this�project.�The�computation�is�shown�in�the�table�on�the�following�page.�The�project�qualifies�for�4�points,�with�94%�of�materials�by�cost�being�sourced�from�within�a�50�mile�radius�of�the�project�site.�
� �
406
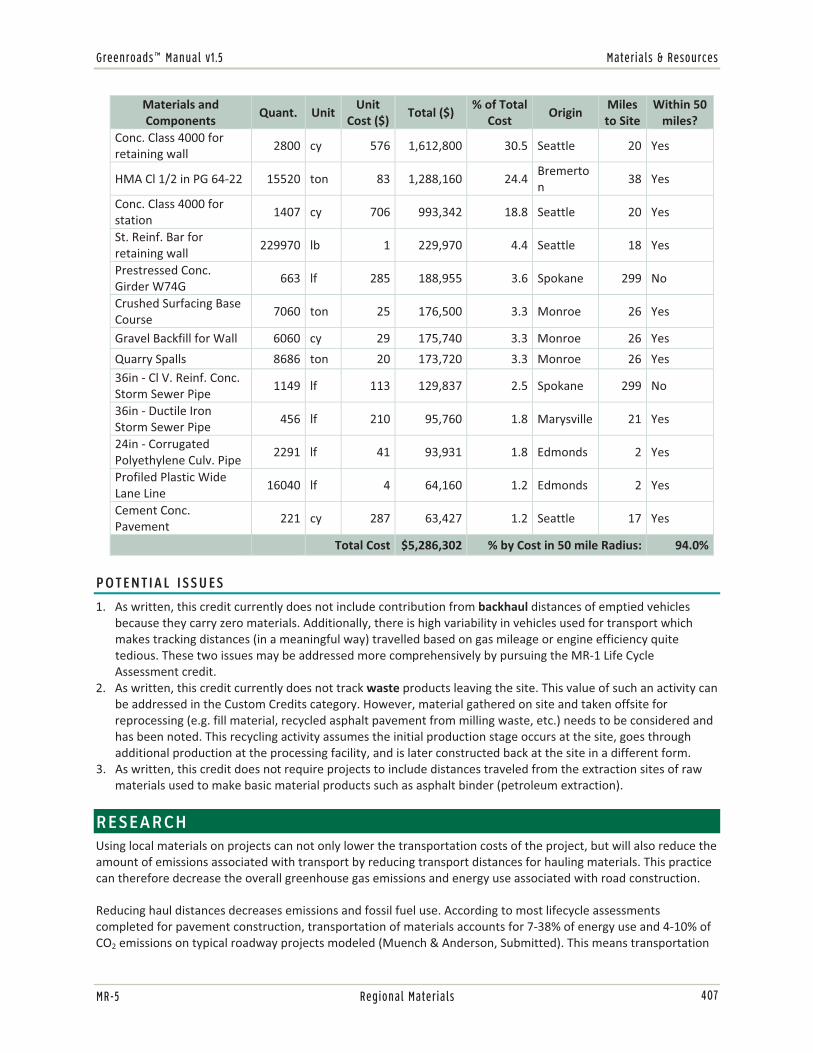
Greenroads™ Manual v1.5 Materials & Resources
MR-5 Regional Materials
Materials�and�Components�
Quant.� UnitUnit�
Cost�($)Total�($)�
%�of�Total�Cost�
Origin�Miles�to�Site�
Within�50�miles?�
Conc.�Class�4000�for�retaining�wall�
2800� cy� 576 1,612,800 30.5 Seattle� 20� Yes�
HMA�Cl�1/2�in�PG�64�22� 15520� ton� 83 1,288,160 24.4Bremerton�
38� Yes�
Conc.�Class�4000�for�station�
1407� cy� 706 993,342 18.8 Seattle� 20� Yes�
St.�Reinf.�Bar�for�retaining�wall�
229970� lb� 1 229,970 4.4 Seattle� 18� Yes�
Prestressed�Conc.�Girder�W74G�
663� lf� 285 188,955 3.6 Spokane� 299� No�
Crushed�Surfacing�Base�Course�
7060� ton� 25 176,500 3.3 Monroe� 26� Yes�
Gravel�Backfill�for�Wall� 6060� cy� 29 175,740 3.3 Monroe� 26� Yes�
Quarry�Spalls� 8686� ton� 20 173,720 3.3 Monroe� 26� Yes�36in���Cl�V.�Reinf.�Conc.�Storm�Sewer�Pipe�
1149� lf� 113 129,837 2.5 Spokane� 299� No�
36in���Ductile�Iron�Storm�Sewer�Pipe�
456� lf� 210 95,760 1.8 Marysville� 21� Yes�
24in���Corrugated�Polyethylene�Culv.�Pipe�
2291� lf� 41 93,931 1.8 Edmonds� 2� Yes�
Profiled�Plastic�Wide�Lane�Line�
16040� lf� 4 64,160 1.2 Edmonds� 2� Yes�
Cement�Conc.�Pavement�
221� cy� 287 63,427 1.2 Seattle� 17� Yes�
Total�Cost $5,286,302 %�by�Cost�in�50�mile�Radius:� 94.0%�
POTENTIAL ISSUES
1. As�written,�this�credit�currently�does�not�include�contribution�from�backhaul�distances�of�emptied�vehicles�because�they�carry�zero�materials.�Additionally,�there�is�high�variability�in�vehicles�used�for�transport�which�makes�tracking�distances�(in�a�meaningful�way)�travelled�based�on�gas�mileage�or�engine�efficiency�quite�tedious.�These�two�issues�may�be�addressed�more�comprehensively�by�pursuing�the�MR�1�Life�Cycle�Assessment�credit.�
2. As�written,�this�credit�currently�does�not�track�waste�products�leaving�the�site.�This�value�of�such�an�activity�can�be�addressed�in�the�Custom�Credits�category.�However,�material�gathered�on�site�and�taken�offsite�for�reprocessing�(e.g.�fill�material,�recycled�asphalt�pavement�from�milling�waste,�etc.)�needs�to�be�considered�and�has�been�noted.�This�recycling�activity�assumes�the�initial�production�stage�occurs�at�the�site,�goes�through�additional�production�at�the�processing�facility,�and�is�later�constructed�back�at�the�site�in�a�different�form.�
3. As�written,�this�credit�does�not�require�projects�to�include�distances�traveled�from�the�extraction�sites�of�raw�materials�used�to�make�basic�material�products�such�as�asphalt�binder�(petroleum�extraction).�
RESEARCH Using�local�materials�on�projects�can�not�only�lower�the�transportation�costs�of�the�project,�but�will�also�reduce�the�amount�of�emissions�associated�with�transport�by�reducing�transport�distances�for�hauling�materials.�This�practice�can�therefore�decrease�the�overall�greenhouse�gas�emissions�and�energy�use�associated�with�road�construction.��
Reducing�haul�distances�decreases�emissions�and�fossil�fuel�use.�According�to�most�lifecycle�assessments�completed�for�pavement�construction,�transportation�of�materials�accounts�for�7�38%�of�energy�use�and�4�10%�of�CO2�emissions�on�typical�roadway�projects�modeled�(Muench�&�Anderson,�Submitted).�This�means�transportation�
407

Materials & Resources Greenroads™ Manual v1.5
Regional Materials MR-5
of�materials�uses�about�8�times�the�energy�and�produces�twice�as�many�CO2�emissions�as�the�construction�processes�for�the�road.�Therefore,�limiting�haul�distances�has�a�sizable�impact�on�energy�and�greenhouse�gas�emissions,�as�well�as�reducing�emissions�of�many�other�harmful�air�pollutants�from�burning�fossil�fuels�that�are�detrimental�to�human�health�(Bilec�et�al.,�2006).�(See�also�Project�Requirement�PR�3�Life�Cycle�Inventory).�
Local�economies�also�benefit�from�projects�using�local�materials.�Using�local�suppliers�creates�or�maintains�jobs,�establishes�community�identity�(Sustainable�Sites,�2009),�and�often�supports�local�small�business�owners.�Typically�many�paving�companies�that�bid�large�scale�road�projects�are�located�less�than�100�miles�away�from�a�project�due�to�local�specification�restraints�on�material�properties�(e.g.�standard�binder�grades�and�aggregate�quality),�and�because�transportation�of�heavy�materials�is�fuel�intensive�and�expensive.�Also,�most�public�work�paving�projects�use�local�material�suppliers�due�to�the�cost�implications�of�competitive�bidding.�That�being�said,�using�local�contractors�and�suppliers�will�not�always�result�in�the�lowest�bid.�The�cost�of�social�externalities�for�the�resultant�transportation�emissions�is�not�normally�included�in�a�bid�and�can�be�significant�(Bilec�et�al.,�2006).����Both�the�Leadership�in�Energy�and�Environmental�Design�(LEED™)�Rating�System�and�the�Sustainable�Sites�Initiative�award�credit�for�minimizing�transport�distance.�In�LEED,�the�radius�that�determines�a�“regional”�product�is�established�at�500�miles�from�the�site.�LEED�has�experienced�issues�with�their�specification�due�to�incorrect�reports�of�haul�distances�during�extraction�and�manufacture�provided�by�contractors.�This�is�largely�a�communication�issue�between�the�contractor,�materials�supplier�and�the�project�team�attempting�a�LEED�certification�(Davis�Langdon,�2004).�There�is�also�some�difficulty�in�understanding�the�LEED�credit�calculation�requirements�for�computing�supply�chain�responsibility�by�cost:�many�building�products�are�extracted�or�produced�in�one�location�that�may�be�outside�the�radius,�and�then�they�are�assembled�locally�(Davis�Langdon,�2007).�In�Sustainable�Sites�(2009),�the�radius�varies�depending�on�the�type�of�product�from�50�miles�(soils�and�aggregate)�to�500�miles�(for�specialty�products).��For�this�credit,�a�50�mile�radius�is�used�and�calculations�are�done�by�weight,�because�soil�and�aggregates�represent�the�largest�percentage�of�materials�on�most�paving�projects,�are�typically�supplied�locally�due�to�cost�effectiveness,�and�weights�of�these�materials�are�already�tracked.�Additionally,�weight�of�materials�directly�corresponds�to�total�fuel�use�and�thus�bid�cost�for�the�most�common�hauling�equipment�used�in�construction.�
GLOSSARY
Backhaul� The�return�trip�after�a�good�has�been�deliveredBasic�material� A�material�component�that�cannot�be�taken�apart�without�changing�the�
chemical�composition�of�the�material�component�itself�Fronthaul� The�trip�associated�with�delivery�of�a�goodHaul�distance� The�distance�a�good�travels�to�get�to�the�location�of�intended�use�Waste� Unwanted�material�produced�as�a�result�of�construction�activity��
REFERENCES Bilec,�Melissa;�Ries,�Robert;�Matthews,�Scott�&�Sharrard,�Aurora.��(2006).�Example�of�a�Hybrid�Life�Cycle�
Assessment�of�Construction�Processes.��ASCE�Journal�of�Infrastructure�Systems,�Volume�12,�Issue�4.�pp�207�215.��
Davis�Langdon.�(2004).�Costing�Green:�A�Comprehensive�Cost�Database�and�Budgeting�Methodology.�Available�at:�http://www.usgbc.org/Docs/Resources/Cost_of_Green_Full.pdf�
Davis�Langdon�(2007).�The�Cost�of�Being�Green�Revisited:�Reexamining�the�feasibility�and�Cost�Impact�of�Sustainable�Design�in�the�Light�of�Increased�Market�Adoption.�Available�at:�http://www.davislangdon.com/USA/Research/��
�Muench,�S.T.�&�Anderson,�J.L.�(n.d.).�Weighting�a�Sustainability�Performance�Metric�for�Roadways:�Greenroads.�
Manuscript�submitted�for�publication.��
408

Greenroads™ Manual v1.5 Materials & Resources
MR-5 Regional Materials
Sustainable�Sites�Initiative.�(2009)�The�Sustainable�Sites�Initiative:�Guidelines�and�Performance�Benchmarks�2009.�Available�at�http://www.sustainablesites.org/report/�
United�States�Green�Building�Council�(USGBC).�(2009)�LEED�2009�for�New�Construction�and�Major�Renovations�Rating�System.�Available�at�http://www.usgbc.org/DisplayPage.aspx?CMSPageID=220��
� �
409

Materials & Resources Greenroads™ Manual v1.5
Regional Materials MR-5
�
410

Greenroads™ Manual v1.5 Materials & Resources
MR-6 Energy Efficiency
ENERGY EFFICIENCY GOAL Reduce�lifetime�energy�consumption�of�lighting�systems�for�roadways.�
CREDIT REQUIREMENTS Install�lighting�systems�with�luminaires�that�meet�or�exceed�the�2009�Energy�Star�standard�for�roadway�lighting�and�are�compliant�with�all�safety�requirements�applicable�to�the�roadway�project.�The�2009�Energy�Star�Standard�is�available�at:�http://www.drintl.com/htmlemail/ESOutdoorDraft2_01Jul09.pdf.�
Points�are�awarded�based�on�the�fraction�of�total�luminaires�installed�on�the�project�with�energy�efficient�fixtures�that�are�2009�Energy�Star�compliant�in�the�following�manner:�
� 1�point:�20%�� 2�points:�40%�� 3�points:�60%�� 4�points:�80%�� 5�points:�100%�
Details
Lighting�facilities�and�systems�must�be�appropriate�for�the�project.�This�means�that�installing�pedestrian�safety�lighting�on�a�project�with�no�pedestrian�accessibility�will�not�be�awarded�credit.�Similarly,�lighting�for�new�and/or�improved�driveways�and�parking�lots�are�subject�to�the�credits�only�if�they�are�included�within�the�project�scope�and�budget�boundaries.��Projects�that�do�not�include�lighting�within�their�scope�cannot�achieve�this�credit.���
DOCUMENTATION Provide�a�copy�of�the�specification�and/or�cut�sheets�of�the�luminaires�being�installed�on�the�project.�Show�that�these�are�Energy�Star�2009�compliant.��Show�that�the�lighting�design�complies�with�all�applicable�safety�regulations�for�the�project.�
�
MR-6
1-5 POINTS
RELATED CREDITS
� EW�8�Light�Pollution�� AE�3�Context�
Sensitive�Solutions�� AE�5�Pedestrian�
Access�� PT�4�Cool�Pavement�
SUSTAINABILITY COMPONENTS
� Ecology�� Economy�� Extent�
BENEFITS
� Reduces�Fossil�Fuel�Use�
� Reduces�Air�Emissions�
� Reduces�Greenhouse�Gases�
� Increases�Service�Life� Reduces�Lifecycle�
Costs�
411

Materials & Resources Greenroads™ Manual v1.5
Energy Efficiency MR-6
APPROACHES & STRATEGIES
� Install�luminaires�that�are�2009�Energy�Star�compliant.�� Use�light�emitting�diode�(LED)�lamp�technologies.�� Consider�not�installing�lighting�systems�where�average�daily�traffic�counts�do�not�warrant�lighting�installation�
for�a�particular�roadway�configuration,�or�where�pedestrian�safety�is�not�an�issue.�� Review�and�apply�Chapter�2�of�the�AASHTO�Roadway�Lighting�Design�Guide�to�achieve�a�Master�Lighting�Plan.�� Perform�a�lighting�analysis�of�the�project�lighting�system�according�to�the�American�Association�of�State�
Highway�and�Transportation�Officials�(AASHTO)�Roadway�Lighting�Design�Guide�method�or�the�Illuminating�Engineering�Society�of�North�America�(IESNA)�Roadway�Lighting�standard�“RP�8�00”�method.�These�methods�can�help�determine�if�solid�state�lighting�technologies�will�be�appropriate�for�the�project.�Design�tables�for�the�referenced�luminance�or�illuminance�methods�are�noted�in�Table�MR�6.1.�Note�that�a�combination�of�luminance�and�illuminance�methods�may�be�appropriate�for�some�projects,�and�that�some�projects�include�multi�pavement�types,�which�must�be�considered�in�the�analysis.�The�analysis�should�include�consideration�of�initial�lumens,�lamp�lumen�depreciation�factor,�and�dirt�depreciation�factor.�
Table�MR�6.1:�Lighting�Analysis�Methods�Reference�Source� Luminance Illuminance�AASHTO�Roadway�Lighting�Design�Guide Table�3�5a Table�3�5a�IESNA�RP�8�00,�Roadway�Lighting� Table�2 Table�3�
�Example: Solid State Lighting Case Study - I-35 Bridge in Minneapolis, Minnesota
Replacement�of�the�I�35�Bridge�in�Minneapolis,�which�tragically�collapsed�in�2007,�was�used�as�an�opportunity�by�the�U.S.�Department�of�Energy�and�Minnesota�Department�of�Transportation�to�demonstrate�the�use�of�solid�state�roadway�lighting�on�a�high�profile�project.�LEDs�were�used�with�the�goal�of�providing�adequate�uniform�lighting�while�reducing�operational�energy�use�and�maintenance�requirements.�(Pacific�Northwest�National�Laboratory:�PNNL,�2009)�An�aerial�photo�of�the�bridge�at�night�is�shown�in�Figure�MR�6.1�and�Figure�MR�6.2�(next�page)�shows�a�pair�of�luminaires.�
�Figure�MR�6.1:�Aerial�View�of�LED�Lighting�on�I�35.�Photo�by�Beta�Lighting.�
(http://www.ledwaystreetlights.com/Benefits/pdf/case�study/ledway�I�35W�CaseStudy.pdf)�
412

Greenroads™ Manual v1.5 Materials & Resources
MR-6 Energy Efficiency
�Figure�MR�6.2:�Lit�LED�luminaires�at�night�on�I�35.�Photo�by�Figg�Engineering�Group.��
(http://www.ledwaystreetlights.com/Benefits/pdf/case�study/ledway�I�35W�CaseStudy.pdf)��
Some�highlights�of�the�project�include�(PNNL,�2009):��
� Bridge�illumination�was�accomplished�using�20�luminaires�of�two�different�designs.�� Operational�energy�requirements�of�the�LED�luminaires�were�estimated�to�be�a�minimum�of�13%�lower�than�
those�of�Minnesota’s�standard�250�watt�high�pressure�sodium�luminaires.�
More�information�about�this�project�is�available�from�PNNL�and�the�U.S.�Department�of�Energy�at:�http://apps1.eere.energy.gov/buildings/publications/pdfs/ssl/gateway_i�35w�bridge.pdf�
POTENTIAL ISSUES
1. A�tradeoff�exists�between�providing�enough�luminance�for�safety,�limiting�light�pollution,�and�reducing�or�conserving�energy.�
2. Compliance�with�veiling�luminance�ratios�may�also�be�required�in�some�jurisdictions.�3. In�colder�climates,�LED�lighting�may�not�provide�as�much�heat�that�assists�with�deicing�of�luminaires�or�traffic�
signals�as�do�incandescent�bulbs.�
RESEARCH With�a�large�proportion�of�the�world’s�electricity�being�produced�by�unsustainable�methods,�reduction�of�electricity�consumption�is�an�important�goal�in�the�pursuit�of�sustainable�infrastructure.�After�construction�is�completed,�the�direct�electricity�consumption�of�virtually�all�roadways�can�be�primarily�attributed�to�roadway�lighting�systems.�The�U.S.�Department�of�Energy�estimates�that�roadway�lighting�systems�consume�31�terawatt�hours�of�electricity�each�year�in�the�United�States�(US�DOE,�2008).�
413

Materials & Resources Greenroads™ Manual v1.5
Energy Efficiency MR-6
Solid�State�Lighting�In�recent�years,�lighting�technologies�have�been�refined�to�provide�feasible�alternatives�to�traditional�methods�that�can�provide�comparable�performance�with�significantly�reduced�energy�use.�Solid�state�lighting,�which�uses�light�emitting�diodes�(LED),�can�replace�typical�sodium�or�mercury�luminaires�above�roadways�to�meet�lighting�needs.�Notably,�the�optical�efficacy�(light�output�in�lumens�per�watt�of�electricity)�of�LEDs�has�become�comparable�or�better�than�current�alternatives,�and�light�from�LEDs�can�be�more�effectively�directed�and�therefore�used�to�light�an�area�with�less�energy�(Wu�et�al.,�2009).�In�addition,�the�increased�lifespan�of�LEDs�decreases�the�need�for�replacement�and�maintenance.�
Solid�state�lighting�is�a�technology�still�very�much�under�development.�Because�of�this,�the�efficiency�of�LED�luminaires�is�continually�increasing�as�devices�are�refined.�In�2006,�LEDs�were�developed�that�approximated�the�same�optical�efficacy�as�typical�modern�day�mercury�lamps,�about�70�lumens�per�watt�of�electricity�(Wu�et�al.,�2009).�In�2007,�commercial�luminaires�were�produced�that�could�perform�at�80�lumens�per�watt�(Craford,�2008).�Efficacy�levels�reached�around�130�lumens�per�watt�experimentally�by�2008�and�it�is�expected�that�a�long�term�feasible�maximum�for�LED�efficacy�is�about�150�lumens�per�watt�(Long�et�al.,�2008;�Schubert�et�al.,�2006).�In�addition�to�energy�savings,�LED�roadway�lighting�provides�a�longer�lasting�alternative�to�traditional�luminaires,�reduces�the�need�for�replacement�and�maintenance,�and�decreases�material�waste�and�pollution.�
Energy�Savings�LEDs�with�comparable�levels�of�optical�efficacy�can�provide�significant�energy�savings�over�traditional�light�sources�such�as�mercury�and�sodium�bulbs.�This�is�due�to�the�increased�ability�to�focus�or�aim�LED�light�through�design.�Over�85%�of�the�light�from�an�LED�may�be�directed�to�hit�the�roadway�surface,�while�only�about�half�of�the�light�from�conventional�fixtures�does�so�(Wu�et�al.,�2009).�Therefore,�less�total�light�output�is�required�to�illuminate�the�roadway�surface,�reducing�energy�use�as�well�as�light�pollution�and�trespass.�
In�roadway�lighting�field�tests,�LED�luminaires�have�shown�energy�savings�between�30%�and�75%�(Wu�et�al.,�2009;�US�DOE,�2008,�Long�et�al.,�2008).�Decreased�energy�use�also�allows�for�reduction�in�the�amount�of�copper�wire�used�for�electrical�transmission�(Huang�et�al.,�2009).�Assuming�that�the�optical�efficacy�of�LEDs�will�continue�to�improve�and�surpass�that�of�mercury�and�sodium�lamps,�LED�luminaires�promise�to�be�a�very�attractive�alternative�to�traditional�systems.��
Increased�Service�Lifetime�In�addition�to�reducing�electricity�consumption,�LEDs�have�substantially�longer�functional�lifetimes�than�sodium�and�mercury�bulbs.�LED�luminaires�can�provide�adequate�light�levels�for�about�50,000�hours�(nearly�six�years),�or�about�four�times�longer�than�current�alternatives�(Wu�et�al.,�2009;�McClear,�2007).�This�means�decreased�long�term�costs�and�less�need�for�replacement,�which�is�a�difficult,�dangerous,�and�sometimes�fatal�process,�particularly�on�busy�highways�(New�Jersey�DOT,�2005).�
Other�Benefits�Rather�than�burning�out�like�traditional�bulbs,�LEDs�slowly�lose�brightness�over�time.�This�increases�the�safety�of�LED�lit�roadways,�eliminating�periods�of�complete�darkness�between�bulb�failures�and�replacements.�Finally,�in�contrast�to�some�commonly�used�luminaires,�LED�luminaires�contain�no�mercury,�meaning�reduced�mercury�pollution�at�the�end�of�the�useful�lifetime�of�the�light�(Long�et�al.,�2008).�The�U.S.�Department�of�Energy�(2008)�estimates�that�if�all�high�pressure�sodium�luminaires�in�the�nation�were�replaced�with�LED�luminaires,�8.1�terawatt�hours�would�be�saved�annually�at�minimum,�amounting�to�5.7�million�metric�tons�of�atmospheric�carbon�dioxide.�
Lifecycle�Cost�Savings�The�most�significant�barrier�to�use�of�LED�roadway�lighting�is�the�increased�initial�capital�costs�of�such�systems.�However,�decreased�electricity�and�maintenance�costs�mean�that�these�systems�are�capable�of�paying�for�themselves�in�the�long�term,�even�without�considering�environmental�benefits.�Studies�of�different�technologies�and�methods�on�various�roadway�projects�have�found�payback�times�ranging�from�1.2�to�6.3�years�
414

Greenroads™ Manual v1.5 Materials & Resources
MR-6 Energy Efficiency
(Wu�et�al.,�2009;�US�DOE,�2008).�These�durations�will�continue�to�decrease�as�LED�technology�becomes�less�expensive�and�more�efficient.�
What�is�Induction�Lighting?�Induction�lighting�is�another�alternative�to�traditional�lighting�systems,�and�uses�induced�magnetic�fields�to�cause�mercury�vapor�to�emit�light.�Because�of�the�lack�of�filaments�and�electrodes,�induction�lights�can�have�extremely�long�lifetimes�of�100,000�hrs�(Lippert,�2009).�This�is�especially�attractive�for�applications�where�maintenance�is�difficult�or�dangerous,�such�as�roadway�lighting.�Induction�lights�can�provide�energy�savings�over�typical�luminaries�while�maintaining�safe�conditions�(Dahua�et�al.,�2008).�However,�large�scale�testing�and�comparison�is�still�needed�before�this�technology�can�be�widely�implemented.��
GLOSSARY
AASHTO� American�Association�of�State�Highway�and�Transportation�OfficialsIESNA� Illuminating�Engineering�Society�of�North�AmericaInduction�Lighting� A�type�of�lighting�that�uses�induced�magnetic�fields�to�cause�mercury�vapor�to�
emit�light.�Illuminance� Quantity�of�light�that�reaches�a�given�surfaceLED� Light�emitting�diodeLumen� Unit�of�luminous�fluxLuminaire� A�complete�lighting�unit�that�includes light�source,�covering,�mounting,�
wiring,�etc.�Luminance� Quantity�of�light�reflected�by�a�given�surface�(measure�of�brightness)Optical�efficacy� Number�of�lumens�an�electrical�light�source�produces�per�watt�of�energy�usedSolid�state�lighting� A�type�of�lighting�produced�by�light�emitting�diodes��
REFERENCES American�Association�of�State�Highway�and�Transportation�Officials�(AASHTO).�(2005)�Roadway�Lighting�Design�
Guide.�Washington,�DC.��
BetaLED.�(2009,�March�6)�LEDway�Streetlights�Project�Summary:�I�35W�St.�Anthony’s�Falls�Bridge,�Minneapolis,�MN.�Accessed�December�23,�2009.�Available�at�http://www.ledwaystreetlights.com/benefits�case�studies.html�
Craford,�M.�(2008)�High�Power�LEDs�for�Solid�State�Lighting:�Status,�Trends�and�Challenges.�Journal�of�Light�and�Visual�Environment,�2,�58�62�
Dahua,�C.,�Liping,�G.,�Wencheng,�C.,�Yandan�&�L.,�Zheng,�H.�(2008)�Performance�of�induction�lamps�and�HPS�lamps�in�road�tunnel�lighting.�Tunneling�and�Underground�Space�Technology,�23,�139�144.�
ENERGY�STAR.�(2009).�ENERGY�STAR�Program�Requirements�for�Solid�State�Lighting�Luminaires:�Proposed�Category�“A”�Additions�Outdoor�Area�&�Parking�Garage.�Available�at�http://www.drintl.com/htmlemail/ESOutdoorDraft2_01Jul09.pdf��
Illuminating�Engineering�Society�of�North�America�(IESNA).�(2000).�Roadway�Lighting�(RP�8�00).�New�York,�NY.�
Lippert,�J.�(2009)�Induction�Lighting:�An�Old�Lighting�Technology�Made�New�Again.�Retrieved�November�18,�2009,�From�Department�of�Energy:�Energy�Savers�Blog�web�site:�http://www.eereblogs.energy.gov/energysavers/post/Induction�Lighting�An�Old�Lighting�Technology�Made�New�Again.aspx��
415
Materials & Resources Greenroads™ Manual v1.5
Energy Efficiency MR-6
Long,�X.,�Liao,�R.,�Zhou,�J.�(2008)�Development�of�Street�Lighting�System�Based�Novel�High�Brightness�LED�Modules.�IET�Optoelectronics�3,�40�46�
McClear,�M.�(2007,�September)�Rise�of�the�LED�City.�Lighting�Design�and�Application.�48�50�
New�Jersey�Department�of�Transportation�(NJDOT).�(2005).�Use�of�LED�or�Other�New�Technology�to�Replace�Standard�Overhead�and�Sign�Lighting.�NJDOT�Research�Report�No:�FHWA�NJ�2005�029.�
Pacific�Northwest�National�Laboratory�(PNNL).�(2009).�Demonstration�Assessment�of�Light�Emitting�Diode�(LED)�Roadway�Lighting�at�the�I�35�Bridge,�Minneapolis,�MN.�(PNNL�Doc.�No.�18687).�Prepared�for�United�States�Department�of�Energy.�
Schubert,�E.,�Kim,�J.K.,�Luo,�H.�&�Xi,�J.Q.�(2006)�Solid�State�Lighting��A�Benevolent�Technology.�Reports�on�Progress�in�Physics,�69,�3069�2099�
U.S.�Department�of�Energy.�(2008).�LED�Street�Lighting�Host�Site:�City�of�San�Francisco,�California�
Wu,�M.S.,�Huang,�H.H.,�Huang,�B.J.,�Tang,�C.W.�&�Cheng�C.W.�(2009)�Economic�Feasibility�of�Solar�Powered�LED�Roadway�Lighting.�Renewable�Energy,�34,�1934�1938�
416

Greenroads Manual v1.5 © 2011
�
�
�
�
�
PAVEMENT TECHNOLOGIES
417

Greenroads Manual v1.5 © 2011
� �
418

Greenroads™ Manual v1.5 Pavement Technologies
PT-1 Long-Life Pavement
LONG-LIFE PAVEMENT GOAL Minimize�life�cycle�costs�by�promoting�design�of�long�lasting�pavement�structures.�
CREDIT REQUIREMENTS The�first�requirement�AND�EITHER�of�the�following�two�requirements�must�be�met�to�achieve�points.�
Requirement�1:�Design�at�least�75%�of�the�total�new�or�reconstructed�pavement�surface�area�for�regularly�trafficked�lanes�of�pavement�to�meet�long�life�pavement�design�criteria.�Compute�the�total�surface�area�of�all�trafficked�lanes�and�show�that�a�minimum�of�75%�of�that�area�is�designed�for�long�life.�Do�not�include�shoulders,�medians,�sidewalks�and�other�paved�areas�in�the�computation.�Long�life�pavement�is�defined�as�a�pavement�structure�that�is�designed�using�a�minimum�40�year�design�life.�
Requirement�2a:�Meet�the�requirements�of�Figure�PT�1.1.�
OR�
Requirement�2b:�Pavement�design�is�in�accordance�with�a�design�procedure�that�is�formally�recognized,�adopted�and�documented�by�the�project�owner.�
Details
Generally,�not�all�pavement�sections�on�a�project�will�be�designed�as�long�lasting�sections.�Also,�this�credit�is�not�applicable�to�roads�that�are�not�surfaced�with�hot�mix�asphalt�(HMA)�or�portland�cement�concrete�(PCC),�such�as�gravel�roads,�dirt�roads,�and�roads�sealed�with�bituminous�surface�treatments.�
Figure�PT�1.1�Method.�Requirements�for�subgrade�California�Bearing�Ratio�(CBR)�and�base�material�CBR�can�be�taken�as�averages�across�the�entire�project�where�more�than�one�test�is�done.�If�subgrade�or�base�support�is�not�measured�by�CBR,�use�the�common�conversion�techniques�in�Table�PT�1.1�or�any�local�conversion�that�is�commonly�used�in�design�and�has�a�basis�in�empirical�evidence.�Soils�testing�data�should�support�the�conversion�used.�
Table�PT�1.1:�Commonly�Accepted�CBR�Conversion�Methods�(AASHTO,�1993)�Conversion�� Equation� LimitationCBR���Resilient�Modulus��(MR)� �
Fine�grained�soils�with�a�soaked�CBR�of�10�or�less�only�
CBR���Resistance�Value�(R�value)�
�Fine�grained,�non�expansive�soils�with�a�soaked�CBR�of�8�or�less�only�
Design�Procedure�Method.�The�intention�is�to�allow�an�owner�agency�to�use�its�existing�design�procedure�to�design�the�pavement�section�as�long�as�a�sufficiently�long�design�life�is�chosen�(at�least�40�years).�Some�common�design�procedures�include�(but�are�not�limited�to):�
� 1993�AASHTO�Method.�The�method�described�in�the�1993�version�of�the�
PT-1
5 POINTS
RELATED CREDITS
� PR�2�Lifecycle�Cost�Analysis�
� MR�2�Pavement�Reuse�
SUSTAINABILITY COMPONENTS
� Ecology�� Economy�� Extent�� Expectations�� Experience�
BENEFITS
� Reduces�Raw�Materials��
� Reduces�Fossil�Fuel�Use��
� Reduces�Air�Emissions�
� Reduces�Greenhouse�Gases�
� Reduces�Solid�Wastes
� Increases�Service�Life� Reduces�Lifecycle�
Costs�� Improves�
Accountability�
419
CBR���ResilientModulus� (MR)
Fine grained soils with asoaked CBR of 10 or less only
CBR Fi i d iCBR���ResistanceValue (R�value)
Fine grained, non�expansivesoils with a soaked CBR of 8or less only
CBR � Fine grained non�expansive

Pavement Technologies Greenroads™ Manual v1.5
;97 Long-Life Pavement PT-1
AASHTO Guide for Design of Pavement Structures (1993) and computerized in DARWin, and AASHTOware product.
Asphalt Institute Method. The method described in the Asphalt Institute’s MS‐1 Asphalt Pavements for Highways and Streets and computerized in the Asphalt Institute’s publication, SW‐1 Asphalt Thickness Design Software for Highways, Airports, Heavy Wheel Loads and other applications (1981).
Mechanistic‐Empirical Pavement Design Guide (MEPDG). The method described in AASHTO MEPDG‐1 Mechanistic‐Empirical Pavement Design Guide, Interim Edition: A Manual of Practice (2008). This method is eventually intended to replace the 1993 AASHTO method.
Existing Pavements. Existing pavements that are to at least partially remain in place (in any condition) can also qualify for this credit. In these cases, evaluation for this credit shall be based on the final pavement structure, which may include (1) existing pavement remaining in place, and (2) any new pavement structure added. In this manner, a diamond grind of an existing PCC pavement or an overlay of an existing HMA pavement can qualify for this credit if the resultant pavement structure meets the criteria of this credit.
DOCUMENTATION A list of pavement sections to be built (or reconstructed) and their associated pavement material type, surface
areas, equivalent single axle loads (ESALs), design thicknesses, subgrade CBR, and if design was intended to be long‐life or not in accordance with the requirements of this credit. This may be included as part of the standard project documentation or as a separate document.
A calculation to indicate the total percentage of trafficked lane pavement surface areas that are designed for long‐life.
A drawing or project map showing locations of pavement sections designed for long‐life. These pavement sections should be highlighted on the plan, a scale should be on the plan, and the total surface area of each pavement section should be called out as a note on the plan.
Figure PT‐1.1: Long‐life pavement design graph.
Greenroads™ Manual v1.5 Pavement Technologies
PT-1 Long-Life Pavement
APPROACHES & STRATEGIES
� Consider�designing�long�lasting�pavement�that�meets�the�requirements�of�this�credit.�Any�number�of�pavement�design�methods�can�produce�pavement�sections�that�meet�the�requirements�of�this�credit.��
� Have�a�rehabilitation/preservation�program�that�strives�to�keep�existing�pavements�in�satisfactory�condition�such�that�they�may�remain�in�place�for�overlays�or�diamond�grinds.�This�allows�simple�rehabilitations�such�as�diamond�grinds�and�overlays�to�quality�for�this�credit.�Ultimately,�this�gives�credit�for�a�road�being�durable�enough�such�that�it�does�not�need�to�be�entirely�replaced.��Example: Sample Calculation using Figure PT-1.1
A�pavement�is�to�be�designed�for�a�roadway�that�will�have�a�loading�of�5�million�equivalent�single�axle�loads�(ESALs)�over�a�40�year�period�built�on�a�subgrade�with�an�average�CBR�of�11.�ESAL�calculation�methods�and�definitions�are�found�in�the�AASHTO�Guide�for�Design�of�Pavement�Structures�(1993).�Determine�the�required�pavement�thickness�as�follows:�
a. Enter�Figure�PT�1.1�at�5�million�ESALs.�Note�that�the�ESAL�scale�is�a�log�scale�so�5�million�is�more�than�half�way�between�1�million�and�10�million�(Figure�PT�1.2).�
b. Find�where�5�million�ESALs�intersects�the�plotted�lines�for�HMA�and�PCC.�In�this�case�both�plotted�lines�lie�on�top�of�one�another.��
c. Find�where�this�point�lies�on�the�Thickness�axis.�In�this�case,�it�is�10�inches.��d. Since�the�average�CBR�is�11,�the�graph�note�allows�the�surfacing�thickness�to�be�reduced�by�1�inch�leaving�a�
final�surfacing�thickness�of�9�inches.��e. Note�the�5�items�the�pavement�must�have�as�listed�in�the�upper�left�corner�of�the�graph�(minimum�
subgrade�CBR�of�5,�base�material�CBR�of�80�or�greater,�minimum�base�thickness�of�6�inches,�surfacing�material�of�either�HMA�or�PCC,�and�a�minimum�surfacing�thickness�from�the�graph).��
f. The�final�pavement�should�be�9�inches�of�HMA�or�PCC,�placed�on�at�least�6�inches�of�base�course�with�a�CBR�of�at�least�80,�placed�on�the�subgrade.��
421

Pavement Technologies Greenroads™ Manual v1.5
Long-Life Pavement PT-1
�Figure�PT�1.2:�Example�calculation.�
Example: HMA Pavements
Currently,�the�Asphalt�Pavement�Alliance�(APA)�has�a�“Perpetual�Pavement�Award”�given�nearly�annually�to�proven�long�lasting�pavements.�The�APA�defines�a�“Perpetual�Pavement”�as�“…an�asphalt�pavement�designed�and�built�to�last�longer�than�50�years�without�requiring�major�structural�rehabilitation�or�reconstruction,�and�needing�only�periodic�surface�renewal�in�response�to�distresses�confined�to�the�top�of�the�pavement.”�(APA,�2002).�All�pavements�that�receive�the�Perpetual�Pavement�Award�are�evaluated�for�structure,�condition,�maintenance�and�rehabilitation�efforts�to�ensure�they�meet�the�APA�requirements.�Awardees�for�2006,�which�can�serve�as�examples�of�in�service�long�lasting�pavements�were:�
� California�Department�of�Transportation�for�a�section�of�the�San�Diego�Freeway�(Interstate�405)�between�Harbor�Boulevard�and�Beach�Boulevard�
� Minnesota�Department�of�Transportation�for�Town�Highway�(TH)�61�between�Wabasha�and�Kellogg�� Montana�Department�of�Transportation�for�a�10�mile�length�of�Interstate�90�over�Homestake�Pass�� Nebraska�Department�of�Roads�for�a�5�mile�section�of�State�Highway�35�in�Wayne�County�� Tennessee�Department�of�Transportation�for�a�14�mile�section�of�State�Route�14�in�Tipton�County�� Virginia�Department�of�Transportation�for�a�6.5�mile�portion�of�Interstate�81�in�Frederick�County�
While�these�pavements�are�all�generally�higher�volume,�examples�of�a�low�volume�HMA�long�lasting�pavement�can�be�found�in�Muench�et�al.�(2004).�They�investigated�the�WSDOT�pavement�network�and�found�1,339�lane�miles�of�low�volume�pavement�of�which�a�majority�(about�64%)�had�been�in�service�for�over�35�years�without�having�undergone�reconstruction.�These�pavements�were�also�found�to�exist�in�all�areas�of�the�state�and�be�in�good�condition.�
0
2
4
6
8
10
12
14
16
18
20
10,000 100,000 1,000,000 10,000,000 100,000,000 1,000,000,000
Thic
knes
s (in
ches
)
Lifetime Eqivalent Single Axle Loads (ESALs)
Portland Cement Concrete Surfacing
Hot Mix Asphalt Surfacing
PCC Minimum7 inches (175 mm)
PCC Maximum13 inches (325 mm)
HMA Maximum14 inches (350 mm)
HMA Minimum6 inches (150 mm)
The pavement must have:
1. Minimum subgrade CBR = 52. Base material CBR = 80 or better3. Minimum base thickness = 6 inches (150 mm)4. Surfacing material = HMA or PCC5. Minimum surfacing thickness = from this graph
If subgrade CBR � 10 then surfacing thickness can be reduced by 1 inch (25 mm) from that shown on graph.
inf lection point: 500,000 ESALs
inf lection point: 870,000 ESALs
inf lection point: 50,000,000 ESALsinf lection point: 28,000,000 ESALs
Thic
knes
s (m
m)
100
200
400
300
422

Greenroads™ Manual v1.5 Pavement Technologies
PT-1 Long-Life Pavement
Example: PCC Pavements
It�may�be�more�likely�that�a�PCC�pavement�will�be�designed�for�at�least�35�years.�The�NCHRP�Report�1�32�lists�7�states�in�1997�that�already�used�PCC�pavement�design�lives�of�at�least�35�years.�Even�PCC�pavements�designed�for�shorter�lives�often�last�in�excess�of�35�years.�For�instance,�most�of�the�State�owned�PCC�pavements�in�Washington�State�were�designed�for�20�years�but�have�lasted�much�longer:�there�are�over�400�lane�miles�of�PCC�pavement�in�Washington�State�that�are�already�older�than�35�years�and�are�still�functioning.�There�are�many�examples�of�this�type�of�performance�nationwide�including:��
� I�80�(Grundy�County),�I�70�(Clark�County),�I�290�(Cook�County),�I�80�(Grundy�County)�and�I�74�(Peoria�County)�in�Illinois�(Winkelman,�2006).�
� The�Motorway�E40�from�Brussels�to�Leige�in�Belgium�(Caestecker,�2006)�� US�40/�I�80�in�Fairfield,�CA�(Rao,�et�al.,�2006)�
Additionally,�many�cities�that�surface�their�residential�streets�with�PCC�have�experienced�long�life.�For�example,�the�City�of�Seattle�paved�many�urban�streets�with�concrete�before�1940�and�many�of�those�are�still�in�service�(Flynn,�2002).�Some�remain�in�their�original�state�while�others�have�been�covered�up�by�subsequent�layers�of�HMA.�However,�in�nearly�all�cases�the�original�PCC�pavement�remains�in�some�fashion.��
POTENTIAL ISSUES
1. In�many�applications�an�adequate�pavement�design�may�not�call�for�hot�mix�asphalt�(HMA)�or�portland�cement�concrete�(PCC)�surfacing.�These�include�gravel,�dirt�or�bituminous�surface�treated�(BST)�roads.�This�credit�does�not�apply�to�these�roads�even�though�these�surfaces�may�be�the�most�appropriate�for�the�given�project.�However,�the�design�approach�is�still�applicable�and�appropriate�for�such�projects.��
2. Some�commonly�used�pavement�design�methods�may�produce�pavement�thicknesses�that�do�not�meet�the�requirements�of�this�graph.�Such�designs�do�not�qualify�for�this�credit�even�though�they�conform�to�common�pavement�design�practice.�
3. The�idea�that�pavement�design�can�be�reduced�to�a�single�graph�may�be�controversial�among�experts.�However�it�is�a�necessary�compromise�in�order�to�engage�decision�makers�who�may�otherwise�arrive�at�inadequate�pavement�designs�driven�by�budgetary�constraints�or�unfamiliarity�with�the�concepts�of�long�lasting�design.�
RESEARCH A�“long�lasting�pavement”�is�one�where�the�bulk�of�the�pavement�structure�is�designed�to�last�for�at�least�35�years.�The�only�required�maintenance�and�rehabilitation�actions�are�periodic�surface�renewals�to�address�roughness�and�surface�distress.�This�definition�is�taken�largely�from�the�Asphalt�Pavement�Alliance�(APA,�2002).��
This�is�in�contrast�to�the�historical�practice�of�designing�pavements�for�shorter�lives�(often�10�to�20�years)�and�then�reconstructing�the�entire�pavement�structure�at�the�end�of�life.�Part�of�National�Cooperative�Highway�Research�Program�(NCHRP)�Project�1�32,�Systems�for�Design�of�Highway�Pavements�(1997),�consisted�of�a�survey�of�U.S.�state�department�of�transportation�(DOT)�pavement�design�practices.�This�survey�showed�that�most�state�DOTs�use�pavement�design�lives�of�20�to�30�years�(Figure�PT�1.3).�Based�on�the�35�year�cutoff�of�this�credit,�most�of�these�design�lives�do�not�qualify�as�“long�life.”�However,�since�1997�the�general�trend�has�been�to�design�pavements�for�longer�life.�For�example,�the�Minnesota�DOT�has�extended�its�PCC�pavement�design�life�standard�from�35�to�60�years�(Burnham�et�al.,�2006).��
Long�lasting�pavements�generally�lead�to�higher�initial�costs�(due�to�more�material�being�used)�but�lower�lifecycle�costs�because�less�rehabilitation�and�maintenance�is�needed�over�time.�Both�HMA�and�PCC�surfaced�pavements�can�be�long�lasting�according�to�this�description.��
For�low�volume�HMA�pavements�Muench�et�al.�(2004)�performed�a�lifecycle�cost�comparison�conforming�to�the�guidelines�of�Walls�and�Smith�(1998)�between�an�archtype�long�lasting�low�volume�pavement�with�one�that�was�
423

Pavement Technologies Greenroads™ Manual v1.5
Long-Life Pavement PT-1
designed�to�be�reconstructed�after�25�years.�They�used�typical�Washington�State�Department�of�Transportation�(WSDOT)�design�characteristics�and�found�a�cost�savings�over�50�years�of�about�25%�for�the�long�lasting�pavement.��
�Figure�PT�1.3:�Pavement�design�lives�taken�from�NCHRP�Project�1�32�survey.�
�Looking�at�just�the�performance�life�of�the�pavement�surface�(often�called�the�“wearing�course,“�the�Organisation�for�Economic�Co�operation�and�Development�(OECD)�(2005)�concluded�that�developing�long�lasting�surface�courses�that�cost�three�times�as�much�as�traditional�ones�(e.g.,�the�ones�in�use�today)�that�would�only�require�resurfacing�every�30�40�years�would�generally�be�economically�viable�for�traffic�levels�of�at�least�70,000�to�80,000�AADT�in�both�directions.�With�discount�rates�below�6%�they�could�be�viable�between�40,000�and�60,000�AADT�in�both�directions.�In�general,�economic�savings�increases�as�traffic�levels�increase�and�as�discount�rates�decrease.��
Development�of�Figure�PT�1.1�Figure�PT�1.1�was�developed�based�on�output�from�a�number�of�generally�accepted�pavement�design�methods�(AASHTO,�1993;�Muench�et�al.,�2007;�Timm,�2007;�Asphalt�Institute,�1981;�Nunn,�1998)�and�is�an�attempt�to�capture�the�basic�pavement�structure�that�is�likely�to�result�in�long�life.�Figure�PT�1.4�shows�how�Figure�PT�1.1�was�developed�using�these�design�methods.�Pavements�designed�according�to�Figure�PT�1.1�are�likely�to�be�long�lasting�pavements�and�thus�result�in�lower�lifecycle�costs.�Additionally,�design�thicknesses�and�subgrade�requirements�are�straightforward.�
�The�design�assumptions�that�were�used�to�develop�Figure�PT�1.4�are�summarized�here.�
1993�AASHTO�Rigid�Design�(AASHTO,�1993)�� Reliability�=�75%�for�designs�of�500,000�ESALs�or�less.��� Reliability�=�85%�for�designs�>�500,000�and�<�20,000,000�ESALs.��� Reliability�=�95%�for�designs�of�20,000,000�ESALs�or�more.��� PCC�modulus�(Ec)�=�4,000,000�psi��� PCC�modulus�of�rupture�(S'c)�=�700�psi��� Drainage�coefficient�(Cd)�=�1.0��� Load�transfer�coefficient�(J)�=�3.2�� Modulus�of�subgrade�reaction�(k)�=�200�psi/inch��� Base�thickness�=�6�inches�of�granular�base�material��
3
1
27
6
2
18
13
5
2
0
5
10
15
20
25
30
5 10 15 20 25 30 35 40 More
Num
ber�o
f�States
Design�Life
HMAPCC
424

Greenroads™ Manual v1.5 Pavement Technologies
PT-1 Long-Life Pavement
Figure�PT�1.4�Development�of�graph�using�existing�design�methods.��
1993�AASHTO�Flexible�Design�(AASHTO,�1993)�� Reliability�=�75%�for�designs�of�500,000�ESALs�or�less.��� Reliability�=�85%�for�designs�>�500,000�and�<�20,000,000�ESALs.��� Reliability�=�95%�for�designs�of�20,000,000�ESALs�or�more.��� Change�in�servicability�over�the�pavement�life�(delta�PSI)�=�1.5��� HMA�structural�coefficient�(a�HMA)�=�0.44��� Granular�base�material�structural�coefficient�(a�base)�=�0.13��� Granular�base�material�resilient�modulus�(MR)�=�30,000�psi��� Base�thickness�=�6�inches�of�granular�base�material��� Subgrade�CBR�=�5,�equivalent�to�a�subgrade�MR�=�7,500�psi��
Asphalt�Institute�MS�1�(Asphalt�Institute,�1981)�� Design�table:�HMA�over�6�inches�of�untreated�granular�base�material�with�MAAT�=�60F��� Design�Chart�A�29�in�MS�1��
Low�Volume�roads�(Muench�et�al.,�2007)��� The�plot�for�“Honolulu,�low�volume”�comes�from�the�City�and�County�of�Honolulu�design�standards�that�
were�developed�as�described�in�this�paper.��
TRL�standards�(as�reported�by�Nunn,�1998)�The�plots�for�the�various�“Nunn,�1998”�come�from�the�TRL�standards.��
� The�full�report�(Report�250)�can�be�found�at:�http://www.trl.co.uk/online_store/reports_publications/trl_reports/cat_highway_engineering/report_design_of_long�life_flexible_pavements_for_heavy_traffic.htm��
425

Pavement Technologies Greenroads™ Manual v1.5
Long-Life Pavement PT-1
� A�version�of�the�graph�used�(from�Figure�8�on�page�9�of�10)�to�get�the�values�plotted�above�can�be�seen�at:�http://www.transport�links.org/transport_links/filearea/publications/1_764_PA3736_2001.pdf.��
GLOSSARY
AADT� Annual�average�daily�trafficAASHTO� American�Association�of�State�Highway�and�Transportation�OfficialsADT� Average�daily�trafficAPA� Asphalt�Pavement�AllianceBST� bituminous�surface�treatmentCBR� California�Bearing�RatioDOT� department�of�transportationESAL� Equivalent�single�axle�loadHMA� Hot�mix�asphaltLong�life�pavement� any�pavement�design�that�falls�on�or�above�the�plotted�line�for�the�given�
pavement�type�and�meets�the�criteria�described�in�the�PT�1.1�graph�MR� Resilient�modulusNCHRP� National�Cooperative�Highway�Research�ProgramPCC� Portland�cement�concreteR�value� Resistance�value�
REFERENCES American�Association�of�State�Highway�and�Transportation�Officials�(AASHTO).�AASHTO�Guide�for�Design�of�
Pavement�Structures.�AASHTO,�Washington,�DC,�1993.��
Asphalt�Institute.�Thickness�Design.�MS�1.�Asphalt�Institute,�Lexington,�KY,�1981.�
Asphalt�Pavement�Alliance�(APA).�(2002).�Perpetual�Pavements:�A�Synthesis.�Asphalt�Pavement�Alliance,�Lanham,�MD.�
Burnham,�T.,�Izevbekhai,�B.�&�Rangaraju,�P.R.�(2006).�The�Evolution�of�High�Performance�Concrete�Pavement�Design�in�Minnesota.�Proceedings�of�the�International�Conference�on�Long�Life�Concrete�Pavements,�Chicago,�IL,�25�27�October�2006.�P.�135�151.�
Caestecker,�C.�(2006).�The�Motorway�E40�(Formerly�E5)�From�Brussels�to�Liege.�Proceedings�of�the�International�Conference�on�Long�Life�Concrete�Pavements,�Chicago,�IL,�25�27�October�2006,�pp.�221�232.�
Flynn,�P.A.�(2002).�Seattle’s�Early�Streets�1870�1920.�Research�paper,�University�of�Washington,�Seattle,�WA.��
Muench,�S.T.,�Mahoney,�J.P.,�Wataru,�W.,�Chong,�L.�&�Romanowski,�J.�(2007).�Best�Practices�for�Long�Lasting�Low�Volume�Pavements.�Journal�of�Infrastructure�Systems,�Vol.�13,�No.�4.�pp.�311�320.�
Muench,�S.T.,�White,�G.C.,�Mahoney,�J.P.,�Pierce,�L.M.�&�Sivaneswaran,�N.�(2004).�Long�Lasting�Low�Volume�Pavements�in�Washington�State.�Proceedings,�International�Symposium�on�Design�and�Construction�of�Long�Lasting�Asphalt�Pavements,�Auburn,�AL,�June�7�9,�2004,�pp.�729�773.��
Nunn,�M.�(1998).�Design�of�Long�Life�Roads�for�Heavy�Traffic.�Proceedings,�Australian�Asphalt�Pavement�Association�Industry�Conference,�Surfers�Paradise,�Queensland,�Australia.�
Organisation�for�Economic�Co�operation�and�Development�(OECD).�(2005).�Economic�Evaluation�of�Long�Life�Pavements,�Phase�1.�OECD�Publishing,��
426

Greenroads™ Manual v1.5 Pavement Technologies
PT-1 Long-Life Pavement
Rao,�C.,�Darter,�M.I.�&�Pyle,�T.�(2006).�Extended�Service�Life�of�Continuously�Reinforced�Concrete�Pavement�in�California.�Proceedings�of�the�International�Conference�on�Long�Life�Concrete�Pavements,�Chicago,�IL,�25�27�October�2006,�pp.�61�78.�
Timm,�D.H.�PerRoad�3.2.�Perpetual�Pavement�Design�Software.�National�Center�for�Asphalt�Technology�(NCAT),�Auburn�University,�Auburn,�AL,�2006.�
Walls,�J.�&�Smith,�M.R.�(1998).�Life�Cycle�Cost�Analysis�in�Pavement�Design�–�Interim�Technical�Bulletin.�FHWA�report�FHWA�SA�98�079.�Federal�Highway�Administration,�Washington,�D.C.�
Winkelman,�T.J.�(2006).�Design�and�Construction�of�Extended�Life�Concrete�Pavements�in�Illinois.�Proceedings�of�the�International�Conference�on�Long�Life�Concrete�Pavements,�Chicago,�IL,�25�27�October�2006,�pp.�3�18.�
� �
427

Pavement Technologies Greenroads™ Manual v1.5
Long-Life Pavement PT-1
�
428

Greenroads™ Manual v1.5 Pavement Technologies (PT)
PT-2 Permeable Pavement
PERMEABLE PAVEMENT GOAL Improve�flow�control�and�quality�of�stormwater�runoff�through�use�of�permeable�pavement�technologies.��
CREDIT REQUIREMENTS Use�a�permeable�(porous)�pavement�or�pavers�to�control�and�treat�at�least�50%�of�the�90th�percentile�average�annual�rainfall�event�post�construction�runoff�volume�to�25�mg/L�concentration�of�total�suspended�solids�(TSS)�or�less.�
Details
Low�impact�development�(LID)�stormwater�controls�must�be�considered�in�the�scope�and�budget�of�the�project�for�this�credit�to�be�applicable�AND�permeable�pavement�must�be�considered�a�feasible�design�best�management�practice�within�the�stormwater�management�plan.�This�means�that�the�feasibility�study�completed�for�PR�8�Low�Impact�Development�must�clearly�show�that�permeable�pavement�(of�any�type)�is�appropriate�for�application�on�the�project.�
DOCUMENTATION � Copy�of�the�drainage�or�hydrology�report�and�supporting�calculations�showing�
treatment�area�and�percent�treatment�achieved.�This�document�may�be�included�as�part�of�the�submittal�requirements�for�PR�8�Low�Impact�Development,�but�relevant�permeable�pavement�calculations,�areas,�and�treatment�levels�should�be�highlighted�for�this�credit.�
� Copy�of�the�permeable�pavement�mix�design.�The�mix�design�should�have�the�following�items�highlighted:�
� Name�of�permeable�technology,�if�used�(e.g.�pavers,�turf,�etc.)�� Total�tons�of�pavement�on�the�project,�including�portland�cement�concrete�and�
asphalt�concrete�(hot,�warm�and�cold�mix)�� Total�air�voids�in�the�mix�(or�manufacturer�tested�voids�specifications�for�pavers�
based�on�method�of�installation)�� Total�tons�of�permeable�pavement�used�
� Copy�of�the�maintenance�plan�in�place�for�the�permeable�pavement(s).�� Photo�of�the�permeable�pavement(s)�installed�on�the�project.�
PT-2
3 POINTS
RELATED CREDITS
� PR�8�Low�Impact�Development�
� EW�2�Runoff�Flow�Control�
� EW�3�Runoff�Quality�� EW�4�Stormwater�
Cost�Analysis�� PT�4�Cool�Pavement�� PT�5�Quiet�Pavement
SUSTAINABILITY COMPONENTS
� Ecology�� Expectations�� Experience�
BENEFITS
� Reduces�Water�Pollution�
� Restores�Habitat�� Creates�Habitat�� Reduces�Manmade�
Footprint�� Increases�Aesthetics�
429

Pavement Technologies (PT) Greenroads™ Manual v1.5
Permeable Pavement PT-2
APPROACHES & STRATEGIES
Following�some�of�these�key�design�and�maintenance�elements�will�promote�maximum�performance�of�permeable�pavements.�(Pennsylvania�Department�of�Environmental�Protection:�PDEP,�2006)�
Design�Elements�� Use�a�mix�design�for�the�pavement�with�significant�permeability�(>�8�inches�per�hr).�� Use�an�open�graded�subbase�with�minimum�40%�void�space�(typically�a�washed�aggregate).�� Design�the�pavement�surface�and�stone�bed�to�suitable�for�design�traffic�loads.�� Ensure�placement�on�uncompacted�sub�grade.�� Use�nonwoven�geotextile�underlayments.�� Use�level�infiltration�bed�bottoms�to�prevent�pooling.�� Do�not�place�on�trafficked�slopes�with�grades�over�>5%�(without�careful�design).�� Provide�positive�stormwater�overflow�from�beds.�� Do�not�place�bed�bottom�on�compacted�fill;�fill�with�stone,�as�needed.�� Protect�from�sedimentation�during�construction.�� Line�bed�with�nonwoven�geotextile.�� Provide�perforated�pipe�network�along�bed�bottom�for�distribution.�� Allow�three�foot�buffer�between�bed�bottom�and�seasonal�high�ground�water�table�and�two�feet�for�bedrock.�� Place�infiltration�beds�on�upland�soils�when�possible.�� Attempt�to�make�periodic�maintenance�easy�for�owners�in�the�design�process.�Pavement�areas�should�be�
accessible�and�slope�gradually�to�accommodate�standard�maintenance�vehicles.��
Clog�Prevention�Maintenance�� Vacuum�the�pavement�twice�per�year�(or�align�with�rainy�season).�� Maintain�planted�areas�adjacent�to�pavement.�� Immediately�clean�any�soil�deposited�on�pavement.�� Do�not�allow�construction�staging,�soil/mulch�storage,�etc.�on�unprotected�pavement�surface.�� Clean�inlets�draining�to�the�subsurface�bed�twice�per�year.�
Winter�Snow/Ice�Removal�� Monitor�the�permeable�pavement�in�the�winter.�Porous�pavement�systems�generally�perform�better�and�
require�less�treatment�than�standard�pavements.�� Do�not�apply�abrasives�such�as�sand�or�cinders�on�or�adjacent�to�porous�pavement.�� Place�snowplow�blades�slightly�higher�than�for�conventional�pavements.�� Apply�salt�as�necessary;�however,�keep�in�mind�that�salts�will�infiltrate,�so�organic�deicers�are�preferable.�
Maintenance�Repairs�� Do�not�seal�coat�permeable�pavement�surfaces.�� Patch�damaged�areas�less�than�50�square�feet�with�porous�or�standard�pavement.�� Patch�damaged�areas�larger�than�50�square�feet�with�an�approved�permeable�pavement.�
Example: Types of Permeable Pavement
Porous�Asphalt�Porous�asphalt,�developed�about�1970,�greatly�resembles�non�porous�asphalt�except�the�fines�(very�fine�sand�and�dust)�have�been�removed,�leaving�additional�air�voids�where�the�fines�would�have�been.�This�leaves�space�for�water�to�flow�through�and�collect.�Large�aggregate�is�also�used�to�raise�the�void�space.�Asphalt�is�typically�designed�with�a�small�amount�of�air�voids,�typically�4%�of�the�total�mix�volume,�in�order�to�allow�the�binder�to�migrate�a�little.�The�binder�remains�somewhat�soft�long�after�pavement�is�laid,�and�sometimes�moves�into�these�voids,�which�is�called�migration.�There�were�problems�in�the�past�with�early�porous�asphalt,�as�the�binder�would�migrate�into�the�higher�void�spaces,�blocking�the�travel�path�of�the�water.�This�has�been�ameliorated�
430

Greenroads™ Manual v1.5 Pavement Technologies (PT)
PT-2 Permeable Pavement
with�the�use�of�additives�and�additional�binders.�(North�Carolina�Department�of�Environment�and�Natural�Resources,�2007;�Hun�Dorris,�2005)��
Additives�and�additional�binders�are�often�used�to�enhance�the�characteristics�of�porous�asphalt.�Polymers�keep�the�binder�from�migrating�into�the�void�spaces.�Polymer�reinforcing�fibers�assist�with�cohesion�of�the�mix.�(Hun�Dorris,�2005)��
Figure�PT�2.1:��The�appearance�of�porous�asphalt�is�much�the�same�as�non�porous�asphalt.�The�porous�asphalt�is�placed�over�course�of�porous�aggregate�beneath�a�temporary�geotextile�fabric,�which�is�to�prevent�
clogging�issues�during�construction.�(Photo�by�K.�Hansen,�National�Asphalt�Pavement�Alliance)��
Porous�Concrete�Porous�concrete,�much�like�porous�asphalt,�has�the�fines�removed�in�order�to�create�voids.�It�was�also�developed�in�the�70s.�Portland�cement�concrete�(PCC)�is�typically�made�with�coarse�aggregate�(gravel),�fine�aggregate�(sand),�water,�cement,�and�optional�additives.�In�porous�concrete,�the�fines�are�greatly�reduced�or�entirely�removed.�Fifteen�to�twenty�five�percent�(15�25%)�void�spaces�may�be�achieved,�with�an�average�flow�rate�of�around�480�inches��per�hr.�(Hun�Dorris,�2005)�The�appearance�of�porous�PCC�is�generally�rougher�than�nonporous.�See�Figure�PT�2.2.�Finishing�during�the�construction�process�may�create�an�impervious�layer�on�the�surface�and�attention�needs�to�be�paid�to�the�process�to�prevent�this�from�happening.��
431
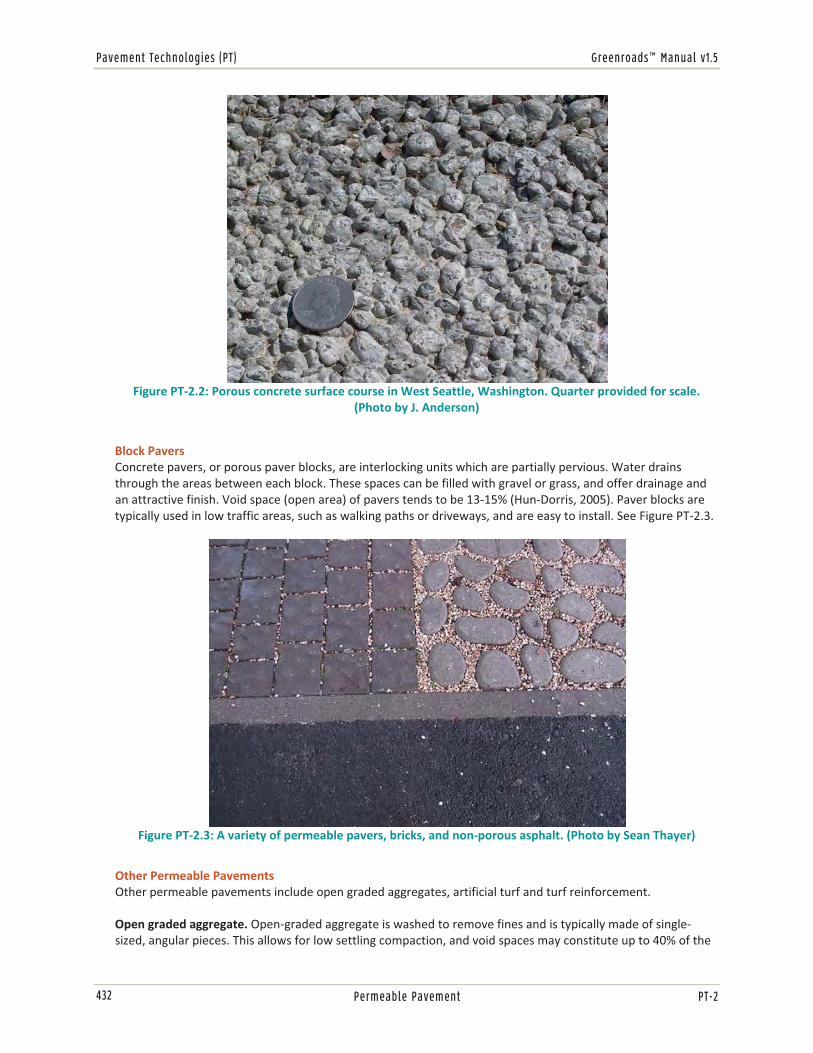
Pavement Technologies (PT) Greenroads™ Manual v1.5
Permeable Pavement PT-2
Block�Pavers�Concrete�pavers,�or�porous�paver�blocks,�are�interlocking�units�which�are�partially�pervious.�Water�drains�through�the�areas�between�each�block.�These�spaces�can�be�filled�with�gravel�or�grass,�and�offer�drainage�and�an�attractive�finish.�Void�space�(open�area)�of�pavers�tends�to�be�13�15%�(Hun�Dorris,�2005).�Paver�blocks�are�typically�used�in�low�traffic�areas,�such�as�walking�paths�or�driveways,�and�are�easy�to�install.�See�Figure�PT�2.3.�
�Figure�PT�2.3:�A�variety�of�permeable�pavers,�bricks,�and�non�porous�asphalt.�(Photo�by�Sean�Thayer)�
�
Other�Permeable�Pavements�Other�permeable�pavements�include�open�graded�aggregates,�artificial�turf�and�turf�reinforcement.�
Open�graded�aggregate.�Open�graded�aggregate�is�washed�to�remove�fines�and�is�typically�made�of�single�sized,�angular�pieces.�This�allows�for�low�settling�compaction,�and�void�spaces�may�constitute�up�to�40%�of�the�
�Figure�PT�2.2:�Porous�concrete�surface�course�in�West�Seattle,�Washington.�Quarter�provided�for�scale.�
(Photo�by�J.�Anderson)�
432

Greenroads™ Manual v1.5 Pavement Technologies (PT)
PT-2 Permeable Pavement
material.�Open�graded�aggregate�is�extremely�permeable.�This�kind�of�base�has�a�strong�tendency�to�segregate�and�steps�must�be�taken�through�production,�transport,�and�placement�to�offset�this�tendency.�Regularly�wetting�the�stone�through�the�laydown�and�compaction�processes�keeps�the�material�more�stable.�
�Figure�PT�2.4:��Washed�aggregate�base�with�keys�for�scale.�
�Artificial�turf.�Artificial�turf�is�typically�the�topmost�layer�of�one�or�more�other�permeable�layers,�such�as�open�graded�aggregate.�Artificial�turf�is�rolled�out�in�large�sheets�(see�following�photos)�and�pinned�to�the�underlayer.�The�seams�between�lengths�of�turf�are�stitched.�Artificial�turf�typically�lasts�for�12�to�15�years.�
Figure�PT�2.5:�Permeable�artificial�turf�(keys�for�scale).�This�material�is�typically�laid�over�a�base�of�
washed�open�graded�aggregate.��
Figure�PT�2.6:�Underside�of�permeable�artificial�turf,�showing�drainage�holes.�
�
Turf�reinforcement.�Similarly,�turf�reinforcement��(commonly�called�“geogrid”)�is�typically�achieved�via�an�open�plastic�grid�or�honeycomb�matrix�that�is�filled�with�gravel�at�the�surface,�placed�on�a�well�draining�aggregate,�over�a�layer�of�geosynthetic�filter�fabric,�and�finally�on�top�of�a�well�draining�soil�subbase.�Usually�these�installations�are�most�common�in�gravel�parking�areas�or�emergency�accessways�that�need�a�bit�of�extra�reinforcement�in�order�to�carry�a�(low�volume)�vehicle�load.�We�do�not�expect�many�Greenroads�projects�to�be�made�of�turf�or�geogrids�or�gravel,�but�these�methods�are�technically�valid�and�may�be�appropriate�for�pedestrian�areas�within�the�project�right�of�way.�See�Figure�PT�2.7.�
433

Pavement Technologies (PT) Greenroads™ Manual v1.5
Permeable Pavement PT-2
�Figure�PT�2.7:�Turf�reinforcing�grid�installed�in�gravel�parking�area�in�Pennsylvania�to�alleviate�ponding�
issues.�(Blair�County�Conservation�District,�n.d.)��
Semi�Permeable�Materials�Not�Suitable�for�Roadway�Traffic�For�purposes�of�this�credit,�we�do�not�expect�many�Greenroads�projects�to�be�made�of�timber�decking,�wood�mulch,�shells�or�turf.�These�materials�may�be�installed�on�a�project�as�part�of�a�low�impact�development�scheme�(to�reduce�actual�impervious�surfaces,�such�as�conventional�concrete�sidewalks);�however,�areas�made�with�these�materials�do�not�count�toward�points�in�this�credit.�
Soft�materials.�Soft�paving�materials,�such�as�wood�mulch�and�crushed�shells,�are�typically�used�for�foot�traffic.�High�void�spaces�allow�for�good�permeability,�and�such�materials�tend�to�offer�great�aesthetic�benefits.�
Timber�Decking.�Decks�allow�for�ease�of�walking�through�swampy�or�sandy�areas�while�creating�very�low�environmental�impact�structures.�Wooden�structures�are�also�natural�looking�and�aesthetically�pleasing.�
POTENTIAL ISSUES
1. Clogging�of�voids�in�the�pavement.�Routine�maintenance�is�recommended�to�help�prevent�clogging�and�optimize�infiltration�rates.�
2. Quality�control�and�contractor�familiarity�varies�widely�with�location,�contractor�and�pavement�type.�3. Pre�existing�groundwater�issues�may�not�allow�permeable�pavements�within�certain�distances�of�aquifers.�
However,�quality�treatment�is�provided�by�permeable�pavements�to�some�extent.�4. Long�term�data�is�generally�not�available.�5. Permeable�pavements�may�not�be�suitable�for�high�volume�traffic�loads�or�arterials.�However,�shoulder�areas�
and�sidewalks�may�be�appropriate�applications�to�consider.�
RESEARCH Permeable�pavement�is�a�low�impact�development�technique�that�can�be�used�as�part�of�a�comprehensive�roadway�stormwater�management�plan.�The�terms�“permeable,”�“porous”�or�“pervious”�are�used�interchangeably�to�describe�a�pavement�structural�system�that�has�more�voids�than�a�conventional�paved�surface�such�as�concrete�or�asphalt.�For�stormwater�design,�permeable�implies�that�the�curve�number�(CN)�for�areas�paved�with�these�surface�materials�is�lower�than�a�conventionally�paved�surface.�For�composite�mixes,�such�as�asphalt�and�concrete,�this�generally�means�intentionally�designing�for�a�higher�void�ratio�in�the�mix,�i.e.�fewer�fine�aggregates,�larger�coarse�aggregate�or�introduction�of�air�during�mixing.�
434

Greenroads™ Manual v1.5 Pavement Technologies (PT)
PT-2 Permeable Pavement
A�permeable�surface�may�also�be�achieved�through�a�strategic�layout�of�stone�or�masonry�pavers�and�filling�paver�gaps�with�a�well�draining�material,�which�may�be�designed�to�withstand�vehicular�loading.�This�also�provides�an�increase�in�overall�void�ratio�over�a�large�surface�area.�Further,�artificial�turf�or�grid�reinforcement�are�other�types�of�surfaces�that�may�also�be�considered�permeable�“pavements,”�but�in�general�for�roadways�that�carry�high�volumes�of�traffic,�there�is�no�long�term�performance�data�to�justify�that�they�offer�enough�structural�capacity�to�carry�those�loads.�Generally,�the�latter�applications�will�be�seen�most�commonly�in�pedestrian�areas�or�areas�with�very�low�traffic�volumes.�
How�Do�Permeable�Pavements�Work?�Due�to�the�increased�void�ratio,�water�is�conveyed�through�the�surface�and�allowed�to�(1)�infiltrate,�(2)�evaporate,�whereas�conventional�surfaces�will�not�do�so.�(NCDWQ,�2007)�A�permeable�pavement�surface�therefore�becomes�an�active�participant�in�the�hydrological�cycle:�rainfall�and�snowmelt�are�conveyed�back�through�soils�into�groundwater.��Therefore,�permeable�pavements�can�become�part�of�a�stormwater�infiltration�system�if�appropriately�designed,�constructed�and�maintained.�This�means�that�key�elements�of�the�pavement�must�be�considered:�(1)�long�term�hydraulic�capacity�of�the�material,�and�(2)�infiltration�capacity�of�the�base�material.�(City�of�Seattle,�2008)�
Permeable�pavements�allow�rainwater,�snowmelt�and�air�to�pass�through�the�matrix,�recharging�the�groundwater�table�and�refreshing�soil�nutrients.�This�reduces�total�volume�of�runoff�flows�leaving�the�paved�surface.�The�void�space�captures�water�and�slowly�releases�it�to�infiltrate�the�subgrade.�This�filtration�process�reduces�the�total�quantity�and�concentration�(generally)�of�pollutants�that�would�otherwise�runoff�the�paved�surface�and�require�treatment,�volume�control�and�flow�attenuation.�Typical�pollutants�removed�or�improved�are�hydrocarbons�and�heavy�metals,�(Hun�Dorris,�2005)�as�well�as�a�number�of�other�chemical�compounds�that�are�considered�deleterious.�(Geosyntec�Consultants�and�Wright�Water�Engineers,�2008)��
The�air�voids�also�allow�for�evaporation,�which�offers�a�cooling�process�on�the�surface�and�to�the�stormwater�runoff.�This�is�especially�beneficial�in�cities�which�experience�extremely�high�temperatures�in�summer���traditional�"blacktop"�temperatures�can�make�some�public�spaces�unusable�in�warmer�weather.�(Hun�Dorris,�2005)�
Existing�Literature�Stormwater�quality�and�quantity�performance�data�is�relatively�sparse�for�permeable�pavements,�especially�for�long�term�data.�“Long�term”�performance�data�(6�years)�is�available�from�four�different�pervious�paver�and�turf�reinforcing�grid�systems�installed�in�urban�parking�lots�in�western�Washington�from�Brattebo�and�Booth�(2003).�These�lots�were�originally�tested�by�Booth�and�Leavitt�(1999)�in�1997.�Site�soils�were�sands�with�a�high�hydraulic�conductivity�to�isolate�the�pavement�hydraulic�conductivity.�These�two�studies�showed�significantly�or�completely�reduced�surface�runoff�for�winter�storm�conditions�even�long�term,�except�in�one�condition�measured�in�the�revisit�by�Brattebo�and�Booth:�a�72�hour�storm�produced�about�four�millimeters�of�surface�flow.�
In�the�UK,�a�porous�asphalt�parking�lot�was�tested�in�place�and�monitored�for�flow�control�performance�over�a�13�month�period.�The�results�indicated�that�the�pavements�reduced�peak�flows�and�increased�time�of�concentration.�(Abbott�&�Camino�Mateos,�2003)�A�relatively�recent�study�of�another�porous�asphalt�parking�lot�in�Rhode�Island�by�Boving�et�al.�(2008)�investigated�the�potential�for�contaminants�to�leach�from�the�lot�into�the�groundwater�table�directly�below�the�lot’s�infiltration�bed.�They�found�a�retention�rate�of�more�than�90%�for�metals,�no�bacteria,�and�a�much�lower�rate�for�nutrients�(27%).�However,�they�detected�polycyclic�aromatic�hydrocarbons�(PAHs)�at�near�minimum�allowable�levels.��
Information�on�pavement�structural�performance�in�high�traffic�volume�roadway�environments�is�very�limited.�Open�graded�surface�courses�(OGFC)�in�Oregon�have�traditionally�been�installed�to�reduce�noise�and�spray.�However,�they�may�theoretically�also�reduce�surface�flows�via�horizontal�hydraulic�conductivity,�which�occurs�below�the�surface�course�and�moves�water�to�the�shoulder�areas,�but�this�has�not�been�well�studied.�(City�of�Seattle,�2008)��
435

Pavement Technologies (PT) Greenroads™ Manual v1.5
Permeable Pavement PT-2
However,�the�International�Stormwater�BMP�(Best�Management�Practice)�database�(BMPDB)�reports�that,�of�six�reporting�permeable�pavement�sites,�quality�indicators�for�effluent�heavy�metal�and�total�suspended�solid�concentration�were�as�follows�(shown�compared�to�a�detention�pond)�based�on�median�values�from�mean�effluent�concentrations.�For�comparison,�ranges�are�also�provided.�
Table�PT�2.1:�Constituent�removal�performance�data�for�6�permeable�pavement�installations�and�25�detention�ponds.�(GeoSyntec�Consultants�and�Wright�Water�Engineers,�2008)�Constituents� Unit� Value� Permeable�Pavement�Effluent
(6�reporting)�Detention�Pond�Effluent�(25�reporting)�
Relative�Removal�(%)�
Suspended�Solids� (mg/L)� Median� 16.96 31.04 183Range� 5.90�– 8.72 16.07�– 46.01� ��
Total�Copper� (μg/L)� Median� 2.78 12.10 435Range� 0.88�– 8.78 5.41�– 18.80 ��
Total�Lead� (μg/L)� Median� 7.88 15.77 200Range� 1.64�– 37.96 4.67�– 26.87 ��
Total�Zinc� (μg/L)� Median� 16.60 60.20 363Range� 5.91�– 46.64� 20.70�– 99.70� ��
Total�Phosphorus� (mg/L)� Median� 0.09 0.19 211Range� 0.05�– 0.15� 0.12�– 0.27 ��
TKN� (mg/L)� Median� 1.23 1.89 154Range� 0.44�– 3.44 1.58�– 2.19 ��
�In�all�six�quality�measures�tested,�permeable�pavement�installations�treated�effluent�stormwater�to�a�higher�level�of�treatment�than�conventional�detention�ponds.�Note�that�data�for�these�statistics�comes�from�15�U.S.�states�and�also�the�United�Kingdom�(UK)�and�Sweden,�but�neither�the�locations�nor�the�types�of�these�permeable�pavements�were�specified,�nor�were�the�storm�conditions�when�these�data�were�measured.�Additionally,�data�was�not�provided�for�influent�treatment�levels�because�it�was�not�measured�for�the�pavements�or�there�were�not�enough�samples�for�statistical�analysis.�However,�the�BMPDB�maintains�a�working�database�and�it�is�currently�updating�statistics�for�2009.�
Finally,�studies�on�safety�are�also�limited.�One�study�of�safety�of�surface�course�porous�asphalt�in�Europe�(where�permeable�pavements)�are�more�common�was�inconclusive�due�to�inconsistent�reporting.�(Elvik�and�Greibe,�2005)�
Permeable�Pavement�Benefits�Permeable�pavements�offer�many�benefits,�both�aesthetic�and�practical.�These�include�(Charles�River�Watershed�Association:�CWRA,�2008):�
� Reduces�stormwater�runoff,�total�water�volume,�and�flowrate��� Treats�water�runoff,�including�reduction�of�temperature�� Increases�groundwater�infiltration�and�recharge��� Provides�local�flood�control��� Improves�the�quality�of�local�surface�waterways��� Reduces�soil�erosion��� Reduces�the�need�for�traditional�stormwater�infrastructure,�which�may�reduce�the�overall�project�cost��� Increases�traction�when�wet��� Reduces�splash�up�in�trafficked�areas��� Extends�the�life�of�paved�area�in�cold�climates�due�to�less�cracking�and�buckling�from�the�freeze�thaw�cycle��� Reduces�the�need�for�salt�and�sand�use�during�the�winter,�due�to�little�or�no�black�ice��� Requires�less�snow�plowing��� Reduces�groundwater�pollution��� Creates�greenspace�(grass�groundcover,�shade�from�tree�canopies,�etc.)��
436

Greenroads™ Manual v1.5 Pavement Technologies (PT)
PT-2 Permeable Pavement
� Offers�evaporative�cooling��� Porous�pavements�reduce�the�volume�of�stormwater,�increase�the�recharge,�control�the�peak�rate,�and�offer�a�
high�outflowing�water�quality.�� Pollutants�are�removed:�total�suspended�solids�are�reduced�by�85%,�NO3�by�30%,�and�total�phosphorous�by�
85%.�(PDEP,�2006)�
Cost�Considerations�With�a�permeable�pavement�system,�traditional�stormwater�systems�may�be�reduced�or�bypassed�entirely.�This�may�reduce�the�total�lifecycle�cost�of�the�project�significantly.�Cost�depends�on�the�system�chosen,�and�varies�widely.�A�washed�aggregate�gravel�pathway�that�may�be�appropriate�in�some�pedestrian�areas�will�be�extremely�inexpensive�and�have�extremely�high�hydraulic�conductivities�(Hun�Dorris,�2005).For�surface�courses,�permeable�asphalt�is�more�expensive�than�traditional�asphalt.�The�project�specifics�also�significantly�dictate�the�cost,�and�must�be�considered�individually.�(EPA,�2000)��
� Porous�asphalt,�with�additives,�may�cost�more�than�standard�asphalt�on�a�unit�area�basis.�Generally�this�depends�on�availability�and�contractor�familiarity.�(PDEP,�2006)�
� Porous�concrete�as�a�material�is�generally�more�expensive�than�porous�asphalt�and�requires�more�labor�and�experience�for�installation�due�to�specific�material�constraints.�(ibid.)�
� Porous�paver�blocks�vary�in�cost�depending�on�type,�manufacturer,�order�volume�and�site�layout.�(ibid.)�
Design�Elements�Design�of�permeable�structures�generally�includes�a�permeable�surface�such�as�asphalt�or�portland�cement�concrete�over�a�base�of�fines,�which�help�to�filter�the�water,�and�uniformly�graded�gravel,�which�stores�the�water�as�it�infiltrates�through�the�ground�below�the�structure.�An�uncompacted�soil�base�is�highly�recommended,�and�construction�practices�which�emphasize�this�are�critical�for�groundwater�recharge.�(CRWA,�2008)�
The�design�of�permeable�pavements�varies�considerably�due�to�location�and�cost�considerations.�However,�three�things�must�be�considered�regardless�of�which�design�is�being�considered:�(1)�the�location�and�any�unique�features,�hydrogeologic�and�geotechnical�characteristics,�local�codes,�etc.;�(2)�proper�structural�design;�(3)�and�quality�construction�(Hun�Dorris,�2005).�Soil�beneath�the�permeable�pavement�structure�must�allow�the�accumulated�water�to�drain,�meaning�these�soils�must�not�be�overcompacted.�Care�must�also�be�taken�to�ensure�that�debris�and�water�drains�away�from�the�permeable�structure,�in�all�directions,�to�ensure�that�clogging�does�not�become�a�problem.��
Maintenance�Requirements�Regular�maintenance�is�recommended�for�permeable�pavements.�This�may�include�re�sodding,�laying�gravel,�and�other�small�repairs.�Other�typical�concerns�for�maintaining�the�permeable�pavement�are�limited�to�aesthetics,�snow�and�ice�conditions�and�the�prevention/repair�of�clogging.��
Clog�Prevention�More�typically,�maintenance�of�a�permeable�structure�refers�to�vacuum�sweeping,�pressure�washing,�or�air�blowing�to�remove�debris.�Vacuuming�is�recommended�(PDEP,�2006).�Depending�on�the�site,�this�may�need�to�happen�2�4�times�a�year�(CRWA,�2008).�Clogging�can�be�prevented�or�mitigated�through�proper�routine�maintenance�of�planted�areas,�cleaning�up�soil�spills,�thoughtful�construction�staging�and�storage�of�soils,�covering�permeable�pavement�installations�during�construction�and�cleaning�drainage�inlets�at�least�twice�a�year�or�seasonally�(PDEP,�2006).�Proper�design�may�prevent�clogging,�such�as�designing�for�drainage�away�from�the�porous�section�of�pavement.�This�will�keep�debris�from�sweeping�onto�the�pavement�while�allowing�rain�to�infiltrate�the�soil�below�(PDEP,�2006).�
Winter�Maintenance�Winter�maintenance�for�permeable�pavements�is�simpler�than�that�for�typical�pavements�because�the�increased�air�voids�and�heat�retention�in�the�stone�bed�beneath�the�pavement�tends�to�provide�good�snow�
437
Pavement Technologies (PT) Greenroads™ Manual v1.5
Permeable Pavement PT-2
melt,�leading�to�reduced�snow�and�ice�problems.�Abrasives�that�might�promote�localize�clogging,�such�as�sand,�on�or�near�the�porous�pavement�should�be�avoided.�Snow�plowing�may�be�used�with�caution,�setting�the�blade�about�an�inch�higher�than�normal.�Salt�may�be�used;�however,�nontoxic�organic�deicers�are�preferred,�as�the�contaminated�water�will�go�directly�to�the�water�table.�
Repairs�Drainage�structure�repair�has�the�highest�priority,�in�order�to�keep�the�system�working�as�designed.�Pavement�structural�repairs�will�likely�be�limited�primarily�to�areas�that�may�have�settled�due�to�soft�soils.�These�areas�may�be�patched�with�standard�or�permeable�pavement.�Potholes�will�rarely�be�a�problem,�due�to�the�lack�of�a�freeze�thaw�cycle�as�in�typical�pavements.�Seal�coats�ought�not�to�be�used,�as�they�would�nullify�the�benefit�of�a�permeable�pavement.�
GLOSSARY
OGFC� Open�graded�friction�courseCurve�Number� A�hydrological�parameter�that�is�used�to�model�runoff�TKN� Total�Kjeldahl�NitrogenPermeable�pavement� A�pavement�structural�system�that�has�more voids�than�a�conventional�paved�
surface�such�as�concrete�or�asphalt��
REFERENCES Abbott,�C.�L.�&�Comino�Mateos,�L.�(2003).�In�Situ�Hydraulic�Performance�of�a�Permeable�Pavement�Sustainable�
Urban�Drainage�System.�Water�and�Environmental�Management�:�Journal�of�the�Institution�of�Water�and�Environmental�Management.�17,�187�190.�
Blair�County�Conservation�District.�(n.d.)�Stormwater�Best�Management�Practices.�Accessed�January�9,�2010.�Available�at�http://www.blairconservationdistrict.org/SWBMP.htm�
Booth,�D.�B.�&�Jennifer�Leavitt.�(1999).�Field�evaluation�of�permeable�pavement�systems�for�improved�stormwater�management.�Journal�of�Planning�Literature.�14�(2).�
Boving,�T.,�Stolt,�M.,�Augenstern,�J.,�&�Brosnan,�B.�(2008).�Potential�for�localized�groundwater�contamination�in�a�porous�pavement�parking�lot�setting�in�Rhode�Island.�Environmental�Geology.�55�(3),�571�582.�
Brattebo�B.O.�&�Booth�D.B.�(2003).�Long�term�stormwater�quantity�and�quality�performance�of�permeable�pavement�systems.�Water�Research.�37�(18),�4369�76.�
Charles�River�Watershed�Association�(CRWA).�(2008)�Low�Impact�Best�Management�Practices�Information�Sheet:�Permeable�Pavement.�Accessed�January�9,�2010.�Available�at�http://www.crwa.org/projects/blackstone/maintenance_brochure_web.pdf��
City�of�Seattle�Department�of�Planning�and�Development�and�Seattle�Public�Utilities.�(2009,�June�30).�Environmentally�Critical�Areas:�Best�Available�Science�Review.�(Supplemental�Report).�Stormwater�Code�&�Grading�Code�Revisions.�Accessed�November�22,�2009.�Available�at�http://www.seattle.gov/DPD/Planning/Stormwater_Grading_and_Drainage_Code_Revisions/Overview/��
Elvik�R,�&�Greibe�P.�(2005).�Road�safety�effects�of�porous�asphalt:�a�systematic�review�of�evaluation�studies.�Accident;�Analysis�and�Prevention.�37�(3),�515�22.�
Geosyntec�Consultants�and�Wright�Water�Engineers.�(2008)�BMPDB:�BMP�Performance�Summaries.�Table�of�Performance�by�BMP�Category�and�Common�Pollutant�Type.�Accessed�January�9,�2010.�Available�at�http://www.bmpdatabase.org/BMPPerformance.htm��
438

Greenroads™ Manual v1.5 Pavement Technologies (PT)
PT-2 Permeable Pavement
Hun�Dorris,�T.�(2005,�March�1).�Advances�in�Porous�Pavement�|�stormh20.com�Stormwater.�Accessed�January�9,�2010.�Available�at�http://www.stormh2o.com/march�april�2005/pavement�materials�watershed.aspx��
North�Carolina�Division�of�Water�Quality�(NCDWQ).�(2007).�NCDWQ�Stormwater�BMP�Manual.�N.C.�Division�of�Water�Quality.�Available�at�http://h2o.enr.state.nc.us/su/bmp_updates.htm��
Pennsylvania�Department�of�Environmental�Protection.�(PDEP).�(2006).�Pennsylvania�Stormwater�Best�Management�Practices�Manual.�(363�0300�002).�Available�at�http://www.elibrary.dep.state.pa.us/dsweb/View/Collection�8305��
United�States�Environmental�Protection�Agency�(EPA).�(2000,�October).�Field�Evaluation�of�Permeable�Pavements�for�Stormwater�Management.�(EPA�841�B�00�005B)�Washington,�D.C.:�Office�of�Water,�Environmental�Protection�Agency.�
� �
439

Pavement Technologies (PT) Greenroads™ Manual v1.5
Permeable Pavement PT-2
�
440

Greenroads™ Manual v1.5 Pavement Technologies
PT-3 Warm Mix Asphalt
WARM MIX ASPHALT GOAL Reduce�fossil�fuel�use�at�the�hot�mix�asphalt�plant,�decrease�emissions�at�the�plant,�and�decrease�worker�exposure�to�emissions�during�placement.�
CREDIT REQUIREMENTS Reduce�the�mixing�temperature�of�hot�mix�asphalt�by�a�minimum�of�50°F�from�that�recommended�as�the�mixing�temperature�by�the�asphalt�binder�supplier.�Mixing�temperature�shall�be�measured�as�the�temperature�of�the�mixture�as�it�exits�the�mixing�drum�(for�drum�plants)�or�pugmill�(for�batch�plants).�This�reduced�temperature�mix�must�comprise�a�minimum�of�50%�of�the�total�project�pavement�(hot�mix�asphalt�or�portland�cement�concrete)�by�weight.�
Details
This�credit�requires�a�recommended�HMA�mixing�temperature�to�be�provided�by�the�asphalt�binder�supplier.�This�recommended�temperature�should�be�as�if�no�WMA�technology�were�to�be�used.�If�the�recommended�mixing�temperature�is�provided�as�a�range,�use�high�end�of�the�range�for�calculation�of�the�required�50°F�degree�reduction.�
Note�that�concrete�products�do�not�qualify�for�this�credit.��
Several�additives�and�plant�equipment�options�are�available�for�WMA�technology.�All�are�acceptable.�Based�on�regional�availability,�one�additive�or�equipment�type�may�be�preferred�over�another.�
DOCUMENTATION � A�copy�of�the�WMA�mix�design�should�be�submitted.�The�mix�design�should�have�
the�following�items�highlighted:�
a. Name�of�WMA�technology�used�b. If�an�additive�was�used,�percentage�by�weight�of�binder�or�by�weight�of�mix�c. Total�tons�of�high�type�pavement�on�the�project,�including�Portland�cement�
concrete�and�asphalt�concrete�(hot,�warm�and�cold�mix)�d. Total�tons�of�WMA�pavement�used��e. WMA�mix�temperature�as�it�exits�the�drum�(drum�plant)�or�pugmill�(batch�plant)�f. Recommended�asphalt�binder�mixing�temperature�from�the�asphalt�binder�
supplier.��g. Total�fuel�used�in�the�burner�per�ton�of�WMA�h. Total�fuel�used�in�the�burner�per�ton�of�HMA�if�HMA�was�used.�If�HMA�was�not�
used,�a�general�plant�average�is�acceptable.��
� A�photo�taken�during�placement�of�the�mix,�clearly�labeled�to�identify�the�WMA.�
PT-3
3 POINTS
RELATED CREDITS
� MR�4�Recycled�Materials�
SUSTAINABILITY COMPONENTS
� Ecology�� Equity�� Experience�
BENEFITS
� Reduces�Fossil�Fuel�Use�
� Reduces�Air�Emissions�
� Reduces�Greenhouse�Gasses�
� Improves�Human�Health�&�Safety�
� Reduces�First�Costs�
441

Pavement Technologies Greenroads™ Manual v1.5
Warm Mix Asphalt PT-3
APPROACHES & STRATEGIES
� Consider�specifying�a�temperature�reduction�at�the�plant�of�a�minimum�of�50°F�in�the�design�documents�and�list�all�approved�additives�or�methods�allowed�to�achieve�this�temperature�reduction.�
Example: Case Study – Warm Mix Asphalt on I-90 in Vantage, WA
The�Washington�State�Department�of�Transportation�(WSDOT)�recently�completed�a�10.6�mile�mill�and�overlay�project�on�the�eastbound�truck�lane�of�Interstate�90�between�Vantage�and�George,�WA�(WSDOT,�2008).�Part�of�the�project�(approximately�5.0�miles)�was�paved�using�conventional�HMA,�while�the�remaining�final�5.6�miles�was�paved�using�WMA.�The�same�contractor,�production�plant,�trucks�and�paving�equipment�were�used�for�both�mixes.�Both�mixes�were�placed�in�one�two�inch�lift�and�contained�20�percent�recycled�asphalt�pavement�(RAP),�the�maximum�allowed�by�WSDOT�without�special�testing.�The�mix�design�was�half�inch�Superpave�with�5.2�percent�PG76�28�binder.�Sasobit®�was�added�to�the�warm�mix�at�2.0�percent�by�weight�of�the�binder.�The�Sasobit®�additive�was�provided�by�Sasolwax,�Inc.�and�produced�at�the�Sasol�South�Africa�plant�in�Sasolburg,�RSA.�The�additive�cost�was�roughly�$25,000�(including�shipping),�or�about�two�percent�of�the�total�$1.36�million�paving�portion�of�the�project.�
Based�on�field�data�collected,�the�WMA�was�mixed�at�300°F�and�the�HMA�was�mixed�at�350°F.�This�resulted�in�a�23.5�percent�reduction�of�diesel�fuel�use�in�the�burner.�The�manufacturing�processes�for�these�two�types�of�asphalt�pavement�were�generally�identical,�save�that�the�WMA�includes�the�Sasobit®�additive�to�allow�a�lower�production�temperature�to�be�used�in�the�burner.�(It�is�worth�noting�that�this�temperature�was�much�higher�than�the�minimum�temperature�necessary�for�the�additive,�according�to�Sasolwax)�(Sasol�Wax�Gmbh,�1997).�
Other�notes�on�this�project:�
� Field�compaction�test�results�(using�standard�WSDOT�procedures)�averaged�93.7�for�WMA�(11�lots�with�5�random�samples�per�400�ton�lot)�and�93.6�percent�for�HMA�(19�lots),�with�WMA�allowing�more�time�for�the�rollers�to�reach�compaction.�
� During�placement,�infrared�photographs�taken�during�observations�indicated�that�temperatures�were�more�uniform�across�the�WMA�mat�than�the�HMA�mat.�
More�information�on�that�project�can�be�found�here:�http://www.wsdot.wa.gov/Projects/I90/WGeorgePaving/��
POTENTIAL ISSUES
1. Monitor�the�plant�operations�to�ensure�that�the�temperature�is�maintained�at�50°F�below�the�recommended�mixing�temperature.��
2. Do�not�use�recommended�mixing�temperatures�that�might�result�in�asphalt�binder�thermal�degradation,�typically�defined�by�the�Asphalt�Institute�as�temperatures�above�350°F�(175°C).�
RESEARCH Warm�mix�asphalt�(WMA)�is�a�relatively�new�technology�to�the�United�States’�paving�industry�that�shows�great�promise�to�reduce�both�the�amount�of�energy�used�in�constructing�hot�mix�asphalt�(HMA)�pavements�and�the�air�emissions�associated�with�pavement�construction.�WMA�is�commonly�used�in�Europe,�where�non�renewable�resources�are�strictly�regulated�and�often�heat�and�fuel�energy�required�for�conventional�hot�mix�asphalt�(HMA)�are�cost�prohibitive�(D'Angelo�et�al.,�2008).�Lately,�WMA�has�become�an�intriguing�environmental�marketing�incentive,�both�popularized�and�heavily�advocated,�and�the�material�is�becoming�more�accepted�due�to�the�relatively�new�sustainability�movement�among�engineering�and�construction�professionals.�Emphasis�on�climate�change,�energy�conservation�and�human�health�impacts�has�brought�WMA�paving�to�the�forefront�of�this�newfound�environmental�movement.�Recent�field�and�laboratory�studies�(Hurley,�2006;�Wasiuddin,�Selvamohan,�Zaman,�&�Guegan,�2007)�conducted�in�the�U.S.�have�produced�positive�results,�indicating�that�WMA�is�a�viable�option�to�reduce�the�potential�environmental�and�societal�impacts�associated�with�paving�and�construction.��
442

Greenroads™ Manual v1.5 Pavement Technologies
PT-3 Warm Mix Asphalt
Most�of�the�warm�mix�asphalt�studies�and�research�cite�several�positive�and�few�negative�traits�of�the�material.�Particularly�detailed�research�and�references�can�be�found�in�the�Kristiandottir’s�thesis�(2006)�and�Ghandi’s�dissertation�(2008).�Both�of�these�researchers�review�the�existing�types�of�warm�mix�additives�available,�discuss�the�engineering�properties�of�the�materials�and�additives�in�detail,�and�address�potential�applications�such�as�cold�weather�paving�and�high�recycled�content�mixes.�The�most�common�incentives�cited�are�lower�fuel�consumption�during�the�mix�production�and�improved�compaction�and�workability�during�placement�of�the�mix�(Kristjansdottir,�2006).�Both�of�these�traits�allow�for�more�uniform�mat�temperatures�and�extended�compaction�time.�
However,�long�term�WMA�performance�data�in�U.S.�applications�is�scarce�because�the�technology�is�so�recent.�Noted�drawbacks�generally�include�slightly�heightened�concern�for�rutting�potential,�thought�to�be�due�to�inadequate�drying�of�the�aggregates�for�use�in�the�lower�temperature�mixes�(Hurley,�2006;�Kristiandottir,�2006;�Wasiuddin,�Selvamohan,�Zaman,�&�Guegan,�2007;�Ghandi,�2008)�and,�simply,�cost�(Muench,�Kristiandottir,�Pierce,�&�Willoughby,�2007).��
More�recently,�interest�in�warm�mix�material�has�sparked�field�experiments�for�performance�testing�with�using�a�higher�content�of�recycled�asphalt�pavement�(RAP)�to�alleviate�stiff�mixes�(Mallick,�Bradley,�&�Bradbury,�2007)�and�a�noteworthy�short�duration�high�load�study�at�the�NCAT�track�(Prowell,�Hurley,�&�Crews,�2007).�Generally,�the�results�show�agreement�with�the�benefits�noted�above�for�comparing�performance�of�WMA�with�a�similarly�designed�and�placed�mat�of�HMA.�
Air�emissions�contribute�to�global�warming,�acid�rain�and�smog�formation�throughout�the�lifecycle�of�a�pavement.�Additionally,�studies�have�shown�that�asphalt�paving�may�have�detrimental�effects�on�human�health�(Herrick,�McClean,�Meeker,�Zwack,�&�Hanley,�2007;�Gasthauer,�Maze,�Marchand,�&�Amouroux,�2008)�due�to�the�presence�of�volatile�hydrocarbons�(PAHs,�polycyclic�aromatic�hydrocarbons)�released�when�the�asphalt�is�heated.�For�example,�the�most�common�gas�emitted�from�bituminous�pavements�is�naphthalene�which�is�classified�by�the�Environmental�Protection�Agency�(EPA)�as�a�carcinogen.�Lifecycle�emissions�come�from�transportation�sources,�any�construction�or�demolition�equipment,�stationary�manufacturing�equipment�and�any�part�of�the�manufacturing�process�that�uses�fossil�fuels�as�an�energy�source�(including�electricity).�Other�substance�emissions�come�from�fumes�of�the�pavement�itself�during�both�the�manufacturing�process�and�construction,�which�can�adversely�affect�human�health.�Air�emissions�are�thus�highly�regulated�by�the�EPA.�Of�particular�interest�are�emissions�during�the�paving�process,�which�are�known�to�directly�impact�worker�health�(NIOSH,�1997).��
Fossil�fuel�derivations,�such�as�coal,�diesel�fuel,�and�gasoline�are�major�inputs�to�all�processes�in�the�production�of�asphalt�pavements.�These�fuels�are�used�in�many�types�of�paving�equipment�during�aggregate�excavation,�truck�and�rail�transportation,�manufacturing�equipment�(such�as�burners�and�crushers),�paving�construction�(and�deconstruction),�and�in�disposal�at�landfills.�Also,�electricity�and�heat�at�the�plant�are�generated�using�mostly�non�renewable�fossil�fuel�sources�in�most�U.S.�locations.�This�credit�focuses�on�reducing�lifecycle�air�emissions�only�from�the�mix�production�and�placement�processes�by�encouraging�reduced�fuel�use�at�the�plant�through�use�of�a�temperature�lowering�warm�mix�additive.�
Lifecycle�assessments�(LCA)�have�been�completed�by�various�institutions�attempting�to�identify�and�quantify�air�emissions�and�energy�use�for�asphalt�pavements�(Zapata�&�Gambetese,�2005;�Meil,�2007;�Horvath,�2007).�Zapata�&�Gambetese�(2005)�note�that�because�existing�LCAs�vary�in�method,�they�tend�to�produce�contradictory�results�according�to�their�input�variables�and�model�assumptions.�Further,�reliable�and�publicly�accessible�data�on�environmental�emissions�or�fuel�consumption�for�any�type�of�HMA�pavement,�including�WMA,�is�rare,�outdated�or�simply�does�not�currently�exist.�However,�the�EPA�published�general�emissions�estimation�techniques�for�standard�hot�mix�plants�based�on�average�U.S.�data�collected�for�the�1997�industry�census�(EPA,�2000).�Since�air�emissions�increase�with�higher�temperatures,�and�WMA�allows�for�lower�temperatures�to�be�used�in�production,�it�follows�that�WMA�applications�will�generally�reduce�emissions�during�the�pavement�production�process.�
� �
443
Pavement Technologies Greenroads™ Manual v1.5
Warm Mix Asphalt PT-3
GLOSSARY
EPA� Environmental�Protection�AgencyHMA� Hot�mix�asphaltLCA� Lifecycle�assessmentPAH� Polycyclic�aromatic�hydrocarbonWMA� Warm�mix�asphalt�
REFERENCES D'Angelo,�J.�et�al.�Warm�Mix�Asphalt:�European�Practice.�Report�No.�FHWA�PL�08�007�
http://www.warmmixasphalt.com/submissions/68_20080223_FHWA�PL�08�007.pdf.�(28�June�2008).�72pp.�
Gandhi,�T.�(2008).�Effects�of�warm�asphalt�additives�on�asphalt�binder�and�mixture�properties.�Thesis�(Ph.D.)����Clemson�University,�2008.�
Gasthauer,�E.,�Maze,�M.,�Marchand,�J.�P.,�&�Amouroux,�J.�(2008).�Characterization�of�asphalt�fume�composition�by�GC/MS�and�effect�of�temperature.�Fuel:�Guildford.�87�(7),�1428�1434.��
Herrick,�R.�F.,�McClean,�M.�D.,�Meeker,�J.�D.,�Zwack,�L.,�&�Hanley,�K.�(2007).�Physical�and�Chemical�Characterization�of�Asphalt�(Bitumen)�Paving�Exposures.�Journal�of�Occupational�and�Environmental�Hygiene.�4,�209�216.��
Horvath,�A.�University�of�California�at�Berkeley.�PaLATE.�Pavement�Lifecycle�Tool.�http://www.ce.berkeley.edu/~horvath/palate.html�5�June�2007�(20�May�2008).�
Hurley,�G.�C.�&�Prowell,�B.�D.�(2006).�Evaluation�of�potential�processes�for�use�in�warm�mix�asphalt.�Journal�of�the�Association�of�Asphalt�Paving�Technologists.�Proceedings�of�the�Technical�Sessions,�2006�Annual�Meeting.�75,�41�90.�
International�Organization�for�Standardization.�ISO�14040:2006(E)�Environmental�Management�—�Lifecycle�Assessment�—�Principles�and�Framework.�2nd�ed.�2006:�IHS.�
International�Organization�for�Standardization.�ISO�14044:2006(E)�Environmental�Management�—�Lifecycle�Assessment�—�Requirements�and�Guidelines.�1st�ed.�2006:�IHS.�
Kristjansdottir,�O.�(2006).�Warm�mix�asphalt�for�cold�weather�paving.�Thesis�(M.S.C.E.)��University�of�Washington,�2006.�
Kristjansdottir,�O.,�Muench,�S.,�Michael,�L.,�&�Burke,�G.�(2007).�Assessing�Potential�for�Warm�Mix�Asphalt�Technology�Adoption.�Transportation�Research�Record.�(2040),�91�99.�
Mallick,�R.,�Bradley,�J.,�&�Bradbury,�R.�(2007).�Evaluation�of�Heated�Reclaimed�Asphalt.�Pavement�Material�and�Wax�Modified�Asphalt�for�Use�in�Recycled�Hot�Mix�Asphalt.�Transportation�Research�Record.�(1998),�112�122.�
Meil,�Jaime.�Athena�Research�Institute.�A�Lifecycle�Perspective�on�Concrete�and�Asphalt�Roadways:�Embodied�Primary�Energy�and�Global�Warming�Potential.�Submitted�to�the�Cement�Association�of�Canada.�15�November�2006.�
National�Institute�for�Occupational�Safety�and�Health�(NIOSH).�(1997)�Engineering�Control�Guidelines�for�Hot�Mix�Asphalt�Pavers�Part�1�New�Highway�Class�Pavers.�Publication�No.�97–105.�
Prowell,�B.,�Hurley,�G.,�&�Crews,�E.�(2007).�Field�Performance�of�Warm�Mix�Asphalt�at�National�Center�for�Asphalt�Technology�Test�Track.�Transportation�Research�Record.�(1998),�96�102.�
444

Greenroads™ Manual v1.5 Pavement Technologies
PT-3 Warm Mix Asphalt
Sasol�Wax�Gmbh.�Sasobit.�The�Bitumen�Additive�For�Highly�Stable�Easily�Compactible�Asphalts.�http://www.sasolwax.com/sasolwaxmedia/Downloads/Bitumen+Modification/Sasobit+since+1997.pdf�(28�July�2008).�
United�Stated�Environmental�Protection�Agency.�Hot�Mix�Asphalt�Plants���Emission�Assessment�Report�(EPA�454/R�00�019).�Final�report�dated�December�2000.�http://www.epa.gov/ttn/chief/ap42/ch11/related/ea�report.pdf�(28�July�2008).��
United�States�Department�of�Energy�(USDOE).�Department�of�Energy�–�Homepage.�http://www.doe.gov/�(31�July�2008).��
United�States�Environmental�Protection�Agency.�Individual�Emissions�–�Personal�Emissions�Calculator.�http://www.epa.gov/climatechange/emissions/ind_calculator.html�25�February�2008(31�July�2008).��
Washington�State�Department�of�Transportation.�“WSDOT���Project���I�90���West�of�George���Paving.”�http://www.wsdot.wa.gov/Projects/I90/WGeorgePaving/�27�July�2008).��
Wasiuddin,�N.,�Selvamohan,�S.,�Zaman,�M.,�&�Guegan,�M.�(2007).�Comparative�Laboratory�Study�of�Sasobit�and�Aspha�Min�Additives�in�Warm�Mix�Asphalt.�Transportation�Research�Record.�(1998),�82�88.�
Zapata,�P.�&�Gambatese,�J.�A.�(2005).�Energy�Consumption�of�Asphalt�and�Reinforced�Concrete�Pavement�Materials�and�Construction.�Journal�of�Infrastructure�Systems.�11�(1),�9�20.�
� �
445

Pavement Technologies Greenroads™ Manual v1.5
Warm Mix Asphalt PT-3
�
446

Greenroads™ Manual v1.5 Pavement Technologies
PT-4 Cool Pavement
COOL PAVEMENT GOAL Reduce�contribution�to�localized�increased�air�temperatures�due�to�pavement�reflectance�and�minimize�stormwater�runoff�temperatures.�
CREDIT REQUIREMENTS Use�a�pavement�surface�with�a�minimum�albedo�of�0.3�(measured�using�ASTM�E�903)�for�a�minimum�of�50%�of�the�total�project�pavement�surfacing�by�area.��
OR�
Use�a�porous�pavement�or�pavers�for�a�minimum�of�50%�of�the�total�project�pavement�surfacing�by�area.�
In�either�case,�the�surfaces�intended�for�use�by�vehicles�(e.g.,�roads,�parking�lots)�must�all�be�included�in�the�calculation.�Other�surfaces�(e.g.,�sidewalks)�may�be�included�if�desired.�A�combination�of�materials�may�be�used�to�meet�the�50%�area�requirement.�
Details
Calculate�the�percent�of�cool�pavement�(CP)�surface�area�on�the�project�using�Equation�PT.4.1.�
�
Where:��
� LSA�is�the�total�light�colored�or�high�albedo�surface�area�tested�to�have�a�minimum�0.3�albedo�
� PSA�is�the�total�permeable�or�porous�surface�area�� A�is�the�total�paved�surface�area�on�the�project.�
Area�calculations�must�be�consistent�across�all�credits�requiring�computations�of�this�type�(i.e.�the�total�area,�A,�must�match�throughout).�Note�that�combinations�of�materials�may�be�used�to�achieve�this�credit.�
DOCUMENTATION Provide�the�following�supporting�information,�as�applicable:�� Copy�or�copies�of�albedo�test�results.�� Copy�of�the�porous�pavement�mix�design�noting�total�air�voids�in�the�mix,�or�voids�
specifications�for�paver�blocks�based�on�method�of�installation.�� A�photo�of�the�pavement�with�cool�pavement�areas�identified�either�with�text�
describing�them�or�graphics�highlighting�them.�� A�plan�showing�the�locations�of�the�cool�pavements�on�the�project�with�cool�
pavement�areas�highlighted.�
PT-4
5 POINTS
RELATED CREDITS
� MR�6�Energy�Efficiency�
� PT�2�Permeable�Pavement�
SUSTAINABILITY COMPONENTS
� Ecology�� Equity�� Economy�� Extent�� Expectations�� Experience�
BENEFITS
� Reduces�Fossil�Fuel�Use�
� Reduces�Air�Emissions�
� Reduces�Greenhouse�Gases�
� Increases�Aesthetics�
(Equation PT-4.1)
447

Pavement Technologies Greenroads™ Manual v1.5
Cool Pavement PT-4
APPROACHES & STRATEGIES
� Consider�specifying�a�high�albedo�aggregate�wearing�course�for�the�pavement�section�(especially�for�HMA),�high�albedo�pavements�(like�PCC)�or�consider�high�albedo�surface�coatings.�
� Consider�porous�or�permeable�pavement�materials�or�products.�
Example: Calculation
A�2�mile�section�of�Interstate�highway�is�reconstructed�consisting�of�two�12�ft�wide�travelled�lanes�paved�with�PCC�(albedo�measured�at�0.46)�and�an�8�ft�wide�outside�shoulder�paved�with�HMA�(albedo�of�the�HMA�measured�at�0.18).�In�this�instance,�the�PCC�counts�as�a�cool�pavement.�The�total�cool�pavement�area�is�calculated�using�equation�PT�4.1:�
a0� � � ���9��$(���� � 6� 9��$Z ����6������"$(��6��VV � ������ �6�b�
�0� � � �
� � � ���9��$(���� � 6� 9��$Z c����6������"$(��6��VV � ���6���� !��(#�5�*$%d � ����3� �6�b�
V���) � e������ � ����3� f ��2 � ) � ��)�
This�project�would�satisfy�the�credit�requirements.��
POTENTIAL ISSUES
1. Albedo�is�not�the�only�indicator�of�a�pavement’s�contribution�to�the�UHI�effect.��2. For�a�pavement�in�a�rural�area,�it�may�not�be�appropriate�to�pursue�this�credit�since�the�UHI�effect�is�a�distinctly�
urban�phenomenon.��3. Pavement�albedos�change�over�time�as�they�weather�and�age.�4. Pavement�albedos�also�vary�with�surroundings�such�as�time�of�day�and�shade�cover.�5. Retention�of�heat�in�the�pavement�sections�vary�with�thickness.�6. Permeable�pavements�can�become�less�permeable�over�time�without�proper�maintenance.�
RESEARCH The�urban�heat�island�(UHI)�effect�is�“…a�measurable�increase�in�ambient�urban�air�temperatures�resulting�primarily�from�the�replacement�of�vegetation�with�buildings,�roads,�and�other�heat�absorbing�infrastructure.”�(EPA�2009).�This�occurrence�(Figure�PT�4.1)�is�due�to�the�reduction�of�natural�vegetation,�increased�human�activity�and�the�absorption�and�radiation�of�solar�energy�in�all�built�surfaces.�Roofs,�parks,�water�bodies�and�pavements�all�have�different�properties�that�determine�how�much�of�the�sun’s�heat�is�absorbed�and�released,�and�they�all�interact�together�and�with�other�systems�in�an�urban�area�to�produce�a�total�Heat�Island�Effect�(HIE).�The�UHI�effect�should�not�be�confused�with�climate�change�(global�warming);�they�are�separate�and�rather�unrelated�items.�The�UHI�effect�is�specifically�a�local�temperature�increase�(generally�the�difference�between�urban�and�surrounding�rural�areas)�while�climate�change�refers�to�larger�scale�variations�in�global�climate�caused,�in�general,�by�greenhouse�gas�emissions�resulting�from�human�activity.�Studies�and�simulations�performed�for�10�large�cities�in�the�U.S.�indicate�an�average�UHI�effect�of�about�3.5°F�(2°C),�compared�to�surrounding�rural�areas�(Pomerantz�et�al.,�2000)�and�some�cities�are�as�much�as�10°F�(5.6°C)�warmer�than�surrounding�natural�land�cover�(EPA�2008).�UHI�can�impact�sustainability�in�the�following�ways�(EPA,�2009):��
� Energy�consumption.�Higher�temperatures�increase�artificial�cooling�(air�conditioning)�demand.�Akbari�(2005)�claims�that�increased�cooling�demand�can�account�for�5�10%�of�urban�peak�electricity�demand.�Figure�PT�4.2�shows�how�energy�loads�can�increase�as�temperature�rises.��
448
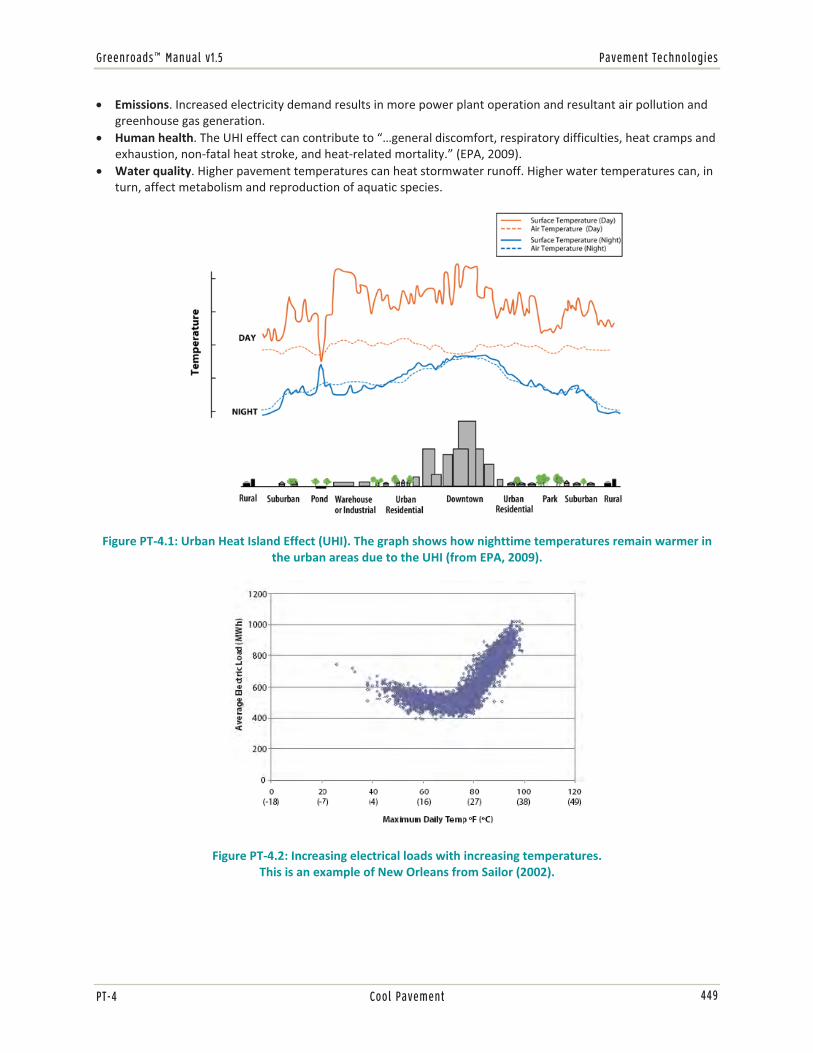
Greenroads™ Manual v1.5 Pavement Technologies
PT-4 Cool Pavement
� Emissions.�Increased�electricity�demand�results�in�more�power�plant�operation�and�resultant�air�pollution�and�greenhouse�gas�generation.��
� Human�health.�The�UHI�effect�can�contribute�to�“…general�discomfort,�respiratory�difficulties,�heat�cramps�and�exhaustion,�non�fatal�heat�stroke,�and�heat�related�mortality.”�(EPA,�2009).�
� Water�quality.�Higher�pavement�temperatures�can�heat�stormwater�runoff.�Higher�water�temperatures�can,�in�turn,�affect�metabolism�and�reproduction�of�aquatic�species.��
�
Figure�PT�4.1:�Urban�Heat�Island�Effect�(UHI).�The�graph�shows�how�nighttime�temperatures�remain�warmer�in�the�urban�areas�due�to�the�UHI�(from�EPA,�2009).�
�
�
Figure�PT�4.2:�Increasing�electrical�loads�with�increasing�temperatures.��This�is�an�example�of�New�Orleans�from�Sailor�(2002).�
�
449

Pavement Technologies Greenroads™ Manual v1.5
Cool Pavement PT-4
Impacts�In�short,�UHI�effect�sustainability�impacts�are�driven�by�energy�consumption�(for�energy�and�emissions�impacts)�and�heat�(for�human�health�and�water�quality�impacts).��
Energy�Increased�local�urban�temperatures�typically�lead�to�higher�electrical�loads�and�more�resultant�energy�use�and�emissions.�For�every�1°F�(0.6°C)�increase�in�summertime�temperature,�peak�utility�loads�in�medium�and�large�cities�increase�by�an�estimated�1.5�2.0�%�(EPA,�2008).�A�reduction�of�1.8�3.6°F�(1�2°C)�in�regional�average�temperatures�can�result�in�a�10%�decrease�of�the�peak�energy�demand,�hence�lessen�annual�energy�cost�and�all�impacts�related�to�energy�extraction.�Rosenfeld�et�al.�(1996)�estimated�that�eliminating�the�UHI�effect�in�Los�Angeles�(a�reduction�of�5.4°F�(3°C))�could�reduce�peak�power�consumption�by�1.6�GW�resulting�in�a�savings�of�about�$175�million/year.�Of�note,�Rosenfeld�et�al.�(1996)�estimated�the�contribution�of�cooler�pavements�(a�theoretical�increase�of�all�pavement�albedo�by�0.25)�to�this�total�at�$15�million/year.�
Human�Health�Higher�urban�temperatures�lead�to�the�formation�of�more�smog.�Specifically,�the�chemical�reaction�between�sunlight,�nitrogen�oxides�(NOx)�and�volatile�organic�compounds�(VOCs)�in�the�atmosphere�that�leads�to�the�formation�of�particulate�matter�(PM)�and�ground�level�ozone�is�a�temperature�sensitive�reaction;�production�of�PM�and�smog�is�increased�with�increased�temperature.�The�impacts�of�this�reaction�on�humans�are�significant�and�include�breathing�difficulties,�headaches,�fatigue�and�exacerbated�respiratory�problems.�Thus,�the�UHI�effect�can�increase�PM�and�ground�level�ozone�in�an�urban�area�by�raising�the�local�temperature.�In�modeling�the�Los�Angeles�Basin,�Rosenfeld�et�al.�(1996)�estimated�that�elimination�of�the�UHI�effect�in�Los�Angeles�(a�reduction�of�5.4°F�(3°C))�could�reduce�smog�exceedance�by�12%�(reduce�the�amount�of�time�the�area�exceeds�the�California�standard�of�90�ppbv�at�the�time�of�the�study)�resulting�in�a�savings�of�about�$360�million/year.�Of�note,�Rosenfeld�et�al.�(1996)�estimated�the�contribution�of�cooler�pavements�(a�theoretical�increase�of�all�pavement�albedo�by�0.25)�to�this�total�at�$76�million/year.�
Pavement�Contribution�to�the�Urban�Heat�Island�Effect�Pavements�are�found�to�be�a�significant�contributor�to�the�UHI�temperature�increase�because�(1)�they�constitute�a�substantial�portion�of�total�urban�land�coverage�and�(2)�pavements�can�store�and�radiate�a�significant�amount�of�heat.�In�looking�at�four�cities�(Sacramento,�Chicago,�Salt�Lake�City�and�Houston)�Rose�et�al.�(2003)�found�pavements�(roads,�parking�lots,�sidewalks,�etc.)�make�up�29�45�percent�of�the�total�land�coverage,�and�about�half�the�total�UHI�contributing�surface�coverage.�Rose�et�al.�(2003)�further�report�that�roads�(the�item�most�directly�addressed�by�Greenroads)�make�up�33�59�percent�of�the�total�pavement�coverage.�Thus,�as�a�gross�approximation,�road�pavements�constitute�about�one�quarter�the�total�surface�area�contributing�to�the�UHI�(about�33�59%�of�one�half�the�UHI�contributing�surface�coverage)�in�urban�areas.�The�next�section�discusses�the�impact�cooler�pavements�can�have�on�the�UHI�effect.��
Cool�Pavement�Impacts�Cool�pavements�are�designed�to�reduce�the�absorption�of�the�sun’s�energy�and�consequently�radiate�less�heat�to�the�surrounding�environment.�Solar�energy�is�absorbed�by�the�pavement�surface�and�becomes�stored�as�heat�in�the�pavement.�Paving�materials�can�reach�as�much�as�150°F�(EPA,�2005)�on�sunny�days,�radiating�this�heat�during�the�day�and�during�the�night�back�into�the�air�as�well�as�heat�storm�water�that�reaches�the�pavement�surface.�
In�addition�to�the�impacts�mentioned�in�the�previous�section,�studies�in�California�(Pomerantz�et�al.,�2000)�have�estimated�that�if�the�solar�absorption�of�all�pavements�were�reduced�from�90%�to�65%,�the�peak�air�temperature�in�an�urban�area�would�decrease�by�1°F�(0.6°C�).�This�decrease�is�roughly�equivalent�to�an�albedo�of�0.25�on�25%�of�all�pavements�in�a�certain�urban�area�(Pomerantz�et�al.,�2000).�Experimentally�and�by�calculation�it�is�found�that�an�increase�in�albedo�of�0.1�produces�a�change�in�pavement�surface�temperature�of�about��7°F�(�4°C)�(Pomerantz�et�al.,�2003).�It�may�also�be,�although�it�has�not�been�seen�experimentally,�that�if�pavement�surface�temperatures�are�decreased�on�hot�days�the�resulting�cooler�pavements�may�also�have�longer�lifetimes�due�to�reduced�thermal�stresses.��
450

Greenroads™ Manual v1.5 Pavement Technologies
PT-4 Cool Pavement
Properties�of�Cool�Pavements�Cool�pavement�strategies�are�those�that�seek�to�purposely�reduce�pavement’s�impact�on�the�UHI�effect�by�affecting�how�pavements�absorb,�store�and�radiate�heat.�Figure�PT�4.3�illustrates�the�relationship�of�heat�transfer�mechanisms�in�a�pavement�structure.�
�
Figure�PT�4.3:�Heat�related�characteristics�and�processes�in�pavement�(Cambridge�Systematics,�Inc.,�2005).��
There�are�two�main�types�of�cool�pavement�strategies:��
1. Reduce�solar�reflectance.�Use�lighter�colored�materials�because�they�have�higher�solar�reflectance�(as�measured�by�albedo)�so�they�absorb�less�of�the�sun's�energy�and�stay�cooler.��
2. Improve�cooling.�Use�porous�materials�because�they��(1)�allow�for�convective�cooling�because�air�can�flow�through�the�pavement�voids�and�(2)�allow�for�evaporative�cooling�because�water�can�also�enter�the�pavement�voids�in�a�rain�event.�
Reduce�Solar�Reflectance�Most�studies�mention�the�effect�of�heat�island�mitigation�taking�place�in�the�top�layer�due�to�variations�in�solar�reflectance�and�porosity.�However,�other�studies�have�shown�that�a�change�in�solar�reflectance�alone�may�not�be�the�only�important�factor�in�determining�the�pavement�surface�temperature�through�a�whole�year.�Factors�such�as�pavement�thickness,�heat�storage�capacity,�the�material’s�thermal�conductivity�and�density�are�also�important�considerations�(Golden�&�Kaloush,�2006;�Cambridge�Systematics,�Inc.,�2005).�
The�solar�reflectance�of�a�pavement�is�correlated�to�a�number�of�pavement�properties�including�(Pomerantz�et�al.,�2000):�
� Pavement�age.�As�a�light�pavement�gets�older�it�gets�darker.�For�instance,�concrete�is�darkened�by�the�presence�of�iron�oxide�and�dirt.�As�a�dark�pavement�gets�older�it�gets�lighter.�For�instance,�as�the�asphalt�
451

Pavement Technologies Greenroads™ Manual v1.5
Cool Pavement PT-4
binder�wears�off�the�aggregate�on�the�pavement�surface�the�aggregate�shows�and�the�albedo�of�the�pavement�approaches�the�albedo�of�the�aggregate.�Also,�the�asphalt�itself�becomes�lighter�due�to�oxidation.��
� �Aggregate�color.�Pomerantz�et�al.�(2000)�examined�several�different�chip�seals�and�found�that�their�albedo�was�approximately�50�80%�that�of�its�constituent�aggregate.�
� Non�pavement�factors.�Other�factors�such�as�wind,�sea�breeze,�shadowing�trees,�buildings,�and�even�vehicle�shadows.�Thus,�the�properties�of�the�pavement�are�not�the�only�properties�that�contribute�to�pavement�solar�reflectivity.��
Figure�PT�4.4�shows�several�different�pavements�and�their�corresponding�albedo�in�the�Phoenix,�Arizona�area�(Cambridge�Systematics,�Inc.,�2005).��
�
Figure�PT�4.4:�Surface�temperature�and�albedo�for�selected�types�of�pavements�in��Phoenix,�Arizona�(Cambridge�Systematics,�Inc.,�2005).�
�Design�Options.�There�are�a�number�of�ways�to�provide�highly�reflective�pavement�surfaces.�This�section�lists�a�few�of�the�more�popular:�
� Use�a�more�reflective�material�such�as�portland�cement�concrete�(PCC)�for�the�pavement�surface.�The�average�of�PCC�albedo�is�usually�higher�than�that�of�aged�hot�mix�asphalt�or�bituminous�surface�treatments�(Pomerantz�et�al.,�2003).�There�are�also�a�number�of�additives�that�can�be�used�to�further�lighten�surface�color�and�increase�reflectivity�including�slag�cement,�white�cement�and�light�fly�ash.�
� Use�a�lighter�colored�aggregate.�For�bituminous�mixtures�(e.g.,�hot�mix�asphalt,�HMA)�the�binder�is�usually�quite�dark.�This�can�be�at�least�partially�offset�by�using�a�light�colored�aggregate�like�limestone.��
� Change�the�pavement’s�surface�color.�There�are�a�number�of�existing�techniques�that�can�be�used�to�color�a�pavement�mixture�or�surface�treatment.�These�usually�involve�pigment�dyes�mixed�with�thin�surface�treatments�to�be�applied�over�the�pavement�structure.��
Improve�Cooling�Using�porous�pavement�mixtures�can�also�reduce�a�pavement’s�contribution�to�the�UHI�effect.�HMA,�PCC�and�block�pavers�can�be�used�to�make�pavements�porous�(or�permeable).�Porous/permeable�pavements�are�
452

Greenroads™ Manual v1.5 Pavement Technologies
PT-4 Cool Pavement
designed�with�a�high�air�void�content�(usually�15�25%�of�the�total�volume),�which�results�in�interconnected�voids�and�a�pavement�that�is�essentially�permeable�to�water.�These�air�voids�also�provide�an�opportunity�for�convective�cooling�(as�air�flows�through�them)�and�evaporative�cooling�(if�they�contain�water,�e.g.,�after�a�rain�event).���
Design�options.�There�are�essentially�two�main�options�to�improve�pavement�cooling:�
� Porous�pavement.�Build�the�entire�pavement�structure�with�a�porous/permeable�material�(e.g.,�block�pavers,�permeable�HMA�or�PCC).�Generally�this�is�done�for�stormwater�treatment�reasons;�however�a�secondary�benefit�is�a�reduction�in�the�pavement’s�contribution�to�the�UHI�effect.�
� Permeable�wearing�courses.�Build�a�normal�impermeable�pavement�(e.g.,�traditional�PCC�or�dense�graded�HMA)�and�cover�the�surface�with�a�layer�of�permeable�material.�While�the�entire�pavement�structure�is�not�permeable,�the�surface�is.�There�is�some�evidence�to�suggest�that�this�helps�pavements�cool�more�quickly�at�night.��
Additional�Information�The�U.S.�Environmental�Protection�Agency�(EPA)�maintains�an�extensive�website�on�the�UHI�effect�(http://www.epa.gov/hiri).�Of�specific�interest�is�the�Cool�Pavement�Report�(Cambridge�Systematics,�Inc.)�available�at:�http://www.epa.gov/hiri/resources/pdf/CoolPavementReport_Former%20Guide_complete.pdf.���
GLOSSARY
Albedo� A�measure of�a�material's�ability�to�reflect�sunlight�on�a�scale�of�0�to�1.�An�albedo�value�of�0.0�indicates�that�the�surface�absorbs�all�solar�radiation,�and�a�1.0�albedo�value�represents�total�reflectivity.��
Urban�Heat�Island�Effect� “…a�measurable�increase�in�ambient�urban�air�temperatures�resulting�primarily�from�the�replacement�of�vegetation�with�buildings,�roads,�and�other�heat�absorbing�infrastructure.”�(EPA�2009).�
�
REFERENCES Akbari,�H.�(2005).�Energy�Saving�Potentials�and�Air�Quality�Benefits�of�Urban�Heat�Island�Mitigation�(PDF)�(19�pp,�
251K).�Lawrence�Berkeley�National�Laboratory.�
Cambridge�Systematics,�Inc.�(2005).�Cool�Pavement�Report�–�EPA�Cool�Pavements�Study��Task�5.�Prepared�for�Heat�Island�Reduction�Initiative,�EPA,�Washington,�D.C.�
Golden,�J.S.�&�Kaloush,�K.E.�(2006).�Mesoscale�and�microscale�evaluation�of�surface�pavement�impacts�on�the�urban�heat�island�effects.�International�Journal�of�Pavement�Engineering�7(1).��
Gui,�J.,�Phelan,�P.�E.,�Kaloush,�K.�E.,�&�Golden,�J.�S.�(2007).�Impact�of�Pavement�Thermophysical�Properties�on�Surface�Temperatures.�Journal�of�Materials�in�Civil�Engineering,�19(8),�683�690.�
Levinson,�R.�&�Akbari,�H.�(2002).�Effects�of�composition�and�exposure�on�the�solar�reflectance�of�portland�cement�concrete.�Cement�and�Concrete�Research,�32(11),�1679�1698.�
Marks,�H.�(2009).�Urban�Heat�Island:�Not�a�Black�and�White�Issue.�HMAT,�November/December�2009,�40�41.��
Pomerantz�M.,�Akbari�H.,�Chang�S.�C.,�Levinson�R.,�&�Pon�B.�(2003).�Examples�of�cooler�reflective�streets�for�urban�Heat�Island�Mitigation:�Portland�Cement�Concrete�and�Chip�Seals.�Lawrence�Berkeley�National�Laboratory,�LBNL�49283.�
453

Pavement Technologies Greenroads™ Manual v1.5
Cool Pavement PT-4
Pomerantz,�M.,�B.�Pon,�H.�Akbari,�&�S.C.�Chang.�(2000).�The�Effect�of�Pavements�Temperatures�on�Air�Temperatures�in�Large�Cities.�Lawrence�Berkeley�National�Laboratory,�LBL�43442.�
Rose,�L.S.,�H.�Akbari,�&�H.�Taha.�(2003).�Characterizing�the�Fabric�of�the�Urban�Environment:�A�Case�Study�of�Greater�Houston,�Texas.�Paper�LBNL�51448.�Lawrence�Berkeley�National�Laboratory,�Berkeley,�CA.��
Rosenfeld,�A.H.,�Romm,�J.J.,�Akbari,�H.,�Pomerantz,�M.,�&�Taha,�H.�(1996).�Policies�to�Reduce�Heat�Islands:�Magnitudes�of�Benefits�and�Incentives�to�Achieve�Them.�Lawrence�Berkeley�National�Laboratory,�LBL�38679.�
Sailor,�D.�J.�(2002).�Urban�Heat�Islands,�Opportunities�and�Challenges�for�Mitigation�and�Adaptation.�Sample�Electric�Load�Data�for�New�Orleans,�LA�(NOPSI,�1995).�North�American�Urban�Heat�Island�Summit.�Toronto,�Canada.�1�4�May�2002.�Data�courtesy�Entergy�Corporation.�
U.S.�Environmental�Protection�Agency�(EPA).�(2008).�Reducing�Urban�Heat�Islands:�Compendium�of�Strategies.�EPA,�Washington,�D.C.��
U.S.�Environmental�Protection�Agency�(EPA).�(2009).�Heat�Island�Effect�website.�http://www.epa.gov/hiri.�Accessed�9�June�2009.��
�
�
�
454

Greenroads™ Manual v1.5 Pavement Technologies
PT-5 Quiet Pavement
QUIET PAVEMENT GOAL Improve�human�health�by�reducing�tire�pavement�noise.�
CREDIT REQUIREMENTS Design�at�least�75%�of�the�total�new�or�reconstructed�pavement�surface�area�for�regularly�trafficked�lanes�of�pavement�where�the�speed�limit�meets�or�exceeds�30�miles�per�hour�(mph)�with�a�surface�course�that�produces�tire�pavement�noise�levels�at�or�below�those�listed�in�Table�PT�5.1,�which�describes�test�vehicle�speed�parameters�and�the�points�corrsponding�to�the�level�of�noise�reduction�achieved.�Test�the�pavements�according�to�the�on�board�sound�intensity�(OBSI)�method��desribed�by�the�current�version�of�AASHTO�TP�76.�Compute�the�total�surface�area�of�all�trafficked�lanes�that�meets�or�exceed�speed�limits�of�30�mph�and�show�that�a�minimum�of�75%�of�this�area�meets�the�tabulated�criteria�for�tire�pavement�noise.�Do�not�include�shoulders,�medians,�sidewalks�and�other�paved�areas�outside�of�the�travelled�way�in�the�computation.�
Table�PT�5.1:�Testing�Speeds�and�Maximum�Average�OBSI�Noise�Levels�� � Maximum�Average�Noise�LevelFacility�Posted�Speed�Limit� Test�Speed� 2�points 3�points55�mph�or�more� 60�mph� 99�dBA 95�dBA30�to�54�mph� 35�mph� 91�dBA 88�dBAless�than�30�mph�� Does�not�qualify�for�credit�
Details
� One�OBSI�measurement�should�be�done�for�each�roadway�section.�A�roadway�section�is�defined�as�having�the�following�attributes:�
� The�same�speed�limit�over�its�entire�length�� A�straight�section�at�least�500�ft�long�(the�test�requires�440�ft)�� The�same�nominal�surfacing�material�over�the�entire�length�
� �Therefore,�in�some�instances�a�project�will�need�to�conduct�several�OBSI�measurements�depending�upon�the�number�of�sections�identified.�Portions�of�roadway�that�do�not�meet�the�section�definition�(usually�this�means�portions�that�do�not�contain�at�least�a�500�ft�straight�section)�shall�be�deemed�to�have�met�the�criteria�for�2�points�providing�the�project�has�at�least�one�section�that�has�been�tested�and�meets�the�criteria�for�2�points.��
� OBSI�testing�need�only�be�done�on�one�lane�of�a�given�roadway�in�one�direction.�For�instance,�on�a�four�lane�divided�highway�testing�need�only�be�done�on�one�lane�for�one�direction�only.�
� OBSI�testing�may�be�completed�at�any�time�on�the�final�pavement�surface.��� The�noise�level�to�compare�with�Table�PT�5.1�values�is�the�weighted�average�of�
all�tested�sections�(weighted�by�the�length�of�each�section).�For�a�section�that�does�not�have�a�straight�portion�of�at�least�500�ft,�but�does�meet�the�other�two�section�definition�requirements,�the�OBSI�measurement�value�shall�be�assumed�equal�to�the�2�point�value�in�Table�PT�5.1.���
PT-5
2-3 POINTS
RELATED CREDITS
� PR�5�Noise�Mitigation�Plan�
� PT�2�Permeable�Pavement�
SUSTAINABILITY COMPONENTS
� Ecology�� Equity�� Experience�
BENEFITS
� Improves�Human�Health�&�Safety�
� Increases��Aesthetics�
455

Pavement Technologies Greenroads™ Manual v1.5
Quiet Pavement PT-5
DOCUMENTATION � A�list�of�pavement�sections�to�be�built�(or�reconstructed)�and�their�associated�surface�material�type,�AASHTO�TP�
76�test�results,�and�surface�areas,�and�if�design�was�intended�to�be�quiet�or�not�in�accordance�with�the�requirements�of�this�criterion.�This�may�be�included�as�part�of�the�standard�project�documentation�or�as�a�separate�document.�
� A�calculation�to�indicate�the�total�percentage�of�trafficked�lane�pavement�surface�areas�surfaced�with�quiet�pavement.��
� A�drawing�or�project�map�showing�locations�of�quiet�pavements.�These�pavements�should�be�highlighted�on�the�plan,�a�scale�should�be�on�the�plan,�and�the�total�surface�area�of�each�pavement�section�should�be�called�out�as�a�note�on�the�plan.�
APPROACHES & STRATEGIES
� Refer�to�Sandberg�and�Ejsmont�(2002),�which�is�an�excellent�overview�of�quiet�pavement�options,�fundamentals�and�research,�including�a�comprehensive�list�of�33�different�pavement�design�guidelines�for�reducing�tire�pavement�noise.��Where�noise�reduction�levels�are�mentioned�they�refer�to�a�newly�constructed�quiet�pavement�surface�and�relate�it�to�a�more�standard�surface;�often�the�surface�that�was�previously�used�or�previously�measured.�These�noise�reduction�levels�are�difficult�to�compare�fairly�from�one�test/experiment�to�another�because�the�reference�noise�level�is�different�in�many�cases.�
� For�concrete�pavements,�refer�to�Rasmussen�et�al.�(2008)�for�typical�measurement�values�and�methods�to�reduce�tire�pavement�noise.��
� Use�open�graded�hot�mix�asphalt�(HMA)�and�portland�cement�concrete�(PCC).�In�general,�open�graded�pavements�have�shown�noise�reductions�from�3�8�dBA�although�numbers�vary�greatly�depending�upon�materials,�design�and�measurement�techniques�(Sandberg�&�Ejsmont,�2002).�The�following�mixture�qualities�generally�lead�to�less�tire�pavement�noise:�
� High�porosity.�This�means�a�high�level�of�interconnected�air�voids�on�and�near�the�surface.�Typically�effective�air�void�content�ranges�are�15�30%�with�air�void�contents�above�20%�being�better.��
� Smaller�maximum�aggregate�sizes.�Sizes�under�0.4�inches�tend�to�work�well�with�even�smaller�sizes�working�even�better.��
� Smooth�surfaces.�Especially�important�in�the�range�of�“Megatexture”�and�“Macrotexture.”�Megatexture�refers�to�pavement�surface�elevation�changes�on�the�order�of�2�20�inches�in�wavelength,�which�is�often�perceived�as�uneven�waviness�or�rough�surface�imperfections.�Macrotexture�refers�to�pavement�surface�elevation�changes�on�the�order�of�0.2�20�inches,�which�is�in�the�range�of�maximum�aggregate�size.����
� More�coverage.�Open�graded�material�placed�outside�the�travelled�lanes�can�reduce�tire�pavement�noise�propagation�by�its�sound�absorbing�characteristics.��(Sandberg�&�Ejsmont,�2002)�
� Use�texturing�methods�for�PCC.�In�general,�transverse�tining�(the�most�popular�texturing�method�in�the�U.S.)�produces�the�loudest�surfaces�with�alternative�methods�such�as�longitudinal�tining,�carpet�drags�and�diamond�grinding�producing�quieter�surfaces.�(Sandberg�&�Ejsmont,�2002)�
� Use�fine�surface�treatments�with�aggregate�on�the�order�of�0.05�to�0.25�inches.�This�surface�texture�generally�can�also�reduce�noise.�Examples�cited�in�Sandberg�and�Ejsmont�(2002)�included�a�number�of�proprietary�materials�(e.g.,�EP�Grip,�Epoxy�Durop,�Pavetex,�ITALGRIP,�Novachip,�Colsoft,�Safedress,�Masterpave,�Tuffgrip,�Hitex,�Smatex,�UL�M,�Euroduit,�Ultraflex,�Microduit,�Microflex,�Microchape,�Microvile,�Microvia,�Mediflex,�Miniphone,�Citychape,�Colrug,�Viaphone,�Tapiphone)�and�showed�noise�reductions�in�the�range�of�1�6�dBA.�
Example: Sample Calculation
An�existing�four�lane�divided�freeway�is�to�be�resurfaced�with�asphalt�rubber�open�graded�friction�course�(ARFC).�Ten�lane�miles�of�freeway�(5�in�each�direction)�with�12�foot�wide�lanes�are�to�be�resurfaced.�Also,�two�14�foot�wide�off�ramps,�each�2,000�feet�(ft)�long,�and�the�existing�10�ft�wide�shoulders�are�to�be�resurfaced�
456

Greenroads™ Manual v1.5 Pavement Technologies
PT-5 Quiet Pavement
with�dense�graded�HMA�(not�a�quiet�pavement).�The�posted�speed�limit�for�the�freeway�is�65�mph�while�the�posted�speed�limit�for�the�off�ramps�is�40�mph.�
�U�V��%$� � �� �NMTHghONHQ 2 7���� RJhONH8 2 ����RJ�NMTHQ � ����� �RJ��
i$"($�[%�*$*� !���%$�� � ��� �RJ�FRREMhS2���FRREMhSQ2����RJ�jOkH������ �RJ��
�������%$����1$*� � ������ �RJ����� �RJ������3�� �RJ��
)��6�05%6�'$�W��#�l5�$����1$9$"�� � ����� ��3�� ��3���)�
The�area�of�the�shoulders�is�excluded�because�it�is�not�in�the�regularly�trafficked�lanes.�OBSI�tests�after�construction�were�done�at�60�mph�in�accordance�with�AASHTO�TP�76�on�the�inside�northbound�lane.�The�entire�job�consisted�of�one�defined�section.�Within�that�section�there�were�several�curves�but�at�least�one�straight�stretch�of�over�500�ft.�Results�showed�that�the�measured�OBSI�sound�level�on�this�section�was�96.5�dBA.�No�tests�were�run�on�the�ramps�because�they�were�not�surfaced�with�quiet�pavement�and�were�excluded�from�the�quiet�pavement�surface�area�calculation.��
This�project�would�earn�2�points�because�the�minimum�area�requirement�of�75%�was�met�(91.2%�was�achieved)�and�the�maximum�sound�level�as�measured�by�OBSI�of�99�dBA�was�not�exceeded.���
Example: States with Quiet Pavements
Some�of�the�largest�users�of�quiet�pavement�in�the�U.S.�are�Arizona�and�California�A�few�specific�examples�are:��
� The�Arizona�DOT�has�placed�over�4.2�million�tons�of�rubberized�asphalt�(much�of�which�is�asphalt�rubber�friction�course��–�ARFC�–�used�for�noise�reduction)�since�1988�(see�map�of�1988�2001�locations�at:�http://www.asphaltrubber.org/ari/Performance/ADOT_Projects_1998�2001.pdf).�Surface�lives�are�typically�10�12�years�(Morris�and�Carlson,�2001)�with�noise�typically�in�the�96�101�dBA�range�depending�on�conditions�and�age.�
� Caltrans�has�placed�a�significant�amount�of�open�graded�friction�course�throughout�the�state.�Specific�locations�of�sections�to�be�researched�in�the�Caltrans�Quieter�Pavement�Research�Plan�can�be�found�at:�http://www.dot.ca.gov/hq/esc/Translab/ope/QuieterPavements.html.�The�longest�continually�monitored�quiet�pavement�in�the�U.S.�is�a�section�of�I�80�near�Davis,�CA�(http://www.dot.ca.gov/hq/env/noise/pub/IH80_davis_ogacpvmntwtudy_7yrrpt.pdf).��
� The�Washington�State�Department�of�Transportation�(WSDOT)�has�several�pavement�surfaces�under�evaluation�(http://www.wsdot.wa.gov/Projects/QuieterPavement).�PCC�locations�are�at:�http://www.wsdot.wa.gov/NR/rdonlyres/5F022BDB�B9B3�437F�9016�2F1624EA0589/0/QuieterconcreteinWA.pdf�.�Open�graded�HMA�surfaces�at:�http://www.wsdot.wa.gov/Projects/QuieterPavement/Maps.htm.��
Other�states�and�areas�also�have�active�quiet�pavement�use�and�research�programs�including�Georgia,�Alabama,�Florida,�New�Jersey,�New�Mexico,�Minnesota,�Kansas,�United�Kingdom,�Belgium,�the�Netherlands,�Denmark,�Germany,�Austria,�Sweden�and�more.�
POTENTIAL ISSUES
1. Without�adequate�prior�testing�on�the�surface�course�mix�design,�there�is�some�risk�that�the�constructed�surface�course�will�not�meet�the�required�maximum�average�noise�levels�for�this�credit.�
2. In�general,�open�graded�surface�courses�have�shorter�performance�lives�than�traditional�surfacing.�Therefore,�life�cycle�costing�of�the�roadway�surface�should�be�carefully�considered�and�the�potential�for�shorter�service�life�should�be�considered.��
457

Pavement Technologies Greenroads™ Manual v1.5
Quiet Pavement PT-5
3. While�other�methods�may�be�successful,�open�graded�surface�courses�have�been�the�most�thoroughly�researched�and�are�reasonably�well�understood�although�there�are�still�many�unknowns.�
4. Fine�surface�treatments�can�improve�pavement�surface�texture,�but�in�general�these�are�surfaces�used�for�primary�purposes�other�than�noise�reduction.�They�often�have�noise�reduction�values�associated�with�them�but�these�values�often�have�not�been�adequately�tested�or�independently�verified.�
5. Measurement�of�noise�“reduction”�can�be�inconsistent.�Usually�noise�reductions�are�reported�in�relation�to�(1)�an�established�reference�pavement,�(2)�a�comparable�dense�graded�pavement,�or�(3)�the�previous�pavement�surface.�In�all�cases�these�references�are�usually�not�well�defined�or�their�definitions�vary�from�location�to�location.�For�instance,�several�European�countries�have�standard�reference�pavements�from�which�reference�noise�levels�are�measured,�but�these�reference�pavements�vary�from�country�to�country.�Because�of�this�reference�level�dilemma,�two�pavements�with�the�same�measured�tire�pavement�noise�may�be�reported�as�having�entirely�different�noise�reductions.��
RESEARCH This�credit�focuses�on�roadway�noise�from�traffic�that�is�generated�from�a�roadway�project�after�construction�is�complete.�In�particular,�certain�roadway�surfacing�materials�can�be�used�to�reduce�tire�pavement�noise.�For�purposes�of�this�credit,�surfacing�methods�that�reduce�average�tire�pavement�noise�below�defined�On�Board�Sound�Intensity�(OBSI)�levels�(shown�in�Table�PT�5.1)�are�defined�as�“quiet�pavements.”�It�is�worth�noting�that�the�aesthetic�terms�“quiet”�and�“noise”�are�based�entirely�on�subjective�human�perceptions�and�depend�on�a�number�of�variables.�However,�the�decibel�criteria�used�in�this�credit�is�necessary�to�distinguish�and�recognize�roadway�projects�where�teams�intentionally�approach�long�term�noise�mitigation�through�pavement�design.�
Noise�mitigation�efforts�and�alternatives�for�minimizing�temporary�construction�noise�and�long�term�traffic�noise�are�addressed�in�Project�Requirement�PR�5�Noise�Mitigation�Plan�(NMP)�and�also�generally�in�the�first�Project�Requirement,�PR�1�Environmental�Review�Process.�Quiet�pavements�may�be�a�viable�strategy�for�operational�noise�mitigation�for�the�roadway�project,�and�may�be�included�in�both�the�NMP�and�documentation�for�the�project�environmental�review�process.�Details�and�basic�definitions�of�noise,�how�it�is�measured,�and�discussion�of�adverse�human�health�impacts�are�provided�in�PR�5�and�are�not�repeated�here.�
The�following�discussion�focuses�on�details�of�roadway�traffic�noise�and�various�methods�of�designing�the�pavement�section�to�be�quieter�than�conventionally�designed�pavements.�Other�traffic�noise�mitigation�efforts,�such�as�permanent�sound�walls�or�other�common�techniques,�are�not�addressed�by�this�credit.�
Traffic�Noise�Noise�from�a�roadway�is�generated�largely�by�the�traffic�activities�taking�place�on�the�road.�Noise�generated�from�traffic�depends�on�traffic�volume,�traffic�speed,�vehicle�mix,�engine�types,�tire�types,�vehicle�condition,�roadway�geometry�and�physical�features�also�depends�on�the�characteristics�of�the�surrounding�environment�such�as�topography,�development�and�population�density.�Traffic�noise�can�be�disturbing�either�as�a�constant�noise�such�as�a�steady�stream�of�traffic�such�as�from�a�highway�or�as�single�events�such�as�passby�of�a�truck,�bus�or�even�a�car.�Some�typical�noise�levels�you�might�expect�if�you�were�standing�50�feet�away�for�different�vehicle�classes�traveling�at�55�mph�(Michael�Minor�&�Associates,�n.d.):�
� Passenger�cars:�72�74�dBA�� Medium�trucks:�80�82�dBA��� Heavy�trucks:�84�86�dBA�
Traffic�noise�generated�from�vehicles�can�be�further�categorized�into�four�major�sources�(Bernhard�et�al.,�2005):�1)�engine�and�drive�train�noise,�2)�exhaust�noise,�3)�aerodynamic�noise�and�4)�tire�pavement�interaction�noise.�Above�about�30�mph�tire�pavement�noise�is�the�predominant�source�(Bernhard�&�Wayson,�2005).��
458

Greenroads™ Manual v1.5 Pavement Technologies
PT-5 Quiet Pavement
Pavement�Surface�and�Noise�Generation�Tire�pavement�noise�is�influenced�by�both�the�tire�and�pavement�type�and�condition�(Sandberg�&�Ejsmont,�2002).�While�it�may�not�be�realistic�to�regulate�tire�types�and�condition�for�a�particular�project,�pavement�type�can�be�specified�in�project�design.�Some�of�the�characteristics�of�a�pavement�surface�that�can�influence�noise�generation�are�(Sandberg�&�Ejsmont,�2002):�texture�of�the�surface,�skewing�(orientation�of�pavement�texture),�thickness�of�the�pavement,�porosity,�tire�pavement�adhesion�and�elasticity�of�the�pavement�surface.�Also,�as�the�pavement�ages�these�characteristics�often�change�which�can�cause�changes�in�noise�reduction�properties�(Munden,�2006).���
Pavement�Surface�Noise�Measurement�Tire�pavement�noise�can�either�be�measured�from�the�side�of�the�road�as�a�vehicle�passes�by�or�from�a�point�(or�points)�very�near�a�standard�tire�as�it�drives�down�the�road.�There�are�a�number�of�variations�of�noise�measurements�that�can�be�made�in�these�two�manners�but�In�the�U.S.�the�on�board�sound�intensity�(OBSI)�measurement�method�(Figure�PT�5.2)�enjoys�growing�popularity�and�is�the�measurement�upon�which�this�credit�is�based.�This�method�is�most�useful�for�comparing�pavement�surfaces�and�is�relatively�portable�and�cost�effective.�Since�the�OBSI�method�measures�noise�very�near�the�tire,�OBSI�readings�are�not�equivalent�to�noise�readings�alongside�the�roadway.�However,�the�two�can�be�roughly�correlated�(Figure�PT�5.3).�Additionally,�OBSI�measurements�can�vary�by�season�(summer�gives�slightly�lower�values�–�Illingworth�&�Rodkin,�2005),�weather�(wet�pavements�are�noisier)�and�location�(measurements�may�vary�along�the�roadway�surface�by�about�2�dBA:�Bennert�et�al.,�2004).�
�Figure�PT�5.2:�OBSI�measurement�device�(picture�from�Illingworth�&�Rodkin,�Inc.)�
459
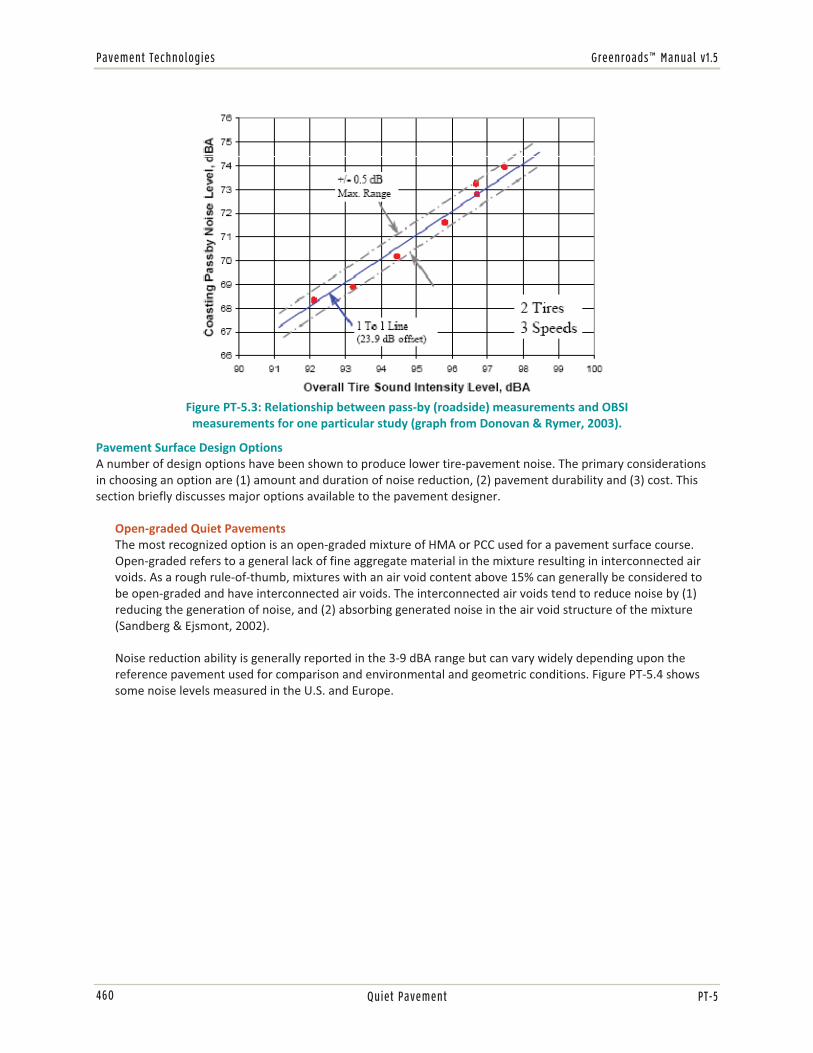
Pavement Technologies Greenroads™ Manual v1.5
Quiet Pavement PT-5
�Figure�PT�5.3:�Relationship�between�pass�by�(roadside)�measurements�and�OBSI�measurements�for�one�particular�study�(graph�from�Donovan�&�Rymer,�2003).�
Pavement�Surface�Design�Options�A�number�of�design�options�have�been�shown�to�produce�lower�tire�pavement�noise.�The�primary�considerations�in�choosing�an�option�are�(1)�amount�and�duration�of�noise�reduction,�(2)�pavement�durability�and�(3)�cost.�This�section�briefly�discusses�major�options�available�to�the�pavement�designer.�
Open�graded�Quiet�Pavements�The�most�recognized�option�is�an�open�graded�mixture�of�HMA�or�PCC�used�for�a�pavement�surface�course.�Open�graded�refers�to�a�general�lack�of�fine�aggregate�material�in�the�mixture�resulting�in�interconnected�air�voids.�As�a�rough�rule�of�thumb,�mixtures�with�an�air�void�content�above�15%�can�generally�be�considered�to�be�open�graded�and�have�interconnected�air�voids.�The�interconnected�air�voids�tend�to�reduce�noise�by�(1)�reducing�the�generation�of�noise,�and�(2)�absorbing�generated�noise�in�the�air�void�structure�of�the�mixture�(Sandberg�&�Ejsmont,�2002).�
Noise�reduction�ability�is�generally�reported�in�the�3�9�dBA�range�but�can�vary�widely�depending�upon�the�reference�pavement�used�for�comparison�and�environmental�and�geometric�conditions.�Figure�PT�5.4�shows�some�noise�levels�measured�in�the�U.S.�and�Europe.��
460

Greenroads™ Manual v1.5 Pavement Technologies
PT-5 Quiet Pavement
�Figure�PT�5.4:�Comparison�of�sound�intensity�levels�for�various�types�of�HMA�open�graded�surface�courses�in�
California,�Arizona�and�Europe�at�97�km/hr�(60�mph).�(From�Donovan,�n.d.)��
In�general,�open�graded�pavement�surfaces�have�equal�or�shorter�service�lives�than�a�standard�pavement�surfaces.�Specifically,�open�graded�pavements�may�have�maximum�service�lives�in�the�8�to�10�year�range�with�the�length�of�effective�noise�reduction�being�somewhat�less.�Bendtsen�et�al.�(2008)�report�that�the�time�history�of�quieting�effect�on�noise�levels�of�various�European�open�graded�pavements�varies�widely�but�that�on�average�one�should�expect�noise�level�increases�per�year�as�seen�in�Table�PT�5.2.��Harvey�et�al.�(2008)�studied�54�California�quiet�pavement�HMA�surfaces�and�found�that�for�any�specific�material�older�pavements�were�generally�louder�than�younger�ones.�However,�the�older�pavements�still�tended�to�produce�less�tire�pavement�noise�than�similar�non�quiet�pavements.��
Table�PT�5.2:�Overall�Time�History�of�Noise�Increase�(in�dBA�per�year)�of�Pavement�Service�Time�for�Various�Pavement�Traffic�Conditions�(From�Bendtsen�et�al.,�2008).�� Light�Vehicles Heavy�Vehicles�Surfacing� High�speed�traffic Low�speed�traffic High�speed traffic� Low�speed�trafficDense�HMA� 0.1� 0.1 0.1 0.1�Porous�Open�graded�HMA� 0.4� 0.9 0.2 ��
�Studded�tire�wear�is�a�major�concern�in�the�longevity�of�open�graded�pavements.�Observations�in�Washington�State�indicate�a�near�total�loss�in�noise�reduction�in�just�over�two�years�for�an�experimental�asphalt�rubber�friction�course�(similar�to�those�paved�in�Arizona)�placed�on�I�5,�and�Bendtsen�et�al.�(2008)�also�describe�durability�under�studded�tire�traffic�as�a�major�concern�noting�that�wear�increases�by�a�power�of�2�with�an�increase�in�speed.�Clogging�of�the�interconnected�air�voids�can�also�be�a�problem.�For�higher�speed�facilities�(on�the�order�of�60�mph)�a�self�cleaning�effect�has�been�found�(Ongel�et�al.,�2008)�resulting�from�the�combination�of�water�(contributed�by�rainfall)�and�a�suction�effect�created�by�tire�pavement�contact.�However,�on�some�pavements�Ongel�et�al.�(2008)�did�not�see�a�cleaning�effect�where�one�was�expected�because�of�high�speed�traffic.�Finally,�Chiba�et�al.�(2008)�found�that�in�Japan�snow�removal�equipment�and�tire�chains�tended�to�damage�open�graded�pavement�surfaces�and�cause�a�loss�of�permeability�after�about�2�years.�This�seems�to�
461

Pavement Technologies Greenroads™ Manual v1.5
Quiet Pavement PT-5
have�led�to�an�increase�in�noise�level�but�measured�noise�levels�after�6�years�were�still�slightly�below�that�for�a�conventional�pavement�surface.��
Costs�for�open�graded�pavement�surfaces�are�typically�reported�as�above�those�for�traditional�surfacing�and�can�command�a�premium�on�a�per�ton�basis�of�20�200%�depending�upon�mix�type,�location�and�availability.��
PCC�Surface�Texturing�Quiet�pavement�options�for�PCC�can�involve�open�graded�PCC�but�can�also�involve�various�means�of�texturing�the�PCC�surface.�Surface�texturing�can�have�a�significant�effect�on�tire�pavement�noise�and�there�are�certain�techniques�that�are�better�than�others.�Table�PT�5.3�lists�surface�texturing�and�typical�noise�levels.�Of�note,�transverse�PCC�joints�also�contribute�significantly�to�noise�levels.��
Table�PT�5.3:�Typical�PCC�Surface�Texturing�and�Average�Noise�Levels.�Measured�by�Rasmussen�et�al.�(2008).�Technique� Typical�Noise�Level NotesTransverse�tining� 104�dBA� Small,�shallow�grooves�across�the�pavement�surface�
transverse�to�the�direction�of�traffic.�The�most�popular�means�of�PCC�pavement�texturing�in�the�U.S.��
Longitudinal�tining� 102�dBA� Small,�shallow�grooves�across�the�pavement�surface�in�line�with�the�direction�of�traffic.�
Carpet�drag� 100.5�dBA� Uneven�texture�created�by�dragging�a�piece�of�artificial�turf�across�the�pavement�surface.�
Diamond�Grinding� 99�dBA� Removes�the�surface�with�a�gang�mounted�spindle�of�saw�blades.�The�resulting�surface�typically�has�a�grooved�appearance�with�the�spacing�and�depth�of�grooves�being�controlled�by�the�technique�used.�
�PCC�texturing�life�depends�on�traffic�and�the�presence�of�studded�tires.�Tining�can�last�in�excess�of�6�years�(WSDOT,�2006)�if�no�significant�stud�traffic�exists�while�experience�in�Washington�State�has�shown�tining�to�last�only�3�6�years�(depending�upon�traffic�levels)�because�of�studded�tire�wear.�The�durability�of�carpet�drag�surfaces�is�not�yet�well�understood.�Finally,�The�American�Concrete�Pavement�Association�expects�a�typical�diamond�grind�to�last�14�years�while�results�from�Idaho�(where�studs�are�allowed)�point�to�10�years�and�results�from�California�(where�studded�tire�wear�is�insignificant)�point�to�16�17�years�(Cotter,�2007).��
PCC�texturing�is�generally�not�as�quiet�as�open�graded�options�but�most�techniques�can�achieve�some�noise�reduction�when�compared�to�transverse�tining.�Rasmussen�et�al.�(2008)�point�out�that�construction�technique�and�details�can�also�influence�texturing�effects�on�noise.�Noise�reduction�strategies�that�rely�on�diamond�grinding�usually�design�the�original�pavement�thicker�than�needed�to�compensate�for�the�loss�in�thickness�resulting�from�each�grinding.�While�this�technique�works,�it�may�not�be�sustainable�beyond�2�3�grinding�operations.�Finally,�studded�tire�wear�can�greatly�reduce�the�life�expectancy�of�any�surface�texturing�technique.���
With�the�exception�of�diamond�grinding,�PCC�surface�texturing�is�a�standard�procedure�and�thus,�does�not�command�a�premium.�Diamond�grinding�costs�can�vary�widely�depending�upon�quantity,�aggregate�hardness,�contractor�availability�and�geometry.�Some�example�5�year�average�costs�provided�during�the�open�comment�period�for�Version�1.0�are:��
� Washington:�$9.45/yd2�� Kentucky:�$2.67/yd2�� Washington:�$2.27/yd2�
Other�Techniques�Other�surfacing�techniques�that�are�not�engineered�primarily�for�noise�reduction�have�been�shown�to�be�somewhat�quieter�than�conventional�methods.�Proprietary�thin�surfacing�and�stone�matrix�asphalt�(SMA,�which�is�a�gap�graded�mixture)�are�the�two�most�commonly�cited�surfaces.�Both�work�by�creating�a�negative�texture�
462

Greenroads™ Manual v1.5 Pavement Technologies
PT-5 Quiet Pavement
(where�a�majority�of�the�surface�texture�is�at�the�same�height�with�small�air�void�indentations)�and/or�using�smaller�maximum�aggregate�sizes�(e.g.,�3/8�inch�or�smaller�in�HMA).��One�concern�with�these�types�of�surfacing�methods�is�that�they�may�lose�their�noise�reduction�capabilities�more�quickly�than�pavements�specifically�engineered�to�reduce�noise.�Harvey�et�al.�(2008)�found�that�Caltrans�RAC�G�mixes�(a�gap�graded�mixture)�increased�noise�levels�over�the�first�several�years�to�where�there�were�comparable�to�a�typical�1/2�inch�dense�graded�HMA.�
Prices�for�these�surfacing�methods�vary�widely.�Proprietary�mixtures�are�generally�not�predictable�while�SMAs�may�cost�20�30%�more�than�traditional�dense�graded�HMA�surfacing�on�a�per�ton�basis.��
GLOSSARY
AASHTO� American�Association�of�State�Highway�Tranportation�Officials�dB� DecibeldBA� A�weighted�decibelsFt� foot�(feet)HMA� Hot�mix�asphaltMi� mile(s)Mph� miles�per�hourNoise� Unwanted�soundOBSI� On�Board�Sound�IntensityPCC� Portland�cement�concreteSMA� Stone�matrix�asphalt�
REFERENCES Bendtsen,�H.,�Kragh,�J.,�&�Nielsen,�E.,�ed.�(2008).�Use�of�noise�reducing�pavements�–�European�experience.�
Technical�note�69,�Danish�Road�Institute,�Denmark.�http://www.dot.ca.gov/hq/esc/Translab/ope/DRI�DK�TechNote�69�Report.pdf.���
Bennert,�T.,�Hanson,�D.,�&�Maher,�A.�(2004).�Demonstration�Project�–�The�Measurement�of�Pavement�Noise�on�New�Jersey�Pavements�Using�the�NCAT�Noise�Trailer.�Report�No.�FHWA�NJ�2003�021.�New�Jersey�Department�of�Transportation,�Trenton,�NJ.�
Bernhard,�R.J.�&�Wayson,�R.L.�(2005).�An�Introduction�to�Tire/Pavement�Noise�of�Asphalt�Pavement.�Department�of�Civil�&�Environmental�Engineering,�University�of�Central�Florida,�SQDH�2005�1.�Accessed�18�September�2008.�Available�at�the�Asphalt�Alliance�website�at�http://www.quietpavement.com/docs/AnIntroductiontoTire�PavementNoiseofAsphaltPavement.pdf�
Cotter,�A.�(2007).�Best�Practices�for�PCC�Pavements�in�Washington�State:�Studded�Tire�Wear�Mitigation.�Master’s�Thesis,�University�of�Washington,�Seattle,�WA.�
Donavan,�P.�R.�&�B.�Rymer.�(2003).�Assessment�of�Highway�Pavements�for�Tire/Road�Noise�Generation.�SAE�Noise�&�Vibration�Conference�and�Exhibition,�Grand�Traverse,�MI,�USA,�Session:�Drive�By�Noise.�
Donovan,�P.R.�(no�date�given).�Comparative�Measurements�of�Tire/Pavement�Noise�in�Europe�and�the�United�States:�A�Summary�of�the�NITE�Study.�Illingworth�&�Rodkin,�Inc.�prepared�for�the�California�Department�of�Transportation,�Sacramento,�CA.��
Environmental�Protection�Agency�(EPA).�(1973,�July)�Public�Health�and�Welfare�Criteria�for�Noise.�(550/9�73�002).�Office�of�Noise�Abatement�and�Control�(ONAC).�Washington,�D.C.:�EPA,�ONAC.�Accessed�January�1,�2010.�Available�at�http://www.nonoise.org/epa/Roll1/roll1doc3.pdf��
463
Pavement Technologies Greenroads™ Manual v1.5
Quiet Pavement PT-5
Environmental�Protection�Agency�(EPA).�(1978).�Noise:�A�Health�Problem.�EPA,�Office�of�Noise�Abatement�and�Control,�Washington,�DC.�Office�of�Noise�Abatement�and�Control�(ONAC).�Washington,�D.C.:�EPA,�ONAC.�Accessed�January�1,�2010.��Available�at�http://www.nonoise.org/epa/Roll15/roll15doc152.pdf�
Illingworth�&�Rodkin,�Inc.�(2005).�I�80�Davis�OGAC�Pavement�Noise�Study:�Traffic�Noise�Levels�Associated�with�Aging�Open�Grade�Asphalt�Concrete�Overlay,�7th�Year�Summary�Report.�Prepared�for�the�California�Department�of�Transportation,�Division�of�Environmental�Analysis,�Sacramento,�CA.�
Michael�Minor�and�Associates.�Traffic�Noise�Background�Information.�Michael�Minor�and�Associates,�Portland,�OR.�Accessed�24�September�2008.�Available�at�http://www.drnoise.com/PDF_files/Traffic%20Noise%20Primer.pdf.�
Morris,�G.R.�&�Carlson,�D.D.�(2001).�The�Arizona�Rubber�Project�Review�Part�1:�Evaluation�of�A�R�Pavements�Constructed�Before�1992.�Arizona�Department�of�Transportation�and�the�Rubber�Pavements�Association.��
Munden,�H.�(2006).�Lower�Noise�Pavement�Options�For�Washington�State.�Master�Thesis,�Department�of�Civil�&�Environmental�Engineering,�University�of�Washington.�
Passchier�Vermeer,�W�&�Passchier,�W.F.�(2000).�Noise�Exposure�and�Public�Health.�Environ.�Health�Perspect.�Vol.�108,�Suppl�1,�pp.�123�131.�
Rasmussen,�R.O.,�Garber,�S.I.,�Fick,�G.J.,�Ferragut,�T.R.,�&�Wiegand,�P.D.�(2008).�How�to�Reduce�Tire�Pavement�Noise:�Interim�Better�Practices�for�Constructing�and�Texturing�Concrete�Pavement�Surfaces.�National�Concrete�Pavement�Technology�Center,�Ames,�IA.��
Sandberg,�U.�&�Ejsmont,�J.A.�(2002).�Tyre/Road�Noise�Reference�Book.�Informex�Ejsmont�&�Sandberg�Handelsbolag,�Sweden.��
Washington�State�Department�of�Transportation�(WSDOT).�(2006).�Pavements�and�Studded�Tire�Damage.�WSDOT�Materials�Laboratory,�Olympia,�WA.�Accessed�25�September�2008.�Available�at�http://www.wsdot.wa.gov/biz/mats/pavement/PavementsStuddedTiresFinalv2.pdf�
�
464

Greenroads™ Manual v1.5 Pavement Technologies
PT-6 Pavement Performance Tracking
PAVEMENT PERFORMANCE TRACKING GOAL Allow�for�more�thorough�performance�tracking�by�integrating�construction�quality�and�pavement�performance�data.�
CREDIT REQUIREMENTS Use�a�process�that�allows�construction�quality�measurements�and�long�term�pavement�performance�measurements�to�be�spatially�located�and�correlated�to�one�another.�This�implies�four�requirements:��
1. Construction�quality�measurements�must�be�spatially�located�such�that�the�location�of�the�quality�measurement�is�known�to�within�25�ft�of�the�actual�location�where�the�material�or�process�that�was�measured�is�actually�located.�
2. Pavement�condition�measurements�must�be�taken�at�least�every�2�years�and�must�be�spatially�located�to�a�specific�portion�of�roadway�or�location�within�the�roadway.�
3. An�operational�system,�computer�based�or�otherwise,�that�is�capable�of�storing�construction�quality�measurements,�pavement�condition�measurements�and�their�spatial�locations.��
4. The�designated�system�must�be�demonstrated�in�operation,�be�capable�of�updates�and�have�written�plans�for�its�maintenance�in�perpetuity.�
Details
This�generally�means�spatially�locating�construction�quality�measurements�in�a�permanent�location�system�and�maintaining�those�records�indefinitely.�Examples�of�construction�quality�records�include�but�are�not�limited�to:�
� Density�tests�� Water�content�tests�� Air�content�tests�� Slump�tests�� Compressive�strength�tests�� Asphalt�content�tests�� Gradation�tests�
Examples�of�pavement�condition�measurements�include,�but�are�not�limited�to,�the�extent�and�severity�of:�
� Cracking�� Permanent�deformation�(rutting)�� Bleeding�or�flushing�(in�relation�to�hot�mix�asphalt�pavements)�� Faulting�(in�relation�to�portland�cement�concrete�pavements)�� Joint�spalling�(in�relation�to�portland�cement�concrete�pavements.�
DOCUMENTATION � A�signed�letter�from�an�owner�official�stating�that�the�performance�tracking�system�
is�operational�and�has�been�populated�with�the�required�data.�
PT-6
1 POINT
RELATED CREDITS
� PR�4�Quality�Control�Plan�
� PR�9�Asset�Management�Plan�
� CA�1�Quality�Management�System
SUSTAINABILITY COMPONENTS
� Extent�� Expectations�� Experience�� Exposure�
BENEFITS
� Increases�Service�Life� Reduces�Lifecycle�
Costs�� Improves�
Accountability�� Creates�New�
Information�
465
Pavement Technologies Greenroads™ Manual v1.5
Pavement Performance Tracking PT-6
APPROACHES & STRATEGIES
Develop�and�implement�a�pavement�performance�tracking�system.�Off�the�shelf�systems�that�meet�the�credit�requirements�are�difficult�if�not�impossible�to�find.��
Example: Sample Systems
Two�examples�of�systems�that�could�accomplish�the�intent�of�this�credit�are:�
HMA�View.�A�web�based�system�developed�at�the�University�of�Washington�between�2000�and�2004�(White�et�al.,�2002).�No�significant�development�has�happened�since�about�2005�and�it�is�not�ready�for�commercial�use.�However,�it�does�demonstrate�that�such�a�system�can�be�created�and�does�work.�It�is�capable�of�maintaining�construction�quality�and�pavement�condition�records�in�the�same�database.�The�spatial�location�feature�was�never�fully�developed.�The�system�was�used�for�a�time�by�the�Washington�State�Department�of�Transportation�(WSDOT)�and�the�Maryland�State�Highway�Administration�(SHA).��
Pavement�Interactive�(PI)�Maps.�An�system�in�proof�of�concept�stage�developed�in�2008�9�and�accessible�at:�http://maps.pavementinteractive.org.�PI�Maps�is�a�tool�for�storing�and�sharing�spatial�data.�It�is�currently�in�a�public�beta�testing�period,�so�the�functionality�may�change�from�time�to�time.�PI�Maps�uses�the�Google�Maps�API�to�allow�viewing�and�input�of�points,�lines,�and�polygons.�PI�Maps�runs�on�Google�App�Engine,�so�it�takes�advantage�of�Google's�robust�storage�and�server�infrastructure,�which�allows�users�to�have�confidence�in�their�data's�well�being.��
Google�My�Maps�or�Windows�Live�Local�Application.�At�the�very�simplest�level,�a�Google�My�Maps�(http://maps.google.com)�could�be�created�and�a�placemarker�could�be�used�to�designate�testing�with�the�associated�text�used�to�describe�the�test�and�test�result.�Pavement�condition�could�be�described�in�association�with�a�line�that�is�drawn�over�the�particular�section�of�roadway�being�documented.�While�this�system�is�simple�it�could�quickly�become�unwieldy�for�larger�organizations�such�as�large�cities,�counties�and�states.��
POTENTIAL ISSUES
1. The�general�trend�in�road�construction�is�to�dispose�of�construction�records�after�a�prescribed�amount�of�time.�Usually�this�time�is�set�by�legal�obligations,�but�for�this�credit,�records�would�not�be�able�to�be�disposed.�
2. There�are�no�existing�commercially�available�systems�for�accomplishing�the�actions�of�this�credit.�Where�no�system�exists,�implementing�this�credit�(i.e.�creating�a�system�from�scratch)�will�likely�be�very�difficult.�The�project�team�has�to�develop�a�system�or�the�owner�must�want�to�develop�or�operate�a�system�like�this�independent�of�the�Greenroads�credit.�However,�long�term�benefits�of�such�a�system�may�outweigh�the�costs�of�designing�and�implementing�one.�
3. It�is�difficult�to�define�the�concepts�of�performance�and�quality�in�simple�terms.�Tying�construction�quality�and�pavement�performance�data�together�can�involve�some�very�specific�ideas.�
4. The�location�of�the�construction�quality�test�should�be�the�final�location�of�the�material�or�process�associated�with�the�test�and�not�the�laboratory�or�testing�location.�
5. Currently�there�is�no�major�organization�that�integrates�construction�quality�control�data�with�long�term�pavement�performance�data.�As�a�result,�it�is�difficult�to�trace�pavement�performance�issues�back�to�construction�quality.��
RESEARCH Many�other�industries�(e.g.,�computers,�automobiles,�etc.)�are�able�to�trace�each�element�of�their�final�assembly�back�to�original�construction.�The�ability�to�accomplish�this�would�improve�pavement�performance�through�a�better�understanding�of�how�construction�quality�influences�long�term�pavement�performance�and�allow�existing�data�to�be�better�used�to�evaluate�the�performance�of�new�materials,�concepts�and�design�methods.�Due�to�the�limited�research�in�this�area�for�pavements,�this�section�is�necessarily�short.��
466

Greenroads™ Manual v1.5 Pavement Technologies
PT-6 Pavement Performance Tracking
Current�Means�of�Performance�Tracking�Almost�all�agencies�that�track�pavement�performance�do�so�by�measuring�surface�defects�and�their�qualities�including�such�items�as:�cracking�(longitudinal,�transverse,�reflective,�alligator),�rutting,�raveling,�faulting,�spalling,�roughness,�etc.).�However,�databases�that�contain�this�information�do�not,�as�a�general�rule�contain�construction�information�and�therefore�are�unable�to�link�pavement�performance�with�construction�data.�Typically�construction�data�is�saved�for�a�finite�amount�of�time�(e.g.,�3�or�5�years)�and�then�discarded.��
The�Problem�with�Unlinked�Data�Hudson�et�al.�(2002)�describe�the�problem�when�referring�to�their�interview�results�with�several�state�departments�of�transportation�(DOTs):��
“One�of�the�main�challenges�discovered�in�all�the�states�visited�is�the�absence�of�a�convenient�link�between�essential�data�on�materials�characteristics�used�in�each�project�on�the�one�hand�and�PMS�[Pavement�Management�System]�data�including�performance�data�on�the�other.�This�is�most�often�caused�by�the�fact�that�the�first�group�of�data�(information�on�design,�testing,�inplace�properties,�thickness,�and�QA�data)�is�commonly�stored�in�flat�files,�difficult�to�access�and�sometimes�incomplete…Performance�data�can�only�be�linked�to�materials�and�construction�data�when�use�is�made�of�a�common�locator�reference.”�
The�General�Solution�Provide�a�pavement�performance�database�that�is�linked�spatially�to�a�pavement�construction�database.�This�means�that�both�performance�and�construction�data�must�be�available�electronically.�Whereas�10�years�ago�this�was�not�likely�(construction�files�were�often�paper�files),�today�it�is�more�likely�since�most�files�are�now�stored�electronically.�Ideally,�linking�and�storage�could�be�accomplished�in�a�web�based�system�(White�et�al.,�2002).�To�improve�efficiency,�White�et�al.�(2002)�proposed�that�construction�data�be�initially�recorded�in�electronic�form�and�geotagged�at�the�construction�site.�This�would�typically�involve�hand�held�data�entry�devices�and�GPS�units.�At�the�time�(2002)�these�types�of�GPS�units�were�less�common,�however�now�they�are�relatively�cheap�and�are�routinely�included�in�personal�electronics�such�as�smart�phones.��
Demonstration�of�a�Pavement�Performance�Tracking�System�Both�Hudson�et�al.�(2002)�and�White�et�al.�(2002)�describe�the�system�developed�primarily�by�White�et�al.�called�“HMA�View”�that�allows�integrated�performance�data�to�be�uploaded,�displayed�and�analyzed�on�the�web.�Figure�PT�6.1�shows�the�basic�architecture�of�what�became�HMA�View�(at�the�time�it�was�simply�known�as�the�“hot�mix�database”).�This�basic�architecture�(minus�the�mobile�field�setup)�was�demonstrated�on�a�limited�basis�with�the�Maryland�State�Highway�Administration�(MDSHA)�and�the�Washington�State�Department�of�Transportation�(WSDOT)�in�the�mid�2000s�but�has�not�been�receiving�new�data�since�2005�and�has�not�been�operational�since�about�2007.�Currently,�there�are�no�plans�to�re�start�the�system�or�refine�it.��
467

Pavement Technologies Greenroads™ Manual v1.5
Pavement Performance Tracking PT-6
�
Figure�PT�6.1:�Overview�of�content�acquisition�and�delivery�for�HMA�View�(from�White�et�al.,�2002).��
REFERENCES Hudson,�W.R.,�Monismith,�C.L.,�Dougan,�C.E.,�&�Visser,�W.�(2002).�Use�of�PMS�Data�For�Performance�Monitoring�
With�Superpave�As�An�Example.�Volume�1.�FHWA�Contract�DTFH61�98�C�00075,�B98C75�007�Battelle�Subcontract�156421���TRDI�Project�001.�http://www.fhwa.dot.gov/pavement/management/pms.cfm.�Accessed�8�January�2010.�
White,�G.C.,�Mahoney,�J.P.,�Turkiyyah,�G.M.,�Willoughby,�K.A.,�&�Brown,�E.R.�(2002).�Online�Tools�for�Hot�Mix�Asphalt�Monitoring.�Transportation�Research�Record,�No.�1813,�Transportation�Research�Board,�National�Research�Council,�Washington,�D.C.�p.�124�132.�
468

Greenroads Manual v1.5 © 2011
�
�
�
�
�
�
�
CUSTOM CREDIT
� �
469

Greenroads Manual v1.5 © 2011
�
470
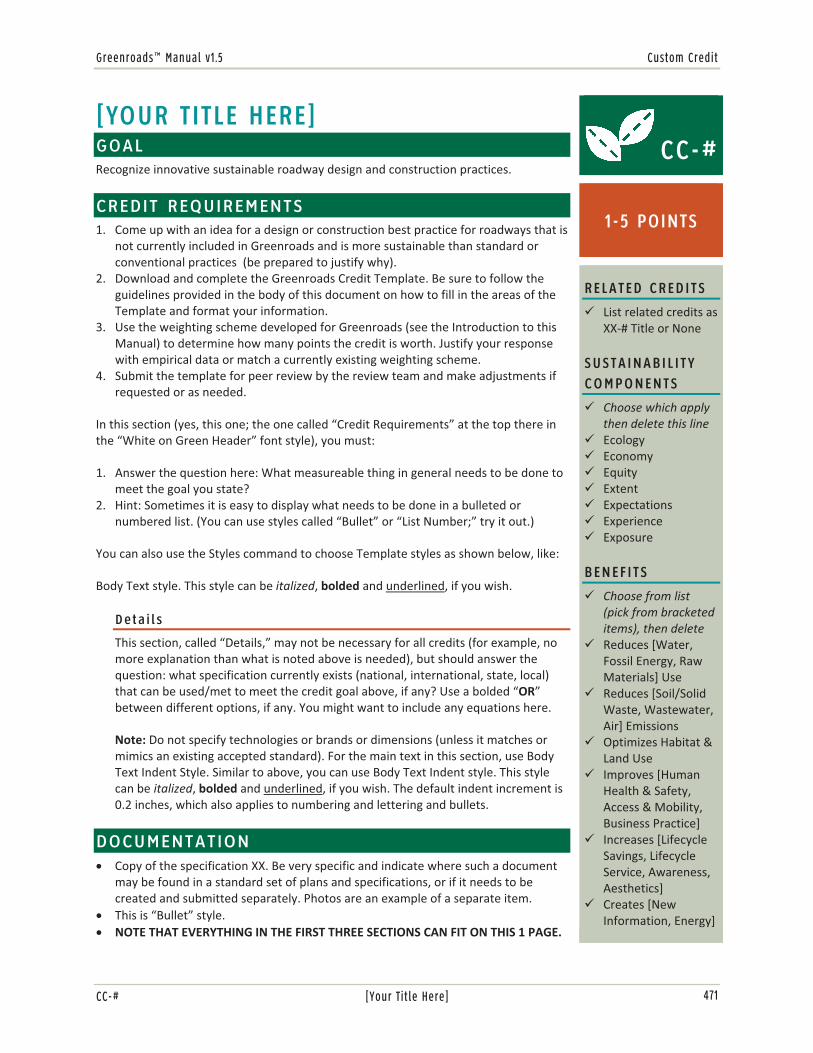
Greenroads™ Manual v1.5 Custom Credit
CC-# [Your Title Here]
[YOUR TITLE HERE] GOAL Recognize�innovative�sustainable�roadway�design�and�construction�practices.�
CREDIT REQUIREMENTS 1. Come�up�with�an�idea�for�a�design�or�construction�best�practice�for�roadways�that�is�
not�currently�included�in�Greenroads�and�is�more�sustainable�than�standard�or�conventional�practices��(be�prepared�to�justify�why).�
2. Download�and�complete�the�Greenroads�Credit�Template.�Be�sure�to�follow�the�guidelines�provided�in�the�body�of�this�document�on�how�to�fill�in�the�areas�of�the�Template�and�format�your�information.�
3. Use�the�weighting�scheme�developed�for�Greenroads�(see�the�Introduction�to�this�Manual)�to�determine�how�many�points�the�credit�is�worth.�Justify�your�response�with�empirical�data�or�match�a�currently�existing�weighting�scheme.�
4. Submit�the�template�for�peer�review�by�the�review�team�and�make�adjustments�if�requested�or�as�needed.�
In�this�section�(yes,�this�one;�the�one�called�“Credit�Requirements”�at�the�top�there�in�the�“White�on�Green�Header”�font�style),�you�must:�
1. Answer�the�question�here:�What�measureable�thing�in�general�needs�to�be�done�to�meet�the�goal�you�state?�
2. Hint:�Sometimes�it�is�easy�to�display�what�needs�to�be�done�in�a�bulleted�or�numbered�list.�(You�can�use�styles�called�“Bullet”�or�“List�Number;”�try�it�out.)�
You�can�also�use�the�Styles�command�to�choose�Template�styles�as�shown�below,�like:�
Body�Text�style.�This�style�can�be�italized,�bolded�and�underlined,�if�you�wish.�
Details
This�section,�called�“Details,”�may�not�be�necessary�for�all�credits�(for�example,�no�more�explanation�than�what�is�noted�above�is�needed),�but�should�answer�the�question:�what�specification�currently�exists�(national,�international,�state,�local)�that�can�be�used/met�to�meet�the�credit�goal�above,�if�any?�Use�a�bolded�“OR”�between�different�options,�if�any.�You�might�want�to�include�any�equations�here.�
Note:�Do�not�specify�technologies�or�brands�or�dimensions�(unless�it�matches�or�mimics�an�existing�accepted�standard).�For�the�main�text�in�this�section,�use�Body�Text�Indent�Style.�Similar�to�above,�you�can�use�Body�Text�Indent�style.�This�style�can�be�italized,�bolded�and�underlined,�if�you�wish.�The�default�indent�increment�is�0.2�inches,�which�also�applies�to�numbering�and�lettering�and�bullets.�
DOCUMENTATION � Copy�of�the�specification�XX.�Be�very�specific�and�indicate�where�such�a�document�
may�be�found�in�a�standard�set�of�plans�and�specifications,�or�if�it�needs�to�be�created�and�submitted�separately.�Photos�are�an�example�of�a�separate�item.�
� This�is�“Bullet”�style.�� NOTE�THAT�EVERYTHING�IN�THE�FIRST�THREE�SECTIONS�CAN�FIT�ON�THIS�1�PAGE.�
CC-#
1-5 POINTS
RELATED CREDITS
� List�related�credits�as�XX�#�Title�or�None�
SUSTAINABILITY COMPONENTS
� Choose�which�apply�then�delete�this�line�
� Ecology�� Economy�� Equity�� Extent�� Expectations�� Experience�� Exposure�
BENEFITS
� Choose�from�list�(pick�from�bracketed�items),�then�delete�
� Reduces�[Water,�Fossil�Energy,�Raw�Materials]�Use�
� Reduces�[Soil/Solid�Waste,�Wastewater,��Air]�Emissions�
� Optimizes�Habitat�&�Land�Use�
� Improves�[Human�Health�&�Safety,�Access�&�Mobility,�Business�Practice]�
� Increases�[Lifecycle�Savings,�Lifecycle�Service,�Awareness,�Aesthetics]�
� Creates�[New�Information,�Energy]
471

Custom Credit Greenroads™ Manual v1.5
[Your Title Here] CC-#
APPROACHES & STRATEGIES
Explain�some�common�approaches�and�strategies�in�this�section.�This�is�where�practical�experience�comes�in�very�handy,�especially�when�it�can�be�explained�in�a�few�short�words.�The�heading�above�is�in�the�style�called�“Heading�Blue�Line.”�There�should�be�a�page�break�before�this�section,�even�if�the�first�page�of�the�credit�overlaps�onto�a�second�page�(see�last�sentence�on�first�page�though).�
� Bullet�style�is�often�an�easy�way�to�display�approaches�and�strategies�in�this�section.�
� You�can�use�Bullet�Indent�style�to�note�subtopics�under�each�strategy�or�approach,�too.�
Below�is�an�example�of�a�table�for�text�or�numbers.�Table�borders�should�be�outlined�with�simple�boxes�using�the�official�Greenroads�color�of�gray�(if�you�should�need�to�know�the�color�palette�to�make�adjustments���which�you�should�not���please�contact�your�Greenroads�reviewer).�Important�items�in�the�table�can�be�bolded�or�italicized�manually�for�emphasis,�such�as�headings.�Text�in�the�tables�is�style�No�Spacing.�Note�that�all�tables�have�a�0.2”�bottom�separation�from�text�on�the�bottom,�which�is�accomplished�by�adding�a�carriage�return�(a�blank�line)�in�the�No�Spacing�style,�followed�by�Body�Text,�Body�Text�Indent�(if�table�is�indented),�or�one�of�the�heading�fonts�for�a�new�section.��
Table�XX�#.1:�Table�of�Values�or�Text�Items�Item�1� Sample�text�or�numbers�in�No�Spacing�style XX.XXItem�2� Sample�text�or�numbers� XX.XX�A�line�underneath�tables�should�have�no�text�and�be�in�style�No�Spacing,��
�Note:�If�this�is�an�indented�table,�use�Body�Text�Indent�following�the�single�No�Spacing�line�(just�like�this�paragraph�and�the�preceding�line).�
Example: Case Study [or Calculation]
This�section�can�be�used�to�demonstrate�how�a�credit�was�achieved.�It�is�optional,�but�a�good�idea,�especially�if�you�are�profiling�something�you�did�on�your�own�project�that�supports�the�case�for�award�of�this�credit.�If�numbers�are�used�to�compute�a�credit,�this�is�where�examples�are�worked.�(Be�sure�to�title�the�header�appropriately.�Note�also�that�you�can�have�more�than�one�example�too!)�This�is�“Body�Text�Indent”�style.�The�heading�style�for�the�Examples�section�is�called�Indented�Heading�Orange�Line.�
� This�is�“Bullet�Indent”�style.�� Avoid�highlighting�specific�products�where�possible.�
Here�is�an�example�of�a�photo�(they�can�be�bigger�or�placed�in�pairs�in�table�cells).�It�is�embedded�in�a�table�cell�that�is�aligned�for�the�width�of�the�headed�section�and�centered�in�the�cell.�Figures�are�labeled�similar�to�tables,�with�the�style�called�Caption,�but�the�Figure�and�the�Figure�caption�are�centered�below�image�in�the�same�cell.�
�Figure�CC�#.1:�A�snowy�stock�photo.�(Windows�2000)�
472

Greenroads™ Manual v1.5 Custom Credit
CC-# [Your Title Here]
POTENTIAL ISSUES
1. Write�“None”�here�or�provide�a�short�summary�of�what�might�go�wrong�when�trying�to�implement�the�credit�(based�on�the�research�or�pilot�projects).�If�you�have�misgivings�about�this�credit,�or�are�aware�of�any�tradeoffs�that�have�been�encountered�along�the�way,�put�them�on�the�table�by�including�them�here.�
2. Explanation�of�another�potential�issue�if�any.�This�is�“List�Number”�style.�
RESEARCH The�Greenroads�Rating�System�is�a�collection�of�best�practices�for�design�and�construction�of�roadway�projects.�Greenroads�supports�sustainable�performance�and�design�goals�that�go�beyond�most�existing�federal,�state,�and�local�regulations.�If�you�find�yourself�writing�a�Greenroads�credit,�what�you�write�should�fit�within�this�framework.�
Credit�Writing�101�Greenroads�understands�that�we�have�not�been�able�to�recognize�all�possible�sustainable�innovations�and�best�practices�because�roadway�projects�are�very�diverse�and�specialized.�This�credit�category,�Custom�Credits,�is�designed�to�represent�user�contributions�to�the�ongoing�development�of�Greenroads�via�cutting�edge�research�and�innovative�design�and�construction�practices.�
Before�You�Write�Before�you�write�the�credit�(and�as�you�are�writing�it)�consider�whether�or�not�this�credit�should�even�exist.�Could�it�be�replaced�by�another�credit�that�makes�more�sense?�Should�it�be�fundamentally�different?�Is�it�needed�at�all?�We�are�hoping�that�the�credit�writer�exercises�her/his�expertise�here�and�gives�this�some�good�thought.�A�Custom�Credit�must�demonstrate�beneficial�impacts�on�the�overall�sustainability�of�the�roadway�system�and�demonstrate�at�least�one�of�the�seven�components�of�sustainability:�Ecology,�Equity,�Economy,�Extent,�Expectations,�Experience�and�Exposure.�If�you�are�wondering�what�those�ideas�are�all�about,�read�the�introduction�to�the�Greenroads�Manual�one�more�time�and�get�familiar�with�the�philosophy�that�underlies�all�of�the�credits�and�requirements�in�the�system.�
Writing�a�Good�Credit�Ultimately,�Greenroads�credits�have�the�following�characteristics.�
� Straightforward�and�understandable.�Simplicity�is�valued�over�excessive�detail�because�it�is�more�understandable.�Credits�are�often�simplistic�interpretations�of�complex�ideas;�they�are�bound�to�contain�some�controversy,�however�the�interpretation�should�hold�true�to�the�fundamental�idea�and�intent.�
� Supported�by�empirical�evidence�and�existing�evaluative�techniques.�Credits�should�be�thoroughly�researched,�based�on�empirical�evidence�when�available,�and,�to�the�extent�possible,�capable�of�evaluation�using�existing�tools,�techniques�and�documentation.�Greenroads�does�not�seek�to�develop�evaluation�tools�or�subsets�of�metrics�at�the�credit�level.�
� Commensurate�with�Impact.�High�investment�long�term�impact�items�are�given�more�credit�than�low�investment�short�term�impact�items.�The�weighting�scheme�is�explained�later�in�this�document.�
� Flexible�and�dynamic.�The�system�shall�continually�evolve.�Over�time,�better�ideas,�more�complete�knowledge,�and�technology�advances�will�require�Greenroads�to�be�updated�and�changed.�
� Supported�by�existing�project�documents�where�possible.�Most�credits,�with�very�few�exceptions,�should�be�able�to�be�clearly�specified�and�incorporated�into�a�project�using�typical�contract�documentation�such�as�plans,�specifications�and�design�reports.�Any�additional�documents�should�be�simple�and�inexpensive�to�produce�(and�digital�wherever�possible)�and�also�may�use�other�standard�reports�such�as�standard�construction�quality�control�reports,�change�orders,�etc.�No�new�or�unfamiliar�types�of�documentation�should�be�necessary�to�satisfy�credit�intent.�
� Verifiable�by�a�design�professional�or�inspection�agency.�The�Greenroads�system�shall�presuppose�the�integrity�of�individuals,�unless�proven�otherwise,�and�hold�accountable�the�professionals�involved.�
473

Custom Credit Greenroads™ Manual v1.5
[Your Title Here] CC-#
Once�you�have�your�idea�ready�to�put�into�words,�download�this�Greenroads�Credit�Template�and�start�editing�it�in�place.�If�you�have�read�this�far,�you�have�probably�noted�the�suggestions�for�what�to�include�in�previous�parts�of�the�template�as�far�as�content,�as�well�as�suggestions�for�formatting�and�presenting�your�ideas.�
The�necessary�sections�of�a�Greenroads�credit�are�listed�briefly�in�Table�CC�X.2.�Each�part�listed�below�is�essential�to�making�the�credit�complete.�
Table�CC�X.2:�Greenroads�Credit�Structure�MAIN�BODY� OPTIONAL FRONT�PAGE�SIDEBAR�Credit�Title� Credit�NumberGoal� PointsCredit�Requirements� Details Related�CreditsDocumentation� Sustainability�Components�Approaches�&�Strategies� Examples BenefitsPotential�Issues�Research� GlossaryReferences��The�remainder�of�this�document�provides�guidance�regarding�content�and�intent�of�each�of�the�sections�listed�above.�Additionally,�there�are�formatting�suggestions�for�the�Research�section.�
Credit�Title�Name�your�credit�in�three�words�or�less.�
Goal�State�the�overall�goal�of�the�credit.�
� This�should�be�no�more�than�two�full�sentences,�written�concisely,�in�plain�language�and�in�imperative�tense.�� The�overall�goal�of�the�credit�should�be�written�in�the�simplest�terms�possible�to�make�it�clear�to�even�the�
casual�observer�what�is�desired.�It�should�be�free�of�technical�jargon�or�long,�rambling�sentences.�For�instance,�the�goal�for�the�Roadway�Safety�Audit�credit�would�be�better�as�"Reduce�roadway�crashes�and�fatalities"�rather�than�"Improve�the�safety�of�the�roadway�corridor�through�a�multi�disciplinary�audit�whose�purpose�is�to�reduce�pedestrian,�bicycle�and�motor�vehicle�safety�issues�related�to�public�mobility."�It�is�obvious�that�the�first�is�more�simple�and�straightforward.�The�subtleties�of�credit�may�not�be�obvious�by�the�goal�statement�but�the�goal�should�be�crystal�clear.�
� If�the�credit�is�based�on�some�other�standard�method�of�practice�or�documentation�(like�the�AE�1�Roadway�Safety�Audit�credit�is�based�on�NCHRP�Synthesis�336)�then�it�is�helpful�to�look�in�that�document�for�a�simple�goal�statement.�(See�also�“Research”�below.)�
Credit�Requirements�Write�the�simple�text�describing�what�must�be�done.�
� If�you�think�there�should�be�different�point�values�associated�with�doing�different�steps,�specify�how�many�points�that�activity�is�worth.�For�example,�the�MR�4�Recycled�Materials�credit�is�worth�up�to�5�points,�but�it�is�awarded�in�10%�increments�each�worth�1�point.�
� The�credit�requirements�should�be�written�in�clear,�simple�terms�to�make�it�obvious�what�must�be�done�to�earn�the�credit�or�credits.�Again,�simplicity�is�the�key.�The�litmus�test�is�that�a�decision�maker�(e.g.,�politician,�executive,�department�head,�etc.)�without�detailed�knowledge�of�transportation�design�or�construction�should�understand�what�must�be�done.�They�may�not�understand�the�details�but�they�should�have�a�general�idea�about�what�action�must�be�taken�to�achieve�the�credit.�
� Do�not�develop�standards�of�practice,�measurement�techniques�or�any�other�regulatory�like�text.�Rather,�use�existing�standards�that�have�been�proven�robust�and�worthy�and�then�ask�Greenroads�applicants�to�comply�
474

Greenroads™ Manual v1.5 Custom Credit
CC-# [Your Title Here]
with�something�that�exceeds�those�standards�by�some�measurable�increment�or�verifiable�accomplishment.�In�most�cases�there�is�a�standard�somewhere�that�works�well�or�is�well�worded.�The�advantage�of�using�these�standards�is�that�they�are�generally�well�thought�out�and�vetted�for�possible�legal,�design,�regulatory,�etc.�conflicts.�For�example,�Project�Requirement�PR�8�Low�Impact�Development�uses�existing�guidelines�from�the�Washington�State�Department�of�Ecology.�In�this�instance,�the�guidance�used�applies�specifically�to�one�state�but�may�be�easily�reworded�to�be�generally�applicable�to�any�type�of�project�or�location.�
Details�(Optional)�Provide�further�explanation�of�the�credit�requirements.�
� This�text�adds�details,�such�as�definitions,�to�the�Credit�Requirements�where�necessary,�or�shows�an�equation,�if�any.�Note�in�this�section�when�a�particular�credit�may�be�inappropriate�or�not�applicable.�
� Be�sure�to�note�instances�where�a�credit�may�not�be�appropriate�or�applicable.�Credits�should�reward�intents�which�fall�within�context�sensitive�design.�For�example,�a�project�team�might�try�to�earn�the�AE�7�Transit�Access�credit�by�putting�a�bus�stop�and�shelter�on�a�rural�forest�road,�miles�from�the�nearest�city,�claiming�potential�for�future�growth.�Or,�perhaps�the�AE�8�Scenic�Views�credit�should�only�apply�to�non�urban�environments.�It�is�important�to�clearly�identify�these�issues�in�the�text�of�the�credit�on�the�front�page:�providing�these�disclaimers�is�ultimately�a�courtesy�to�future�users�of�the�credit.�
Documentation�Provided�a�bulleted�list�of�the�items�required�to�prove�that�the�credit�was�completed�and�that�the�goal�was�met.�
� The�purpose�is�to�use�standard�project�documents�to�verify�that�the�intent�of�each�Greenroads�credit�is�being�met.�Projects�applying�for�Greenroads�certification�will�provide�the�following�documentation:�
a. Full�project�plans�and�drawings�(90%�minimum�for�initial�review).�b. Project�specifications�(90%�as�above).�c. Project�design�report�(where�available).�d. A�link�to�an�online�gallery�with�photos�of�the�construction�process.�e. A�checklist�showing�which�credits�are�being�attempted,�and�where�evidence�of�each�credit�may�be�found�in�
the�above�documents.�(This�is�to�streamline�the�review�process�for�certification.)�
� Any�additional�documentation�is�discouraged.�The�idea�is�to�use�documentation�that�already�exists�in�a�typical�roadway�design�and�construction�project.�Credits�should�be�able�to�be�represented�within�the�plans,�specifications�or�design�report�(bid�document,�etc.)�or�with�a�photograph.�For�example,�the�compliance�with�NEPA�(a�requirement)�uses�a�checklist�which�can�be�attached�as�an�Appendix�to�the�design�report�or�Xeroxed�onto�a�sheet�of�the�drawings.�
� However,�some�Construction�Activities�credits�may�require�additional�documentation,�such�as�compaction�test�reports�or�mix�designs.�Note�that�these�types�of�reports�are�commonly�available�on�infrastructure�projects,�and�should�be�able�to�be�submitted�scanned�or�otherwise�digitized.�Do�not�ask�for�a�City�Inspector�or�engineer�to�write�an�essay�describing�the�construction�process.�Instead,�you�may�request�a�copy�of�a�daily�report�(if�absolutely�necessary�to�verify�your�credit�intent�was�met).�
� The�web�based�system�for�Greenroads�will�allow�documentation�to�be�submitted�via�the�web�(e.g.,�file�attachments,�links,�etc.).�No�paper�or�physical�documentation�(e.g.,�a�paint�sample)�will�be�accommodated.�File�format�should�be�Adobe�PDF�for�documents�and�universal�image�formats�(GIF,�JPG)�for�photos.�
Approaches�&�Strategies�Suggest�things�that�may�be�done�to�achieve�the�credit�requirements.�
� In�this�section,�you�should�identify�any�potential�credit�synergies,�especially�if�you�have�listed�them�as�“Related�Credits”�in�the�front�page�sidebar.�For�example,�a�project�using�porous�asphalt�or�concrete�should�be�able�to�satisfy�the�intent�of�the�Permeable�Pavement�credit�and�also�meet�at�least�one�of�the�points�for�EW�3�Runoff�
475

Custom Credit Greenroads™ Manual v1.5
[Your Title Here] CC-#
Quality�with�minimal�to�moderate�additional�effort.�Where�some�technologies�are�unfamiliar,�these�types�of�relationships�are�very�important�to�note�for�project�teams�to�consider�going�beyond�their�standard�designs�to�make�the�overall�roadway�system�more�comprehensive.�
� Most�of�the�time,�an�actual�example�is�the�best�way�to�portray�an�idea�or�strategy.�Consider�using�the�optional�Examples�section�as�many�times�as�necessary�to�illustrate�your�idea�more�clearly.�
� Also,�photos�and�tables�are�encouraged.�
Examples�(Optional)�Give�an�example.�
� Examples�can�have�different�levels�of�quality.�The�following�is�a�list�that�goes�from�highest�quality�to�lowest�quality�of�examples.��
a. An�example�that�has�actually�been�done�on�a�project�successfully�and�you�can�show�evidence�(e.g.,�pictures,�documents,�etc.)�that�it�has.��
b. An�example�that�has�actually�been�done�on�a�project�successfully�but�you�cannot�show�any�evidence�of�it�other�than�the�description.�You�should�still�have�strong�evidence�that�is�has�actually�been�done.��
c. An�example�that�is�planned�to�be�done�on�a�project�and�you�can�show�evidence�(e.g.,�project�documents)�that�it�is.��
d. An�example�that�is�planned�to�be�done�on�a�project�but�you�cannot�show�any�evidence�that�it�is.�You�should�still�have�strong�evidence�that�is�actually�planned.��
e. An�example�that�is�made�up�but�realistic.�It�has�not�been�done�on�any�project�to�your�knowledge.�
Potential�Issues�State�any�typical�problems�or�situations�that�may�have�been�identified�in�the�research�or�any�potential�problems�that�could�be�foreseen.�
� This�is�also�a�good�place�to�state�any�misgivings�you�may�have�or�comments�about�potential�misinterpretations�for�the�credit.�Also,�be�sure�to�state�any�uncertainties�that�result�from�underlying�assumptions�made�about�particular�project�types,�places,�agencies,�etc.�
� From�the�research,�you�should�be�able�to�note�problems�that�were�encountered�during�construction�or�limitations�of�a�type�of�material,�etc.�It�is�important�to�identify�these�for�the�Review�Team�to�understand�the�full�depth�of�the�issue�you�are�trying�to�present.�Also,�use�your�imagination�to�identify�things�that�could�possibly�go�wrong�if�a�design�team�or�construction�crew�is�trying�to�implement�the�credit.�Things�that�can�be�overlooked�or�misinterpreted�are�important�to�note.�
Research�Research�your�topic�and�write�about�it.�
� In�general,�start�with�a�need�or�purpose�statement,�discuss�current�available�knowledge,�and�present�perceived�costs�and�benefits.�
� In�this�section�you�should�briefly�describe�the�empirical�evidence�and�existing�research�that�suggests�this�credit�is�feasible�and�contributes�to�sustainability.�This�section�is�crucial�and�should�likely�involve�the�bulk�of�your�time�writing�a�credit.�However,�the�key�word�here�is�the�word�“briefly”�and�the�key�concept�is�“contributes�to�sustainability.“�If�empirical�evidence�is�unavailable,�be�sure�to�note�this�here.�
� �The�point�of�this�section�is�to�demonstrate�that�significant�sleuthing�was�completed�in�order�to�support�each�credit.�So,�if�you�have�a�popular�topic,�you�might�find�quite�a�bit�of�existing�research.�(If�this�is�the�case,�sometimes�it�is�easier�to�present�each�document�in�a�table�with�a�brief�summary�in�a�second�column.)�If�you�have�a�recent�technology�you�might�not�find�anything.�Do�the�best�you�can�and�please�be�sure�to�cite�your�documents�so�we�can�always�go�back�and�check�them�later.�What�we’re�looking�for�here�is�a�few�short�paragraphs�that�summarize�the�existing�research�on�your�topic�in�a�clear�and�concise�manner�that�will�be�understandable�to�someone�using�the�Greenroads�system.�
476

Greenroads™ Manual v1.5 Custom Credit
CC-# [Your Title Here]
Evidence�Guidelines�We�have�high�standards�for�vetting�and�approving�Greenroads�Custom�Credits.�Following�are�some�guidelines�for�research�that�will�help�back�up�each�credit.�
Research�and�evidence�should�be�properly�documented�and�referenced.�Evidence�should�be�referenced�to�the�report,�study,�etc.�where�it�was�originally�investigated.�References�should�be�included�in�this�section�(at�the�end)�just�as�they�are�included�at�the�end�of�a�refereed�journal�article.�APA�citation�format�is�preferred.�(Additionally,�a�digital�library�will�be�implemented�on�the�Greenroads�website�to�manage�and�maintain�all�of�these�supporting�documents.)�
Research�and�evidence�should�be�credible.�Different�sources�of�evidence�have�different�sources�of�credibility.�A�general�list�of�most�credible�to�least�credible�is�as�follows�in�Table�CC�#.3�(this�is�not�strictly�true�but�can�serve�as�a�good�guide).�
Table�CC�#.3:�Table�of�Values�or�Text�Items�BEST� Peer�reviewed�journal�article,�published�peer�reviewed�conference�paper,�or�other�independent�
research.�Keep�in�mind�that�these�often�come�from�larger�study�reports.�If�this�is�the�case,�find�the�larger�study�report.�Certainly,�these�things�can�be�outright�wrong�too,�but�the�probability�of�any�blatant�errors�is�substantially�reduced�due�to�the�review�process.�
STRONG� Public�agency�report�or�study.�Again,�these�can�be�wrong�or�incomplete�or�biased�but�the�possibility�of�any�blatant�errors�is�substantially�reduced�because�they�tend�to�be�reviewed.�
GOOD� Substantiated�commercial�or�trade�organization�work.�This�is�similar�to�the�"STRONG"�work�above�but�comes�from�a�sponsor�(e.g.,�company�or�trade�organization)�with�an�obvious�interest�in�the�results�and�how�they�come�out.�For�instance�a�trade�organization�that�sponsors�a�professor�to�do�a�study�that�proves�their�material�is�superior�falls�into�this�category.�
FAIR� Trade�publications�or�other�news�items�written�for�the�general�public.�Due�to�time/space�constraints�these�items�can�often�gloss�over�the�important�details�because�they�are�written�for�a�more�general�audience.�This�writing�style�is�fine�and�effective�but�not�ideal�for�this�evidence�section.�Often�you�can�find�the�more�detailed�work�on�which�such�pieces�are�based.�
POOR� Unsubstantiated�claims.�These�can�come�in�the�form�of�statements�by�commercial�entities�with�a�vested�interest�in�the�evidence�(either�pro�or�con),�blogs,�YouTube�or�other�video,�claims�overheard�in�conversation,�marketing�claims�and�the�like.�The�key�is�unsubstantiated.�
�Anecdotes�are�insufficient.�Something�that�happens�once�or�twice�is�not�evidence�that�its�occurrence�is�well�established.�Often�anecdotes�can,�however,�provide�leads�to�better�evidence�(see�above�list�from�BEST�to�POOR),�so�further�digging�might�help.�
Research�and�evidence�should�be�corroborated.�There�should�be�more�than�one�credible�independent�source�for�your�supporting�evidence.�Two�papers�by�the�same�research�team�involving�the�same�study�are�not�considered�"independent."�See�Table�CC�#.4.�
Table�CC�#.4:�Rules�of�Thumb�for�Corroborating�Evidence�No.�of�Independent�Sources� Credibility�of�Evidence3�or�More� Three�independent�sources�all�arriving�at�similar�conclusions�is�likely�to�mean�
that�the�efficacy�of�a�concept,�idea�or�practice�is�well�established.�2� There�is�evidence�that�the�efficacy�of�a�concept,�idea�or�practice�is�established�
but�it�may�not�be�fully�vetted.�1� It�is�possible�that�a�concept,�idea�or�practice�is�proper�and�understood�but�
there�is�not�yet�enough�evidence�to�say�it�is�well�established.��
Dissenting�views�should�be�included.�Sometimes�there�is�quality�evidence�for�more�than�one�interpretation�of�a�particular�thing.�If�there�are�dissenting�views�they�should�all�be�listed�and�discussed�in�the�comments�section�
477

Custom Credit Greenroads™ Manual v1.5
[Your Title Here] CC-#
of�the�credit.�It�is�better�both�for�the�end�user�and�the�credit�developer�to�be�aware�of�these�than�not.�Issues�arise�when�there�are�one�or�more�pieces�of�fair/good/best�evidence�with�opposing�views�or�different�interpretations.�For�instance,�there�may�be�three�studies�that�give�one�point�of�view�and�two�studies�that�give�an�opposite�point�of�view.�In�these�cases,�it�is�up�to�the�credit�writer�to�use�his/her�best�judgment�to�determine�the�quality�of�the�evidence�and�render�a�decision.�(If�the�decision�is�that�there�may�not�be�enough�evidence�to�suggest�a�credit�contributes�to�roadway�sustainability,�then�it�is�best�to�remove�that�credit.)�
Glossary�Include�definitions�of�unfamiliar�terms.�
� This�is�where�definitions�of�jargon�or�non�plain�English�language�terms�should�be�defined.�
References�Cite�your�sources.�
� At�the�end�of�the�credit,�provide�a�list�of�all�the�references�used.�
Credit�Number�Assign�a�Greenroads�credit�number.�
� Credits�are�numbered�on�a�project�basis�for�purposes�of�your�Custom�Credit�application.�For�example,�if�you�are�applying�for�your�project�to�earn�two�different�Custom�Credits,�the�first�template�will�be�numbered�CC�1�[Your�Title�1]�and�the�second�will�be�CC�2�[Your�Title�2].�
Points�Determine�the�type�of�credit�and�how�many�points�the�credit�is�worth.�
� Custom�Credits�are�variable�in�point�value�and�may�be�worth�1�to�5�points�depending�on�their�overall�impact�on�comprehensive�roadway�sustainability.�
� As�far�as�credit�weighting�and�the�valuation�system�used�in�Greenroads�credits�(including�supporting�research),�we�have�written�about�this�in�excruciating�detail.�We�will�spare�that�detail�here�and�give�you�basic�hints�on�how�to�choose�the�point�value�for�your�credit.�
� There�are�three�general�types�of�Greenroads�requirements�and�credits�shown�and�described�in�Table�CC�#.5�(next�page).�
� For�Greenroads,�the�default�minimum�for�any�practice�is�1�point,�and�the�default�maximum�is�5�points,�but�your�credit�can�float�anywhere�including�or�in�between�those�values.�
� A�good�way�to�approach�weighting�your�own�credit�is�to�look�for�similar�credits�already�included�in�Greenroads.�Try�to�identify�characteristics�that�might�warrant�different�point�values�for�your�own�credit.�Table�CC�#.6�may�offer�some�insight�(next�page).�
� Ultimately,�the�Review�Team�will�validate�this�point�value�in�line�with�the�existing�weighting�and�reserves�the�right�to�modify�this�point�value�as�appropriate.�For�more�information,�there�is�also�a�brief�discussion�on�this�weighting�taxonomy�in�the�Introduction�to�this�Manual�
��������.�
478

Greenroads™ Manual v1.5 Custom Credit
CC-# [Your Title Here]
Table�CC�#:5:�Hints�about�Assigning�Greenroads�Points�Type�� Credit�Characteristics� ExampleBinary� This�is�the�simplest�type�of�Greenroads�credit.�The
project�team�either�meets�the�requirements�(1)�and�gets�points,�or�does�not�(0)�and�does�not�get�points.�
The�entire�Project�Requirements�category�is�a�good�default�example�of�the�binary�approach:�if�any�requirement�is�unmet,�no�certification�is�possible.�There�are�a�number�of�Voluntary�Credits�that�also�use�this�binary�approach,�such�as�the�CA�1�Quality�Management�System�credit.�
Incremental� This�is�an�extension�of�the�higher�level�of�the�binary�credit.�Still�awarded�in�the�all�or�nothing�(binary)�fashion,�these�credits�are�earned�based�on�specified�percentages�of�achievement.�In�general,�the�increment�is�linear�or�exponential�depending�on�the�level�of�difficulty�perceived�or�effort�required�to�complete�such�a�task.�
A�good�example�of�this�type�of�credit�is�MR�4�Recycled�Materials,�where�1�point�is�awarded�based�on�every�10%�added.�
Buffet� These�credits�allow�you�to�pick�and�choose�from�a�number�of�different�specified�practices�or�technologies�in�order�to�earn�between�the�minimum�and�maximum�points�for�that�activity.�In�general,�these�types�of�credits�recognize�that�there�are�a�number�of�good�practices�in�existence,�but�not�all�of�them�are�feasible,�cost�effective,�or�easy�to�implement�at�once,�and�it�would�be�rare�that�any�single�roadway�project�would�find�all�of�them�appropriate.�However,�implementing�more�than�one�might�result�in�a�more�sustainable�roadway�overall.�
A�good�example�of�a�Buffet�style�credit�is�AE�2�Intelligent�Transportation�Systems�because�you�can�pick�a�number�of�categories�and�applications�that�may�be�appropriate�to�your�project.�
Foundation� These�credits�build�on�one�(or�more)�particular�credit�as�an�extension�of�an�existing�best�practice.�In�order�for�this�credit�to�be�awarded,�this�prerequisite�credit�step�must�be�completed�and�achieved.�This�type�of�credit�is�infrequent�and�often�difficult�to�implement,�measure�or�otherwise�specify.�Use�sparingly.�
The�AE�series�(AE�4,�5,�6,�and�7�)�credit�set�is�a�good�example�of�a�Foundation�credit.�Credit�AE�3�Context�Sensitive�Solutions�must�be�achieved�in�order�to�qualify�for�these�4�credits.�Generally,�though,�all�11�Project�Requirements�are�also�examples�of�Foundation�credits�with�0�point�value.���
�Table�CC�#:6:�Hints�about�Assigning�Greenroads�Points�Points� Credit�Characteristics�1� Default�point�value.�Short�term impacts.�Generally�low�cost�or�easy�process�with�little�to�no�
additional�effort�needed.�Might�be�regulated�in�most�states�but�not�all.�Most�construction�credits�fall�here�based�on�life�cycle�assessment�data.�
2� Incentive�based�(for�data�collection)�or�influential�at�organization�or�agency�level.�Access�and�mobility�improvement�credits.�
3� Most�ecology�and�water�credits�fall�here,�including�context�sensitivity,�noise�and�human�perceptions�of�environmental�quality.�Moderate�effort�to�implement,�possible�extensions�to�scope�of�work�to�achieve.�
4� Usually�a�combination�of�1,�2�and�3�point�credits,�or�this�can�be�achieved�through�credits�with�incremental�points.�
5� Influences�phase�most�cited�in�life�cycle�assessments�for�roadways:�materials�use�or�traffic�operations.�Long�term�or�permanent�impacts.�Could�be�high�cost,�or�high�level�of�perceived�difficulty�due�to�needed�changes�in�scope�or�being�against�existing�regulation�or�standard.�
479

Custom Credit Greenroads™ Manual v1.5
[Your Title Here] CC-#
Related�Credits�Identify�credit�synergies.�
� List�any�credits�that�might�be�part�of�a�related�practice�or�activity.�Use�the�format�“XX�#:�Credit�Title”�and�Side�Checkmark�style.�Note�that�it�is�a�good�idea�to�discuss�these�in�the�Approaches�&�Strategies�section�as�well.�
Sustainability�Components�Identify�sustainability�components.�
� Pick�the�major�sustainability�components�that�are�supported�by�this�credit.�There�are�seven�to�choose�from:�
� Ecology�� Equity�
� Economy�� Extent�
� Expectations� Experience�
� Exposure�
�� This�section�of�the�sidebar�helps�identify�what�resources�and�principles�of�sustainability�apply�to�a�particular�
credit.�Pick�at�least�one�resource�and�one�principle�from�the�lists�below�that�are�influenced,�supported�or�enhanced�by�your�credit.�It�is�likely�that�the�credit�will�have�more�than�one�sustainability�components.�However,�it�is�rare�that�a�single�credit�will�address�all�sustainability�components.�
� Note�that,�while�we�recognize�that�all�projects�take�time�(Extent)�and�cost�money�(Economy),�these�two�principles�should�not�be�noted�for�every�credit�unless�there�is�a�significant�impact�due�to�implementation�of�the�credit�itself�on�time�or�money.�For�example,�the�Long�Life�Pavement�credit�directly�considers�the�principles�Extent�and�Expectations,�whereas�the�Energy�Efficiency�credit�probably�falls�under�both�Economy�and�Ecology.�
Benefits�Highlight�direct�and�indirect�benefits.�
� The�major�benefits�that�represent�influenced�resources�and�needs�met�by�your�activity�or�practice.�There�are�16�to�choose�from:�
� Reduces�Water�Use�� Reduces�Fossil�Energy�Use�� Reduces�Raw�Materials�Use�� Reduces�Air�Emissions�� Reduces�Wastewater�Emissions�� Reduces�Soil/Solid�Emissions�
� Improves�Human�Health�&�Safety�
� Improves�Access�&�Mobility�
� Improves�Business�Practice�
� Increases�Lifecycle�Savings�
� Increases�Lifecycle�Service�
� Increases�Awareness��� Aesthetics�
� Optimizes�Habitat�&�Land�Use�
� Creates�New�Information�
� Creates�Energy�
�� Essentially�this�section�of�the�sidebar�answers�the�question:�What�is�achieved�or�improved�by�attempting�to�
satisfy�the�credit�requirements?�A�user�can�look�briefly�at�the�front�page�of�the�credit�and�have�a�quick�understanding�of�the�beneficial�consequences�associated�with�implementing�the�credit.�
� These�benefits�can�be�qualitative�or,�more�often,�quantifiable�attributes�of�the�credit.�For�example,�is�air�quality�improved?�Is�there�a�novel�impact�on�life�cycle�service�or�savings?�For�any�benefit�where�the�relationship�is�not�immediately�obvious,�please�provide�some�supporting�research�to�make�that�connection�clear.�Sometimes�these�benefits�may�be�indirectly�achieved�or�difficult�to�quantify,�but�these�should�still�be�noted�in�the�sidebar.�An�example�is�achieving�AE�5�Pedestrian�Access�which�has�the�direct�benefit�of�improved�access�and�mobility,�but�also�the�indirect�benefit�of�reduced�greenhouse�gas�air�emissions.�
Application�Review�Process�Your�team’s�credit�application�will�be�reviewed�by�Greenroads�developers�based�on�the�following�criteria.�
1. Greenroads�Credit�Template�is�substantially�completed.�2. Goal�statement�is�clear�and�concise.�3. Credit�Requirements�are�clear,�concise,�and�actionable.�
480

Greenroads™ Manual v1.5 Custom Credit
CC-# [Your Title Here]
4. Documents�needed�are�clear�and�concise�and�easy�to�produce.�5. Potential�Issues�and�associated�sustainability�tradeoffs�are�stated.�6. At�least�one�strategy�and�one�example�are�provided.�7. Research�is�thoroughly�referenced�or�has�clearly�denoted�limitations.�8. Research�clearly�exemplifies�one�or�more�component�of�sustainability.�9. Research�clearly�exemplifies�one�or�more�benefit�due�to�the�suggested�practice�and�notes�any�tradeoffs�
associated�with�implementation�of�such�practice.�10. All�sources�used�are�listed.�
� You�will�be�notified�of�comments�and�questions�by�a�member�of�the�Review�Team.�� After�that,�your�credit�will�be�submitted�to�a�panel�of�professionals�for�review�and�comment.�This�might�be�a�
long�process,�and�it�will�likely�be�iterative�and�require�interaction�between�Greenroads�Reviewers�and�your�project�team.�
What�Happens�Next?�� If�your�application�is�accepted,�your�custom�credit�will�be�put�in�the�Greenroads�bank�of�ideas�and�published�
online�at�http://www.greenroads.us�in�a�form�similar�to�other�existing�credits.�It�will�be�reassigned�a�number�based�on�other�Custom�Credits�that�have�also�been�approved.�It�will�be�made�available�to�other�projects�to�use�following�approval.�Therefore,�please�take�care�to�preserve�proprietary�knowledge�where�necessary.�
� If�your�application�is�not�accepted,�you�are�welcome�to�revise�and�resubmit,�or�write�an�entirely�new�credit.�
Formatting�for�the�Research�Section�in�the�Template�This�is�an�example�of�the�standard�style,�in�paragraphs,�of�Body�Text.�Be�sure�to�define�terms�or�professional�jargon�used�to�make�your�case�in�the�glossary.�Present�any�vocabulary�term�in�boldface�and�define�it�in�the�Glossary.�
This�is�Research�Heading�style�Body�Text,�List�Number,�Bullet�
This�is�Research�Heading�Indent�style�Body�Text�indent,�List�Number�Indent,�Bullet�Indent�
This�is�Research�Blockquote.�Use�it�when�displaying�large�amounts�of�directly�quoted�or�verbatim�text�from�other�references.�
Final�Comments�Be�sure�to�change�both�headers�and�footers�to�include�your�credit�title�and�credit�number.�This�template�is�designed�to�print�double�sided�and�bound�(or�hole�punched)�on�the�left�side�of�the�front�page�of�each�credit.�
GLOSSARY
This�section�is�optional.�Define�words�that�might�be�unfamiliar�to�a�wide�audience�of�Greenroads�users�in�this�section.�Vocabulary�is�defined�in�a�2�column�table,�terms�on�left�(2”�column),�defined�on�right�(the�remaining�width).�Do�not�use�captions�for�this�table.�Orange�text�is�called�“Vocabulary”�style�and�the�definition�is�in�the�style�called�“No�Spacing.”�All�tables�have�a�0.2”�bottom�separation�from�text�on�the�bottom,�which�is�accomplished.�No�intro�text�in�given�in�this�section�below�the�header,�so�delete�this�paragraph�when�writing�your�own�credit.�This�glossary�contains�an�example�of�the�word�sustainability.�
Sustainability� A�system�characteristic�that�describes�the�system’s�capacity�to�support�natural�laws�and�human�values�
�
481

Custom Credit Greenroads™ Manual v1.5
[Your Title Here] CC-#
REFERENCES For�this�section,�use�American�Psychological�Association�(APA)�reference�style�and�apply�References�style.�
There�are�many�resources�available�online�to�help�you�format�your�references.�Here�is�a�good�one�with�many�examples�from�the�Online�Writing�Lab�at�Purdue�University:�http://owl.english.purdue.edu/owl/resource/560/01/�
Here�is�an�example�of�how�to�format�the�above�reference�from�the�web�correctly:�
Purdue�University�Online�Writing�Lab�(2009,�Nov.�11).�APA�Formatting�and�Style�Guide�–�The�OWL�at�Purdue.�Retrieved�November�25,�2009,�from�http://owl.english.purdue.edu/owl/resource/560/01/.�
482

© 2011
�

© 2011
www.greenroads.us